ECON 351* -- NOTE 8 - Queen's Economics...
30
ECONOMICS 351* -- Assignment 3 ANSWERS M.G. Abbott Queen’s University Department of Economics ECON 351* -- Introductory Econometrics ASSIGNMENT 3 – ANSWERS Winter Term 2009 M.G. Abbott TOPIC: OLS Estimation and Inference in the Multiple Linear Regression Model INSTRUCTIONS: • Answer all questions on standard-sized 8.5 x 11-inch paper. • Answers need not be typewritten (document processed), but if hand-written must be legible. Illegible assignments will be returned unmarked. • Please label clearly each answer with the appropriate question number and letter. Securely staple all answer sheets together, and make certain that your name(s) and student number(s) are printed clearly at the top of each answer sheet. • Students submitting joint assignments must ensure that each student’s name and student number are printed clearly at the top of each answer sheet. Submit only one copy of the assignment. MARKING: Marks for each question are indicated in parentheses. Total marks for the assignment equal 132. Marks are given for both content and presentation. SOFT DUE DATE: Tuesday March 31, 2009 by 4:00 p.m. HARD DUE DATE: Friday April 3, 2009 by 4:00 p.m. • Assignments submitted on or before the soft due date will receive a bonus of 5 points to a maximum total mark of 132. • Assignments submitted after the hard due date will be penalized 20 points per day. • Please submit your assignments either to me in class, or by depositing them in the ECON 351 slot of the Assignment Collection Box located immediately inside the double doors on the second floor of Dunning Hall (opposite the elevator). DATA FILE: 351assn3w09.raw (a text-format, or ASCII-format, data file) • Data Description: A random sample of 321 houses that were sold in a single metropolitan area in the years 1978 and 1981. • Objective of the Analysis: The primary objective of the research project for which this dataset was originally assembled was to estimate empirically the effect on house prices of proximity to an incinerator, which presumably generates negative externalities for homeowners and others located close to it. Keep this objective in mind as you work your way through the questions in this assignment. ECON 351* -- Winter Term 2009: Assignment 3 ANSWERS Page 1 of 30 pages
-
Upload
hoangnguyet -
Category
Documents
-
view
228 -
download
0
Transcript of ECON 351* -- NOTE 8 - Queen's Economics...

ECONOMICS 351* -- Assignment 3 ANSWERS M.G. Abbott
Queen’s University Department of Economics
ECON 351* -- Introductory Econometrics
ASSIGNMENT 3 – ANSWERS
Winter Term 2009 M.G. Abbott TOPIC: OLS Estimation and Inference in the Multiple Linear Regression Model INSTRUCTIONS:
• Answer all questions on standard-sized 8.5 x 11-inch paper. • Answers need not be typewritten (document processed), but if hand-written must be legible.
Illegible assignments will be returned unmarked.
• Please label clearly each answer with the appropriate question number and letter. Securely staple all answer sheets together, and make certain that your name(s) and student number(s) are printed clearly at the top of each answer sheet.
• Students submitting joint assignments must ensure that each student’s name and student number are printed clearly at the top of each answer sheet. Submit only one copy of the assignment.
MARKING: Marks for each question are indicated in parentheses. Total marks for the
assignment equal 132. Marks are given for both content and presentation. SOFT DUE DATE: Tuesday March 31, 2009 by 4:00 p.m.
HARD DUE DATE: Friday April 3, 2009 by 4:00 p.m.
• Assignments submitted on or before the soft due date will receive a bonus of 5 points to a maximum total mark of 132.
• Assignments submitted after the hard due date will be penalized 20 points per day. • Please submit your assignments either to me in class, or by depositing them in the ECON 351
slot of the Assignment Collection Box located immediately inside the double doors on the second floor of Dunning Hall (opposite the elevator).
DATA FILE: 351assn3w09.raw (a text-format, or ASCII-format, data file)
• Data Description: A random sample of 321 houses that were sold in a single metropolitan area in the years 1978 and 1981.
• Objective of the Analysis: The primary objective of the research project for which this dataset was originally assembled was to estimate empirically the effect on house prices of proximity to an incinerator, which presumably generates negative externalities for homeowners and others located close to it. Keep this objective in mind as you work your way through the questions in this assignment.
ECON 351* -- Winter Term 2009: Assignment 3 ANSWERS Page 1 of 30 pages
ECONOMICS 351* -- Assignment 3 ANSWERS M.G. Abbott
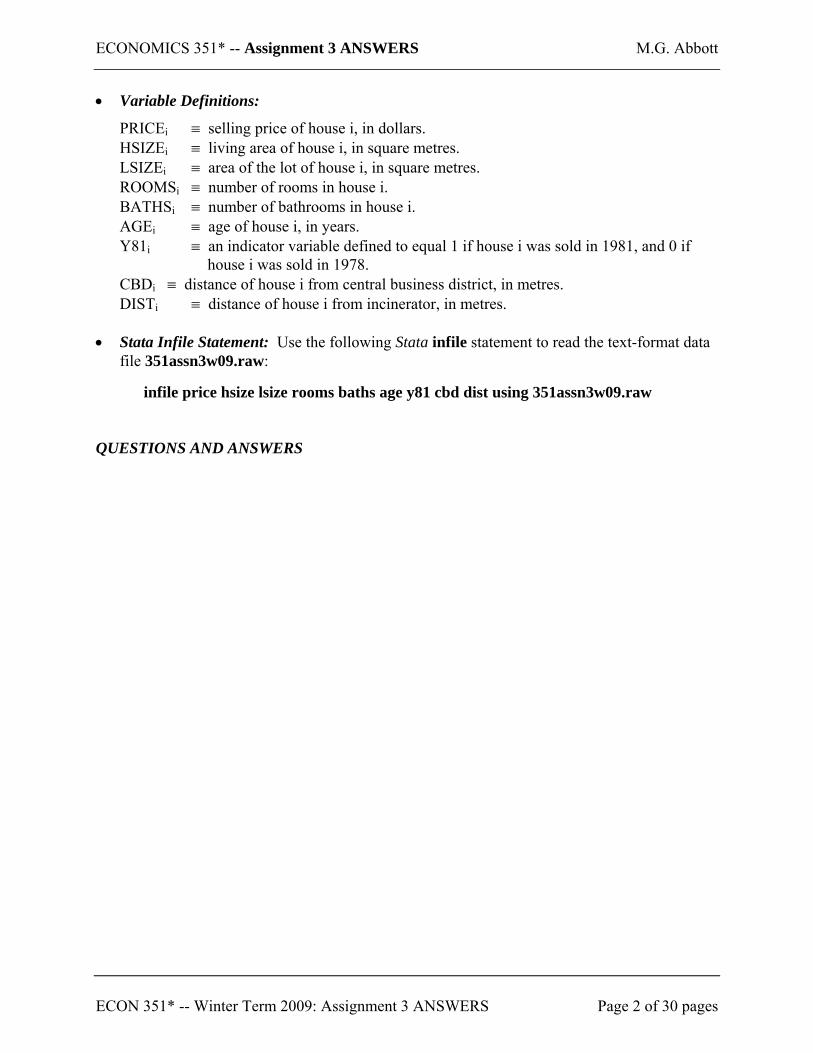
• Variable Definitions:
PRICEi ≡ selling price of house i, in dollars. HSIZEi ≡ living area of house i, in square metres. LSIZEi ≡ area of the lot of house i, in square metres. ROOMSi ≡ number of rooms in house i. BATHSi ≡ number of bathrooms in house i. AGEi ≡ age of house i, in years. Y81i ≡ an indicator variable defined to equal 1 if house i was sold in 1981, and 0 if house i was sold in 1978. CBDi ≡ distance of house i from central business district, in metres. DISTi ≡ distance of house i from incinerator, in metres.
• Stata Infile Statement: Use the following Stata infile statement to read the text-format data
file 351assn3w09.raw:
infile price hsize lsize rooms baths age y81 cbd dist using 351assn3w09.raw QUESTIONS AND ANSWERS
ECON 351* -- Winter Term 2009: Assignment 3 ANSWERS Page 2 of 30 pages

ECONOMICS 351* -- Assignment 3 ANSWERS M.G. Abbott
(48 marks) 1. Compute and present OLS estimates of the following population regression equation for the
full sample of 321 houses:
i5i4ii3i2i10i BATHSROOMSLSIZEHSIZELSIZEHSIZEPRICE β+β+β+β+β+β=
ii11i102i9i8
2i7i6 u81YCBDDISTDISTAGEAGE +β+β+β+β+β+β+ (1)
(12 marks) (a) Compute and report OLS estimates of regression equation (3) for the full sample of 321
houses. Present the estimation results in an appropriate table.
ANSWER Question 1(a) . regress price hsize lsize hsizelsize rooms baths age agesq dist distsq cbd y81 Source | SS df MS Number of obs = 321 -------------+------------------------------ F( 11, 309) = 86.42 Model | 4.5119e+11 11 4.1018e+10 Prob > F = 0.0000 Residual | 1.4666e+11 309 474626870 R-squared = 0.7547 -------------+------------------------------ Adj R-squared = 0.7460 Total | 5.9785e+11 320 1.8683e+09 Root MSE = 21786 ------------------------------------------------------------------------------ price | Coef. Std. Err. t P>|t| [95% Conf. Interval] -------------+---------------------------------------------------------------- hsize | 93.80356 34.6208 2.71 0.007 25.68122 161.9259 lsize | -3.410538 .8284851 -4.12 0.000 -5.040724 -1.780352 hsizelsize | .0270578 .004151 6.52 0.000 .0188899 .0352257 rooms | 3343.379 1839.101 1.82 0.070 -275.3674 6962.125 baths | 11453.16 2860.263 4.00 0.000 5825.102 17081.22 age | -584.915 149.3339 -3.92 0.000 -878.755 -291.0749 agesq | 2.120924 .9216408 2.30 0.022 .3074383 3.93441 dist | 8.0328 2.712159 2.96 0.003 2.696163 13.36944 distsq | -.0004487 .0002048 -2.19 0.029 -.0008517 -.0000457 cbd | -2.833553 1.896985 -1.49 0.136 -6.566196 .8990891 y81 | 37509.43 2574.096 14.57 0.000 32444.46 42574.41 _cons | -4241.35 13134.38 -0.32 0.747 -30085.49 21602.79 ------------------------------------------------------------------------------
ECON 351* -- Winter Term 2009: Assignment 3 ANSWERS Page 3 of 30 pages
ECONOMICS 351* -- Assignment 3 ANSWERS M.G. Abbott
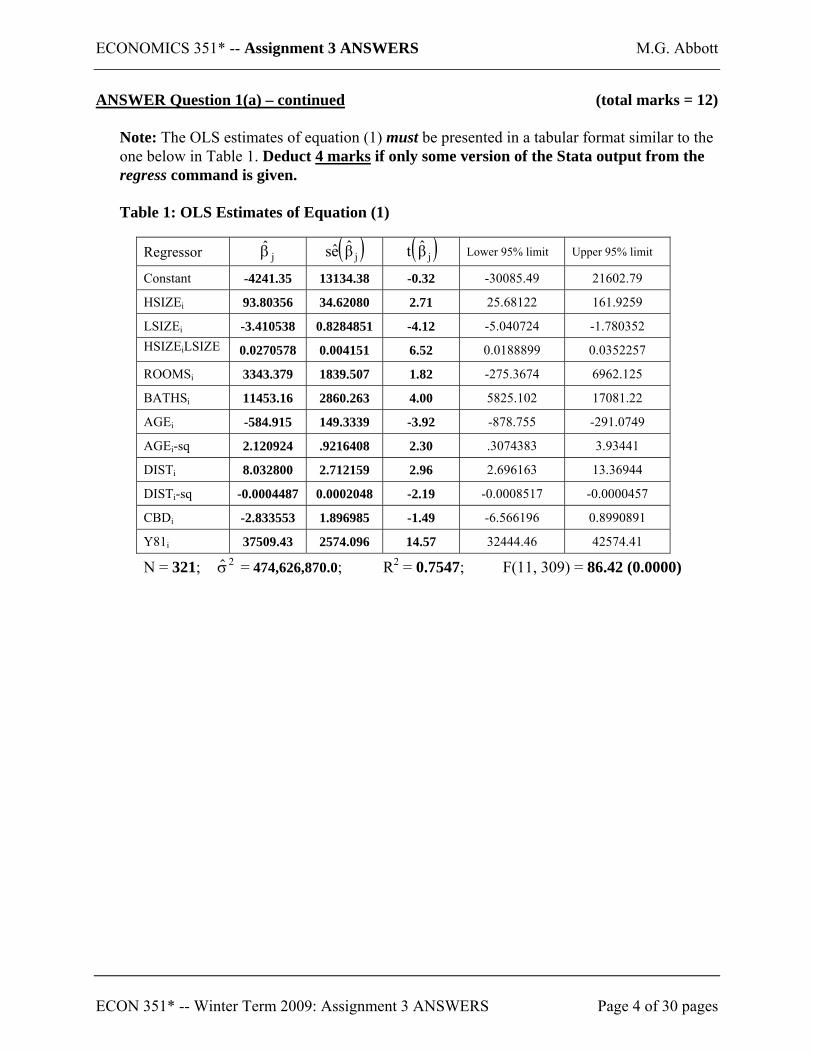
ANSWER Question 1(a) – continued (total marks = 12) Note: The OLS estimates of equation (1) must be presented in a tabular format similar to the one below in Table 1. Deduct 4 marks if only some version of the Stata output from the regress command is given. Table 1: OLS Estimates of Equation (1)
Regressor jβ ( )jβes ( )jβt Lower 95% limit Upper 95% limit
Constant -4241.35 13134.38 -0.32 -30085.49 21602.79
HSIZEi 93.80356 34.62080 2.71 25.68122 161.9259
LSIZEi -3.410538 0.8284851 -4.12 -5.040724 -1.780352 HSIZEiLSIZE 0.0270578 0.004151 6.52 0.0188899 0.0352257
ROOMSi 3343.379 1839.507 1.82 -275.3674 6962.125
BATHSi 11453.16 2860.263 4.00 5825.102 17081.22
AGEi -584.915 149.3339 -3.92 -878.755 -291.0749
AGEi-sq 2.120924 .9216408 2.30 .3074383 3.93441
DISTi 8.032800 2.712159 2.96 2.696163 13.36944
DISTi-sq -0.0004487 0.0002048 -2.19 -0.0008517 -0.0000457
CBDi -2.833553 1.896985 -1.49 -6.566196 0.8990891
Y81i 37509.43 2574.096 14.57 32444.46 42574.41
N = 321; = 474,626,870.0; R$σ2 2 = 0.7547; F(11, 309) = 86.42 (0.0000)
ECON 351* -- Winter Term 2009: Assignment 3 ANSWERS Page 4 of 30 pages

ECONOMICS 351* -- Assignment 3 ANSWERS M.G. Abbott
(12 marks) (b) Write the expression implied by equation (1) for the partial marginal effect of on
house prices. Use the OLS estimation results for equation (1) to test the proposition that distance from the incinerator has no effect on mean house prices for all values of . State the null and alternative hypotheses, and show how the sample value of the test statistic is calculated (give its formula). Report the sample value of the test statistic and its p-value. State the decision rule you use, and the inference you would draw from the test. Does the sample evidence favour the proposition?
iDIST
iDIST
ANSWER Question 1(b) (total marks = 12) • The partial marginal effect of on house prices is: iDIST
( )
i98i
i
i
i DIST2DIST
PRICEEDIST
PRICEβ+β=
∂•∂
=∂∂ (2 marks)
Null hypothesis: H0: and 08 =β 09 =β (1 mark) Alternative hypothesis: H1: and/or 08 ≠β 09 ≠β (1 mark) • Formula for general F-test statistic is: (1 mark)
)KN(RSS)KK()RSSRSS(
dfRSS)dfdf()RSSRSS(F
1
010
11
1010
−−−
=−−
=
or
)KN()R1()KK()RR(
df)R1()dfdf()RR(F 2
U
02R
2U
12U
102R
2U
−−−−
=−
−−=
where:
00 KNdf −= = degrees-of-freedom for RSS0 = 321 – 10 = 311; KNdf1 −= = degrees-of-freedom for RSS1 = 321 – 12 = 309;
number of restrictions specified by H0 = 010 KKdfdfq −=−= = 12 – 10 = 2 • Sample value F0 of the general F-test statistic and p-value under H0 is:
0F = 4.3952 = 4.40 (2 marks)
p-value of F0 = 0.01312 = 0.0131 (1 mark)
ECON 351* -- Winter Term 2009: Assignment 3 ANSWERS Page 5 of 30 pages
ECONOMICS 351* -- Assignment 3 ANSWERS M.G. Abbott
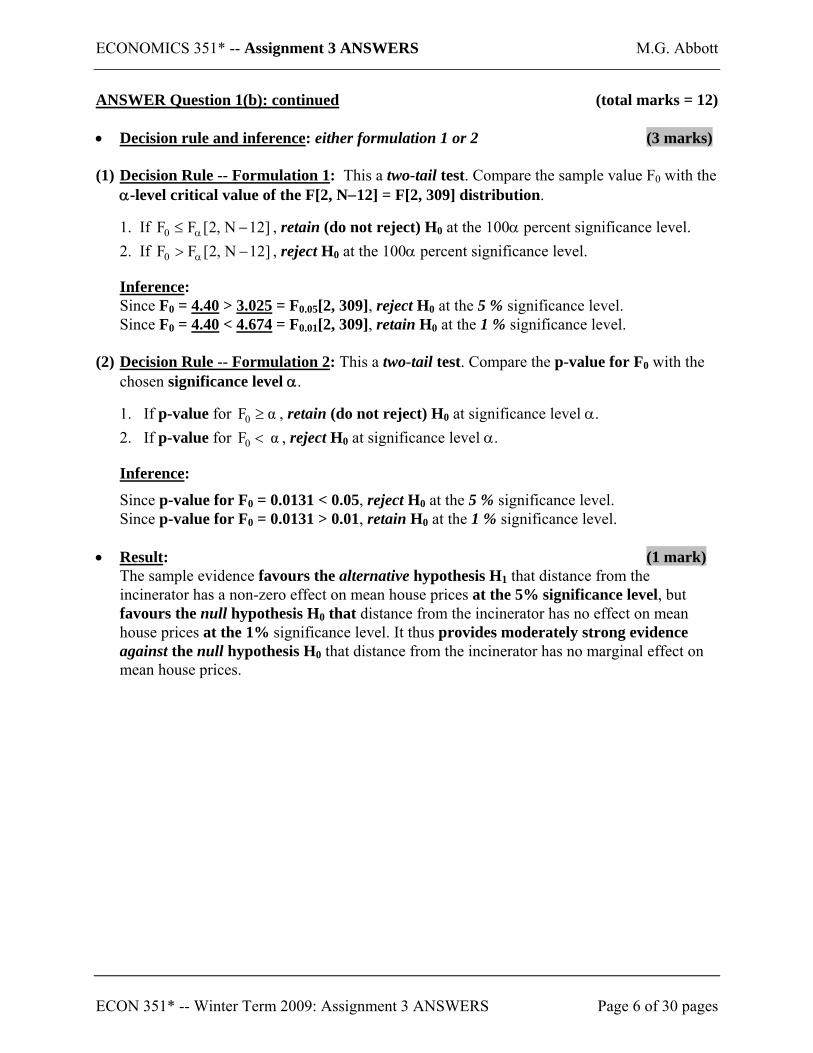
ANSWER Question 1(b): continued (total marks = 12) • Decision rule and inference: either formulation 1 or 2 (3 marks) (1) Decision Rule -- Formulation 1: This a two-tail test. Compare the sample value F0 with the
α-level critical value of the F[2, N−12] = F[2, 309] distribution.
1. If , retain (do not reject) H]12N,2[FF0 −≤ α 0 at the 100α percent significance level. 2. If , reject H]12N,2[FF0 −> α 0 at the 100α percent significance level.
Inference: Since F0 = 4.40 > 3.025 = F0.05[2, 309], reject H0 at the 5 % significance level. Since F0 = 4.40 < 4.674 = F0.01[2, 309], retain H0 at the 1 % significance level.
(2) Decision Rule -- Formulation 2: This a two-tail test. Compare the p-value for F0 with the
chosen significance level α.
1. If p-value for , retain (do not reject) HαF0 ≥ 0 at significance level α. 2. If p-value for , reject HαF0 < 0 at significance level α.
Inference:
Since p-value for F0 = 0.0131 < 0.05, reject H0 at the 5 % significance level. Since p-value for F0 = 0.0131 > 0.01, retain H0 at the 1 % significance level.
• Result: (1 mark)
The sample evidence favours the alternative hypothesis H1 that distance from the incinerator has a non-zero effect on mean house prices at the 5% significance level, but favours the null hypothesis H0 that distance from the incinerator has no effect on mean house prices at the 1% significance level. It thus provides moderately strong evidence against the null hypothesis H0 that distance from the incinerator has no marginal effect on mean house prices.
ECON 351* -- Winter Term 2009: Assignment 3 ANSWERS Page 6 of 30 pages

ECONOMICS 351* -- Assignment 3 ANSWERS M.G. Abbott
1. (continued)
(12 marks) (c) Use the OLS estimation results for equation (1) to test a real estate broker’s conjecture
that the partial marginal effect on house prices of , distance from the incinerator, is smaller for homes located further from the incinerator than for homes located close to the incinerator. State the null and alternative hypotheses, and show how the sample value of the test statistic is calculated (give its formula). Report the sample value of the test statistic and its p-value. State the appropriate critical values of the null distribution of the test statistic for both the 5 percent and 1 percent significance levels. State the decision rule you use, and the inference you would draw from the test. Does the sample evidence favour the real estate broker’s conjecture?
iDIST
ECON 351* -- Winter Term 2009: Assignment 3 ANSWERS Page 7 of 30 pages

ECONOMICS 351* -- Assignment 3 ANSWERS M.G. Abbott
ANSWER Question 1(c) (total marks = 12) Null hypothesis: H0: (or 09 =β 09 ≥β ) (1 mark) Alternative hypothesis: H1: a left-tail09 <β t-test (2 marks)
• Calculation of t-test statistic: The sample value t0 under the null hypothesis H0 is
( ) ( ) ( ) 000204801.0000448674.0
ˆes
ˆˆes
0ˆˆesbˆ
)ˆ(t9
9
9
9
9
9990
−=
ββ
=β−β
=β−β
=β = −2.1908 = −2.19 (2 marks)
• Left-tail p-value of t0 = Pr( t < −t0) = Pr( t < −2.191) = 0.0146072 = 0.0146 (1 mark)
• Left-tail critical values of the t[N−12] = t[309] distribution are:
]309[t]12N[t 05.0−=−− α = −1.650 at the 5% significance level (α = 0.05) (1 mark) ]309[t]12N[t 01.0−=−− α = −2.338 at the 1% significance level (α = 0.01) (1 mark)
• Decision rule and inference: either formulation 1 or 2 (3 marks) (1) Decision Rule -- Formulation 1: This a left-tail test. Compare the sample value t0 with the
lower α-level critical value of the t[N−12] = t[309] distribution.
1. If , reject H]12N[tt α0 −−< 0 at the 100α percent significance level. 2. If , retain (do not reject) H]12N[tt α0 −−≥ 0 at the 100α percent significance level.
Inference:
Since = −2.19 < −1.650 = −t)ˆ(t 90 β 0.05[309], reject H0 at the 5 % significance level.
Since = −2.19 > −2.338 = −t)ˆ(t 90 β 0.01[309], retain H0 at the 1 % significance level. (2) Decision Rule -- Formulation 2: This a right-tail test. Compare the right-tail p-value for
t0 with the chosen significance level α.
1. If left-tail p-value for , retain (do not reject) Hα≥0t 0 at significance level α. 2. If left-tail p-value for , reject Hα<0t 0 at significance level α.
Inference:
Since left-tail p-value for t0 = 0.0146 < 0.05, reject H0 at the 5 % significance level. Since left-tail p-value for t0 = 0.0146 > 0.01, retain H0 at the 1 % significance level.
Result: (1 mark) The sample evidence favours the alternative hypothesis that β9 < 0 at the 5% significance level, but not at the 1% significance level. It thus provides only moderately strong evidence that the partial marginal effect on house prices of is decreasing in . iDIST iDIST
ECON 351* -- Winter Term 2009: Assignment 3 ANSWERS Page 8 of 30 pages
ECONOMICS 351* -- Assignment 3 ANSWERS M.G. Abbott
(12 marks) (d) Use the OLS estimation results for equation (1) to test the conjecture that distance from
the incinerator has no marginal effect on mean prices for houses located 4,000 metres (4 kilometres) from the incinerator. State the null and alternative hypotheses, and show how the sample value of the test statistic is calculated (give its formula). Report the sample value of the test statistic and its p-value. State the decision rule you use, and the inference you would draw from the test. Does the sample evidence favour the conjecture?
ECON 351* -- Winter Term 2009: Assignment 3 ANSWERS Page 9 of 30 pages

ECONOMICS 351* -- Assignment 3 ANSWERS M.G. Abbott
ANSWER Question 1(d): (total marks = 12) • Null hypothesis: H0: 040002 98 =β+β
Alternative hypothesis: H1: 040002 98 ≠β+β a two-tail te (3 markst s)
• Calculation of t-test statistic: The sample value t0 under the null hypothesis H0 is
( ) 790786.1443406.4
ˆ8000ˆes
ˆ8000ˆ)ˆ8000ˆ(t
98
98980 =
β+ββ+β
=β+β = 2.4813 = 2.48 (4 marks)
• Two-tail p-value for t0 = 0.013624 = 0.0136 (1 mark)
• Decision rule and inference: either formulation 1 or 2 (3 marks) (1) Decision Rule -- Formulation 1: This a two-tail test. Compare the sample value t0 with the
α/2-level critical value of the t[N−12] = t[309] distribution.
1. If ]12N[tt 2/0 −≤ α , retain (do not reject) H0 at the 100α percent significance level.
2. If ]12N[tt 2/0 −> α , reject H0 at the 100α percent significance level.
Inference: Since )ˆ8000ˆ(t 980 β+β = 2.48 > 1.968 = t0.025[309], reject H0 at 5 % significance level.
Since )ˆ8000ˆ(t 980 β+β = 2.48 < 2.592 = t0.005[309], retain H0 at 1 % significance level.
(2) Decision Rule -- Formulation 2: This a two-tail test. Compare the two-tail p-value for t0
with the chosen significance level α.
1. If two-tail p-value for , retain (do not reject) Hα≥0t 0 at significance level α. 2. If two-tail p-value for , reject Hα<0t 0 at significance level α.
Inference:
Since two-tail p-value for t0 = 0.0136 < 0.05, reject H0 at the 5 % significance level. Since two-tail p-value for t0 = 0.0136 > 0.01, retain H0 at the 1 % significance level.
• Result: (1 mark)
The sample evidence favours the alternative hypothesis H1 that 040002 118 ≠β+β at the 5% significance level but not at the 1% significance level; it provides moderately strong evidence that distance from the incinerator has a non-zero marginal effect on mean prices for houses located 4,000 metres (4 kilometres) from the incinerator.
ECON 351* -- Winter Term 2009: Assignment 3 ANSWERS Page 10 of 30 pages

ECONOMICS 351* -- Assignment 3 ANSWERS M.G. Abbott
Alternative ANSWER 1 to Question 1(d): two-sided confidence intervals (total marks = 12) • Null hypothesis: H0: 040002 98 =β+β
Alternative hypothesis: H1: 040002 98 ≠β+β a two-tail te (3 markst s) • Two-sided 100(1−α) percent confidence interval for β8 + 2β94000 = β8 + 8000β9 is:
Lower 100(1−α) percent confidence limit for β8 + 2β94000 = ( )98298
ˆ8000ˆes]12N[tˆ8000ˆ β+β−−β+β α Upper 100(1−α) percent confidence limit for β8 + 2β94000 = ( )98298
ˆ8000ˆes]12N[tˆ8000ˆ β+β−+β+β α
• Compute two-sided 95 percent confidence interval for β8 + 2β94000
Lower 95 percent confidence limit for β8 + 2β94000 = 0.9197292 = 0.9197 (1 mark)
Upper 95 percent confidence limit for β8 + 2β94000 = 7.967083 = 7.967 (1 mark)
• Compute two-sided 99 percent confidence interval for β8 + 2β94000
Lower 99 percent confidence limit for β8 + 2β94000 = −0.1980122 = −0.1980 (1 mark)
Upper 99 percent confidence limit for β8 + 2β94000 = 9.084825 = 9.085 (1 mark) • Decision rule and inference: (2 marks)
1. If hypothesized value of β8 + 2β94000 lies inside the two-sided 100(1−α) percent confidence interval for β8 + 2β94000, retain (do not reject) H0 at significance level α.
2. If hypothesized value of β8 + 2β94000 lies outside the two-sided 100(1−α) percent confidence interval for β8 + 2β94000, reject H0 at significance level α.
Inference: (2 marks)
Since 0 lies outside the two-sided 95 percent confidence interval for β8 + 2β94000, which is [0.9197, 7.967], reject H0 at the 5% significance level.
Since 0 lies inside the two-sided 99 percent confidence interval for β8 + 2β94000, which is [−0.1980, 9.085], retain H0 at the 1% significance level.
• Result: (1 mark)
The sample evidence favours the alternative hypothesis H1 that 040002 98 ≠β+β at the 5% significance level but not at the 1% significance level; it provides moderately strong evidence that distance from the incinerator has a non-zero marginal effect on mean prices for houses located 4,000 metres (4 kilometres) from the incinerator.
ECON 351* -- Winter Term 2009: Assignment 3 ANSWERS Page 11 of 30 pages

ECONOMICS 351* -- Assignment 3 ANSWERS M.G. Abbott
Alternative ANSWER 2 to Question 1(d): An F-test (total marks = 12) • Null hypothesis: H0: 040002 98 =β+β
Alternative hypothesis: H1: 040002 98 ≠β+β a two-tail F-test (3 marks)
• Calculation of F-test statistic: The sample value F0 under the null hypothesis H0 is
( ) 7256.7644649.9179
ˆ8000ˆraV)ˆ8000ˆ()4000ˆ2ˆ(F
98
298
980 =β+β
β+β=β+β = 6.1567 = 6.16 (4 marks)
• (right-tail) p-value for F0 = 0.013624 = 0.0136 (1 mark)
• Decision rule and inference: either formulation 1 or 2 (3 marks) (1) Decision Rule -- Formulation 1: This a two-tail test. Compare the sample value F0 with the
α-level critical value of the F[1, N−12] = F[1, 309] distribution.
1. If , retain (do not reject) H]12N,1[FF α0 −≤ 0 at the 100α percent significance level. 2. If , reject H]12N,1[FF α0 −> 0 at the 100α percent significance level.
Inference: Since F0 = 6.16 > 3.872 = F0.05[1, 309], reject H0 at the 5 % significance level. Since F0 = 6.16 < 6.718 = F0.01[1, 309], retain H0 at the 1 % significance level.
(2) Decision Rule -- Formulation 2: This a two-tail test. Compare the p-value for F0 with the
chosen significance level α.
1. If p-value for , retain (do not reject) HαF0 ≥ 0 at significance level α. 2. If p-value for , reject HαF0 < 0 at significance level α.
Inference:
Since p-value for F0 = 0.0136 < 0.05, reject H0 at the 5 % significance level. Since p-value for F0 = 0.0136 > 0.01, retain H0 at the 1 % significance level.
• Result: (1 mark)
The sample evidence favours the alternative hypothesis H1 that 040002 98 ≠β+β at the 5% significance level but not at the 1% significance level; it provides moderately strong evidence that distance from the incinerator has a non-zero marginal effect on mean prices for houses located 4,000 metres (4 kilometres) from the incinerator.
ECON 351* -- Winter Term 2009: Assignment 3 ANSWERS Page 12 of 30 pages
ECONOMICS 351* -- Assignment 3 ANSWERS M.G. Abbott
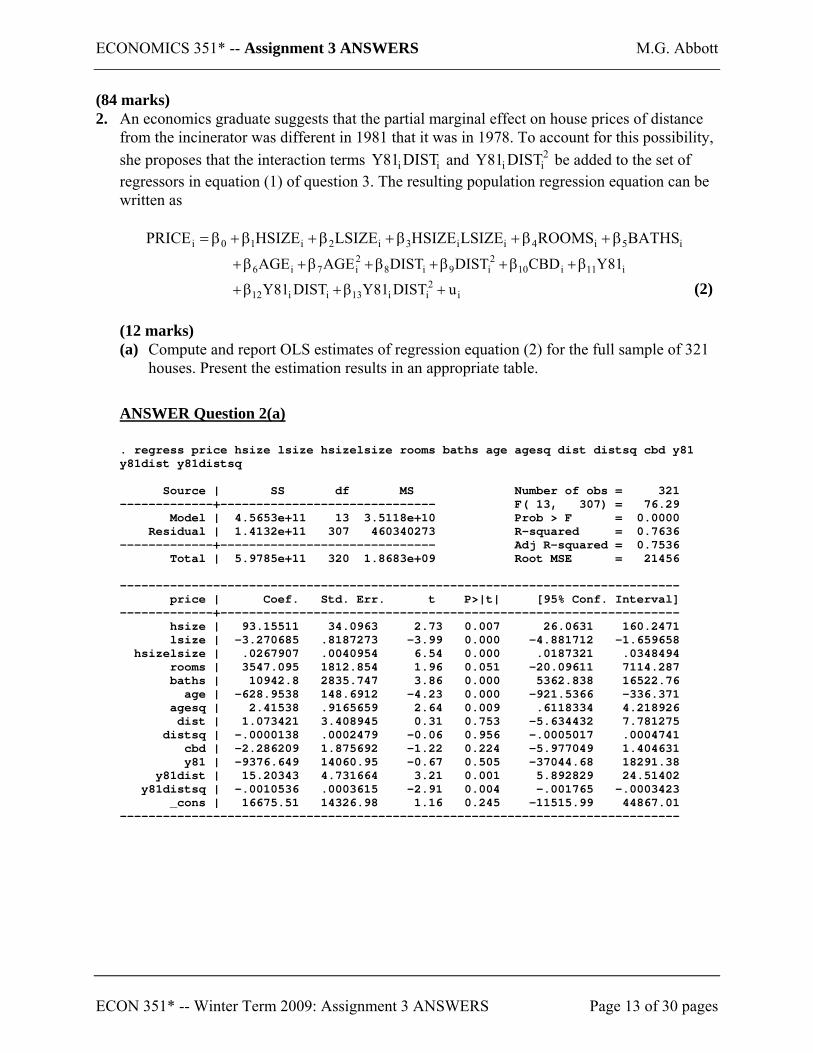
(84 marks) 2. An economics graduate suggests that the partial marginal effect on house prices of distance
from the incinerator was different in 1981 that it was in 1978. To account for this possibility, she proposes that the interaction terms and be added to the set of regressors in equation (1) of question 3. The resulting population regression equation can be written as
ii DIST81Y 2ii DIST81Y
i5i4ii3i2i10i BATHSROOMSLSIZEHSIZELSIZEHSIZEPRICE β+β+β+β+β+β=
i11i102i9i8
2i7i6 81YCBDDISTDISTAGEAGE β+β+β+β+β+β+
(2) i2ii13ii12 uDIST81YDIST81Y +β+β+
(12 marks) (a) Compute and report OLS estimates of regression equation (2) for the full sample of 321
houses. Present the estimation results in an appropriate table.
ANSWER Question 2(a) . regress price hsize lsize hsizelsize rooms baths age agesq dist distsq cbd y81 y81dist y81distsq Source | SS df MS Number of obs = 321 -------------+------------------------------ F( 13, 307) = 76.29 Model | 4.5653e+11 13 3.5118e+10 Prob > F = 0.0000 Residual | 1.4132e+11 307 460340273 R-squared = 0.7636 -------------+------------------------------ Adj R-squared = 0.7536 Total | 5.9785e+11 320 1.8683e+09 Root MSE = 21456 ------------------------------------------------------------------------------ price | Coef. Std. Err. t P>|t| [95% Conf. Interval] -------------+---------------------------------------------------------------- hsize | 93.15511 34.0963 2.73 0.007 26.0631 160.2471 lsize | -3.270685 .8187273 -3.99 0.000 -4.881712 -1.659658 hsizelsize | .0267907 .0040954 6.54 0.000 .0187321 .0348494 rooms | 3547.095 1812.854 1.96 0.051 -20.09611 7114.287 baths | 10942.8 2835.747 3.86 0.000 5362.838 16522.76 age | -628.9538 148.6912 -4.23 0.000 -921.5366 -336.371 agesq | 2.41538 .9165659 2.64 0.009 .6118334 4.218926 dist | 1.073421 3.408945 0.31 0.753 -5.634432 7.781275 distsq | -.0000138 .0002479 -0.06 0.956 -.0005017 .0004741 cbd | -2.286209 1.875692 -1.22 0.224 -5.977049 1.404631 y81 | -9376.649 14060.95 -0.67 0.505 -37044.68 18291.38 y81dist | 15.20343 4.731664 3.21 0.001 5.892829 24.51402 y81distsq | -.0010536 .0003615 -2.91 0.004 -.001765 -.0003423 _cons | 16675.51 14326.98 1.16 0.245 -11515.99 44867.01 ------------------------------------------------------------------------------
ECON 351* -- Winter Term 2009: Assignment 3 ANSWERS Page 13 of 30 pages

ECONOMICS 351* -- Assignment 3 ANSWERS M.G. Abbott
ANSWER Question 2(a) -- continued
Table 2: OLS Estimates of Equation (2)
Regressor jβ ( )jβes ( )jβt Lower 95% limit Upper 95% limit
Constant -4241.35 13134.38 -0.32 -11515.99 44867.01
HSIZEi 93.1551 34.0963 2.73 26.0631 160.2471
LSIZEi -3.27069 0.818727 -3.99 -4.881712 -1.659658 HSIZEiLSIZE 0.026907 0.0040954 6.54 0.0187321 0.0348494
ROOMSi 3547.094 1812.854 1.96 -20.09611 7114.287
BATHSi 10942.8 2835.757 3.86 5362.838 16522.76
AGEi -628.954 148.691 -4.23 -921.5366 -336.371
AGEi-sq 2.41538 0.916566 2.64 0.6118334 4.218926
DISTi 1.07342 3.40895 0.31 -5.634432 7.781275
DISTi-sq -0.0000138 0.0002479 -0.06 -0.0005017 0.0004741
CBDi -2.28621 1.87569 -1.22 -5.977049 1.404631
Y81i -9376.65 14060.95 -0.67 -37044.68 18291.38
Y81iDISTi 15.2034 4.73166 3.21 5.892829 24.51402
Y81iDISTi-sq -0.0010536 0.0003615 -2.91 -0.001765 -0.0003423
N = 321; = 460,340,273.0; R$σ2 2 = 0.7636; F(13, 307) = 76.29 (0.0000)
ECON 351* -- Winter Term 2009: Assignment 3 ANSWERS Page 14 of 30 pages
ECONOMICS 351* -- Assignment 3 ANSWERS M.G. Abbott
2. (continued)
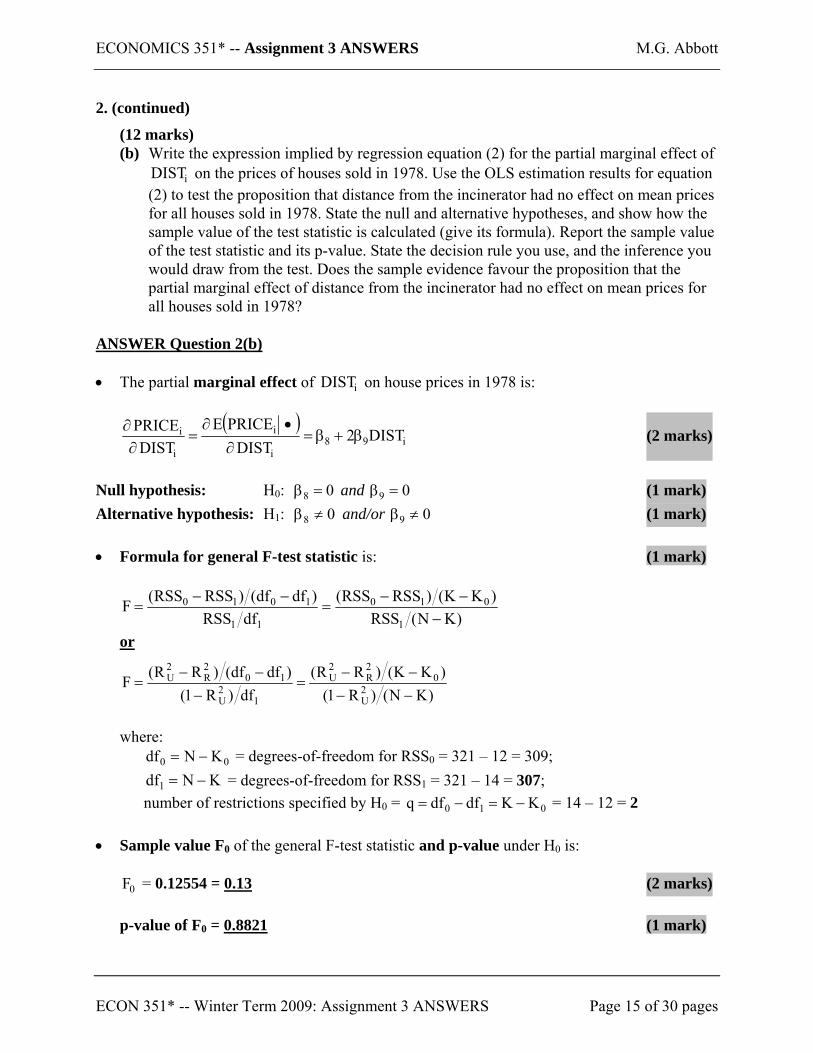
(12 marks) (b) Write the expression implied by regression equation (2) for the partial marginal effect of
on the prices of houses sold in 1978. Use the OLS estimation results for equation (2) to test the proposition that distance from the incinerator had no effect on mean prices for all houses sold in 1978. State the null and alternative hypotheses, and show how the sample value of the test statistic is calculated (give its formula). Report the sample value of the test statistic and its p-value. State the decision rule you use, and the inference you would draw from the test. Does the sample evidence favour the proposition that the partial marginal effect of distance from the incinerator had no effect on mean prices for all houses sold in 1978?
iDIST
ANSWER Question 2(b) • The partial marginal effect of on house prices in 1978 is: iDIST
( )
i98i
i
i
i DIST2DIST
PRICEEDIST
PRICEβ+β=
∂•∂
=∂∂ (2 marks)
Null hypothesis: H0: and 08 =β 09 =β (1 mark) Alternative hypothesis: H1: and/or 08 ≠β 09 ≠β (1 mark) • Formula for general F-test statistic is: (1 mark)
)KN(RSS)KK()RSSRSS(
dfRSS)dfdf()RSSRSS(F
1
010
11
1010
−−−
=−−
=
or
)KN()R1()KK()RR(
df)R1()dfdf()RR(F 2
U
02R
2U
12U
102R
2U
−−−−
=−
−−=
where:
00 KNdf −= = degrees-of-freedom for RSS0 = 321 – 12 = 309; KNdf1 −= = degrees-of-freedom for RSS1 = 321 – 14 = 307;
number of restrictions specified by H0 = 010 KKdfdfq −=−= = 14 – 12 = 2 • Sample value F0 of the general F-test statistic and p-value under H0 is:
0F = 0.12554 = 0.13 (2 marks)
p-value of F0 = 0.8821 (1 mark)
ECON 351* -- Winter Term 2009: Assignment 3 ANSWERS Page 15 of 30 pages

ECONOMICS 351* -- Assignment 3 ANSWERS M.G. Abbott
ANSWER Question 1(b): continued (total marks = 12) • Decision rule and inference: either formulation 1 or 2 (3 marks) (1) Decision Rule -- Formulation 1: This a two-tail test. Compare the sample value F0 with the
α-level critical value of the F[2, N−14] = F[2, 307] distribution.
1. If , retain (do not reject) H]14N,2[FF0 −≤ α 0 at the 100α percent significance level. 2. If , reject H]14N,2[FF0 −> α 0 at the 100α percent significance level.
Inference: Since F0 = 0.13 < 3.025 = F0.05[2, 307], retain H0 at the 5 % significance level. Since F0 = 0.13 < 2.320 = F0.10[2, 307], retain H0 at the 10 % significance level.
(2) Decision Rule -- Formulation 2: This a two-tail test. Compare the p-value for F0 with the
chosen significance level α.
1. If p-value for , retain (do not reject) HαF0 ≥ 0 at significance level α. 2. If p-value for , reject HαF0 < 0 at significance level α.
Inference:
Since p-value for F0 = 0.8821 > 0.05, retain H0 at the 5 % significance level. Since p-value for F0 = 0.8821 > 0.10, retain H0 at the 10 % significance level.
• Result: (1 mark)
The sample evidence favours the null hypothesis H0 that distance from the incinerator had no effect on mean prices for all houses sold in 1978 at both the 5% and 10% significance levels. It thus provides no evidence that the partial marginal effect on 1978 house prices of distance from the incinerator was non-zero.
ECON 351* -- Winter Term 2009: Assignment 3 ANSWERS Page 16 of 30 pages

ECONOMICS 351* -- Assignment 3 ANSWERS M.G. Abbott
2. (continued)
(12 marks) (c) Write the expression implied by regression equation (2) for the partial marginal effect of
on the prices of houses sold in 1981. Use the OLS estimation results for equation (2) to test the proposition that distance from the incinerator had no effect on mean prices for all houses sold in 1981. State the null and alternative hypotheses, and show how the sample value of the test statistic is calculated (give its formula). Report the sample value of the test statistic and its p-value. State the decision rule you use, and the inference you would draw from the test. Does the sample evidence favour the proposition that the partial marginal effect of distance from the incinerator had no effect on the mean prices of houses sold in 1981?
iDIST
ANSWER Question 2(c) • The partial marginal effect of on house prices in 1981 is: iDIST
( )
i139128i
i
i
i DIST)(2DIST
PRICEEDIST
PRICEβ+β+β+β=
∂•∂
=∂∂ (2 marks)
Null hypothesis: H0: 0128 =β+β and 0139 =β+β (1 mark) Alternative hypothesis: H1: 0128 ≠β+β and/or 0139 ≠β+β (1 mark) • Formula for general F-test statistic is: (1 mark)
)KN(RSS)KK()RSSRSS(
dfRSS)dfdf()RSSRSS(F
1
010
11
1010
−−−
=−−
=
or
)KN()R1()KK()RR(
df)R1()dfdf()RR(F 2
U
02R
2U
12U
102R
2U
−−−−
=−
−−=
where:
00 KNdf −= = degrees-of-freedom for RSS0 = 321 – 12 = 309; KNdf1 −= = degrees-of-freedom for RSS1 = 321 – 14 = 307;
number of restrictions specified by H0 = 010 KKdfdfq −=−= = 14 – 12 = 2 • Sample value F0 of the general F-test statistic and p-value under H0 is:
0F = 9.5600 = 9.56 (2 marks)
p-value of F0 = 0.0000942 = 0.0001 (1 marks
ECON 351* -- Winter Term 2009: Assignment 3 ANSWERS Page 17 of 30 pages
ECONOMICS 351* -- Assignment 3 ANSWERS M.G. Abbott
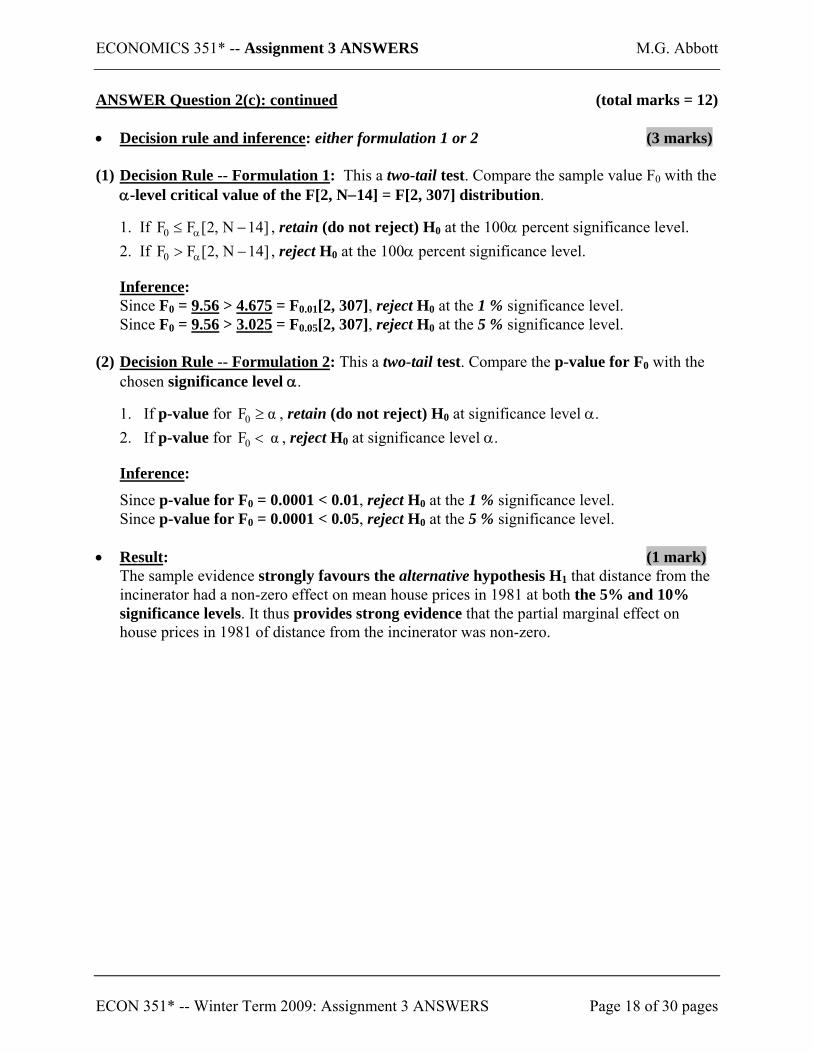
ANSWER Question 2(c): continued (total marks = 12) • Decision rule and inference: either formulation 1 or 2 (3 marks) (1) Decision Rule -- Formulation 1: This a two-tail test. Compare the sample value F0 with the
α-level critical value of the F[2, N−14] = F[2, 307] distribution.
1. If , retain (do not reject) H]14N,2[FF0 −≤ α 0 at the 100α percent significance level. 2. If , reject H]14N,2[FF0 −> α 0 at the 100α percent significance level.
Inference: Since F0 = 9.56 > 4.675 = F0.01[2, 307], reject H0 at the 1 % significance level. Since F0 = 9.56 > 3.025 = F0.05[2, 307], reject H0 at the 5 % significance level.
(2) Decision Rule -- Formulation 2: This a two-tail test. Compare the p-value for F0 with the
chosen significance level α.
1. If p-value for , retain (do not reject) HαF0 ≥ 0 at significance level α. 2. If p-value for , reject HαF0 < 0 at significance level α.
Inference:
Since p-value for F0 = 0.0001 < 0.01, reject H0 at the 1 % significance level. Since p-value for F0 = 0.0001 < 0.05, reject H0 at the 5 % significance level.
• Result: (1 mark)
The sample evidence strongly favours the alternative hypothesis H1 that distance from the incinerator had a non-zero effect on mean house prices in 1981 at both the 5% and 10% significance levels. It thus provides strong evidence that the partial marginal effect on house prices in 1981 of distance from the incinerator was non-zero.
ECON 351* -- Winter Term 2009: Assignment 3 ANSWERS Page 18 of 30 pages
ECONOMICS 351* -- Assignment 3 ANSWERS M.G. Abbott
2. (continued)
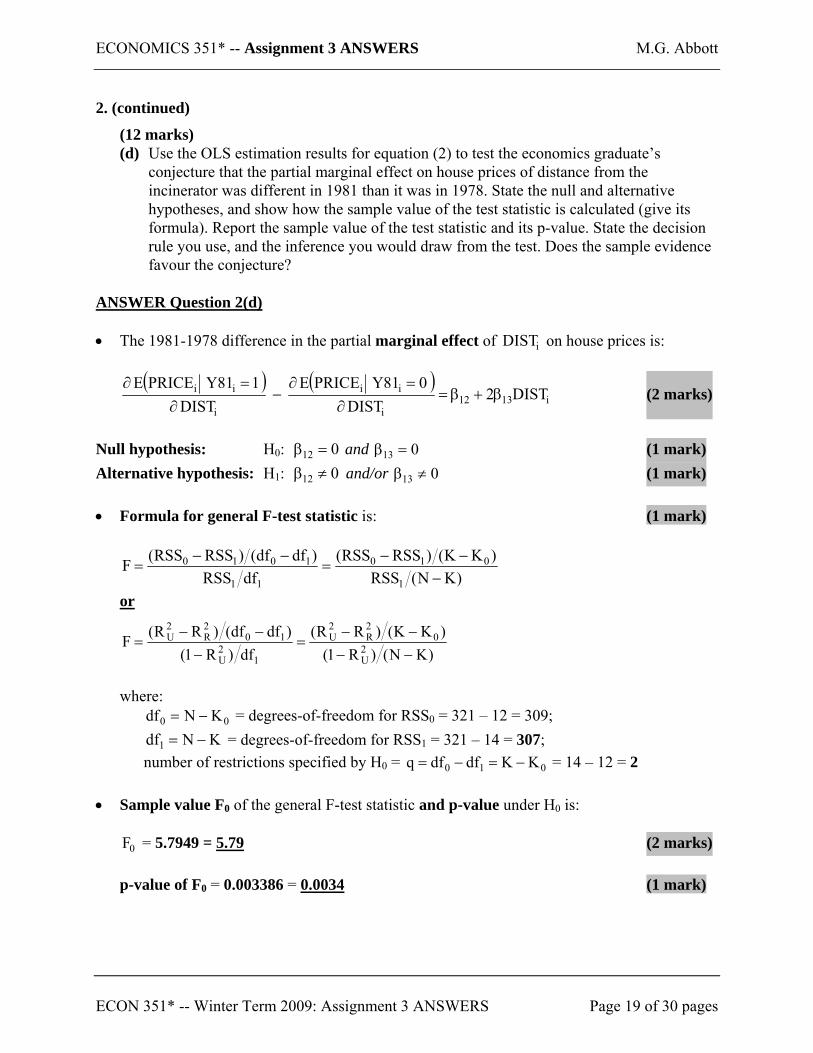
(12 marks) (d) Use the OLS estimation results for equation (2) to test the economics graduate’s
conjecture that the partial marginal effect on house prices of distance from the incinerator was different in 1981 than it was in 1978. State the null and alternative hypotheses, and show how the sample value of the test statistic is calculated (give its formula). Report the sample value of the test statistic and its p-value. State the decision rule you use, and the inference you would draw from the test. Does the sample evidence favour the conjecture?
ANSWER Question 2(d) • The 1981-1978 difference in the partial marginal effect of on house prices is: iDIST
( ) ( )
i1312i
ii
i
ii DIST2DIST
081YPRICEEDIST
181YPRICEEβ+β=
∂=∂
−∂
=∂ (2 marks)
Null hypothesis: H0: and 012 =β 013 =β (1 mark) Alternative hypothesis: H1: and/or 012 ≠β 013 ≠β (1 mark) • Formula for general F-test statistic is: (1 mark)
)KN(RSS)KK()RSSRSS(
dfRSS)dfdf()RSSRSS(F
1
010
11
1010
−−−
=−−
=
or
)KN()R1()KK()RR(
df)R1()dfdf()RR(F 2
U
02R
2U
12U
102R
2U
−−−−
=−
−−=
where:
00 KNdf −= = degrees-of-freedom for RSS0 = 321 – 12 = 309; KNdf1 −= = degrees-of-freedom for RSS1 = 321 – 14 = 307;
number of restrictions specified by H0 = 010 KKdfdfq −=−= = 14 – 12 = 2 • Sample value F0 of the general F-test statistic and p-value under H0 is:
0F = 5.7949 = 5.79 (2 marks) p-value of F0 = 0.003386 = 0.0034 (1 mark)
ECON 351* -- Winter Term 2009: Assignment 3 ANSWERS Page 19 of 30 pages
ECONOMICS 351* -- Assignment 3 ANSWERS M.G. Abbott
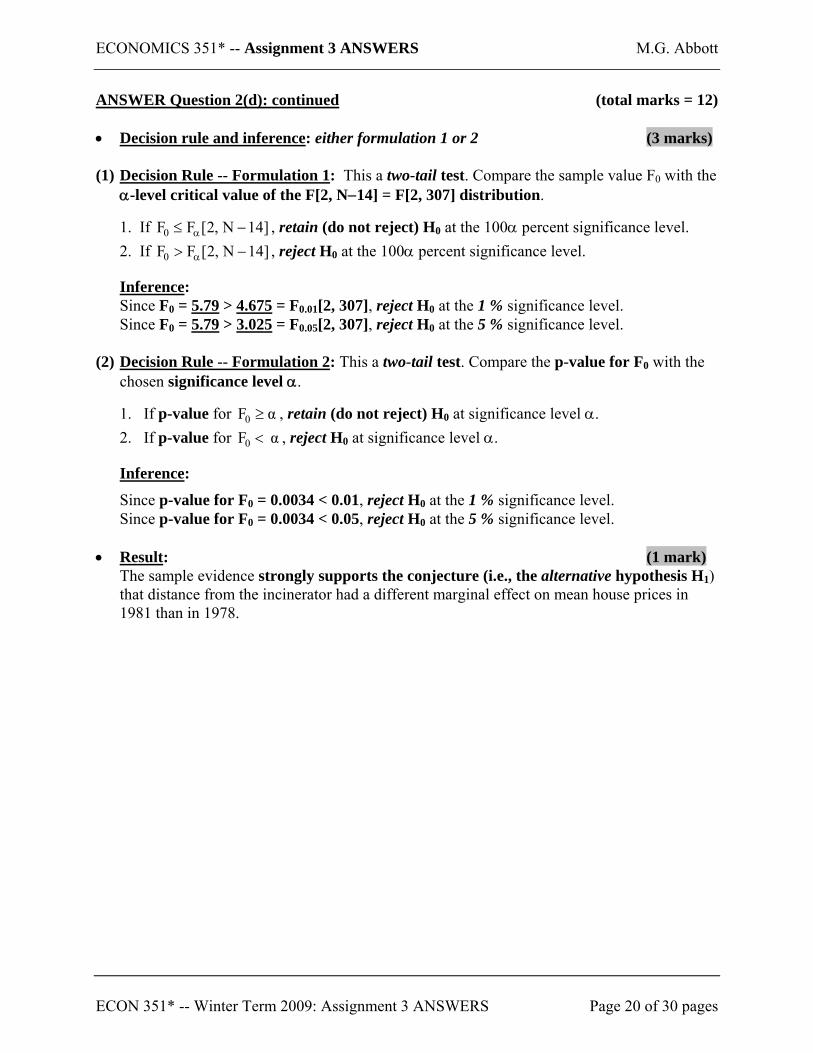
ANSWER Question 2(d): continued (total marks = 12) • Decision rule and inference: either formulation 1 or 2 (3 marks) (1) Decision Rule -- Formulation 1: This a two-tail test. Compare the sample value F0 with the
α-level critical value of the F[2, N−14] = F[2, 307] distribution.
1. If , retain (do not reject) H]14N,2[FF0 −≤ α 0 at the 100α percent significance level. 2. If , reject H]14N,2[FF0 −> α 0 at the 100α percent significance level.
Inference: Since F0 = 5.79 > 4.675 = F0.01[2, 307], reject H0 at the 1 % significance level. Since F0 = 5.79 > 3.025 = F0.05[2, 307], reject H0 at the 5 % significance level.
(2) Decision Rule -- Formulation 2: This a two-tail test. Compare the p-value for F0 with the
chosen significance level α.
1. If p-value for , retain (do not reject) HαF0 ≥ 0 at significance level α. 2. If p-value for , reject HαF0 < 0 at significance level α.
Inference:
Since p-value for F0 = 0.0034 < 0.01, reject H0 at the 1 % significance level. Since p-value for F0 = 0.0034 < 0.05, reject H0 at the 5 % significance level.
• Result: (1 mark)
The sample evidence strongly supports the conjecture (i.e., the alternative hypothesis H1) that distance from the incinerator had a different marginal effect on mean house prices in 1981 than in 1978.
ECON 351* -- Winter Term 2009: Assignment 3 ANSWERS Page 20 of 30 pages

ECONOMICS 351* -- Assignment 3 ANSWERS M.G. Abbott
2. (continued)
(10 marks) (e) Use the OLS estimation results for equation (2) to test the proposition that the partial
marginal effect of on house prices was positive for houses sold in 1981 that were located 6,000 metres from the incinerator, i.e., for houses sold in 1981 for which DIST = 6000. State the null and alternative hypotheses, and show how the sample value of the test statistic is calculated (give its formula). Report the sample value of the test statistic and its p-value. State the decision rule you use, and the inference you would draw from the test. Does the sample evidence favour the conjecture?
iDIST
ANSWER Question 2(e) • The partial marginal effect of on house prices in 1981 is: iDIST
( )i139128
i
i
i
i DIST)(2DIST
PRICEEDIST
PRICEβ+β+β+β=
∂•∂
=∂∂
Null hypothesis: H0: 06000)(2 139128 =β+β+β+β (1 mark) Alternative hypothesis: H1: 06000)(2 139128 >β+β+β+β (1 mark)
• Calculation of t-test statistic: The sample value t0 under the null hypothesis H0 is
( ) ( ) 815021.1467287.3
)ββ(12000ββes)ββ(12000ββ)ββ(12000ββt
139128
1391281391280 =
++++++
=+++ = 1.91033 = 1.91
(3 marks)
• Right-tail p-value of t0 = Pr( t > t0) = Pr( t > 1.91033) = 0.02851 (1 mark)
• Right-tail critical values of the t[N−14] = t[307] distribution are:
]307[t]14N[t 05.0=−α = 1.6498 = 1.65 at the 5% significance level (α = 0.05) (1 mark) ]307[t]14N[t 01.0=−α = 2.3386 = 2.34 at the 1% significance level (α = 0.01)
ECON 351* -- Winter Term 2009: Assignment 3 ANSWERS Page 21 of 30 pages
ECONOMICS 351* -- Assignment 3 ANSWERS M.G. Abbott
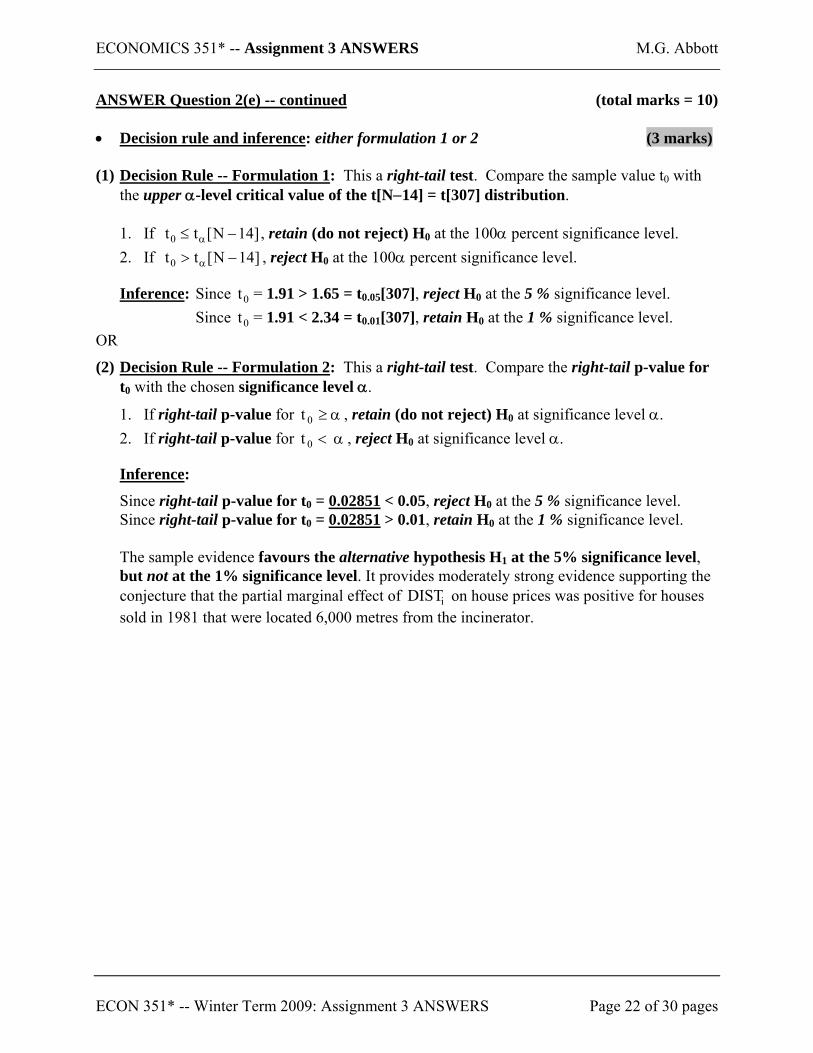
ANSWER Question 2(e) -- continued (total marks = 10) • Decision rule and inference: either formulation 1 or 2 (3 marks) (1) Decision Rule -- Formulation 1: This a right-tail test. Compare the sample value t0 with
the upper α-level critical value of the t[N−14] = t[307] distribution.
1. If , retain (do not reject) H]14N[tt0 −≤ α 0 at the 100α percent significance level. 2. If , reject H]14N[tt0 −> α 0 at the 100α percent significance level.
Inference: Since = 1.91 > 1.65 = t0t 0.05[307], reject H0 at the 5 % significance level. Since = 1.91 < 2.34 = t0t 0.01[307], retain H0 at the 1 % significance level.
OR
(2) Decision Rule -- Formulation 2: This a right-tail test. Compare the right-tail p-value for t0 with the chosen significance level α.
1. If right-tail p-value for α≥0t , retain (do not reject) H0 at significance level α. 2. If right-tail p-value for α<0t , reject H0 at significance level α.
Inference:
Since right-tail p-value for t0 = 0.02851 < 0.05, reject H0 at the 5 % significance level. Since right-tail p-value for t0 = 0.02851 > 0.01, retain H0 at the 1 % significance level.
The sample evidence favours the alternative hypothesis H1 at the 5% significance level, but not at the 1% significance level. It provides moderately strong evidence supporting the conjecture that the partial marginal effect of on house prices was positive for houses sold in 1981 that were located 6,000 metres from the incinerator.
iDIST
ECON 351* -- Winter Term 2009: Assignment 3 ANSWERS Page 22 of 30 pages

ECONOMICS 351* -- Assignment 3 ANSWERS M.G. Abbott
2. (continued)
(14 marks) (f) Use the OLS estimation results for equation (2) to compute an estimate of the partial
marginal effect of on house prices for houses sold in 1981 that were located 2,000 metres from the incinerator, i.e., for houses sold in 1981 for which DIST = 2000. Use the estimation results for equation (2) to test the proposition that the partial marginal effect of on house prices was zero for houses sold in 1981 that were located 2,000 metres from the incinerator (for which DIST = 2000). State the null and alternative hypotheses, and show how the sample value of the test statistic is calculated (give its formula). Report the sample value of the test statistic and its p-value. State the decision rule you use, and the inference you would draw from the test.
iDIST
iDIST
ECON 351* -- Winter Term 2009: Assignment 3 ANSWERS Page 23 of 30 pages
ECONOMICS 351* -- Assignment 3 ANSWERS M.G. Abbott
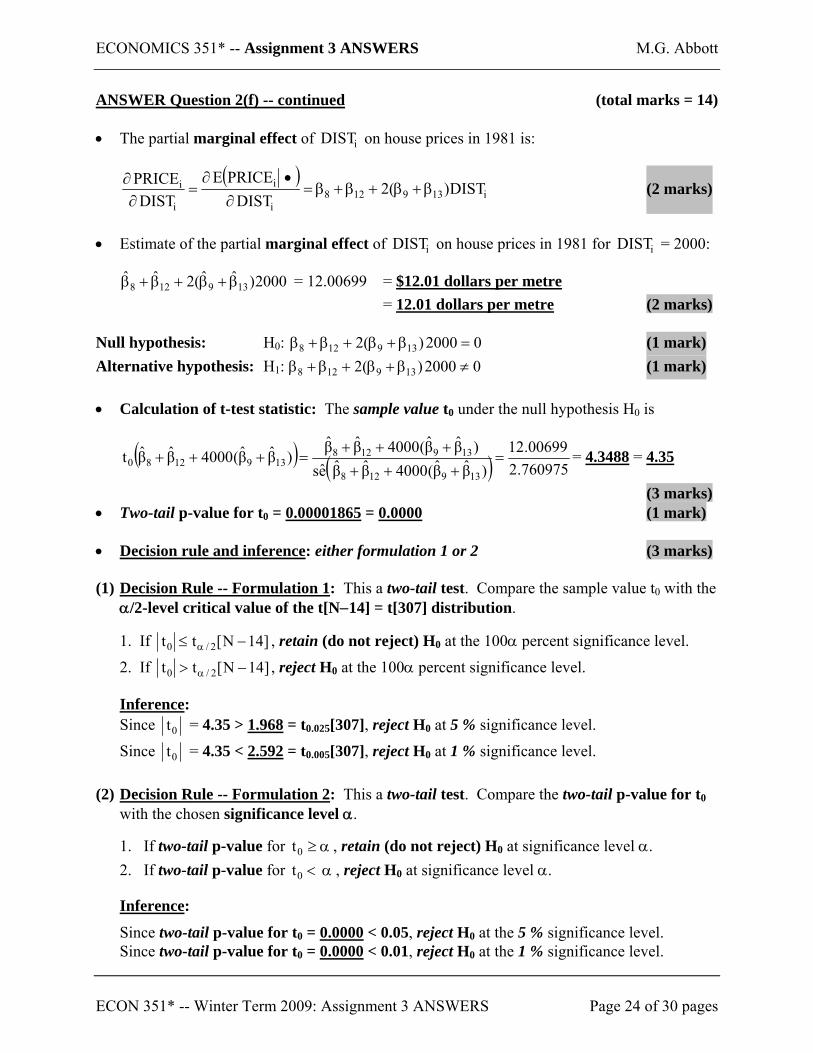
ANSWER Question 2(f) -- continued (total marks = 14) • The partial marginal effect of on house prices in 1981 is: iDIST
( )i139128
i
i
i
i DIST)(2DIST
PRICEEDIST
PRICEβ+β+β+β=
∂•∂
=∂∂ (2 marks)
• Estimate of the partial marginal effect of on house prices in 1981 for = 2000: iDIST iDIST
2000)ˆˆ(2ˆˆ139128 β+β+β+β = 12.00699 = $12.01 dollars per metre
= 12.01 dollars per metre (2 marks) Null hypothesis: H0: 02000)(2 139128 =β+β+β+β (1 mark) Alternative hypothesis: H1: 02000)(2 139128 ≠β+β+β+β (1 mark)
• Calculation of t-test statistic: The sample value t0 under the null hypothesis H0 is
( ) ( ) 760975.200699.12
)ββ(4000ββes)ββ(4000ββ)ββ(4000ββt
139128
1391281391280 =
++++++
=+++ = 4.3488 = 4.35
(3 marks) • Two-tail p-value for t0 = 0.00001865 = 0.0000 (1 mark)
• Decision rule and inference: either formulation 1 or 2 (3 marks) (1) Decision Rule -- Formulation 1: This a two-tail test. Compare the sample value t0 with the
α/2-level critical value of the t[N−14] = t[307] distribution.
1. If ]14N[tt 2/0 −≤ α , retain (do not reject) H0 at the 100α percent significance level.
2. If ]14N[tt 2/0 −> α , reject H0 at the 100α percent significance level.
Inference: Since 0t = 4.35 > 1.968 = t0.025[307], reject H0 at 5 % significance level.
Since 0t = 4.35 < 2.592 = t0.005[307], reject H0 at 1 % significance level. (2) Decision Rule -- Formulation 2: This a two-tail test. Compare the two-tail p-value for t0
with the chosen significance level α.
1. If two-tail p-value for , retain (do not reject) Hα≥0t 0 at significance level α. 2. If two-tail p-value for , reject Hα<0t 0 at significance level α.
Inference:
Since two-tail p-value for t0 = 0.0000 < 0.05, reject H0 at the 5 % significance level. Since two-tail p-value for t0 = 0.0000 < 0.01, reject H0 at the 1 % significance level.
ECON 351* -- Winter Term 2009: Assignment 3 ANSWERS Page 24 of 30 pages

ECONOMICS 351* -- Assignment 3 ANSWERS M.G. Abbott
ANSWER Question 2(f) -- continued (total marks = 14) • Result: (1 mark)
The sample evidence favours the alternative hypothesis H1 that β8 + β12 + 2(β9 + β13)2000 ≠ 0 at both the 5% and 1% significance levels; it provides strong evidence that distance from the incinerator has a non-zero marginal effect on mean prices for houses sold in 1981 that were located 2,000 metres (2 kilometres) from the incinerator.
ECON 351* -- Winter Term 2009: Assignment 3 ANSWERS Page 25 of 30 pages
ECONOMICS 351* -- Assignment 3 ANSWERS M.G. Abbott
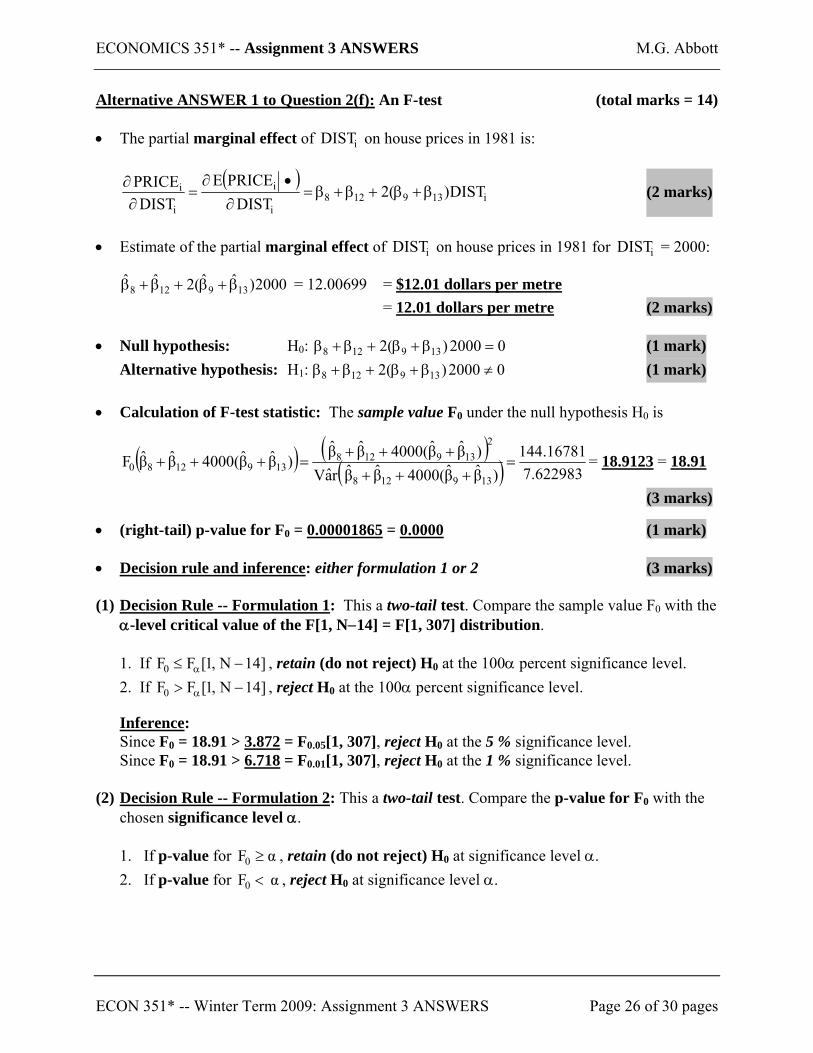
Alternative ANSWER 1 to Question 2(f): An F-test (total marks = 14) • The partial marginal effect of on house prices in 1981 is: iDIST
( )
i139128i
i
i
i DIST)(2DIST
PRICEEDIST
PRICEβ+β+β+β=
∂•∂
=∂∂ (2 marks)
• Estimate of the partial marginal effect of on house prices in 1981 for = 2000: iDIST iDIST
2000)ˆˆ(2ˆˆ139128 β+β+β+β = 12.00699 = $12.01 dollars per metre
= 12.01 dollars per metre (2 marks) • Null hypothesis: H0: 02000)(2 139128 =β+β+β+β (1 mark)
Alternative hypothesis: H1: 02000)(2 139128 ≠β+β+β+β (1 mark)
• Calculation of F-test statistic: The sample value F0 under the null hypothesis H0 is
( ) ( )( ) 622983.7
16781.144)ββ(4000ββraV
)ββ(4000ββ)ββ(4000ββF139128
2139128
1391280 =+++
+++=+++ = 18.9123 = 18.91
(3 marks)
• (right-tail) p-value for F0 = 0.00001865 = 0.0000 (1 mark)
• Decision rule and inference: either formulation 1 or 2 (3 marks) (1) Decision Rule -- Formulation 1: This a two-tail test. Compare the sample value F0 with the
α-level critical value of the F[1, N−14] = F[1, 307] distribution.
1. If , retain (do not reject) H]14N,1[FF0 −≤ α 0 at the 100α percent significance level. 2. If , reject H]14N,1[FF0 −> α 0 at the 100α percent significance level.
Inference: Since F0 = 18.91 > 3.872 = F0.05[1, 307], reject H0 at the 5 % significance level. Since F0 = 18.91 > 6.718 = F0.01[1, 307], reject H0 at the 1 % significance level.
(2) Decision Rule -- Formulation 2: This a two-tail test. Compare the p-value for F0 with the
chosen significance level α.
1. If p-value for , retain (do not reject) HαF0 ≥ 0 at significance level α. 2. If p-value for , reject HαF0 < 0 at significance level α.
ECON 351* -- Winter Term 2009: Assignment 3 ANSWERS Page 26 of 30 pages

ECONOMICS 351* -- Assignment 3 ANSWERS M.G. Abbott
Alternative ANSWER 1 to Question 2(f): An F-test (total marks = 14)
Inference:
Since p-value for F0 = 0.0000 < 0.05, reject H0 at the 5 % significance level. Since p-value for F0 = 0.0000 < 0.01, reject H0 at the 1 % significance level.
• Result: (1 mark)
The sample evidence favours the alternative hypothesis H1 that β8 + β12 + 2(β9 + β13)2000 ≠ 0 at both the 5% and 1% significance levels; it provides strong evidence that distance from the incinerator has a non-zero marginal effect on mean prices for houses sold in 1981 that were located 2,000 metres (2 kilometres) from the incinerator.
. * Question 2(f):
. *
. lincom _b[dist] + _b[y81dist] + 2*(_b[distsq] + _b[y81distsq])*2000 ( 1) dist + 4000 distsq + y81dist + 4000 y81distsq = 0 ------------------------------------------------------------------------------ price | Coef. Std. Err. t P>|t| [95% Conf. Interval] -------------+---------------------------------------------------------------- (1) | 12.00699 2.760975 4.35 0.000 6.574164 17.43982 ------------------------------------------------------------------------------ . lincom _b[dist] + _b[y81dist] + 2*(_b[distsq] + _b[y81distsq])*2000, level(99) ( 1) dist + 4000 distsq + y81dist + 4000 y81distsq = 0 ------------------------------------------------------------------------------ price | Coef. Std. Err. t P>|t| [99% Conf. Interval] -------------+---------------------------------------------------------------- (1) | 12.00699 2.760975 4.35 0.000 4.850716 19.16327 ------------------------------------------------------------------------------
ECON 351* -- Winter Term 2009: Assignment 3 ANSWERS Page 27 of 30 pages
ECONOMICS 351* -- Assignment 3 ANSWERS M.G. Abbott
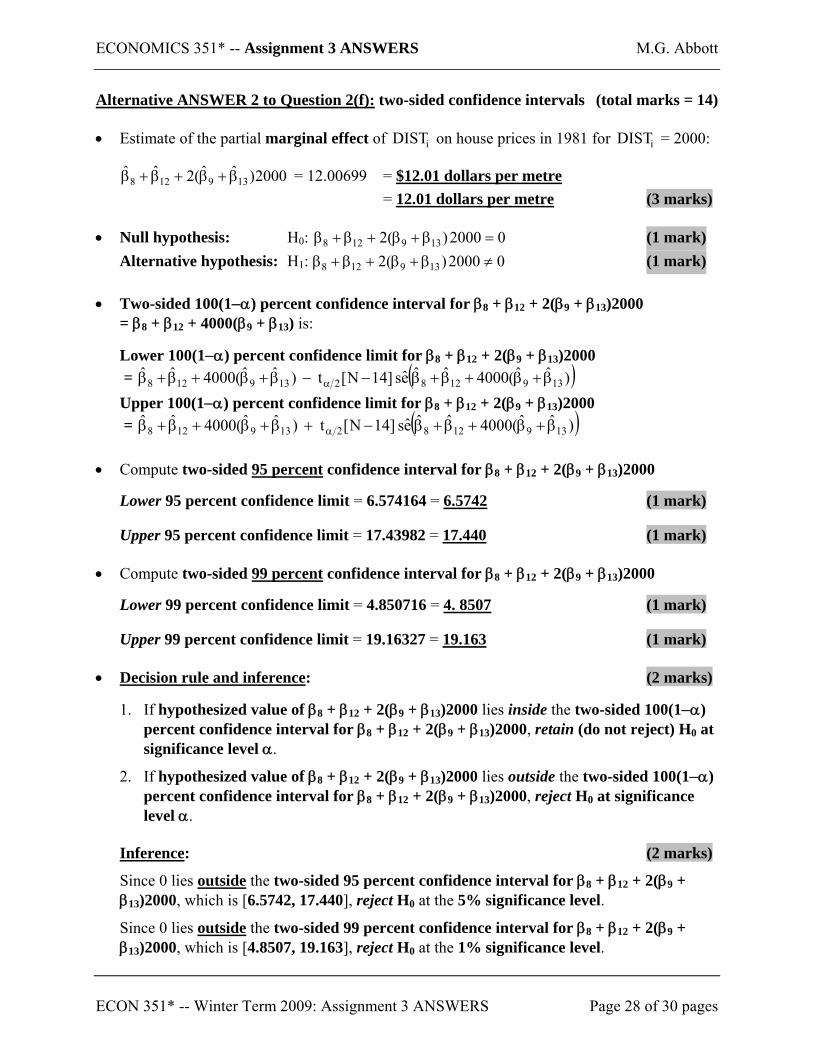
Alternative ANSWER 2 to Question 2(f): two-sided confidence intervals (total marks = 14) • Estimate of the partial marginal effect of on house prices in 1981 for = 2000: iDIST iDIST
2000)ˆˆ(2ˆˆ139128 β+β+β+β = 12.00699 = $12.01 dollars per metre
= 12.01 dollars per metre (3 marks) • Null hypothesis: H0: 02000)(2 139128 =β+β+β+β (1 mark)
Alternative hypothesis: H1: 02000)(2 139128 ≠β+β+β+β (1 mark) • Two-sided 100(1−α) percent confidence interval for β8 + β12 + 2(β9 + β13)2000
= β8 + β12 + 4000(β9 + β13) is:
Lower 100(1−α) percent confidence limit for β8 + β12 + 2(β9 + β13)2000 = ( ))ˆˆ(4000ˆˆes]14N[t)ˆˆ(4000ˆˆ
1391282139128 β+β+β+β−−β+β+β+β α Upper 100(1−α) percent confidence limit for β8 + β12 + 2(β9 + β13)2000 = ( ))ˆˆ(4000ˆˆes]14N[t)ˆˆ(4000ˆˆ
1391282139128 β+β+β+β−+β+β+β+β α
• Compute two-sided 95 percent confidence interval for β8 + β12 + 2(β9 + β13)2000
Lower 95 percent confidence limit = 6.574164 = 6.5742 (1 mark)
Upper 95 percent confidence limit = 17.43982 = 17.440 (1 mark)
• Compute two-sided 99 percent confidence interval for β8 + β12 + 2(β9 + β13)2000
Lower 99 percent confidence limit = 4.850716 = 4. 8507 (1 mark)
Upper 99 percent confidence limit = 19.16327 = 19.163 (1 mark) • Decision rule and inference: (2 marks)
1. If hypothesized value of β8 + β12 + 2(β9 + β13)2000 lies inside the two-sided 100(1−α) percent confidence interval for β8 + β12 + 2(β9 + β13)2000, retain (do not reject) H0 at significance level α.
2. If hypothesized value of β8 + β12 + 2(β9 + β13)2000 lies outside the two-sided 100(1−α) percent confidence interval for β8 + β12 + 2(β9 + β13)2000, reject H0 at significance level α.
Inference: (2 marks)
Since 0 lies outside the two-sided 95 percent confidence interval for β8 + β12 + 2(β9 + β13)2000, which is [6.5742, 17.440], reject H0 at the 5% significance level.
Since 0 lies outside the two-sided 99 percent confidence interval for β8 + β12 + 2(β9 + β13)2000, which is [4.8507, 19.163], reject H0 at the 1% significance level.
ECON 351* -- Winter Term 2009: Assignment 3 ANSWERS Page 28 of 30 pages

ECONOMICS 351* -- Assignment 3 ANSWERS M.G. Abbott
Alternative ANSWER 2 to Question 2(f) -- continued (total marks = 14) • Result: (1 mark)
The sample evidence favours the alternative hypothesis H1 that β8 + β12 + 2(β9 + β13)2000 ≠ 0 at both the 5% and 1% significance levels; it provides strong evidence that distance from the incinerator has a non-zero marginal effect on mean prices for houses sold in 1981 that were located 2,000 metres (2 kilometres) from the incinerator.
ECON 351* -- Winter Term 2009: Assignment 3 ANSWERS Page 29 of 30 pages

ECONOMICS 351* -- Assignment 3 ANSWERS M.G. Abbott
2. (continued) (12 marks) (g) Use the Stata graph command to draw a line graph of the conditional relationship of
estimated mean house price to , distance from the incinerator, for houses sold in 1981 (for which Y81 = 1) that had the following observed characteristics: HSIZE = 196 square metres; LSIZE = 3700 square metres; ROOMS = 7; BATHS = 2; AGE = 18 years; and CBD = 4,800 metres. Note that these observed characteristics correspond to the approximate sample mean values of the explanatory variables , ,
, , and in the estimation sample.
iDIST
iHSIZE iLSIZE
iROOMS iBATHS iAGE iCBD
8000
090
000
1000
0011
0000
1200
00m
ean
hous
e pr
ice
in 1
981
(dol
lars
)
2000 4000 6000 8000 10000 12000distance from incinerator (metres)
Conditional Effect of Distance from Incineratoron Mean House Prices in 1981
Stata commands used to create the above line graph: #delimit ; generate pricehat = _b[_cons] + _b[hsize]*196 + _b[lsize]*3700 + _b[hsizelsize]*196*3700 + _b[rooms]*7 + _b[baths]*2 + _b[age]*18 + _b[agesq]*18*18 + (_b[dist] + _b[y81dist] )*dist + (_b[distsq] + _b[y81distsq] )*dist *dist + _b[cbd]*4800 + _b[y81] ; #delimit cr sort dist summarize pricehat dist list dist pricehat in 1/10 #delimit ; graph twoway line pricehat dist, ytitle("mean house price in 1981 (dollars)") xtitle("distance from incinerator (metres)") title("Conditional Effect of Distance from Incinerator" "on Mean House Prices in 1981") ; #delimit cr
ECON 351* -- Winter Term 2009: Assignment 3 ANSWERS Page 30 of 30 pages