ECOLOGY OF THE AMERICAN MINK & THE POTENTIAL …
116
ECOLOGY OF THE AMERICAN MINK & THE POTENTIAL IMPACT ON SPECIES OF CONCERN IN CAPE ROMAIN NATIONAL WILDLIFE REFUGE, SOUTH CAROLINA A Thesis Presented to the Graduate School of Clemson University In Partial Fulfillment of the Requirements for the Degree Master of Science Wildlife and Fisheries Biology by Caroline E. Gorga May 2012 Accepted by: Dr. Greg K. Yarrow, Committee Chair Dr. Patrick D. Gerard Dr. Patrick G. Jodice
Transcript of ECOLOGY OF THE AMERICAN MINK & THE POTENTIAL …

ECOLOGY OF THE AMERICAN MINK & THE POTENTIAL IMPACT
ON SPECIES OF CONCERN IN CAPE ROMAIN NATIONAL
WILDLIFE REFUGE, SOUTH CAROLINA
A Thesis
Presented to
the Graduate School of
Clemson University
In Partial Fulfillment
of the Requirements for the Degree
Master of Science
Wildlife and Fisheries Biology
by
Caroline E. Gorga
May 2012
Accepted by:
Dr. Greg K. Yarrow, Committee Chair
Dr. Patrick D. Gerard
Dr. Patrick G. Jodice

ii
ABSTRACT
Species reintroduction projects are becoming more common as a conservation
tool to reestablish populations following extirpation. The implementation of these
projects can be controversial due to the potential impact the reintroduced animal could
have on endangered, threatened, or at risk prey species. In 1999, South Carolina’s
Department of Natural Resources (SCDNR) reintroduced the American mink (Neovison
vison), a SCDNR designated species of high conservation priority, to the northern coastal
marshes of the state, including Cape Romain National Wildlife Refuge (CRNWR). In
order to estimate the impact of this opportunistic predator on other species, especially
those of special concern to the US Fish and Wildlife Service (USFWS) at CRNWR, a
literature-based bioenergetics model was constructed using diet analysis data from 45
mink stomach/gastrointestinal tracts collected from CRNWR. Diet was predominately
crustacean (51.9% of prey occurrences) and fish (40.7%) with occasional avian
occurrence (7.4%). The bioenergetics model estimated, on average, that a single mink
could consume 158 crustacean, 38 fish, and 8.5 avian prey items per month.
Additionally, 7 female mink were captured, implanted with an intraperitoneal
transmitter, and monitored from March through August (2010 and 2011) to determine
home range size and activity pattern. Average lactating female mink home range and
core area measured 2.12 ha and 0.26 ha, respectively, and average linear home range (i.e.,
marsh edge utilization within home range) measured 1.0 km. Lactating female mink
activity was negatively related to tide height. Although activity was not significantly
influenced by temperature and light, lactating female mink appeared to be less active
iii
during the day, especially at mid-day when temperatures were high. Based on the
findings of this study and others that have monitored avian species of concern in
CRNWR, predation (e.g., mink, raccoon, great horned owl, black vulture, rat, and ghost
crab) has been demonstrated to contribute to lost shorebird and seabird productivity (i.e.,
nest loss or chick loss). Since American mink, American oystercatcher (Haematopus
palliates), black skimmer (Rynchops niger), and least tern (Sternula antillarum) have
high conservation value in South Carolina, further monitoring and research of the
interaction of these species is necessary to restore the historical ecological integrity of the
system. A joint mink culling-relocation program between SCDNR and USFWS at
CRNWR could benefit both mink and beach-nesting bird conservation.

iv
DEDICATION
I dedicate this thesis to my loving family. To my parents, Carolyn and Joe, for
their guidance and support. To my brother, Matthew, for his encouragement every step of
the way. Thank you for always believing in me. I could not have reached this goal
without you.

v
ACKNOWLEDGMENTS
I am extremely grateful to my advisor, Dr. Greg Yarrow, for his patience,
guidance, and support throughout my time at Clemson, as well as for making trapping
nights both fun and successful. Special thanks to my committee members, Dr. Patrick
Gerard and Dr. Patrick Jodice, for their guidance and encouragement.
This study was conducted through the School of Agricultural, Forest, and
Environmental Sciences at Clemson University and the South Carolina Department of
Natural Resources (SCDNR). I would like to thank SCDNR for providing project funds
and equipment through the South Carolina State Wildlife Grants Project. I would
especially like to thank Jay Butfiloski, the SCDNR Fur Bearer and Alligator Program
Coordinator, for his support throughout the project.
Special thanks to Dr. Lynn Flood, D.V.M, and her staff from Daniel Island
Animal Hospital for helping make this project a reality. Thank you for all of the early
morning surgeries!
I would like to thank Michael Waller and Walter Hansen for their hard work and
dedication, especially during the late night and early morning shifts. Thanks to Sarah
Dawsey, Billy Shaw, and all those at Cape Romain National Wildlife Refuge for their
support with this project as well as for providing housing. Thanks to Cady Etheredge,
Lauren Pile, Adam DiNuovo, Jessica Gorzo, Molly Giles, Kristi Dunn, Gillian Brooks,
and Kate Sheehan for their friendship and support.

vi
TABLE OF CONTENTS
Page
TITLE PAGE .................................................................................................................... i
ABSTRACT ..................................................................................................................... ii
DEDICATION ................................................................................................................ iv
ACKNOWLEDGMENTS ............................................................................................... v
LIST OF TABLES ........................................................................................................ viii
LIST OF FIGURES ......................................................................................................... x
CHAPTER
I. GENERAL INTRODUCTION ...................................................................... 1
Objectives ................................................................................................. 3
Study Area ................................................................................................ 3
Biology of the American Mink ................................................................. 4
Literature Cited ......................................................................................... 7
II. DIET ANALYSIS OF THE AMERICAN MINK & ESTIMATING
THE POTENTIAL IMPACT ON PREY SPECIES
USING A BIOENERGETICS MODEL ...................................................... 11
Introduction ............................................................................................ 11
Materials and Methods ........................................................................ 14
Results .................................................................................................. 21
Discussion ............................................................................................ 24
Literature Cited .................................................................................... 32
III. ACTIVITY PATTERN & HOME RANGE OF AMERICAN MINK
IN THE TIDAL MARSHES OF CAPE ROMAIN NATIONAL
WILDLIFE REFUGE, SC .......................................................................... 49
Introduction ............................................................................................ 49
Materials and Methods ........................................................................... 51
Results .................................................................................................... 58
Discussion .............................................................................................. 62
Literature Cited ...................................................................................... 70

vii
Table of Contents (Continued)
IV. SUMMARY & CONCLUSIONS ............................................................... 85
Literature Cited ...................................................................................... 88
APPENDICES ............................................................................................................... 90
A: Bioenergetics model SAS/STAT® program code for the
estimation of fish, crustacean, and avian consumption of
a male mink in Cape Romain National Wildlife Refuge,
South Carolina ............................................................................................. 91
B: Histograms generated from 300,000 iterations of each
bioenergetics model showing the distribution of the
outcomes using the male model (crustacean, fish, and avian),
female model (avian only), and lactating female (avian only) .................... 93
C. 95% Fixed Kernel Home Ranges and 50% Core Use Areas
(50% Kernel) for 7 radio-monitored female American mink
in Cape Romain National Wildlife Refuge, South Carolina ........................ 99

viii
LIST OF TABLES
Table Page
2.1 Bioenergetics model input parameters – Estimated prey
mass range, g wet weight, and prey energy density,
kJ/g wet weight, found in the literature ................................................. 38
2.2 Bioenergetics model input parameter – Methods compiled
from the literature to estimate daily energy expenditure,
kJ/day, of an American mink ................................................................. 39
2.3 Trapping data (capture date, sex, age class, weight, and
general location) collected by USFWS personnel as well
as stomach and gastrointestinal (GI) tract contents of mink
captured in CRNWR in 2010 (March through August) ......................... 40
2.4 Trapping data (capture date, sex, age class, weight, and
general location) collected by USFWS personnel as well
as stomach and gastrointestinal (GI) tract contents of mink
captured in CRNWR in 2011 (March through April)…………………..41
2.5 Diets of CRNWR mink (male, female, and both sexes
combined, “total”) during Spring/Summer 2010 and
2011 using relative frequency of occurrence method
of analysis .............................................................................................. 42
2.6 Bioenergetics model input parameter – Diet composition
of the American mink in terms of relative frequency of
occurrence (RFO) compiled from the literature..................................... 43
2.7 Bioenergetics model input parameters – Weight range,
g, of mink trapped in CRNWR, South Carolina, and
the estimated daily, kJ/g/day, and monthly, kJ/g/month,
energy expenditure of the mink using Equation 2 ................................. 44
2.8 Bioenergetics model simulation output – Estimated mean
monthly consumption (± standard deviation) of each prey
category by male, female, and lactating female mink
during the spring/summer in CRNWR, South Carolina ....................... 45

ix
List of Tables (Continued)
2.9 Bioenergetics model simulation output – Median, range,
3rd
Quartile (75th
percentile), and 95th
Percentile
obtained from 300,000 iterations of each bioenergetics
model (male, female, lactating female mink) ........................................ 46
3.1 Sex, age class, weight (g), capture date, transmitter
frequency, and kit measurements (when applicable)
in CRNWR, South Carolina, May 2010 and April-May 2011 .............. 74
3.2 Home range (95% Fixed Kernel, ha), core area (50%
Fixed Kernel, ha), and linear range (km) of 7
radio-monitored mink in CRNWR, South Carolina,
March through August 2011 .................................................................. 75
3.3 Dates monitored for activity pattern analysis, total number
of fixes (active + inactive), and number of number of
active fixes per female in CRNWR, South Carolina.
The number of “not found” occurrences in which a
female was not located (i.e., not detected) during a
time block............................................................................................... 76
3.4 Total number of active and inactive fixes recorded
during the day (0600 to 20:00) and at night (20:00
to 06:00) for all 6 females monitored in CRNWR,
South Carolina, from March through August 2011 ............................... 77
3.5 Percentage of time within a 24-hour cycle in which
lactating & non-lactating females are expected to be
active in CRNWR, South Carolina, March-August 2011.
Data was combined to estimate an average percentage
of active time for all monitored female .................................................. 78
x
LIST OF FIGURES
Figure Page
1.1 Cape Romain National Wildlife Refuge, Charleston
County, South Carolina. Research was concentrated
in the northern marshes (box), adjacent to Cape
Island, Lighthouse Island, and Raccoon Key......................................... 10
2.1 Locations of predator management activities within the
northern marsh and on Cape Island in relation to
capture sites of 9 radio-monitored mink in CRNWR,
South Carolina, 2010-2011 .................................................................... 47
2.2 Relative frequency of occurrence of mink diet (male, female,
and both sexes combined, “total”) in CRNWR, South
Carolina during Spring/Summer 2010 and 2011 ................................... 48
3.1 Capture locations of 9 mink (2 juvenile males, 7 adult females)
in the northern marshes of CRNWR, South Carolina,
in May 2010 and from April to May 2011 ............................................. 79
3.2 Use of small drainage creeks (enclose in red) by lactating
female mink, F3, in CRNWR, South Carolina,
June-August 2010 locations ................................................................... 80
3.3 Home range, core area, and estimated monthly locations
of mink F6 and F9 in CRNWR, South Carolina,
May-August 2011. Not the total lack of home range
overlap.................................................................................................... 81
3.4 Percentage of all active and inactive fixes on 6 female
mink at various tide heights (m) in CRNWR, South
Carolina, March-August 2011 ............................................................... 82
3.5 Range of activity within a time block for each monitored
female mink in CRNWR, South Carolina, March-August
2011. Mink F2 and F3 (royal blue and red) were monitored
between March and April 2011 during the end of mink
breeding season ...................................................................................... 83
3.6 Average predicted activity within each time block
for female mink during spring and summer in
CRNWR, South Carolina, March-August 2011 .................................... 84

1
CHAPTER ONE
GENERAL INTRODUCTION
Species reintroduction projects are becoming more common as a conservation
tool to reestablish populations following extirpation (Seddon et al. 2007). Reintroduction
efforts require careful planning, which typically includes population modeling, pre-
release health-risk assessment, and post-release monitoring (Beck 2001, Seddon et al.
2007). Reintroduction efforts often lack an ecosystem perspective beyond that of
restoring the ecological integrity of a system (Armstrong and Seddon 2007). Armstrong
and Seddon (2007) proposed a series of a priori questions at the population,
metapopulation, and ecosystem levels to provide a more strategic approach to
reintroduction projects, and one of these questions addressed the potential effect of a
reintroduced animal on an ecosystem. Predator reintroductions, in particular, are
controversial due to this potential impact, especially when a reintroduction area contains
endangered, threatened, or at risk prey species.
In the 1980s, South Carolina’s Department of Natural Resources (SCDNR)
reported the American mink (Neovison vison) population to be in decline statewide. The
mink, an opportunistic predator, was found to be nearly absent within the coastal marshes
north of Charleston, South Carolina, where the species had previously been abundant.
The specific cause for decline is unknown, but habitat degradation and the presence of
environmental contaminates (such as mercury or polychlorinated biphenyls) are the
primary hypotheses (Baker 1999). In 1998, SCDNR assessed the feasibility of
reintroducing the mink to the northern coastal marshes of the state (Peeples 2001).

2
Following the identification of areas with suitable mink habitat, 62 mink from stable
populations along the southern coast of South Carolina (south of the city of Charleston)
were captured and released in Cape Romain National Wildlife Refuge (CRNWR). A
post-release study reported the restoration project to be a success, documenting an 89%
survival rate of 19 monitored mink for 125 days post-release (Peeples 2001). In 2005,
SCDNR listed mink as a species of high conservation priority in the South Carolina
Comprehensive Wildlife Conservation Strategy (Kohlsaat et al. 2005).
Recently, mink-specific predation on nesting shorebird and colonial beach nesting
birds as well as loggerhead sea turtles (Caretta caretta) has been observed by US Fish
and Wildlife Service (USFWS) officials at CRNWR. Mink predation on waterfowl,
shorebirds, and seabirds has been documented both in North America and abroad (Craik
1997, Ferreras and MacDonald 1999, Nordström et al. 2002, Hall and Kress 2004, Sabine
et al. 2006, Shüttler et al. 2009). Several areas have reported colony-wide breeding
failures of various colonial nesting avian species due to mink presence (Craik 1997, Hall
and Kress 2004, Brooks 2011), while other areas have found mink predation to
negatively impact nest survival of solitary nesting species (Shüttler et al. 2009). The
majority of the documentation regarding mink impact on avian species, however, has
occurred outside of North America where the mink is an invasive species.
Mammalian predation (and predation in general) is not a new occurrence in
CRNWR. Raccoons (Procyon lotor) have been frequent predators of avian and turtle
nests at CRNWR. Rat (species unknown), black vulture (Coragyps atratus), great horned
owl (Bubo virginianus), laughing gull (Larus atricilla), and ghost crab (Ocepode

3
quadrata) have recently been documented depredating nests of American oystercatchers
(Haematopus palliates), black skimmer (Rynchops niger), and least terns (Sternula
antillarum) (Brooks 2011; S. Collins, personal communication, September 9, 2011; S.
Dawsey, personal communication, February 11, 2010).
In order to estimate the potential impact of this opportunistic predator on other
species, especially those of special concern to USFWS at CRNWR (i.e., American
oystercatcher, black skimmer, least tern, and loggerhead sea turtles), a literature-based
bioenergetics model was constructed using diet analysis data collected from mink
stomachs and gastrointestinal tracts in CRNWR. Additionally, mink were captured and
implanted with an intraperitoneal VHF-transmitter, and monitored from March through
August of 2010 and 2011 to determine activity pattern and home range size.
STUDY AREA
Cape Romain National Wildlife Refuge (Figure 1.1) is a 26,817 ha migratory bird
refuge located along 35 km of South Carolina’s coastline just north of Charleston. The
refuge is a combination of barrier islands, salt marshes, tidal creeks, coastal waterways,
beaches, fresh and brackish water impoundments, maritime forest, and open water
(Godsea et al. 2010). CRNWR is a Western Hemisphere Shorebird Reserve Network
Site of International Importance, hosting approximately 277 species of waterfowl, wading
birds, shorebirds, and raptors (Godsea et al. 2010). Avian species at CRNWR such as the
brown pelican (Pelecanus occidentalis), American oystercatcher, piping plover
(Charadrius melodus), least tern, and black skimmer are of high conservation priority to

4
the USFWS. The refuge also provides habitat to the largest nesting population of
loggerhead sea turtles north of Cape Canaveral, Florida (approximately 1,000 nests per
year), as well as raccoon, mink, white-tailed deer (Odocoileus virginianus), river otter
(Lutra canadensis), American alligator (Alligator mississippiensis), and other species
(Godsea et al. 2010).
My research focused on the ecology of mink that inhabited the salt marsh and
barrier island complex in the northern region of the refuge near McClellanville, South
Carolina. This area is important to the refuge due to the high number of nesting shorebird
and colonial beach nesting birds (mainly black skimmers, least terns, and American
oystercatchers) and loggerhead sea turtles that utilize the barrier islands. Vegetation of
the CRNWR salt marsh system is dominated by smooth cordgrass (Spartina alterniflora),
while the barrier islands are primarily beaches, sand dunes, and salt marsh (Godsea et al.
2010).
BIOLOGY OF THE AMERICAN MINK
The American mink is a member of the weasel family Mustelidae and has the
long cylindrical body, short legs, and short ears characteristic of mustelids (Larivière
2003). Adults weigh between 500 and 1500g with females weighing approximately 50%
less than males (Hall 1981). Average overall body length ranges from 470 mm to 700
mm, with the tail accounting for one third of the length (Jackson 1961). The pelage is
typically a uniform dark brown with the exception of the tip of the tail, which tends to be

5
nearly black. White markings are often found on the chin but also on the throat, chest,
and belly (Jackson 1961).
Historically, this semi-aquatic species has inhabited aquatic areas, such as
swamps, rivers, streams, lakes and fresh and saltwater marshes, throughout the United
States and Canada with varying densities in South Carolina (Larivière 2003, Butfiloski
and Baker 2005). American mink were taken to Europe in the 1920s for the fur industry,
and, either due to accidental or intentional release, populations have become established
throughout the region (Larivière 2003). As a result, mink are negatively impacting prey
species like the water vole (Arvicola amphibius) and various avian species (Aars et al.
2001, Nordström et al. 2003). Interspecies competition with the European polecat
appears unlikely due to resource partitioning (Lodé 1993). Bonesi and MacDonald
(2004) reported a reduction in mink density following Eurasian otter (Lutra lutra)
reintroduction, suggesting interference competition as the cause, and proposed Eurasian
otter reintroductions in Europe could be used to control invasive mink.
Mink are a denning species that rarely excavate their own dens, using cavities
within tree roots and rock piles or burrows of other species like the muskrat (Butfiloski
and Baker 2005). Gerell (1970) reported mink utilizing 2 to 5 dens that were 70-2060 m
apart. Populations inhabiting tidal systems rarely utilize permanent dens due to
fluctuating water levels (Peeples 2001). In CRNWR, mink use tide racks, or dead
smooth cordgrass (Spartina alterniflora) accumulation, along creek edges to escape high
tides (Peeples 2001).

6
Immediately following the reintroduction of mink into CRNWR, Peeples (2001)
monitored 19 mink and documented the largest recorded home range for the species in a
marsh environment (males: 6.91 km2, females: 2.28 km
2). The home range was also
found to be two-dimensional, unlike the linear home ranges reported for mink along
rivers in Europe (Peeples 2001). Mink are considered to be territorial, and Peeples (2001)
documented intersexual but not intrasexual home range overlap for adult mink in
CRNWR.
Mink are strict carnivores with a diet that reflects prey availability and abundance
(Ben-David et al. 1997). Depending on the season and the system, mink diet can include
fish, crustacean (crabs and crayfish), amphibians, small mammals, birds and their eggs,
reptiles, lagomorphs, and arthropods (Arnold and Fritzell 1987, Birks and Dunstone
1985, Larivière 2003, Previtali et al. 1998, Shüttler et al. 2008). Relative frequency of
avian prey in mink diet, for instance, tends to increase during the spring and summer
months when this prey is more readily available (Arnold and Fritzell 1987, Bartoszewicz
and Zalewski 2003, Shüttler et al. 2008).

7
LITERATURE CITED
Aars, J., X. Lambin, R. Denny, and A. C. Griffin. 2001. Water vole in the Scottish
uplands: distribution patterns of disturbed and pristine populations ahead and
behind the American mink invasion front. Animal Conservation 4:187-194.
Armstrong, D. P., and P. J. Seddon. 2007. Directions in reintroduction biology. TRENDS
in Ecology and Evolution 23:20-25.
Arnold, T. W., and E. K. Fritzell. 1987. Food habits of prairie mink during the
waterfowl breeding season. Canadian Journal of Zoology 65:2322-2324.
Baker, O. E. 1999. The status of mink (Mustela vison) in South Carolina. South Carolina
Department of Natural Resources, Furbearer Project Publication No. 99-01,
Columbia, South Carolina, USA.
Bartoszewicz, M., and A. Zalewski. 2003. American mink, Mustela vison diet and
predation on waterfowl in the Slonsk Reserve, western Poland. Folia Zoologica
52:225-238.
Beck, B. B. 2001. A vision for reintroduction. Communiqué September 2001:20-21.
American Zoo and Aquarium Association, Silver Spring, Maryland, USA.
Ben-David, M., T. A. Hanley, D. R. Klein, and D. M. Schell. 1997. Seasonal changes in
diets of coastal and riverine mink: the role of spawning Pacific salmon. Canadian
Journal of Zoology 75:803-811.
Birks, J. D. S., and N. Dunstone. 1985. Sex-related differences in the diet of the mink
Mustela vison. Holarctic Ecology 8:245-252.
Bonesi, L., D. W. MacDonald. 2004. Impact of released Eurasian otters on a population
of American mink: a test using an experimental approach. Oikos 106:9-18.
Brooks, G. 2011. Reproductive success of black skimmers and least terns. Thesis,
Clemson University, Clemson, South Carolina, USA.
Butfiloski, J., and B. Baker. 2005. Mink – Mustela vison. South Carolina Department of
Natural Resources. Columbia, South Carolina, USA.
Craik, C. 1997. Long-term effects of North American mink Mustela vison on seabirds in
western Scotland. Birdy Study 44:303-309.
Ferreras, P., and D. W. MacDonald. 1999. The impact of American mink Mustela vison
on water birds in the upper Thames. Journal of Applied Ecology 36:701-708.

8
Gerell, R. 1970. Home ranges and movements of the mink Mustela vison Shreber in
southern Sweden. Oikos 21:160-173.
Godsea, K., R. Nilius, V. Fischer, S. Dawsey, R. Paterra, P. Lynch. 2010. Comprehensive
conservation plan and environmental assessment – Cape Romain National
Wildlife Refuge. U.S. Fish and Wildlife Service, Cape Romain National Wildlife
Refuge, Charleston County, South Carolina, USA.
Hall, E. R. 1981. The mammals of North America. Second edition. John Wiley, New
York, New York, USA.
Hall, C. S., and S. W. Kress. 2004. Comparison of Common Tern reproductive
performance at four restored colonies along the coast of Maine. Waterbirds 27:
424-433.
Jackson, H. H. T. 1961. Mammals of Wisconsin. University of Wisconsin Press,
Madison, Wisconsin, USA.
Kohlsaat, T., L. Quattro, and J. Rinehart. 2005. South Carolina Comprehensive Wildlife
Conservation Strategy 2005-2010. South Carolina Department of Natural
Resources, South Carolina, USA.
Larivière, S. 2003. Mink: Mustela vison. Pages 662-671 in G. A. Feldhamer, B. C.
Thompson, and J. A. Chapman, editors. Wild mammals of North America.
Second edition. The Johns Hopkins University Press, Baltimore, Maryland, USA.
Lodé, T. 1993. Diet composition and habitat use of sympatric polecat and American mink
in western France. Acta Theriologica 38:161-166.
Nordström, M., J. Högmander, J. Nummelin, J. Laine, N. Laanetu, and E. Korpimaki.
2002. Variable responses of waterfowl breeding populations to long-term removal
of introduced American mink. Ecography 25:385-394.
Nordström, M., J. Högmander, J. Laine, J. Nummelin, N. Laanetu, and E. Korpimaki.
2003. Effects of feral mink removal on seabirds, waders and passerines on small
islands in the Baltic Sea. Biological Conservation 109:359-368.
Peeples, J. W. 2001. The feasibility of re-establishing wild mink in the northern coastal
marshes of South Carolina. Thesis, Clemson University, Clemson, South
Carolina, USA.
Previtali, M. H., M. H. Cassini, and D. W. MacDonald. 1998. Habitat use and diet of the
American mink (Mustela vison) in Argentinian Patagonia. Journal of Zoology,
London 246:482-486.

9
Sabine, J. B., S. H. Schweitzer, and J. M. Meyers. 2006. Nest fate of productivity of
American oystercatchers, Cumberland Island National Seashore, Georgia.
Waterbirds 29:308-314.
Seddon, P. J., D. P. Armstrong, and R. F. Maloney. 2007. Developing the science of
reintroduction biology. Conservation Biology 21:303-312.
Shüttler, E., C. J. Carcamo, and R. Rozzi. 2008. Diet of the American mink Mustela
vison and its potential impact on the native fauna of Navarino Island, Cape Horn
Biosphere Reserve, Chile. Revista Chilena de Historia Natural 81:585-598.
Shüttler, E., R. Klenke, S. McGehee, R. Rozzi, and K. Jax. 2009. Vulnerability of
ground-nesting waterbirds to predation by invasive American mink in the Cape
Horn Biosphere Reserve, Chile. Biological Conservation 142:1450-1460.

Ed
ucato
r’s Gu
ide
3
S
ewee V
isitor &
Env
iron
men
tal Edu
cation C
enter / 5
821 H
igh
way
17 N
orth
, Aw
end
aw, S
C 2
942
9 / (8
43
) 92
8-3
36
8
Figure 1.1: Cape Romain National Wildlife Refuge, Charleston County, South
Carolina. Research was concentrated in the northern marshes (see inset), adjacent to
Cape Island, Lighthouse Island, and Raccoon Key.

11
CHAPTER TWO
DIET ANALYSIS OF THE AMERICAN MINK & ESTIMATING POTENTIAL
IMPACT ON PREY SPECIES USING A BIOENERGETICS MODEL
INTRODUCTION
The American mink is an opportunistic and generalist predator with a diet that
typically includes fish, crustacean, small mammals, and amphibians while
opportunistically includes avian and reptiles eggs, adult birds, lagomorphs, and
arthropods (Ben-David et al. 1997, Birks and Dunstone 1985, Arnold and Fritzwell 1987,
Previtali et al. 1998, Larivière 2003, Shüttler et al. 2008). The impact of mink predation
on seabirds and shorebirds, in particular, has either determined the level of productivity
lost to predation (Hall and Kress 2004, Shüttler et al. 2009) or quantified mink diet to
determine the importance of avian prey (Arnold and Fritzell 1987, Ibarra et al. 2009). In
this study the goal was to quantify food habits of mink in a system where avian prey was
common.
Local prey availability and abundance influences the proportion of prey species
found in the mink diet, which can differ between ecosystems (Delibes et al. 2004,
Hammersh et al. 2004, Shüttler et al. 2008), seasons (Arnold and Fritzwell 1987,
Bartoszewicz and Zalewski 2003, Hatler 1976), sex (Birks and Dunstone 1985), and
individuals (Sidorovich et al. 2001). Frequency of avian prey, for instance, tends to
increase in mink diet during months while birds are nesting and rearing chicks, which is a
time when birds are more vulnerable to predation (Arnold and Fritzwell 1987,
Bartoszewicz and Zalewski 2003, Shüttler et al. 2008).
12
Mink predation on avian species, in particular, can result in colony-wide breeding
failure for colonial nesting seabirds as well as significantly reduce productivity of solitary
nesting birds (Craik 1997, Ferreras and MacDonald 1999, Schüttler et al. 2009). For
example, in CRNWR, Brooks (2011) suggested mink to be the cause of colony failures of
least tern (Sternula antillarum) on Lighthouse Island (2009) and Raccoon Key (2010).
Evidence has shown that mink, along with other predators like raccoon (Procyon lotor),
rat (species unknown), black vulture (Coragyps atratus), great horned owl (Bubo
virginianus), laughing gull (Larus atricilla), and ghost crab (Ocepode quadrata) are
negatively impacting (i.e. disturb and/or depredate) shorebirds and seabirds (Brooks
2011; S. Collins, personal communication, September 9, 2011).
Loggerhead sea turtle (Caretta caretta) nest depredation in CRNWR has
primarily been caused by raccoons, which were the main mammalian egg predator
present in CRNWR prior to the reintroduction of mink in 1999. Mink depredation of sea
turtle nests was not observed until 2007 when a lactating female raided 3 nests (Dawsey
2007). Since the 2007 incident, sea turtle nest depredation by mink has not been
observed. Although no official study documenting mink predation on sea turtles has
occurred, it is hypothesized that mink are more likely to target emerging hatchlings than
nests (S. Dawsey, personal communication, February 11, 2010).
In 2010, CRNWR released the Comprehensive Conservation Plan and
Environmental Assessment, describing the management goals, objectives, and strategies
for the refuge over the next 15 years. To achieve the goals of (a) conserving, protecting,
and enhancing populations of endangered, threatened, and rare species on the refuge; and,

13
(b) sustaining healthy and viable migratory bird populations, implementation of
mammalian predator (i.e., raccoon and mink) management was included in numerous
objectives and strategies (Godsea et al. 2010:42,47). Within the goal of conserving South
Carolina’s native wildlife and fish populations, however, the game animal objective
states, “keep raccoon population density at low levels to [prevent] predation of sea turtle
and ground nesting birds. Remove mink from the refuge” (Godsea et al. 2010:52). Prior
to implementing large-scale predator management such as removing a native species
from an area, it is important to quantify loss to predation as well as the impact of that loss
on prey population dynamics.
Breeding failure in coastal nesting birds in CRNWR has been attributed to
predation and environmental factors, e.g., overwash caused by high tides or boat wakes
and erosion of barrier islands (Thibault 2008, Brooks 2011). Loggerhead sea turtle nests
are also in danger of overwash and beach erosion; therefore, the Cape Romain Nest
Relocation Program relocates nests in danger of inundation or erosion to self-releasing
hatcheries built by the program or more appropriate nesting sites on the beach (Dawsey
2009). Due to the inability to protect nests of coastal breeding birds from overwash,
reducing predation-caused nest loss is CRNWR’s most practicable management option if
increasing nesting productivity of shorebirds, seabirds, and loggerhead sea turtles is a
goal.
Bioenergetics models are often used to quantify the impact of predators on prey
by mathematically modeling energy flow between the populations (Dekar et al. 2010,
Glahn and Brugger 1995, Matias and Catry 2008, Roby et al. 2003). Such models can be

14
created from data collected in the field from focal populations, or can be built from data
in the literature and basic energetic equations. While the former typically results in a
more accurate model, the latter can be useful for creating a more broadly focused model
that can highlight critical data needs without an investment in labor-intensive and
expensive field studies. In either case, energy estimates can vary depending on how the
input parameters are calculated, and validation of the estimates can be difficult.
My goal was to develop a literature-based bioenergetics model to determine
monthly estimates of the amount of aquatic and avian prey consumed by American mink
during spring and summer in CRNWR. Although mink are generalist predators, mink
predation on CRNWR’s avian species of concern will be the primary focus of this study.
Stomach and gastrointestinal tracts from mink in CRNWR were collected and the relative
frequency of occurrence of prey items (i.e., fish, crustacean, avian species) in these
samples was determined. This data was then used to create the bioenergetics model, and
data not available directly from the focal population in CRNWR was found in the
literature. This model will allow managers to quantify the potential negative impact of
mink on other species, particularly nesting shorebirds and seabirds (i.e. American
oystercatcher, least tern, and black skimmer; referred to as “species of concern”).
MATERIALS & METHODS
Mink Diet Analysis
Mink diet composition was estimated through gross stomach and gastrointestinal
tract (digestive tract) content analysis. Determining diet through scat analysis (as

15
reported by Arnold and Fritzell 1987, Delibes et al. 2004, Salo et al. 2010) would have
been a challenge due to the difficulty of collecting scat in a system with fluctuating water
levels. Digestive tracts were obtained from mink carcasses that were removed by
USFWS personnel during routine predator management activities on the refuge in 2010
and 2011. Cape Island, one of the barrier islands at CRWNR, was the primary location
for predator management since both shorebirds and loggerhead sea turtles nest on this
island. Bull’s Bay was also included in mink removal efforts following reports of
predation on American oystercatcher (Haematopus palliatus). Date of capture, location
of trap (GPS location, UTM coordinates), sex, age, and weight were recorded for each
carcass by USFWS personnel. Carcasses were immediately frozen to halt decomposition
and preserve contents of the digestive tract for later analysis. Digestive tracts were
removed at CRNWR, re-frozen, and later analyzed at Clemson University.
Contents were removed from each stomach and intestinal tract, washed with
distilled water, and examined under a dissecting scope. Undigested prey remains were
documented using the frequency of occurrence method (Hyslop 1980) and sorted into one
of four categories: crustacean (exoskeleton fragments), fish (scales, bone, vertebrae), bird
(chick remains, egg shell, feathers), and other (i.e., vegetation, sand, etc.) (Fasola et al.
2009). Due to the small sample size, digestive tract data from different locations and
collection years was pooled for analysis. Relative frequency of occurrence (RFO), or the
total number of items in a category in relation to the sum of all prey occurrences across
all categories, was calculated. Digestive tracts containing only sand and/or vegetation
were excluded from the analysis.

16
Diet Composition by Relative Energetic Contribution
Bioenergetics studies use diet composition analyses to determine the percent of
each prey type by biomass, which is then converted to the relative energetic contribution
of the prey item to the daily energy requirement of the predator. Energetic contribution
of a prey category (i.e., crustacean) is used instead of the RFO to account for the
discrepancy between the relative frequency of an item in the diet and the energetic
contribution of an item to the diet (i.e., common items may not always contribute the
majority of the energy). Due to the small sample of digestive tracts obtained from
CRNWR, percent biomass (and therefore percent energy) could not be determined.
Literature reporting mink diet composition (primarily from scat analyses) was compiled
to supplement my data in the bioenergetics model.
Prey Mass & Energy Content
Prey mass (wet weight in grams) was estimated for all three prey categories based
on field observations and supplemented with the literature. Diet analysis and
observations in the field indicated that crustaceans consumed by mink in CRNWR were
fiddler crabs (Atlantic marsh fiddler crab, Uca pugnax and/or sand fiddler crab, Uca
pugilator) and Atlantic blue crab (Callinectes sapidus). The range for mass of
crustaceans as a prey category was estimated to be 5 - 85 g based on values obtained in
the field and from the literature. For example, the minimum weight was based on direct
observations of fiddler crabs, while the maximum weight was based on Atlantic blue crab
meat content. It was estimated that, on average, a blue crab contained between 57 and 85
g of non-exoskeleton content (i.e., meat, internal organs) (Table 2.1).

17
The range for the mass of fish as a prey category was estimated to be 30-125 g
based on direct observations of fish carcasses, primarily channel catfish (Ictalurus
puncta), found on floating tide racks occupied by mink (Table 2.1). The minimum
weight (30 g) was based on the average length and weight of commercial channel catfish
purchased for a double-crested cormorant (Phalacrocorax auritus) digestibility study
(Brugger 1993). The maximum weight (125 g) was based on the length of the larger fish
found on mink tide racks (approximately 22-23 cm) that was converted to weight using
the equation given by Keenan et al. (2011):
(1)
where W is the weight (kg), L is the length (cm), and a and b are constants (0.00522,
3.2293) specific to channel catfish.
Data on mass of avian eggs was compiled for the species of special concern to the
refuge (Table 2.1), and the range (8 to 50 g) was determined. Adult birds were not
included in the analysis since mink do not appear to predate on adult black skimmers,
least terns, and American oystercatchers in CRNWR. This bioenergetics model focused
on avian egg predation, but it can be adapted to include chicks and/or adult birds like
clapper rail (Rallus longirostris), which was found in the tide rack nest of a lactating
female mink in 2011.
Energy density, or the energy per unit mass of a food item, is a measure of the
heat released from the burning of a unit of a substance (Barboza et al. 2009). Crustacean,
fish, and avian egg energy density estimates were taken from the literature (Table 2.1).
Using the estimated energy density (kJ/g wet weight) and mass (wet weight in grams) of

18
each prey category, energy content (kJ, total heat released/prey item, or gross energy, i.e.,
kJ/g * mass of the item) was calculated. The gross energy content of a food item,
however, is not completely available to the consumer (Robbins 1993, Barboza et al.
2009). The metabolizable energy (ME, %) is the portion of the gross energy content of a
particular food item that is available to the consumer (Robbins 1993). Evans (1967b,
1976, 1977, unpublished data) reported metabolizable energy values of various mink
diets falling between 72 and 85% with an average of 77% (as cited in National Research
Council 1982). Since bioenergetics studies on other mustelids (Dekar 2010, Bodey et al.
2011) and strict carnivores (Matias and Catry 2008) used similar ME estimates, the range
reported by Evans (1967b, 1976, 1977) was selected for this model.
Mink Daily Energy Expenditure
Daily energy expenditure (DEE), or the field metabolic rate (FMR), is the total
amount of energy required by a free-ranging individual per day, and it is computed by
summing the basal metabolic rate (BMR), thermoregulation, activity (e.g., locomotion,
feeding, grooming, etc.), and reproduction (Powell and Leonard 1983, Robbins 1993,
Barboza et al. 2009). Using the available literature, methods estimating the energy
requirements of American mink were compiled (Table 2.2) and compared. Since the
American mink is a valuable furbearing species, the majority of the literature reports
BMR or food energy required for maintenance of farm-raised mink. These values do not
take into account the higher energy demands of free-ranging individuals (Powell 1979).
Robbins (1993) reported DEE in captive terrestrial eutherians to be approximately 15%
lower than that of free-ranging eutherians (neither breeding nor lactating). To estimate

19
the DEE of mink in CRNWR, this study used the following allometric equation for the
FMR of carnivores provided by Nagy et al. (1999, Eq. 12):
(2)
This allometric equation compiled direct measurements of FMRs from several
mammalian carnivore species, primarily cannids and pinnipeds, in order to provide an
estimate of energy requirements for similar species that have yet to be directly measured
(Nagy et al 1999). This equation accounts for the energy demands of mink beyond that
of general maintenance, and it utilizes the available mink mass (g) data specific to the
study site.
Powell (1979) and Powell and Leonard (1983) used both field and laboratory data
to build energy expenditure models for the free-ranging fisher (Martes pennanti), which
is also in the Mustelidae family. Powell’s (1979) DEE model for the forest-dwelling
fisher could not be adapted to the semi-aquatic mink in CRNWR primarily because the
equation variables (e.g., daily swimming energy, activity budgets, etc.) could not be
directly measured nor found in the literature. However, Powell and Leonard (1983) took
the model built by Powell (1979) a step further by incorporating reproduction energy
(i.e., copulation energy and lactation energy). Due to the high demands of lactation
(Tauson et al. 1998), the model for female mink that were lactating used the allometric
equation and added a daily lactation energy demand (L, Equation 2 in Moors 1974,
Powell and Leonard 1979) to the allometric equation given by Nagy et al. (1999).
(3)

20
Based on capture data for activity and home range analyses in my study, mean litter size
was set at 5 kits. Powell and Leonard (1979) defined kit growth energy as kit daily
weight gain multiplied by the energy per unit weight. For weasels Moors (1974) found
this to be 6.88 kJ/g (as cited in Wamberg and Tauson 1998). Wamberg and Tauson
(1998) reported kit daily weight gain weekly during the first four weeks following
parturition, and the average daily weight gain (4.675 g/day) was used in Equation 2. The
kit maintenance energy, or the kit BMR, was estimated from Wamberg and Tauson’s
(1998) mink kit data to be 87.1 kJ/day. Brody (1945) estimated the efficiency of
lactation, or milk production, to be 0.90, and Tauson et al. (2004) estimated 0.85 for milk
assimilation efficiency in mink. The daily lactation energy for female mink in CRNWR
was estimated as 780 kJ/day.
Bioenergetics Model
Three separate bioenergetics models (male, female, and lactating female mink)
were constructed in SAS version 9.3 (SAS Institute, Cary, North Carolina) in order to
estimate prey consumption of mink in CRNWR. Input parameters and the structure of
the model were based on energetics models found in the literature (Beja 1996, Roby et al.
2003, Matias and Catry 2008, Bodey et al. 2011). The number of prey items within a
category, i, consumed per month (Ni) was estimated using the following equation:
(4)
where EE is the monthly energy expenditure of an individual male, female, or lactating
female mink (kJ/month); %Ci is the energetic contribution of the prey category, i (based

21
on diet analysis results); mi is the mass of the prey item (g); di is the energy density of the
prey item (kJ/g); and %ME is the metabolizable energy of mink.
The input variables, mink mass, mink metabolizable energy, and prey mass were
assumed to follow a triangular distribution. The triangular distribution is applied to data
when the minimum, maximum, and likely mode are available but the actual distribution
is unknown (Kotz and van Dorp 2004). Using the RANTRI function in SAS, a likely
modal value for mink mass, assimilation efficiency, and prey mass was randomly
generated from a triangular distribution. The analysis included 300,000 iterations of each
model (male, female, lactating female) with each run utilizing a different combination of
randomly generated input values. Mean, standard deviation, and range were calculated
using the PROC UNIVARIATE statement in SAS. The SAS program code for the male
bioenergetics model appears in Appendix A.
RESULTS
Mink Diet
In total, 44 mink carcasses (31 male, 13 female) were obtained from USFWS
personnel between March and August of 2010 and 2011 (Table 2.3, Table 2.4, Figure
2.1). Thirty of the digestive tracts were removed from individuals captured on Cape
Island. In an early attempt to compare the diets of marsh-dwelling mink to island-
dwelling mink, 4 mink were captured in the northern marshes on CRNWR adjacent to the
barrier islands. The remaining 9 individuals were trapped on shell rakes within Bulls Bay,
which is an area within CRNWR just south of the study area (not depicted in Figure 2.1).

22
Approximately half of the digestive tracts contained undigested material (n = 23,
male: 16, female: 7). Typically one prey type was found per digestive tract, but 4 tracts
(2 adult males, 1 juvenile male, and 1 adult female) contained two. Three males (D1,
D18, D24) contained crustacean and fish, while one female (D9) contained adult avian
feathers and crustacean exoskeleton.
Due to the small number of digestive tracts containing prey items, a comparison
of the relative frequency of occurrence of dietary items between years, locations, and sex
was not conducted, and the data was subsequently pooled. Diet items found in trapped
mink in CRNWR were almost exclusively crustacean (RFO 51.9%; primarily crab) and
fish (RFO 40.7%) (Table 2.5, Figure 2.2). Avian prey was found in two digestive tracts
(RFO 7.4%).
The digestive tract of D9, an adult female, and D16, a lactating female, were the
only two tracts containing avian prey. Female D9 contained avian feathers and was
trapped on Cape Island in March 2010. Although the feathers were not identifiable, the
small size of the feathers (<25 mm) and the time of year (i.e., pre- or very early breeding
season) suggest it likely was not a black skimmer (Rynchops niger), least tern (Sternula
antillarum), or American oystercatcher adult or chick. Other possibilities include
passerines, such as marsh wrens (Cistothorus palustris), or a species migrating through
the area. Female D16 was captured on Cape Island in July 2010 due to reports of
predation events in one of the least tern colonies, and partially digested feathers were
found in the stomach.

23
Diet Composition by Relative Energetic Contribution
Relative frequency of occurrence (RFO) reported in the literature for crustacean,
fish, and avian prey was compared to that found for mink in CRNWR (Table 2.6). Mink
populations described in the literature with high occurrences of mammalian prey (Birks
and Dunstone 1985, Dunstone and Birks 1987, Hammersh et al. 2004, Wilson 1954) were
not used in this study due to the lack of small mammal occurring in the digestive tracts of
mink collected in CRNWR. Other studies reporting RFO values for avian prey ≥ 30%
(Bartoszewicz and Zalewski 2003, Salo et al. 2010) were also not used due to the large
discrepancy with the CRNWR avian RFO value of 7.4%. Hatler (1976) and Delibes et al.
(2004), however, reported RFO values for coastal-dwelling mink comparable to those
found by this study. Unfortunately, appropriate estimates for prey energy contributions
that coincided with this study’s RFO results were not found in the literature.
Consequently, RFO values from CRNWR were used in place of percent energy
contributions in the model.
Bioenergetics Model Output
Average estimates of the daily energy requirements for male, female, and
lactating female mink in CRNWR were translated to monthly estimates and assumed to
be constant across an entire month: 25004 kJ, 15697 kJ, and 39097 kJ (EE in Equation 4,
Table 2.7). Energetic contribution (%Ci), which was approximated using RFO values
from this study’s diet analysis results, suggested that avian eggs could contribute, on
average, 1850.3 kJ/month, 1161.6 kJ/month, or 2893.2 kJ/month to male, female, and
lactating female mink (7.4%; RFO of avian prey). Average metabolizable energy

24
(midi%ME) of a typical avian egg was estimated to be 182.12 kJ/egg, suggesting that
male, female, and lactating female mink in CRNWR could consume, on average, 10.2,
6.4, and 15.9 avian eggs per month, respectively. The analysis in SAS comprised of
300,000 runs of each bioenergetics model (Equation 4 with triangular distributions of
each input parameter) in order to obtain standard deviation, median, range, and percentile
estimates for the 3 prey categories (Table 2.8, Table 2.9, Appendix B). Potential avian
consumption per month was 7.95±4.76, 4.99±2.98, and 12.43±7.37 eggs for male,
female, and lactating female mink.
DISCUSSION
Part I: Mink Diet
The majority of mink removed from CRNWR in 2010 and 2011 were male. Mink
breeding season occurs between January and March, so males are highly active and
traveling extensively, often beyond home range boundaries (Mitchell 1961, Gerell 1969,
Garin et al. 2002, Butfiloski and Baker 2005), and hence may be more susceptible to
trapping. In contrast, female mink do not move as extensively as males, especially
during the early kit-rearing months from April through June/July (Ireland 1990). It is
possible that the males captured on Cape Island were not all residents, but traveled there
to find mates. Based on female movements found in this study, females captured on
Cape Island were most likely resident mink. Although less time was spent trapping on
Cape Island in 2011, a similar number of males were captured in both years (2010 n = 14;
2011 n = 17), while far fewer females were captured in 2011 (2010 n = 10; 2011 n = 3).

25
Trapping methods used at CRNWR are likely the reason nearly 50% of the
captured minks’ digestive tracts were completely empty. USFWS personnel captured
mink with snares set in mink runs, which typically stretched along the edges of marshes
or dunes. It is likely that these mink were exiting a sheltered area in order to forage along
a waterline and were caught prior to consuming prey items. It is also possible that, due to
the mink’s mean prey retention time (the average time between ingestion and excretion of
a prey item) of approximately 4 hours (Warner 1981 as cited in Blaxter 1989), a meal
was fully digested and excreted prior to the mink being euthanized. The data suggest
that, in order for diet analysis using digestive tracts to be effective, either more trapping
throughout a larger area is necessary or the trapping method needs to be modified.
Alternatively, a longer-term assessment of diet may be undertaken using different
techniques (e.g., stable isotope analysis, fatty acids). If the goal of CRNWR is to
continue removing mink to reduce predation on species of concern, then data in this study
suggests that trapping should be conducted during the mink breeding season to capitalize
on high male and female activity. A late winter/early spring trapping period would
remove predators prior to the nesting season for coastal birds and sea turtles and reduce
late-summer trapping activity (April-August), which typically occurs as a response to
predation events.
The RFO in CRNWR was similar to that found for mink in other coastal systems.
The diet of a mink population along a rocky shoreline in Spain was nearly identical to the
findings in this study (Delibes et al. 2004: RFO: crab 51.6%, fish 46.3%, bird 1.2%).
Hatler (1976) also found fish, crab and bird items to occur most frequently in the diet of
26
coastal-dwelling mink (approximately, crab: 80%, fish: 40-60%, bird < 20%). Similarly,
CRNWR mink consumed more crustacean than fish. Due to the small sample of
digestive tracts, which were spatio-temporally restricted, it is likely the relative
occurrence of avian prey in mink diet at CRNWR was underestimated. For example, the
majority of digestive tracts came from a single location – Cape Island (68%). Of the
samples that contained prey items, 52% were collected prior to 1 April when American
oystercatcher nesting in CRNWR tends to begin (Thibault 2008), 17% were collected in
April when avian eggs were available on the refuge, and 30% were collected from mid-
July through late August when few eggs of any bird species are available and when
chicks of American oystercatchers, black skimmers, and least terns are close to fledging
or fledged (Thibault 2008, Brooks 2011). The RFO method showed crustacean and fish
were most often found in the digestive tracts of mink at CRNWR, but this method cannot
infer true proportions (as determined by feeding trials), preference for particular prey
items, or the impact on demography of the prey (Carss and Parkinson 1996).
Although species identification of prey items was not possible in this study, the
size of chelae found in digestive tracts suggested fiddler crabs (Atlantic marsh fiddler
crab, Uca pugnax, sand fiddler crab, Uca pugilator) as the main prey type in the
crustacean category. Mink were observed at high tides consuming primarily the body
meat of Atlantic blue crabs (Callinectes sapidus) while on floating tide racks. In terms of
fish, channel catfish (Ictalurus puncta) were the primary species found on floating tide
racks used by mink. In 2011, the tide rack nest of a lactating female mink included one
channel catfish and an adult clapper rail (Rallus longirostris).

27
The concurrent study at CRNWR monitoring reproductive success of least tern
and black skimmer colonies documented mink, raccoon, black vulture, ghost crab, great
horned owl, and laughing gull presence in the colonies in 2009 and 2010 (Brooks 2011).
Brooks (2011) monitored colonies, on average, every 3 days, reporting cause of nest loss,
or the failure of eggs to hatch, based on visual cues in proximity to the nest. Based on
observations of mink or mink sign in or near the colonies, Brooks (2011) suggested mink
predation to be the reason two least tern colonies failed. Due to the difficulty of
classifying avian nests as depredated and identifying the species of the nest predator
(Staller et al. 2005, Brooks 2011), it is possible that nest failure due to predation in
CRNWR was underestimated (Brooks 2011). In terms of this study’s findings, it is
possible that mink in CRNWR consume avian prey more frequently than the overall RFO
suggested, especially due to the spatio-temporal restrictions of the digestive tract
sampling method. A further, more detailed diet analysis using a greater sample size of
digestive tracts as well as scat or other techniques (e.g., stable isotopes, fatty acids) is
necessary before any inferences regarding the importance of any specific prey item to
mink diet in CRNWR can be made.
Part II: Bioenergetics Model
Evidence has shown large imprecision in estimates of energy requirements using
allometric equations (Furness 1978, Williams et al. 1993). Equations that predict FMR
from body weight are not necessarily species-specific, and they do not take into account
FMR oscillation due to season, reproductive status, gender, etc. Nagy et al. (1999)
advised researchers to select the equation that would most specifically apply to the study

28
animal. The energy expenditure measurements for various mammalian carnivores
compiled by Nagy (1999) formed the equation used in this model, but many of the
species were pinnipeds or canids. Due to the variability in output when allometric
equations are used in bioenergetics models, caution should be taken in terms of applying
results to management purposes.
Since it was not feasible for this study to measure mink FMR, Equation 2 was
likely the most accurate estimate of mink FMR available. Direct measurements to build
the equation used the doubly labeled water method, DLW (Nagy et al. 1999). The DLW
technique measures the elimination rates of hydrogen and oxygen isotopes introduced
into an animal in the form of water, and the difference in rate is used to approximate
energy expenditure (Speakman 1997). This method has been administered to a wide
variety of species in both the laboratory and in the field successfully, but the considerable
cost of the isotopes and sample analysis limits its application (Speakman 1997). As more
species are directly measured using this technique and incorporated into the appropriate
equations, accuracy and precision of estimates for unstudied species will increase.
Mink lactation energy was calculated and added to the allometric equation in
order to provide a more accurate estimation of mink energy expenditure during kit-
rearing season, which coincides with the nesting activities of CRNWR’s species of
concern. Lactation energy (equation 3) was likely overestimated in this model because it,
like FMR, is not a constant value during the 6 weeks prior to weaning. During the first 4
weeks following parturition, mink kits are completely dependent on milk and grow
rapidly at approximately 12% per 24-hour period. Female daily milk production during
29
this time increased 100g between week 1 and week 4 of lactation (Tauson et al. 1998).
Energy deficiencies during the final weeks of lactation suggest that female mink are
unable to meet the high energy demands by food consumption (Tauson et al. 1998 as
cited in Tauson and Elnif 1994). It is possible, therefore, that the most significant mink
predation on prey populations would occur later in the summer (July – September) while
females are attempting to sustain energy needs and kits are weaned, learning to hunt, and
beginning to disperse.
Using RFO values in place of energetic contribution in the model may have
resulted in overestimates of crustacean (51.9% and 3 kJ/g) and underestimates of avian
consumption (7.4% and 8 kJ/g). It is also possible, however, that due to the tendency of
occurrence analyses to be biased by overestimating rare and underestimating abundant
diet items (Carss and Parkinson 1996), the RFO values accounted for the energetic
contribution discrepancy. Accurate average prey size estimates are also necessary,
especially if mink consume large prey items that provide multiple meals. A more
comprehensive mink diet analysis, preferentially using other techniques such as scat or
stable isotope analysis, measuring the RFO, percent biomass, number of individuals
(prey) per scat, and energetic contribution of prey is necessary before this model can
provide more reliable estimates of mink impact on demography of avian prey populations
in CRNWR.
Bioenergetics model studies, especially for avian species, tend to report estimates
of population consumption. This study constructed three separate models (male, female,
lactating female) to predict consumption per individual since mink do not forage together

30
in one area but individually within separate home ranges. Therefore, the entire mink
population in CRNWR is not foraging on the barrier islands and not, in its entirety,
impacting species of concern. Model estimates could be reported for mink utilizing Cape
Island, which could be estimated using trapping data (Tables 2.3, 2.4), to quantify prey
consumption if predator management activities ceased.
In order for bioenergetics models to be effective at quantifying prey loss to
predators, prey density should also be known. Monthly consumption estimates for
crustaceans are high. Fiddler crab density, for instance, has been estimated at 27
crabs/m2, in southeastern salt marshes (Teal 1958), and home range of female mink in
CRNWR ranged from 2,936.86 m2 to 171,378.17 m
2. Estimates of standing fish stock
biomass and total predation (include all avian and mammalian predators) in CRNWR is
necessary in order to provide context for mink consumption estimates. It can be
assumed, however, that, due to the high productivity of salt marsh systems, mink are not
significantly impacting population dynamics of fish species (Stevens 2002).
Avian species of concern to the refuge (least tern, black skimmer, and American
oystercatcher) are annually monitored at CRNWR, and during the 2009-2010 breeding
seasons, nest counts and predation events were recorded on least tern and black skimmer
colonies. Using nest counts from Brooks (2011), approximately 190 least tern nests
(typically 2 egg clutches) and 720 black skimmer nests (3 to 4 egg clutches) were
recorded in CRNWR between 2009 and 2010. Sanders et al. (2008) reported
approximately 230 breeding pairs of American oystercatchers, which typically lay 2 to 3
egg clutches, to nest in CRNWR annually. Using nest and breeding pair counts, an

31
estimation of egg availability throughout the refuge is approximately 3,475 eggs/breeding
season for American oystercatcher, least tern, and black skimmer combined. Based on
nest counts for least tern and black skimmer on Cape Island in 2009 and 2010,
approximately 1,330 eggs/breeding season are available on Cape Island alone.
The goal of this study was to determine the potential impact of mink on other
species in CRNWR, particularly those of special concern to the refuge. A bioenergetic
modeling approach was applied to assess this impact since determining the cause of avian
nest failure in CRNWR has proven to be a challenge. The model provided estimates of
fish, crustacean, and avian (egg) consumption for individual mink in CRNWR during the
spring and summer. Further research, however, is necessary to increase the accuracy of
model estimates. Research should focus on mink diet composition in CRNWR,
especially in terms of the energetic contribution of different prey items to mink diet and
the estimated mass range of those prey items. Although primarily built from the
literature, the model is a starting point in terms of assessing the potential impacts of
American mink on other species.

32
LITERATURE CITED
Arnold, T. W., and E. K. Fritzwell. 1987. Food habits of prairie mink during the
waterfowl breeding season. Canadian Journal of Zoology 65:2322-2324.
Barboza, P. S., K. L. Parker, and I. D. Hume. 2009. Integrative wildlife nutrition.
Springer, Berlin, Germany.
Bartoszewicz, M., and A. Zalewski. 2003. American mink, Mustela vison diet and
predation on waterfowl in the Slonsk Reserve, western Poland. Folia Zoologica
52:225-238.
Ben-David, M., T. A. Hanley, D. R. Klein, and D. M. Schell. 1997. Seasonal changes in
diets of coastal and riverine mink: the role of spawning Pacific salmon. Canadian
Journal of Zoology 75:803-811.
Beja, P. R. 1996. An analysis of otter Lutra lutra predation on introduced American
crayfish Procambarus clarkia in Iberian streams. Journal of Applied Ecology
33:1156-1170.
Birks, J. D. S., and N. Dunstone. 1985. Sex-related differences in the diet of the mink
Mustela vison. Holarctic Ecology 8:245-252.
Blaxter, K. L. Sir. 1989. Energy metabolism in animals and man. Cambridge University
Press, New York, New York, USA.
Bodey, T. W., S. Bearhop, and R. A. McDonald. 2011. The diet of an invasive nonnative
predator, the feral ferret Mustela furo, and implications for the conservation of
ground-nesting birds. European Journal of Wildlife Research 57:107-117.
Brody, S. 1945. Bioenergetics and growth. Reinhold, New York, New York USA.
Brooks, G. 2011. Reproductive success of black skimmers and least terns. Thesis,
Clemson University, Clemson, South Carolina, USA.
Brugger, K. E. 1993. Digestibility of three fish species by double-crested cormorants.
The Condor 95:25-32.
Butfiloski, J., and O.E. Baker. 2005. Mink. South Carolina Department of Natural
Resources. Columbia, South Carolina, USA.
Carey, C., H. Rahn, & P. Parisi. 1980. Calories, water, lipid and yolk in avian eggs. The
Condor 82:335-343.

33
Carss, D. N., and S. G. Parkinson. 1996. Errors associated with otter Lutra lutra faecal
analysis. I. Assessing general diet from spraints. Journal of Zoology, London
238:301-317.
Craik, C. 1997. Long-term effects of North American mink Mustela vison on seabirds in
western Scotland. Birdy Study 44:303-309.
Cumberland, R. E., J. A. Dempsey, and G. J. Forbes. 2001. Should diet be based on
biomass? Importance of larger prey to the American marten. Wildlife Society
Bulletin 29:1125-1130.
Dawsey, S. 2007. Management of Atlantic loggerhead sea turtle nests on Cape Romain
National Wildlife Refuge. U.S. Fish and Wildlife Service, Cape Romain National
Wildlife Refuge, Charleston County, South Carolina, USA.
Dawsey, S. 2009. Management of Atlantic loggerhead sea turtle nests on Cape Romain
National Wildlife Refuge. U.S. Fish and Wildlife Service, Cape Romain National
Wildlife Refuge, Charleston County, South Carolina, USA.
Dekar, M. P., D. D. Magoulick, and J. Beringer. 2010. Bioenergetics assessment of fish
and crayfish consumption by river otter (Lontra canadensis): Integrating prey
availability, diet, and field metabolic rate. Canadian Journal of Fisheries and
Aquatic Sciences 67:1439-1448.
Delibes, M., M. Clavero, J. Prenda, M. del Carmen Blázquez, and P. Ferreras. 2004.
Potential impact of an exotic mammal on rocky intertidal communities of
northwestern Spain. Biological Invasions 6:213-219.
Dunstone, N., and J. D. S. Birks. 1987. The feeding ecology of mink (Mustela vison) in
coastal habitat. Journal of Zoology, London 212:69-83.
Evans, E. V. 1976b, 1976, 1977. Determinations of metabolizable energy in mink diets
and feed ingredients. Unpublished data.
Fasola, L., C. Chehébar, D. W. MacDonald, G. Porro, and M. H. Cassini. 2009. Do alien
North American mink compete for resources with native South American river
otter in Argentinean Patagonia? Journal of Zoology, London 277:187-195.
Ferreras, P., and D. W. MacDonald. 1999. The impact of American mink Mustela vison
on water birds in the upper Thames. Journal of Applied Ecology 36:701-708.
Furness, R. W. 1978. Energy requirements of seabird communities: a bioenergetics
model. Journal of Animal Ecology 47:39-53.

34
Garin, I., J. Aihartza, I. Zuberogoitia, and J. Zabala. 2002. Activity pattern of European
mink (Mustela lutreola) in southwestern Europe. Z. Jagdwiss 48:102-106.
Gerell, R. 1969. Activity patterns of the mink Mustela vison Schreber in southern
Sweden. Oikos 20:451-460.
Glahn, J. F., and K. E. Brugger. 1995. The impact of double-crested cormorants on the
Mississippi Delta catfish industry: A bioenergetics model. Colonial Waterbirds
18(Special Publication 1):168-175.
Godsea, K., R. Nilius, V. Fischer, S. Dawsey, R. Paterra, P. Lynch. 2010. Comprehensive
conservation plan and environmental assessment – Cape Romain National
Wildlife Refuge. U.S. Fish and Wildlife Service, Cape Romain National Wildlife
Refuge, Charleston County, South Carolina, USA.
Hall, C. S., and S. W. Kress. 2004. Comparison of common tern reproductive
performance at four restored colonies along the main coast, 1991-2002.
Waterbirds 27:424-433.
Hammersh, J., E. A. Thomsen, and A. B. Madsen. 2004. Diet of free-ranging American
mink and European polecat. Acta Theriologica 49:337-347.
Hatler, D. F. 1976. The coastal mink on Vancouver Island, British Columbia.
Dissertation, The University of British Columbia, Vancouver, British Columbia,
Canada.
Hyslop, E. J. 1980. Stomach contents analysis – A review of methods and their
application. Journal of Fish Biology 17:411-429.
Ibarra, J. T., L. Fasola, D. W. MacDonald, R. Rozzi, and C. Bonacic. 2009. Invasive
American mink Mustela vison in wetlands of the Cape Horn Biosphere Reserve,
southern Chile: What are they eating? Oryx 43:87-90.
Ireland, M. C. 1990. The behaviour and ecology of the American mink Mustela vison
(Schreber) in a coastal habitat. Dissertation, The University of Durham, Durham,
England.
Keenan, E., S. Warner, A. Crowe, and M. Courtney. 2011. Length, weight, and yield in
channel catfish, Lake Diane, MI. Available from Nature Precedings
<http://hdl.handle.net/10101/npre.2011.5706.1>
Kotz, S., and J. R. van Dorp. 2004. The triangular distribution. Pages 1-31 in Beyond
beta, other continuous families of distributions with bounded support and
applications. World Scientific Press, Singapore.

35
Larivière, S. 2003. Mink: Mustela vison. Pages 662-671 in G. A. Feldhamer, B. C.
Thompson, and J. A. Chapman, editors. Wild mammals of North America.
Second edition. The Johns Hopkins University Press, Baltimore, Maryland, USA.
Massey, B. W. 1974. Breeding biology of the California least tern. Proceedings of the
Linnean Society of New York 72:1-24.
Matias, R., and P. Catry. 2008. The diet of feral cats at New Island, Falkland Islands, and
impact on breeding seabirds. Polar Biology 31:609-616.
Mitchell, J. L. 1961. Mink movements and populations on a Montana river. The Journal
of Wildlife Management 25:48-54.
Moors, P. J. 1974. The annual energy budget of a weasel (Mustela nivalis L.) population
in farmland. Dissertation, University of Aberdeen, Aberdeen, Scotland.
Nagy K. A., I. A. Girard, and T. K. Brown. 1999. Energetics of free-ranging mammals,
reptiles, and birds. Annual Review of Nutrition 19:247-277.
National Research Council. 1982. Nutrient requirements of mink and foxes: Nutrient
requirements of domestic animals number 7. Second Revised Edition. National
Academy Press, Washington, D.C., USA. Robbins, C. T. 1993. Wildlife feeding
and nutrition. Second edition. Academic Press, San Diego, California, USA.
Nol, E., A. J. Baker, and M. D. Cadman. 1984. Clutch initiation dates, clutch size, and
egg size of the American oystercatcher in Virginia. The Auk 101:855-867.
Powell, R. A. 1979. Ecological energetics and foraging strategies of the fisher (Martes
pennanti). Journal of Animal Ecology 48:195-212.
Powell, R. A., and R. D. Leonard. 1983. Sexual dimorphism and energy expenditure for
reproduction in female fisher Martes pennanti. Oikos 40:166-174.
Previtali, M. H., M. H. Cassini, and D. W. MacDonald. 1998. Habitat use and diet of the
American mink (Mustela vison) in Argentinian Patagonia. Journal of Zoology,
London 246:482-486.
Roby, D. D., D. E. Lyons, D. P. Craig, K. Collis, and G. H. Visser. 2003. Quantifying the
effect of predators on endangered species using a bioenergetics model approach:
Caspian terns and juvenile salmonids in the Columbia River estuary. Canadian
Journal of Zoology 81:250-265.
Robbins, C. T. 1993. Wildlife feeding and nutrition. Second edition. Academic Press, San
Diego, California, USA.

36
Salo, P., M. Toivola, M. Nordstrom, and E. Korpimaki. 2010. Effects of home-range
characteristics on the diet composition of female American mink in the Baltic Sea
archipelago. Annales Zoologici Fennici 47:111-122.
Sanders, F. J., T. M. Murphy, M. D. Spinks, and J. W. Coker. 2008. Breeding season abundance and distribution of American Oystercatchers in South Carolina. Waterbirds 31:268-273.
Sidorovich, V. E., D. W. MacDonald, M. M. Pikulik, and H. Kruuk. 2001. Individual
feeding specialization in the European mink, Mustela lutreola and American mink,
M. vison in north-eastern Belarus. Folia Zoologica 50:27-42.
Sotherland, P. R., and H. Rahn. 1987. On the composition of bird eggs. The Condor
89:48-65.
Shüttler, E., C. J. Carcamo, and R. Rozzi. 2008. Diet of the American mink Mustela
vison and its potential impact on the native fauna of Navarino Island, Cape Horn
Biosphere Reserve, Chile. Revista Chilena de Historia Natural 81:585-598.
Shüttler, E., R. Klenke, S. McGehee, R. Rozzi, and K. Jax. 2009. Vulnerability of
ground-nesting waterbirds to predation by invasive American mink in the Cape
Horn Biosphere Reserve, Chile. Biological Conservation 142:1450-1460.
Speakman, J. R. 1997. Doubly labelled water: Theory and practice. First edition.
Chapman and Hall, New York, New York, USA.
Staller, E. L., W. E. Palmer, J. P. Carroll, R. P. Thornton, and D. C. Sisson. 2005.
Identifying predators at northern bobwhite nests. Journal of Wildlife Management
69:124-132.
Stevens, P. W. 2002. Test of salt marsh as a site of production and export of fish biomass
with implications for impoundment management and restoration. Dissertation,
University of Florida, Gainesville, Florida, USA.
Tauson, A.-H., and J. Elnif. 1994. The pregnant mink (Mustela vison) – energy
metabolism nutrient oxidation and metabolic hormones. Proceedings of the 13th
Symposium on Energy Metabolism EAAP 76:79-82.
Tauson, A. H., R. Fink, K. B. Hansen, N. E. Hansen, and A. Chwalibog. 2004. Utilization
of milk energy by suckling mink kits. Archives of Animal Nutrition 58:181-194.

37
Tauson, A.-H., H. J. Sørensen, S. Wamberg, and A. Chwalibog. 1998. Energy
metabolism, nutrient oxidation and water turnover in the lactating mink (Mustela
vison). Journal of Nutrition 128:2615S-2617S.
Teal, J.M. 1958. Distribution of fiddler crabs in Georgia salt marshes. Ecology.
39:185-193.
Thibault, J. M. 2008. Breeding and foraging ecology of American oystercatchers in Cape
Romain Region, South Carolina. Thesis, Clemson University, Clemson, South
Carolina, USA.
U.S. Environmental Protection Agency (USEPA). 1993. Wildlife exposure factors
handbook I. U.S. Environmental Protection Agency, Washington, D.C.,
EPA/600/R-93/187.
U.S. Fish and Wildlife Service [USFWS]. 1988. U.S. Department of the Interior.
Synopsis of the biological data on the loggerhead sea turtle Caretta caretta
(Linnaeus 1978). <http://www.dtic.mil/cgibin/GetTRDoc?Location=U2&doc
=GetTRDoc.pdf&AD=ADA322813>. Accessed 5 March 2012.
Waller, M. 2010. Evaluation of spotlight surveys for monitoring mink populations in
coastal South Carolina. Thesis, Clemson University, Clemson, South Carolina,
USA.
Wamberg, S., and A.-H. Tauson. 1998. Daily milk intake and body water turnover in
suckling mink (Mustela vison) kits. Comparative Biochemistry and Physiology
Part A 119:931-939.
Warner, A. C. I. 1981. Rate of passage of digesta through the gut of mammals and birds.
Nutrition Abstract and Reviews Series B 51:789-820.
Williams, J. B., W.R. Siegfried, S.J. Milton, N.J. Adams, W.R.J. Dean, M.A. du Plessis,
and S. Jackson. 1993. Field metabolism, water requirements, and foraging
behavior of wild ostriches in the Namib. Ecology 74:390–404.
Wilson, K. A. 1954. The role of mink and otter as muskrat predators in Northeastern
North Carolina. The Journal of Wildlife Management 18:199-207.

38
Table 2.1: Bioenergetics model input parameters - Estimated prey mass range, g wet weight, and prey energy density, kJ/g wet
weight, found in the literature.
Prey Category Mass Range,
g wet weight Source
Energy Density,
kJ/g wet weight Source
Crustacean 5 to 85 Based on observations in the field 3 Ferreras and
MacDonald 1999
Fish 30 to 125 Based on observations in the field,
Brugger 1993, Keenan et al. 2011 5.02 ± 1.00 U.S. EPA 1993
Avian (Egg) 8 to 50
Egg weight range of species of concern
within CRNWR (i.e., Least terna, Black
skimmerb, American oystercatcher
c)
8 ± 0.3 Carey et al. 1980
Notes: aMassey 1974,
bSotherland and Rahn 1987,
c Nol et al. 1984
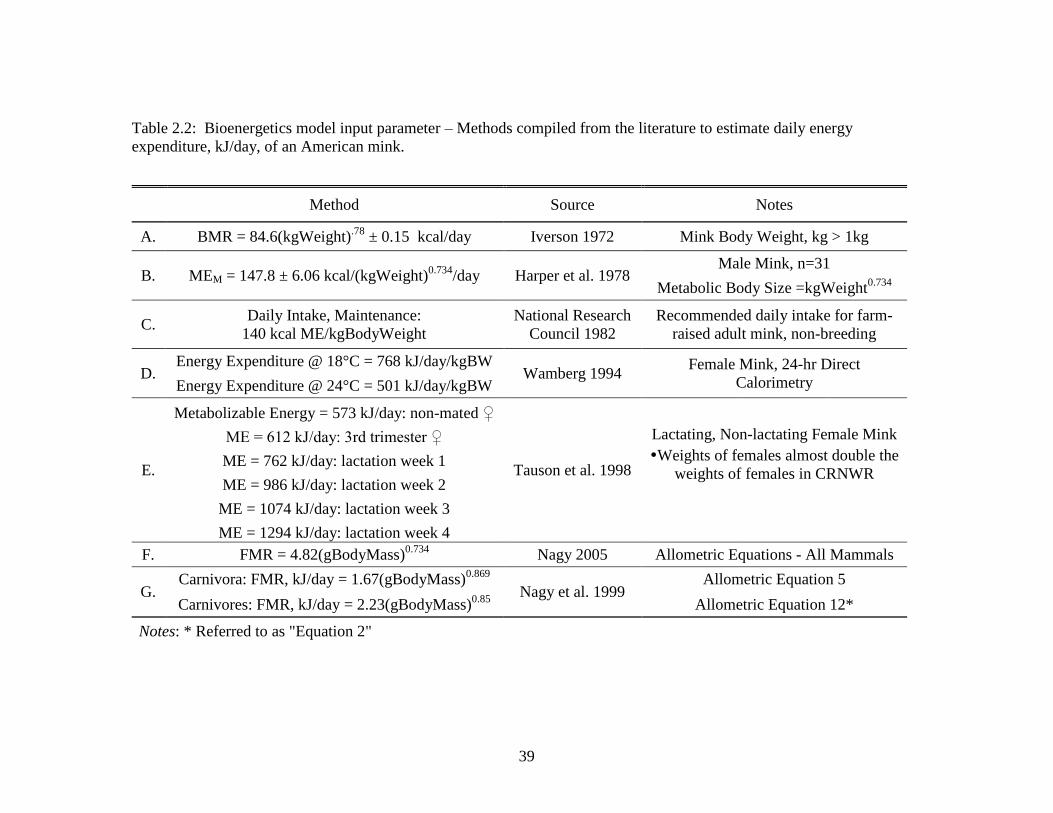
39
Table 2.2: Bioenergetics model input parameter – Methods compiled from the literature to estimate daily energy
expenditure, kJ/day, of an American mink.
Method Source Notes
A. BMR = 84.6(kgWeight).78
± 0.15 kcal/day Iverson 1972 Mink Body Weight, kg > 1kg
B. MEM = 147.8 ± 6.06 kcal/(kgWeight)0.734
/day Harper et al. 1978 Male Mink, n=31
Metabolic Body Size =kgWeight0.734
C. Daily Intake, Maintenance:
140 kcal ME/kgBodyWeight
National Research
Council 1982
Recommended daily intake for farm-
raised adult mink, non-breeding
D. Energy Expenditure @ 18°C = 768 kJ/day/kgBW
Wamberg 1994 Female Mink, 24-hr Direct
Calorimetry Energy Expenditure @ 24°C = 501 kJ/day/kgBW
E.
Metabolizable Energy = 573 kJ/day: non-mated ♀
Tauson et al. 1998
ME = 612 kJ/day: 3rd trimester ♀ Lactating, Non-lactating Female Mink
ME = 762 kJ/day: lactation week 1 Weights of females almost double the
weights of females in CRNWR ME = 986 kJ/day: lactation week 2
ME = 1074 kJ/day: lactation week 3
ME = 1294 kJ/day: lactation week 4
F. FMR = 4.82(gBodyMass)0.734
Nagy 2005 Allometric Equations - All Mammals
G. Carnivora: FMR, kJ/day = 1.67(gBodyMass)
0.869
Nagy et al. 1999 Allometric Equation 5
Carnivores: FMR, kJ/day = 2.23(gBodyMass)0.85
Allometric Equation 12*
Notes: * Referred to as "Equation 2"

40
Table 2.3: Trapping data (capture date, sex, age class, weight, and general location)
collected by USFWS personnel as well as stomach and gastrointestinal (GI) tract contents
of mink captured in CRNWR in 2010 (March through August).
Mink
ID
Trap
Date Sex Age Weight (g)
Stomach & GI Tract
Contents Trap Site
D1 13-Mar M Adult 1162.3 Fish, Crustacean
Cape
Island
D2 15-Mar M Adult 1247.4 Crustacean
D3 16-Mar M Adult 992.2
D4 16-Mar M Adult 1275.7 Crustacean
D5 17-Mar M Juvenile 652.0 Fish, (Sand)
D6 18-Mar F Adult 652.0 (Sand, Vegetation)
D7 18-Mar M Adult 1219.0
D8 18-Mar M Adult 822.1 (Vegetation)
D9 18-Mar F Adult 538.6 Crustacean, Feathers
D10 19-Mar M Adult 1304.1
D11 20-Mar F Adult 680.4 Fish (Sand)
D12 20-Mar M Adult 907.2 Fish
D13 21-Mar F Adult 595.3 (Sand, Vegetation)
D14 22-Mar M Juvenile 680.4 Fish
D15 26-Mar M Adult [Unknown] Crustacean Bulls Bay
D16 10-Jul F Lactating 453.6 Avian (Vegetation) Cape
Island
D17 11-Jul F Juvenile 425.2 Crustacean
Northern
Marsh
D18 11-Jul M Juvenile 538.6 Fish, Crustacean
D19 11-Jul F Juvenile 425.2 Crustacean
D20 14-Jul F Adult 652.0 Fish
D21 27-Jul F Juvenile 283.5 (Vegetation)
Cape
Island
D22 26-Aug F Adult 510.3
D23 26-Aug M Juvenile 623.7 Fish
D24 26-Aug M Adult 964.9 Fish, Crustacean
Notes: “” - Stomach and GI tract was empty; Contents enclosed in “()” were not included in
the analysis

41
Table 2.4: Trapping data (capture date, sex, age class, weight, and general location)
collected by USFWS personnel as well as stomach and gastrointestinal (GI) tract contents
of mink captured in CRNWR in 2011 (March through April).
Mink
ID
Trap
Date Sex Age Weight (g)
Stomach & GI Tract
Contents Trap Site
D25 24-Mar M Juvenile 517.1 Crustacean
Cape
Island
D26 25-Mar M Adult 1088.6
D27 25-Mar M Adult 907.2 Crustacean
D28 25-Mar F Adult 635.0 (Sand, Vegetation)
D29 27-Mar M Juvenile 521.6 (Sand)
D30 28-Mar M Adult 907.2
D31 29-Mar M Juvenile 517.1 Crustacean
D32 7-Apr M Adult 1088.6
Bulls Bay
D33 7-Apr F Adult 503.5 Fish
D34 8-Apr M Adult 975.2
D35 8-Apr M Adult 1088.6
D36 8-Apr M Adult 1270.1
D37 10-Apr M Juvenile 503.5 Fish
D38 10-Apr M Juvenile 517.1 Crustacean
D39 12-Apr F Adult 726.0
D40 12-Apr M Adult 966.2 (Sand)
D41 17-Apr M Adult 861.8 Crustacean
Cape
Island
D42 17-Apr M Juvenile 503.5
D43 20-Apr M Adult 997.9 (Sand)
D44 21-Apr M Adult 979.8
Notes: “” - Stomach and GI tract were empty; Contents enclosed in “()” were not included
in the analysis
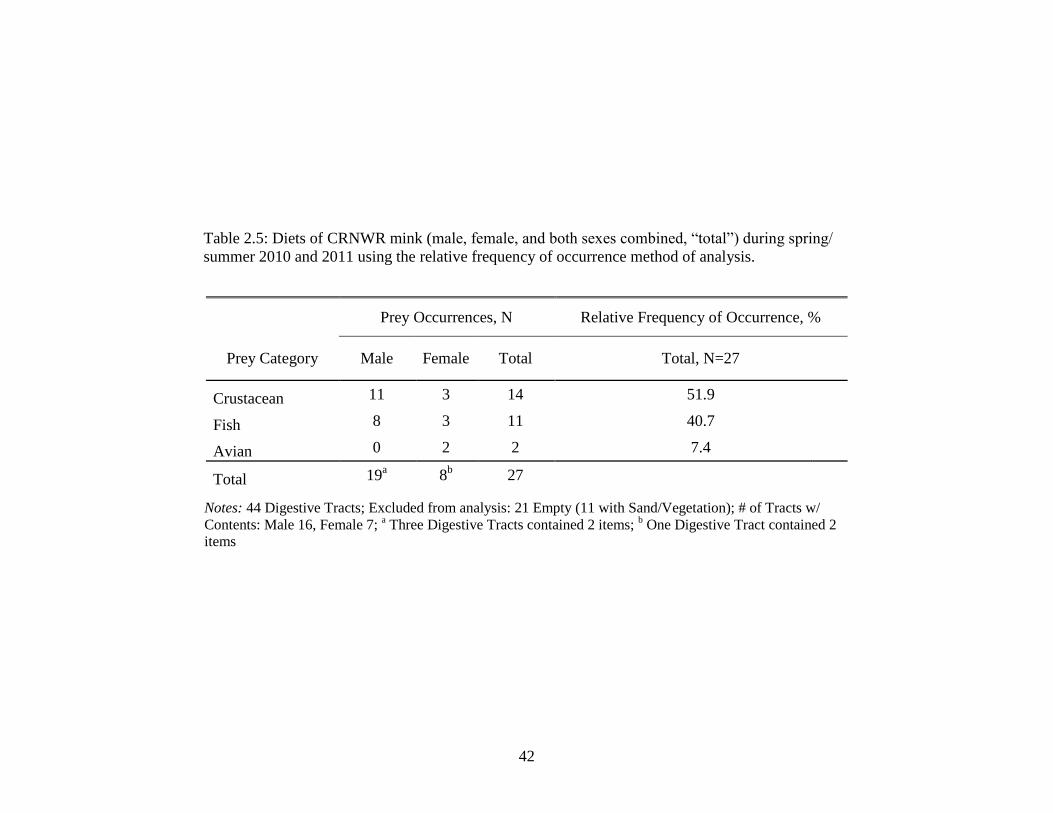
42
Table 2.5: Diets of CRNWR mink (male, female, and both sexes combined, “total”) during spring/
summer 2010 and 2011 using the relative frequency of occurrence method of analysis.
Prey Occurrences, N Relative Frequency of Occurrence, %
Prey Category Male Female Total Total, N=27
Crustacean 11 3 14 51.9
Fish 8 3 11 40.7
Avian 0 2 2 7.4
Total 19a 8
b 27
Notes: 44 Digestive Tracts; Excluded from analysis: 21 Empty (11 with Sand/Vegetation); # of Tracts w/
Contents: Male 16, Female 7; a Three Digestive Tracts contained 2 items;
b One Digestive Tract contained 2
items

43
Table 2.6: Bioenergetics model input parameter – Diet composition of the American mink in terms of relative frequency
of occurrence (RFO) compiled from the literature.
Source Relative Frequency of Occurrence, %
Crustacean Fish Avian Mammal
Mammalian
Consumption
Wilson 1954 10.1 34.4 12.2 25%
aBirks and Dunstone 1985
♂: 18.8 ♂: 20.4 ♂: 7.1 ♂: 53.9
♀: 29.2 ♀: 37.5 ♀: 11.1 ♀: 21.9
Dunstone and Birks 1987 18.7 29.1 11.2 40.9
Hammersh et al. 2004 n/a 13.1 15.4 24.0
High Avian
Consumption
Bartoszewicz and Zalewski 2003 n/a 22b
65-74b
27-38b
Salo et al. 2010 n/a 32.8 28.4 15.2
Coastal-Dwelling
Mink
Delibes et al. 2004 51.6 46.3 1.2 n/a
Hatler 1976 80.0 40-60 < 20 n/a
Notes: a Gender differences in mink diet,
b Estimates given as % biomass

44
Table 2.7: Bioenergetics model input parameters – Weight range, g, of mink trapped in CRNWR, South
Carolina and the estimated daily, kJ/g/day, and monthly, kJ/g/month, energy expenditure of the mink using
Equation 2 (Nagy et al.1999).
Weight Range, g Average Daily Energy
Expenditure (kJ/g/day)
Average Monthly Energy
Expenditure (kJ/g/month)
Male 822.1 to 1304.1 833.47 25004
Female 503.5 to 726.0 523.24 15697
Lactating Female 503.5 to 726.0 1303.24 39097

45
Table 2.8: Bioenergetics model simulation output – Estimated mean monthly consumption
(± standard deviation) of each prey category by male, female, and lactating female mink
during the spring/summer in CRNWR, South Carolina.
Mean Monthly Consumption ± Standard Deviation
Prey Category Male Female Lactating Female
Crustacean 148.7±89.1 93.3±55.7 232.51±137.9
Fish 35.8±11.0 22.5±6.8 56.0±16.6
Avian 8.0±4.8 5.0±3.0 12.4±7.4

46
Table 2.9: Bioenergetics model simulation output – Median, range, 3rd
Quartile (75th
percentile), and
95th
Percentile obtained from 300,000 iterations of each bioenergetics model (male, female, and
lactating female mink).
Bioenergetics Model Output,
# prey consumed/month/category
Prey Category Median Range 3rd
Quartile 95th
Percentile
Crustacean
Male 122.7 52.12-1229.9 166.5 315.4
Female 77.1 34.2-758.5 104.4 197.7
Lactating Female 192.0 93.0-1809.2 259.5 490.7
Fish
Male 33.3 16.6-102.8 40.9 58.0
Female 20.9 10.8-63.0 25.6 36.3
Lactating Female 52.1 29.3-148.0 63.6 90.0
Avian
Male 6.6 2.7-64.6 8.9 16.9
Female 4.1 1.79-39.9 5.6 10.6
Lactating Female 10.3 4.9-95.1 13.9 26.2

47
Figure 2.1: Locations of predator management activities within the northern marsh (inset represents 3
juvenile mink culled in the same location) and on Cape Island in relation to capture sites of 9 radio-
monitored mink in CRNWR, 2010-2011.
Lighthouse Island Raccoon Key
Cape Island

48
Figure 2.2: Relative frequency of occurrence analysis of mink diet (male, female, and
both sexes combined, “total”) in CRNWR, South Carolina during spring and summer
2010 and 2011.
0
10
20
30
40
50
60
70
Male Female Total, N=27
Rel
ati
ve
Fre
qu
ency
of
Occ
urr
ence
, %
Crustacean
Fish
Avian

49
CHAPTER THREE
ACTIVITY PATTERN & HOME RANGE OF THE AMERICAN MINK IN A TIDAL
MARSH SYSTEM, CAPE ROMAIN NATIONAL WILDLIFE REFUGE,
SOUTH CAROLINA
INTRODUCTION
The literature documenting American mink ecology in salt marsh ecosystems is
limited. Most coastal studies focus on the ecology of mink utilizing rivers, lakeshores,
freshwater marshes, or beaches (Marshall 1936, Hatler 1976, Gerell 1969, Ireland 1990,
Niemimaa 1995, Zschille et al. 2010). In 1998, the South Carolina Department of
Natural Resources (SCDNR) and Clemson University successfully reintroduced 62 mink
to Cape Romain National Wildlife Refuge (CRNWR). Peeples (2001) monitored 13 of
the released individuals for a 15-month period (September 1999-November 2000) and his
data indicated that the mink in this system had home range sizes larger than those
reported elsewhere in marsh systems (male, n = 4: 6.91 km2; female, n = 9: 2.28 km
2).
Based on observations in the field, Peeples (2001) hypothesized that tidal fluctuations
likely influenced the daily activity pattern of this population. The goal of this study was
to examine home range size 10 years following reintroduction as well as assess whether
tide influences mink activity in CRNWR.
Burt (1943) defined an animal’s home range as “that area traversed by the
individual in its normal activities of food gathering, mating, and caring for young,”
excluding exploratory trips. Generally, the space within the home range is used
disproportionally, and so smaller areas, or core areas, are selected by the individual and
used more than can be expected by random use (Burt 1943, Powell 2000, Plowman et al.

50
2006). For mink, core areas include suitable denning sites and access to foraging areas
(Gerell 1970). Two home range shapes have been reported for mink in the literature and
are based on the type of aquatic system inhabited: 1) 2-dimensional in marsh habitats
(Arnold and Fritzell 1987, Niemimaa 1995); and 2) linear, or 1-dimensional, in riparian
and reservoir systems (Birks and Linn 1982, Dunstone and Birks 1983, Yamaguchi and
MacDonald 2003, Gerell 1970, Stevens et al. 1997, Melero et al. 2008). Mink home
ranges observed in CRNWR are considered to be 2-dimensional (Peeples 2001).
Mink are influenced by the daylight-dark cycle and are considered a nocturnal
species (Gerell 1969, Garin et al. 2002). Research has found, however, that females are
less active while pregnant and often diurnal during kit-rearing season (Gerell 1969,
Ireland 1990), while males are predominately nocturnal or crepuscular year-round (Gerell
1969, Hatler 1976, Birks and Linn 1982, Ireland 1990, Niemimaa 1995, Zschille et al.
2010). Both sexes reduce activity in the cold months to conserve energy (Marshall 1936,
Birks and Linn 1982, Ireland 1990, Zschille et al. 2010) and increase activity during the
breeding season (i.e., January-March) (Garin et al. 2002, Zschille et al. 2010).
Prey availability and habitat features have been shown to influence both the daily
and seasonal activity pattern of mink and other mustelids (Marshall 1936, Gerell 1969,
Zielinski et al. 1983, Gelatt et al. 2002, Zuberogoitia et al. 2006, Wellman and Haynes
2009). Wellman and Haynes (2009) found mink more active at night in upland stream
systems than in wetland systems potentially because of the higher presence of nocturnal
terrestrial prey in the upland area. In wetland systems with a high presence of aquatic
prey, Wellman and Haynes (2009) observed higher diurnal activity, suggesting that due

51
to the mink’s poor visibility underwater, foraging for aquatic prey is most successful
during the day than at night (Sinclair et al. 1974).
In CRNWR, the mink population primarily inhabits the tidal marsh system and is
therefore subject to a fluctuating environment in terms of both habitat structure (i.e.,
flooding events) and weather conditions. It has been suggested that coastal-dwelling
mink (i.e., utilization of beaches or rocky coastlines) are less active than those
populations inhabiting freshwater systems due to the greater food availability found in
tidal marsh systems (Hatler 1976, Gerell 1969, Whitman 1981, Ireland 1990). This
species’ opportunistic foraging strategy, paired with observations of high prey
availability, low risk of predation, and little competition with other species in the
CRNWR suggests that tidal fluctuations could influence activity more so than other
factors (Hatler 1976, Ireland 1990, Peeples 2001).
MATERIALS AND METHODS
Capture of American Mink
Trapping efforts for this study focused on mink inhabiting the northern tidal salt
marshes adjacent to the barrier islands of CRNWR. South Carolina experiences extreme
high tides between April and December with water levels rising 0.3-0.6 m above the
mean high water level (1.6 m), or the high-water norm. During high tides, mink utilize
tide racks (i.e. accumulations of floating dead smooth cordgrass, Spartina alterniflora)
along creek edges as areas to rest and consume prey until the water recedes (Peeples
2001). Between April and July, lactating females build nests on top of tide racks to

52
conceal kits during high tides. These flooding events provide the opportunity to easily
locate this otherwise elusive species.
Trapping occurred at night during extreme high tides in April and May 2010 and
2011. Individual mink (i.e., males or non-lactating females) were spotlighted from a boat
and captured using dip nets and then transferred to a plastic-coated wire mesh cage (75
cm x 75 cm x 25 cm) containing a PVC hide tube (12 cm x 30 cm) (Peeples 2001).
Females with kits were caught using Tomahawk, double-door live traps (14 cm x
14 cm x 48 cm, Tomahawk Trap Company, Tomahawk, WI) rather than dip nets. Due to
a female mink’s strong affinity toward her kits, she would only depart from the nest
briefly upon the boat’s arrival. This departure allowed for the altricial kits to be collected
and relocated to a closed live trap. An open live trap was then zip-tied to the closed trap
containing the kits, and both were placed on a piece of foam insulation and returned to
the tide rack. The trap was checked every 15 minutes until the female, in her attempts to
remove the kits from the adjacent trap, was captured (Peeples 2001). The family group
was then transferred to the above-mentioned holding cage.
Mink were transported from the marsh to a holding area prior to being taken to an
approved veterinary clinic (Daniel Island Animal Hospital, 291 Seven Farms Dr. Suite
103, Daniel Island, SC 29492) where a radio-transmitter was surgically implanted into
the abdominal cavity of each adult mink (Hernandez-Divers et al. 2001, Peeples 2001,
Zschille et al. 2008, Zschille et al. 2010). As shown by Zschille et al. (2008), internal
radio-transmitters are more suitable for mink and other species with similar neck and
head circumferences than radio collars. Following surgery, mink were transported back

53
to the capture-site and released < 12 hours following capture (Animal Use Protocol 2010-
002, Clemson University).
Surgery
A qualified veterinarian, Dr. Lynne Flood, D.V.M, performed a general health
examination prior to implanting (Zschille et al. 2008) each mink with an intra-peritoneal,
mortality sensing radio-transmitter weighing 22g (ATS Model 1230, Advanced
Telemetry Systems, Isanti, Minnesota). To ensure that the mobility of the animal was not
significantly impacted, transmitters weighed no more than 5% of the expected mink body
mass (Cochran 1980, Yamaguchi et al. 2002). Only male and female mink weighing
more than 500g received a transmitter in this study (Cochran 1980, Zschille et al. 2008,
Animal Use Protocol 2010-002 Clemson University). Mink were anesthetized with
isoflurane gas while in the PVC hide tube and then transferred to an anesthesia mask
(Yamaguchi et al. 2002). Mink were sexed and weighed while anesthetized. Kits were
separated from the female prior to the delivery of the anesthetic, weighed, and then
transferred to a heating pad until the female recovered.
The abdominal region was shaved and cleansed for surgery using standard aseptic
techniques, and the transmitter was immersed in absolute isopropanol and rinsed with
sterile water. Using sterile surgical techniques, a 2 to 2.25cm incision was made along
the avascular midline through the skin, muscle, and peritoneum, allowing for the
transmitter to be placed freely within the abdominal cavity (Zschille et al. 2008). Using a
simple uninterrupted suture technique, the peritoneum and muscles were closed together
in one layer (Zschille et al. 2008, Animal Use Protocol 2010-002 Clemson University).

54
Above this, a simple interrupted suture pattern was used subcutaneously to close the skin
(Zschille et al. 2008). The incision was then sealed with surgical glue. To reduce risk of
infection, a long-acting antibiotic (cefovecin sodium, Convenia®, at 8 mg/Kg body
weight - a cephalosporin with 7 – 14 days duration) was administered. The surgery took
no longer than 30 minutes. Following recovery, mink were transported back to the
capture site (Animal Use Protocol 2010-002, Clemson University).
Telemetry
Tracking of radio-implanted mink began ≤ 36 hours following release, but
collection of activity and home range data began between 48-72 hours following release
to allow individuals time recover from surgery and handling. Each mink was monitored
daily until the individual died, the transmitter ceased to function, the signal was lost, or
the study period ended (Peeples, 2001). Activity was defined as a change in signal
strength for at least 15 seconds, or the signal alternating between audible and inaudible
for the same duration of time (Gerell 1969, Zielinski et al. 1983, Niemimaa 1995,
Zschille et al. 2010). To be classified as “inactive,” the signal strength remained constant
and audible for at least 60 seconds (Zschille et al. 2010).
Mink activity was monitored and locations were triangulated from a boat using a
portable TR-5 model receiver connected to a H-antenna (Telonics Inc., Mesa, Arizona).
The environment (primarily thick smooth cordgrass, wind, and rising and falling water
levels) and the internal placement of the transmitter limited detection to approximately
50-100m. Between the limited range of the transmitter signal and the constraints of the
environment (shallow and narrow creeks, flooded marsh, strong winds, etc.), collecting

55
three or more bearings ≥ 60 degrees apart for home range analysis was not always
feasible (UTM positions, using a Lowrance® HDS-5 GPS Unit, Tulsa, Oklahoma, USA).
As a result, two bearings were recorded with the angle of intersection between 60 and
120 degrees.
From June through August 2010, locations for home range analysis were recorded
(activity was not recorded in 2010). Mink were monitored randomly during the night and
daylight hours at randomly chosen tide heights. Locations were separated by at least 9
hours to reduce the impact of temporal correlation. In order to determine whether tide
cycle impacted horizontal movement across the landscape, tracking periods occurred
during rising, falling, and high tides. It was proposed that a mink would utilize different
areas within its home range during different tide levels, so at high tide a mink would
move to an elevated site until the water subsided (taken from observations by Peeples
2001). This initial hypothesis was not formally tested, however, following observations
throughout the 2010 field season when lactating females were observed moving vertically
by using the same tide rack as cover during low tide and as a floating raft during high
tide.
From March through August 2011, both activity and locations were recorded.
Due to limited manpower and variable weather conditions, continuous monitoring (as
seen in Gerell 1969, Birks and Linn 1982, Niemimaa 1995, Yamaguchi and MacDonald,
2003) was not feasible, so a 24-hour cycle, consisting of 24 time blocks, was divided into
five possible tracking shifts: DayA (08:00-13:00), DayB (13:00-18:00), Twilight2 (18:00-

56
23:00), Night (23:00-03:00), Twilight1 (03:00-08:00) (Zschille et al. 2010). No more
than two tracking shifts would occur in the same 24-hour cycle.
During a 4-5 hour tracking shift, the location of each mink was triangulated once,
while activity data was recorded hourly for each mink with (1) indicating “active” and (0)
indicating “inactive” (Drew and Bissonette 1997). Occasionally, a mink could not be
relocated during the following time block or located during an entire shift, hence “not
found” was recorded when a signal was not detected within a time block. Locations were
separated by at least 9 hours and activity was separated by at least one hour to minimize
auto-correlation (Rooney et al. 1998, Zschille et al. 2010). Activity between the hour of
sunrise (typically 06:00) and sunset (typically 20:00) was considered to occur during
daylight hours. Tide height and weather conditions (i.e., temperature, cloud cover, wind)
were recorded with each activity reading. In the field, tide heights were estimated using
the Southeastern Edition of the 2010 TIDELOG (Pacific Publishers, Box 480, Bolinas,
CA 94924). The estimates were later replaced with verified tide heights (mean low water
datum) from station 8665530 in Charleston, SC found on the National Oceanic and
Atmospheric Administration (NOAA) database. Verified tides were then adjusted for the
study site using the tide corrections provided in the 2010 TIDELOG.
Prior to radio-tracking, triangulation error was evaluated by locating a transmitter
placed on the edge of the marsh (Location A) and then 10 meters off the marsh edge
(Location B). The exact position of the transmitter was recorded using a handheld GPS
device (Lowrance® GlobalMap 100, Tulsa, Oklahoma, USA). Three triangulated
locations per transmitter site were recorded and compared to the exact location, and the

57
mean distance (arithmetic mean) between relocation estimates and the actual transmitter
location was the mean location error (Kauhala and Tiilikainen 2002). Mean linear error
was 20.3 m for marsh edge relocations, 12 m for interior marsh relocations, and 16.2 m
overall.
Data Analysis
Locations of transmittered mink were determined using the maximum likelihood
estimator with default settings in Location of a Signal v.4.0.3.7 (LOASTM
, Ecological
Software Solutions LLCTM
, Hegymagas, Hungary) and then projected into ArcGIS 10
(ESRI 2011, Environmental Systems Research Institute, Redlands, California, USA).
BiotasTM
v.2.0a (Ecological Software Solutions LLCTM
, Hegymagas, Hungary) was used
to calculate home range (95% of an individual’s locations) and core areas (50%) using
the fixed kernel density estimator and least squares cross validation (LSCVh) to select a
smoothing parameter, h. This method is currently recommended for home-range
estimation (Powell 2000, Horne and Garton 2006). Linear home range was then
estimated in GIS by measuring the linear distance of utilized marsh edge within the 95%
kernel (Melero et al. 2008).
Using the Glimmix procedure (PROC GLIMMIX, P<0.05) provided by
SAS/STAT® software version 9.3 (SAS Institute, Cary, North Carolina), the degree of
influence of various environmental factors on mink activity was analyzed. This
generalized linear mixed model was used due to its ability to account for the individual
random effects of each mink on the response variables, allowing for the activity data of
all mink captured to be pooled. The data were tested to determine whether the tide

58
height, time of day (data combined within each of the 24 time blocks), presence or
absence of light (light phase), temperature, and/or presence or absence of kits
significantly impacted the dichotomized activity variable. All five explanatory variables
were considered fixed effects, while the identity of the mink was a random effect. Due to
the potential for correlation between explanatory variables, the analysis was run without
time block and then again with time block but without light phase and temperature.
A quadratic spline was then applied to smooth the data using 11 equally spaced,
randomly chosen, time block knots: 0, 3, 5, 7, 9, 11, 13, 15, 17, 19, and 21 (Pedan 2003,
Jo et al. 2007). These time block knots were input as a random effect with SAS
determining each knot’s degree of influence (i.e., automatic knot selection). Using
observed combinations of tide height, light phase, and temperature, the predicted values
of activity were averaged within each time block to produce the “expected activity” for
that hour (i.e., the likely or average predicted level of activity for females in CRNWR
during that time period).
RESULTS
Captured Mink
Nine mink and twenty-eight kits were captured during this study (Table 3.1,
Figure 3.1). Implanted transmitters weighed 2.5 and 3.5% of the average body mass of
males (911.5 g; range=880-943 g, n=2) and females (634 g; range=535-720 g, n =7)
captured in this study. Mink F1, F2, and F3 (all lactating females) were captured in late
May 2010 and radio-located between June and August of that year. In 2011, F1 was not

59
relocated, while F2 and F3 were monitored briefly in March and April before both
transmitters ceased to function. Mink F6, F7, and F9 all had kits and were captured in
May 2011. Mink F8 was pregnant when captured in May 2011, and parturition occurred
2 weeks following surgery. All four females were monitored from May through August
of that year. Unlike the other family groups, F7 was not relocated for over a week after
surgery and was located infrequently throughout the summer compared to other females.
Mink M4 and M5 were juvenile males captured in April 2011. Mink M4 was
captured in open water, fleeing from a larger male mink in what was assumed to be a
territorial dispute. Both juvenile males were monitored only briefly before mortality
signals were detected. The carcass of M5 was recovered approximately 5 km inland from
the capture site and taken to Daniel Island Animal Hospital to determine cause of death.
Multiple, small puncture wounds found on M5’s hindquarter appeared to have resulted in
a severe infection, which likely led to reduced ambulation and eventually death due to
starvation.
Home Range
Between May and August 2010 and 2011, 324 relocations of 7 radio-implanted
female mink were obtained (Table 3.2). Total home ranges were estimated for 3 lactating
females in 2010, 3 lactating females in 2011, and one female (F7) without kits in 2011.
Captured males did not survive long enough to gather sufficient data for home range size
and activity pattern analyses. Females F2 and F3 were briefly relocated between March
and April 2011, so home ranges were estimated using 2010 data as well as locations from

60
both years. While additional locations on F3 refined her core area (0.235 ha to 0.171 ha),
the core area for F2 remained the same (Table 3.2).
Estimates of 95% kernel home range size for all females ranged from 0.3 to 17.1
ha. When F7 was excluded, however (i.e., a female without kits for all locations), the
maximum home range size decreased to 4.23 ha (Table 3.2). Core areas ranged from
0.03 to 2.26 ha for all females, but when F7 was excluded, the maximum core area
declined to < 1.00 ha (Table 3.2). Maps of fixed kernel home ranges for all individuals
appear in Appendix C. Approximate linear distance ranged from 0.44 km to 1.81 km
(Table 3.2, mean = 1.00 km).
Family groups were often located in close proximity to drainage creeks (< 5 m
wide) along the larger, navigable creeks (Figure 3.2 specifically, also Appendix C). Un-
tagged mink were observed crossing these larger creeks (approximately 60-80 m wide),
but in terms of the tagged mink, only F7 was located on either side of a larger creek
(Appendix C-5). Mink F6 and F9 were captured 0.43 km apart and utilized adjoining
areas throughout the summer (Figure 3.3). At no point was either F6 or F9 located within
the other individual’s home range (i.e., there was 0% overlap in home ranges).
Activity Pattern
In total, 941 activity measurements were made on 6 female mink between March
and August 2011. Of the 941 measurements, 38% (n = 359) were “active” readings and
58% were gathered during daylight hours (time block 06:00-09:00) (Table 3.3). On 47
occasions, a female (typically F7) was not located within a time block. During daylight
hours (time block 06:00-19:00), mink were found active 34% of the time, while 44% of

61
the recordings taken at night (time block 20:00-05:00) were active (Table 3.4). Lactating
females were found to spend approximately 36% of the cycle active, while non-lactating
females spent 43% active (Table 3.5).
The first test of fixed effects in Glimmix used the explanatory variables (tide
height, time of day, light phase, temperature, and/or presence or absence of kits) as fixed
effects, while making the identity of the animal (due to grouping of all activity data) a
random effect. Tide height (p=0.0002, Figure 3.4) and time of day (p=0.02) significantly
impacted activity. A negative relationship was observed between tide height and activity.
Light phase (p=0.2436), temperature (p=0.4843), and kit presence/absence (p=0.1898)
did not significantly influence activity level.
In order to further explain how time of day impacted mink activity, time block
was set as a random effect and a quadratic smoothing spline was applied to the data.
Activity of all individuals was shown to be at a minimum at midday (between 11:00 and
13:00), at a maximum near midnight, and then gradually decreasing through the early
morning hours (Figure 3.5). Using observed combinations of tide height, light phase, and
temperature, the predicted values of activity of all individuals were averaged within each
time block (Figure 3.6), showing activity sharply declining three hours following sunrise
and reaching its minimum at midday. Female mink activity then sharply increased three
hours prior to sunset, reaching its maximum at 23:00.
The potential correlation between time block, light phase, and temperature was
considered further due to the pattern observed in Figure 3.5. When time block was
excluded from the analysis, ambient temperature was then significantly and negatively

62
related to activity (p=0.03), while light phase was marginally significant (p=0.06). The
inclusion of time block with the removal of temperature and light from the analysis
resulted in a highly significant relationship between time block and activity (p=0.0004).
Both analyses suggest that temperature, light, and time of day jointly impact activity.
DISCUSSION
Captured Mink
All nine captured mink underwent successful surgeries and, based on direct
observations and radio-tracking, eight of the nine mink did not appear to be negatively
impacted by the surgery or implanted transmitter. The behavior of F7 following surgery
was unusual, compared to that of the other 5 lactating females. Typically the female
would regain awareness and immediately return to protecting her kits in the PVC hide
tube (also observed by Zschille et al. 2008). Mink F7, however, took a considerably
longer period of time (approximately 45 minutes) to re-accept the kits. Although age was
not recorded in this study, a dental health check suggested that F7 was younger than the
other females and potentially in her first kit-rearing season. It is possible the stress of the
situation, coupled with her age and inexperience, interfered with her maternal instinct.
Juvenile males did not survive the length of the study period. Based on carcass
condition, M5 appeared to have died during a territorial dispute with an adult male.
Multiple puncture wounds on the hindquarter of M5 appeared to match mink dentition
patterns. Mink M4 was captured during a territorial dispute, and following release at the
capture site, was observed successfully foraging at low tide in the same general area (0.4

63
km from capture site). The mortality signal was detected 4 days following the foraging
observation in an area approximately 0.3 km from the capture site and 0.5 km from the
foraging area. The carcass could not be retrieved to determine cause of death. It is
possible the territorial dispute resumed and M4, like M5, suffered significant enough
injuries to cause death.
The carcass of M5 was located wedged underneath what appeared to be a scent
mound, or a mound of dirt used to elevate an animal’s scent in order to increase scent
dispersal for territorial purposes. The use of scent mound communication is heavily
documented for both the Eurasian and North American beaver (Castor fiber, Castor
canadensis) but not for mink. Mink mark an area by depositing feces in prominent,
elevated places (Gerell 1968 as cited in Brinck 1978), and a small amount of scat was
found on the mound. Elevated areas are not common within the tidal marsh system, and
therefore the CRNWR population may use scent mound structures to aid in marking
territory. Further research, however, regarding mink territorial behavior in CRNWR is
necessary to support this observation.
Home Range
Birks and Linn (1982) estimated that 80% of a mink’s total home range could be
determined if locations were taken at least twice a day for 5 or more days, while the
entire home range required at least two locations per day for a minimum of 10 days.
Zabala et al. (2007) found that 15 fixes taken on different days could reveal at least 30%
of the home range. Due to the limited movement typical of pregnant and lactating
females (Ireland 1990), however, the majority of an individual’s home range was likely

64
not ascertained in this study (i.e., wintering home ranges may have been larger than those
recorded during the breeding season).
Peeples (2001) monitored mink in CRNWR and reported an average female home
range of 228 ha, and linear range between 1.40 km and 3.63 km. Both home range (95%
kernel) and linear range approximations from my study appeared to be smaller than that
reported by Peeples (2001). It is likely that this difference was primarily because Peeples
(2001) reported home range size using the minimum convex polygon method (MCP).
Due to the tendency of mink to utilize areas along shorelines (Larivière 2003), the MCP
most likely overestimated home range of mink in CRNWR. Female mink on islands off
the coast of Finland (mean: 10 ha Niemimaa 1995; mean: 9.41 ha, Salo et al. 2010) had
larger ranges than this study’s lactating females. Also, my study collected data during a
shorter time period, which occurred while females were lactating (i.e., May-August), than
Peeples (2001) whose larger home ranges were reported from year-round data from both
sexes.
Linear home ranges along rivers and streams are most commonly reported for
American mink, since the majority of foraging activity typically occurs within 2 meters
of the shoreline (Larivière 2003). Home ranges in this study were reported two-
dimensionally due to mink utilizing areas within the marsh as well as along the main
creeks; however, linear estimates were also calculated because locations within the marsh
were typically found along small drainage creeks. Linear ranges of female mink in
England (0.9-4.3 km, Yamaguchi and MacDonald 2003), Sweden (2.8 km, Gerell 1970),
and Spain (0.42-0.77 km, Melero et al. 2008) were similar to this my estimations (range:

65
0.44-1.81 km). Further monitoring may show linear representations of mink home range
in CRNWR to be more accurate than two-dimensional estimates.
Although sample sizes were limited (1 pair of females), intrasexual overlap in
home ranges was not observed. Peeples (2001) also did not observe any intrasexual
overlap in home ranges for females or males. Gerell (1970) and Peeples (2001) both
found that males often overlapped or subsumed at least one female home range, while
evidence of juvenile males within adult male territories was not found. Yamaguchi and
MacDonald (2003), however, found both intrasexual and intersexual home range overlap.
Consequently, it is possible that mink exhibit territorial behavior within a spatio-temporal
framework (Gerell 1970, Ireland 1990). Mink in Sweden, for instance, restricted activity
to a portion of the home range for several days before moving to a new area for a similar
length of time (Gerell 1970). Therefore, intermittent sampling or short study duration
could be causing difficulty in documenting range overlap between mink.
Lactating females were often located in the same area throughout the study,
especially during the beginning of the summer when the kits were most vulnerable.
Ireland (1990) reported that as the kits grew, a female’s home range increased. During
my study, it appeared from the frequent day-to-day location changes and the increased
home range size that Female 7 was no longer rearing kits for the entire study period.
Compared to the other family groups, Female 7 regularly shifted to new areas between
days and during telemetry shifts (unlike the other family groups). Her home range was
approximately 10 ha larger than the largest home range reported for lactating females.
Unpredictable movements and the abnormal behavior observed during the recovery

66
period following surgery suggested that F7 abandoned her kits during the week she was
not detected.
A previous study in CRNWR reported that mink were most often found along
creeks less than 200 meters wide (Waller 2010). It is likely the narrower creeks provided
protection from wind and wave exposure typical of a coastal environment (Hatler 1976,
Gerell 1969, Ben-David et al. 1995). Family groups, in particular, appeared to have an
affinity for areas adjacent to smaller drainage creeks (< 5 m wide) along the larger,
navigable creeks (approximately 60-100 m wide). These areas are characterized by
numerous tide racks, a habitat feature often used for nesting and loafing, and substantial
areas of shallow water, a habitat feature often used for foraging. Dunstone (1983)
reported that shallow water and low flow rates contributed to a mink’s foraging success,
especially since this species exhibits poor visibility underwater (Sinclair et al. 1974).
Activity Pattern
In CRNWR, activity level of female mink within a 24-hour cycle (non-lactating:
43.3%, lactating: 36.3%, all females: 38.4%) was slightly higher than those found in
other studies. Males and lactating females in British Columbia were active on average,
for 32.2% of a 24-hour period (Hatler 1976), and a lactating female in Sweden
significantly increased her activity from 13.5% during pregnancy to 30.5% during kit-
rearing (Gerell 1969). When active fixes within the den were excluded, female mink in
Scotland were active for 12.1% of a 24-hour period, but when den activity was included,
the estimate increased to approximately 33.3% (Ireland 1990). Mink activity in CRNWR

67
could be higher than the reports in the literature because, unlike beach-dwelling mink, the
CRNWR population inhabits an area that is flood twice a day.
Although no significant difference was found in activity level between lactating
(F6, F8, and F9) and non-lactating females (F2, F3, and F7), the percentage of activity
within a 24-hour cycle was higher for non-lactating females. Two of these individuals
(F2 and F3) were captured in 2010 and relocated and monitored in 2011 from the last
week in March through the last week in April. Both females may have been pregnant,
but the transmitters ceased to function before kits could be detected. Gerell (1969)
reported low activity in April and May for a pregnant female just prior to parturition and
a 100g increase in weight during that time. Figure 3.5 shows high levels of activity for
both females from late March (end of the breeding season) through late April. It is
possible that a decrease in activity for pregnant females in CRNWR occurs closer to
parturition in April and May as observed by Gerell (1969).
In terms of time spent foraging, the limited observational data from this study
agrees with the literature, which found coastal-dwelling male and female mink in
Scotland to forage for a 3-hour period per day (Ireland 1990). Mink M4 was observed
foraging successfully on a mudflat for a similar 3-hour period (08:00-11:00, 25-April)
before retreating into the marsh grass, where he remained inactive for the last two hours
of the morning telemetry shift. It is reasonable that daily energy requirements can be met
during this 3-hour period due to the high foraging success rate reported for mink in
highly productive ecosystems (Hatler 1976).

68
The activity pattern described in this study (i.e., minimum at midday, maximum
near midnight, a gradual decrease in the early morning with a brief peak in activity
between 05:00 and 08:00) is similar to that found for other coastal-dwelling mink (Hatler
1976, Ireland 1990, Niemimaa 1995). Gerell (1969) and García et al. (2009) also
observed a spike in activity between 05:00 and 08:00. Gerell (1969) attributed this spike
in activity to the favorable weather conditions at dawn. It is likely that the females in
CRNWR sharply increased their activity during the cooler morning hours before
temperature and relative humidity surged upward between 08:00 and 17:00. Extreme
heat could force females to display a crepuscular/nocturnal pattern during kit-rearing,
instead of the diurnal pattern typically reported for lactating females in the literature
(Gerell 1969, Hatler, 1976, Zschille 2010).
Although light phase was not found to have a significant influence on activity, it
appears as if monitored females increased activity between dusk and dawn due to the
sharp increase in activity through the evening until midnight, followed by a sudden spike
in activity during early morning hours. Longer summer days (approximately 14 hours of
daylight) could have resulted in the absence of light appearing to be a less influencing
factor on mink activity. Further monitoring in CRNWR, specifically during the winter
and fall months, is necessary to accurately determine how light phase and temperature
influence mink activity pattern.
The combined activity data of 6 monitored female mink indicated that as tide
height increased, female activity level decreased in CRNWR. Ireland (1990) found that
on a rocky coastline in Scotland mink activity was not significantly related to tide cycle,

69
but in terms of shore-based foraging activity, female mink were present during low tide.
Hatler (1976) also suggested that coastal mink foraging activity would increase during
low tide to optimize foraging success. Although this study’s findings cannot link activity
with specific behaviors (i.e., foraging, travel, etc.), it is possible that mink in this study
were foraging at low tides along mudflats and within drainage creeks (Peeples 2001).
Prey availability is often high along mudflats, which often swarm with sand and mud
fiddler crabs (Uca pugilator and Uca pugnax) at low tide, and drainage creeks can
contain prey items stranded by rapidly falling tides. Since the majority of mink observed
in CRNWR appeared to not have access to permanent denning sites or alternate foraging
areas unaffected by tidal fluctuations, mink inhabiting salt marshes are more influenced
by tide than those living along coastal shorelines.

70
LITERATURE CITED
Arnold, T. W., and E. K. Fritzell. 1987. Activity patterns, movements, and home ranges
of prairie mink. Prairie Naturalist 19:25-32.
Ben-David, M., R. T. Bowyer, and J. B. Faro. 1995. Niche separation by mink and river
otters: coexistence in a marine environment. Oikos 75:41-48.
Birks J. D. S., and I. J. Linn. 1982. Studies of home range of feral mink, Mustela vison.
Symposia of the Zoological Society of London 49:231-257.
Brinck, C., R. Gerell, and G. Odham. 1978. Anal pouch secretion in mink Mustela vison.
Chemical communication in Mustelidae. Oikos 30:68-75.
Burt, W. H. 1943. Territoriality and home range concepts as applied to mammals. Journal
of Mammalogy 24:346-352.
Cochran, W. W. 1980. Wildlife telemetry. Pages 507-520 in S.D. Schemnitz, editor.
Wildlife management techniques manual. The Wildlife Society, Washington,
D.C., USA.
Drew, G. S., and J. A. Bissonette. 1997. Winter activity patterns of American martens
(Martes americana): rejection of the hypothesis of thermal-cost minimization.
Canadian Journal of Zoology 75:812-816.
Dunstone, N. 1983. Underwater hunting behavior of the mink (Mustela vison Schreber):
An analysis of constraints on foraging. Annales Zoologici Fennici 174:201-103.
Dunstone, N., and J. Birks. 1983. Activity budget and habitat usage by coastal-living
mink (Mustela vison Shreber). Annales Zoologici Fennici 174:189-191.
García, P., I. Mateos, and V. Arévalo. 2009. Diurnal activity of the American mink
(Neovison vison) in central Spain. Hystrix Italian Journal of Mammalogy 20:61-
68.
Garin, I., J. Aihartza, I. Zuberogoitia, and J. Zabala. 2002. Activity pattern of European
mink (Mustela lutreola) in southwestern Europe. Z. Jagdwiss 48:102-106.
Gelatt, S., D. B. Siniff, and J. A. Estes. 2002. Activity patterns and time budgets of the
declining sea otter population at Amchitka Island, Alaska. The Journal of Wildlife
Management 66:29-39.
Gerell, R. 1968. Food habits of the mink, Mustela vison Schreber, in Sweden. Viltrecy
5:119-211.

71
Gerell, R. 1969. Activity patterns of the mink Mustela vison Schreber in southern
Sweden. Oikos 20:451-460.
Gerell, R. 1970. Home ranges and movements of the mink Mustela vison Shreber in
southern Sweden. Oikos 21:160-173.
Hatler, D. F. 1976. The coastal mink on Vancouver Island, British Columbia.
Dissertation, The University of British Columbia, Vancouver, British Columbia,
Canada.
Hernandez-Divers, S. M., G. V. Kollias, N. Abou-Madi, B. K. Hartup. 2001. Surgical
technique for intra-abdominal radiotransmitter placement in North American river
otters (Lontra canadensis). Journal of Zoo and Wildlife Medicine 32:202-205.
Horne, J. S., and E. O. Garton. 2006. Likelihood cross-validation versus least squares
cross-validation for choosing the smoothing parameter in kernel home-range
analysis. Journal of Wildlife Management 70:641648.
Ireland, M. C. 1990. The behaviour and ecology of the American mink Mustela vison
(Schreber) in a coastal habitat. Dissertation, The University of Durham, Durham,
England.
Kauhala, K., and T. Tiilikainen. 2002. Radio location error and the estimates of home-
range size, movements, and habitat use: a simple field test. Annales Zoologici
Fennici 39:317-324.
Jo, C., J. Gossett, and P. Simpson. 2007. Regression splines with longitudinal data: SAS
Survey Procedures and NHANES. SAS Global Forum 2007. Orlando, Florida,
USA. Available online at http://www2.sas.com/proceedings/forum2007/143-
2007.pdf. Accessed 7 February 2012.
Larivière, S. 2003. Mink: Mustela vison. Pages 662-671 in G. A. Feldhamer, B. C.
Thompson, and J. A. Chapman, editors. Wild mammals of North America.
Second edition. The Johns Hopkins University Press, Baltimore, Maryland, USA.
Marshall, W. H. 1936. A study of the winter activities of the mink. Journal of
Mammalogy 17:382-392.
Melero, Y., S. Palazón, E. Revilla, J. Martelo, and J. Gosàlbez. 2008. Space use and
habitat preferences of the invasive American mink (Mustela vison) in a
Mediterranean area. European Journal of Wildlife Research 54:609-617.
Niemimaa, J. 1995. Activity patterns and home ranges of the American mink Mustela
vison in the Finnish outer archipelago. Annales Zoologici Fennici 32:117-121.
72
Pedan, A. 2003. Smoothing with SAS Proc Mixed. Seattle SAS Users Group
International Proceedings March 30–April 2. SAS, Inc., Cary, North Carolina,
USA. Available online at http://www2.sas.com/proceedings/sugi28/268-28.pdf.
Accessed 7 February 2012.
Peeples, J. W. 2001. The feasibility of re-establishing wild mink in the northern coastal
marshes of South Carolina. Thesis, Clemson University, Clemson, South
Carolina, USA.
Plowman, B. W., L. M. Conner, M. J. Chamberlain, B. D. Leopold, and L. W. Burger, Jr.
2006. Annual dynamics of bobcat (Lynx rufus) home range and core use areas in
Mississippi. The American Midland Naturalist 156:386-393.
Powell, R. A. 2000. Animal home ranges and territories and home range estimators.
Pages 65-110 in L. Boitani and T. K. Fuller, editors. Research techniques in
animal ecology: controversies and consequences. Columbia University Press,
New York, New York, USA.
Rooney, S, A. Wolfe, and T. J. Hayden. 1998. Autocorrelated data in telemetry studies:
time to independence and the problem of behavioral effects. Mammal Review
28:89-98.
Salo, P, M. Toivola, M Nordström, and E. Korpimäki. 2010. Effects of home-range
characteristics on the diet composition of female American mink in the Baltic Sea
archipelago. Annales Zoologici Fennici 47:111-122.
Sinclair, W. N., N. Dunstone, and T. B. Poole. 1974. Aerial and underwater visual acuity
in the mink Mustela vison Schreber. Animal Behaviour 22:965-974.
Stevens, R. T., T. L. Ashwood, and J. M. Sleeman. 1997. Fall early winter home ranges,
movements, and den use of male mink, Mustela vison, in eastern Tennessee.
Canadian Field-Naturalist 111:312-314.
Waller, M. 2010. Evaluation of spotlight surveys for monitoring mink populations in
coastal South Carolina. Thesis, Clemson University, Clemson, South Carolina,
USA.
Wellman, S. T., and J. M. Haynes. 2009. Diel activity patterns of mink, Neovison vison,
change with habitat. Canadian Field-Naturalist 123:368-370.
Whitman, J. S. 1981. Ecology of the mink (Mustela vison) in west-central Idaho. Thesis,
University of Idaho, Moscow, Idaho, USA.
73
Yamaguchi, N., R. Strachan, and D. W. MacDonald. 2002. Practical considerations for
the field study of American mink Mustela vison in lowland England. Mammal
Study 27:127-133.
Yamaguchi, N., and D. W. MacDonald. 2003. The burden of co-occupancy: intraspecific
resource competition and spacing patterns in American mink, Mustela vison.
Journal of Mammalogy. 84:1341-1355.
Zabala, J., I. Zuberogoitia, and J. A. Martinez-Climent. 2007. Winter habitat preferences
of feral American mink Mustela vison in Biscay, Northern Iberian Peninsula. Acta
Theriologica 52:27-36.
Zielinski, W. J., W. D. Spencer, and R. H. Barrett. 1983. Relationship between food
habits and activity patterns of pine martens. Journal of Mammalogy 64:387-396.
Zschille, J., N. Stier, and M. Roth. 2008. Radio tagging American mink (Mustela vison) –
experience with collar and intraperitoneal-implanted transmitters. European
Journal of Wildlife Research 54:263-268.
Zschille, J., N. Stier, and M. Roth. 2010. Gender differences in activity patterns of
American mink Neovison vison in Germany. European Journal of Wildlife
Research 56:187-194.
Zuberogoitia, I., J. Zabala, and J. A. Martínez. 2006. Dirunal activity and observations of
the hunting and ranging behavior of the American mink (Mustela vison).
Mammalia 70:310-312.

74
Table 3.1: Sex, age class, weight (g), capture date, and transmitter frequency, and kit
measurements (when applicable) of 9 mink captured for this study in CRNWR, South
Carolina, in May 2010 and April-May 2011.
Mink
ID Sex
Age
Class Weight, g
Capture
Date
Transmitter
(173.xyz)
Kits
Sex Weight, g
F1 F Adult 535 26-May-10 732 F 60
F 55
M 50
F2 F Adult 540 28-May-10 808 F 60
M 70
M 70
F3 F Adult 650 28-May-10
F 45
F 60
F 60
M 70
M 60
M 60
M 65
M4a M Juvenile 943 18-Apr-11 752 N/A
M5a M Juvenile 880 20-Apr-11 819 N/A
F6 F Adult 675 18-May-11 712 F 17
F 17
M 17
M 17
F7 F Adult 685 20-May-11 772 F 10
F 10
F 10
M 15
M 15
M 15
F8 F Adult 720 20-May-11 831 Pregnant, evidence
of kits ~ 03-June
F9 F Adult 720 20-May-11 861 F 17
F 17
M 17
M 23
M 23
a Mortality Signals Detected: Mink 4 on 29-April; Mink 5 on 09-May
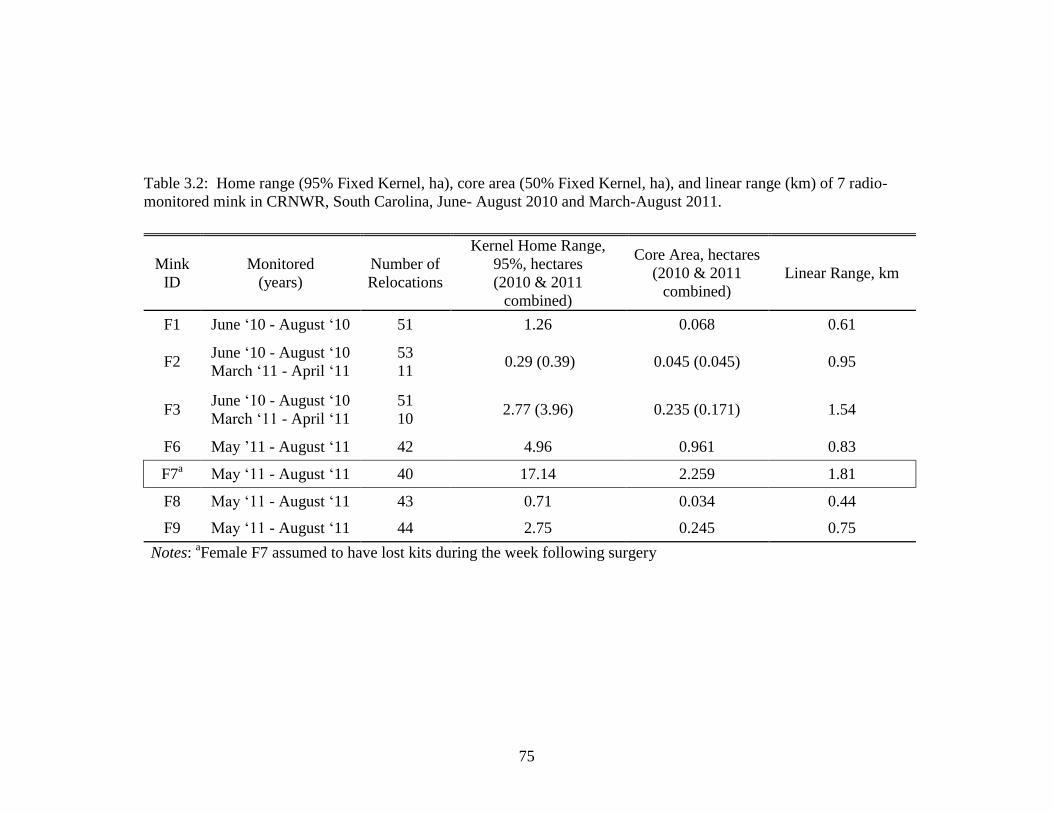
75
Table 3.2: Home range (95% Fixed Kernel, ha), core area (50% Fixed Kernel, ha), and linear range (km) of 7 radio-
monitored mink in CRNWR, South Carolina, June- August 2010 and March-August 2011.
Mink
ID
Monitored
(years)
Number of
Relocations
Kernel Home Range,
95%, hectares
(2010 & 2011
combined)
Core Area, hectares
(2010 & 2011
combined)
Linear Range, km
F1 June ‘10 - August ‘10 51 1.26 0.068 0.61
F2 June ‘10 - August ‘10 53
0.29 (0.39) 0.045 (0.045) 0.95 March ‘11 - April ‘11 11
F3 June ‘10 - August ‘10 51
2.77 (3.96) 0.235 (0.171) 1.54 March ‘11 - April ‘11 10
F6 May ’11 - August ‘11 42 4.96 0.961 0.83
F7a May ‘11 - August ‘11 40 17.14 2.259 1.81
F8 May ‘11 - August ‘11 43 0.71 0.034 0.44
F9 May ‘11 - August ‘11 44 2.75 0.245 0.75
Notes: aFemale F7 assumed to have lost kits during the week following surgery

76
Table 3.3: Dates monitored for activity pattern analysis, total number of fixes
(active + inactive), and number of active fixes per monitored female in CRNWR,
South Carolina. The number of “not found” occurrences in which a female was
not located (i.e., not detected) during a time block.
Mink
ID Monitored
Total Fixes
(Active, Inactive) Active Not Found
F2 25-March to 25-April 48 16 8
F3 25-March to 25-April 48 28 7
F6 23-May to 10-August 224 83 1
F7 29-May to 10-August 177 72 25
F8 23-May to 10-August 225 76 0
F9 23-May to 10-August 219 84 6
Total 941 359 47

77
Table 3.4: Total number of active and inactive fixes recorded
during the day (0600 to 20:00) and at night (20:00 to 06:00)
for all 6 females monitored in CRNWR, South Carolina,
from March through August 2011.
Duration Active Inactive
Light 06:00 to 20:00 185 364
Dark 20:00 to 06:00 174 218

78
Table 3.5: Percentage of time within a 24-hour cycle in which lactating & non-lactating females are expected to be active in
CRNWR, South Carolina, March-August 2011. Data were combined to estimate an average percentage of active time for all
monitored females.
Time Block
Lactating Female Non-Lactating Female All Female Activity
Active Inactive Active Inactive Active Inactive % Active
0 13 16 7 3 20 19 51.3
1 10 19 7 3 17 22 43.6
2 9 21 4 4 13 25 34.2
3 9 20 6 6 15 26 36.6
4 13 17 6 5 19 22 46.3
5 6 24 7 5 13 29 31.0
6 13 16 5 8 18 24 42.9
7 17 13 10 5 27 18 60.0
8 10 17 2 11 12 28 30.0
9 13 14 4 9 17 23 42.5
10 9 17 2 10 11 27 28.9
11 8 18 2 12 10 30 25.0
12 4 23 3 11 7 34 17.1
13 9 18 3 8 12 26 31.6
14 5 22 5 6 10 28 26.3
15 6 21 2 9 8 30 21.1
16 5 22 2 9 7 31 18.4
17 11 16 6 5 17 21 44.7
18 13 14 5 6 18 20 47.4
19 9 18 6 4 15 22 40.5
20 9 18 5 4 14 22 38.9
21 13 14 6 5 19 19 50.0
22 16 11 8 4 24 15 61.5
23 13 16 3 5 16 21 43.2
Avg % Active per 24 hr 36.3 43.3 38.4

79
Figure 3.1: Capture locations of 9 mink (2 juvenile males, 7 adult females) in the northern marshes of
CRNWR, South Carolina, in May 2010 and from April to May, 2011.
Raccoon Key
Lighthouse Island
Cape Island

80
Figure 3.2: Use of small drainage creeks (enclosed in red boxes) by lactating female mink, F3, in
CRNWR, South Carolina, June-August 2010 locations.

81
Figure 3.3: Home range, core area, and estimated monthly locations of mink F6 and F9 in CRNWR,
South Carolina, May-August 2011. Note the total lack of home range overlap.

82
0.0
10.0
20.0
30.0
40.0
50.0
60.0
70.0
80.0
< 0.3 0.3 - 0.6 0.6 - 0.9 0.9 - 1.2 1.2 - 1.5 1.5 <
% A
ctiv
ity F
ixes
Tide Height, meters
Active
Inactive
Figure 3.4: Percentage of all active and inactive fixes on 6 female mink at various tide heights (m) in CRNWR,
South Carolina, March to August, 2011.

83
Figure 3.5: Range of activity within a time block for each monitored female
mink in CRNWR, South Carolina, March-August 2011. Mink F2 and F3 (royal
blue and red) were monitored between March and April 2011 during the end of
the mink breeding season.

84
Figure 3.6: Average predicted activity within each time block for female mink during spring and
summer in Cape Romain National Wildlife Refuge, South Carolina, March-August, 2011. Arrows
indicate approximate sunrise and sunset throughout the study.

85
CHAPTER FOUR
SUMMARY & CONCLUSIONS
Ecology and management techniques of the American mink are well documented
in the literature (Dunstone 1993, Harrington et al. 2009, Larivière 2003). Most of this
research, however, has occurred in Europe and South America where mink are an
invasive species, and the management and research goals revolve around mink impact on
native species and/or mink removal from the system (Bartoszewicz and Zalewski 2003,
Ferreras and MacDonald 1999, Salo et al. 2008). In South Carolina, mink are considered
to be in decline statewide and have been designated a species of high conservation
priority by South Carolina’s Department of Natural Resources (SCDNR) (Kohlsaat et al.
2005). Unlike populations studied abroad, South Carolina’s coastal mink populations
inhabit tidal saltwater marshes. Since reestablishing a successful mink population in
Cape Romain National Wildlife Refuge (CRNWR), research regarding effective trapping
techniques, surveying methods, and basic ecology have occurred (Butfilsoki and Baker
2005, Osowski et al. 1995, Peeples 2001). This study measured home range and activity
pattern of lactating females in the refuge. It was found that mink activity was negatively
related to tide height. A diet analysis of mink stomach and gastrointestinal tracts showed
mink diet to be predominately fish and crustacean in CRNWR.
As the mink population established itself in the refuge, reports of mink-specific
predation on species of concern (i.e., black skimmer, least tern, American oystercatcher,
and loggerhead sea turtle) to U.S. Fish and Wildlife Service (USFWS) at CRNWR have
increased. Consequently, USFWS has proposed the removal of all mink from the refuge.

86
Predation by mink and other species (e.g., ghost crab, black vulture, raccoon, and great
horned owl) as well as overwash and beach erosion have been observed to contribute to
lost avian productivity (i.e., American oystercatcher, least tern, black skimmer) either
through nest loss or chick loss in CRNWR (Thibault 2008, Brooks 2011, Godsea et al.
2010); however, it is unclear to what extent any of these factors contribute individually or
collectively to beach nesting bird or loggerhead sea turtle losses. Further research is
necessary to document and understand causes of specific and significant losses to help
guide sound management decisions.
If the goal of the refuge is to reduce avian nest and chick loss, particularly for
species of special concern, USFWS trapping data (this study; Dawsey 2007, 2009) and
the estimates of the bioenergetics model suggest culling of mammalian predators within
and adjacent to avian nesting sites on Cape Island, Lighthouse Island, and Raccoon Key
may be important. Based on mink movements reported in this study and in the literature,
it is suggested that mink removal from barrier islands should take place between January
and March (i.e., mink breeding season) when mink are most active. The bioenergetics
model presented in this study provides preliminary estimates of monthly consumption
rates of mink in CRNWR. However, further research, especially regarding diets of mink
in the refuge, is highly recommended to refine estimates of mink prey consumption and
provide a more accurate description of potential mink impact on other species.
Since mink, American oystercatcher, least tern, and black skimmer have high
conservation value in South Carolina, further monitoring and research of the interaction
of these species is necessary to restore the historical ecological integrity of the system. If

87
the goal of SCDNR’s Furbearer Project is to continue mink reintroduction efforts in other
areas along the northern coast of the state, then it is recommended that the CRNWR
population be used as the source population for such efforts. This would reduce the
number of mink within the refuge (i.e., reduce predation on species of concern in
CRNWR), as well as provide for further research opportunities on mink ecology in South
Carolina’s coastal marshes (i.e., a goal of SCDNR’s Furbearer Project). A joint mink
culling-relocation program between SCDNR and USFWS at CRNWR could benefit both
mink and beach-nesting bird conservation.

88
LITERATURE CITED
Bartoszewicz, M., and A. Zalewski. 2003. American mink, Mustela vison diet and
predation on waterfowl in the Slonsk Reserve, western Poland. Folia Zoologica
52:225-238.
Brooks, G. 2011. Reproductive success of black skimmers and least terns. Thesis,
Clemson University, Clemson, South Carolina, USA.
Butfiloski, J., and O.E. Baker. 2005. Mink. South Carolina Department of Natural
Resources. Columbia, South Carolina, USA.
Dunstone, N. 1993. The mink. T. & A.D. Poyser Ltd, London, United Kingdom.
Ferreras, P., and D. W. MacDonald. 1999. The impact of American mink Mustela vison
on water birds in the upper Thames. Journal of Applied Ecology 36:701-708.
Godsea, K., R. Nilius, V. Fischer, S. Dawsey, R. Paterra, P. Lynch. 2010. Comprehensive
conservation plan and environmental assessment (draft) – Cape Romain National
Wildlife Refuge. U.S. Fish and Wildlife Service, Cape Romain National Wildlife
Refuge, Charleston County, South Carolina, USA.
Kohlsaat, T., L. Quattro, and J. Rinehart. 2005. South Carolina Comprehensive Wildlife
Conservation Strategy 2005-2010. South Carolina Department of Natural
Resources, South Carolina, USA.
Larivière, S. 2003. Mink: Mustela vison. Pages 662-671 in G. A. Feldhamer, B. C.
Thompson, and J. A. Chapman, editors. Wild mammals of North America.
Second edition. The Johns Hopkins University Press, Baltimore, Maryland, USA.
Osowski, S. L., L. W. Brewer, O. E. Baker, G. P. Cobb. 1995. The decline of mink in
Georgia, North Carolina, and South Carolina: The Role of Contaminants.
Archives of Environmental Contamination and Toxicology 29:418-423.
Peeples, J. W. 2001. The feasibility of re-establishing wild mink in the northern coastal
marshes of South Carolina. Thesis, Clemson University, Clemson, South
Carolina, USA.
Salo, P., M. Nordström, R. L. Thomson, and E. Korpimäki. 2008. Risk induced by a
native top predator reduces alien mink movements. Journal of Animal Ecology
77:1092-1098.

89
Thibault, J. M. 2008. Breeding and foraging ecology of American oystercatchers in Cape
Romain Region, South Carolina. Thesis, Clemson University, Clemson, South
Carolina, USA.

90
APPENDICES

91
Appendix A
Bioenergetics model SAS program code for the estimation of fish, crustacean, and avian
consumption of a male mink in Cape Romain National Wildlife Refuge,
South Carolina

92
data male;
fishpc=.407;
crupc=.519;
avipc=.074;
do rep=1 to 300000;
wt = ((1304-822)*rantri(234,.5) + 822);
fmr = (2.23*(wt)**.85)*30;
fishwt = (125-30)*rantri(345,.5) +30;
fishcv = fishwt*5.02;
fishae = ((85-72)*rantri(567,.5) + 72)/100;
fishen = fishcv*fishae;
cruwt = (85-5)*rantri(345,.5) +5;
crucv = cruwt*3.0;
cruae = ((85-72)*rantri(567,.5) + 72)/100;
cruen = crucv*cruae;
aviwt = (50-8)*rantri(345,.5) +8;
avicv = cruwt*8.0;
aviae = ((85-72)*rantri(567,.5) + 72)/100;
avien = avicv*aviae;
fmrfish=fmr*fishpc;
fmrcru=fmr*crupc;
fmravi=fmr*avipc;
fish=fmrfish/fishen;
cru=fmrcru/cruen;
avi=fmravi/avien;
output;
end;
proc univariate plot;
var fish cru avi;
run;
quit;

93
Appendix B
Histograms generated from 300,000 iterations of each bioenergetics model showing the
distribution of the outcomes using the male model (crustacean, fish, and avian),
female model (avian only), and lactating female (avian only).

94
Figure B-1: Male Bioenergetics Model Output for Crustacean Consumption
♂

95
Figure B-2: Male Bioenergetics Model Output for Fish Consumption
♂
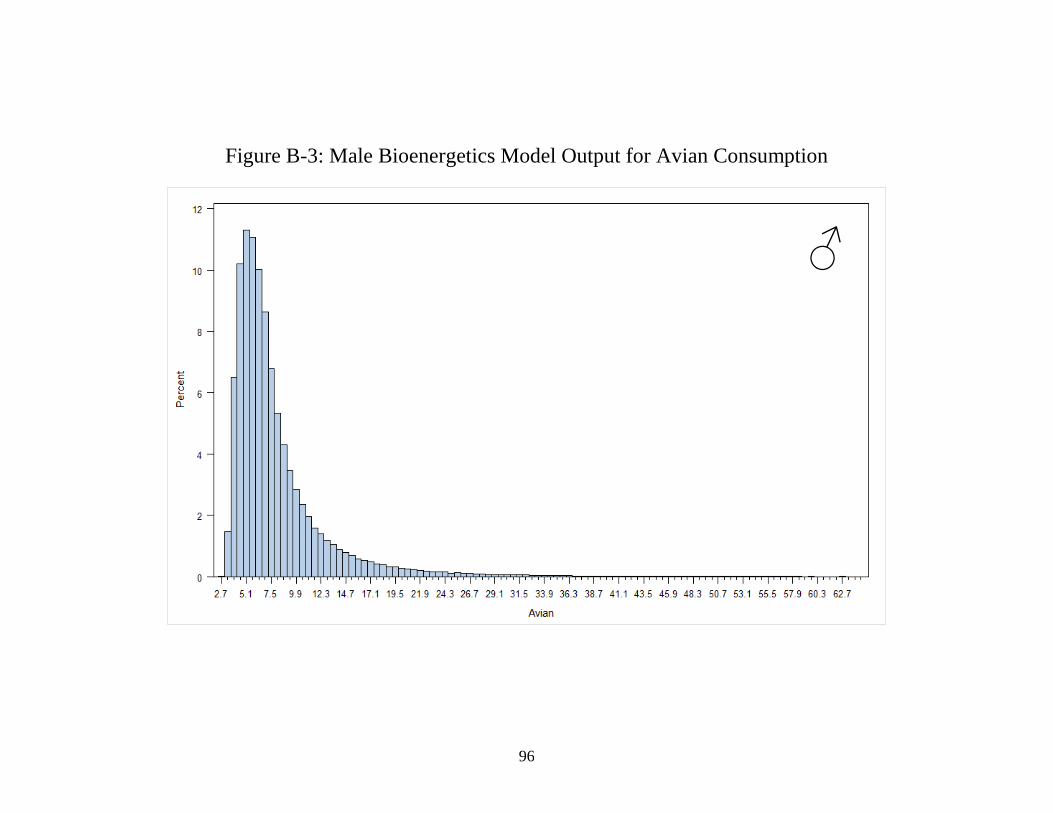
96
Figure B-3: Male Bioenergetics Model Output for Avian Consumption
♂

97
Figure B-4: Female Bioenergetics Model Output for Avian Consumption
♀

98
Figure B-5: Lactating Female Bioenergetics Model Output for Avian Consumption
♀L

99
Appendix C
95% Fixed Kernel Home Ranges and 50% Core Use Areas (50% Kernel)
for 7 radio-monitored female American mink in Cape Romain
National Wildlife Refuge, South Carolina
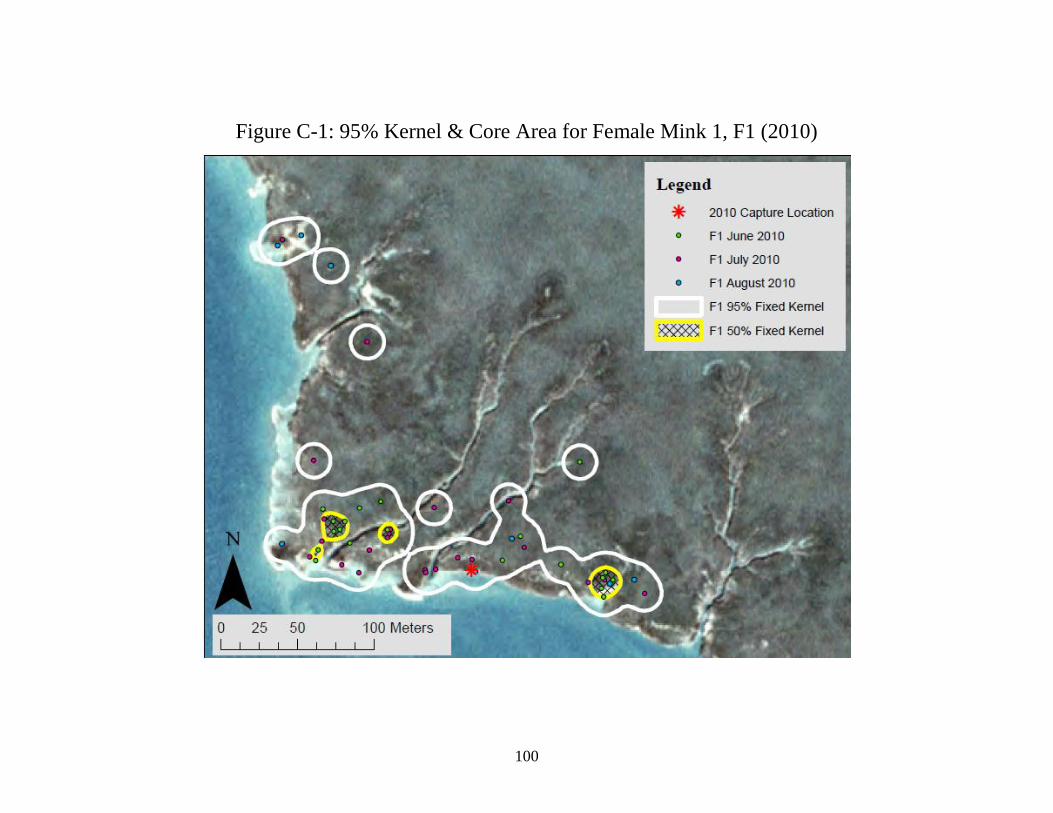
100
Figure C-1: 95% Kernel & Core Area for Female Mink 1, F1 (2010)

101
Figure C-2: 95% Kernel & Core Area for Female Mink 2, F2 (2010, 2011)

102
Figure C-3: 95% Kernel & Core Area for Female Mink 3, F3 (2010, 2011)

103
Figure C-4: 95% Kernel & Core Area for Female Mink 6, F6 (2011)

104
Figure C-5: 95% Kernel & Core Area for Female Mink 7, F7 (2011)

105
Figure C-6: 95% Kernel & Core Area for Female Mink 8, F8 (2011)
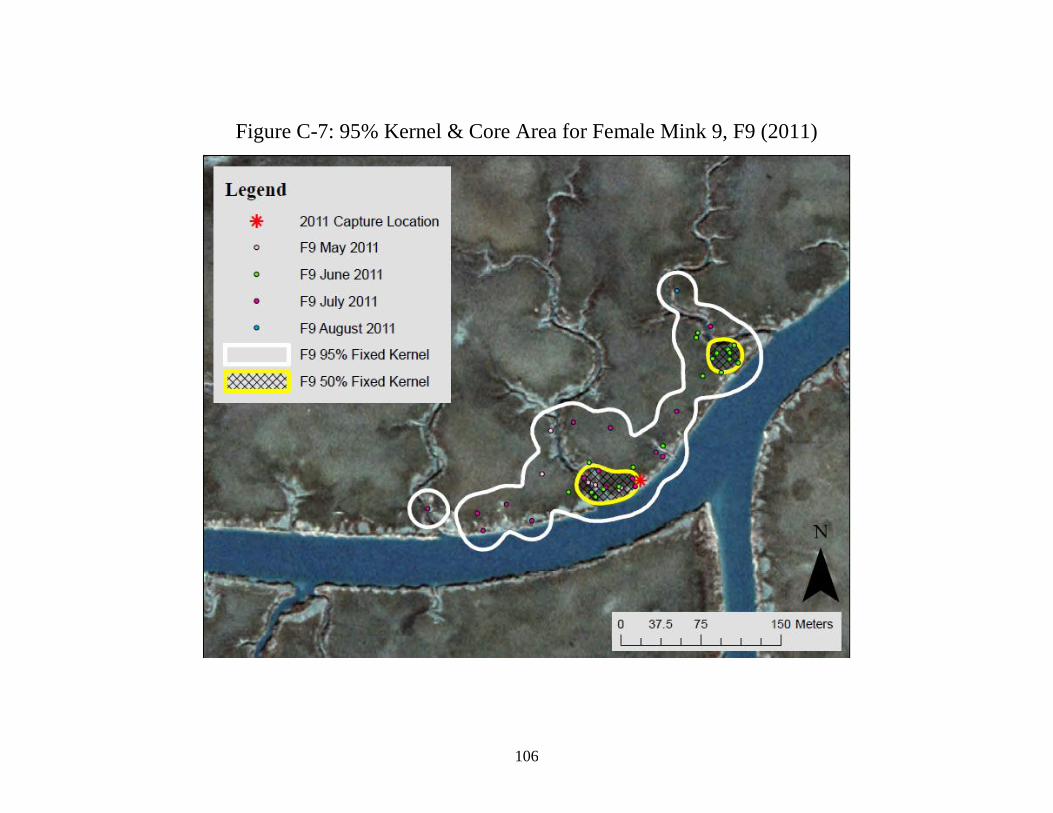
106
Figure C-7: 95% Kernel & Core Area for Female Mink 9, F9 (2011)