Ecological needs of low flows in the Barwon-Darling · Ecological needs of low flows in the...
71
Ecological needs of low flows in the Barwon-Darling Technical Report March 2018 Murray-Darling Basin Authority
Transcript of Ecological needs of low flows in the Barwon-Darling · Ecological needs of low flows in the...

Ecological needs of low flows in the Barwon-Darling
Technical Report
March 2018
Murray-Darling Basin Authority

Published by the Murray–Darling Basin Authority
© Murray–Darling Basin Authority 2017
With the exception of the Commonwealth Coat of Arms, the MDBA logo, trademarks and any
exempt photographs and graphics (these are identified), this publication is provided under a
Creative Commons Attribution 4.0 licence.
https://creativecommons.org/licenses/by/4.0
The Murray‒Darling Basin Authority’s preference is that you attribute this publication (and any
Murray‒Darling Basin Authority material sourced from it) using the following wording within your
work:
Title: Ecological needs of low flows in the Barwon-Darling
Source: Licensed from the Murray‒Darling Basin Authority under a Creative Commons
Attribution 4.0 Licence
Accessibility
The Murray‒Darling Basin Authority makes its documents and information available in accessible
formats. On some occasions the highly technical nature of the document means that we cannot
make some sections fully accessible. If you encounter accessibility problems or the document is
in a format that you cannot access, please contact us.
Acknowledgement of the Traditional Owners of the Murray–Darling Basin
The Murray–Darling Basin Authority acknowledges and pays respect to the Traditional Owners,
and their Nations, of the Murray–Darling Basin, who have a deep cultural, social, environmental,
spiritual and economic connection to their lands and waters. The MDBA understands the need
for recognition of Traditional Owner knowledge and cultural values in natural resource
management associated with the Basin.
The approach of Traditional Owners to caring for the natural landscape, including water, can be
expressed in the words of the Northern Basin Aboriginal Nations Board:
…As the First Nations peoples (Traditional Owners) we are the knowledge holders, connected to
Country and with the cultural authority to share our knowledge. We offer perspectives to balance
and challenge other voices and viewpoints. We aspire to owning and managing water to protect
our totemic obligations, to carry out our way of life, and to teach our younger generations to
maintain our connections and heritage through our law and customs. When Country is happy, our
spirits are happy.
Cover image: Small in-channel flow at Bourke Weir on 19 January 2004 (about 900 ML/d)

Contents Executive Summary ..................................................................................................................... 2
Introduction .................................................................................................................................. 8
Barwon-Darling Context ............................................................................................................ 9
Environmental importance of the Barwon-Darling ................................................................... 10
History of water sharing arrangements in the Barwon-Darling ................................................ 11
Water sharing pre 2012 Water Sharing Plan ....................................................................... 11
Barwon-Darling Water Sharing Plan, 2012 .......................................................................... 12
Analysis of hydrological impacts ............................................................................................. 13
Connection to the Basin Plan environmental water planning framework ................................. 15
Ecological importance of low flows ............................................................................................. 16
In-stream habitat features ....................................................................................................... 20
Fish community of the Barwon-Darling ................................................................................... 24
Golden Perch ...................................................................................................................... 26
Fish movement opportunities .............................................................................................. 26
Longitudinal Connectivity ........................................................................................................ 29
Method for assessing ecological needs for low flows ................................................................. 31
Selection of the umbrella environmental asset ........................................................................ 31
Identify ecological values and targets ..................................................................................... 32
Environmental Flow Requirements ......................................................................................... 32
Results ....................................................................................................................................... 36
Environmental Flow Requirement frequency .......................................................................... 36
Environmental Flow requirement spells between events ......................................................... 37
Trends in Algal Suppression Flows ......................................................................................... 39
Trends in dry spells ................................................................................................................ 41
Observed salinity during periods of very low flow periods ....................................................... 43
Key findings and recommendations............................................................................................ 48
Conclusion ................................................................................................................................. 50
References ................................................................................................................................. 52
Appendix A - Algal suppression flow spells ................................................................................ 56
Appendix B - Case Study and CEWH environmental water deliveries ........................................ 57
Appendix C - Distribution of environmental flow indicator spells for between 1990 and 2017. .... 66

Ecological needs of low flows in the Barwon-Darling
Page 2
Executive Summary
In November 2016 the MDBA released the findings from the Northern Basin Review,
recommending a reduction in the total volume of water to be recovered for the environment
across the Northern Basin. As a result of the Northern Basin Review’s extensive research and
community consultation, the MDBA recommended that the 390 GL recovery volume set in 2012
be reduced to 320 GL, contingent upon commitments from governments to implement a range of
‘toolkit measures’.
The purpose of the toolkit measures is to improve water management practices. The Authority
believes that implementing these measures will provide improved environmental outcomes and
lessen the social and economic impacts compared with the original 390 GL Basin Plan recovery
settings.
One of these measures specifies the need for the protection of smaller but ecologically significant
flows across the Northern Basin. Smaller flows are critical for both communities and the
environment, particularly in dry-times. The Authority believes that the protection of the most
ecologically significant small flows is critical to achieve the desired outcomes of the Basin Plan,
particularly in the Barwon-Darling. This sentiment was reiterated by stakeholders from their lived
experience of living and working on the river. Protecting environmental water and restoring
ecologically important small flows was also identified as a policy priority to be addressed by
Basin governments by the recent MDBA Compliance review and Ken Matthews Review
(Matthews, 2017) commissioned by the NSW government.
This report provides a synthesis of environmental water requirements associated with
ecologically important small flows ‘low flow and small fresh events’ in the Barwon-Darling
between Mungindi and Wilcannia.
For the purpose of this analysis, ‘low flow and small fresh events’ have been defined to be those
representing flow events with a peak of between 350-2,000 ML/d across the Barwon-Darling river
system. This flow range is consistent with the ecological significance as described in previous
studies (Thoms et al. 1996, MDBA 2011 and NSW DPI 2015). To place this definition into
context, commence to pump thresholds for licences, specified in the Barwon-Darling Water
Sharing Plan (2012), are generally within this flow range, and these flows may not be considered
low for purposes other than environmental.
The MDBA has previously assessed the environmental water requirements of the Barwon-
Darling river system, and developed a suite of site-specific flow indicators, as part of the Northern
Basin Review (MDBA, 2016a). These indicators focused on ecologically important larger in-
channel and overbank aspects of the flow regime to assist with determining the long-term
average amount of water required by the environment as an input to setting Sustainable
Diversion Limits.
The analysis presented in this report complements the previous assessment. The Northern Basin
Review focused on larger flow events (>6,000 ML/d) that are important for informing the total
quantum of water to be recovered for the environment and describe the types of flows that are
ecologically important during average to wetter conditions. The synthesis of existing information
on ‘low flow and small fresh events’ within this document has two objectives. Firstly, to describe

Ecological needs of low flows in the Barwon-Darling
Page 3
the types of flows that are ecologically important during drier conditions. Secondly, to inform
consideration of mechanisms to better protect environmental flows as part of managing water
within the Sustainable Diversion Limit.
It is acknowledged that the management of unregulated flows in the Barwon-Darling river system
must occur at a reach scale and through management of individual flow events in order to
optimise outcomes across all users, including the environment. Under existing management
arrangements, commence to pump thresholds are largely within the range of the environmental
water requirements for ecologically important small flows. It is therefore important to ensure the
rules around water sharing, and approaches to managing environmental water, are based on a
good understanding of the ecological needs associated with that flow window.
In addition, ecologically important small flows are the types of events that the Commonwealth
Environmental Water Holder currently has capacity to deliver and actively manage with the
portfolio of water recovered for the environment (as has been demonstrated on several
occasions in recent years — see Appendix B). Protection of this water is important to ensure it
meets is intended purpose and flows through the river system.
The ecological needs for small flows in the Barwon-Darling river system include:
• Maintaining populations of native fish and other aquatic biota (like mussels) by
replenishing refuge pools and maintaining aquatic habitats; providing opportunities for
movement between habitats; and supporting key ecosystem functions (including
cycling of nutrients and provision of carbon for productive food webs);
• Supporting regular breeding and recruitment of fish and other invertebrates with short
life cycles to maintain populations and genetic diversity.
• Maintaining water quality through regular flushing of refuge pools to mitigate against
issues such as algal blooms and salinity spikes.
• Providing longitudinal connectivity through the Barwon-Darling river system and its
tributaries to support the ecological needs above, maintain in-channel and riparian
vegetation condition, and provide natural cues for flow responsive fish and other
aquatic biota.
Ecologically important small flows also provide water for downstream communities to ensure
reliable and good quality water for critical human water needs (such as town water and stock and
domestic uses), and water to support cultural and recreational values.
What is this report about?
The report describes environmental flow requirements for ‘low flow and small fresh events’ in the
Barwon-Darling river system based on a synthesis of existing information and literature. The
description of flow requirements includes the flow event magnitude, duration, timing frequency
and thresholds of concern for the period of time between events. The term environmental flow
requirement has been used in this report to differentiate this work from the site-specific flow
indicators developed previously as part of the Northern Basin Review. However, it should be
noted that both are expression of environmental water needs for the Barwon-Darling River with
the distinction being their focus on different parts of the flow regime.
Thirteen environmental flow requirements have been described for different points along the
river, including at Walgett, Brewarrina, Bourke, Louth and Wilcannia (see table below). This

Ecological needs of low flows in the Barwon-Darling
Page 4
approach provides spatial coverage of environmental water needs along the length of the river in
recognition of reach based differences in hydrology, geomorphology and ecology. Furthermore,
irrigation extractions occur along the entire length of the Barwon River and in the upper sections
of the Darling River around Bourke. Hence, an understanding of the needs for all reaches is
important from a management perspective given they experience varying levels of flow alteration
due to consumptive use. Description of flow requirements at Wilcannia is considered especially
important as the last gauge on the Darling River and hence it represents the full impact of
upstream development and can be used to assess longitudinal connectivity for the entire river
system.
The performance of the environmental flow requirements has been assessed against the
modelled without development flow regime and observed gauged flows for between 1990-91 and
2016-17. The analysis of observed flows is important as the current hydrological model for the
Barwon-Darling (the Barwon-Darling IQQM developed by the NSW government) is known to
have issues with providing an accurate representation of such flow events, especially for low
flows (CSIRO, 2008; Bewsher, 2016). When flows fall below about 400-500 ML/d at Bourke,
there is a divergence between the observed and Baseline model flow exceedance curves,
indicating the model has difficulty predicting these flows. This is not to say that the model does
not provide valuable information, rather, that it is important to supplement the model with other
sources of information.
List of Environmental Flow Requirements for the Barwon-Darling river system.
Ecological rationale Threshold Duration (days)
Timing Target frequency (% of years with an event)
Threshold of concern for spells b/w events (days)
CEWO Northern Unregulated Rivers Portfolio Management Plan (CEWO, 2017)
Maintain native fish populations and in-channel ecosystem processes such as refuge pools and connectivity down the river. #set to match the without development maximum spell between events.
500 ML/d @ Walgett
7-20 Aug-May (1 to 3 events)
80-90 476#
500 ML/d @ Bourke
7-20 Aug-May (1 to 2 events)
80-90 365
350 ML/d @ Louth
7-14 Aug-May (1 to 2 events)
80-90 365
Enhance native fish spawning, and recruitment for reaches in the Barwon-Darling(especially small bodied fish)
500 ML/d @ Bourke
50 Sep-April 70-80 730
1,500 ML/d @ Bourke
5 Sep-April 70-80 730
Golden Perch small pulse requirements (Stuart and Sharp, 2017)
Regular opportunity for Golden perch to migrate and spawn in the Barwon-Darling and Border Rivers, with larval development in- channel and downstream transport.
3,000 ML/d @ Brewarrina
20 Any time (ideally when temp is above 18 degrees)
60-70 1460
Algal suppression/connectivity flow - Interim Northwest Unregulated Flow Plan - associated with the B-D water sharing plan (NSW, 2012)
Flow pulse to the end of system during the hotter months to mitigate against stratification of pools and the development of algal blooms.
2,000 ML/d @ Wilcannia
5 Oct-April 80-90 730

Ecological needs of low flows in the Barwon-Darling
Page 5
Ecological rationale Threshold Duration (days)
Timing Target frequency (% of years with an event)
Threshold of concern for spells b/w events (days)
Management target for access to unregulated flows to be restricted to achieve event, unless flow occurred within the preceding months.
Algal suppression thresholds (Mitrovic et al., 2006)
Critical discharge to suppress stratification of pools and Anabaena circinalis (toxic blue-green algae) growth during the hotter months of the year. *would indicate there has not been an algal bloom mitigation flow between October to March.
510 ML/d @ Brewarrina
1 15 Oct-15 March
100 150*
450 ML/d @ Bourke
1 15 Oct-15 March
100 150*
350 ML/d @ Wilcannia
1 15 Oct-15 March
100 150*
What are the key findings?
Analysis of observed flows shows that the environmental flow requirements have mixed
performance against the identified frequency and dry spell targets (Table 6, Table 7). The desired
frequency and/or dry spell is exceeded for many of the flow requirements across multiples
reaches of the Barwon-Darling river system. There are much longer periods of no to very low
flows which go beyond the threshold of concern identified for most environmental flow
requirement events, especially for the smaller in-channel freshes and baseflows.
Some of the trends and impacts of the longer low or no-flow periods include:
• The maximum dry spell between flow low events is approximately doubled in length
for many of the flow requirements described when comparing observed flows to the
without development flow regime. In extreme cases, the maximum dry spell is greater
than 10 times longer which is likely to place ecosystems under severe stress.
• Periods of low or no flow have increased for gauges downstream of Bourke post 2000
as compared to pre-2000.
• Algal bloom risks is increased through the system with the risk highest at Wilcannia
(compared to Bourke and Brewarrina) and increasing for the period after 2010 (see
figure below). The flow thresholds important for mixing pools to mitigate algal bloom
risk are also associated with other positive outcomes, such as connectivity for fish
movement between habitats.
• Salinity spikes (salinity going over 5,000 µS/cm) observed during periods of low flow
for the reach between Bourke and Tilpa, as a result of saline groundwater inflows.
This salinity is known to exceed the tolerance for many plants and invertebrates.
• Longer periods between opportunities for fish to move between habitats and breed,
especially for smaller fish that generally live for less than five years.

Ecological needs of low flows in the Barwon-Darling
Page 6
In order to sustain the ecological health of the Barwon-Darling River, there is a need to minimise
the duration of longer very low and no-flow periods that are inconsistent with the natural
hydrology of the Barwon-Darling river system. The aquatic biota have evolved to the boom and
bust variability of the river but, extended dry periods beyond those that would have occurred
naturally, test the resilience of the ecosystem.
It is recommended that alternative water sharing arrangements and rules should be investigated
to implement event based management that limits no and very low flow periods from exceeding
60-80 days at Bourke and 120-150 days at Wilcannia, especially in spring-summer. Investigation
of management strategies should not be limited to the main Barwon-Darling channel. As the
development of upstream catchments has an effect on flows in the Barwon-Darling, examination
of the management rules in these areas could improve outcomes for the Barwon-Darling and
provide a better understanding of system-wide linkages between catchments.
This is based on multiple lines of information including: the maximum no-flow periods in the
without development model; minimising salinity issues for the reach between Bourke and Tilpa,
providing flows in the hotter months to supress algal blooms; providing fish with regular
opportunities to access habitats and complete life-cycle stages; and providing water downstream
for critical human water needs. For example, the weir at Wilcannia retains only ~120 days of town
water supply following the start of a no-flow period after which time there is a reliance on
groundwater.
The volume of water required to provide longitudinal connectivity along the length of the Barwon-
Darling River is dependent on a range of factors with the dryness of the preceding period, source
of tributary inflow and level of take by consumptive users' primary drivers. Analysis of observed
flow events shows there is a very high likelihood of system scale longitudinal connectivity,
through to Wilcannia, with an event volume of at least 20 GL at Bourke. This flow event would
generally take the shape of a magnitude of 500 ML/d for at least 14 days, with 20 days providing
more certainty. This flow would also be sufficient to mix and freshen pools and improve water
quality. The volume needed would reduce under wetter antecedent conditions, and where a
sequence of smaller events collectively build the volume required for connectivity.

Ecological needs of low flows in the Barwon-Darling
Page 7
How does this work relate to the Long-term environmental Watering Plan?
The NSW Office of Environment and Heritage is currently developing the Long-term
Environmental Watering Plan (LTWP) for the Barwon-Darling river system. The LTWP is due to
be completed in 2019. Ultimately, this plan will set the environmental objectives and water
requirements used during the NSW Government's development of the water resource plan and
for guiding decisions by environmental water holders regarding use of environmental water.
This report is expected to provide early support to the LTWP development. It is also expected
that the environmental flow requirements described in the LTWP will be consistent with those
described in this document as the same scientific literature base and site-specific eco-hydrology
information is largely being used. The LTWP will be the enduring plan for managing
environmental water in the Barwon-Darling river system at the regional scale. The environmental
water requirements in the LTWP will supersede the requirements in this report once available.
What other work is being done to look at the protection of environmental flows?
The MDBA has undertaken hydrological analysis to investigate the historical behaviour of low
flows (≤ 2000 ML/d) along the Barwon-Darling river system between 1990 and 2017 (MDBA,
2017b). The aim was to assess any observable changes to flow behaviour over this time period.
The work produced a comprehensive catalogue of more than two thousand individual flow events
and provides a robust dataset with which to undertake the hydrological investigation.
Both the hydrology report and this report provide lines of evidence as part of a larger ongoing
work program to improve the protection of individual low flows for environmental outcomes, while
still ensuring other water users along the river have access to flows including basic rights and
improved water quality.
This work will inform the considerations of the Taskforce established by NSW government to
address the Toolkit Measures, and the subsequent recommendations of the Matthews Report
into water management and compliance. The Taskforce will provide recommendations to the
NSW Minister on the most effective way to protect environmental water in the short and longer
term within 90 days.
The Darling River at Louth, May 2016 (river peaked at 1,000 ML/d on 9 May (met 350 ML/d for 5 days but the flow was less than the specified 7-14 day duration for the environmental flow requirement).

Ecological needs of low flows in the Barwon-Darling
Page 8
Introduction
This report is a synthesis of existing information and literature describing the environmental water
requirements for low flows in the Barwon-Darling river system between Mungindi and Wilcannia
(see Figure 1). For the purpose of this report, low flows have been defined as events that are
typically between 350-2,000 ML/d across the Barwon-Darling river system. To place this
definition of low flows into context, commence to pump thresholds for licences, specified within
the Barwon-Darling Water Sharing Plan, are generally below within this flow range.
The entire flow regime is important when describing the environmental water requirements for a
river or catchment. The Barwon-Darling river system is unregulated and highly variable, including
events that pulse through the river, separated by periods of low to no-flow and sporadic flooding.
Each flow component (no-flow, small freshes, large freshes, bank-full and overbank) is important
for the ecosystem to function. These components collectively make up the flow regime that the
ecology has adapted to and relies upon.
The MDBA has previously assessed the environmental water requirements of the Barwon-
Darling river system and developed a suite of site-specific flow indicators, as part of the Northern
Basin Review (MDBA, 2016a). These site-specific flow indicators describe the types of flows that
are ecologically important during average to wetter conditions and their focus on larger in-
channel and overbank aspects of the flow regime (>6,000 ML/d) was deliberate to assist with
determining the long-term average amount of water required by the environment as an input to
setting Sustainable Diversion Limits.
This work complements, and is consistent with, the previous assessment. The synthesis of
existing information on low flows within this document has two objectives. Firstly, to describe the
types of flows that are ecologically important during drier conditions. Secondly, to inform
consideration of mechanisms to better protect environmental flows as part of managing water
within the Sustainable Diversion Limit.
Low flow events are also what the Commonwealth Environmental Water Holder currently has
capacity to deliver and actively manage with the portfolio of water recovered for the environment.
This has been demonstrated on a number of occasions in recent years, with the Gwydir River
release in spring 2014 a good example (see Case study at Appendix B). Protection of
Commonwealth environmental water is important to ensure it meets is intended purpose and
flows through the river system.
The purpose of this work is to synthesise the available scientific literature to describe
environmental flow requirements that represent the ecological needs for low flows in the Barwon-
Darling. These requirements have been assessed using modelled and observed flow data to
understand how they perform and understand trends over time that can be used to inform water
management.

Ecological needs of low flows in the Barwon-Darling
Page 9
Figure 1: The Barwon-Darling system showing tributaries, key reaches (coloured sections), their associated upstream and downstream gauges and the location of the 15 weirs along the river.
Barwon-Darling Context
The Barwon–Darling river system, in north-western New South Wales, takes in the Barwon River
from upstream of Mungindi at the confluence of the Macintyre and Weir rivers, to where the
Barwon meets the Culgoa River. At this point the river channel becomes the Darling River and
the Barwon–Darling system extends downstream to the Menindee Lakes.
The catchment only generates about 2.8% of the flow in the Basin, however much more water
flows through the system, 99% of which is generated in upstream catchments. The Barwon–
Darling is unregulated, except for the low-level weirs near townships, but many of the tributaries
of the system are highly regulated.
The Barwon River flows south-west through a relatively narrow floodplain with a tightly
meandering channel and a highly-variable flow pattern and capacity. Capacity is increased
downstream of Collarenebri, after the Little Weir, Boomi, Moonie, Gwydir and Mehi rivers have
joined the Barwon.
After Collarenebri, the Barwon River continues south-west, and is joined by more creeks and
rivers. Beyond Walgett the river turns in a westerly direction and flows unrestricted across alluvial
plains. It becomes less sinuous but there are many anabranches and effluent channels which
split and re-join the major channel.
The Darling River flows south-west within a deeply incised channel towards Wilcannia. Below
Wilcannia the Darling reaches the Menindee Lakes, at the artificial storage of Lake Wetherell.
Beyond this point the catchment is the Lower Darling.
Ecological needs of low flows in the Barwon-Darling
Page 10
The highly variable flows in the Barwon–Darling are driven by tributaries carrying water from the
many catchments in northern New South Wales and southern Queensland, including the Paroo,
Warrego, Condamine–Balonne rivers and Moonie in the north and west, and the Border Rivers,
Gwydir, Namoi, Macquarie–Castlereagh and Bogan Rivers to the east and south. Some of these
waterways only reach the Barwon–Darling after major floods.
The Barwon River starts at an elevation of about 200 m, at the confluence of the Macintyre and
Weir rivers, and flows about 700 km over a low gradient to an elevation of 110 m at its
confluence with the Culgoa River. From this point, the Darling River flows another 900 km to the
Menindee Lakes, at which point the elevation is less than 100 m.
The Barwon–Darling region has a semi-arid climate and rainfall is low throughout the year, but
peaks in summer, with an annual average of 330 mm.
Environmental importance of the Barwon-Darling
The Barwon–Darling corridor connects the rivers, lakes and wetlands in the northern Basin; and
then provides a connection to the southern Basin through the Lower Darling River. The river
provides refuge habitat during dry periods and travel pathways for aquatic biota between rivers,
especially for fish that are known to move long distances such as golden perch (MDBA, 2014).
There are many billabongs and lagoons along the Barwon–Darling, as well as lakes and
wetlands on the floodplains, which provide major bird refuges and breeding sites.
The Barwon–Darling is recognised for supporting populations of native fish, which are excellent
indicators of the health of rives and their catchments. It is an ecologically significant area,
featuring wetlands including the Wongalara, Woytchugga and Poopelloe lakes, the Acres
Billabong and several deflation basin wetlands (MDBA, 2016a). There is also the nationally
important wetland area Talyawalka Anabranch and Teryawynia Creek, near the southern
boundary of the Barwon–Darling region, located between Wilcannia and Menindee on the Darling
Riverine Plains.
A wide variety of ecosystems and a number of fish species are supported by the river channel
and riparian habitats. Vulnerable or endangered species such as the olive perchlet, Murray cod,
silver perch and freshwater catfish, have been recorded amongst the 15 native species of fish
known to inhabit the Barwon-Darling (NSW DPI, 2015). The Darling River Endangered Ecological
Community listing under NSW legislation acknowledges the threat posed to native fish and
aquatic invertebrates along the length of the Barwon-Darling River from Mungindi to Wentworth.
Increasing numbers of carp have had a significant impact on native fish, however there are
healthy communities of turtles, mussels, shrimp and other aquatic species. Flora species found in
the catchment include river red gum, black box, river cooba, coolibah and lignum, which have
varying levels of water dependence.
In the Sustainable Rivers Audit 2 released in 2012, the study area of the Darling River valley
included the narrow upper valley of the Barwon–Darling river system, through to the wide
floodplain regions of the mid and lower Darling River (Davies et.al. 2012). The audit reported that
the overall ecosystem health of the Darling valley was poor. The fish community had lost half of
its native species richness, and was rated poor in the lower and middle zones and moderate in
the upper zone; while the macroinvertebrates were rated poor overall. Riverine vegetation in the
region is notable for being in near-reference condition across the zones, with each being rated in
good condition. There was little evidence of the main vegetation groups being cleared or

Ecological needs of low flows in the Barwon-Darling
Page 11
damaged, however there were some modifications noted near the main river channels. The
physical form of the river system was rated in moderate condition, but there was accelerated
floodplain sedimentation in the upper zone and channel enlargements in the lower zone, since
European settlement. The overall rating of hydrology of the Darling was moderate, as flow
volumes, seasonality and variability has changed markedly in the main-stem of the river system.
History of water sharing arrangements in the Barwon-Darling
Water sharing pre 2012 Water Sharing Plan
As an early response to the impact of development (through dams, weirs and diversions through
the northern basin), the Interim Unregulated Flow Management Plan for the North West was
released in 1992 (NSW, 2012). This plan coincided with the massive algal bloom in the Barwon-
Darling in the summer of 1991 which covered over 1,000 km of the river (Donnelly et al. 1997).
The primary objective of the interim plan was to better manage unregulated flows to provide
water quality and fish passage outcomes for the Barwon-Darling (NSW, 2012). The interim plan
established: target flows at key locations along the Barwon-Darling, priorities for river health and
riparian flows, and a framework for sharing unregulated flows between irrigators.
Although the interim plan has been in place since 1992, difficulties with flow forecast across such
a large geographical area with varying antecedent conditions has limited the application of the
rules to protect flows to achieve the triggers in the plan (NSW, 2012).
The rules within the interim plan should be reviewed to ensure they can be implemented in a
robust and transparent manner, under the water sharing plan. This includes considering better
defining how periods of restrictions are applied, considering if the river operator is better placed
to make decisions on temporary restrictions, considering if new or different rules are needed
based on the latest information, and considering extending the restrictions to include A Class
licences.
It was recognised in the mid-1990s that there had been a decrease in the annual and daily
volumes of flow along the Barwon-Darling river system as a result of development in the Northern
Basin. Impacts for the Barwon-Darling included increased rates of flood recession and erosion
(related to pumping), decreases in the frequency of small flow pulses and marked changes in the
frequency of large freshes and flooding flows (Thoms et al. 1996).
A panel of independent scientists were convened to assess the environmental condition of the
Barwon-Darling between Mungindi and Menindee in 1995 and observed evidence of habitat
degradation (Thoms et al. 1996). The panel considered the degradation to be particularly severe
in the reaches between Collarenebri to Walgett and Bourke to Louth and less severe between
Louth and Wilcannia and Brewarrina and Bourke. In all cases, in-channel habitat availability and
access to important food sources was found to have declined due to hydrological changes.
As part of the scientific panel's deliberations, it was identified that water management actions
were needed to protect critical elements of low flows important for in-stream ecosystem health.
The panel considered these critical low flows to be ≤ 2,000 ML/d across the Barwon-Darling.
In response, the NSW government developed flow rules between 1998 and 2000 to address the
river health needs in the Barwon-Darling, with a principle of not having an impact on water users
exceeding 10% of their average annual diversions (NSW, 2012).

Ecological needs of low flows in the Barwon-Darling
Page 12
The Barwon-Darling environmental flow rules were based on the independent scientific panel's
assessment into the impact of tributary and Barwon-Darling development on flows and water
dependent environmental assets and ecosystem processes (Thoms et al. 1996).
The panel recommended that flows equal to or less than 10% of the river channel capacity were
essential to maintain the river environment. Estimates based on cross sectional area and flow
data indicate that this equates to flow in the 50th to 60th percentile range of without development
flows throughout the river. It was proposed to increase pumping thresholds to the 60 percentile
for B class and the 50 percentile for C class licences, thus meeting this recommendation while
preserving the distinction between these classes.
It should be noted that A Class commence to pump thresholds fall well short of the base
environmental flow (that is the 60th percentile). However, it was assumed that the effect of this
class has a comparatively negligible impact on the river system because the volume and pattern
of use of A Class licences was relatively small at this particular time (1998) and in the absence of
subsequent rule changes.
Commence to pump thresholds were finalised in 2000 when new gauges were installed and final
thresholds were agreed for different reaches. More information on the process to establish
commence to pump rules, and the rules, can be found in the Background Document to the
Barwon-Darling Water Sharing Plan (NSW, 2012).
Barwon-Darling Water Sharing Plan, 2012
The Water Sharing Plan for the Barwon-Darling Unregulated and Alluvial Water Sources
commenced on 4 October 2012. The Water Sharing Plan includes rules for protecting the
environment, water extractions, managing licence holders' water accounts and water trading in
the area. It contains the rules for the management of the surface water and groundwater sources.
The Water Sharing Plan was made under NSW law prior to the finalisation of the Basin Plan
2012 (Cth) (Basin Plan) in 2012, and was considered an interim water resource plan under
section 242 of the Water Act 2007 (Cth) (Water Act). The interim status expired in October 2017.
In September 2017 the MDBA reviewed amendments made to the water sharing plan since it
was first made in 2012 and advised the Department of Agriculture and Water Resources that,
given there had been no substantive changes since the plan commenced under NSW law, the
amended plan meet the 'no less consistent' test in the Water Act 2007 for it to be recognised as a
transitional plan.
A transitional plan is not required to be fully consistent with the Basin Plan, however NSW must
deliver the Barwon-Darling Water Resource Plan, incorporating its Basin Plan commitments, by
2019. The MDBA will assess the Water Resource Plan and make a recommendation to the
Minister on whether it should be accredited.
A State Interagency Panel, State Groundwater Panel and the Barwon-Darling Interagency
Regional Panel were involved in the development of the Water Sharing Plan. Activities in the
development of the plan included: targeted consultation in November 2010, and a public
exhibition for the draft plan (initially from 10-18 October 2011, and then extended until 18
December 2011).

Ecological needs of low flows in the Barwon-Darling
Page 13
The MDBA was consulted by NSW during the preparation of the Water Sharing Plan. The MDBA
made no comment at that time because the Basin Plan was not in effect so there was no
legislative basis on which comment could be provided. There were changes between the draft
plan and what was included the final Water Sharing Plan that were not shared publically prior to
commencement. Some of these are detailed below.
The key rule additions and/or changes between the draft and final Water Sharing Plan included:
• The final Water Sharing Plan (2012) removed the Total Daily Extraction Limits that
were proposed in the draft plan, provided no ability for the Minister to impose
restrictions on Class A Licence extractions for public interest purposes, provided
unlimited carryover of account water at the end of each water year, provided power for
the Minister to grant pumping exemptions for A and B Class licences when flows are
imminent, provided opportunity for extraction of up to 300% of access entitlements,
provided no detailed requirement for the protection of environmental water, introduced
water trading arrangements and defined the commence to pump rules (as per the
rules previously in place).
The most contentious aspect of the Water Sharing Plan was that the changes to the extraction
rules meant that there was increased opportunities to legally extract water at low flows. Other
potential implications of the rules under the Water Sharing Plan that were raised included: while
the Minister has the power to impose extraction restrictions this is a discretionary power; if
unchecked, the provisions for unlimited carryover and 300% take in any year could lead to
breaching of the Cap/SDL; and as a result of enabling trade in the region there has been a
concentration of licences.
Various submissions to the Northern Basin Review in 2016 and the advice of the Northern Basin
Advisory Panel provided commentary about the consequences of operation of the rules in the
Water Sharing Plan (MDBA, 2016b; NBAC, 2016).
Analysis of hydrological impacts
The development of water resources has modified flow regimes across the Murray-Darling Basin,
including in the Barwon-Darling and its tributaries (MDBA, 2011; Sheldon et al. 2014).
Figure 2 shows a comparison between the observed flows at the Bourke gauge and modelled
without development flows for a five year period in the 2000s (MDBA, 2016a). This example
shows the hydrological changes in flow magnitude and variability following water resource
development.

Ecological needs of low flows in the Barwon-Darling
Page 14
Figure 2: Comparison of observed and modelled without development flow data for a five year period at Bourke on the Darling River.
The impact of extraction, both in-situ and from upstream tributaries, on low flows in the Barwon-
Darling is of highest significance for the first flow after a dry period as this event is critically
important for the environment to break the dry spell. This is important to maintain habitats and
refresh pools, improve water quality, provide conditions for fish and other animals to access key
habitats and water riparian vegetation. This flow event is also important for the critical human
water needs of the downstream communities that depend on the river.
However, there is acute pressure from competing demands, as irrigators also need access to
water, under their licence rules, to support the businesses. In addition, the first flow of the year is
often in spring/summer in the Barwon-Darling which aligns with the cotton growing season.
It is because of this vying for the finite volumes of available water during low flows that rules are
required for the protection of environmental water to support the ecology and the downstream
communities of the river system, in a way that still enables irrigators to access water.
To inform water management and the planning process, hydrologic models developed by Basin
States are used to predict flow patterns under a variety of climatic conditions and policy settings.
During Basin Plan development, the MDBA used these models to predict flows for the period
1895 – 2009 under different water sharing scenarios. Two key model scenarios have been
developed; a without development scenario which represents pre-development conditions and a
baseline scenario representing water sharing arrangements as they existed as at 30 June 2009.
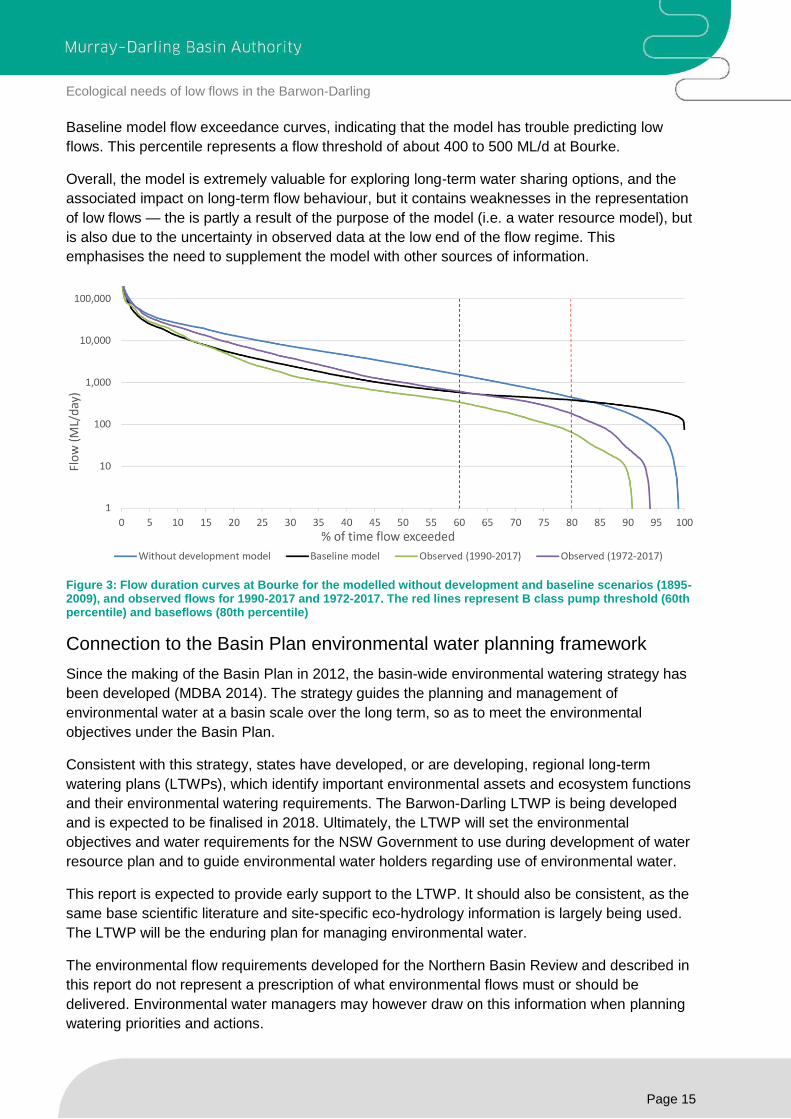
Figure 3 shows the flow duration curve at Bourke for the without development and baseline
scenario, as well as for gauged flows for the periods 1990/91 to 2016/17 and 1972/73 to 2016/17.
The 1972/73 to 2016/17 period is the full history of near-continuous observed flow data available
at Bourke. The difference between without development and the other lines shows the impact of
development on different parts of the flow regime. This shows a very evident impact of water
resource development across all elements of the flow regime, particularly for flow events of
≤ 2,000 ML/d and 80th percentile flows that is a commonly used metric to define base-flows.
Issues with the Barwon-Darling hydrology model providing an accurate representation of flow
events, especially for low flows have been documented previously (CSIRO, 2008; Bewsher,
2016). At the about the 70th percentile flow there is a divergence between the observed and the
Ecological needs of low flows in the Barwon-Darling
Page 15
Baseline model flow exceedance curves, indicating that the model has trouble predicting low
flows. This percentile represents a flow threshold of about 400 to 500 ML/d at Bourke.
Overall, the model is extremely valuable for exploring long-term water sharing options, and the
associated impact on long-term flow behaviour, but it contains weaknesses in the representation
of low flows — the is partly a result of the purpose of the model (i.e. a water resource model), but
is also due to the uncertainty in observed data at the low end of the flow regime. This
emphasises the need to supplement the model with other sources of information.
Figure 3: Flow duration curves at Bourke for the modelled without development and baseline scenarios (1895-2009), and observed flows for 1990-2017 and 1972-2017. The red lines represent B class pump threshold (60th percentile) and baseflows (80th percentile)
Connection to the Basin Plan environmental water planning framework
Since the making of the Basin Plan in 2012, the basin-wide environmental watering strategy has
been developed (MDBA 2014). The strategy guides the planning and management of
environmental water at a basin scale over the long term, so as to meet the environmental
objectives under the Basin Plan.
Consistent with this strategy, states have developed, or are developing, regional long-term
watering plans (LTWPs), which identify important environmental assets and ecosystem functions
and their environmental watering requirements. The Barwon-Darling LTWP is being developed
and is expected to be finalised in 2018. Ultimately, the LTWP will set the environmental
objectives and water requirements for the NSW Government to use during development of water
resource plan and to guide environmental water holders regarding use of environmental water.
This report is expected to provide early support to the LTWP. It should also be consistent, as the
same base scientific literature and site-specific eco-hydrology information is largely being used.
The LTWP will be the enduring plan for managing environmental water.
The environmental flow requirements developed for the Northern Basin Review and described in
this report do not represent a prescription of what environmental flows must or should be
delivered. Environmental water managers may however draw on this information when planning
watering priorities and actions.

Ecological needs of low flows in the Barwon-Darling
Page 16
Ecological importance of low flows
This report focuses on the ecological importance of low flows (base-flows and small freshes)
while also acknowledging that the other components of the flow regime (large freshes, bank-full
and overbank flows) are an important part of a rivers environmental water requirements. It is the
entire flow regime, over broad spatial and temporal scales, which influences the maintenance
and improvement of ecosystem condition for the Barwon-Darling River (Puckridge et al. 1998).
The environmental water requirements for the Northern Basin Review describe larger in-channel
freshes, bank-full and overbank flows for the Barwon-Darling (MDBA, 2016a). In addition, the
Barwon-Darling LTWP being developed by the NSW government will establish objectives and
environmental water requirements for the whole flow regime in the Barwon-Darling and for
connectivity with other catchments.
As outlined previously, for the purposes of this report low flows have been defined as being
generally ≤ 2,000 ML/d at key gauge locations across the river system. This definition is
consistent with the assessment of low flows used in the independent scientific review of the
Barwon-Darling in the mid-1990s (Thoms et al. 1996).
In addition, several sources have identified the 80th percentile flow as an ecologically significant
threshold for base-flows in the Barwon-Darling (Sheldon, 2017; Thoms et al. 1996; NSW DPI,
2015). These flows under without development conditions are: 261 ML/d at Walgett, 346 ML/d at
Brewarrina, 440 ML/d at Bourke, 401 ML/d at Louth and 361 ML/d at Wilcannia).
Figure 4 provides a range of photos that show low and no-flows at different points along the river.

Ecological needs of low flows in the Barwon-Darling
Page 17
Figure 4: Low flows on the Barwon-Darling. Clockwise from top left: u/s of Walgett gauge - 0 ML/d on 13 April 2016, Bourke weir - 647 ML/d on 19 January 2004, Louth Weir - 589 ML/d on 17 March 2006, d/s of Tilpa weir - 145 ML/d on 2 December 2004.

Ecological needs of low flows in the Barwon-Darling
Page 18
The ecological needs for low in-channel flows in the Barwon-Darling river system include:
• Maintaining populations of native fish and other aquatic biota (like mussels) by
replenishing refuge pools and maintaining aquatic habitats; providing opportunities for
movement between habitats; and supporting key ecosystem functions (including
cycling of nutrients and provision of carbon for productive food webs);
• Supporting regular breeding, recruitment and dispersal of fish and other invertebrates
with short life cycles to maintain populations and genetic diversity.
• Maintaining water quality through regular flushing of refuge pools to mitigate against
issues such as algal blooms and salinity spikes in areas prone to high salinity
groundwater inflows.
• Providing longitudinal connectivity through the Barwon-Darling river system and its
tributaries to support the ecological needs above, maintain in-channel and riparian
vegetation condition, and provide natural cues for flow responsive fish and other
aquatic biota.
In addition to the ecological outcomes, low flows also provide water for downstream communities
to ensure reliable and good quality water for critical human water needs (such as town water and
stock and domestic uses), and water to support cultural and recreational values.
Figure 5 provides a cross-section conceptual diagram of the river system with the main flow
components (no-flow, base-flows, freshes, bank-full flows and overbank flows) and the physical
features of the river identified. No flows, base-flows and small in-channel freshes are all within
scope in the definition of low flows adopted in this report. The following section provides
information on the ecological role and importance of each of these flow components.
Figure 5: An illustrative river cross-section showing flow regime components.
Base-flows are an important component of the flow regime as they maintain aquatic habitat for
fish, plants and invertebrates. Base-flows are small magnitude, long duration flow events that
support refuge pools during dry periods and contribute to nutrient dilution during wet periods or
after a flood event. The provision of these flows also enables longitudinal dispersal and provides
conditions that stimulate spawning and support the recruitment of many native fish species (Rolls
Low flow
focus No flow

Ecological needs of low flows in the Barwon-Darling
Page 19
et al. 2013). Base-flows following fish spawning can assist with the survivorship of juveniles by
facilitating increased productivity and food supply, assisting with dispersal of larvae and providing
juveniles with access to appropriate nursery habitat (NSW DPI, 2015; Stuart and Sharp, 2017).
In-channel freshes are small-to-medium flow events which inundate benches or small
anabranches, but stay in the river channel. They are relatively short in duration (i.e. a few days to
a month). These events increase longitudinal connectivity, improve water quality in previously
disconnected reaches, replenish soil water for riparian vegetation, maintain in-stream habitats,
and cycle nutrients between parts of the river channel. They also inundate snags and woody
debris—important sites for fish spawning events and macroinvertebrate assemblages (Boys and
Thoms, 2006). The increased turbidity and mixing can reduce the frequency and severity of algal
blooms by preventing the stratification of pools (Mitrovic et al. 2006). These flows occur every
year (to varying magnitudes) in the Barwon-Darling with multiple freshes a normal aspect of the
hydrology which is driven by the timing of different tributary inflows.
No flows or cease to flow (CTF) periods are a normal and important aspect of the flow regime in
the Barwon-Darling. No-flow periods allow the development of a diversity of biofilms and aquatic
plants, and periods of stress that promote resilience and can control the population of invasive
species such as carp that are not as well adapted to the highly variable flow regime of Australia's
semi-arid rivers. Studies from other catchments have shown short-term increases in the
abundance and richness of invertebrates and fish towards the start of a no-flow period (Rolls et
al. 2012; Stubbington et al. 2011; Dewson et al. 2007). However, as periods of no flow or very
low flows increase, conditions become worse as aquatic biota is forced into contracting refugia
often with reducing water quality (Rolls et al. 2012).
Rolls et al. (2012) presented a conceptual model that describes four principles for the importance
of low flows that generally apply to riverine ecosystems:
• Principle 1: Low flows control the extent of physical aquatic habitat, thereby
influencing composition and diversity of biota, trophic structure and carrying capacity;
• Principle 2: Low flows mediate changes in habitat conditions, which in turn, drive
patterns in the distribution and recruitment of biota;
• Principle 3: Low flows affect the sources and exchange of energy in riverine
ecosystems, thereby affecting ecosystem production and biotic composition; and
• Principle 4: Low flows restrict connectivity and diversity of habitat, increases the
importance of refugia, and drives multiscale patterns in biotic diversity.
Figure 6 provides this conceptual model which summaries the interaction between low flows and
ecological responses within habitats and between habitats (i.e. refuge pools). These interactions
do not operate in isolation, and many of the ecological consequences of changes to low flows are
likely to overlap and occur simultaneously, resulting in synergistic and complex effects (Rolls et
al. 2012). The ecological consequence of alterations to low flow include reduced resilience of the
aquatic community and a transition to more generalist species with reduced diversity and
abundance of species (Rolls et al. 2012).

Ecological needs of low flows in the Barwon-Darling
Page 20
Figure 6: Four principles outlining the links between low flow processes and patterns in riverine ecosystems. DO = dissolved oxygen, BOM = benthic organic matter, POM = particulate organic matter. (Taken from Rolls et al., 2012).
In-stream habitat features
The Barwon-Darling river system contains a variety of in-stream habitat types, including deep
pools, snags and benches which are all important for fish and other aquatic biota (Figure 7).
Figure 7: Examples of snags (a), pools (b) and benches (c) in the Barwon Darling River system.

Ecological needs of low flows in the Barwon-Darling
Page 21
Refuge pools
The Barwon-Darling river system naturally experiences no-flow periods where the river contracts
to a series of disconnected pools. These pools are large (and supplemented by weirs constructed
along the river), and provide refuges which are critical for the maintenance of healthy aquatic
biota (McNeil et al. 2013). Using the pools, fish and other aquatic biota can recolonise other
habitat areas once flow returns to the system.
DSITI (2015) assessed the persistence of waterholes in the Lower Balonne and Barwon-Darling
based on a combination of: analysing Landsat remote sensing imagery (since 1988) to
understand water presence at the landscape scale; and developing persistence models for
representative waterholes for more detailed modelling of different flow regime scenarios.
A finding of DSITI (2015) was that the waterholes in the Barwon-Darling river system are highly
persistent due to a combination of weir pools and very deep waterholes (some of which are
deeper than 8 metres). The modelling of three representative waterholes suggested that they
would have persistence times of more than 1,000 days which is much longer than the periods of
no-flow under both pre-development conditions and current arrangements. For example the
longest observed no flow spell for Bourke was 199 days in 2007. The exception to this was the
Tilpa reach (roughly between Louth and Tilpa) which was observed to run dry twice during the
Landsat record, after no-flow periods of 176 and 182 days at Tilpa. Knowledge gaps identified
from DSITI (2015) were changes in habitat quality during long no-flow periods and the influence
of pumping on pools.
In a parallel project, NSW DPI (2015) mapped pools and identified over 1,000 that had a depth
greater than 3.5 metres between Walgett and Wilcannia under low flow conditions (Table 1).
Roughly half the pools were above Bourke and half below. The average depth of the pools was
between 4.5 m and 5.1 m. This analysis did not distinguish between natural and weir pools.
Table 1: Number, surface area, depth and volume of refuge pools recorded between Walgett and Wilcannia (source: NSW DPI 2015)
Zone Zone Length (km’s)
Total number
Total surface area (Ha)
Mean depth (m)
Average Volume (ML)
Walgett - Brewarrina
279 297 51.5 5.1 8.8
Brewarrina - Bourke
207 216 55.9 4.5 11.7
Bourke - Tilpa 355 374 157 4.7 19.7
Tilpa - Wilcannia 275 182 65.1 4.5 16.1
The zone between Bourke and Tilpa, had the greatest number of refuge pools overall and also
the greatest total surface area (Table 1). Interestingly this zone also had the greatest number of
snags (Table 2). The zone between Walgett and Brewarrina also contained a large number of
refuge pools, however these were relatively small pools, with pools in this zone containing the
lowest total surface area and average volume.
Flow events across gauges at Walgett and downstream will enhance local connectivity and water
quality for the 1,116 refuge pools identified by NSW DPI (2015) within these sections of river.

Ecological needs of low flows in the Barwon-Darling
Page 22
Snags
Snags are important habitat in the Barwon-Darling, providing shelter and spawning sites for
several native fish species (O'Connor, 1992; Lake, 1995; Crook and Robertson, 1999; NSW DPI,
2007; Koehn and Nichol, 2014). There is a strong association between snags and fish species
such as golden perch and Murray cod in the Barwon-Darling river system (Boys, 2011). As snags
break down they provide food for benthic algae, invertebrates and microorganisms that form a
large part of the food web for a range of aquatic species (Treadwell, 1999; NSW DPI, 2007).
NSW DPI (2015) mapped snags and identified around 48,000 snags between Walgett and
Wilcannia. As part of their analysis, it was found that there was a lower snag loading (expressed
as the number of snags/km) in the zone between Tilpa and Wilcannia. Overall the snag loading
across the 4 zones (Walgett-Brewarrina, Brewarrina – Bourke, Bourke - Tilpa and Tilpa –
Wilcannia) was found to be 43 snags/km (Table 2). This falls just below the suggested ideal
loading for this type of river of 47 snags per kilometre (Townsend, 2016), suggesting that this
important aquatic habitat feature is functioning well in the Barwon-Darling. But further analysis of
the data showed a severe lack of the complex snags that fish prefer. This type of wood only has
a loading of 17 snags per kilometre, falling well below the ideal number.
Table 2: Number and distribution of snags recorded between Walgett and Wilcannia
Zone Zone length (km’s)
Total number
Loading/Distribution (snags/km)
Proportion of snags located outside of weir pools
Walgett - Brewarrina
279 12,566 45 63%
Brewarrina - Bourke
207 9,324 45 53%
Bourke - Tilpa 355 15,999 45 59%
Tilpa - Wilcannia 275 10,450 38 65%
NSW DPI (2015) also analysed the relationship between snag inundation and flow in four zones.
To enhance the accuracy of the analysis, the flow/inundation relationships were based on the
29,000 snags (approximately 60% of all snags) located outside of weir pools (Figure 8). Of the
snags located outside of weir pools between Walgett and Wilcannia, a between 20 and 45%
remain inundated under no and low flow conditions. Given the large number of refuge pools
identified between Walgett and Wilcannia (1,116) it is likely that these snags are predominantly
located in refuge pools. Snags located in refuge pools and the lower sections of the channel
provide native fish with access to important habitat during dry periods.

Ecological needs of low flows in the Barwon-Darling
Page 23
Figure 8: Relationship between snag inundation and flow (flow components represented by boxes moving left to right: small pulse, large pulse and bank-full).
Flows of 500 ML/d provide limited additional inundation of snags compared to no flow conditions
but do enhance connectivity so fish can move between pools. At a threshold of 2,000 ML/d, there
is about a 5% increase in snags inundated (as compared to no flow conditions).
While there have been few studies looking at the direct effect of in-channel flows on
macroinvertebrates in the Barwon-Darling, Sheldon and Walker (1998) found the diversity and
abundance of macroinvertebrates outside of weir pools was highest on snag habitats, with the
highest diversity and abundance in weir pools occurring in submerged vegetation. There is also
evidence from other dryland rivers in Australia that an increase in the abundance of
macroinvertebrates is linked to flow pulses (Marshall et al. 2006). Increases in
macroinvertebrates provides an important food source for fish and other higher order animals.
Benches
In-channel benches are relatively flat sections within the main channel that accumulate debris
(such as leaf litter) which builds up over time and provide a source of carbon to the river when
the bench is inundated. Benches also provide different and increased habitat and hydrodynamic
diversity for fish and other aquatic animals. Benches play an important role in primary production
which is the driver for the entire aquatic food web (Southwell, 2008).
As part of their work, NSW DPI (2015) analysed the relationship between bench inundation and
flow for the approximately 600 benches (81% of all benches) located outside of weir pools
(Figure 9). The Brewarrina to Bourke, and the Tilpa to Wilcannia zones contain the largest area
of benches with inundation of benches in these two zones commencing at much lower flows. In
these zones, flows of 500 ML/d inundate between 5 -20 % of the benches outside of weir pools.

Ecological needs of low flows in the Barwon-Darling
Page 24
For a flow of 2,000 ML/d inundation of benches increases to between 10 - 60 % of the benches
outside of weir pools.
Figure 9: Relationship between bench inundation and flow (flow components represented by boxes moving left to right: small pulse, large pulse and bankfull)
Fish community of the Barwon-Darling
The extensive range of in-channel and floodplain habitats in the Barwon–Darling river system
supports a diverse assemblage of 15 native fish species, as well as other important native
aquatic fauna. NSW DPI (2015) report that bony bream appeared to be the most abundant native
species between Walgett and Wilcannia with spangled perch and golden perch also common.
Other species known to occur in the river zones between Walgett and Wilcannia, include carp
gudgeon, Murray-Darling rainbowfish (predominantly in lower end of the zone between Walgett to
Brewarrina), Murray cod (predominantly in the zone between Brewarrina and Bourke and
particularly near Barwon-Darling junction), and Hyrtl’s tandan (predominantly in the zone
between Bourke and Tilpa). While rare within the Walgett to Wilcannia sections of the system,
unspecked hardyhead has an isolated and patchy distribution upstream of Bourke.
In addition, a number of fish species expected to be found between Walgett and Wilcannia are
listed as threatened under Commonwealth or NSW legislation (Table 3).
The fish community status in the NSW section of the Northern Basin is shown in Figure 10.
Recent analysis of freshwater fish research data for NSW (completed as part of the Fish
Community Status Project) has consolidated data collected over twenty years of biological
surveys. This data has been combined with spatial distribution models to provide a delineation
Bourke – Tilpa (Darling River D/S of Weir 19a) Tilpa – Wilcannia (Darling River at Tilpa)

Ecological needs of low flows in the Barwon-Darling
Page 25
and spatial recognition of the condition of fish communities and threatened species across NSW
(NSW DPI, 2016). The overall Fish Community Status was derived from the three condition
indicators of Expectedness, Nativeness and Recruitment, with outcomes partitioned into five
equal bands to rate the condition of the fish community; Very Good, Good, Moderate, Poor, or
Very Poor. As can be seen in Figure 10 the fish community status for the Barwon-Darling is
generally moderate to good. Figure 10 also identifies the carp hotspots for recruitment.
Table 3: Threatened fish species expected to be found in the Barwon-Darling system
Species Status Legislation
Purple spotted gudgeon Endangered NSW Fisheries Management Act 1994
Freshwater catfish of the Murray–Darling Basin
Endangered NSW Fisheries Management Act 1994
Western population of olive perchlet Endangered NSW Fisheries Management Act 1994
Silver perch Vulnerable Critically endangered
NSW Fisheries Management Act 1994 Environment Protection and Biodiversity Conservation Act 1999
Murray cod Vulnerable Environment Protection and Biodiversity Conservation Act 1999
Figure 10: Fish community status for the NSW section of the Northern Basin, highlighting condition of fish communities and carp hotspots.

Ecological needs of low flows in the Barwon-Darling
Page 26
Golden Perch
The Barwon-Darling River has been shown to be a significant source for Basin populations of
golden perch (Zampatti et al. 2015; Koster et al. 2017; Thiem et al. 2017). Research from the
past five years as described in Stuart and Sharp (2017) has rewritten the conceptual model for
the life-history of golden perch in the Northern Basin. This revised conceptual model highlights
that previous life-history models underestimated the distance which spawned golden perch
larvae drift downstream. This new understanding is based on a detailed review of age
observations of golden perch and monitoring of larvae drifting at Walgett in late 2016 following a
significant spawning event. Analysis of this data suggests that spawning had taken place in the
Barwon or even Macintyre system with larvae drifting up to hundreds of kilometres downstream.
The new research by Stuart and Sharp (2017) is developing improved flow management plans
for golden perch, which is demonstrating the importance of protecting flow events in the northern
Basin through to the nursery habitat of the Menindee Lakes to support strong age classes
dispersing into the southern connected basin and back up into the northern Basin from the
Menindee Lakes.
The new science by Stuart and Sharp (2017) has not been finalised and is not available at the
time of this reports publication. However, an environmental flow requirement that forms just one
aspect of the plan has been included in this report. This is a flow of 3,000 ML/d for at least
20 days at Mungindi to support regular local spawning cues, larval drift, and in-channel
development of juvenile fish. This flow requirement would drown-out Mungindi weir (2,500 ML/d)
to improve fish passage in the upper Barwon River.
It is important to note that this requirement forms just on part of the flow plan for golden perch.
For the greatest outcomes substantial flows (beyond the low flow focus of this report) are needed
to pass through to the Menindee Lakes and beyond. It is recognised that a series of flows over
multiple years will be needed to meet the spawning, dispersal, nursery recruitment, and then
juvenile dispersal of golden perch to achieve the system scale population recovery.
Fish movement opportunities
Flows that elicit flow responsive fish to move between habitats and/or complete critical life cycle
stages are an important part of the flow regime. Recent research on fish movements in the
nearby Moonie River has demonstrated that water level, temperature and the first post-winter
flow are important cues for the movement of golden perch and freshwater catfish (Marshall et al.
2016). The research found that fish responded to changes in river height of over 2 metres from
commence to flow, and moved when water temperature was greater than 15 degrees Celsius
(Marshall et al. 2016).
An average flow velocity of 0.3 metres per second is also thought to be a useful threshold for
biota that need flowing water for lifecycle responses, such as golden perch (Passy, 2001; Mallen-
Cooper and Zampatti, 2015).
NSW Office of Environment and Heritage is currently developing the Barwon-Darling LTWP
which will provide the basis for the regional environmental water requirements to inform water
resource planning. For this work, important flow bands for gauges across the river system are
being informed (partially) by the flow heights needed for fish movement, with the following
relationships identified:

Ecological needs of low flows in the Barwon-Darling
Page 27
• A rise of ≥ 0.3 m above cease to flow (CTF) to provide connectivity for small to
moderate sized fish (Fairfull and Witheridge 2003).
• A rise of ≥ 0.5 m above CTF to provide connectivity for larger bodied fish (Fairfull and
Witheridge 2003).
• A 2 m rise and/or 0.3-0.4 m/s average velocity for flow dependent fish to spawn and
move (Marshall et al. 2016; Mallen-Cooper and Zampatti, 2015).
Table 4 provides the relationships between these heights and the corresponding discharge
volume for a number of gauge locations. The 0.3 and 0.5 m rise from CTF is considered more
relevant for the low flows being assessed here, however low flow events at the upper end of the
2000 ML/d threshold can provide for the 2 m rise (and/or >0.3 m/s velocity) at some of the gauge
sites.
Table 4: Relationship between river heights considered sufficient for fish to move and discharge rate (ML/d) for a number a gauge locations along the Barwon-Darling river system.
Fish movement metric Walgett Bourke d/s 19a Louth Tilpa Wilcannia
0.3 m above CTF 68 972 155 328 75 71
0.5 m above CTF 146 2,490 359 799 189 195
The larger of 2 m above CTF or >0.3 m/s average velocity
1,690 15,000 7,280 5,940 2,580 3,110
Figure 11 shows a flow event between January and April 2015 for Bourke and Wilcannia that was
preceded by an extended no flow period (44 and 139 days). This flow event maintained a flow of
500 ML/d for 22 days. This flow event provided a 1.86 and 2.1 metre rise at the downstream of
Weir 19a gauge and Wilcannia respectively and would have provided connectivity for fish to
move, especially important after such a long period between flows. The downstream of Weir 19a
gauge was used to represent change in river height outside of the influence of the Bourke weir
pool (~50 km pool) where fish movement is less of an issue as compared to the free flowing parts
of the river weir pool.
Another example, from a smaller flow event in 2007 (as shown in Figure 13) also provided at
least a 0.5 m rise in the river, showing that flow events of that maintain a threshold of 500 ML/d
for 11-23 days at Bourke will generally provide the desired scale of fish movement opportunity for
much of the Barwon-Darling river system.
However, these smaller in-channel pulses would not provide the large scale fish movement
opportunities (1000s of km) due to the influence of the weirs along the length of the Barwon-
Darling River which need higher flows to drown out and provide fish passage. Figure 12 provides
the location of the 15 major fish passage barriers along the Barwon-Darling River with the
estimated drown out values for each structure.

Ecological needs of low flows in the Barwon-Darling
Page 28
Figure 11: Flow event in 2015 showing the scale of connectivity between Bourke and Wilcannia and height rise the events provided to support fish movement opportunities.
Figure 12: Location of the 15 major fish passage barriers along the Barwon-Darling River, with estimated drown out flow rates for fish passage (taken from Cooney (1994).

Ecological needs of low flows in the Barwon-Darling
Page 29
Longitudinal Connectivity
Longitudinal connectivity is essential for a healthy ecosystem and to support the populations of
native fish and other aquatic biota that live in the Barwon-Darling river system.
Regular connectivity events provide a range of ecological functions, including:
• supporting movement opportunities for fish to access habitats and supporting critical
life-cycle stages (such as cues for breeding for some species, flow for drifting larvae,
base flows to increase survivorship and reduce predation, and migration
opportunities);
• replenishing and freshening refuge pools to maintain adequate water quality;
• supporting and maintaining macroinvertebrate communities;
• maintaining riparian vegetation and water for downstream communities; and
• supporting key ecosystem functions like increased carbon cycling through wetting and
drying of in-channel bars and benches.
In the Barwon-Darling river system, connectivity is dependent on the size of the flow and
antecedent conditions. Smaller in-channel flow events that move partway through the river
provide benefits for the upstream reaches. However, regular connectivity through to Wilcannia
and Menindee Lakes is needed to support the environmental water needs across the river
system. Connectivity can occur from a single pulse but is more regularly associated with a series
of pulses down the river (see example from 2007 in Figure 13 below).
The MDBA has undertaken analysis of observed flow events with a magnitude of less than
3,000 ML/d at Bourke (between 1990-01 and 2016-17) to better understand the types of flows
that provide longitudinal connectivity. This analysis looked at over 50 individual flow events with a
minimum and maximum threshold of 500 and 3,000 ML/d at Bourke. It was found that most
events did provide some level of longitudinal connectivity between Bourke and Wilcannia.
The exception to this was during dry periods when small in-channel flow events that did meet the
500 ML/d threshold at Bourke did not travel downstream and reach Wilcannia. All of these events
were above 500 ML/d for a maximum of 11 days at Bourke, indicating that a longer duration is
necessary to ensure connectivity through to Wilcannia.
To illustrate this, Figure 13 shows a series of small in-channel flow events between May and
November 2007 for Bourke and Wilcannia (the events followed a 198 day no-flow spell at
Bourke). The three events maintained a flow of 500 ML/d or greater for 11, 13 and 23 days,
respectively at Bourke. The first event peaked at 1,600 ML/d and contained about 16 GL but did
not reach Wilcannia. The flow did however result in over a 1 m rise downstream at the Weir 19a
gauge and flow at the Tilpa gauge (located downstream of the Tilpa weir pool). The second and
third events peaked at 800 ML/d and 1,100 ML/d and contained about 22 GL each. These events
did maintain flow between Bourke and Wilcannia for extended periods.

Ecological needs of low flows in the Barwon-Darling
Page 30
Figure 13: Series of flow events in 2007 showing the scale of connectivity between Bourke and Wilcannia and the height rise the events provided to support fish movement opportunities.
These flows would have been sufficient to refill and enhance water quality (and supress potential
algal blooms - see algal bloom section) in the more than 500 large refuge pools between Bourke
and Wilcannia. The flows would have also provided local connectivity for fish movement between
habitats for the 630 km of river between Bourke and Wilcannia. Figure 13 shows that all of the
pulses provided at least a 0.5 m rise above CTF (the black dotted line), which has been identified
as an adequate depth for small and large bodied fish to move between habitats (see section on
fish movement below). At these flow rates there would not have been connectivity between the
weirs which need higher flows to drown-out and provide fish passage (see Figure 12).
The environmental demands and priorities for active management of Commonwealth
environmental water in the Barwon-Darling for 2016-17, described the need for a low/base-flow
pulse to replenish waterholes and improve water quality along the upper and mid-Darling (CEWO
2016). The specific requirement describes the delivery of 10-20 GL of tributary inflow based on a
trigger of at least 40 days of no-flow at Bourke or 60 days at Wilcannia. This volume was based
on observation of past flow pulses by the CEWO from the Gwydir system in November 2013
(inflow of 11 GL) and October 2014 (inflow of 13.5 GL).
Both of these CEWO actions occurred during very dry periods and, as such, did not provide
connectivity through to Wilcannia (also did not meet 500 ML/d at Bourke). The Commonwealth
environmental water was used to target fish outcomes in the Gwydir and provide connectivity
between the Gwydir and Barwon systems. In addition to providing environmental benefits, the
inflows triggered irrigation access for A and B class licences in zones of the Barwon River. If this
water was protected, the flows could have moved further down the river. More detail on both of
these CEWO watering actions is provided in case studies at Appendix B.

Ecological needs of low flows in the Barwon-Darling
Page 31
The volume of water required to provide longitudinal connectivity along the length of the Barwon-
Darling River is dependent on a range of factors with the dryness of the preceding period, source
of tributary inflow and level of take by consumptive users being primary drivers. For a very high
likelihood of system scale connectivity, a volume of at least 20 GL at Bourke is required during a
dry period. Flow events of this volume would generally take the shape of an event with a
magnitude of 500 ML/d for a duration of at least 14 days with 20 days providing more certainty.
Water sharing arrangements and rules that can protect environmental water would enhance the
probability of water passing further though the river.
Method for assessing ecological needs for low flows
The peer reviewed 'umbrella environmental asset' (UEA) approach as described by Swirepik et
al. (2015) has been used for this assessment of environmental water requirements for low flows
in the Barwon-Darling river system. This is the same approach used for the environmental water
requirements that informed the Basin Plan and Northern Basin Review (MDBA, 2016a).
Imperfect knowledge of flow-ecology relationships is a universal challenge in determining the
water needs of aquatic ecosystems (Poff and Zimmerman, 2010). It is generally not possible to
explicitly know and understand the water requirements of all ecosystem components in large
river systems, such as the Barwon-Darling river system. The disjunct between the timeframes for
large-scale ecological investigations (decades) and the timeframes for policy development and
implementation (years) creates the need to draw upon the existing and uneven knowledge base
to inform the policy process. The umbrella environmental asset approach enables the integration
of existing information for key sites, which are then used to represent environmental water
requirements across larger areas.
The UEA approach includes the following main steps:
• Selection of the environmental asset
• Identification of the ecological values and targets
• Establish environmental flow requirements at flow indicator gauges to represent flow
components that are linked to the ecological values and targets for the asset.
Selection of the umbrella environmental asset
The following five principles were used to guide the selection of UEAs:
• High ecological value. The Basin Plan lists five criteria for identifying environmental
assets, and four criteria for identifying ecosystem functions, which indicate a site has
high ecological value. These criteria are listed in Schedule 8 of the Basin Plan.
• Representative of water requirements. The water requirements are assumed to
represent the water needs of a broader reach of river or an entire river valley.
• Spatially representative. The hydrology and geomorphic character is to be
representative of river valleys, rather than sites of unusual hydrology or character.
• Significant flow alteration. Have experience significant departures from without
development flows.
• Availability of data. Hydrological and ecological information needs to be sufficient to
allow a detailed assessment of environmental water requirements.
Ecological needs of low flows in the Barwon-Darling
Page 32
By applying these principles, the Barwon–Darling River upstream of Menindee Lakes to Mungindi
has been selected as the UEA. This is the same as original environmental water requirements
assessment of the Barwon–Darling (MDBA 2012), and for the assessment for the Northern Basin
review (MDBA 2016).
This recognises the importance of the entire Barwon-Darling river system as the connection
between northern Basin catchments and the southern Basin. It also recognises the relatively
consistent level of eco-hydrology information through the river system, especially between
Walgett and Wilcannia where new habitat information (snags, benches, refuge pools) was
collected for the Northern Basin Review.
Identify ecological values and targets
The ecological values of the Barwon–Darling river system UEA include species that are listed for
protection under Commonwealth and NSW legislation, persistent refuge pools for fish and other
aquatic biota, connection pathways for fish to move to other parts of the Murray-Darling Basin,
and a large number of floodplain habitats providing foraging areas for migratory birds listed under
international agreements, and wetlands listed on the Directory of Important Wetlands in Australia.
The ecological targets for the Barwon–Darling river system UEA have been retained from the
Northern Basin Review. These targets focus on providing a flow regime which:
• supports recruitment opportunities for a range of native aquatic species (e.g. fish,
frogs, turtles, invertebrates),
• supports the habitat requirements of waterbirds.
• ensures the current extent of native vegetation of the riparian, floodplain and wetland
communities is sustained in a healthy, dynamic and resilient condition, and
• supports hydrological connectivity between habitats, along the river (longitudinal) and
between the river and its floodplain (lateral).
Environmental Flow Requirements
Environmental flow requirements describe an ecologically important flow event and the frequency
that it is required. This includes the following four hydrological metrics:
• magnitude: the minimum flow threshold in megalitres per day;
• duration: the minimum number of days the flow needs to be above the flow threshold;
• timing: the months of the year where the specified event is sought; and
• frequency: the percentage of years in which there is at least one event of the specified
magnitude, duration and timing occurs (e.g. 90% of years).
In addition to the frequency, a threshold of concern has also been set which describes the period
between an event (spell) considered likely to result in ecological risk.
The hydrological metrics that were most challenging to select was the frequency and threshold of
concern for spells between events. It is likely that there are thresholds for many plants and
animals beyond which their resilience is diminished and their survival or ability to reproduce is
lost. However, the precise details of those thresholds are mostly unknown. As a result of these
uncertainties, the frequency is given as a range from a low uncertainty of achieving an ecological
target to a high uncertainty of achieving the target.

Ecological needs of low flows in the Barwon-Darling
Page 33
The environmental flow requirements within this document represent a synthesis of existing
information and literature documenting the environmental water needs for low flows in the
Barwon-Darling River. The environmental flow requirements are expressed in the same format as
the site-specific flow indicators developed for the Northern Basin Review i.e. flow magnitude,
duration, timing and frequency. The term environmental flow requirement has been used in this
report to differentiate this work from the site-specific flow indicators developed previously as part
of the Northern Basin Review.
Thirteen environmental flow requirements have been described for different points along the
river, including at Walgett, Brewarrina, Bourke, Louth and Wilcannia (Table 5).
This approach provides spatial coverage of environmental water needs along the length of the
river in recognition of the reach based differences in hydrology, geomorphology and ecology.
Furthermore, irrigation extractions occur along the entire length of the Barwon River and in the
upper sections of the Darling River around Bourke and hence understanding of environmental
water needs for all reaches is important from a management perspective given they experience
varying levels of flow alteration due to consumptive use. Description of flow requirements at
Wilcannia is considered especially important as the last gauge on the Darling River and hence it
represents the full impact of development and can be used to assess longitudinal connectivity for
the entire river system.
Table 5 provides reference to the source literature for the environmental flow requirements
including: ecological rationale, event shape (magnitude, duration and seasonal timing), and the
target frequency. The flow magnitude, duration and timing for each of the 13 environmental flow
requirements have been taken directly from the source literature. More information about the
science behind these can be found in the source literature references.
The target frequency and threshold of concern are based on a combination of specification of the
requirements in the literature, a comparison of the frequency and spells under without
development modelling and expert advice. This ensures that the requirements are robust and
can be used to compare the ecological outcomes and consequences of different flow regimes.
It should be noted that the threshold of concern is not an ecological tipping point. Very little is
known about thresholds for ecological resilience in the Barwon-Darling river system (i.e. any step
changes). However, the threshold of concern provides an indicative duration between events
considered to be very long, outside of without development flow regime spells, and likely to result
in ecological stress for comparison between flow regimes.
The threshold of concern information base includes:
• For maintaining native fish population environmental flow requirements, a threshold of
1 year (or the maximum spell between events in the without development model) has
been used. This takes into account the target frequency to have an event close to
annually (8-9 years out of ten), and advice from NSW fisheries that it is desirable to
have annual in-channel pulses to maintain flow variability, habitat access and
productivity to support fish populations.
• For enhancing native fish spawning and recruitment environmental flow requirements
a threshold of 2 years has been used. This takes into account the target frequency to
have an event in 7-8 year in ten, and advice from NSW fisheries that it is desirable for

Ecological needs of low flows in the Barwon-Darling
Page 34
flows that facilitate small bodied fish to breed to occur multiple times within their life-
span (which is generally between 3-5 years).
• The regular breeding opportunities for Golden perch environmental flow requirement
uses a threshold of 4 years. This takes into account the target frequency of 6-7 years
in ten, and a threshold used by the Queensland Government for the Moonie and
Lower Balonne catchments for considering risks during the development of water
resource plans which considers a spell of more than 4 years between in-channel
pulses for golden perch breeding as a moderate risk for the survival of the
populations.
• The 2000 ML/d for 5 days environmental flow requirement at Wilcannia uses a 2 year
threshold which takes into account the target frequency of 8-9 years in ten.
• The algal suppression threshold environmental flow requirements have been set at
150 days which represents the period between October and March. It is desirable for
regular flows to meet this threshold over these months to mitigate against algal
blooms and to have at least one event each year.
The environmental flow requirements have been compared to the modelled without development
frequency to ensure that they are representative of the typical hydrology of the Barwon–Darling
river system. This check was a practice retained from the original assessment (MDBA 2012) to
gives confidence that the proposed environmental flow requirements are reasonable. In addition,
given issues with hydrological model representation of low flows, observed flows from the past 27
years (1990 to 2017) have also been analysed as a better indicator of performance under
existing water sharing arrangements than the modelled baseline scenario.
For the results section, the environmental flow requirements that specify multiple events within
the requirement (i.e. 1 to 3 flow events within a year) have used the minimum number of events
specified (i.e. 1 event).
The NSW Office of Environment and Heritage is developing the LTWP for the Barwon-Darling
river system which will set the environmental objectives and water requirements used during the
NSW Government's development of the water resource plan and for guiding decisions by
environmental water holders regarding use of environmental water.
It is expected that the requirements described in the LTWP will be consistent with those
described in this document as the same scientific literature base and site-specific eco-hydrology
information is largely being used. The LTWP will be the enduring plan for managing
environmental water in the Barwon-Darling river system at the regional scale. The environmental
water requirements in the LTWP will supersede the requirements in this report once available.

Ecological needs of low flows in the Barwon-Darling
Page 35
Table 5: Low flow environmental flow requirements for the Barwon-Darling River describing the information source, ecological rationale, flow event magnitude, duration, timing and target frequency, and the threshold of concern for spells between events.
Ecological rationale Magnitude Duration (days)
Timing Target frequency (% of years with an event)
Threshold of concern for spells b/w events (days)
CEWO Northern Unregulated Rivers Portfolio Management Plan (CEWO, 2017)
Maintain native fish populations and in-channel ecosystem processes such as refuge pools and connectivity down the river. #set to match the without development maximum spell between events.
500 ML/d @ Walgett
7-20 Aug-May (1 to 3 events)
80-90 476#
500 ML/d @ Bourke
7-20 Aug-May (1 to 2 events)
80-90 365
350 ML/d @ Louth
7-14 Aug-May (1 to 2 events)
80-90 365
Enhance native fish spawning, and recruitment for reaches in the Barwon-Darling(especially small bodied fish)
500 ML/d @ Bourke
50 Sep-April 70-80 730
1,500 ML/d @ Bourke
5 Sep-April 70-80 730
Golden Perch small pulse requirements (Stuart and Sharp, 2017)
Regular opportunity for golden perch to migrate and spawn in the Barwon-Darling and Border Rivers, with larval development in- channel and downstream transport. The report specifies Mungindi but Brewarrina has been used represent flow downstream of an area of major consumptive use. The report describes other flows requirements, including large scale breeding (not included here).
3,000 ML/d @ Brewarrina
20 Any time (ideally when temp is above 18 degrees)
60-70 1460
Algal suppression/connectivity flow - Interim Northwest Unregulated Flow Plan - associated with the B-D water sharing plan (NSW, 2012)
Flow pulse to the end of system during the hotter months to mitigate against stratification of pools and the development of algal blooms. Management target where access to unregulated flows can be restricted to achieve the event, unless this flow occurred within the preceding months.
2,000 ML/d @ Wilcannia
5 Oct-April 80-90 730
Algal suppression thresholds (Mitrovic et al., 2006)
Critical discharge to suppress stratification of pools and Anabaena circinalis (toxic blue-green algae) growth during the hotter months of the year. *would indicate there has not been an algal bloom mitigation flow between October to March.
510 ML/d @ Brewarrina
1 15 Oct-15 March
100 150*
450 ML/d @ Bourke
1 15 Oct-15 March
100 150*
350 ML/d @ Wilcannia
1 15 Oct-15 March
100 150*

Ecological needs of low flows in the Barwon-Darling
Page 36
Results
Environmental Flow Requirement frequency
Table 6 presents the frequency results (% of years with a successful event) for the environmental
flow requirements for the modelled without development scenario and for observed flows
between 1990-91 and 2016-17.
The results show that the target frequency for all environmental flow requirement is achieved
under the without development scenario. By comparison, 7 out of the 13 requirements meet the
target when assessed against observed flows. Environmental flow requirements met are
associated with the maintenance of fish populations and the small 1,500 ML/d for 5 days fresh at
Bourke to enhance native fish spawning opportunities. One requirement of 3,000 ML/d for 20
days at Brewarrina for regular golden perch breeding in the Barwon River met the high
uncertainty but not the low uncertainty target, indicating an increased level of risk.
Six of the requirements did not meet the high uncertainty frequency target based on analysis of
observed flows.
The three algal suppression flow threshold requirements at Brewarrina, Bourke and Wilcannia did
not meet the target, indicating that there was at least one year between 1990 to 2017 where the
flow never met the threshold to mitigate against blue green algae risk for the high risk October to
March period (when this occurred is included in the spells results in Appendix C).
The 500 ML/d for 50 days at Bourke requirement which aims to provide conditions for the
successful recruitment of short lived fish (amongst other outcomes) also did not meet the target
frequency. This flow event had the most impact from water resource development, being
achieved close to annually under without development conditions but only for 63% of years under
the observed flows. This is an important result as the longer duration is expected to be critical for
successful recruitment of native fish species with lifespans less than 3-5 years.
The second largest threshold requirement (2,000 ML/d for 5 days at Wilcannia) was the second
most impacted, achieving 100% under without development but 78% for the observed period.
This event represents a small in-channel flow event at the end of system to provide a range of
outcomes including pool freshening and mixing, water for riparian vegetation and downstream
communities, and opportunities for fish to access habitats and breed.
Table 6: Frequency of years with a successful environmental flow requirement event for the without development model and observed flows between 1990-01 and 2016-17.
Location Environmental Flow Requirement
Frequency of Years with an Event (%)
WOD Observed
HU LU 1895 -
2009
1990 -
2017
Walgett 500 ML/d (7 days) Aug to May 100 96 80 90
500 ML/d (20 days) Aug to May 99 96 80 90

Ecological needs of low flows in the Barwon-Darling
Page 37
Green: meets low uncertainty target; Yellow: meets high uncertainty target; Apricot: does not
meet target. Frequency calculated using eFlow predictor (eWater software)
Environmental Flow requirement spells between events
Table 7 presents the average number of events per year, maximum spell between events, and
the number of spells that are longer than the threshold of concern for the environmental flow
requirements.
The average number of events show mixed performance with some meeting the target numbers
of events (where specified) and having relatively small differences between without development
conditions and observed flows. In contrast, other flow requirements do not achieve the target
when assessed against observed flows and/or show marked change in the number of events
compared to the without development scenario.
The events that are specified as ideally having more than one event in the year (see Table 5)
generally achieve the desired number of events per year on average, except for the flow events
specified by CEWO with duration expressed as a range. For the CEWO specified flow
requirements where duration is expressed as a range the number of events exceeds the without
development number of events for flow events at the upper end of the duration range. The events
that show the most difference between the two scenarios are the larger freshes (3,000 ML/d for
20 days at Brewarrina and 2,000 ML/d for 5 days at Wilcannia). Mixed performance for number of
events against the metrics under observed conditions is consistent with the findings from the
frequency assessment.
Under without development conditions, no thresholds of concern are exceeded. In contrast,
observed flows analysis illustrates that the maximum spell between events show large changes
for all of the environmental flow requirements with most maximum spells approximately doubling
in length and being longer than the threshold of concern. The number of spells that are longer
Brewarrina 3000 ML/d (20 days) any time of the year 97 63 60 70
510 ML/d (1 day) Oct to March 100 93 100 100
Bourke 500 ML/d (7 days) Aug to May 100 100 80 90
500 ML/d (20 days) Aug to May 100 93 80 90
500 ML/d (50 days) Sep to April 97 63 70 80
1500 ML/d (5 days) Sep to April 100 85 70 80
450 ML/d (1 days) - Oct to March 100 89 100 100
Louth 350 ML/d (7 days) Aug to May 100 100 80 90
350 ML/d (14 days) Aug to May 100 96 80 90
Wilcannia 2000 ML/d (5 days) any time of the year 100 78 80 90
350 ML/d (1 days) any time of the year 100 89 100 100

Ecological needs of low flows in the Barwon-Darling
Page 38
than the threshold of concern is expected to impact on the maintenance of native fish populations
in the Barwon-Darling and increase risks for water quality issues during extended dry periods.
The very long maximum periods between low flow environmental water requirements and their
marked departure from without development conditions combined with the number of thresholds
of concern that have been breached indicates risks to ecological needs as a result of extended
dry periods. There is a need to consider management options that can reduce the length of the
longest low to no-flow spells.
The 1,500 ML/d for 5 days at Bourke and the 3,000 ML/d for 20 days at Brewarrina are the two
requirements that perform well against the threshold of concern. This contrasts with the
frequency assessment for the Brewarrina requirement whereby the target is not met. The
3000 ML/d for 20 days at Brewarrina threshold has been set at 4 years which aligns with a
threshold set for golden perch spawning opportunities for the Northern Basin Review (MDBA,
2016a). This ensures a number of spawning opportunities within the 15 year average life-span of
golden perch in the northern basin (Stuart and Sharpe, 2017).
The distribution of dry spells for 1990 to 2017 for each of the indicator gauges is presented in
Appendix 3. One interesting result is the 2,000 ML/d for 5 days at Wilcannia environmental flow
indicator which was not met for 3.1 years between 2013 and 2016. This compares to the
maximum spell of 2.4 years at the height of the Millennium drought. This finding is concerning as
this flow best represents the connectivity needs of the entire river system as it is represents a
small in-channel fresh at the end of the Barwon-Darling river system.
Table 7: Average number of events per year, maximum spell between events and number of spells longer than the threshold of concern for the environmental flow requirements
Location Environmental Flow
Requirement
Average
number of
events per
year (# of
events)
Maximum Spell
between events
(days)
Number of spells longer
than the threshold of
concern (# of spells)
WOD Obs WOD Obs WOD Obs
1895 -
2009
1990 -
2016
1895 -
2009
1990 -
2016
1895 -
2009
1990 -
2016
Walgett 500 ML/d (7 days) Aug to
May
3 3.1 278 531 0 2
500 ML/d (20 days) Aug to
May
2.3 1.8 476 633 0 4
Brewarrina 3000 ML/d (20 days) any
time of the year
Not
available
Not
available
720 1239 0 0
510 ML/d (1 day) Oct to
March
10 153 0 2

Ecological needs of low flows in the Barwon-Darling
Page 39
Bourke 500 ML/d (7 days) Aug to
May
2.3 2.7 247 407 0 1
500 ML/d (20 days) Aug to
May
1.9 1.8 291 607 0 1
500 ML/d (50 days) Sep to
April
1.3 0.9 587 1031 0 4
1500 ML/d (5 days) Sep to
April
2.7 1.7 355 684 0 0
450 ML/d (1 days) - Oct to
March
2 3.4 18 153 0 3
Louth 350 ML/d (7 days) Aug to
May
2 2.9 243 408 0 1
350 ML/d (14 days) Aug to
may
1.9 2.1 275 479 0 1
Wilcannia 2000 ML/d (5 days) any
time of the year
2.6 1.3 428 1147 0 2
350 ML/d (1 days) any time
of the year
2 2.6 19 153 0 3
Green: spells shorter than threshold of concern; Apricot: spells longer than threshold of concern
Trends in Algal Suppression Flows
The occurrence of algal blooms in the Barwon-Darling, such as the wide-spread blue-green algae
bloom in the summer of 1991 that covered over 1,000 km, are related to thermal stratification of
water in pools. This stratification occurs in the hotter months (between October and March) when
flow rates are low. The 1991 blue-green algal bloom was at a time of low flow (~100's ML/d) and
hot/still conditions. The sustained low flow allowed influx of saline groundwater which caused
clay flocculation, water clarification and increased photosynthesis in the surface water (Donnelly
et al. 1997). These conditions were ideal for the boom in algal growth.
There are many factors that influence the development of algal blooms (with the interaction
between these factors generally not well understood). The factors include wind, saline
groundwater inflow, turbidity and its associated effect on light penetration, concentrations of
nutrients and metals and other biological and physical processes. However, during the hotter part
of the year when algal blooms are more likely, flow events can prevent thermal stratification by
mixing pools and also reduce ingress of groundwater inflow or dilute its impact, and so inhibit
blooms from developing.
Work by Mitrovic et al (2006) has identified critical velocities and discharges required to mix the
water column within weir pools to prevent stratification and suppress blooms from forming at
three sites along the Barwon-Darling; at Brewarrina (510 ML/d), Bourke (450 ML/d) and

Ecological needs of low flows in the Barwon-Darling
Page 40
Wilcannia (350 ML/d). These critical discharge rates correspond to a velocity of 0.04 m/s. It is
estimated that it takes 12 days with flows below this threshold for weir pools to stratify.
In addition to mitigating the risk of algal blooms, these flow thresholds are of a size to provide
other outcomes, such as small scale fish movement opportunities, increased productivity,
freshening of pools, and water for riparian downstream communities (NSW DPI, 2015).
Previous long-term modelling of the Water Sharing Plan arrangements using the Barwon-Darling
Integrated Quantity and Quality model (Foster and Cooke, 2011) aimed to determine the impact
of water sharing arrangements on the thresholds identified by Mitrovic (2006).
Notwithstanding the limitations of the hydrological model in representing the part of the flow
regime, this analysis indicated that the number of events that exceed the critical flow threshold
for the suppression of algal blooms at Brewarrina, Bourke and Wilcannia has increased as a
result of the water sharing arrangements in the northern Basin (as compared to without
development conditions). However, the modelling showed that despite the increase in frequency,
there was a reduction in the average volume of events exceeding the thresholds. The mean
number of days since a previous event exceeding the critical threshold was reduced under
without development conditions to baseline conditions from 38 to 28 days at Brewarrina, from 35
to 19 days at Bourke, however increased from 42 to 62 days at Wilcannia.
As a comparison to the findings of Foster and Cooke (2011), the observed hydrology from
1990/01 to 2016/17 has been analysed for trends in the average number of days that flows are
below the critical threshold and the average length of these spells (Figure 14, Figure 15). The
spells are for between 15 October and 15 March and longer than 12 days. Key statistics for each
year is included at Appendix A.
The figures have been split into three periods (1990-1999, 2000-2010 and 2011-2017), with
2000/01 corresponding with the commencement of cease to pump rules for protecting instream
values in the Barwon-Darling river system and 2011-17 the commencement of the water sharing
plan (NSW, 2012). Both figures show that all three sites the 2000-2010 and 2011-2017 periods
had longer periods below the critical threshold compared to 1990-1999; likely to be due to a
combination of differences in climate and development of water resources. However, it is
interesting that 2011-2017 had longer spells between flows as compared to 2000-2010 which
corresponded to the Millennium drought. Also, it is the trajectory of the lines that provides insight
into potential increases in risk for algal blooms.
For the average number of days the flow is below the critical threshold, all sites show an
increasing risk of algal outbreaks between the three periods. However, there is also a difference
between the trends at Brewarrina and Bourke and the trend at Wilcannia. Wilcannia exhibits a
more rapid increase in days below the critical flow threshold and average spells between the
critical thresholds for the 2000-2017 period compared to the other two sites. This data suggest an
increasing risk of algal blooms at Wilcannia during the 2000-2017 period as compared to the
upstream sites (and more so for the 2011-2017 period which is associated with the water sharing
plan established in 2012).

Ecological needs of low flows in the Barwon-Darling
Page 41
Figure 14: Average number of days flow is below the identified algal suppression flow between 15 October and 15 March when there is the highest risk of algal outbreaks, critical thresholds and seasonal timing drawn from Mitrovic et al (2006).
Figure 15: Change in length of spells between algal suppression flows for Brewarrina, Bourke and Wilcannia. The critical thresholds, min 12 day length of spell and seasonal timing have been drawn from Mitrovic et al (2006).
Trends in dry spells
Hydrology analysis of the Barwon-Darling river system conducted by the MDBA (MDBA, 2017b),
included analysis on historical dry spells throughout the river system, the main conclusions of
which are presented here. The aim was to identify trends in either the length or frequency of dry
spell events spatially and temporally, which can help indicate a change in hydrological behaviour
of the Barwon-Darling river system.
The length of each dry spell was determined for each of the fifteen gauges along the Barwon-
Darling, and any period where the flow was continually less than 20 ML/d contributed to the

Ecological needs of low flows in the Barwon-Darling
Page 42
analysis (the 20 ML/d was selected as a flow considered sufficiently large to ensure connectivity
had recommenced). The results were then used to calculate both the number of dry spells and
the average dry spell length at each of the gauges.
Figure 16 shows that dry spell behaviour is correlated from upstream (green) to downstream
(orange through red) gauges, as would be expected in an arid system, where there are fewer
individual dry spells present at downstream gauges but their average length increases. As this
includes dry spells of any length, this would be largely driven by local climate. However for the
downstream gauges dry spells have become very long, with a spell of at least 80 days having
occurred every year since 2013 at Wilcannia.
Figure 16: Number and length of dry spells for each of the 15 gauges in the Barwon-Darling. Black dots show the number and length of dry spells for each gauge and the dotted line shows the upstream to downstream trend (MDBA 2017b).
As well as studying historic dry spells spatially, their temporal behaviour was also studied, by
analysing the average length of dry spell for key time periods since 1990. Figure 17 presents the
results by comparing 1990-1999, 2000-2010 and 2011-2017 dry spells.
It can be seen that dry spells downstream of Bourke are higher for the period covering the
Millennium drought, suggesting that local climate (IE the Millennium drought itself) is playing a
role in determining dry spells in the lower reaches of the river, as would be expected. However
for Walgett and Brewarrina the average dry spell length post the Millennium drought is similar to
that experienced during the drought, whereas previously they were shorter in length, indicating a
driver in addition to climate is possibly at play in that particular part of the system.

Ecological needs of low flows in the Barwon-Darling
Page 43
Figure 17: Change in average length of dry spells for key gauges along the Barwon Darling River, for three time periods: 1990-1999, 2000-2010 and 2011-2017 (MDBA 2017b).
Further work by Sheldon (2017), looked at the same dry spells data as used by MDBA but
overlayed them with information on the Southern Oscillation Index (SOI). This was based on the
work of Leigh et al (2010) which showed that there is a strong relationship between the long-term
flow regime in the Barwon-Darling and the SOI. The SOI gives an indication of the development
and intensity of El Niño and La Niña events.
This analysis showed that from 1989 to 2000 negative SOI values were associated with an
increased number of dry spells (as would be expected under El Niño conditions which tend to be
drier than normal) and positive SOI values were associated with fewer dry spells (as expected
under La Niña conditions).
From 2001 to 2010 the pattern changed. While negative SOI values from 1989-2000 (and from
the long-term flow record of Leigh et al. 2010) were associated with increased number of dry
spells, positive SOI values from 2001-2017 were also associated with dry spells. There was no
difference between the 1989-2000 and 2001-2017 time periods in the annual average number of
dry spells when the SOI was strongly negative (<-7), suggesting wetter than normal periods (t =
2.8, df = 12 , p>0.05). However, the difference between the 1989-2000 and 2001-2017 periods
when the SOI was strongly positive (>7), suggesting drier than average conditions, was highly
significant (t = 2.05, df = 26, p<0.01). Sheldon (2017) concluded that given the strong correlation
between flow patterns and SOI from the long-term flow record (Leigh et al. 2010) it is likely the
difference in the correlation between dry spells and SOI for the 2001-2017 period reflects the
increased level of extractions from the Barwon-Darling during this time.
Observed salinity during periods of very low flow periods
Saline groundwater discharge below Weir 19a is well known and it the reason for the Upper
Darling salt interception scheme being built in 2012-13 (NSW DPI, 2017). This scheme starts
about 100-200 m downstream of Weir 19a and intercepts approximately 37 tonnes of salt per day
when in operation. The Scheme is generally in operation when the flow in the river is below
Ecological needs of low flows in the Barwon-Darling
Page 44
4,000 ML/d. Above this flow, the gradient between the groundwater level and the river is towards
the groundwater which supresses groundwater inflow into river.
During prolonged very low flow/no-flow periods (i.e. <10s of ML/d) a high proportion of the flow in
the river for reaches between Weir 19a and Tilpa can come from the saline groundwater
discharge which causes salinity in the river to increase to very high levels. Small in-channel flow
events are thus vital for moderating water quality parameters, including diluting salinity.
There is limited site-specific information regarding the salinity tolerances for fish and other
aquatic biota in the Barwon-Darling river system. However, salinity can cause mortality of
animals, particularly juvenile fish and benthic (bottom dwelling) organisms such as freshwater
mussels, as the saline water tends to drop to the bottom of standing water (Sheldon, 2017).
Research from other areas shows that salinity can cause physiological stress in freshwater
organisms, with most freshwater plants and animals beginning to show signs of stress at
salinities more than 1 g/L (~1,500 µS/cm), with severe impacts above 3.5 g/L (~5,000 µS/cm)
and few freshwater biota persist above 10 g/L (15,000 µS/cm) (Dunlop et al. 2005; Nielsen and
Brock, 2009). Increases in salinity can also exacerbate declining water quality in pools through
flocculation of suspended clay which can increase light penetration and stimulate algal growth
which can reduce oxygen levels (Bowling and Baker, 1996, Dunlop et al. 2005).
An example of a salinity spike is presented in Figure 18, where in 2014, after about 40 days of
low flows, the salinity in the river downstream of Weir 19a gauge (downstream of Bourke) peaked
at about 17,000 µS/cm. The small rise in water level in November 2014 corresponded to a
Commonwealth environmental water release in the Gwydir River which resulted in an increase in
flows to about 200 ML/d. This flow event provided short term freshening, reducing salinity to
approximately 3,000 µS/cm, before the salinity continued to rise later in November 2014 due to
no-flow conditions returning. The salinity peaked at the end of second no-flow period of about 60
days at about 20,000 µS/cm. Information presented above on ecological thresholds suggest that
these salinities would have been lethal to nearly all native freshwater fish.
Following the second no-flow period, the in-channel event in February 2015 peaked at about
3,000 ML/d and provided enough flow to fully mix and freshen the river and enable downstream
flows. This resulted in a reduction in salinity from the 20,000 µS/cm peak to a salinity less than
1,000 µS/cm (which is the threshold for drinking water). This second flow event in February 2015
maintained a threshold of 500 ML/d for 23 days at Bourke which corresponds to one of the
environmental flow requirements (500 ML/d for 20 days to provide longitudinal connectivity).

Ecological needs of low flows in the Barwon-Darling
Page 45
Figure 18: Monitoring of groundwater and surface water levels and salinity at the Darling River @ D/S Weir 19A gauge (orange dotted line represents low flow conditions - <10 ML/d; grey dotted line is when the Salt Interception Scheme production bores started).
Table 8 shows the salinity rise during other very low flow periods (<10 ML/d) at the downstream
of Weir 19a gauge site for 2013 to 2016. The trend observed during each of these periods was
the salinity rising rapidly at the start of the very low flows commencing, with the salinity diluted
almost immediately by the passing of the next flow event. This trend shows the importance of
regular flows in the Barwon-Darling to mitigate against salinity spikes that are likely to have sub-
lethal and lethal impacts on aquatic biota and limit suitability for human and consumptive use.
Table 8: Summary of cease to flow conditions at gauge downstream of 19A and corresponding maximum salinity levels between 2013 and 2016 (Note: the SIS production bore started operating in mid-November 2014)
Number of days flow was less than 10 ML/d
Date range Maximum EC (µS/cm) at gauge
34 January 2014 – February 2014 20,632
38 October-November 2014 16,904
64 November 2014 - January 2015 19,962
26 April 2015 5,396
63 December 2015 – February 2016 19,962
54 December 2015 – February 2016 11,258
35 April 2016 – May 2016 4,839
33 May 2016 – June 2016 6,234
The hydrological and water-quality metrics formulated to measure the ecological condition of
reaches along the Barwon-Darling are summarised for Wilcannia in Figure 19. These metrics
relate to water salinity, algal outbreak risk and loss of fish connectivity. A flow of ≥0.3 metres
above cease-to-flow has been found to provide connectivity for small to medium-bodied fish

Ecological needs of low flows in the Barwon-Darling
Page 46
(Fairfull and Withebridge, 2003), which is essential in food access, shelter, access to new
habitats and reproductive needs of native fish. A threshold of 1,000 µS/cm was set to indicate a
decline in water quality as this is the threshold for drinking water. Risk of algal outbreak was
defined as periods between October and March that exhibited flows below 350 ML/d. The
October-March period was chosen as algal outbreaks are more likely to occur in hotter climates
with thresholds of flow based off the work of Mitrovic et al., 2006. Figure 19 shows that declines
in these metrics often occur simultaneously which consequently puts greater strain on the biota
of the affected reaches.

Ecological needs of low flows in the Barwon-Darling
Page 47
Figure 19: Hydrological and water-quality metrics used to determine ecological condition at Wilcannia compared to flow and dry periods.

Ecological needs of low flows in the Barwon-Darling
Page 48
UNDER EMBARGO UNTIL 12.01AM WEDS 7 MARCH 2018
Key findings and recommendations
Thirteen environmental flow requirements have been identified from the existing literature that
collectively support the ecological needs for low flows in the Barwon-Darling river system:
• Maintaining populations of native fish and other aquatic biota (like mussels) by
replenishing refuge pools and maintaining aquatic habitats; providing opportunities for
movement between habitats; and supporting key ecosystem functions (including
cycling of nutrients and provision of carbon for productive food webs);
• Supporting regular breeding and recruitment of fish and other invertebrates with short
life cycles to maintain populations and genetic diversity.
• Maintaining water quality through regular flushing of refuge pools to mitigate against
issues such as algal blooms and salinity spikes.
• Providing longitudinal connectivity through the Barwon-Darling river system and its
tributaries to support the ecological needs above, maintain in-channel and riparian
vegetation condition, and provide natural cues for flow responsive fish and other
aquatic biota.
Analysis of observed flows between 1990/91 to 2016/17 shows that the environmental flow
requirements have mixed performance against the identified frequency and dry spell targets.
However, the assessment of observed flows has identified very long maximum periods between
the low flow environmental flow requirements being achieved and a marked departure from
without development conditions. This combined with the number of thresholds of concern events
being breached shows risks to the ecological needs during low flows in the Barwon-Darling as a
result of extended dry periods.
The trends and impacts of the longer low or no-flow periods include:
• The maximum dry spell between flow low events is approximately doubled in length
for many of the flow requirements described when comparing observed flows to the
without development flow regime. In extreme cases, the maximum dry spell is greater
than 10 times longer which is likely to place ecosystems under severe stress.
• Periods of low or no flow have increased for gauges downstream of Bourke post 2000
as compared to pre-2000.
• Algal bloom risks is increased through the system with the risk highest at Wilcannia
(compared to Bourke and Brewarrina) and increasing for the period after 2010 (see
figure below). The flow thresholds important for mixing pools to mitigate algal bloom
risk are also associated with other positive outcomes, such as connectivity for fish
movement between habitats.
• Salinity spikes (salinity going over 5,000 µS/cm) observed during periods of low flow
for the reach between Bourke and Tilpa, as a result of saline groundwater inflows.
This salinity is known to exceed the tolerance for many plants and invertebrates.
• Longer periods between opportunities for fish to move between habitats and breed,
especially for smaller fish that generally live for less than five years.
It recommended that mechanisms be established for the protection of environmental water
especially the flows that can limit very long dry spells. For this, it is recommended that

Ecological needs of low flows in the Barwon-Darling
Page 49
UNDER EMBARGO UNTIL 12.01AM WEDS 7 MARCH 2018
management of unregulated flows in the Barwon-Darling river system occur at a reach scale and
through management of individual flow events in order to optimise outcomes across all users,
including the environment. Also, since the development of upstream catchments has an effect on
flows in the Barwon-Darling, examination of the management rules in these areas could improve
outcomes for the Barwon-Darling and provide a better understanding of system-wide linkages
between catchments.
The impact of extraction on low flows is of highest significance for the first flow after a dry period
as this event is critically important for the environment as it breaks the dry spell. However, there
is acute pressure from competing demands, as irrigators also need access to this water, under
their licence rules, to support the businesses. Measures for the protection of environmental water
should be developed in a way that provides the environmental outcomes in a way that enables
irrigation businesses to continue to operate.
No flow periods
Periods of no-flow are a natural feature of the Barwon-Darling river system due to its highly
variable hydrology. However, when the length of no-flow spells are longer than the ecology of the
river have adapted to, there is potential for negative ecological implications (Rolls et al. 2012).
This includes reduced resilience for the aquatic community, and a transition to more generalist
species with reduced diversity and abundance of more sensitive species.
In addition, no-flow spells have significant implications for communities along the river having
reduced access to reliable and good quality water for town water and stock and domestic supply,
and cultural and recreational purposes. Town water supplies for Collarenebri, Walgett,
Brewarrina, Bourke, Louth, Tilpa, Wilcannia and Menindee are dependent on water supplies
directly from the Barwon or Darling Rivers into their water treatment plants (NSW, 2012). Unlike
irrigators, towns do not have off river storages.
There is limited site-specific information regarding critical thresholds for the different aquatic biota
in the Barwon-Darling and their tolerance for extended dry spells. Long dry spells do impact on
the ecosystem but there is no information on specific tipping points or the thresholds at which the
ecosystem declines and loses its resilience (Sheldon, 2017).
However multiple lines of evidence can be used to inform what is considered a high risk no-flow
spell, based on both ecological and critical human water needs considerations. Drawing upon
information regarding the maximum dry spell that would have been experienced under modelled
without development conditions, management options should be considered to limit no and very
low flow periods from exceeding 60-80 days at Bourke and 120-150 days at Wilcannia, especially
in spring-summer.
By comparison the maximum dry spell at Wilcannia in the without development model is
147 days, while a no-flow spell of 332 days observed during the millennium drought (2006-07). At
Bourke the maximum without development no-flow period was 77 days as compared to 199 days
observed in 2007.
The Northern Basin Review waterhole project (DSITI, 2015) found that Barwon-Darling
waterholes are, for the majority, highly persistent. The exception to this is the reach of the river
near Tilpa (roughly between Louth and Tilpa). This reach did run dry two times during the
Landsat record (since 1988) with no flow periods of 176 days and 182 days at the Tilpa gauge. It
Ecological needs of low flows in the Barwon-Darling
Page 50
UNDER EMBARGO UNTIL 12.01AM WEDS 7 MARCH 2018
would be desirable for flow events to be often enough to prevent this reach from going dry to
prevent complete loss of habitat and provide for the supply of water for critical human needs. The
recommendation above for flows at Bourke and Wilcannia will support persistence of pools in this
reach of river.
The Darling River between Bourke and Tilpa is known to receive saline groundwater, with the
impact greatest during times of very low flows (i.e. 10s of ML/d). There are several instances of
salinity exceeding 5,000 µS/cm during no-flow spells (longer than ~30 days). There is information
that indicates this is a threshold for many freshwater zooplankton and aquatic plants (Nielsen and
Brock, 2009).
At Bourke and Wilcannia, the weir pool provides approximately 6 months (~180 days) and 4
months (~120 days) of town water supply (NSW, 2012). During low and no-flow periods, water
restrictions are progressively implemented and access to alternate water sources (such as
groundwater) are needed.
River system connectivity
The volume of water required to provide connectivity is dependent on a range of factors with the
dryness of the preceding period and level of take by consumptive users being primary drivers.
However, analysis of observed flows shows there is a very high likelihood of system scale
connectivity, through to Wilcannia, with flow event volumes of at least 20 GL at Bourke. This
would generally take the shape of a magnitude of 500 ML/d for at least 14 days, with 20 days
providing more certainty. The volume needed would reduce under wetter antecedent conditions.
This flow would also be sufficient to mix and freshen pools to improve water quality.
Water sharing arrangements and rules should be investigated that are able to protect the integrity
of this type of flow event to pass through the river system that target minimising the identified no-
flow periods at Bourke and Wilcannia.
Conclusion
The report describes environmental flow requirements for ‘low flow and small fresh events’ in the
Barwon-Darling River based on a synthesis of existing information and literature. This report has
described the types of flows that are ecologically important during drier conditions, which can be
used to inform consideration of mechanisms to better protect environmental flows.
The regular occurrence of low and base-flows are critically important during dry times to support
the environment and downstream communities. For the purpose of this report, low flows have
been defined as representing events that typically contain flow peaks between 350 - 2,000 ML/d
across the Barwon-Darling river system; consistent with the definition of ecologically significant
flows adopted in previous studies. This is an important distinction as commence to pump
thresholds for licences are generally within this flow range.
This work complements the previous assessment for the Northern Basin Review which focused
on larger flow events (>6,000 ML/d) that are important for informing the total quantum of water to
be recovered for the environment and describe the types of flows that are ecologically important
during average to wetter conditions.

Ecological needs of low flows in the Barwon-Darling
Page 51
UNDER EMBARGO UNTIL 12.01AM WEDS 7 MARCH 2018
Thirteen environmental flow requirements were defined for different points along the river,
including at Walgett, Brewarrina, Bourke, Louth and Wilcannia to describe the environmental
values for low flows. These values include to maintain native fish populations and in-channel
ecosystem processes, enhance native fish spawning and recruitment, mitigate against water
quality issues (such as salinity and algal blooms), and provide longitudinal connectivity. These
requirements will be superseded by the environmental water objectives and requirements
developed for the NSW Long Term Environmental Watering Plan once available.
The performance of the environmental flow requirements show risks for the environmental values
of low flows in the Barwon-Darling. The majority of environmental flow requirements show a very
long maximum period between events and a marked departure from without development
conditions. In addition, the number of thresholds of concern periods between events that have
been breached indicates risks to ecological needs as a result of extended dry periods.
As part of another report, the MDBA has also undertaken hydrological analysis to investigate the
historical behaviour of low flows (≤ 2000 ML/d) along the Barwon-Darling river system between
1990-01 and 2016-17 (MDBA, 2017b). The aim was to assess any observable changes to flow
behaviour over this time period. The work produced a comprehensive catalogue of more than two
thousand individual flow events to provide a robust dataset with which to undertake the
investigation.
This analysis is part of ongoing work to understand and characterise the hydrology and
associated ecological needs of the Barwon–Darling river system and ultimately use science and
the best available information, including the lived experience of local stakeholders, to help frame
options for protecting low and small fresh outcomes, in line with the conclusions of the Northern
Basin Review and both the MDBA and NSW compliance reviews.

Ecological needs of low flows in the Barwon-Darling
Page 52
UNDER EMBARGO UNTIL 12.01AM WEDS 7 MARCH 2018
References
Bewsher (2016), Review of the hydrological modelling frameworks used to inform potential basin
plan amendments, Murray-Darling Basin Authority, Canberra.
Boys, C.A. and Thoms, M.C (2006), A large-scale, hierarchical approach for assessing habitat
associations of fish assemblages in large dryland rivers, Hydrobiologia, Volume 572, Issue 1, pp
11-31.
Boys, C. (2011), Bourke to Brewarrina demonstration reach monitoring and evaluation program,
design and methodologies. NSW Department of Primary Industries and the Murray-Darling Basin
Commission, Port Stephens NSW. http://www.finterest.com.au/wp-84
Bowling, L. and Baker, P. (1996), Major cyanobacterial bloom in the Barwon-Darling River,
Australia, in 1991, and underlying limnological conditions. Marine and Freshwater Research
47:643-657.
CEWO (2017), Northern unregulated rivers, portfolio management plan 2017-18, Commonwealth
Environmental Water Office, Canberra
CEWO (2017), Environmental water requirements of the Barwon-Darling system during lower
flows, Commonwealth Environmental Water Holder, Canberra (unpublished)
Crook, D. and Robertson, A. (1999), Relationships between riverine fish and woody debris:
implications for lowland rivers. Marine and Freshwater Research 50: 941-953.
CSIRO (2008), Water availability in the Barwon-Darling, a report to the Australian Government
from the CSIRO Murray-Darling Basin Sustainable Yields Project, CSIRO, Australia. 106pp.
Davies, P.E., Stewardson, M.J., Hillman, T.J., Roberts, J.R. and Thoms, M.C. (2012),
Sustainable Rivers Audit 2: The ecological health of rivers in the Murray-Darling Basin at the end
of the Millennium Drought (2008-2010), Murray-Darling Basin Authority, Canberra.
Dewson, Z.S., James, A.B.W. and Death, R.G. (2007), A review of the consequences of
decreased flow for instream habitat and macroinvertebrates. Journal of the North American
Benthological Society 26:401–415.
Donnelly, M.R., Grace, B.T. and Hart, B.T. (1997) Algal blooms in the Darling -Barwon River,
Australia, Water, Air and Soil Pollution, Volume 99, Issue 1-4, pp 487-496.
DSITI (2015). Waterhole refuge mapping and persistence analysis in the Lower Balonne and
Barwon–Darling rivers. Department of Science, Information Technology and Innovation.
Dunlop, J., G. McGregor, and N. Horrigan. (2005), Potential impacts of salinity and turbidity in
riverine ecosystems: Characterisation of impacts and a discussion of regional target setting for
riverine ecosystems in Queensland.
Eco Logical Australia (2017), Long Term Intervention Monitoring Project, Junction of the Warrego
and Darling rivers selected area 2015-16.
Eco Logical Australia (2015), Long Term Intervention Monitoring Project, Junction of the Warrego
and Darling rivers selected area 2014-15.

Ecological needs of low flows in the Barwon-Darling
Page 53
UNDER EMBARGO UNTIL 12.01AM WEDS 7 MARCH 2018
Fairfull, S. and Witheridge, G. (2003), Why do fish need to cross the road? Fish passage
requirements for water way crossings, NSW Fisheries, Cronulla, 16pp.
Foster, N. and Cooke, R. (2013), Critical flow thresholds for environmental values identified
within the Barwon-Darling Water Sharing Plan, NSW Department of Primary Industries.
Koehn, J. and Nichol, S. (2014), Comparative habitat use by large riverine fishes. Marine and
Freshwater Research 65: 164-174.
Koster, W., Stuart, I. and Dawson, D. (2017), Maintaining connectivity of fish populations across
broad spatial scales and river networks using coordinated environmental flows. 4th ICFT
Abstract.
Lake, P.S. (1995), Of floods and droughts: river and stream ecosystems of Australia. In Cushing,
E., Cummins, K. and Minshall, G. E. (eds). River and Stream Ecosystems. p. 659-94. Elsevier,
New York.
Mallen-Cooper, M. and Zampatti, B. (2015), Background paper: use of life history conceptual
models of fish in flow management in the Murray-Darling Basin. Murray-Darling Basin Authority,
Canberra.
Marshall, J. C., Sheldon, F., Thoms, M. and Choy, S. (2006), The macroinvertebrate fauna of an
Australian dryland river: spatial and temporal patterns and environmental relationships. Marine
and Freshwater Research 57:61-74.
Marshall, J, Menke, N, Crook, D, Lobegeiger, J, Balcombe, S, Huey, J, Fawcett, J, Bond, N,
Starkey, A and Sternberg, D (2016), 'Go with the flow: the movement behaviour of fish from
isolated waterhole refugia during connecting flow events in an intermittent dryland river',
Freshwater Biology, vol.61, pp.1242-1258.
Matthews, K. (2017), Independent investigation into NSW water management and compliance –
Final Report, Advice on implementation, NSW Department of Industry.
McNeil, D., Gehrig, S. and Cheshire, K. (2013), The protection of drought refuges for native fish
in the Murray-Darling Basin. Report prepared by the South Australian Research and
Development Institute for the Murray-Darling Basin Authority. South Australian Research and
Development Institute (Aquatic Sciences), Adelaide.
MDBA (2011), The proposed ‘environmentally sustainable Level of take’ for surface water of the
Murray-Darling Basin: methods and outcomes, Murray-Darling Basin Authority, Canberra.
MDBA (2012), Assessment of environmental water requirements for the proposed Basin Plan:
Barwon–Darling River upstream of Menindee Lakes, 41/12, Murray–Darling Basin Authority,
Canberra.
MDBA (2014), Basin-wide environmental watering strategy, Murray-Darling Basin Authority,
Canberra.
MDBA (2016a), Assessment of environmental water requirements: Barwon-Darling river system,
Murray-Darling Basin Authority, Canberra.

Ecological needs of low flows in the Barwon-Darling
Page 54
UNDER EMBARGO UNTIL 12.01AM WEDS 7 MARCH 2018
MDBA (2016b), Northern Basin Review – Community consultation report, Murray-Darling Basin
Authority, Canberra.
MDBA (2017a), The Murray-Darling Basin Water Compliance Review, Containing reports by the
Murray-Darling Basin Authority and Independent Review Panel, Murray-Darling Basin Authority,
Canberra.
MDBA (2017b), Observed flows in the Barwon-Darling 1990-2017, a hydrological investigation,
Murray-Darling Basin Authority, Canberra.
Mitrovic, S.M., Chessman, B.C., Bowling, L.C. and Cooke, R.H. (2006), Modelling suppression of
cyanobacterial blooms by flow management in a lowland river, River Research and Applications,
22 109-114.
Northern Basin Advisory Committee (2016), Finding the balance, Final report of the Northern
Basin Advisory Committee, Murray-Darling Basin Authority, Canberra.
NSW Department of Primary Industries (2007), Threat abatement plan: removal of large woody
debris from NSW rivers and streams. NSW Department of Primary Industries, Orange NSW.
http://www.dpi.nsw.gov.au/__data/assets/pdf_file/0005/179357/Threat-abatement-plan---
Removal-of-large-woody-debris-from-NSW-rivers-and-streams---May-2007.pdf.
NSW (2012), Water Sharing Plan for the Barwon-Darling Unregulated and Alluvial Water Sources
Background Document, NSW Department of Primary Industries.
NSW DPI Water (2017), Upper Darling Salt Interception Scheme Annual Performance Report
2015/16, NSW Department of Primary Industries, Water, Dubbo.
NSW DPI (2015), Fish and flows in the Northern Basin - responses of fish to changes in flow in
the Northern Murray-Darling Basin, reach scale report, New South Wales Department of Primary
Industries - Fisheries, prepared for the MDBA.
O’Connor, N. (1992), Quantification of submerged wood in a lowland Australian stream system.
Freshwater Biology 27: 387-395.
Passy, S.I. (2001), Spatial paradigms of lotic diatom distribution: a landscape ecology
perspective, Journal of Phycology, vol. 37, pp. 370-378.
Poff, N.L. and Zimmerman, J.K. (2010), Ecological responses to altered flow regimes: a literature
review to inform the science and management of environmental flows, Freshwater Biology,
vol.55, pp.194-205.
Puckridge, J.T., Sheldon, F., Walker, K.F. and Boulton, A.J. (1998), Flow variability and the
ecology of large rivers, Marine Freshwater Resources, vol.49, pp.55-72.
Rolls, R.J., Leigh, C. and Sheldon, F. (2012), Mechanistic effects of low-flow hydrology on
riverine ecosystems: ecological principles and consequences of alteration, Freshwater Science,
31(4), 1163-1186pp.
Rolls R., Growns, I. Khan, T., Wilson, G., Ellison, T., Prior, A. and Waring, C. (2013), Fish
recruitment in rivers with modified discharge depends on the interacting effects of flow and
thermal regimes. Freshwater Biology 58: 1804–1819.

Ecological needs of low flows in the Barwon-Darling
Page 55
UNDER EMBARGO UNTIL 12.01AM WEDS 7 MARCH 2018
Sheldon, F., and Walker, K.F. (1998), Spatial distribution of littoral invertebrates in the lower
Murray-Darling River system, Australia. Marine and Freshwater Research 49:171-182.
Sheldon, F., Balcombe, S., Capon S. and Hale, J. (2014), Reviewing the scientific basis of
environmental water requirements in the Condamine-Balonne and Barwon-Darling, Report
prepared for the MDBA.
Sheldon (2017), Changes in the ‘low-flow hydrology’ of the Barwon-Darling River, Australian
Rivers Institute, Griffith University, Advice to the Commonwealth Environmental Water Holder
Office.
Southwell, M. (2008), Floodplains as Dynamic Mosaics: Sediment and Nutrient patches in a
Large Lowland Riverine Landscape, Riverine Landscapes Research Laboratory, University of
Canberra, Canberra.
Stuart, I. and Sharpe, C. (2017), Northern golden perch population recovery: protection and
enhancement of Border River flows, from Goondiwindi to Menindee, for Murray-Darling Basin
benefits, Kingfisher Research and CPS Enviro (not yet published).
Stubbington, R., Wood, P.J., Reid, I. and Gunn, J. (2011), Benthic and hyporheic invertebrate
community responses to seasonal flow recession in a groundwater dominated stream,
Ecohydrology 4:500–511.
Thiem, J.D., Wooden, I.J., Baumgartner, L.J., Butler, G.L., Forbes, J.P. and Conallin, J. (2017),
Recovery from a fish kill in a semi-arid Australian river: can stocking augment natural recruitment
processes? Austral Ecology 42, 218-226.
Thoms, M., Sheldon, F., Roberts, J., Harris, J. and Hillman, T. (1996), Scientific panel
assessment of environmental flows for the Barwon-Darling river system, a report to the technical
services division of the NSW Department of Land and Water Conservation.
Townsend, A. (2016), Going deep beneath the Barwon-Darling, Rip Rap, Edition 39 Habitat
makes fish happen, The Australian River Restoration Centre.
Treadwell, S. (1999). Managing snags and large woody debris. In Lovett, S. and Price, P. (eds).
Riparian land management guidelines: volume two: on-ground management tools and
techniques. P. 15-22. Land and Water Resources Research and Development Corporation,
Canberra.
Zampatti, B.P., Wilson, P.J., Baumgartner, L., Koster, W., Livore, J.P., McCasker, N., Thiem, J.,
Tonkin, Z. And Ye, Q. (2015). Reproduction and recruitment of golden perch (Macquaria
ambigua ambigua) in the southern Murray-Darling basin in 2013-14: an exploration of river-scale
response, connectivity and population dynamics. SARDI Research Report Series No. 820. 61pp.
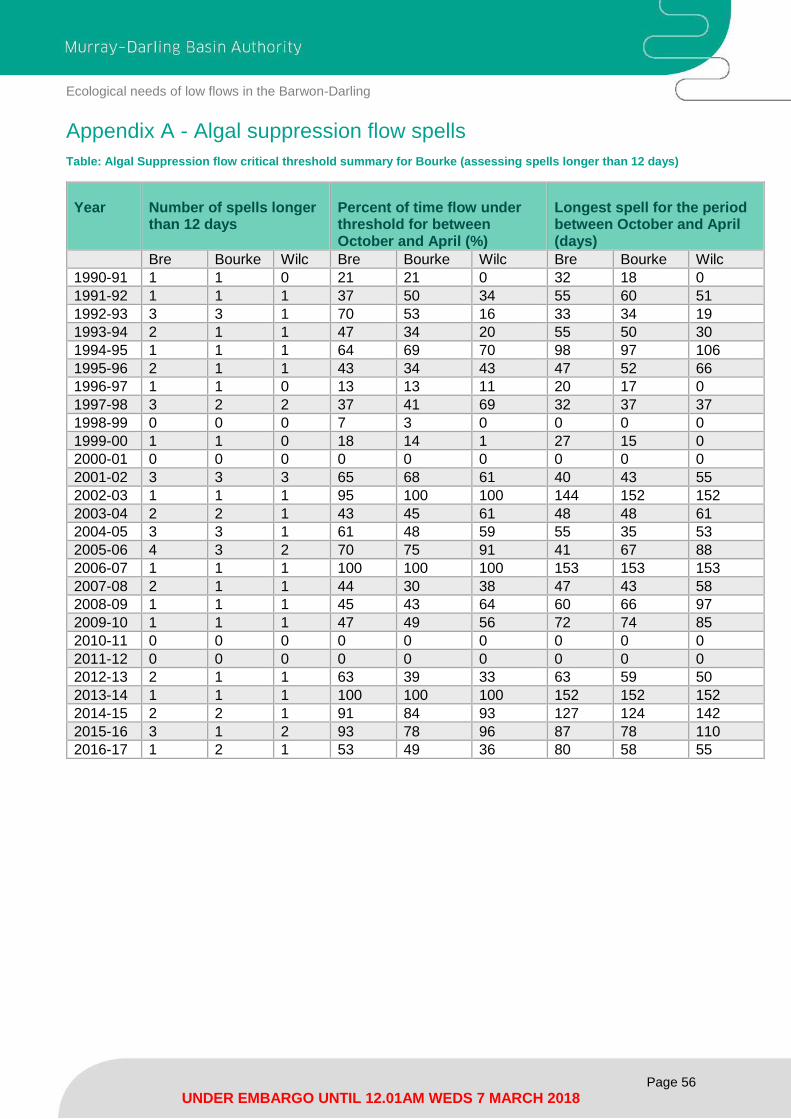
Ecological needs of low flows in the Barwon-Darling
Page 56
UNDER EMBARGO UNTIL 12.01AM WEDS 7 MARCH 2018
Appendix A - Algal suppression flow spells
Table: Algal Suppression flow critical threshold summary for Bourke (assessing spells longer than 12 days)
Year Number of spells longer than 12 days
Percent of time flow under threshold for between October and April (%)
Longest spell for the period between October and April (days)
Bre Bourke Wilc Bre Bourke Wilc Bre Bourke Wilc
1990-91 1 1 0 21 21 0 32 18 0
1991-92 1 1 1 37 50 34 55 60 51
1992-93 3 3 1 70 53 16 33 34 19
1993-94 2 1 1 47 34 20 55 50 30
1994-95 1 1 1 64 69 70 98 97 106
1995-96 2 1 1 43 34 43 47 52 66
1996-97 1 1 0 13 13 11 20 17 0
1997-98 3 2 2 37 41 69 32 37 37
1998-99 0 0 0 7 3 0 0 0 0
1999-00 1 1 0 18 14 1 27 15 0
2000-01 0 0 0 0 0 0 0 0 0
2001-02 3 3 3 65 68 61 40 43 55
2002-03 1 1 1 95 100 100 144 152 152
2003-04 2 2 1 43 45 61 48 48 61
2004-05 3 3 1 61 48 59 55 35 53
2005-06 4 3 2 70 75 91 41 67 88
2006-07 1 1 1 100 100 100 153 153 153
2007-08 2 1 1 44 30 38 47 43 58
2008-09 1 1 1 45 43 64 60 66 97
2009-10 1 1 1 47 49 56 72 74 85
2010-11 0 0 0 0 0 0 0 0 0
2011-12 0 0 0 0 0 0 0 0 0
2012-13 2 1 1 63 39 33 63 59 50
2013-14 1 1 1 100 100 100 152 152 152
2014-15 2 2 1 91 84 93 127 124 142
2015-16 3 1 2 93 78 96 87 78 110
2016-17 1 2 1 53 49 36 80 58 55

Ecological needs of low flows in the Barwon-Darling
Page 57
UNDER EMBARGO UNTIL 12.01AM WEDS 7 MARCH 2018
Appendix B - Case Study and CEWH environmental water
deliveries
2014 connectivity event between the Gwydir River and Barwon-Darling River
Following an autumn in-channel pulse during April/May 2014, there was an extended period of
low to no-flow lasting from May to October in the upper parts of the Barwon-Darling River, and
through to January 2015 for the lower parts of the river system downstream of Bourke.
In October-November 2014, there was a regulated release of Commonwealth Environmental
Water through the Gwydir catchment down the Mehi River and Carole Creek channels. The
environmental water flowed into the Barwon-Darling River with a noticeable peak to Weir 19a,
while no increase in flow was detected downstream at Louth.
The flow peaked at about 900 ML/d at Colleranebri, 600 ML/d at Walgett and 150 ML/d at Bourke
(see hydrograph below). There was A and B class pumping downstream of Collarenebri,
however further downstream pumping of this event would have been limited as commence to
pump thresholds were not met. The Commonwealth environmental water was estimated to be
75% of the total volume in the event.
The event was above 500 ML/d for 8 days at Walgett, produced connectivity through the
Brewarrina fishway for 10 days, and freshened pools through to Weir 19a.
Hydrographs at different points down the Barwon-Darling River showing how the Commonwealth environmental water inflow from the Gwydir catchment moved down the Barwon-Darling River
While there was flow in the Barwon-Darling River through to Weir 19a, the event did not provide
connectivity to fill and freshen downstream pools or provide water for downstream communities.
At Bourke, without the flow event there would have been about 100 days of no-flow instead of the
25 days before the event and 44 days after the event (before the next pulse in late December). At
Louth and Wilcannia, the no-flow period lasted over 117 days, which is extreme (compared to
77 days as the maximum no-flow spell in the Basin Plan without development modelling for

Ecological needs of low flows in the Barwon-Darling
Page 58
UNDER EMBARGO UNTIL 12.01AM WEDS 7 MARCH 2018
Wilcannia). There would have been limited opportunities for fish and other aquatic biota to
access habitat, flows at Bourke and downstream were not enough to mix weir pools and limit
algal bloom risks and salinity became a significant problem for the reach between Weir 19a and
Tilpa.
While it is not possible to know exactly, protection of this environmental water may have
increased the volume that moved downstream, therefore providing relief for the environment and
downstream communities during this critically dry period. It would also potentially have increased
the connectivity for subsequent flow events as pools would have been topped up and
transmission losses reduced. This can be important for the volume of water that reaches the
Menindee Lakes Storages.
Comparison between the 2013 and 2017 connectivity events between the Gwydir River
and Barwon-Darling River
There were two similar small in-channel fresh events in the Barwon-Darling that originated from
Commonwealth environmental water deliveries in tributaries in 2013 and 2017 which resulted in
different levels of river system connectivity. These events were:
• A flow event in 2013 from the Gwydir system but not the Macintyre (hence very little
flow u/s Presbury), where there was some pumping in the Barwon-Darling as
permitted under the water sharing plan (see hydrograph below)
• A flow event spring 2017 from the Border Rivers and Gwydir systems, where Barwon-
Darling water users made the decision not to divert water from this event even though
some had the opportunity under their water sharing plan commence to pump rules
(see hydrograph below).
In both years, there was flow at Wilcannia in the month preceding the events. As such, the pools
would likely have been close to full and transmission losses between the two years would be
similar (i.e. similar antecedent conditions).
As can be seen in the hydrographs, in 2013, the flow did not make it to Wilcannia (the purple flow
at Wilcannia), while in 2017, the flow did make it to Wilcannia.
This example provides a line of information to support the consideration of mechanisms for the
protection of environmental water.

Ecological needs of low flows in the Barwon-Darling
Page 59
UNDER EMBARGO UNTIL 12.01AM WEDS 7 MARCH 2018
Flows at different points along the Barwon-Darling River between November and December 2013, following an inflow from the Border Rivers - no connectivity to Wilcannia (hydrograph provided by the Commonwealth Environmental Water Holder).
Flows at different points along the Barwon-Darling River between September and October 2017, following an inflow from the Border Rivers - no connectivity to Wilcannia (hydrograph provided by the Commonwealth Environmental Water Holder).

Ecological needs of low flows in the Barwon-Darling
Page 60
UNDER EMBARGO UNTIL 12.01AM WEDS 7 MARCH 2018
CEWH events contributing to flows in the Barwon-Darling River: 2012/13 to 2016
Commonwealth environmental water delivered in tributary catchments of the Barwon-Darling can
provide benefits to the Barwon-Darling River, with the relative contribution and outcomes varying
depending on the conditions in the river at the time and the size of the event.
The information below provides information on Commonwealth environmental water that has
contributed to flows in the Barwon-Darling. This information has been sourced from the CEWH
website (available at: https://www.environment.gov.au/water/cewo/catchment. Only actions that
may have contributed to the Barwon-Darling are included.
Border Rivers
2016-17
As of 30 October ML,15,291 ML of Commonwealth unregulated water in the Macintyre-
Dumaresq River may have improved end-of-system flows as the Commonwealth’s share of
the flow event could not be extracted by other authorised users.
2014-15
564 ML Commonwealth unregulated water in the Macintyre-Dumaresq River may have
improved end-of-system flows as the Commonwealth’s share of the flow event could not be
extracted by other authorised users.
2013-14
In the NSW Severn River, 4,000 ML of Commonwealth environmental water was used in
conjunction with 4,000 ML of NSW planned environmental water (released from Pindari Dam
into the NSW Severn River) in the second half of August 2013. The flow was likely to have
improved end of system flows (Mungindi) from residual flows that carried through the system.
2012-13
895 ML of Commonwealth environmental water in conjunction with 4,000 ML of NSW
planned environmental water and 7,105 ML of water being released to meet downstream
irrigation orders, to provide a high velocity, high peaked ‘stimulus’ flow in the NSW Severn
River.
The combined release of 16,000 ML from Pindari Dam commenced on 1 December and was
delivered over 10 days. The co-delivery of a large volume of irrigation water reduced the
Commonwealth contribution required (4,000 ML had been approved for the action).
Some residual flows from the release carried through to the end of the system (Mungindi)
where flows peaked at 800 ML/day in late December.
Gwydir
2014-15
Commonwealth environmental water (13.3 GL in the Mehi River and 3.7 GL in Carole Creek)
was delivered in October 2014 in conjunction with a block release of irrigation water. These

Ecological needs of low flows in the Barwon-Darling
Page 61
UNDER EMBARGO UNTIL 12.01AM WEDS 7 MARCH 2018
flows contributed to the Barwon River, activating the Brewarrina fishway for a period of ten
days.
There were no inflows from upstream in the Barwon, therefore, all the flow in the Barwon
River was a result of flows from the Gwydir. The flow was recorded through to the
downstream of Weir 19a gauge but not to Louth.
2013-14
In October- November 2013, residual EOS flows from regulated watering actions in the Mehi
River and Carole Creek (~11 GL) generated a small flow pulse in the Barwon River between
Mogil Mogil to Dangar Bridge.
Condamine-Balonne
2016-17
In September to October 2016, the largest flow event since April 2013 occurred in the system
(peaking at around 41,000 ML/day at St George on 23 Sept 2016 and a total of 270 GL
passing). From this event an estimated 18 GL entered the Narran Lakes Nature Reserve and
42 GL into the lower Culgoa River, with Commonwealth environmental water contributing
approximately 30% of total water left in-stream (17 GL was estimated as inflow to the
Barwon-Darling. This water inundated approximately 1500 hectares, including core rookery
habitat. Another moderate flow event occurred in late March 2017 (peaking at around 16,000
ML/day at St George on 7 April 2017). For both flow events, 43,750 ML of Commonwealth
environmental water was provided, with the expected environmental outcomes of this
watering action contributing to:
- supporting a more naturally variable flow regime in this system, including overbank
- supporting key ecosystem functions such as fish movement across the system and into
the Barwon River
- improving the resilience of native plant and animal communities with widespread
inundation of the lignum nesting areas around Back and Clear Lakes (Narran Lakes
Nature Reserve).
2015-16
110 GL entered the Lower Balonne system over January-March 2016, with 88 GL passing
during the water harvesting event (7 to 15 February 2016). Commonwealth entitlements
contributed 9.5 GL to in-stream flows during the water harvesting event.
CEW is estimated to have increased cross-border flows (all distributary channels) by around
4.6 GL or 17% of the total (26.5 GL) and inflows into the Darling River by 2.5 GL.
2014-15
Commonwealth environmental water contributed 17.2 GL out of a total of 186 GL of flow
entering the Lower Balonne distributary system between December 2014 and March 2015.
Commonwealth environmental water, in conjunction with flow protection rules (10 percent

Ecological needs of low flows in the Barwon-Darling
Page 62
UNDER EMBARGO UNTIL 12.01AM WEDS 7 MARCH 2018
reduction in water harvesting), helped ensure that ‘flow through’ was achieved in all the
Lower Balonne channels in this event.
Small volumes reached the Barwon-Darling through the Birrie and Bokhara rivers in early
March. These systems had not flowed in over 18 months.
The Commonwealth environmental water improved flows in the Culgoa River, with 30 GL
estimated to have reached the Barwon-Darling.
2013-14
Commonwealth environmental water comprised around half of the 30 GL passing the Brenda
gauge near the Qld-NSW border. Commonwealth environmental water combined with some
local catchment inflow from the west of the Culgoa contributed to higher than expected
inflows to the Barwon-Darling.
This event followed a year-long spells of no flow, so the additional environmental water had
particular benefits in replenishing and connecting waterholes throughout the distributary
system and extending the period of flows.
2012-13
During February and March 2013, nearly 65 GL of Commonwealth environmental water
contributed to sequential medium flood events in the Lower Balonne system. Commonwealth
environmental water is estimated to have increased end-of-system flows to the Barwon-
Darling via the Culgoa and Birrie/Bokhara rivers by around 28 GL, or more than 10% of total
volume reaching the Barwon River up to the end of April 2014.
Namoi
2016-17
7,852 ML of Commonwealth environmental water was delivered in the Lower Namoi River
from March to May 2017 to provide a cue for fish, flows to support conservation stocking of
silver perch between Gunnedah and Narrabri, connectivity to freshen pools and improve
vegetation health, and support fish moving from the Barwon River into the Namoi River.
2012-13
7,728 ML of Commonwealth environmental water was delivered in the Namoi River at the
end of January 2013. An estimated 6,500 ML reaching the Barwon River at the end of
February 2013.
Commonwealth environmental water combined from the Namoi, unregulated inflows from the
Condamine- Balonne (~60 GL) and resulted in greater flows in the Barwon-Darling.
Macquarie
Estimating the contribution of Commonwealth environmental water to the Barwon-Darling from
the Macquarie catchment is difficult:

Ecological needs of low flows in the Barwon-Darling
Page 63
UNDER EMBARGO UNTIL 12.01AM WEDS 7 MARCH 2018
Depending on where environmental water is delivered, the contribution to the Barwon-Darling
can be estimated based on flows from the Macquarie River at the Bells Bridge gauge (outflow
from the Northern Marshes), and Marthaguy Creek at the Carinda gauge (outflows from the
Eastern Marshes and upper Marthaguy unregulated flows).
There are no gauges on the Macquarie River closer to the Barwon-Darling than at Bells
Bridge.
The potential maximum contribution to the Barwon River from the Macquarie includes all
sources of water (e.g. environmental, stock and domestic, surplus flows).
Water in the lower Macquarie River downstream of Carinda can be extracted when flows are
above 50 ML/day and the volume of unregulated pumping below Bell’s Bridge is unknown.
2016–17
Between 16 April and 15 May 2017, 27,583 ML of Commonwealth environmental water was
delivered to the lower Macquarie River to provide connection from to the Barwon River, via
the mid-Macquarie and Macquarie Marshes.
The objective of the watering action was to facilitate the movement of native fish between the
Macquarie and Barwon rivers (in both directions). Environmental water was also expected to
provide additional environmental benefits, including the inundation of wetland vegetation,
provision of waterbird foraging habitat, and continued replenishment of groundwater systems.
2015–16
14,239 ML of Commonwealth environmental water was delivered to the Macquarie River and
Marshes in winter-spring 2015 and winter 2016 (in conjunction with NSW environmental
water).
It is expected that the contribution of Commonwealth environmental water to the Barwon-
Darling would have been small, with low flow rates being recorded at Bells Bridge between
September and December 2015. Flows remained below the 50 ML/day threshold over which
unregulated pumping can occur, so much of this water is expected to have reached the
Barwon River.
2013–14
10,000 ML of Commonwealth environmental water was delivered to the Macquarie Marshes
in winter-spring 2013, in conjunction with NSW environmental water.
Some connectivity with the Barwon River is expected to have occurred. Observational data
indicated that environmental flows entered Marthaguy Creek from the Eastern Marshes, and
passed Carinda. This water may have joined the lower Macquarie River, however, there are
no gauging sites to determine this. It is estimated that approximately 10,000 ML (including but
not limited to environmental water) passed Bells Bridge on the Macquarie River between
June and December 2013. However, the portion of Commonwealth environmental water is
unknown, and where flows were above 50 ML/day this water would have been subject to
unregulated extraction.

Ecological needs of low flows in the Barwon-Darling
Page 64
UNDER EMBARGO UNTIL 12.01AM WEDS 7 MARCH 2018
2012–13
100,000 ML of Commonwealth environmental water was delivered to the Macquarie Marshes
in spring 2012, in conjunction with NSW environmental water.
It is likely that some connectivity with the Barwon River occurred, however, the actual
contribution is not clear. Flows were above the threshold of 50 ML/day during and after the
delivery of Commonwealth environmental water, so it is likely that water may have been
extracted as unregulated water downstream.
Warrego River at Toorale
2016–17
In October 2016, approximately 7,800ML of environmental water from Warrego River
licences was left in stream to provide a flow to connect the Warrego and Darling rivers to
support fish, habitat and ecological processes in the Warrego River.
2013–14
Approximately 1,292.65ML of environmental water (Warrego and Darling entitlements) was
used to enhance natural flow variability in the Darling River and the Lower Warrego at
Toorale.
2011–12
Approximately 7,826ML of environmental water (Warrego River entitlements) was used to
enhance in-stream flows in the lower Warrego and Darling Rivers.
Barwon-Darling
Use of Commonwealth environmental water in the Barwon-Darling is dependent on river flow
triggers in licence conditions under the NSW Water Sharing Plan Barwon-Darling Unregulated
and Alluvial Water Source.
Commonwealth environmental water operates under the same rules as irrigation water. Water
that becomes available from the Commonwealth's unregulated holdings in the Barwon-Darling
River is left in-stream to support natural river flows and contribute to a more naturally variable
flow regime. How flows extend through the system depends on the size and duration of individual
flow events.
2016-17
Approximately 26,796 ML of environmental water entitlements from the Barwon River
entitlements and the Darling River entitlements at Toorale was left in-stream to support
natural river flows (baseflows, freshes, bankfull and overbank component). These flows
contributed to a more naturally variable flow regime to improve the resistance of aquatic biota
and the resilience of the system.
2015–16

Ecological needs of low flows in the Barwon-Darling
Page 65
UNDER EMBARGO UNTIL 12.01AM WEDS 7 MARCH 2018
Approximately 7,640 ML of environmental water entitlements from the Barwon River near
Collarenebri and the Darling River entitlements at Toorale was left in-stream to support natural
river flows (baseflows, freshes, bankfull and overbank component) and contribute to a more
naturally variable flow regime in this system to improve the resistance of aquatic biota and the
resilience of the system.
2014–15
Approximately 1,715 ML of environmental water entitlements from the Barwon River near
Collarenebri and the Darling River entitlements at Toorale was left in-stream to support
natural river flows (baseflows, freshes, bankfull and overbank component) and contribute to a
more naturally variable flow regime in this system to improve the resistance of aquatic biota
and the resilience of the system.
2013–14
Approximately 13,009 ML of environmental water entitlements from the Barwon River near
Collarenebri and the Darling River entitlements at Toorale was left in-stream to support
natural river flows (baseflows, freshes, bankfull and overbank component) and contribute to a
more naturally variable flow regime in this system to improve the resistance of aquatic biota
and the resilience of the system.
2012–13
Approximately 25,616 ML of environmental water entitlements from the Barwon River near
Collarenebri and the Darling River entitlements at Toorale was left in-stream to support
natural river flows (baseflows, freshes, bankfull and overbank component) and contribute to a
more naturally variable flow regime in this system to improve the resistance of aquatic biota
and the resilience of the system.
2011–12
Approximately 8,100 ML of Toorale entitlements was used to enhance in-stream flows to
benefit assets in the Warrego River downstream of Boera Dam and Darling River below the
junction with the Warrego.

Ecological needs of low flows in the Barwon-Darling
Page 66
UNDER EMBARGO UNTIL 12.01AM WEDS 7 MARCH 2018
Appendix C - Distribution of environmental flow indicator spells for
between 1990 and 2017.
Observed no-flow spells durations - 1990-01 to 2016-17 at Walgett
Observed spells between a flow event of 500 ML/d for 7 days - 1990-01 to 2016-17 at Walgett

Ecological needs of low flows in the Barwon-Darling
Page 67
UNDER EMBARGO UNTIL 12.01AM WEDS 7 MARCH 2018
Observed spells between a flow event of 500 ML/d for 20 days - 1990-01 to 2016-17 at Walgett
Observed no-flow spells durations - 1990-01 to 2016-17 at Bourke

Ecological needs of low flows in the Barwon-Darling
Page 68
UNDER EMBARGO UNTIL 12.01AM WEDS 7 MARCH 2018
Observed spells between a flow event of 500 ML/d for 7 days (Aug-May) - 1990-01 to 2016-17 at Bourke
Observed spells between a flow event of 500 ML/d for 20 days (Aug-May) - 1990-01 to 2016-17 at Bourke

Ecological needs of low flows in the Barwon-Darling
Page 69
UNDER EMBARGO UNTIL 12.01AM WEDS 7 MARCH 2018
Observed no-flow spells durations - 1990-01 to 2016-17 at Wilcannia
Observed length of spells between flow events of 2,000 ML/d for 5 days at Wilcannia using the observed flow record between 1990-91 and 2016-17. The figure shows the significant period between events between 2013 and 2016 (3.1 years); longer than the most significant spell experienced during the millennium drought in 2007 (2.4 years).