ECOLAB UPDATE...Strengthened Nalco Water Light Industry Focus on Downstream Mining to Phosphates,...
98
ECOLAB UPDATE DOUG BAKER CHAIRMAN AND CEO September 5, 2019
Transcript of ECOLAB UPDATE...Strengthened Nalco Water Light Industry Focus on Downstream Mining to Phosphates,...

ECOLAB UPDATE
DOUG BAKERCHAIRMAN AND CEOSeptember 5, 2019

WELCOME

We continue to get better
The world continues to get more complicated
Our strategy is as relevant as ever
We adjust via our plan
Our opportunities are large
Themes

It’s been a busy 2 years

We Invested
15 acquisitions
Deployed SAP in North AmericaEcolab is now 80% on SAP
$380M in digital investment
Built a Life Sciences business

We Grew Share
$2.2B
$2.6B
New Business Innovation

We Delivered
Quarterly Adjusted EPS Growth
8%
10%
14%13%
11%12%
13%12%
Q3 17 Q4 17 Q1 18 Q2 18 Q3 18 Q4 18 Q1 19 Q2 19

We Also Sharpened Our Focus
Sold Equipment Care (Dec ‘17)
Announced $325M efficiency initiative
Announced Spin of Upstream (Feb ‘19)

Spin of Upstream Energy
Ecolab$14.7B
Ecolab$12.2B
Ecolab$14.7B
Ecolab$12.2B
ChampionX$2.4B
Post Spin based on pro forma 2018

Temporarily Smaller, Permanently Stronger
More Focused
Less Cyclical
Higher Returns
HigherMargins Still Huge
Growth Upside

Excludes Upstream Energy. Market data reflects current estimates of potential opportunities.
Ecolab Opportunity $130B
10%
$72BUNSOLD
CUSTOMERS
$46BCIRCLE THE CUSTOMER
$106B$39B
$32B$18B
$57B19952000
20052010
2015
2020
We Remain Opportunity Rich
Sold

$0 $5,000 $10,000 $15,000 $20,000
Building Services
Other
Mining
Refining
Food Retail
Ed./Government
Life Sciences
Lodging
Light Industry
Paper
Heavy Industry
Food & Beverage
Health Care
Food Service
Major Opportunities in Existing Markets
$ MILLIONS Ecolab Remaining Opportunity
Excludes Upstream Energy. Market data reflects current estimates of potential opportunities.

$0 $5,000 $10,000 $15,000 $20,000
Building Services
Other
Mining
Refining
Food Retail
Ed./Government
Life Sciences
Lodging
Light Industry
Paper
Heavy Industry
Food & Beverage
Health Care
Food Service
$ MILLIONS Ecolab Remaining Opportunity
Life Sciences
$6B
(still secret)$300M
(still secret)$500M
Major Opportunities in Existing Markets
Excludes Upstream Energy. Market data reflects current estimates of potential opportunities.

Macro Trends Remain Relevant
AGING POPULATION
GROWING MIDDLE CLASS
POPULATION GROWTH
TECHNOLOGY
25% MORE PEOPLE by 2050, with most growth in emerging markets
in Europe, Japan,and China Higher RISK, More HEALTHCARE
More DISPOSABLE INCOME, More ENERGY,DIET SHIFTS to protein and away from home dining
Increased RISKS, and CAPABILITIES & OPPORTUNITIES
$ $$$
$$

Global Needs Continue to Drive Demand
50% MORE ENERGY 35% MORE FOOD

Perfectly Positioned
GLOBAL LEADER
19 trillionBTUs of energy
188 billion gallons of water
CLEAN WATER
SAFE FOOD
ABUNDANT ENERGY
HEALTHY ENVIRONMENTS
54 millionpounds of waste
2.4 billionpounds of CO2e
Annually saving customers:

Ranked #2 U.S. 500 List
Water A List
5th Consecutive Year
Recognized for ESG Leadership
2018 North America Index
Ranked #32Ranked #26
2018 Gold Medal for Sustainable Development13th Consecutive Year
MSCI ESGAAA(scale AAA to CCC)

While macro trends are consistent, micro trends aren’tChanging political and trade policies
Climate change pressure
Consumer awareness and activism

The “What we do” remains relevant
We are adjusting the “How we do it”

Execution Strategy Adjustments
Historical
Make where we sell
Best in class technology
Great talent
Global execution
Future
Make where we sell
Best in class technology
Great talent
Global / Local execution Key market enablement Decisions and accountability
closer to customerDigital!

The Digital Future
1. We have an advantaged position
2. This is a historic opportunity
3. We are on it

3 million customers, 170+ countries Majority collecting data Unique data sets provide unique opportunities
Data streams, knowledge unique to us What we collect unique How we interpret, based on our know-how
Challenge / opportunity Connect all 3 million to the cloud Efficiently turn data into predictive models
Killer App Predictive AI Field activation to create future
Digital Opportunity

Digital Benefits
1. Better value
2. Easier to do business with
3. More efficient

Remain Committed to our Targets
OPERATING INCOME
ROIC
15%EPS Growth
20%
20%
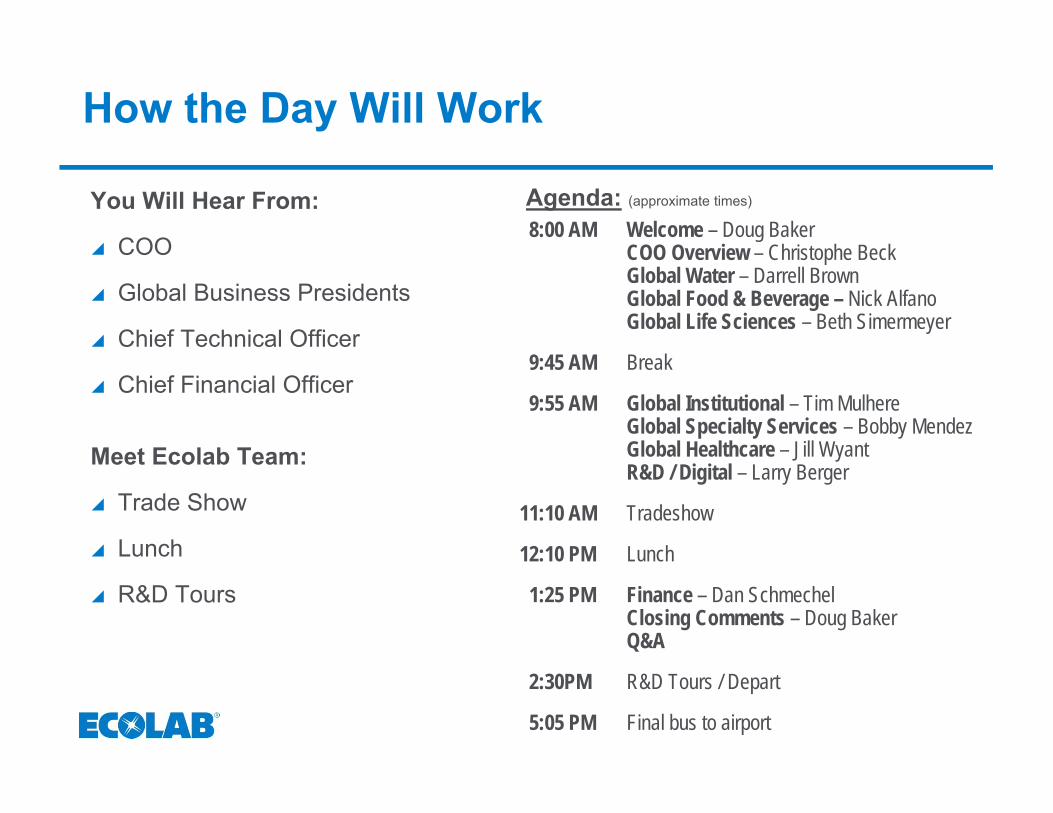
How the Day Will Work
13%
You Will Hear From:
COO
Global Business Presidents
Chief Technical Officer
Chief Financial Officer
Meet Ecolab Team:
Trade Show
Lunch
R&D Tours
Agenda: (approximate times)
8:00 AM Welcome – Doug BakerCOO Overview – Christophe BeckGlobal Water – Darrell BrownGlobal Food & Beverage – Nick AlfanoGlobal Life Sciences – Beth Simermeyer
9:45 AM Break
9:55 AM Global Institutional – Tim MulhereGlobal Specialty Services – Bobby Mendez Global Healthcare – Jill WyantR&D / Digital – Larry Berger
11:10 AM Tradeshow
12:10 PM Lunch
1:25 PM Finance – Dan SchmechelClosing Comments – Doug BakerQ&A
2:30PM R&D Tours / Depart
5:05 PM Final bus to airport
What You Will See and Hear Today
A step function change in our value
We have huge opportunity in front of us
We are focused
Most importantly…we have a great team

ECOLAB INVESTOR DAYCONTINUED EVOLUTION FOR CONTINUED HIGH PERFORMANCE
CHRISTOPHE BECK
September 5, 2019
PRESIDENT AND CHIEF OPERATING OFFICER

Early on growth journey
Uniquely positioned to win
Will continue to:
Deliver high performance
Focus on exceptional execution
Evolve to stay ahead

Uniquely positioned to win
GLOBAL LEADER
19 trillionBTUs of energy
188 billion gallons of water
CLEAN WATER
SAFE FOOD
ABUNDANT ENERGY
HEALTHY ENVIRONMENTS
54 millionpounds of waste
2.4 billionpounds of CO2e
Annually saving customers:
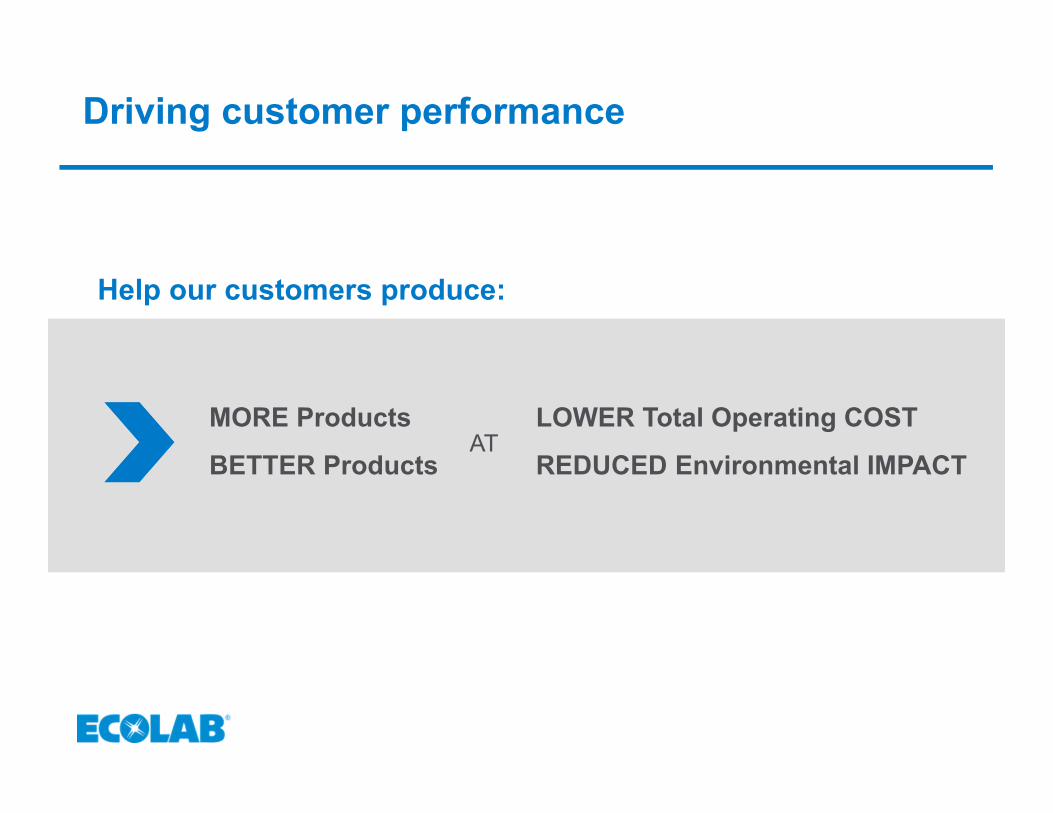
Driving customer performance
MORE Products
BETTER Products
LOWER Total Operating COST
REDUCED Environmental IMPACTAT
Help our customers produce:

Demonstrated, assured value
Strong value delivery driving premium pricing
> 25%

Huge opportunity
$12BSALES
$70BUNSOLD
CUSTOMERS
$45BCIRCLE THECUSTOMER
Addressing a $130B market (post spin)
$12BSALES
$70BUNSOLD
CUSTOMERS
$45BCIRCLE THECUSTOMER
$72BCIRCLE THE CUSTOMER
$46B
2018 SALES
$12BSALES
$70BUNSOLD
CUSTOMERS
2018 SALES
$12B
Market data reflects current estimates of potential opportunities
$118B of opportunity!

Continued drive for high performance
New Business
White Spaces
Innovation
Pricing
Digital
Operations Excellence
GROWTH
MARGINS
PRODUCTIVITY
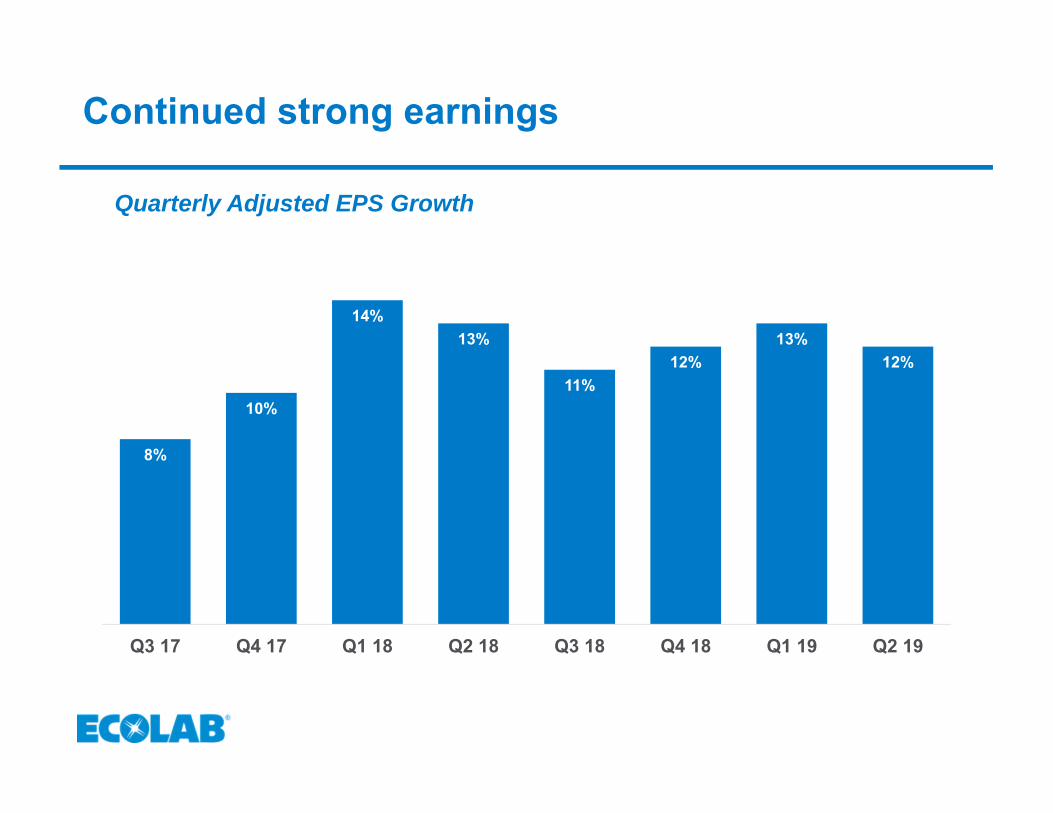
Continued strong earnings
Quarterly Adjusted EPS Growth
8%
10%
14%13%
11%12%
13%12%
Q3 17 Q4 17 Q1 18 Q2 18 Q3 18 Q4 18 Q1 19 Q2 19

Increased resilience
Strengthened Nalco Water Light Industry
Focus on Downstream
Mining to Phosphates, Paper to Boxes
PORTFOLIO
FOOTPRINT
DIGITAL
Expanded Geographies
New Segments
Lock & Key solutions
Globally connected sites
CONTINUOUS IMPROVEMENT
Catalyst / SAP
Efficiency Initiative

Continued focus on execution
New Business
+$1.3B
Innovation
Pricing
+2-3%
Productivity
2016 2017 2018 2019
$K / headcount
Pipeline
2016 2017 2018 2019

Continued focus on culture of accountability
High performance consistently delivered
Spend control
Stretch targets
Short-+
long-termCommitment

Circle The Customer, Circle The Globe
$12BSALES
$70BUNSOLD
CUSTOMERS
$45BCIRCLE THE CUSTOMER
Addressing a $130B market opportunity (post spin)
$12BSALES
$70BUNSOLD
CUSTOMERS
$45BCIRCLE THE CUSTOMER
$72BCIRCLE THE CUSTOMER
$46B
2018 SALES
$12BSALES
$70BUNSOLD
CUSTOMERS
UNSOLD CUSTOMERS
$72BCIRCLE THE CUSTOMER
$46B
2018 SALES
$12B
Market data reflects current estimates of potential opportunities

Leverage proven model
CHEMISTRY & DISPENSING
CHEMISTRY & DISPENSING
ON-SITE SERVICEON-SITE SERVICE
TRAININGTRAININGDATA-DRIVEN INSIGHTS
DATA-DRIVEN INSIGHTS $12B
SALES
$70BUNSOLD
CUSTOMERS
$45BCIRCLE THE CUSTOMER
BEST RESULTS AT LOWEST TOTAL COSTS
4x Opportunity Within Own Customers
$12BSALES
$70BUNSOLD
CUSTOMERS
$45BCIRCLE THE CUSTOMER
$72BCIRCLE THE CUSTOMER
$46B
2018 SALES
$12BSALES
$70BUNSOLD
CUSTOMERS
UNSOLD CUSTOMERS
$72BCIRCLE THE CUSTOMER
$46B
2018 SALES
$12B
Market data reflects current estimates of potential opportunities

Expand the opportunity
$12BSALES
$70BUNSOLD
CUSTOMERS
$45BCIRCLE THE CUSTOMER
$12BSALES
$70BUNSOLD
CUSTOMERS
$45BCIRCLE THE CUSTOMER
$72BCIRCLE THE CUSTOMER
$46B
2018 SALES
$12BSALES
$70BUNSOLD
CUSTOMERS
UNSOLD CUSTOMERS
$72BCIRCLE THE CUSTOMER
$46B
2018 SALES
$12B
Market data reflects current estimates of potential opportunities

Liquids
Solids
Digital and AI
Clean & Sanitize
Food Safety + Water
Infection Prevention
Institutional
Industrial
Healthcare, Life Sciences
North America
International
Mega Markets
Continued evolution
GLOBALIZATION
SEGMENTATION
$12B
$70B $45B
OFFERING
CAPABILITIES
UNSOLD CUSTOMERS
$72BCIRCLE THE CUSTOMER
$46B
2018 SALES
$12B
UNSOLD CUSTOMERS
$72BCIRCLE THE CUSTOMER
$46B
2018 SALES
$12B
Market data reflects current estimates of potential opportunities
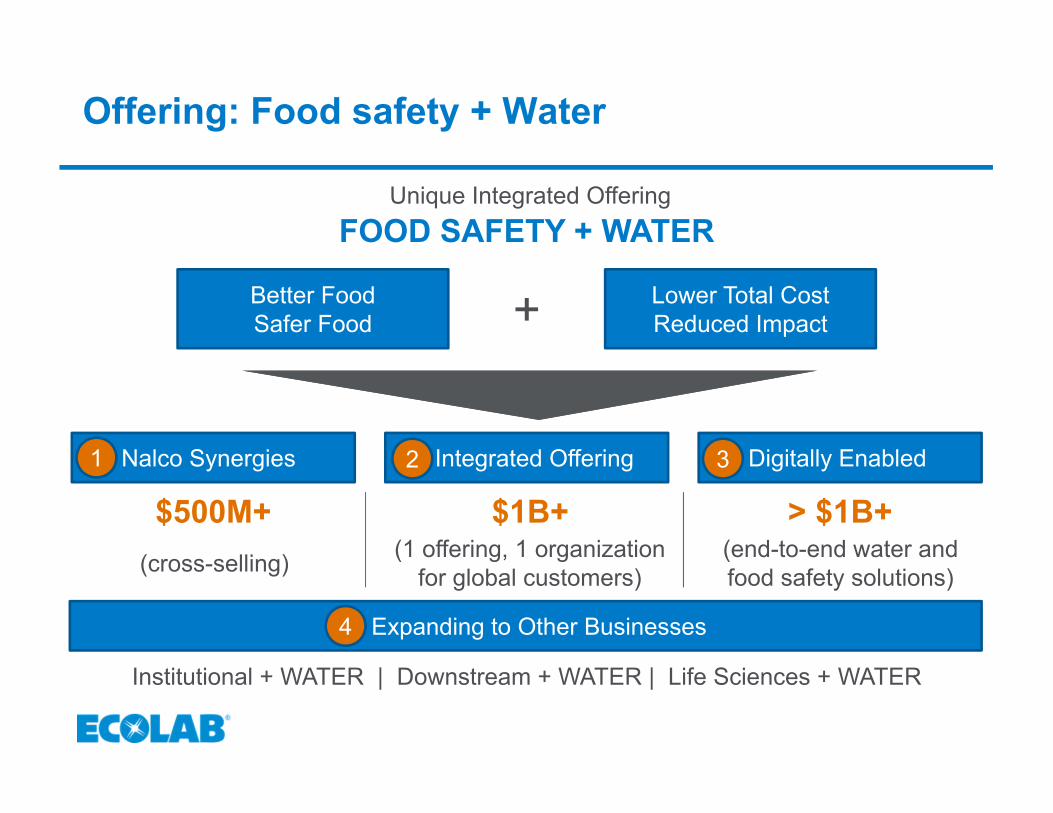
Offering: Food safety + Water
Unique Integrated OfferingFOOD SAFETY + WATER
Better FoodSafer Food
Lower Total CostReduced Impact+
Nalco Synergies Integrated Offering Digitally Enabled 1 2 3
Expanding to Other Businesses4
Institutional + WATER | Downstream + WATER | Life Sciences + WATER
(cross-selling)
$500M+ $1B+ > $1B+(1 offering, 1 organization
for global customers)(end-to-end water and food safety solutions)

Digital: Building on decades of tech experience
1988
2000+
2010
2019
2020+
TRASAR
Connected chemistry
Pool & Spa
Solids / Apex
System Assurance
Center
Remote monitoring
ECOLAB3D (Industrial)
Cloud platform
Predictive analytics
ECOLAB3D (Ecolab-wide)

Digital: Rich offering getting even stronger
18
WATER DOWNSTREAM FOOD & BEVERAGE
HEALTHCARE INSTITUTIONAL SPECIALTY
Hand Hygiene Compliance Monitoring
3D TRASAR
MarketGuard365Ecolab
Intelligence Platform
3D TRASARFor Clean-in-PlaceCrudeFlex

Digital: Strategic value drivers
Enhance Customer Value
and Revenue
Increase Field
Productivity
Drive Operational
Performance
- Digital offerings- Total site performance- Enterprise optimization
- Predictive analytics- Remote monitoring- Ecolab on your phone
- eCommerce- Live order management- Safe deliveries
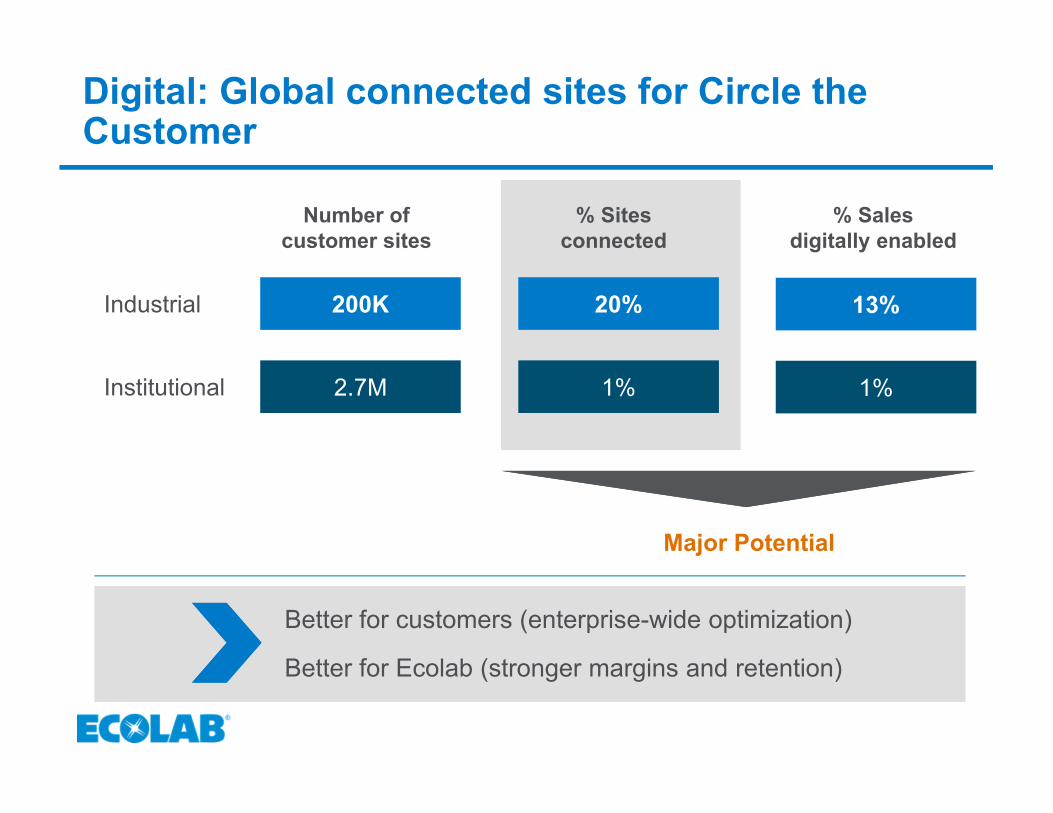
Digital: Global connected sites for Circle the Customer
% Sitesconnected
200K 20% 13%Industrial
Number of customer sites
% Salesdigitally enabled
2.7M 1% 1%Institutional
Major Potential
Better for customers (enterprise-wide optimization)
Better for Ecolab (stronger margins and retention)

Segmentation: New growth engines
WATER LIGHT LIFE SCIENCES NEW FOCUSDATA CENTERS
Secret

Globalization: Focus and expansion
Mega Markets International Markets
North America
International Markets
Western Europe
Greater China
14% market share
9% market share
11% market share
2% market share
$54B
$30B
$19B
$27B
Market data reflects current estimates of potential opportunities

Continued focus on priorities
1
2
3
New business
Margins
Productivity
Delivered globally

Continued success story
Huge and expanding opportunity
Proven model, continually refined
High performance consistently delivered
And
An unbeatable team

NALCO WATERDARRELL BROWNEVP & PRESIDENTSeptember 5, 2019

Capturing A Major Growth Opportunity
Water scarcity an increasing challenge for industry
Focus on customer core needs – improved results withwater and energy savings
Strong and sustainable business momentum
Emphasis on customer value creation and pricing capture
Unique global capabilities and footprint
Digital solutions strengthen value offerings

Delivering Value
FOR OUR CUSTOMERS:
Reducing industrial water consumption
FOR OUR WORLD:
Minimize Water Use
Target 300B gal water savings for our customers by 2030
Maximize ResultsOptimize Total Costs
Plant Process
BACKED BY A GLOBAL NETWORK OF OVER 6,000 EXPERTS SUPPORTING OVER 40,000 CUSTOMERS
BOILER
COOLING
PRE-TREATMENT
POST-TREATMENTPROCESSWATER IN WATER OUT
The Nalco Water Model

Segmentation – By Industry Expertise
5 GLOBAL DIVISIONS
4 CORE PLATFORMS
11 GLOBAL INDUSTRIES
170 Countries
Pretreatment | Cooling Water & Boilers | Process | Post-treatment
F&B | Manufacturing | Institutional | Transportation | Power | MetalsChemicals | Mining | Paper | Refining | Petrochemicals
LIGHT Industries
HEAVY Industries Mining Paper Downstream

Business Portfolio
North America
50%
Europe15%
AP, GC20%
LA10%
MEA5%
SALES BY REGION
$47B 9%
MARKET SIZE
$47 Billion Global Market Opportunity
Market data reflects current estimates of potential opportunities

Business Portfolio
Light 25%Paper 20%
Heavy20%
Mining5%
Other5%
Downstream25%
SALES BY SEGMENT

Our Strategic Ambition
Global Leader in Water Treatment Technology
and Management
Digital Solutions Strengthening Value
Offerings
Target 300B gal Water Savings for our
Customers by 2030
Minimize WaterMaximize Results
Optimize Total Costs
6% to 8% Organic Growth Ambition

PERFORMANCE Accelerating

$M+6-8%
Ambition
Accelerating Sales Performance
2019F

GROWTH FUNDAMENTALS in Place

Circle the Customer. HARD FOR COMPETITION TO REPLICATE.
The Winning Solution: Best Results, Lowest Total Cost
World-classsales and service
Long-standing customer
relationships
Industry leading innovation,
technology and digital solutions
Global knowledge transfer and training
Circle the Customer

Digital As A Growth Lever
DRIVE REVENUE
• ECOLAB 3D• System Optimization• Remote Monitoring
INCREASE PRODUCTIVITY
• Fewer Visits• Impactful Visits• Higher Value Visits
Increased Customer Value:30 Years of Digital Deployment │ Global Footprint
Collecting >90 Billion Data Points Per Year
• Asset Benchmarking• Industry Benchmarking• TCO Management
MAXIMIZE CUSTOMER
PERFORMANCE

Water Innovation StrategyOUTCOME DRIVEN, DIGITALLY ENABLED, PERFORMANCE GUARANTEED
INTEGRATED OFFERING
Chemical Treatment
Monitoring & Control
Performance Models via
Data Analytics
TCO & eROIAsset
Performance Dashboard
System Assurance Center
GROWTH MARKETS
MEGA TRENDS
DIFFERENTIATED TECHNOLOGIES
CUSTOMER VALUE CREATION

2017 2019
Strong Innovation Pipeline
3D CrudeFlexOMNI™ For Condenser
3D TRASAR™ Solid Cooling
LegionGuard™
3D TRASAR™ for Wastewater
FillerTEK™
WaterShedTailings
Management
3D TRASAR™ for Styrene Monomer
HEAVY PAPERLIGHTDOWNSTREAM MINING
ORT Oxalate Control
Technology
Ultis™ Dry² Strength
Technology
PURATE™

DIGITAL FIELD TOOLS CUSTOMER INSIGHTS
Service Model – Leveraged Best Practices
SEGMENTATION TRAINING

Long-term GROWTH TRAJECTORY

Water Demand –Significant And Increasing
Forecasted Water Cost Increases 2014-2030
0%
50%
100%
150%
200%
250%
1 2 3
+133%
+78%
+192%
USAChinaIndia
Water Stress / Quality
Demand – Ahead of Industry Growth

Growing Our Market – Expand Offerings
$20B
$8B
$13BOn-Site
Expertise
Chemical Services
Water Technology
$47B – Total Ecolab Water Market
3D TRASAR™Protected chemistry
Personal service
Filtration treatmentWastewaterPre-treatmentProcess controlRemote monitoring
On-site expertsConsultingPlant AssessmentData analytics
NEW TECHNOLOGIES NEW SERVICES
UNIQUE CHEMISTRY/SERVICES
DIGITAL ENABLEMENT
Market data reflects current estimates of potential opportunities

Downstream – A Great Opportunity
We provide solutions to critical issues in hydrocarbon manufacturing
MARKETS
Refining | Petrochemical | Utilities | Fuel Additives
REFINING FUEL ADDITIVES ETHYLENE R. MONOMERS POLYMERS
$1B IN SALES

Core Strategy: Expand End-to-End Offerings
$500K $2.5M
• Improve quality
• Save water & energy
• Optimize cost
• Digitize paint booth
$65K $520K $50K $500K
CHEMICAL SERVICES• 3D TRASAR™ for
Cooling Water
WATER SAFETYNEW OFFERINGS• Managed operations
• Water technologies
• Adiabatic cooling
• Digital Insights
CIRCLE THE CUSTOMER• Ecolab F&B / Pest
Elimination
• Core applications: boilersand cooling
• Innovative wastewatertechnologies
• Digital offerings
• Managed operations
• Recycle/reuse opportunities
TRANSPORTATION(e.g., automotive, trucks,
aerospace, auto parts, tire)
LIGHT INDUSTRY: FOOD & BEVERAGE
DATA CENTERS
-U.S.A.-Canada-Mexico-China
-Japan-Korea-Germany
FOCUS MARKETS
OWN THE PAINT BOOTH

Uniquely Positioned For High Growth
Sustainable Performance Increasing sales and profitability Impactful innovation Digitally enabled solutions
Fundamentals in Place Segmentation and Corporate Accounts Unique global capabilities and footprint Customer value creation and pricing capture
Expanded product offering Circle the Customer On-site expertise and digital capabilities Protected chemistry and technologies

GLOBAL FOOD & BEVERAGEEVP & GENERAL MANAGER GLOBAL FOOD & BEVERAGESeptember 5, 2019
NICK ALFANO

2
5 Anchor Platforms
BEVERAGE & BREWERY
4 Primary Market Segments
25,000+ Customers
$2B Market Leader in providing Cleaning, Sanitizing, Water and Waste Treatment Solutions to Food & Beverage processors
PROTEINDAIRY & AGRI FARMS
FOOD PROCESSING
Clean-in-Place Bottle WashConveyor
LubricationAntimicrobials Water & WasteManagement
Global Food & Beverage

North America
40%Europe
30%
AP, LA, MEA30%
Ecolab Share17%
$11BMARKET
$11 Billion Global Market Opportunity
MARKET SIZE SALES BY REGION
Market data reflects current estimates of potential opportunities

Winning in a Changing Customer Environment
Double digit growth with largestglobal food companies
Integrating & executinghygiene+water value proposition
Innovation drives operationalefficiency and improves margins
Digital solutions for bettercustomer outcomes and fieldproductivity
Pricing model captures costincreases and value delivery tocustomers
2%3%
3%5%
5%
$1.0B
$1.5B
$2.0B
2014 2015 2016 2017 2018
Ambition6-8%

Customer Consumer Regulatory
Mega Trends Shaping the F&B Landscape
Productivity & Sustainability
• Frequent change-overs• Shorter cycle times• Labor practices• Resource savings• Clean waste water
Consumption Preferences
• Healthy, organic, plant-based• Unique flavors, novel ingredients• Convenient on-the-go eating
Food Safety• Quality assurance• Low-residue, contaminant-free• “Natural” components• Ingredient/ label transparency
Digitization• Consumer influence• Automation for productivity• Real-time insights
Implications
Transform Food SafetyMaximize sales & profits safelyLower residue offeringsDigitally enable risk mgmt & actions
Access Growth in Emerging SegmentsSmall brands & unique snacks, beveragesPlant-based Dairy & ProteinContract manufacturers
Deliver End-to-End Hygiene-WaterSolutionsLarge Customer Enterprise model
Accelerate DigitalIncrease Food Safety & ProductivityStep up Field Productivity & ValueEasy, simple, intuitive experience

As Consumer Preferences Evolve…
+ CONVENIENCE +
1960s 1990s Today

7
…F&B Companies are Evolving with Them
Pork Ready-to-Eat
Juices
Natural & OrganicNon-meat Protein
Turkey
1986
2017
1994
201320152006
Healthier
Ethnic
1998
2018
2018
Carbonated Soft Drinks
2017
2015
Sports
2001
20081965
2006 2007 2018
2018
Probiotic
2016
2019
Protein Bev
2001
Water
ECL Sales: 2X2009 - 2019
Savory
ECL Sales: 3X2009 - 2019
Bevs
Snacks

From Hygiene to Holistic Solutions
Cooling Systems
Water Pretreatment
Boiler Water
Wastewater Operations
Pasteurizer
Brewhouse CIP Conveyor Lubes
Bottlewashing
Filler CIP
Cellar CIP
Food SafetyWater
Recycled CIP Rinse Water

Large Customer Enterprise Team DeliveringF&
B G
loba
l Sol
utio
ns Global Acct Mgr
Marketing
Finance
R&D
ONETeam
OUTSTANDING Results
ENTERPRISEHygiene + Water Treatment
Value Prop+ =
Optimal Quality &
Food Safety
MinimizedWater Usage
ImprovedOperationalEfficiency
Global Service & Expertise
Digital Insights
Innovation
Customer outcomes
Enabled by

Innovation + Digital for Exceptional Outcomes
Analog single point data Manual analysis Reactive
THEN NOW
DAIRY
PROTEIN Poor concentration control Pathogen risk Reactive
3D TRASAR™ CIPSYNERGEX™
Continuous monitoring Millions of data points Real-time analysis + troubleshooting Improved quality Longer shelf life
Out of spec concentration identified by
3D TRASARTM CIP
INSPEXX™ 250ANTIMICROBIAL
INSIGHTS
Continuous monitoring Reduced pathogen risk No labeling / organic

11
Antimicrobial Insights + Inspexx™ 250 helped a poultry customer achieve better product quality with less commodity caustic and water
Less WaterBetter Quality
10% Price Premium
CASE STUDY: North American Poultry Processor
40% less caustic
Less Commodity(Better pH Control)
Improved Quality and Efficiency
$18M value created annually
Cat 1 from Cat 3
PRODUCT QUALITY
7M gallons20% Less Water
11.7K gallons

12
Improved Productivity & QualityCASE STUDY: North American Cheese and Whey Producer
SynergexTM helped a customer eliminatethe need for nightly acid washing – saving time, water and opening up new markets
More Production
842 hoursReduced total CIP time by 40%
Better Quality
Opened up export marketsPRODUCT
QUALITY
0 nitrates
Less Water
1.2M gallons
Reduced post rinse time by 25%
$15M value created annually

13
Expanding Growth Opportunities
Protein Biofuels Small Food
Real-time Insights
Online Ordering & Tracking
Low Residue/ Organic Offerings
Hygiene–WaterOffering
Productivity Offerings
Dynamic Optimization
NEWSEGMENTS
Globalize and Accelerate
INNOVATIONDevelop Next
Gen Cleaning & Sanitizing
DIGITALMove from Reactive to
Proactive, Drive Productivity

Global Food & Beverage Summary
Market LeaderStrong Franchise with Solid Record of Growth & Profitability
Major Growth OpportunitiesContinued Globalization and Segment Focus
Favorable Market LandscapeConsumer Demands for Nutritious & Safe Food
Delivering Superior Value through Enterprise SellingMaximizing Customer Operations
Leveraging Innovation and Digital to WinSolving Food Safety, Productivity and Sustainability Challenges

LIFE SCIENCESBETH SIMERMEYEREXECUTIVE VICE PRESIDENT & GENERAL MANAGER GLOBAL LIFE SCIENCES

Global Life Sciences Summary
Large and Growing Opportunity $5B+ market with needs Ecolab uniquely positioned
to solve
Favorable Macro Trends Aging/growing population, increasing regulations, rapid
development of new medicines, cost pressure
Ideal Setting for Ecolab Business Model Highly consolidated customers and
highly fragmented competitors
Outcome-Based Programs Gaining Traction Focused on ensuring safety, compliance and
operational efficiency
Building our Global Franchise Growth-enabling investments in Corporate Accounts,
field sales, marketing and technical support
Market data reflects current estimates of potential opportunities

4% Current Share with Opportunity to Grow
Ecolab Share 4%
$5B+ Market Size10,000facilities globally
5% market growth
Fragmentedcompetitive landscape
Quality and safety are paramount
Market data reflects current estimates of potential opportunities

Continued Strong Growth to Gain Traction as Global Leader
$50
$100
$150
2015 2016 2017 2018 AmbitionDivision Created
$ M
illio
ns
+12%

Solutions for the Whole PlantCombining Food & Beverage, Healthcare and Water Expertise
Non-Sterile Manufacturing Area Cleanroom (Sterile)

Four Unique Programs That DeliverSafety, Compliance and Operational Efficiency
Safer, Compliant and More Efficient Plants
Cleanrooms Clean In Place / Clean Out of Place
Vaporized Hydrogen Peroxide (Bioquell)
PharmaceuticalClean In Place / Clean Out
of Place
Personal Care
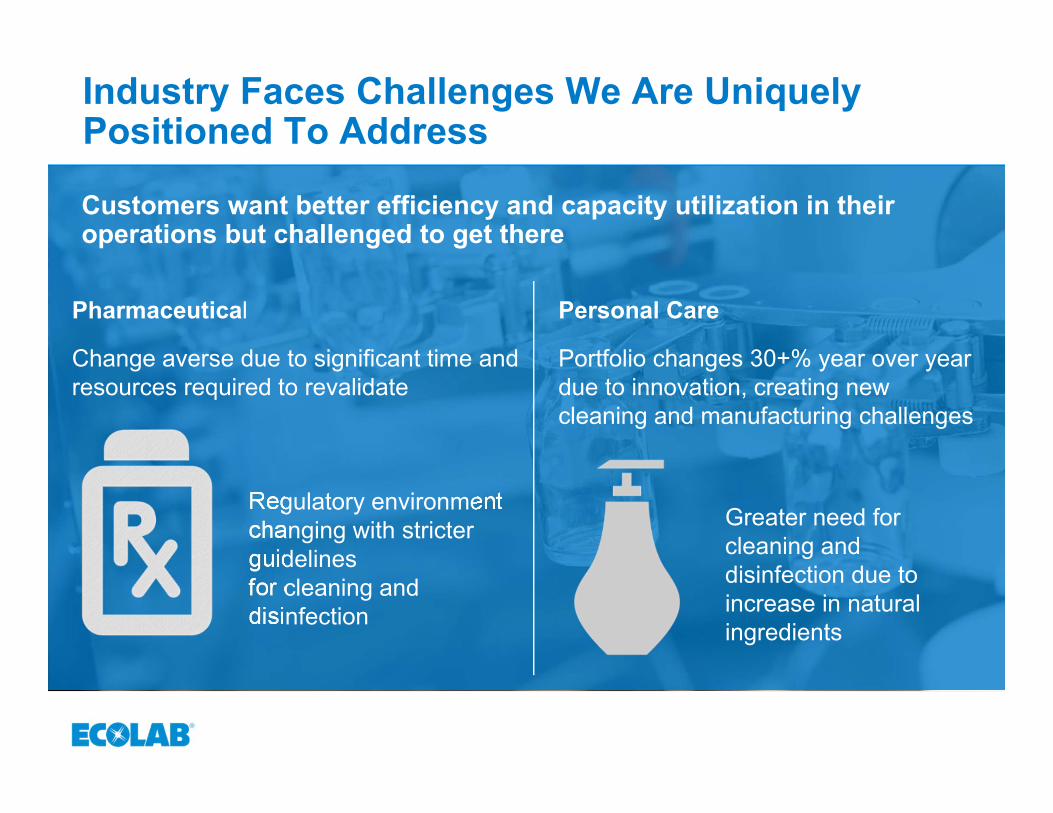
Industry Faces Challenges We Are Uniquely Positioned To Address
Change averse due to significant time and resources required to revalidate
Customers want better efficiency and capacity utilization in their operations but challenged to get there
Portfolio changes 30+% year over year due to innovation, creating new cleaning and manufacturing challenges
Regulatory environment changing with stricter guidelines for cleaning and disinfection
Greater need for cleaning and disinfection due to increase in natural ingredients
Pharmaceutical Personal Care

Meeting Manufacturers Diverse Needs

Total Plant Solutions
CLEANING & DISINFECTION VALIDATION SUPPORT
CLEANING & DISINFECTION PROGRAMS
TECHNICAL LAB SUPPORT
REGULATORY & SCIENTIFIC INSIGHTS
CUSTOMER TRAINING
SITE SURVEY
Strong Partnership With Leading Global Pharmaceutical and Personal Care Manufacturers

Delivering Significant Value to Biosciences: Customer Example
Increase in production worth more than $1 million per year from improved operational efficiency
Customer looked to Ecolab to improve their centrifuge cleaning and sanitizing program
Reduced Clean-in-Place (CIP) time by >1,000 hours per year, resulting in over $2 million in total cost savings from reduced cleaning time and increased productivity
1.7 million gallons of water saved per year

Improving Operational Efficiency for Personal Care: Customer Example
315,000 kWh of energy saved per year
9 full weeks of cleaning and sanitizing time saved per year
472,500 pounds [200 metric tons] of CO2 emissions avoided per year
1.8 million gallons of water saved per year
Customer enlisted Ecolab’s help to improve the efficiency and sustainability of its cleaning and sanitizing process.

Global Life Sciences Summary
Industry Faces Significant Challenges We AreUniquely Positioned To Solve
Chasing A Large Opportunity $5B+ global opportunity Expanding leadership positions in North America and Europe
more broadly
Highly Consolidated Customer Set and a HighlyFragmented Competitive Set
Total Plant Solutions Approach Gaining Traction Safety, compliance and operational efficiency
Performance Accelerating Ambition of double-digit organic growth Acquisitions to add scale, coverage, technology, product lines
Market data reflects current estimates of potential opportunities