EcoEvo-MAPS: An Ecology and Evolution Assessment for ...
14
University of Nebraska - Lincoln University of Nebraska - Lincoln DigitalCommons@University of Nebraska - Lincoln DigitalCommons@University of Nebraska - Lincoln Faculty Publications in the Biological Sciences Papers in the Biological Sciences 2018 EcoEvo-MAPS: An Ecology and Evolution Assessment for EcoEvo-MAPS: An Ecology and Evolution Assessment for Introductory through Advanced Undergraduates Introductory through Advanced Undergraduates Mindi M. Summers University of Calgary, [email protected] Brian A. Couch University of Nebraska - Lincoln, [email protected] Jennifer K. Knight University of Colorado Boulder, [email protected] Sara E. Brownell Arizona State University Alison J. Crowe University of Washington See next page for additional authors Follow this and additional works at: https://digitalcommons.unl.edu/bioscifacpub Part of the Biology Commons Summers, Mindi M.; Couch, Brian A.; Knight, Jennifer K.; Brownell, Sara E.; Crowe, Alison J.; Semsar, Katharine; Wright, Christian D.; and Smith, Michelle K., "EcoEvo-MAPS: An Ecology and Evolution Assessment for Introductory through Advanced Undergraduates" (2018). Faculty Publications in the Biological Sciences. 642. https://digitalcommons.unl.edu/bioscifacpub/642 This Article is brought to you for free and open access by the Papers in the Biological Sciences at DigitalCommons@University of Nebraska - Lincoln. It has been accepted for inclusion in Faculty Publications in the Biological Sciences by an authorized administrator of DigitalCommons@University of Nebraska - Lincoln.
Transcript of EcoEvo-MAPS: An Ecology and Evolution Assessment for ...

University of Nebraska - Lincoln University of Nebraska - Lincoln
DigitalCommons@University of Nebraska - Lincoln DigitalCommons@University of Nebraska - Lincoln
Faculty Publications in the Biological Sciences Papers in the Biological Sciences
2018
EcoEvo-MAPS: An Ecology and Evolution Assessment for EcoEvo-MAPS: An Ecology and Evolution Assessment for
Introductory through Advanced Undergraduates Introductory through Advanced Undergraduates
Mindi M. Summers University of Calgary, [email protected]
Brian A. Couch University of Nebraska - Lincoln, [email protected]
Jennifer K. Knight University of Colorado Boulder, [email protected]
Sara E. Brownell Arizona State University
Alison J. Crowe University of Washington
See next page for additional authors
Follow this and additional works at: https://digitalcommons.unl.edu/bioscifacpub
Part of the Biology Commons
Summers, Mindi M.; Couch, Brian A.; Knight, Jennifer K.; Brownell, Sara E.; Crowe, Alison J.; Semsar, Katharine; Wright, Christian D.; and Smith, Michelle K., "EcoEvo-MAPS: An Ecology and Evolution Assessment for Introductory through Advanced Undergraduates" (2018). Faculty Publications in the Biological Sciences. 642. https://digitalcommons.unl.edu/bioscifacpub/642
This Article is brought to you for free and open access by the Papers in the Biological Sciences at DigitalCommons@University of Nebraska - Lincoln. It has been accepted for inclusion in Faculty Publications in the Biological Sciences by an authorized administrator of DigitalCommons@University of Nebraska - Lincoln.
Authors Authors Mindi M. Summers, Brian A. Couch, Jennifer K. Knight, Sara E. Brownell, Alison J. Crowe, Katharine Semsar, Christian D. Wright, and Michelle K. Smith
This article is available at DigitalCommons@University of Nebraska - Lincoln: https://digitalcommons.unl.edu/bioscifacpub/642

CBE—Life Sciences Education • 17:ar18, 1–12, Summer 2018 17:ar18, 1
ARTICLE
ABSTRACTA new assessment tool, Ecology and Evolution–Measuring Achievement and Progression in Science or EcoEvo-MAPS, measures student thinking in ecology and evolution during an undergraduate course of study. EcoEvo-MAPS targets foundational concepts in ecology and evolution and uses a novel approach that asks students to evaluate a series of predic-tions, conclusions, or interpretations as likely or unlikely to be true given a specific scenar-io. We collected evidence of validity and reliability for EcoEvo-MAPS through an iterative process of faculty review, student interviews, and analyses of assessment data from more than 3000 students at 34 associate’s-, bachelor’s-, master’s-, and doctoral-granting institutions. The 63 likely/unlikely statements range in difficulty and target student un-derstanding of key concepts aligned with the Vision and Change report. This assessment provides departments with a tool to measure student thinking at different time points in the curriculum and provides data that can be used to inform curricular and instructional modifications.
INTRODUCTIONMany biology instructors and departments have embraced scientific teaching to increase student engagement, learning, and persistence (National Research Council [NRC], 2003; Handelsman et al., 2004; American Association for the Advancement of Science [AAAS], 2011; Couch et al., 2015a). This evidence-driven approach requires assessment tools that can measure, observe, or make inferences about student learning (AAAS, 2015). To collect evidence on student thinking, biology education researchers have developed a wide range of tools that differ from most instructor-generated class-room assessments, such as exams, in that their design is based on current understand-ing of student thinking; they typically focus on a few important concepts with which students are known to struggle; and, arguably most importantly, they are backed up by substantial data collection that provides evidence of validity and reliability (Knight, 2010; Campbell and Nehm, 2013; Reeves and Marbach-Ad, 2016).
For instructors interested in student thinking in ecology and evolution, there are concept inventories available for natural selection, genetics, evolutionary develop-mental biology, genetic drift, and macroevolution (Anderson et al., 2002; Smith et al., 2008; Nadelson and Southerland, 2010; Perez et al., 2013; Price et al., 2014; Fiedler and Harms, 2016; Kalinowski et al., 2016) and additional instruments, such as the ACORNS tool, that focus on student written explanations of evolutionary change (Nehm et al., 2012). Notably, there is only one ecology-focused tool, which is an energy and matter short-answer diagnostic (Wilson et al., 2007; Hartley et al., 2011). Such
Mindi M. Summers,†* Brian A. Couch,‡ Jennifer K. Knight,§ Sara E. Brownell,∥ Alison J. Crowe,¶ Katharine Semsar,# Christian D. Wright,∥ and Michelle K. Smith@
†Department of Biological Sciences, University of Calgary, Calgary, AB T2N 1N4, Canada; ‡School of Biological Sciences, University of Nebraska–Lincoln, Lincoln, NE 68588; §Molecular, Cellular, and Developmental Biology and #Miramontes Arts and Sciences Program, University of Colorado–Boulder, Boulder, CO 80309; ∥School of Life Sciences, Arizona State University, Tempe, AZ 85281; ¶Department of Biology, University of Washington, Seattle, WA 98105; @School of Biology and Ecology, University Maine, Orono, ME 04469
EcoEvo-MAPS: An Ecology and Evolution Assessment for Introductory through Advanced Undergraduates
Janet Batzli, Monitoring EditorSubmitted February 21, 2017; Revised January 4, 2018; Accepted January 17, 2018
DOI:10.1187/cbe.17-02-0037
*Address correspondence to: Mindi M. Summers ([email protected]).
© 2018 M. M. Summers et al. CBE—Life Sciences Education © 2018 The American Society for Cell Biology. This article is distributed by The American Society for Cell Biology under license from the author(s). It is available to the public under an Attribution–Noncommercial–Share Alike 3.0 Unported Creative Commons License (http://creativecommons.org/licenses/by-nc-sa/3.0).
“ASCB®” and “The American Society for Cell Biology®” are registered trademarks of The American Society for Cell Biology.
CBE Life Sci Educ June 1, 2018 17:ar18
proyster2
Typewritten Text
© 2018 M. M. Summers et al. Open acces; published under CC-BY-NC-SA license.

17:ar18, 2 CBE—Life Sciences Education • 17:ar18, Summer 2018
M. M. Summers et al.
assessment tools have allowed instructors to investigate teach-ing practices and have fostered faculty collaboration (Marbach- Ad et al., 2010); however, many existing concept inventories focus on a single topic and were designed to measure change in student understanding over a single course (D’Avanzo, 2008). To ensure that a data-driven approach is used to inform strate-gic planning at a department-wide scale (Middaugh et al., 2011), there remains a need for assessment tools purposefully designed to collect broad data on student thinking at multiple time points in the curriculum (AAAS, 2015).
In this article, we describe the development and use of Ecol-ogy and Evolution–Measuring Achievement and Progression in Science (EcoEvo-MAPS), a novel assessment instrument designed to infer student thinking throughout an undergradu-ate degree program. EcoEvo-MAPS is part of a suite of program-matic assessment instruments—referred to as Bio-MAPS—that includes the Molecular Biology Capstone Assessment (Couch et al., 2015b) and two more assessments being developed to address physiology (Phys-MAPS) and general biology (GenBio- MAPS). These assessments are intended to measure differences in student thinking when administered at multiple time points during an undergraduate program—such as when students enter the major, after the introductory biology series, and just before graduation. Each assessment is aligned with the core concepts of biology outlined in the Vision and Change report (AAAS, 2011) and further articulated in the BioCore Guide (Brownell et al., 2014): evolution, structure function, informa-tion flow, pathways and transformations of energy and matter, and systems. These core concepts were developed following conversations with more than 500 stakeholders in biology education, are supported by several national funding agencies, and overlap with the Next Generation Science Standards (NGSS Lead States, 2013) for K–12 education. While these assess-ments follow the methodology used for the development of concept inventories (NRC, 2001; Adams and Wieman, 2011; Bass et al., 2016), they differ in covering a wide breadth of con-cepts and are designed to measure student learning in cohorts of students at different time points in the undergraduate program.
EcoEvo-MAPS can be used to provide a snapshot of overall student thinking on ecology and evolution concepts that faculty agree are fundamental. We report on evidence of content valid-ity and reliability for EcoEvo-MAPS and present a set of con-cepts, revealed by this instrument, that students at a wide range of institutions persistently struggle to learn. We also suggest a methodology for departments to collect data in order to make inferences about such persistently challenging concepts. Col-lecting these data is an important step in stimulating data-driven conversations about departmental and instructional change.
METHODSQuestion DevelopmentWe developed the EcoEvo-MAPS questions through an iterative process (NRC, 2001; Adams and Wieman, 2011; Bass et al., 2016) similar to that used for other biology concept assess-ments to optimize assessment validity (Smith et al., 2008; Price et al., 2014; Couch et al., 2015b). This approach involved mul-tiple cycles of revision, including feedback from both students and faculty experts (Table 1).
TABLE 1. Overview of EcoEvo-MAPS development process
1. Identify foundational themes in ecology and evolution through textbook review, Vision and Change, BioCore Guide, CourseSource Ecology Learning Framework, and feedback from 51 faculty
2. Conduct literature review of ideas, concepts, and skills with which students struggle
3. Draft a set of scenarios and multiple likely/unlikely statements4. Iteratively modify questions and likely/unlikely statements based
on:
• Eighty-six student think-aloud interviews • Online feedback from 106 faculty at 70 institutions regarding
the accuracy and clarity of each question and likely/unlikely statement
• Results from administering EcoEvo-MAPS to students: ◦ Pilot 1 (Spring 2015): 98 students at one institution ◦ Pilot 2 (Fall 2015): 1411 students at 10 institutions ◦ Pilot 3 (Fall 2015): 791 students at 17 institutions ◦ Pilot 4 (Spring 2016): 356 students at four institutions
5. Final version of EcoEvo-MAPS completed and automatic-scoring template generated
6. Eleven faculty review final version for scientific accuracy and clarity
7. Administer final version of EcoEvo-MAPS assessment to 3237 introductory and advanced students at 22 institutions over two semesters
8. Conduct analyses to document student performance overall and for each likely/unlikely statement (percent correct), difficulty and discrimination for each likely/unlikely statement (classical test theory and IRT modeling), evidence of reliability (Cronbach’s alpha), and potential demographic characteristics influencing test score (linear mixed model and logistic regression DIF analysis)
Determining Content Coverage. To develop questions and determine content coverage, we used the core concepts out-lined in Vision and Change (AAAS, 2011) and more specifically articulated in the BioCore Guide (Brownell et al., 2014). Recog-nizing that the Vision and Change categories of core concepts are intentionally broad, we also reviewed 10 common ecology and evolution textbooks (Smith and Smith, 2001, 2003; Cotgreave and Forseth, 2002; Stearns and Hoekstra, 2005; Rose and Mueller, 2006; Barton et al., 2007; Futuyma, 2009; Ricklefs and Miller, 2010; Zimmer and Emlen, 2015; Bergstrom and Dugatkin, 2016), solicited ideas from faculty members, and surveyed the education literature on ecology and evolution (e.g., Munson, 1994; Barak et al., 1997; Nehm and Reilly, 2007; Nehm and Ridgway, 2011; Baum and Offner, 2008; Hartley et al., 2011; Andrews et al., 2012; Chabalengula et al., 2012; Opitz et al., 2016) to develop a list of key ecology and evolution concepts. Fifty-one faculty members reviewed these concepts for importance and omissions using an online Qualtrics survey. These faculty were recruited through snowball sampling, wherein each respondent recommended additional reviewers. The larger list of concepts was then consolidated into eight ecology and evolution “themes” based on those identified by a CourseSource working group (www.coursesource.org/courses/ecology): heritable variation, modes of change, phylogeny and evolutionary history, biological diversity, populations, energy and matter, interactions within ecosystems, and human impact (Supplemental Table S1).

CBE—Life Sciences Education • 17:ar18, Summer 2018 17:ar18, 3
EcoEvo-MAPS Assessment Tool
Question Design. We designed EcoEvo-MAPS questions to provide inferences about student thinking in ecology and evolu-tion and to support development and evaluation of curricular practices at the departmental level. The questions ask students to read a narrative question stem inspired by primary scientific literature that includes observations and evidence, similar to the format used for other concept inventories and capstone assessments (Price et al., 2014; Couch et al., 2015b). Students answer whether or not a series of statements (including predic-tions, conclusions, and interpretations) are likely or unlikely to be true based on this information.
The likely/unlikely to be true format is, to the best of our knowledge, a novel approach to asking true/false questions in biology. The questions use this terminology rather than true/false, because both students and faculty experts were uncom-fortable using the absolute terms of true and false when making predictions, generalizations, or transferring their knowledge to a novel evolutionary or ecological scenario. Presenting the statements as likely/unlikely also most closely matched the research literature in ecology and evolution journals; a survey of the text of articles in two highly read ecology and evolution journals (Ecology Letters and Evolution) found many examples of nonabsolute language (e.g., probable, possible, suggests, likely, supports, maybe) but very few examples of absolute ter-minology (e.g., true, false, known, definite, indisputable). Therefore, using nonabsolutes of likely/unlikely allowed EcoE-vo-MAPS to better reflect the nature of ecology and evolution as a subject area and field of scientific inquiry. All questions are available in Supplemental Appendix S1.
Iterative Revision of Questions to Increase Response and Content Validity. We iteratively revised all questions as feed-back and results were collected from student think-aloud inter-views, faculty feedback, and four pilot administrations at 23 institutions. Table 1 shows an overview of the process.
We recruited and interviewed 86 introductory and advanced undergraduate biology students using a semistructured format (Anders and Simon, 1980) to improve question clarity and col-lect associated student thinking for each likely/unlikely state-ment (student demographics provided in Supplemental Table S2). Students read each question and were asked to “think aloud” to as many questions as they could within a 1-hour interview, as described and used previously (Smith et al., 2008; Marbach-Ad et al., 2009). Students typically discussed their thinking on 80% of the questions. As students answered ques-tions, we also asked them to identify any wording or graphics that were not clear. In revisions, we sought to exclude jargon, and we simplified figures and graphs until introductory stu-dents were able to consistently understand each question. We coded student responses as one of the following: 1) correct response with accurate reasoning (aligned with expert reason-ing); 2) correct response with inaccurate reasoning; 3) incor-rect response with accurate reasoning; or 4) incorrect response with inaccurate reasoning. We iteratively revised question narratives, graphs, and likely/unlikely statement wording to increase clarity and decrease the occurrence of correct responses with inaccurate reasoning to less than 20% for the majority of questions. Twelve or more students (average = 23 students) were interviewed for the final version of each likely/unlikely statement.
We incorporated feedback from 106 faculty at 70 associ-ate’s-, baccalaureate’s-, master’s-, and doctoral-granting institu-tions within the United States and internationally to collect evidence that the questions were scientifically accurate and clear and to revise questions that were not (Table 1). Each fac-ulty member reviewed four to five questions online, rated whether each likely/unlikely statement was “scientifically accu-rate” and “clear,” and provided comments and feedback. We revised the questions based on faculty feedback until >80% of faculty agreed that each likely/unlikely statement was scientifi-cally accurate and clear.
During the development of the assessment, 2622 biology students at 23 institutions took one of four pilot versions of EcoEvo-MAPS, and their responses were used to make iterative revisions (Table 1; institutional data provided in Table 2). We used a Qualtrics online survey platform to administer the sur-vey, with the questions presented in a random order. Instructors announced the opportunity and gave extra credit or homework points for completion. Supplemental Appendix S2 shows suggested language for verbal and email student instructions. Students typically had one week to complete the survey outside class and were not given the answers at the completion of the assessment. Limiting student access to the answers reduces the possibility of students sharing and memorizing answers, which could potentially affect test–retest results.
We used both classical test theory and item response theory (IRT; Doran, 1980; Chalmers, 2012) to estimate statement dif-ficulty and discrimination. Using classical test theory, we calcu-lated statement difficulty as the percent of students answering each statement correctly. In addition, we calculated discrimina-tion by subtracting the statement difficulty for the bottom third of students from the statement difficulty for the top third of students (Doran, 1980). We revised or eliminated statements with difficulty (i.e., percent correct) below 30% or above 90% and/or discrimination less than 20% after each pilot, unless they were aligned with a concept deemed essential from faculty feedback or were statements targeting known conceptual diffi-culties in the literature (e.g., energy and matter; Hartley et al., 2011). Following the revisions after each pilot, questions under-went additional faculty feedback and student interviews.
Final Version of EcoEvo-MAPSAdministration. To collect data supporting the utility of EcoE-vo-MAPS across a wide range of institutions, we administered the final version of EcoEvo-MAPS online through the Qualtrics platform to 3237 introductory to advanced students enrolled in 38 courses at 22 institutions (one associate’s college, five bacca-laureate colleges, five master’s colleges and universities, and 11 doctoral universities; see Table 2). Students saw the questions in a random order and took approximately 15–35 minutes to complete the assessment. Students received participation credit for completing the test, which is recommended for the adminis-tration of other concept assessments (Couch and Knight, 2015). Of the 3237 students who took the final version of the assess-ment, 2750 of the students were 18 years or older and con-sented to have their responses used for research purposes (85% of students).
We excluded data from the statistical analyses if the student: did not answer all of the likely/unlikely statements following a single question stem; did not indicate current class standing as

17:ar18, 4 CBE—Life Sciences Education • 17:ar18, Summer 2018
M. M. Summers et al.
TABLE 2. EcoEvo-MAPS pilot institution with Carnegie (for American) and Maclean’s (for Canadian) rankingsa
Control Research activity RegionTotal number of participants
[final]b
Number of courses: final
Public Doctoral Universities: Higher Research Activity New England 1731 [850] 4Public Medical Doctoral Canada 968 [656] 2Public Doctoral Universities: Highest Research Activity Plains 382 [302] 1Public Doctoral Universities: Highest Research Activity Southeast 292 [183] 1Private Baccalaureate Colleges: Diverse Fields Rocky Mountains 173 [173] 3Private Baccalaureate Colleges: Diverse Fields Rocky Mountains 173 [173] 1Public Doctoral Universities: Highest Research Activity Southeast 354 [142] 1Public Master’s Colleges & Universities: Larger Programs Great Lakes 106 [106] 3Public Master’s Colleges & Universities: Larger Programs Mid East 97 [97] 2Private Baccalaureate Colleges: Arts & Sciences Focus Great Lakes 96 [96] 5Public Doctoral Universities: Moderate Research Activities Far West 82 [82] 1Public Associate’s Colleges: High Transfer-High Traditional Southwest 197 [74] 3Public Doctoral Universities: Higher Research Activity Far West 63 [63] 1Private Doctoral Universities: Higher Research Activity New England 52 [52] 1Private Baccalaureate Colleges: Arts & Sciences Focus Mid East 104 [43] 2Public Doctoral Universities: Highest Research Activity Far West 71 [29] 1Private Doctoral Universities: Higher Research Activity Southeast 23 [23] 1Private Baccalaureate Colleges: Arts & Sciences Focus Southeast 37 [25] 1Private Master’s Colleges & Universities: Larger Programs New England 22 [22] 1Private Master’s Colleges & Universities: Medium Programs Southeast 19 [19] 1Private Master’s Colleges & Universities: Larger Programs Mid East 123 [15] 1Public Doctoral Universities: Highest Research Activity Mid East 26 [12] 1
Private Master’s Colleges & Universities: Larger Programs New England 132Public Master’s Colleges & Universities: Larger Programs Southeast 115Public Baccalaureate Colleges: Arts & Sciences Focus Southeast 89Private Baccalaureate Colleges: Arts & Sciences Focus Plains 71Private Doctoral Universities: Moderate Research Activities Far West 63Private Master’s Colleges & Universities: Larger Programs Mid East 51Public Doctoral Universities: Highest Research Activity Southeast 44Private Baccalaureate Colleges: Arts & Sciences Focus Mid East 34Public Baccalaureate Colleges: Arts & Sciences Focus Rocky Mountains 33Public Master’s Colleges & Universities: Medium Programs New England 31Private Baccalaureate Colleges: Arts & Sciences Focus Southeast 21Public Baccalaureate/Associate’s Colleges Southeast 17aInstitutions are organized by participation in final administration (shown above the horizontal line) and the number of students who participated and completed the assessment.bThe number of students who participated in the final administration of the assessment is shown within brackets.
a first year, sophomore, junior, or senior; and/or spent less than 10 minutes on the assessment. We chose 10 minutes as a minimum cutoff based on the average time (10 minutes and 44 seconds) in which seven people read the assessment and selected likely or unlikely without considering the correctness of their answers. A total of 2142 student responses were included in the final statistical analyses, which represents 78% of students who provided consent on the final version of the assessment. These students answered 99.7% of all likely/unlikely statements on the assessment. For analysis, we coded each likely/unlikely response as 1 = correct or 0 = incorrect or nonresponse. Supplemental Table S3 contains summary demo-graphics of those students included in the final data set.
Content Coverage, Validity, and Assessment Reliability. Two authors (M.K.S. and M.M.S) independently assigned each EcoEvo-MAPS likely/unlikely statement to 1) an ecology or
evolution focus, 2) a Vision and Change core concept (AAAS, 2011) using the BioCore Guide (Brownell et al., 2014), and 3) the ecology and evolution themes described in Supplemental Table S1. Inconsistencies were discussed (9/63 for BioCore Guide, 0/63 for ecology vs. evolution, and 15/63 for ecology and evolution themes) and consensus reached on the categories for each statement. Supplemental Table S1 contains content coverage across these core concepts and themes. While we made an effort to cover all five of the Vision and Change core concepts, more likely/unlikely statements focus on some con-cepts, such as evolution. Eleven faculty reviewed the final ver-sion of EcoEvo-MAPS online, rating whether each question was “scientifically accurate” and “clear” (Supplemental Table S4).
To estimate instrument reliability on the final version of the assessment, we calculated Cronbach’s alpha (α), an internal reliability coefficient, based on likely/unlikely statement responses using SPSS software (IBM, 2015). Values for α range

CBE—Life Sciences Education • 17:ar18, Summer 2018 17:ar18, 5
EcoEvo-MAPS Assessment Tool
from 0 to 1, with high covariance resulting in values closer to 1 and lower covariance resulting in values closer to 0 (e.g., low- performing students outscoring high-performing students on many likely/unlikely statements).
IRT Modeling and Descriptive Statistics. We calculated IRT models of student response data using the software package RStudio (R Studio Team, 2015) and the MIRT package (Chalmers, 2012). In addition, we calculated classical test sta-tistics (statement difficulty and discrimination) for individual statements and the assessment overall using SPSS software. We then used descriptive statistics to characterize student perfor-mance on the final version of EcoEvo-MAPS and to identify areas of persistent conceptual difficulty. To compare student scores among courses at different levels within one institution, we conducted a one-way analysis of variance (ANOVA) with a Tukey post hoc test. We calculated effect size (η²) on the basis of this ANOVA by dividing the sum of squares between groups by the total sum of squares (Lakens, 2013). In addition, we calculated Cohen’s d for each pair of courses by subtracting the mean scores of each course and dividing this difference by the pooled SD of the courses (Lakens, 2013).
To investigate possible effects of demographic variables and motivation on student scores in the final administration, we coded 12 metrics: number of biology courses taken, self- reported grade point average (GPA), biology major, ecology or evolution specialization, transfer student, completion of AP biology, gender, whether English was spoken at home, first- generation college status, underrepresented minority (URM) versus non-URM, the Student Opinion Scale (SOS) (Thelk et al., 2009) importance scores, and SOS effort scores (the demographic questions are included in Supplemental Appendix S3). The SOS consists of 10 scaled items representing two sub-scales of importance and effort. For example, students indicate how much they agree with statements such as “Doing well on this test was important to me” (importance) and “I gave my best effort on this test” (effort) on a scale from 1 to 5. The demographic and SOS questions were administered after stu-dents completed EcoEvo-MAPS.
To investigate possible effects of these variables on overall student scores, we input these 12 variables as fixed factors into a linear mixed model with course nested within institution as a random factor using SPSS. We tested for correlations between the 12 factors and found SOS effort and SOS importance to have a Pearson’s correlation >0.3 with each other. To estimate the effect for each of these factors apart from their correlated factor, we ran the linear mixed model excluding the correlated factor.
We also tested for bias in student scores on individual likely/unlikely statements using logistic regression differential item functioning (DIF) with and without item purification (Swaminathan and Rogers, 1990; de Ayala, 2009), with effect size calculated by Nagelkerke’s R2 (de Ayala, 2009) using the difR package in R (Magis et al., 2010). We investigated five demographic variables: transfer student, gender, whether English was spoken at home, first-generation college status, and URM versus non-URM.
RESULTSAlthough the iterative design of EcoEvo-MAPS involved several pilot versions (Table 1), our results focus only on the 2142
student responses from 22 institutions on the final version of EcoEvo-MAPS. The final version includes nine questions with 63 total likely/unlikely statements and five to nine statements per question (Supplemental Appendix S1).
Evidence of Validity and ReliabilityWe used faculty feedback, student interviews, and pilot admin-istrations to iteratively improve and provide response and con-tent validity for the EcoEvo-MAPS questions (Table 1). A total of 106 biology faculty members reviewed the content coverage and offered suggestions to improve the accuracy and clarity of likely/unlikely statements. Faculty agreed that each question was scientifically accurate (91% agreement) and that each question was clear (82% agreement; Supplemental Table S4). In addition, 12 or more students (average = 23) provided responses and rationales for the final version of each likely/unlikely statement through think-aloud interviews. Students who answered statements correctly provided accurate reason-ing >80% of the time for 53 of the 63 likely/unlikely statements. Students who answered incorrectly provided inaccurate reason-ing >83% of the time for all 63 likely/unlikely statements. A summary of student accurate and inaccurate thinking is provided in Supplemental Table S5. EcoEvo-MAPS internal reli-ability is supported by Cronbach’s α. For the final administra-tion, Cronbach’s α was 0.76. This value is similar to those found for other concept assessments, such as the Molecular Biology Capstone Assessment (α = 0.80; Couch et al., 2015b).
IRT Model FitWe developed and compared several different IRT models to identify a model that best fit student response patterns. The 1PL model estimates the probability of a student answering a partic-ular statement correctly based on student ability and item diffi-culty. The 2PL model uses the same parameters as the 1PL model and includes an item discrimination parameter. The 3PL uses the same parameters as the 2PL and includes a pseu-do-guessing parameter. We further tested multidimensional 3PL models in which the statements were grouped according to their alignment with either the Vision and Change core concepts or ecology and evolution themes. We found the unidimensional 3PL model to have the best fit to student responses, so this model was used to estimate student and item parameters. See Supplemental Appendix S4 for full IRT model fit statistics.
While IRT represents an important tool for analyzing assess-ment results, biology faculty giving this assessment to their stu-dents are more likely to be familiar with calculating and inter-preting classical test statistics such as overall percent correct. They also typically will not have the sample size necessary to compute IRT models for their institution, as recommendations suggest 500 samples for each dimension included in an IRT analysis. The 3PL model used here is most reliable for sample sizes between 1500 and 3000 students (Hambleton et al., 1991). Therefore, to determine the level of correspondence between these two methods, we compared results obtained from the IRT model with results from classical test statistics. We found strong correlations between total scores reported as IRT thetas and scores reported as percent correct (r = 0.92) and between IRT and classical statement difficulty (i.e., percent correct) values (r = 0.76; Supplemental Appendix S5). Because classical test statistics are similar to IRT values and more

17:ar18, 6 CBE—Life Sciences Education • 17:ar18, Summer 2018
M. M. Summers et al.
familiar to biology faculty, we report classical test statistics for the remainder of the results. This strategy of examining correla-tions between IRT and classical test statistics and subsequently reporting classical test statistics has been used in other cases when the two are highly correlated (e.g., Vincent-Ruz and Schunn, 2017).
Student PerformanceIn the final administration of EcoEvo-MAPS at 22 institutions, median scores ranged from 50.8 to 87.3% (Figure 1A). When all students were combined, performance was evenly distrib-uted with a 61.7% mean, 60.3% median, and 11.5% SD (Supplemental Figure S1).
Because EcoEvo-MAPS was designed to measure broad dif-ferences in student thinking when administered at multiple time points during an undergraduate program, we also com-pared student performance in a course series from within one institution (Figure 1B). At this institution, there was a statisti-cally significant difference in student performance between groups (one-way ANOVA: F = 96.916; df = 2; p < 0.001). Stu-dent scores in 300-level (median 65%) and 400-level (median
71%) courses were significantly higher than 100-level courses (median 54%) (Tukey post hoc test; 100-level/300-level: t(445) = 7.751; p < 0.001; 100-level/400-level: t(453) = 13.377; p < 0.001), and 400-level courses were significantly higher than 300-level courses (Tukey post hoc test; t(104) = 2.520; p = 0.001). The comparison across all courses had a large effect size (η² = 0.279; Cohen, 1988), meaning that 28% of the variation in these scores can be accounted for by the course level. Between course levels, the effect size was moderate to large when com-paring 100 to 400 level (d = 1.537), 100 to 300 level (d = 0.939), and 300 to 400 level (d = 0.491).
When the statements were grouped by Vision and Change core concept and ecology and evolution theme, statement diffi-culty (i.e., percent correct) ranged widely within each category (Figure 2). Individual statement difficulty ranged from 26.8 to 90.0% correct.
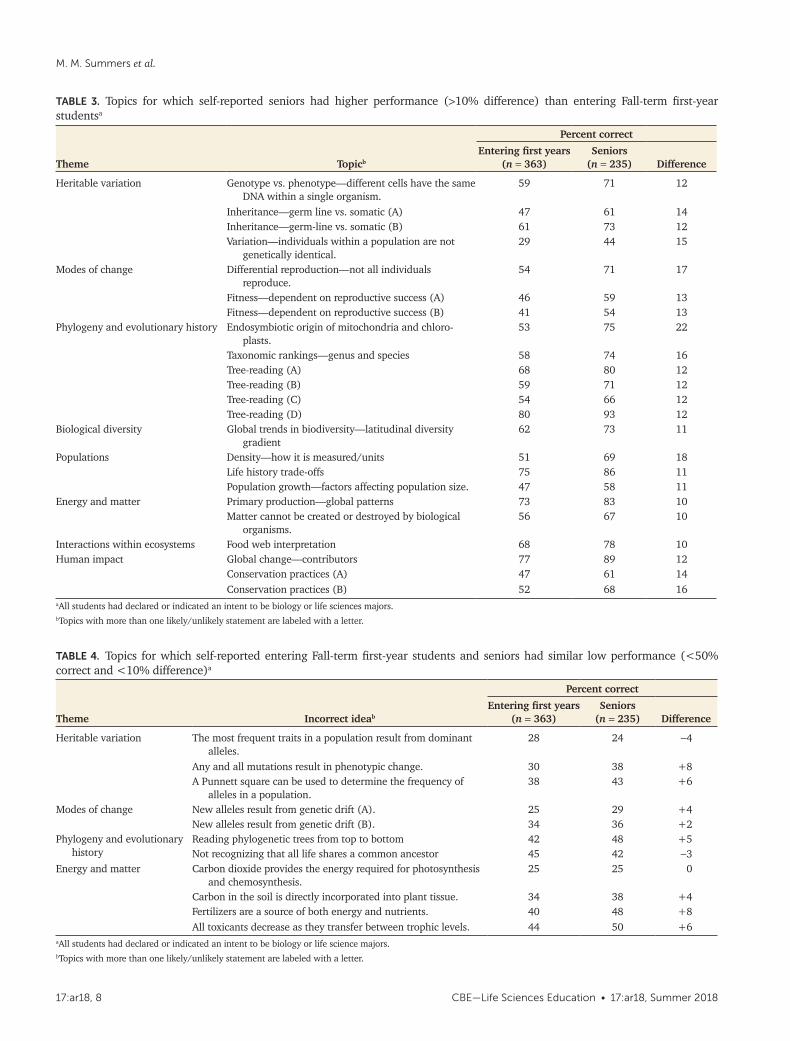
Comparison of Introductory and Advanced Student PerformanceWhen different cohorts of students were sampled, the com-bined assessment results for all courses and institutions show that, for some topics, self-reported seniors exhibited higher performance than first-year students majoring in biology or other life sciences. For several statements related to heritability, evolutionary fitness, tree-reading, the impact of humans, and other key concepts, first-year students showed low perfor-mance, while graduating seniors achieved at higher levels (Table 3). Students struggled both at the beginning and end of a biology degree on other topics such as dominance, mutation, variation, genetic drift, phylogenetic relationships, and energy and matter (Table 4). A summary of student accurate and inac-curate thinking from think-aloud interviewing is provided in Supplemental Table S5.
Statement Performance on Final VersionOne important purpose of IRT modeling and calculating classi-cal test statistics is to determine the extent to which likely/unlikely statements are consistent with broader response pat-terns. Pearson’s chi-square analysis (Orlando and Thissen, 2000) of the IRT 3PL model found that student responses to 57 statements fit the model predictions and responses to six statements had poor fit (Supplemental Appendix S6; questions 1_5, 2_9, 4_4, 4_5, 7_4, and 8_7 shown in Supplemental Appendix S1). Sixty statements had positive slopes in the IRT analysis, suggesting that students who scored high on the assessment overall also scored high on these statements, and three statements had negative slopes in the IRT analysis (Sup-plemental Appendix S6; questions 2_1, 3_1, and 7_4 shown in Supplemental Appendix S1). Classical statement discrimination (the difference in percent correct between the top-performing third and the bottom-performing third on the test overall) was greater than 20% for most statements, with 10 statements hav-ing a value less than 15% (Figure 2; questions 2_1, 2_5, 2_8, 3_1, 4_4, 4_5, 7_4, 8_1, 8_4, 9_2 shown in Supplemental Appendix S1).
To explore potential biases in the assessment tool, we inves-tigated performance on individual likely/unlikely statements using a logistic regression DIF analysis (Supplemental Table S6). Using the criterion of statistical significance (p < 0.05), 39 of 63 likely/unlikely statements were flagged for one of the
FIGURE 1. Student performance on final version of EcoEvo-MAPs assessment. (A) Overall test scores (percent correct) for 38 individual courses at 22 institutions. Central bars represent median test scores, boxes represent inner quartiles, and whiskers represent minimum/maximum scores. Each dot represents one student score. The number of students per course ranged from 3 to 398. Information on the number of courses and students from each institution is provided in Table 2. (B) Distribution of student overall test scores (percent correct) for a course series at one institution. Central bars represent median test scores, boxes represent inner quartiles, and whiskers represent minimum/maximum scores. N = the total number of students per course. Each dot represents one student score.

CBE—Life Sciences Education • 17:ar18, Summer 2018 17:ar18, 7
EcoEvo-MAPS Assessment Tool
FIGURE 2. Individual likely/unlikely statement difficulty and discrimination for each Vision and Change core concept and ecology and evolution theme. Statement difficulty (left) is shown as percent correct. Statement discrimination (right) is calculated by subtracting the average percent correct of student performance in the bottom third from student performance in the top third (i.e., larger discrimination values show greater differences in correct responses between students who scored highest and lowest on the exam overall). Each dot represents one likely/unlikely statement.
included demographic variables (transfer student, gender, whether English was spoken at home, first-generation college status, or URM vs. non-URM). However, the effect size for each of these likely/unlikely statements was classified as negligible (R2 < 0.035) according to the Jodoin-Gierl and Zumbo-Thomas effect-size criteria (Jodoin and Gierl, 2001; Zumbo and Thomas, 1997). These effect-size values suggest that there is little sub-stantive DIF at the likely/unlikely statement level for the tested demographic variables.
Motivation and Demographic EffectsWe investigated the possible effects of motivation and student demographics on overall EcoEvo-MAPS scores using a linear mixed-model analysis. Ten variables were found to be signifi-cant (p < 0.05): gender, number of biology courses taken, first-generation college status, GPA, biology major, completed AP Biology, transfer student, URM versus non-URM, SOS effort (Thelk et al., 2009), and SOS importance. Demographic vari-ables that did not have a significant effect on test scores included English spoken at home (no vs. yes) and ecology or evolution specialization. Unstandardized coefficients for the 10 significant variables included in the final linear mixed-model analyses are provided in Table 5. Unstandardized coeffi-cients indicate the average differences in student score with each unit of change in the variable (e.g., first year to second
year). Significant two-state categorical variables resulted in at most a 3.2% dif-ference in scores. Men’s scores were 3.2% higher than women’s scores; scores of URMs were 2.6% lower than the scores of non-URMs; biology majors outscored nonmajors by 2.4%; students with first- generation status scored 2.0% lower than students whose parents completed a post-secondary degree; transfer student total scores were 1.7% lower than nontransfer student scores; and students who com-pleted AP biology received scores 1.7% higher than to those who did not. Signifi-cant scalar variables identified students to score 2.2% higher on the assessment for each letter grade difference in GPA; a 0.2% increase in score for each additional college-level biology course completed, and a 0.6% and 0.5% increase for each point higher in SOS effort and impor-tance scores, respectively (both SOS effort and importance scores range from 5 to 25).
DISCUSSIONUse of EcoEvo-MAPS to Infer Student Thinking within a ProgramDepartments can use EcoEvo-MAPS to obtain data about students at different time points in their program to identify areas of strength and weakness among their students and then further investi-gate their own students’ thinking with targeted interviews, assessment, or
instructional interventions (Table 6 provides an overview of recommended use). Given that comparisons between student cohorts at different time points in the major can be conflated by disproportionate dropout rates among lower-performing students or certain demographic groups (e.g., female, first-generation, and URM students), assessment results are most appropriately used to evaluate student performance at each time point, rather than comparing time points. Faculty can evaluate EcoEvo-MAPS results with respect to what they think students should have achieved by each point, and this approach can inform departmental instructional improvement plans.
Faculty can also choose to focus on the most important time points on the basis of their own assessment goals. For example, data from first-year and senior students at the piloting institu-tion highlighted in Figure 1B revealed that first-year students struggled with statements about genetic drift, which might be expected at this early time point. However, the finding that students still struggled with this concept as seniors inspired conversations at a faculty retreat about how to increase student exposure to this concept in more courses. Departments wanting to infer trends across time points can consider using additional regression analyses and controlling for certain contributing variables (GPA, gender, motivation, etc.; see Table 5) to distinguish between score differences that can be attributed to
17:ar18, 8 CBE—Life Sciences Education • 17:ar18, Summer 2018
M. M. Summers et al.
TABLE 3. Topics for which self-reported seniors had higher performance (>10% difference) than entering Fall-term first-year studentsa
Percent correct
Theme Topicb
Entering first years (n = 363)
Seniors (n = 235) Difference
Heritable variation Genotype vs. phenotype—different cells have the same DNA within a single organism.
59 71 12
Inheritance—germ line vs. somatic (A) 47 61 14Inheritance—germ-line vs. somatic (B) 61 73 12Variation—individuals within a population are not
genetically identical.29 44 15
Modes of change Differential reproduction—not all individuals reproduce.
54 71 17
Fitness—dependent on reproductive success (A) 46 59 13Fitness—dependent on reproductive success (B) 41 54 13
Phylogeny and evolutionary history Endosymbiotic origin of mitochondria and chloro-plasts.
53 75 22
Taxonomic rankings—genus and species 58 74 16Tree-reading (A) 68 80 12Tree-reading (B) 59 71 12Tree-reading (C) 54 66 12Tree-reading (D) 80 93 12
Biological diversity Global trends in biodiversity—latitudinal diversity gradient
62 73 11
Populations Density—how it is measured/units 51 69 18Life history trade-offs 75 86 11Population growth—factors affecting population size. 47 58 11
Energy and matter Primary production—global patterns 73 83 10Matter cannot be created or destroyed by biological
organisms.56 67 10
Interactions within ecosystems Food web interpretation 68 78 10Human impact Global change—contributors 77 89 12
Conservation practices (A) 47 61 14Conservation practices (B) 52 68 16
aAll students had declared or indicated an intent to be biology or life sciences majors.bTopics with more than one likely/unlikely statement are labeled with a letter.
TABLE 4. Topics for which self-reported entering Fall-term first-year students and seniors had similar low performance (<50% correct and <10% difference)a
Percent correct
Theme Incorrect ideab
Entering first years (n = 363)
Seniors (n = 235) Difference
Heritable variation The most frequent traits in a population result from dominant alleles.
28 24 −4
Any and all mutations result in phenotypic change. 30 38 +8A Punnett square can be used to determine the frequency of
alleles in a population.38 43 +6
Modes of change New alleles result from genetic drift (A). 25 29 +4New alleles result from genetic drift (B). 34 36 +2
Phylogeny and evolutionary history
Reading phylogenetic trees from top to bottom 42 48 +5Not recognizing that all life shares a common ancestor 45 42 −3
Energy and matter Carbon dioxide provides the energy required for photosynthesis and chemosynthesis.
25 25 0
Carbon in the soil is directly incorporated into plant tissue. 34 38 +4Fertilizers are a source of both energy and nutrients. 40 48 +8All toxicants decrease as they transfer between trophic levels. 44 50 +6
aAll students had declared or indicated an intent to be biology or life science majors.bTopics with more than one likely/unlikely statement are labeled with a letter.

CBE—Life Sciences Education • 17:ar18, Summer 2018 17:ar18, 9
EcoEvo-MAPS Assessment Tool
TABLE 5. Estimated coefficients for statistically significant variables (p < 0.05) from linear mixed-model analysis for final version of the assessmenta
Unstandardized coefficient
Fixed factor Estimate SE p value
Gender (female/male) 0.032 0.005 <0.001Ethnicity (URM/non-URM) 0.026 0.006 <0.001Biology major (no/yes) 0.024 0.005 <0.001Self-reported GPA 0.022 0.003 <0.001First-generation college status (yes/no) 0.020 0.005 <0.001SOS Effort (scores range from 5 to 25) 0.006 <0.001 <0.001SOS Importance (scores range from 5
to 25)0.005 <0.001 <0.001
Number of biology courses taken 0.002 <0.001 <0.001Completed AP Biology 0.017 0.005 0.001Transfer student (yes/no) 0.017 0.006 0.005aDependent variable = percent score. Random factor = course nested within institution. N = 2142.
TABLE 6. Overview of intended EcoEvo-MAPS use within an institution
1. Identify courses and/or time points to administer EcoEvo-MAPS. For example, plan for different cohorts of students to take the assessment when they begin their first-year courses, after the introductory series, and when graduating.
2. Contact the corresponding author for the freely available Web-based assessment tool and automatic-scoring template. Inclusion of SOS motivation survey (Thelk et al., 2009) is recommended.
3. Use Qualtrics survey platform to administer the survey online. We recommend giving students one week to complete the survey and awarding participation or homework points for student comple-tion, but not correctness (see assessment introduction in Supple-mental Appendix S2).
4. Input student responses into automatic-scoring template provided by the corresponding author. For each administration, you will receive
• the mean, median, and range of student scores for the assess-ment overall and for each Vision and Change and ecology and evolution theme. Box-and-whisker plots will automatically generate to present these data;
• the percent correct for each statement on the assessment; and • the most prevalent student thinking for correct and incorrect
responses for each statement (as found in Supplemental Table S5).
5. Identify concepts that students understand and struggle with at your institution. Identify specific concepts and/or conceptual difficulties for targeted instruction and curriculum redesign. Consult the education literature for deeper understanding of student thinking, targeted concept inventories, and evidence-based teaching strategies.
differential retention of students versus improvement stemming from other factors, such as student learning.
When interpreting the results of individual statements, faculty should be aware that not all statements performed according to model predictions when examined by Pearson’s chi-square fit analysis, IRT item characteristic curve slope, and classical test theory discrimination. Specific nonconforming statements are described above in the section Results: Statement
Performance on Final Version. Because the goal of this assessment is to provide inferences on student thinking to guide faculty dia-logue, rather than to separate students by ability as is done for standardized tests, such as the Medical College Admission Test or Graduate Record Examination (Adams and Wieman, 2011), these statements remain part of the assessment. Faculty review-ers also stated that these statements tested important concepts, and student interviews indicated that students interpreted and answered the questions accurately (Supplemental Appendix S6 and Supplemental Table S5). Many of these statements align with known conceptual difficulties, such as gene expression (Smith et al., 2008), intraspecific competition (Munson, 1994), and gene flow (Andrews et al., 2012; Price et al., 2014). While these statements remain in the assessment to preserve content validity and give faculty information on student thinking, we recommend future studies investigate whether these results per-sist when the assessment is given to other groups of students.
We have developed an automatic scoring template to help process and interpret EcoEvo-MAPS results. To protect the assessment, the answer key is available upon request from the corresponding author. For each individual cohort or class, the score report automatically calculates and graphs the results of the overall assessment and the results for each of the Vision and Change and ecology/evolution themes (Supplemental Table S1). Difficulty (i.e., percent correct) for likely/unlikely state-ments is also automatically calculated, allowing faculty to fur-ther investigate those concepts that contributed to higher- or lower-scoring categories. Student responses from think-aloud interviews accompany each likely/unlikely statement to pro-vide insight into possible changes to curricula that might improve student conceptions (Supplemental Table S5; Supple-mental Figure S2 shows part of a score report). We recommend that faculty do not share assessment answers with their stu-dents or use the statements on exams or as part of formative tools (e.g., clicker questions, in-class discussion tools) in order to protect the answers.
Integrating EcoEvo-MAPS with Other Assessment Tools to Investigate Student Thinking and Improve InstructionEcoEvo-MAPS provides departments with a tool to connect the broad Vision and Change themes with ongoing assessment and inquiry into student thinking. As an example, we found that students persistently struggled with statements related to con-cepts previously investigated in depth, such as dominance, mutation, variation, genetic drift, tree-reading, and energy and matter (Table 4). A majority of students interviewed considered genetic drift as an equivalent process to gene flow, a misuse previously identified by Andrews et al., 2012. From their descriptions, we can also infer that a large number of students equated dominance with allele frequency (Abraham et al., 2014), read phylogenetic trees from top to bottom (Baum et al., 2005), and considered that matter and energy were inter-changeable (Hartley et al., 2011).
We also uncovered new incorrect ideas. For example, stu-dents think there is higher species diversity at higher latitudes than at lower latitudes and that there are more species alive today than have gone extinct in the past (Supplemental Table S5). From interviews, we also found examples of concepts for which students often present incomplete explanations. For example, students say that competition only occurs between

17:ar18, 10 CBE—Life Sciences Education • 17:ar18, Summer 2018
M. M. Summers et al.
different species and never among individuals of the same spe-cies, decomposition results from only abiotic and not biotic pro-cesses, population regulation occurs only from predation, and humans impact only the habitats in which they live (land vs. deep sea). The summary of student thinking provided in Sup-plemental Table S5 and as part of the automatic scoring tem-plate (sample in Supplemental Figure S2) provides both faculty and education researchers with a starting point to further explore student thinking on these topics.
EcoEvo-MAPS can also provide departments and instructors with an impetus to begin deeper investigation of student think-ing. An overview of how this assessment can be used by depart-ments is shown in Table 6. One department involved in this study gives EcoEvo-MAPS to entering first-year students and to seniors as an exit survey. They discuss the data at retreats, report the information for accreditation, and use the results as a guide for faculty to construct assessment plans that address larger program goals. On the basis of the EcoEvo-MAPS results, some faculty members in this program have decided to also use the ACORNS tool (Nehm et al., 2012) and/or the Genetics Con-cept Assessment (Smith et al., 2008) at the beginning and end of their courses to explore learning gains in evolution and heredity within a course. In addition, other faculty members have used short-answer questions from the Automated Analysis of Constructed Response project (https://create4stem.msu .edu/project/aacr; Haudek et al., 2011; Pelletreau et al., 2016) or other assessments they individually developed (Trenckmann et al., 2017) to examine student learning before and after specific lessons.
The Effects of Motivation and Demographics on Student PerformanceWe found that motivation, as measured using the SOS instru-ment (Thelk et al., 2009), was a significant predictor of student scores according to linear mixed-model analysis (Table 5). The SOS instrument is based on the expectancy-value motivation theory (e.g., Wigfield and Eccles, 2000), which defines motiva-tion relative to three components: perception of likelihood of success, interest in the task (importance, usefulness, or inter-est), and the perceived strength of the reward or punishment based on performance. We recommend that instructors admin-istering EcoEvo-MAPS provide students with a verbal and writ-ten prompt emphasizing the importance of their effort and that either participation or extra credit points be given for comple-tion. Example verbiage for student recruitment is provided in Supplemental Appendix S2. The SOS survey (Thelk et al., 2009) is included in the online Qualtrics survey platform (avail-able from the corresponding author). We strongly encourage faculty to measure their students’ motivation in concert with their performance on EcoEvo-MAPS to ensure that scores accu-rately reflect student understanding by accounting for possible motivation effects.
In addition to motivation, we also encourage departments to consider academic experience (e.g., transfer status, number of courses) and demographic variables when examining student scores. In our analyses, linear mixed models revealed several predictors for higher EcoEvo MAPS scores: each additional college-level biology course completed, each letter grade differ-ence in GPA, and being a biology major (vs. a nonmajor). For demographics, female and first-generation status predicted
lower overall scores, in line with lower scores reported for course-based biology assessments (Table 5; Stanger-Hall, 2012; Wright et al., 2016). URMs also scored lower on the assessment, although English as a second language was not a significant predictor. No individual statements were flagged for nonnegli-gible DIF for the demographic variables we examined (Supple-mental Table S6). Considered together, these results highlight that providing opportunities for all students to learn ecology and evolution, regardless of demographic background, should be an important goal for departments, instructors, and educa-tion researchers.
EcoEvo-MAPS AvailabilityEcoEvo-MAPS is a freely accessible instrument that departments and faculty can use to infer and investigate student thinking among different cohorts of students within their program. A PDF copy of EcoEvo-MAPS, an electronic version for administration through the Qualtrics platform, answer key, and automatic scor-ing template with associated student thinking from interviews is available upon request to the corresponding author.
ACKNOWLEDGMENTSThis material is based on work supported by the National Sci-ence Foundation under grants DRL 0962805 and DUE 1322556, 1323010, and 1322364. Any opinions, findings, and conclu-sions or recommendations expressed in this material are those of the authors and do not necessarily reflect the views of the National Science Foundation. We thank the faculty members who reviewed and commented on the questions; the faculty who administered the assessment; students who participated in interviews and pilots; Meghan Bathgate, Kathleen Brazeal, Man-Wai Chu, Kyla Flanagan, and Brian McGill for advice on statistical analyses; the 32 IRB committees who considered our request to pilot; and Karen Pelletreau, Erin Vinson, Elizabeth Trenckmann, Justin Lewin, Jonathan Dumont, Kenneth Akiha, MaryBeth Semosky, Gabrielle Holt, and Emilie Brigham for their participation and thoughtful discussions regarding this assessment. This research was considered exempt from institu-tional review (protocol 2015-06-07).
REFERENCESAbraham, J. K., Perez, K. E., & Price, R. M. (2014). The dominance concept
inventory: A tool for assessing undergraduate student alternative con-ceptions about dominance in Mendelian and population genetics. CBE—Life Sciences Education, 13(2), 349–358. doi: 10.1187/cbe.13-08-0160
Adams, W. K., & Wieman, C. E. (2011). Development and validation of instru-ments to measure learning of expert-like thinking. International Journal of Science Education, 33(9), 1289–1312. doi: 10.1080/09500693 .2010.512369
American Association for the Advancement of Science (AAAS). (2011). Vision and change in undergraduate biology education: A call to action. Wash-ington, DC.
AAAS. (2015). Vision and change in undergraduate biology education: Chron-icling change, inspiring the future. Washington, DC.
Anders, K., & Simon, H. A. (1980). Verbal reports as data. Psychological Review, 87(3), 215–251. doi: 10.1037/0033-295X.87.3.215
Anderson, D. L., Fisher, K. M., & Norman, J. G. (2002). Development and validation of the Conceptual Inventory of Natural Selection. Journal of Research in Science Teaching, 39(10), 952–978. doi: 10.1002/tea.10053
Andrews, T. M., Price, R. M., Mead, L. S., McElhinny, T. L., Thanukos, A., Perez, K. E., ... Lemmons, P. P. (2012). Biology undergraduates’ misconceptions

CBE—Life Sciences Education • 17:ar18, Summer 2018 17:ar18, 11
EcoEvo-MAPS Assessment Tool
about genetic drift. CBE—Life Sciences Education, 11(3), 248–259. doi: 10.1187/cbe.11-12-0107
Barak, J., Gorodetsky, M., & Chipman, D. (1997). Understanding of energy in biology and vitalistic conceptions. International Journal of Science Education, 19(1), 21–30. doi: 10.1080/0950069970190102
Barton, N. H., Briggs, D. E. G., Eisen, J. A., Goldstein, D. B., & Patel, N. H. (2007). Evolution. New York: Cold Spring Harbor Laboratory Press.
Bass, K. M., Drits-Esser, D., & Stark, L. A. (2016). A primer for developing mea-sures of science content knowledge for small-scale research and in-structional use. CBE—Life Sciences Education, 15(2), rm2. doi: 10.1187/cbe.15-07-0142
Baum, D. A., & Offner, S. (2008). Phylogenies & tree-thinking. American Biology Teacher, 70(4), 222–229. doi: 10.1662/0002-7685(2008)70[222:PT]2.0 .CO;2
Baum, D. A., Smith, S. D., & Donovan, S. S. S. (2005). The tree-thinking chal-lenge. Science, 310(5750), 979–980. doi: 10.1126/science.1117727
Bergstrom, C. T., & Dugatkin, L. A. (2016). Evolution. New York: Norton.
Brownell, S. E., Freeman, S., Wenderoth, M. P., & Crowe, A. J. (2014). BioCore Guide: A tool for interpreting the core concepts of vision and change for biology majors. CBE—Life Sciences Education, 13(2), 200–211. doi: 10.1187/cbe.13-12-0233
Campbell, C. E., & Nehm, R. H. (2013). A critical analysis of assessment qual-ity in genomics and bioinformatics education research. CBE—Life Sciences Education, 12(3), 530–541. doi: 10.1187/cbe.12-06-0073
Chabalengula, V. M., Sanders, M., & Mumba, F. (2012). Diagnosing students’ understanding of energy and its related concepts in biological contexts. International Journal of Science and Mathematics Education, 10(2), 241–266. doi: 10.1007/s10763-011-9291-2
Chalmers, R. P. (2012). Mirt: A Multidimensional Item Response Theory pack-age for the R environment. Journal of Statistical Software, 48(6), 1–29. doi: 10.18637/jss.v048.i06
Cohen, J. (1988). Statistical power analysis for the behavioral sciences. Hillsdale, NJ: Erlbaum.
Cotgreave, P., & Forseth, I. (2002). Introductory ecology. Oxford, United Kingdom: Blackwell Science.
Couch, B. A., Brown, T. L., Schelpat, T. J., Graham, M. J., & Knight, J. K. (2015a). Scientific teaching: Defining a taxonomy of observable prac-tices. CBE—Life Sciences Education, 14(1), ar9. doi: 10.1187/cbe.14-01 -0002
Couch, B. A., & Knight, J. K. (2015). A comparison of two low-stakes methods for administering a program-level biology concept assessment. Journal of Microbiology & Biology Education, 16(2), 178–185. doi: 10.1128/jmbe .v16i2.953
Couch, B. A., Wood, W. B., & Knight, J. K. (2015b). The Molecular Biology Capstone Assessment: A concept assessment for upper-division mole-cular biology students. CBE—Life Sciences Education, 14(1), ar10. doi: 10.1187/cbe.14-04-0071
D’Avanzo, C. (2008). Biology concept inventories: Overview, status, and next steps. BioScience, 58(11), 1079–1085. doi: 10.1641/B581111
de Ayala, R. J. (2009). The theory and practice of item response theory, New York: Guilford.
Doran, R. (1980). Basic measurement and evaluation of science instruction. Washington, DC: National Science Teachers Association.
Fiedler, D., & Harms, U. (2016). Prevalence and characterization of threshold concepts in dynamic visualizations of evolution. Paper presented at: Euro-pean Researchers in Didactics of Biology Conference (Karlstad, Sweden).
Futuyma, J. (2009). Evolution. Sunderland, MA: Sinauer.
Hambleton, R. K., Swaminathan, H., & Rogers, H. J. (1991). Fundamentals of item response theory. Newbury Park, CA: Sage.
Handelsman, J., Ebert-May, D., Beichner, R., Bruns, P., Chang, A., DeHaan, R., ... Wood, W. B. (2004). Scientific teaching. Science, 304(5670), 521–522. doi: 10.1126/science.1096022
Hartley, L. M., Wilke, B. J., Schramm, J. W., D’Avanzo, C., & Anderson, C. W. (2011). College students’ understanding of the carbon cycle: Contrasting principle-based and informal reasoning. BioScience, 61(1), 65–75. doi: 10.1525/bio.2011.61.1.12
Haudek, K. C., Kaplan, J. J., Knight, J., Long, T., Merrill, J., Munn, A., & Urban- Lurain, M. (2011). Harnessing technology to improve formative assessment
of student conceptions in STEM: Forging a national network. CBE—Life Sciences Education, 10(2), 149–155. doi: 10.1187/cbe.11-03-0019
IBM. (2015). SPSS statistics for Macintosh (Version 23). Armonk, NY.
Jodoin, M. G., & Gierl, M. J. (2001). Evaluating type I error and power rates using an effect size measure with the logistic regression procedure for DIF detection. Applied Measurement in Education, 14(4), 329–349. doi: 10.1207/S15324818AME1404_2
Kalinowski, S. T., Leonard, M. J., & Taper, M. L. (2016). Development and vali-dation of the Conceptual Assessment of Natural Selection (CANS). CBE—Life Sciences Education, 15(4), ar64. doi: 10.1187/cbe.15-06-0134
Knight, J. K. (2010). Biology concept assessment tools: Design and use. Microbiology Australia, 31(1), 5–8. doi: 10.1071/MA10005
Lakens, D. (2013). Calculating and reporting effect sizes to facilitate cumula-tive science: A practical primer for t-tests and ANOVAs. Frontiers in Psy-chology, 4, 1–12. doi: 10.3389/fpsyg.2013.00863
Magis, D., Beland, S., Tuerlinckx, F., & De Boeck, P. (2010). A general frame-work and an R package for the detection of dichotomous differential item functioning. Behavior Research Methods, 42(3), 847–862. doi: 10.3758/BRM.42.3.847
Marbach-Ad, G., Briken, V., El-Sayed, N. M., Frauwirth, K., Fredericksen, B., Hutcheson, S., ... Smith, A. C. (2009). Assessing student understanding of host pathogen interactions using a concept inventory. Journal of Mi-crobiology & Biology Education, 10(1), 43–50. doi: 10.1128/jmbe.v10.98
Marbach-Ad, G., McAdams, K. C., Benson, S., Briken, V., Cathcart, L., Chase, M., ... Smith, A. C. (2010). A model for using a concept inventory as a tool for students’ assessment and faculty professional development. CBE—Life Sciences Education, 9(4), 408–416. doi: 10.1187/cbe.10-05-0069
Middaugh, M. F., Nelson, D., & Damminger, J. K. (2011). Planning and assess-ment in higher education: Demonstrating institutional effectiveness. San Francisco: Jossey-Bass.
Munson, B. H. (1994). Ecological misconceptions. Journal of Environmental Education, 25(4), 30–34. doi: 10.1080/00958964.1994.9941962
Nadelson, L. S., & Southerland, S. A. (2010). Development and preliminary evaluation of the Measure of Understanding of Macroevolution: Intro-ducing the MUM. Journal of Experimental Education, 78(2), 151–190. doi: 10.1080/00220970903292983
National Research Council (NRC). (2001). Knowing what students know: The science and design of educational assessment. Washington, DC: Nation-al Academies Press.
National Research Council (NRC). (2003). BIO2010: Transforming under-graduate education for future research biologists. Washington, DC: Na-tional Academies Press.
Nehm, R. H., Beggrow, E. P., Opfer, J. E., & Ha, M. (2012). Reasoning about natural selection: Diagnosing contextual competency using the ACORNS instrument. American Biology Teacher, 74(2), 92–98. doi: 10.1525/abt.2012.74.2.6
Nehm, R. H., & Reilly, L. (2007). Biology majors’ knowledge and misconceptions of natural selection. BioScience, 57(3), 263–272. doi: 10.1641/B570311
Nehm, R. H., & Ridgway, J. (2011). What do experts and novices “see” in evo-lutionary problems? Evolution: Education and Outreach, 4(4), 666–679. doi: 10.1007/s12052-011-0369-7
Next Generation Science Standards Lead States. (2013). Next Generation Sci-ence Standards: For states, by states. Washington, DC: National Acade-mies Press.
Opitz, S. T., Blankenstein, A., & Harms, U. (2016). Student conceptions about energy in biological contexts. Journal of Biological Education, 51(4), 427–440. doi: 10.1080/00219266.2016.1257504
Orlando, M., & Thissen, D. (2000). Likelihood-based item-fit indices for di-chotomous item response theory models. Applied Psychological Mea-surement, 24(1), 50–64. doi: 10.1177/01466216000241003
Pelletreau, K. N., Andrews, T., Armstrong, N., Bedell, M. A., Dastoor, F., Dean, N., ... Smith, M. K. (2016). A clicker-based study that untangles student thinking about the processes in the central dogma. CourseSource. doi: 10.24918/cs.2016.15
Perez, K. E., Hiatt, A., Davis, G. K., Trujillo, C., French, D. P., Terry, M., ... Price, R. M. (2013). The EvoDevoCI: A concept inventory for gauging students’ understanding of evolutionary developmental biology. CBE—Life Scienc-es Education, 12(4), 665–675. doi: 10.1187/cbe.13-04-0079

17:ar18, 12 CBE—Life Sciences Education • 17:ar18, Summer 2018
M. M. Summers et al.
Price, R. M., Andrews, T. C., McElhinny, T. L., Mead, L. S., Abraham, J. K., Thanu-kos, A., & Perez, K. E. (2014). The Genetic Drift Inventory: A tool for mea-suring what advanced undergraduates have mastered about genetic drift. CBE—Life Sciences Education, 13(1), 65–75. doi: 10.1187/cbe.13-08-0159
Reeves, T. D., & Marbach-Ad, G. (2016). Contemporary test validity in theory and practice: A primer for discipline-based education researchers. CBE—Life Sciences Education, 15(1), rm1. doi: 10.1187/cbe.15-08-0183
Ricklefs, R. E., & Miller, G. L. (2010). Ecology. New York: Freeman.
Rose, M. R., & Mueller, L. D. (2006). Evolution and ecology of the organism. Upper Saddle River, NJ: Pearson Education.
R Studio Team. (2015). RStudio: Integrated Development for R. Boston, MA: RStudio. Retrieved 2015 from www.rstudio.com
Smith, M. K., Wood, W. B., & Knight, J. K. (2008). The Genetics Concept As-sessment: A new concept inventory for gauging student understanding of genetics. CBE—Life Sciences Education, 7(4), 422–430. doi: 10.1187/cbe.08-08-0045
Smith, R. L., & Smith, T. M. (2001). Ecology and field biology. San Francisco: Benjamin Cummings.
Smith, R. L., & Smith, T. M. (2003). Elements of ecology. San Francisco: Benjamin Cummings.
Stanger-Hall, K. F. (2012). Multiple-choice exams: An obstacle for higher- level thinking in introductory science classes. CBE—Life Sciences Educa-tion, 11(3), 294–306. doi: 10.1187/cbe.11-11-0100
Stearns, S., & Hoekstra, R. (2005). Evolution: An introduction. New York: Oxford University Press.
Swaminathan, H., & Rogers, H. J. (1990). Detecting differential item function-ing using logistic regression procedures. Journal of Educational Mea-surement, 27(4), 361–370. doi: 10.1111/j.1745-3984.1990.tb00754.x
Thelk, A. D., Sundre, D. L., Horst, S. J., & Finney, S. J. (2009). Motivation mat-ters: Using the Student Opinion Scale to make valid inferences about student performance. Journal of General Education, 58(3), 129–151. doi: 10.1353/jge.0.0047
Trenckmann, E., Smith, M. K., Pelletreau, K. N., & Summers, M. M. (2017). An active-learning lesson that targets student understanding of population growth in ecology. CourseSource. doi: 10.24918/cs.2017.11
Vincent-Ruz, P., & Schunn, C. D. (2017). The increasingly important role of science competency beliefs for science learning in girls. Journal of Research in Science Teaching, 54(6), 790–822. doi: 10.1002/tea.21387
Wigfield, A., & Eccles, J. S. (2000). Expectancy-value theory of achievement motivation. Contemporary Educational Psychology, 25(1), 68–81. doi: 10.1006/ceps.1999.1015
Wilson, C. D., Anderson, C. W., Heidemann, M., Merrill, J. E., Merritt, B. W., Richmond, G., ... Parker, J. M. (2007). Assessing students’ ability to trace matter in dynamic systems in cell biology. Cell Biology Education, 5(4), 323–331. doi: 10.1187/cbe.06-02-0142
Wright, C. D., Eddy, S. L., Wenderoth, M. P., Abshire, E., Blankenbiller, M., & Brownell, S. E. (2016). Cognitive difficulty and format of exams predicts gender and socioeconomic gaps in exam performance of students in introductory biology courses. CBE—Life Sciences Education, 15(2), ar23. doi: 10.1187/cbe.15-12-0246
Zimmer, C., & Emlen, D. J. (2015). Evolution: Making sense of life. Greenwood Village, CO: Freeman.
Zumbo, B. D., & Thomas, D. R. (1997). A measure of effect size for a mod-el-based approach for studying DIF (Working paper of the Edgeworth Laboratory for Quantitative Behavioural Science). Prince George, BC: University of Northern British Columbia.


![rev2 CAP2 Recuperacao ES - Arfit · ecoevo he ec- ecoevo he ec- ecoevo he ec- ecoevo he ec- ecoevo he ec- 10 16 23 39 54 caudal [m3/h] u 94.0 93.5 93.0 92.5 92.0 1000 2000 3000 4000](https://static.fdocuments.net/doc/165x107/5fbfd6b28292e54bee6ffe0c/rev2-cap2-recuperacao-es-ecoevo-he-ec-ecoevo-he-ec-ecoevo-he-ec-ecoevo-he-ec-.jpg)
