Eco Solutions Company Business Policy - Panasonic USA · 2016. 5. 18. · related business strategy...
14
Copyright (C) 2016 Panasonic Corporation All Rights Reserved. Eco Solutions Company Business Policy May 18, 2016 Panasonic Corporation Eco Solutions Company President Tamio Yoshioka Notes: 1. This is an English translation from the original presentation in Japanese. 2. In this presentation, “FY17” refers to the year ending March 31, 2017. Eco Solutions Company Business Policy FY16 Results 1
Transcript of Eco Solutions Company Business Policy - Panasonic USA · 2016. 5. 18. · related business strategy...

Copyright (C) 2016 Panasonic Corporation All Rights Reserved.
Eco Solutions Company
Business Policy
May 18, 2016
Panasonic Corporation
Eco Solutions Company
President Tamio Yoshioka
Notes: 1. This is an English translation from the original presentation in Japanese.
2. In this presentation, “FY17” refers to the year ending March 31, 2017.
Eco Solutions Company Business Policy
FY16 Results
1

Copyright (C) 2016 Panasonic Corporation All Rights Reserved.
Eco Solutions Company Business Policy 2
FY16 Results
Sales Measures such as streamlining did
not offset the impact of decreased
sales.
Sudden shrink in the domestic residential
market for the PV power generation business
and unexpected delayed recovery of the
domestic housing market
OP
DOWN DOWN
1,666.0 Sales
OP (%) 95.3 (5.7%)
FY15 FY16
78.4 (4.9%)
104.5 (6.1%)
FY16(f)
1,726.0 (vs. FY15 -3%)
1,610.8
* Based on US GAAP
(yen : billions)
Eco Solutions Company Business Policy
FY16 Results
3
[OP Analysis]
78.4 95.3
[Sales Analysis]
FY15
1,610.8
1,666.0
FY16
FY15 FY16 -16.9
-55.2
Overseas
sales
increase Exchange
rate effects
Domestic
sales
decrease Price
declines
Overseas
sales
increase
Domestic
sales
decrease
Exchange
rate effects Streamlining
& Price
declines
Fixed-cost
increase
+11.6 +4.6 ‐22.5 ‐48.9
+0.3 +3.4
‐10.5 ‐17.3
+7.2
* Based on US GAAP
(yen : billions)
Copyright (C) 2016 Panasonic Corporation All Rights Reserved.
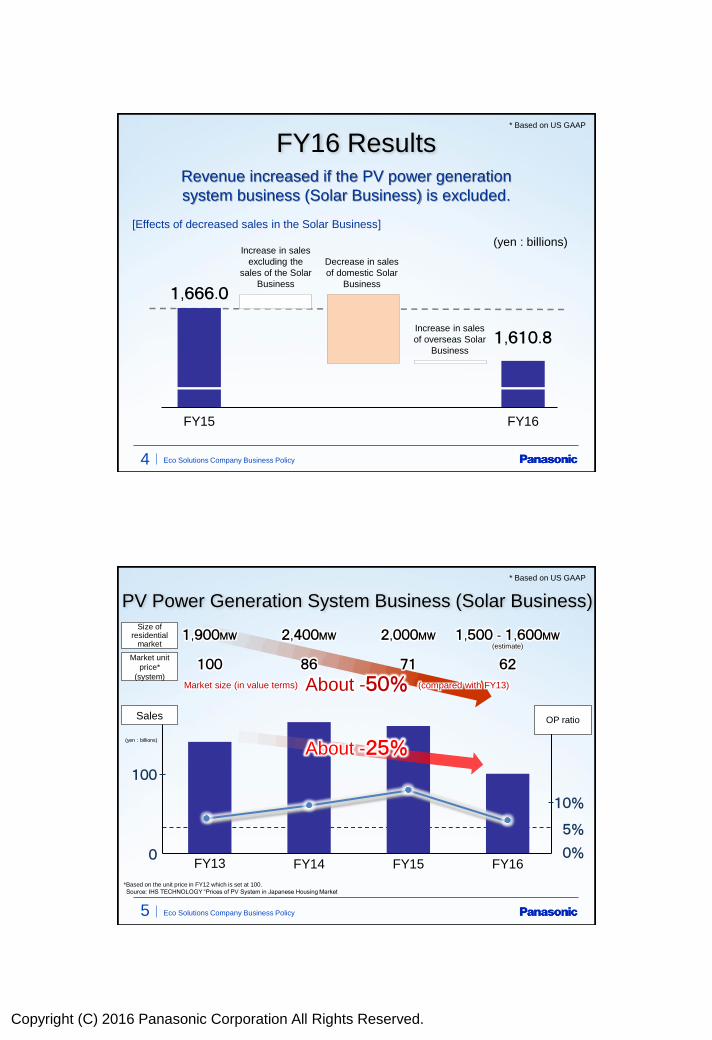
Eco Solutions Company Business Policy
FY16 Results
4
[Effects of decreased sales in the Solar Business]
Revenue increased if the PV power generation
system business (Solar Business) is excluded.
FY15 FY16
1,666.0
Increase in sales
of overseas Solar
Business
Increase in sales
excluding the
sales of the Solar
Business
Decrease in sales
of domestic Solar
Business
1,610.8
* Based on US GAAP
(yen : billions)
Eco Solutions Company Business Policy
PV Power Generation System Business (Solar Business)
5
About -50% (compared with FY13)
(estimate)
FY13 FY16 FY14 FY15
100
Sales
0
5%
0%
About -25%
OP ratio
1,900MW 1,500 - 1,600MW 2,400MW 2,000MW Size of
residential market
100 62 86 71 Market unit
price*
(system)
10%
*Based on the unit price in FY12 which is set at 100.
Source: IHS TECHNOLOGY “Prices of PV System in Japanese Housing Market
Market size (in value terms)
* Based on US GAAP
(yen : billions)

Copyright (C) 2016 Panasonic Corporation All Rights Reserved.
Eco Solutions Company Business Policy
6 large scale BDs
6
Business unit FY16 results
Results of
evaluation Sales vs. FY15 OP vs. FY15
Lighting
Business Division 320.3 +1% 20.3 +5.4 ○
Housing Systems
Business Division 353.6 -4% 14.0 +2.8 △
PanaHome
Corporation 353.0 +8% 15.9 +3.1 ○
[Reference]
* Based on US GAAP
(yen : billions)
* BD stands for business division
Eco Solutions Company Business Policy
Business Portfolio
7
12
Panasonic Ecology
Systems Co., Ltd.
Energy Systems
Business Division
Sales
10%
5%
200 400
OP ratio
0
Lighting Business
Division
Housing Systems
Business Division
FY13
FY16
*Size of circles indicates amounts
of profits.
(FY13 → FY16)
* Based on US GAAP
(yen : billions)

Copyright (C) 2016 Panasonic Corporation All Rights Reserved.
Eco Solutions Company Business Policy 8
Toward FY19
Eco Solutions Company Business Policy
Goals
9
FY17(f) FY16 FY19(f) Goals
1.4
0.6
2.0
1.3
0.6
1.9
1.6
0.7
2.3
Residential
2.0
Non-
residential
Minimum0.8
Minimum 2.8
BtoBtoC
BtoB
*Group’s total
The sales goal was revised by excluding the noncontiguous growth through M&A, and reviewing of the
timing PanaHome can achieve targets (such as the ones of their overseas businesses), and changes in
the domestic market for the PV power generation system business.
Including
0.4 by
PanaHome
Including
0.4 by
PanaHome
Including
0.5 by
PanaHome
*Based on IFRS
Sales
OP ratio 4.8% 5.5% 6.0% Minimum 7.5%
(yen : trillions)

Copyright (C) 2016 Panasonic Corporation All Rights Reserved.
Eco Solutions Company Business Policy
Priority investment
Strategic Framework
10
Growth in
residential-
related
business
Growth in non-
residential-
related
business
Remodeling business
Overseas residential-related business
New contraction and urban development
business
Elderly care business
Residential energy management business
LED solution business
Non-residential energy management
business
Engineering business
Tokyo Olympics and Tohoku region
rebuilding solutions
Development of new business
Do
me
stic
Ove
rse
as
Ove
rse
as
Dom
estic
+145B Yen
+10B Yen
+45B Yen
+10B Yen
+90B Yen
FY16⇒FY19
sales increase
+30B Yen
+3B Yen
+28B Yen
+7B Yen
*Based on IFRS
Eco Solutions Company Business Policy
FY17 Business Policy
11

Copyright (C) 2016 Panasonic Corporation All Rights Reserved.
Eco Solutions Company Business Policy
Market Environment
12
Japan
Overs
eas
FY17 forecast
New housing starts <Time lag has been
considered> 891,000
Housing
remodeling
Non-housing starts <Time lag has been
considered>
Construction investment <ACTION areas + America>
Source: Estimated by our company based on the reports by Japan
Center for Economic Research, Yano Research Institute Ltd.,
Research Institute of Construction and Economy, and IHS
*ACTION areas: ASEAN, China, Turkey and India
vs. FY16
+/-0%
6.6 trillion yen +2%
28.32 million m2 +/-0%
4,195 billion dollars +6%
Market index
+1%
*When consumption tax hike is postponed
※The sum of the store, warehouse, office and factory
Eco Solutions Company Business Policy
FY17 Financial Target
13
1,592.7 Sales
OP (%) 90.0 (5.5%)
76.3 (4.8%)
(vs. FY16 +3%)
1,640.0
FY16 FY17(f)
Sales Increasing sales and profit and
streamlining to offset the price
declines and increases in fixed costs
for growth.
Inside Japan, increasing the sales in the
growing areas such as the remodeling
business, and outside Japan, expanding
mainly in the strategic regions.
OP
UP UP
*based on IFRS
(yen : billions)
*When consumption tax hike is postponed

Copyright (C) 2016 Panasonic Corporation All Rights Reserved.
Eco Solutions Company Business Policy
FY17 Financial Target
14
76.3
FY16
1,592.7
Domestic
sales
increase
FY17(f)
FY16 FY17(f)
+47.3
+13.7
Domestic
sales
increase
90.0
1,640.0
*When consumption tax hike is postponed
*based on IFRS
[OP Analysis]
[Sales Analysis] Overseas
sales increase Exchange
rate effects
Price
declines
Overseas
sales
increase
Exchange
rate effects
Streamlining
& Price
declines Fixed-cost
increase
+28.9 ‐22.9
+61.3 ‐20.0
+5.6 +8.8
+22.0
‐29.2 +0.7 +5.8
Other
(yen : billions)
Expansion of
(strategic) investment
Eco Solutions Company Business Policy
FY17 Sales Goals
15
FY16 FY17(f) +47.3
1,640.0
(by strategy)
“Age Free”
(Elderly care)
business
Remodeling
business
Residential
energy
management
business
Overseas
business
Tokyo
Olympics and
Tohoku region
rebuilding
solutions
Non-residential
energy
management
business Engineering
business LED
solution
business
Residential-related business
Non-residential-related
business
960.0 990.0
FY16 FY17
632.7 654.0
FY16 FY17
*When consumption tax hike is postponed
*based on IFRS
(yen : billions)
+7.5
+2.4 +5.7
+0.2 +8.2
+12.7
+0.2
‐2.2
‐4.0
Decrease
in sales
of Solar
Business
and others
Elimination
and others
1,592.7 +16.6

Copyright (C) 2016 Panasonic Corporation All Rights Reserved.
Eco Solutions Company Business Policy
Remodeling Business
16
Increasing the growth rate by making upfront investments such
as the launch of a general remodeling company
Improving
customer
contacts
4 new LIVING
showrooms
opened
Reinforcing
designing and
construction systems
Offer a wider range
of products for
remodeling homes
Strengthening lineup of
mid-to-high end products
Cross-Value
Creating living space
value
AP AVC ES
Newly opening 50
directly managed
shops
Increase in sales staff
Increase in design staff
Custo
mer
Panasonic Home
Renovation Co., Ltd.
Panasonic Home Renovation Division (Eco Solutions)
Supporting policies
Strengthening collaboration
with the Group and
promotion store
Residential-
related business
strategy ①
255.9 billion yen in FY17(f)
(vs. FY16 +7%)
Reform Club
Increase to 400 shops
※Group Sales Goals 350 billion yen
Eco Solutions Company Business Policy
[Skeleton]
Creation of living space value Providing Panasonic Group’s original new “living space value” through
“equipment and building products / electrical construction materials /
consumer electronics × housing”
17
Constructional
materials and
exterior materials
Equipment and
building products [Infill]
Electrical construction materials Consumer electronics
Living space
value

Copyright (C) 2016 Panasonic Corporation All Rights Reserved.
Eco Solutions Company Business Policy
Expanding the service business and leading growth of the “Age free business”
18
The figures indicate the number of opened AGE-FREE elderly care service centers.
+30 sites (total 155 sites)
The figures indicate the number of opened AGE-FREE houses.
Sales grew by about 1.3 times in the years from FY13 to FY16 and the growth rate is increasing.
+20 sites (total 45 sites)
Elderly care services business
Elderly Housing with support services business
Uplifting CS with work environment improvement
37 billion yen in FY17(f)
(vs. FY16 +25%)
IT introduction for
recording work
Reducing workload
Enriching HR development & training program
Improving safety
Monitoring with IoT
“Age Free”(elderly care)
Business
Residential-
related business
strategy ③
Service business Improving the provided values
※Group Sales Goals 50 billion yen
Eco Solutions Company Business Policy
Residential Energy
Management Business Expediting promotion of HEMS for standardization
19
PV power generation system business Smart HEMS
Pursuing further streamlining
Maximizing profit by fully utilizing the existing
operating resources
Improving the system for overall proposal
・Gaining effects of investment for
streamlining / increases in production
(PV power generation + Storage battery + HEMS)
Improving compatibility with the ZEH by
proposing “total energy management” Increasing domestic share
FY16 FY15
New service
applications
[Number of sold “Smart Cosmo” panels]
About six-fold
expansion
Increasing speed of promotion
103.5 billion yen in FY17(f)
(vs. FY16 +6%)
Creation of an
infrastructure is
expanding steadily.
Residential-
related business
strategy ④
・Introducing strategic new
products for each market
・Widely promoting new
construction method

Copyright (C) 2016 Panasonic Corporation All Rights Reserved.
Eco Solutions Company Business Policy
Overseas Business
20
Growing in ACTION areas + North America. Potential in Middle East and Africa.
・ Increasing share in the wiring
devices market
・ Newly developing the
businesses of LED lighting, etc.
・ Collaboration with PanaHome
for promotion in ASEAN
Action areas
Expediting development of
e-commerce
ASEAN, India and Turkey
China
North America
Middle East and Africa
State of Baja California,
Mexico
Expediting the market development and
starting the full-scale promotion
・ Establishing the marketing controlling company
・ Use of Anchor, ViKO Wiring equipment, lighting fixtures, air cleaners, etc.
Accelerating business expansion of ventilating
system + full-scale development of PV business
・ Establishing “Made in market” system
・ PV business : Promotion of “HIT” superiority
162.5 billion yen in FY17(f)
(vs. FY16 +9%*)
Residential-
related business
strategy ⑤
*Effects of exchange rates are excluded.
Reinforcing promotion of wiring equipment and
expediting new businesses
Eco Solutions Company Business Policy
Facility and emergency lighting
Store lighting
Outdoor lighting
LED Solution Business
21
Business of lighting fixtures in Japan
Development of each market &
strengthening the proposal function
[Changes in Panasonic’s market
share in non-residential market]
FY15 FY16
50%
FY14
~ ~
40%
Capturing demands for LED and realizing strong growth
No. 1 second to
none
・ Improving proposal for each application.
Expanding product lineup.
・ Expanding the rendering lighting
business
Overseas LED equipment business
・ <China> Expanding lineup of the performance-prioritized products in the retailer field
・ <India> Responding to rapidly expanding LED market
・ <Indonesia> Strengthening of design and proposal teams. Improving lineup.
FY13
・ Improving cost competitiveness and promotion of
value-added products
258.8 billion yen in FY17(f)
(vs. FY16 +5%)
Non-residential-
related business
strategy ①
Rein
forc
ing th
e
pro
posal te
am
s
Increasing the speed of promotion in China, Indonesia and India

Copyright (C) 2016 Panasonic Corporation All Rights Reserved.
Eco Solutions Company Business Policy
Engineering Business
22
Environmental engineering business
Advancing “challenges in new areas” based on the domestic
engineering business
Expansion of chemical recycling business
Entering the livestock industry
Overseas engineering business
PV solution business in North America
Developing application of
water solution
technologies
Establishing know-hows for dairy/poultry
farming through collaboration with external
partners and groups
Sales expansion of about 22 times
in 4 years
FY16 FY17 (f) FY13
Electricity storage solution business
Establishing the basis
of electricity storage
solution business
132.6 billion yen in FY17(f)
(vs. FY16 +7%)
Non-residential-
related business
strategy ③
Expansion of 22 times
Eco Solutions Company Business Policy
300
Lighting Business Division
FY17(f) vs. FY16
Sales 338.8B yen +18.5B yen
OP 24.3B yen +11.3B yen
23
24.3
13.0
FY16 FY17(f) +11.3
Sales
increase
Exchange
rate effects,
expenses,
etc.
Streamlining
& Price
declines
FY15 FY16 FY14
5%
FY17(f)
[OP Margin]
FY13 0%
[OP Analysis] [Changes in Panasonic’s market share in domestic LED products market]
FY14 FY15 FY16 FY17(f) 0
LED
Existing
lighting source
products, etc.
Sales growth by enhancing LED lighting business performance
[Sales of Lighting BD]
(%)
[LED lighting sales ratio of whole Lighting BD sales]
~ ~
50
30
*Figures for FY17
are based on IFRS.
Profitable growth Implementation of structural reforms
*Figures for FY17 are based on IFRS.
70
50
40
(%)
6 large scale
BDs
*Based on IFRS
*Based on IFRS
+6.2
+1.0
‐4.5 +8.6
Fixed-cost
increase
(yen : billions)
(yen : billions)

Copyright (C) 2016 Panasonic Corporation All Rights Reserved.
Eco Solutions Company Business Policy
Implementation of structural reforms
Housing Systems Business Division
FY16 FY17(f) +2.7
13.7 16.4
Exchange
rate effects,
price
revision, etc.
5%
0%
Profit improvement by shifting to mid-to-high end product strategy
(Expanding remodeling business)
[Sales ratio of remodeling products]
0
100
[Sales of strategic products *]
* Modular kitchen systems, modular bathroom systems and floor materials
(%)
30
40
[Mid-to-high end product sales of whole strategic
product sales]
(%)
~ ~
30
20
Gaining effects
FY17(f) vs. FY16
Sales 370.0B yen +2.9B yen
Operating profit 16.4B yen +2.7B yen
*Based on IFRS [OP Margin] *Figures for FY17
are based on IFRS.
FY15 FY16 FY14 FY17(f) FY13
[OP Analysis] *Based on IFRS
Sales
increase
Streamlining
& Price
declines
FY14 FY15 FY16 FY17(f)
*Figures for FY17 are based on IFRS.
+0.4
+6.9 ‐5.4 +0.8
Fixed-cost
increase
6 large scale
BDs
(yen : billions)
(yen : billions)
24

Copyright (C) 2016 Panasonic Corporation All Rights Reserved.
Disclaimer Regarding Forward-Looking Statements This presentation includes forward-looking statements (that include those within the meaning of Section 27A of the U.S. Securities Act of
1933, as amended, and Section 21E of the U.S. Securities Exchange Act of 1934), as amended about Panasonic and its Group companies (the Panasonic Group). Panasonic discloses its consolidated financial forecasts for fiscal 2017 based on International Financial Reporting Standards (IFRS). To the extent that statements in this presentation do not relate to historical or current facts, they constitute forward-looking statements. These forward-looking statements are based on the current assumptions and beliefs of the Panasonic Group in light of the information currently available to it, and involve known and unknown risks, uncertainties and other factors. Such risks, uncertainties and other factors may cause the Panasonic Group's actual results, performance, achievements or financial position to be materially different from any future results, performance, achievements or financial position expressed or implied by these forward-looking statements. Panasonic undertakes no obligation to publicly update any forward-looking statements after the date of this presentation. Investors are advised to consult any further disclosures by Panasonic in its subsequent filings under the Financial Instrument and Exchange Act of Japan (the FIEA) and other publicly disclosed documents.
The risks, uncertainties and other factors referred to above include, but are not limited to, economic conditions, particularly consumer spending and corporate capital expenditures in the Americas, Europe, Japan, China and other Asian countries; volatility in demand for electronic equipment and components from business and industrial customers, as well as consumers in many product and geographical markets; the possibility that excessive currency rate fluctuations of the U.S. dollar, the euro, the Chinese yuan and other currencies against the yen may adversely affect costs and prices of Panasonic’s products and services and certain other transactions tha t are denominated in these foreign currencies; the possibility of the Panasonic Group incurring additional costs of raising funds, because of changes in the fund raising environment; the possibility of the Panasonic Group not being able to respond to rapid technological changes and changing consumer preferences with timely and cost-effective introductions of new products in markets that are highly competitive in terms of both price and technology; the possibility of not achieving expected results or incurring unexpected losses in connection with the alliances or mergers and acquisitions; the possibility of not being able to achieve its business objectives through joint ventures and other collaborative agreements with other companies, including due to the pressure of price reduction exceeding that which can be achieved by its effort and decrease in demand for products from business partners which Panasonic highly depends on in BtoB business areas; the possibility of the Panasonic Group not being able to maintain competitive strength in many product and geographical areas; the possibility of incurring expenses resulting from any defects in products or services of the Panasonic Group; the possibility that the Panasonic Group may face intellectual property infringement claims by third parties; current and potential, direct and indirect restrictions imposed by other countries over trade, manufacturing, labor and operations; fluctuations in market prices of securities and other assets in which the Panasonic Group has holdings or changes in valuation of long-lived assets, including property, plant and equipment and goodwill, deferred tax assets and uncertain tax positions; future changes or revisions to accounting policies or accounting rules; the possibili ty of incurring expenses resulting from a leakage of customers’ or confidential information from Panasonic’s systems due to unauthorized access or a detection of vulnerability of network-connected products of the Panasonic Group; as well as natural disasters including earthquakes, prevalence of infectious diseases throughout the world, disruption of supply chain and other events that may negatively impact business activities of the Panasonic Group. The factors listed above are not all-inclusive and further information is contained in the most recent English translated version of Panasonic’s securities reports under the FIEA and any other documents which are disclosed on its website.
In order to be consistent with generally accepted financial reporting practices in Japan, operating profit (loss) is presented in accordance
with generally accepted accounting principles in Japan. The company believes that this is useful to investors in comparing the company's financial results with those of other Japanese companies. Under United States generally accepted accounting principles, expenses associated with the implementation of early retirement programs at certain domestic and overseas companies, and impairment losses on long-lived assets are usually included as part of operating profit (loss) in the statement of income.