Eckhard Hein, Achim Truger
30
Working Paper Hans-Böckler-Straße 39 D-40476 Düsseldorf Germany Phone: +49-211-7778-331 [email protected] http://www.imk-boeckler.de Thomas I. Palley Financialization: What it is and Why it Matters 04/2008
Transcript of Eckhard Hein, Achim Truger

Working Paper
Hans-Böckler-Straße 39 D-40476 Düsseldorf Germany Phone: +49-211-7778-331 [email protected] http://www.imk-boeckler.de
Thomas I. Palley
Financialization: What it is and Why it Matters
04/2008

Financialization: What it is and Why it Matters
Thomas I. Palley
Abstract
Financialization is a process whereby financial markets, financial institutions and financial elites gain greater influence over economic policy and economic outcomes. Financialization transforms the functioning of economic system at both the macro and micro levels.
Its principal impacts are to (1) elevate the significance of the financial sector relative to the real sector; (2) transfer income from the real sector to the financial sector; and (3) increase income inequality and contribute to wage stagnation. Additionally, there are reasons to be-lieve that financialization may render the economy prone to risk of debt-deflation and pro-longed recession.
Financialization operates through three different conduits: changes in the structure and opera-tion of financial markets; changes in the behavior of non-financial corporations, and changes in economic policy.
Countering financialization calls for a multi-faceted agenda that (1) restores policy control over financial markets, (2) challenges the neo-liberal economic policy paradigm encouraged by financialization, (3) makes corporations responsive to interests of stakeholders other than just financial markets, and (4) reforms the political process so as to diminish the influence of corporations and wealthy elites.
JEL code: E61, E62, E63, E64, E65
Keywords: Financialization, neo-liberal policy, deregulation, debt, financial fragility.
JEL ref.: B50, E44, E60
Thomas I. Palley Economics for Democratic & Open Societies, Washington DC, and Visiting Scholar at the Macroeconomic Policy Institute (IMK), Germany E-mail:[email protected]
1st Draft: October 24, 2007 This draft November 6, 2007 Paper presented at a conference on “Finance-led Capitalism? Macroeconomic Effects of Changes in the Finan-cial Sector,” sponsored the Hans Boeckler Foundation and held in Berlin, Germany, October 26 – 27, 2007. My thanks to conference participants for valuable suggestions. All errors in the paper are my own.
2
1. Financialization : what it is and why it is of concern
This paper explores the construct of “financialization,” which Epstein (2001) defines as fol-
lows:
“Financialization refers to the increasing importance of financial markets, finan-
cial motives, financial institutions, and financial elites in the operation of the
economy and its governing institutions, both at the national and international level
(Epstein 2001, p.1).”
The paper focuses on the US economy, which is where financialization seems to be most de-
veloped. However, judging by the increase in rentier income shares, financialization appears
to have infected all industrialized economies (Power, Epstein & Abrena, 2003; Jayadev and
Epstein, 2007).
Financialization transforms the functioning of the economic system at both the macro and
micro levels. Its principal impacts are to (1) elevate the significance of the financial sector
relative to the real sector; (2) transfer income from the real sector to the financial sector; and
(3) contribute to increased income inequality and wage stagnation.
Financialization raises public policy concerns at both the macroeconomic and microeconomic
levels. At the macro level, the era of financialization has been associated with tepid real eco-
nomic growth, and growth also appears to show a slowing trend.1 There are also indications
of increased financial fragility. Internationally, fragility was evident in the run of financial
crises that afflicted the global economy in the late 1990s and early 2000s, and it has surfaced
again in the recent US sub-prime mortgage crisis that spread to Europe.
Furthermore, there are serious reservations about the sustainability of the financialization
process. The last two decades have been marked by rapidly rising household debt-income
ratios and corporate debt-equity ratios. These developments explain both the system’s growth
and increasing fragility, but they also indicate unsustainability because debt constraints must
eventually bite. The risk is when this happens the economy could be vulnerable to debt-
deflation and prolonged recession.
1 Stockhammer (2007) has documented that growth in the EU has also been tepid over the past twenty-five years during the era of financialization.

3
These macroeconomic concerns are compounded by concerns about income distribution.
Thus, the era of financialization has witnessed a disconnection of wages from productivity
growth, raising serious concerns regarding wage stagnation and widening income and wealth
inequality (Mishel et al., 2007).
The financialization thesis is that these changes in macroeconomic patterns and income distri-
bution are significantly attributable to financial sector developments. Those developments
have relaxed constraints on access to finance and increased the influence of the financial sec-
tor over the non-financial sector. For households this has enabled greatly increased borrow-
ing. For non-financial firms, it has contributed to changes in firm behavior. When combined
with changes in economic policy that have been supported by financial and non-financial
business elites, these developments have changed the broader character and performance of
the economy.
2. Financialization and conventional economic theory
Conventional economic theory has played an important role promoting financialization. One
area where theory has been especially important is the formulation of the relationship between
firms and financial markets in terms of an agency problem (Jensen and Meckling, 1976)
whereby the challenge is to get the firm’s managers to maximize profits on behalf of share-
holders. This representation has had important consequences. First, the agency approach en-
visages the solution to the corporate governance problem as one of aligning the interests of
managers with those of financial market participants. That has been used to rationalize the
explosion in top management compensation and stock option grants, and it has also been used
to justify the rise of the takeover movement and private equity investment. Second, the
agency approach promotes a legal view whereby the sole purpose of corporations - which are
a societal construction - is to maximize shareholder returns within the confines of the law.
That has served to restrict the focus of policy discussion to how to give shareholders greater
control over managers. Meanwhile, broader questions regarding the purpose of corporations
and the interest of other stakeholders have been kept completely off the policy table.
Conventional economic theory has also lent support for financialization, by arguing that the
expansion of financial markets enhances economic efficiency. This rationale draws from Ar-
row and Debreu’s (1954) construction of financial assets as contingent claims. According to
this view, expanding the scope of financial markets and the range of financial assets increases
efficiency by expanding the states of nature spanned by financial instruments. This enables

4
markets to better price future economic outcomes, improves the ex-ante allocation of re-
sources across future contingent economic conditions, and helps agents assemble portfolios
that provide better returns and risk coverage.2
Conventional theory has also tended to dismiss problems of financial speculation using
Friedman’s (1953) argument that speculation is stabilizing. According to Friedman, market
prices are set on the basis of economic fundamentals. When prices diverge from those funda-
mentals that creates a profitable opportunity. Speculators then step in and buy or sell, driving
prices back to the level warranted by fundamentals.
Increasing the number of traders and volume of trading is also regarded as improving finan-
cial market outcomes. Increased trade volume increases market liquidity so that market prices
are less susceptible to small random disturbances or manipulation by individual market par-
ticipants.
Lastly, macroeconomic theory has also supported this optimistic view of financial markets
through q-theory (Brainard and Tobin, 1977). “q” represents the ratio of the market price of
capital to its replacement cost, and the q-ratio supposedly provides firms with a signal that
efficiently directs investment and capital accumulation. Thus, when q is greater than unity, the
market price exceeds the replacement cost. That sends a signal that capital is in short supply
and profitable investment opportunities are available, and firms respond by investing.
As always, there is some mainstream literature challenging these conclusions, and that litera-
ture is growing with the emergence of the behavioral finance approach. For instance, rational
expectations theory (Flood and Garber, 1980) acknowledges that market participants can rati-
onally participate in bubbles if they have expectations of rising prices. The noise trader litera-
ture initiated by De Long et al. (1990) argues that risk-neutral speculators who trade purely on
noise can generate market inefficiency if other traders are risk averse. Hirshleifer (1971) ar-
gues that financial market activity can be socially wasteful if the activity is the result of diver-
gent subjectively held beliefs, making it more akin to betting at a racecourse than productive
investment. In this case the race uses valuable economic resources but produces nothing.
Lastly, Crotty (1990) and Palley (2001) have criticized the logic of q-theory, arguing it erro-
2 One caveat to this argument is from second-best best theory. If markets are incomplete, expanding the number of markets can theoretically worsen outcomes by increasing the returns to distorted trades, thereby amplifying their volume. However, this is a theoretical possibility and there is no a priori reason to believe that this will actually happen.
5
neously conflates the behaviors and expectations of managers with those of shareholders and
the reality is stock market signals to invest can be highly inefficient.
However, these within paradigm critiques of financial market activity have been more akin to
bubbles on a stream. That is they show financial markets can generate inefficient outcomes
according to conventional theory, but these critiques have had little impact on either broad
thinking about financial markets or the direction of policy, both of which remain driven by
belief that deregulation and expansion of financial markets is welfare enhancing.
Most importantly, these critiques of financial markets are generated from within the conventi-
onal paradigm so that they remain structured by that paradigm. Consequently, financial mar-
kets are assessed in terms of the neo-classical allocative efficiency paradigm, rather than
being seen as part of an economic system that distributes power and affects the character of
production and the distribution of income. The construct of financialization remedies this fai-
ling.
3. The anatomy of financialization
The defining feature of financialization in the U.S. has been an increase in the volume of debt.
Using peak business cycle years for purposes of control, Table 1 shows the evolution of total
credit market debt outstanding between 1973 and 2005.3 During this period, total debt rose
from 140 to 328.6 percent of GDP. Financial sector debt also grew much faster than non-
financial sector debt, so that financial sector debt rose from 9.7 to 31.5 percent of total debt
over the same period. 1979 appears to mark a break point, with financial sector debt increa-
sing much more rapidly relative to non-financial sector debt thereafter.
Table 2 provides an analysis of non-financial sector debt by type of credit. Consumer revol-
ving credit is stripped out because its evolution largely reflects changes in payments techno-
logy (i.e. increased use of credit cards) rather than fundamental changes in indebtedness. Co-
lumn 6 shows that between 1973 and 2005 non-financial sector debt-x-revolving credit grew
significantly faster than GDP, rising from 136.3 percent to 189.5 percent of GDP. Column 8
shows the mortgage component has risen especially rapidly, rising from 48.7 percent to 97.5
percent of GDP. This increase in mortgage debt has been especially sharp in the period 2000 –
2005, reflecting the U.S. house price bubble.
3 The years 1973, 1979, 1989, and 2000 correspond to peak years of the business cycle, thereby providing peak-to-peak comparisons that facilitate comparison across business cycles. 2005 is not the peak of the current busi-ness cycle but reflects latest available data.

Table 1
Credit market debt outstanding
GDP
($ bils.)
Total credit market debt
($ bils.)
Total cre-dit/GDP
(%)
Financial sector debt
($ bils.)
Financial sector debt/Total debt
(%)
Non-financial sector
debt/Total debt (%)
1973 1,382.7 2,172.7 140.0% 209.8 9.7% 90.3%
1979 2,563,3 4,276.4 166.8 504.9 11.8 88.2
1989 5,484.4 12,838.7 234.1 2,399.3 18.7 81.3
2000 9,187.0 27,019.6 294.1 8,130.3 30.1 69.9
2005 12,455.8 40,926.0 328.6 12,905.2 31.5 68.5
Source: Economic Report of the President, Table B-1; Flow of Funds, Table L.1, Board of Governors of the Federal Reserve, September 17, 2007; and author’s calculations.
6

Table 2
Domestic non-financial sector debt
GDP
($ bil.)
Debt of domestic non-fin. Sectors
($ bil)
Consumer revolving
credit
($ bil)
Debt-x-
Revolving credit
($ bil.)
Debt-x- re-volving
credit/GDP
(%)
Mortgage debt
($ bil.)
Mortgage debt/GDP
(%)
Debt-x-
Revolving credit-x- mortgage
($ bil.)
Debt-x- re-volving-x-
mort-gage/GDP
(%)
1973 1,382.7 1,895.5 11.3 1,884.2 136.3% 673.4 48.7% 1,210.8 87.6%
1979 2,563.3 3,603.0 53.6 3,549.4 138.5 1,330.0 51.9 2,219.4 86.6
1989 5,484.4 10,156.7 211.2 9,945.5 181.3 3,591.3 65.5 6,354.2 115.8
2000 9,187.0 18,091.2 683.0 17,408.2 189.5 6,795.2 74.0 10,613.0 115.5
2005 12,455.8 26,647.1 826.6 25,820.5 207.3 12,148.7 97.5 13,671.8 109.8
Source: Economic Report of the President, Tables B-69, B-75 and B-77, 2007, and author’s calculations.
7

8
Table 3 provides another analysis of non-financial sector debt, this time by type of borrower.
The striking feature about this table is the extraordinary rise in household sector debt. Col-
umns 6 and 7 show that both non-financial corporate and household sector debt rose sharply
relative to GDP, with the break happening in 1979. However. household sector debt has risen
far faster, as evidenced in column 9 which shows its increasing share of total domestic non-
financial debt. The relatively more rapid growth of household debt started after 1989. In the
1980s the debt growth increased in both the household and non-financial corporate sector, but
at a fairly similar rate. Since, 1989 debt has continued growing in all sectors, but it has been
growing far faster in the household sector.
Table 3
Composition of domestic non-financial sector debt
GDP
($ bil.)
Debt of domestic non-fin. sector
($ bil)
Non-fin.
Corp debt
($ bil)
House-hold
sector debt
($ bil)
Non-fin. Corp debt/ GDP (%)
House-hold debt/ GDP
(%)
Non-fin. Corp debt/
Domestic non-fin. debt (%)
House-hold debt/
Domes-tic non-fin. debt
(%)
1973 1,638.3 1,895.5 495.6 624.9 30.3% 45.2% 26.2% 33.0%
1979 2,563.3 3,603.0 843.8 1,276.1 32.9 49.8 23.4 35.4
1989 5,484.4 10,156.7 2,401.3 3,335.9 43.8 60.8 23.6 32.8
2000 9,817.0 18,091.2 4,530.7 7,008..8 46.2 76.3 25.0 38.7
2005 12,455.8 26,647.1 5,285.0 11,707.0 42.4 94.0 19.8 43.9
Source: Economic Report of the President, Table B-1; Flow of Funds, Table L.1, Board of Governors of the Federal Reserve,
September 17, 2007; and author’s calculations.
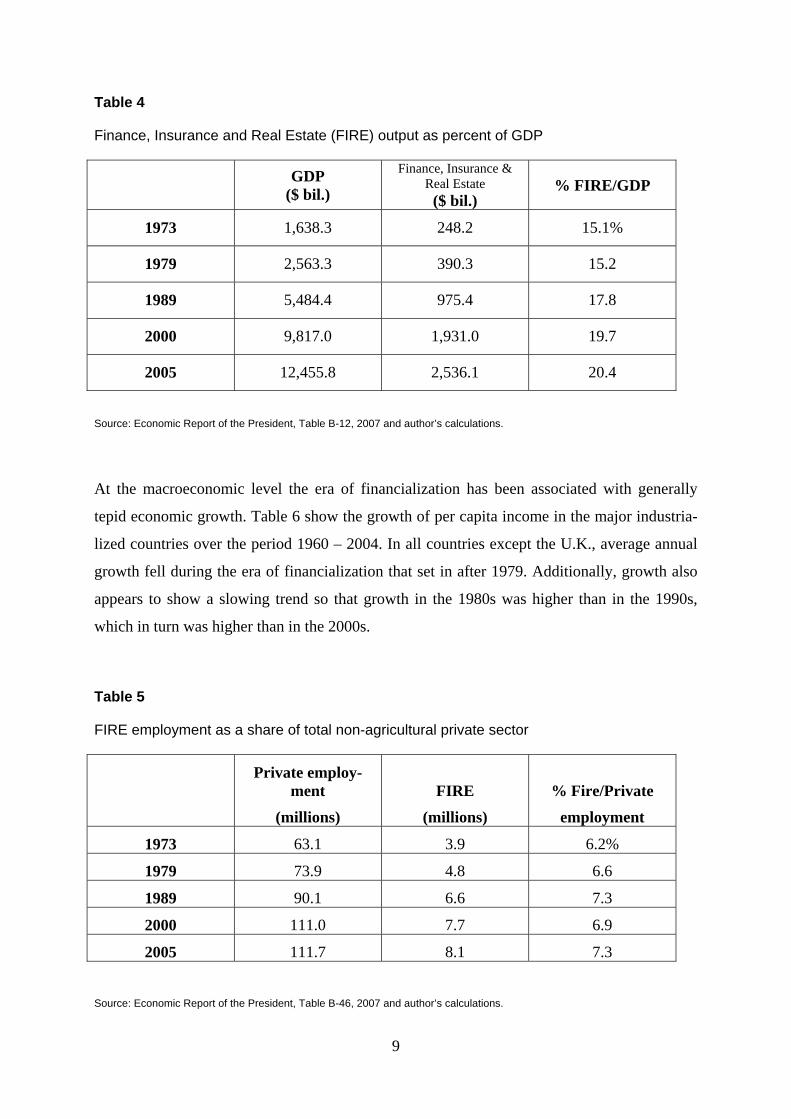
Turning to the real economy, Table 4 shows the growing importance of the financial sector in
the U.S. economy. Between 1979 and 2005, the contribution of the finance, insurance and real
estate (FIRE) sector to GDP rose from 15.2 percent to 20.4 percent. Table 5 shows that at the
same time, FIRE employment as a share of total private sector employment rose from 6.6 per-
cent to 7.3 percent.
9
Table 4
Finance, Insurance and Real Estate (FIRE) output as percent of GDP
GDP ($ bil.)
Finance, Insurance & Real Estate ($ bil.)
% FIRE/GDP
1973 1,638.3 248.2 15.1%
1979 2,563.3 390.3 15.2
1989 5,484.4 975.4 17.8
2000 9,817.0 1,931.0 19.7
2005 12,455.8 2,536.1 20.4
Source: Economic Report of the President, Table B-12, 2007 and author’s calculations.
At the macroeconomic level the era of financialization has been associated with generally
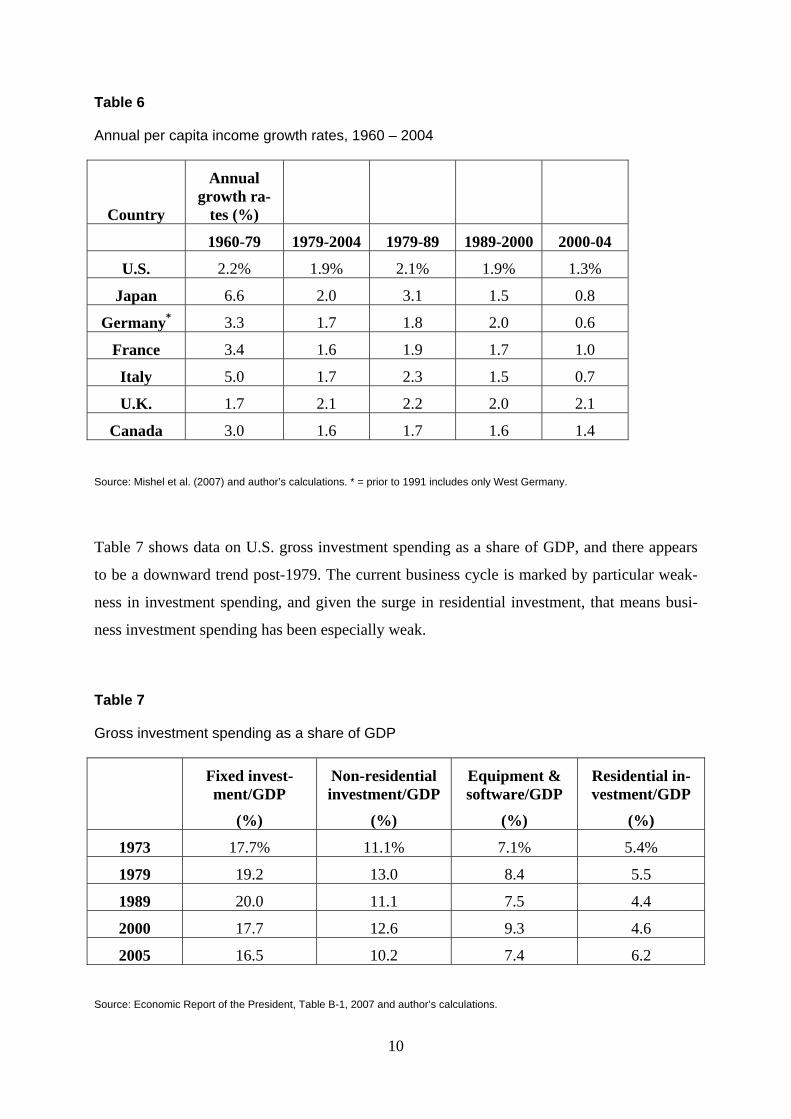
tepid economic growth. Table 6 show the growth of per capita income in the major industria-
lized countries over the period 1960 – 2004. In all countries except the U.K., average annual
growth fell during the era of financialization that set in after 1979. Additionally, growth also
appears to show a slowing trend so that growth in the 1980s was higher than in the 1990s,
which in turn was higher than in the 2000s.
Table 5
FIRE employment as a share of total non-agricultural private sector
Private employ-ment
(millions)
FIRE
(millions)
% Fire/Private
employment
1973 63.1 3.9 6.2%
1979 73.9 4.8 6.6
1989 90.1 6.6 7.3
2000 111.0 7.7 6.9
2005 111.7 8.1 7.3
Source: Economic Report of the President, Table B-46, 2007 and author’s calculations.
10
Table 6
Annual per capita income growth rates, 1960 – 2004
Country
Annual growth ra-
tes (%)
1960-79 1979-2004 1979-89 1989-2000 2000-04
U.S. 2.2% 1.9% 2.1% 1.9% 1.3%
Japan 6.6 2.0 3.1 1.5 0.8
Germany* 3.3 1.7 1.8 2.0 0.6
France 3.4 1.6 1.9 1.7 1.0
Italy 5.0 1.7 2.3 1.5 0.7
U.K. 1.7 2.1 2.2 2.0 2.1
Canada 3.0 1.6 1.7 1.6 1.4
Source: Mishel et al. (2007) and author’s calculations. * = prior to 1991 includes only West Germany.
Table 7 shows data on U.S. gross investment spending as a share of GDP, and there appears
to be a downward trend post-1979. The current business cycle is marked by particular weak-
ness in investment spending, and given the surge in residential investment, that means busi-
ness investment spending has been especially weak.
Table 7
Gross investment spending as a share of GDP
Fixed invest-ment/GDP
(%)
Non-residential investment/GDP
(%)
Equipment & software/GDP
(%)
Residential in-vestment/GDP
(%)
1973 17.7% 11.1% 7.1% 5.4%
1979 19.2 13.0 8.4 5.5
1989 20.0 11.1 7.5 4.4
2000 17.7 12.6 9.3 4.6
2005 16.5 10.2 7.4 6.2
Source: Economic Report of the President, Table B-1, 2007 and author’s calculations.

These headline changes in levels of debt and the composition of macroeconomic activity have
been accompanied by changes in the evolution of wages and the distribution of income. Figu-
re 1 shows how wages of US production and non-supervisory workers (who constitute over
80 percent of employment) have become detached from productivity growth during the era of
financialization. From 1959 – 1979 wages grew roughly in line with productivity, but thereaf-
ter the two have diverged with wages flat-lining while productivity has continued growing.
Figure 1. Index of productivity and hourly compensation of production and non-supervisory workers in the U.S., 1959-2005. Source: Economic Policy Institute.
50
100
150
200
250
300
1959
1961
1963
1965
1967
1969
1971
1973
1975
1977
1979
1981
1983
1985
1987
1989
1991
1993
1995
1997
1999
2001
2003
2005In
dex,
195
9 =
100
productivity
compensation
This stagnation of wages has been accompanied by rising income inequality. Mishel et al.
(2007) report that in 1979 the income of the top five percent of families was 11.4 times the
income of the bottom twenty percent of families. By 2004 this ratio had risen to 20.7 times.
Economists have identified multiple factors behind the stagnation of wages and the growth of
income inequality (Palley 1998a; Gordon, Dew-Becker, 2007; Levy, Temin, 2007). Those
factors include the erosion of unions, the minimum wage, and labor market solidarity; global-
ization and trade; immigration; skill-biased technical change; and rising CEO pay supposedly
driven by the logic of the economics of superstars. However, such analysis tends to treat these
factors as independent of each other. The financialization thesis maintains that many of these
factors should be linked and interpreted as part of a new economic configuration that has been
explicitly promoted by financial sector interests.
11

The stagnation of wages and changes in personal income distribution has been accompanied
by changes in the functional distribution of income, and these latter changes spotlight the role
of financialization. Figure 2 shows the national income tree that describes how national in-
come can be broken down into payments as wages and capital income. Wages can be decom-
posed into payments to managers and workers, while capital incomes can be decomposed into
profit and interest payments, and profit can be decomposed into financial and non-financial
sector profits.
Figure 2. Financialization & the Functional Distribution of Income
National Income
Capital share Wage share
Managers WorkersProfitsInterest
Financial sector Non-financial sector
Table 8 shows the evolution of corporate profits before interest relative to employee compen-
sation. Profits and interest rose from 22.3 percent of employee compensation in 1973 to 25.8
percent in 2005, indicating a shift of income away from labor to capital.
Table 8
Capital’s share
Employee compen-sation
($ bil)
Corporate profits before interest
($ bil)
Profits before inte-rest/compensation
1973 811.2 180.7 22.3%
1979 1,500.8 362.1 24.1
1989 3,145.2 858.7 27.3
2000 5,782.7 1,376.9 23.8
2005 7,030.3 1,814.1 25.8
12Source: Economic Report of the President, Table B-28, 2007 and author’s calculations.
13
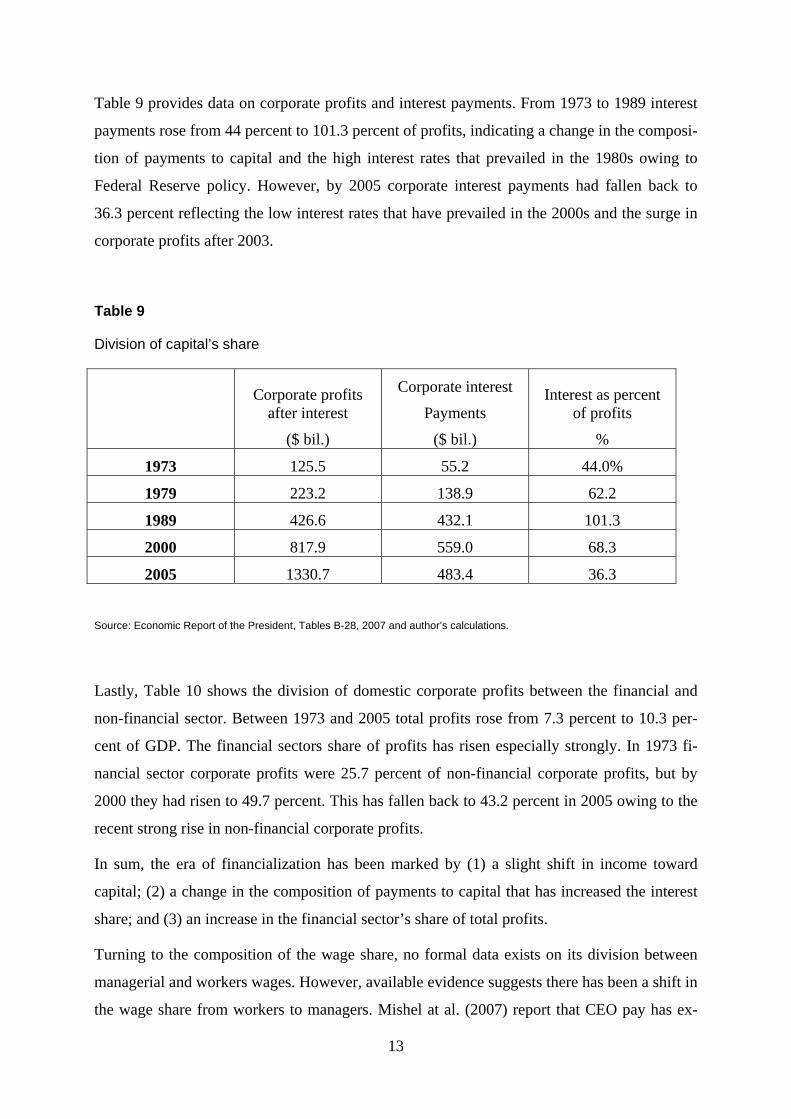
Table 9 provides data on corporate profits and interest payments. From 1973 to 1989 interest
payments rose from 44 percent to 101.3 percent of profits, indicating a change in the composi-
tion of payments to capital and the high interest rates that prevailed in the 1980s owing to
Federal Reserve policy. However, by 2005 corporate interest payments had fallen back to
36.3 percent reflecting the low interest rates that have prevailed in the 2000s and the surge in
corporate profits after 2003.
Table 9
Division of capital’s share
Corporate profits after interest
($ bil.)
Corporate interest
Payments
($ bil.)
Interest as percent of profits
%
1973 125.5 55.2 44.0%
1979 223.2 138.9 62.2
1989 426.6 432.1 101.3
2000 817.9 559.0 68.3
2005 1330.7 483.4 36.3
Source: Economic Report of the President, Tables B-28, 2007 and author’s calculations.
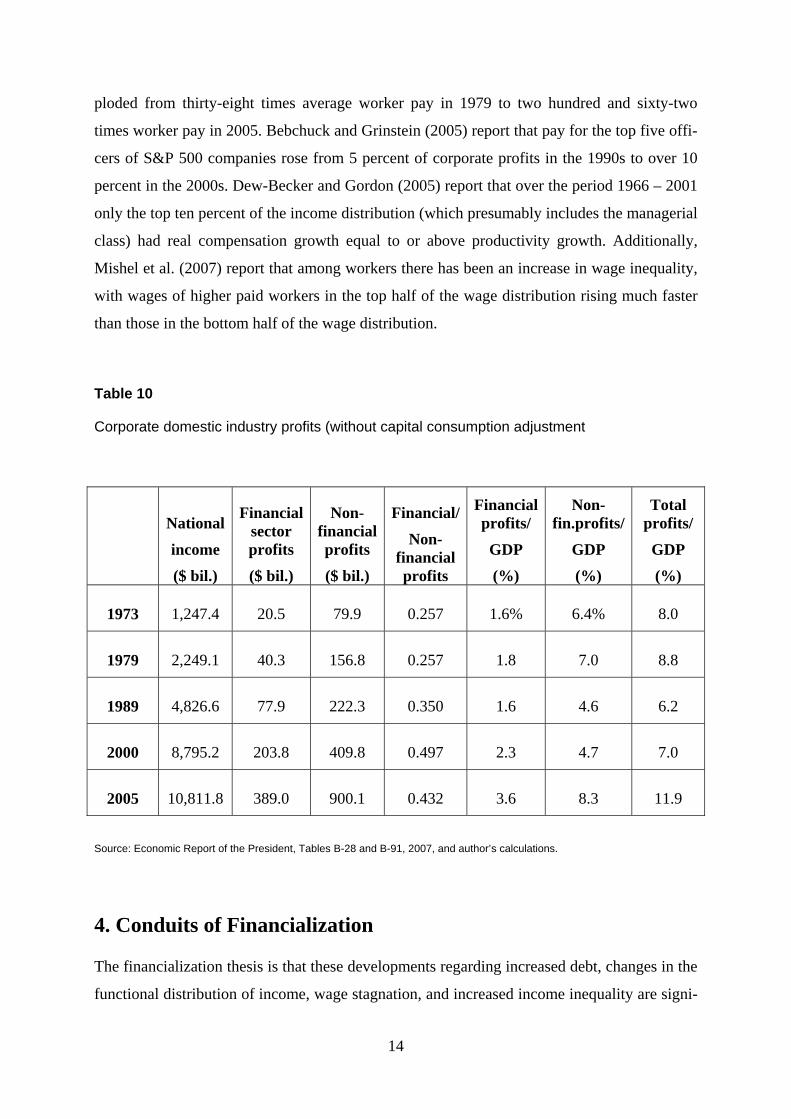
Lastly, Table 10 shows the division of domestic corporate profits between the financial and
non-financial sector. Between 1973 and 2005 total profits rose from 7.3 percent to 10.3 per-
cent of GDP. The financial sectors share of profits has risen especially strongly. In 1973 fi-
nancial sector corporate profits were 25.7 percent of non-financial corporate profits, but by
2000 they had risen to 49.7 percent. This has fallen back to 43.2 percent in 2005 owing to the
recent strong rise in non-financial corporate profits.
In sum, the era of financialization has been marked by (1) a slight shift in income toward
capital; (2) a change in the composition of payments to capital that has increased the interest
share; and (3) an increase in the financial sector’s share of total profits.
Turning to the composition of the wage share, no formal data exists on its division between
managerial and workers wages. However, available evidence suggests there has been a shift in
the wage share from workers to managers. Mishel at al. (2007) report that CEO pay has ex-
14
ploded from thirty-eight times average worker pay in 1979 to two hundred and sixty-two
times worker pay in 2005. Bebchuck and Grinstein (2005) report that pay for the top five offi-
cers of S&P 500 companies rose from 5 percent of corporate profits in the 1990s to over 10
percent in the 2000s. Dew-Becker and Gordon (2005) report that over the period 1966 – 2001
only the top ten percent of the income distribution (which presumably includes the managerial
class) had real compensation growth equal to or above productivity growth. Additionally,
Mishel et al. (2007) report that among workers there has been an increase in wage inequality,
with wages of higher paid workers in the top half of the wage distribution rising much faster
than those in the bottom half of the wage distribution.
Table 10
Corporate domestic industry profits (without capital consumption adjustment
National
income
($ bil.)
Financial sector profits
($ bil.)
Non-financial profits
($ bil.)
Financial/
Non-financial profits
Financial profits/
GDP
(%)
Non-fin.profits/
GDP
(%)
Total profits/
GDP
(%)
1973 1,247.4 20.5 79.9 0.257 1.6% 6.4% 8.0
1979 2,249.1 40.3 156.8 0.257 1.8 7.0 8.8
1989 4,826.6 77.9 222.3 0.350 1.6 4.6 6.2
2000 8,795.2 203.8 409.8 0.497 2.3 4.7 7.0
2005 10,811.8 389.0 900.1 0.432 3.6 8.3 11.9
Source: Economic Report of the President, Tables B-28 and B-91, 2007, and author’s calculations.
4. Conduits of Financialization
The financialization thesis is that these developments regarding increased debt, changes in the
functional distribution of income, wage stagnation, and increased income inequality are signi-
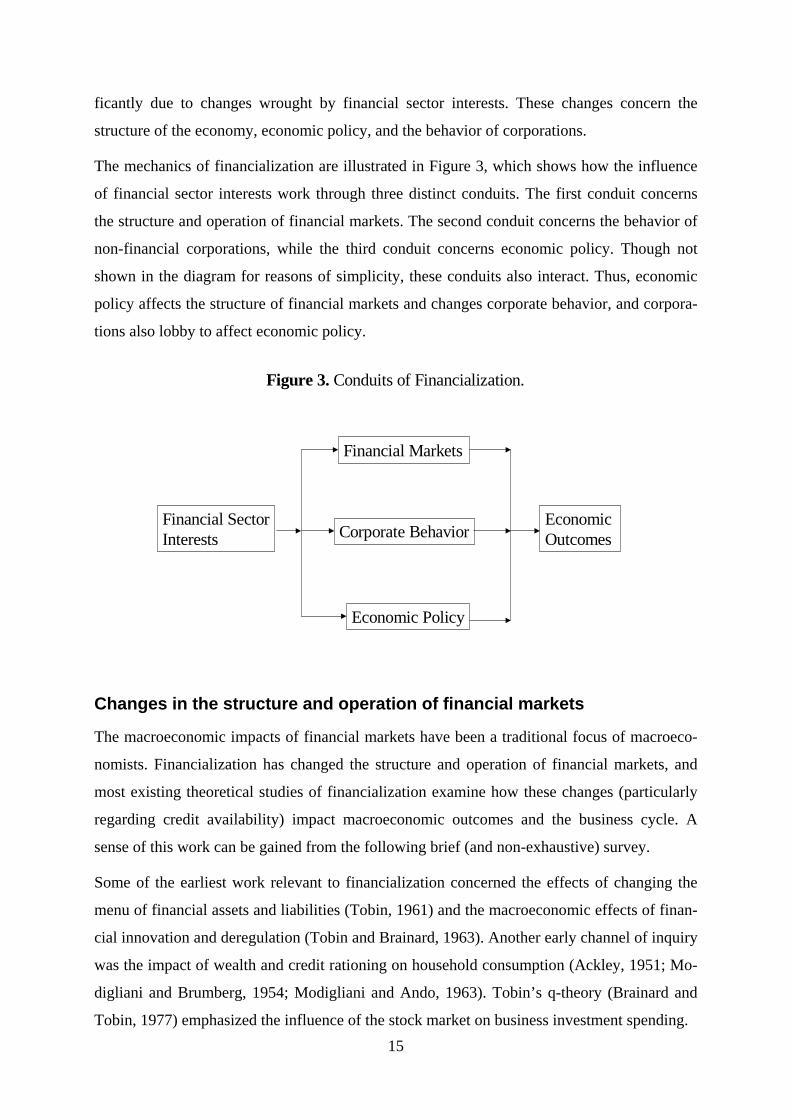
ficantly due to changes wrought by financial sector interests. These changes concern the
structure of the economy, economic policy, and the behavior of corporations.
The mechanics of financialization are illustrated in Figure 3, which shows how the influence
of financial sector interests work through three distinct conduits. The first conduit concerns
the structure and operation of financial markets. The second conduit concerns the behavior of
non-financial corporations, while the third conduit concerns economic policy. Though not
shown in the diagram for reasons of simplicity, these conduits also interact. Thus, economic
policy affects the structure of financial markets and changes corporate behavior, and corpora-
tions also lobby to affect economic policy.
Figure 3. Conduits of Financialization.
Financial SectorInterests Corporate Behavior
Economic Policy
Economic Outcomes
Financial Markets
Changes in the structure and operation of financial markets
The macroeconomic impacts of financial markets have been a traditional focus of macroeco-
nomists. Financialization has changed the structure and operation of financial markets, and
most existing theoretical studies of financialization examine how these changes (particularly
regarding credit availability) impact macroeconomic outcomes and the business cycle. A
sense of this work can be gained from the following brief (and non-exhaustive) survey.
Some of the earliest work relevant to financialization concerned the effects of changing the
menu of financial assets and liabilities (Tobin, 1961) and the macroeconomic effects of finan-
cial innovation and deregulation (Tobin and Brainard, 1963). Another early channel of inquiry
was the impact of wealth and credit rationing on household consumption (Ackley, 1951; Mo-
digliani and Brumberg, 1954; Modigliani and Ando, 1963). Tobin’s q-theory (Brainard and
Tobin, 1977) emphasized the influence of the stock market on business investment spending. 15
16
This early work on the macroeconomic effects of financial markets tended to ignore credit
and debt, which has become the focus of current work on financialization. Minsky (1982) has
been especially influential with his psychological theory of the business cycle that has agents
borrowing and bidding up asset prices to unsupportable levels that is then followed by a crash.
Additionally, there has been a resurgence of interest in Fisher’s (1933) debt-deflation theory
of recessions, which links with the long-standing debate in Keynesian economics whether
price level adjustment can restore full employment in a monetary economy with nominal debt
(Tobin, 1980; Caskey and Fazzari, 1987; Palley, 1999, 2007a).
Minsky’s (1982) construction of the business cycle has considerable similarities with the the-
ory of the financial accelerator developed by Bernanke and Gertler (1996). However, Minsky
places greater emphasis on subjective psychological forces and speculation. Financial accele-
rator theory emphasizes asset price inflation that raises collateral values, which allows more
borrowing that finances investment spending and drives economic expansion. However, even-
tually firms’ balance sheets become congested so that borrowing and investment fall, setting
off a downturn in which asset prices fall. Credit constraints then tighten, causing a cumulative
spiral downward (Kiyotaki and Moore, 1997).
The financial accelerator, which might also be termed the “balance sheet congestion” appro-
ach, has now become the major workhorse for theoretical enquiry into the macroeconomic
effects of financialization. The focus is on how changes in financial markets affect collateral
values and credit availability, thereby relaxing corporate balance sheet constraints and poten-
tially making for more volatile and longer business cycles that may even be unstable.
Additionally, there is a specifically Post Keynesian line of inquiry that emphasizes the impact
of debt on income distribution and aggregate demand (Palley, 1994, 1996a, 1997a). This Post
Keynesian approach emphasizes how debt transfers income from high marginal propensity to
spend debtors to lower marginal propensity to spend creditors, and this process of transfer can
generate business cycles. However, this line of enquiry emphasizing income distribution ef-
fects has been ignored by the mainstream, which has instead chosen to focus on the corporate
balance sheet congestion mechanism.
Finally, there is an emerging Post Keynesian literature that seeks to examine the effects of
financialization on long run growth (Dutt, 2005; Palley, 2005a; Hein, Treeck, 2007; Lavoie,
2007; Skott, Ryoo, 2007). This literature focuses on the growth effects of increased indebted-
ness, increases in the profit share, shifts in income away from workers, and lower retained
profits of corporations. The emerging consensus is that these factors tend to reduce the long
17
run equilibrium growth rate. However, this conclusion is sensitive to assumptions about the
response of aggregate demand to changes in come the profit share, In particular, if investment
responds strongly to an increased profit share and consumption is little affected by a lowered
wage share, then growth can increase as a result of an increased profit share.
Corporate behavior
A second conduit for the influence of financialization is corporate behavior, which financial
markets have worked to change so as to align with their interests. As discussed earlier,
mainstream economic theory has played an important role via its construction of the issue of
corporate governance as an agency problem. That construction has given rise to the notion of
the market for corporate control, whereby managers are disciplined by the prospect of takeo-
ver and ouster if they fail to maximize profits. According to this view, financial innovations
such as leveraged buyouts and private equity investing financed by junk bonds are market
efficiency improvements that compel managers to satisfy the interests of shareholders, who
are the owners.
The agency approach to corporate governance has also fostered the growth of stock option
pay, the reasoning being that options serve to align the interests of management with those of
shareholders. Top management has benefited from these new pay practices and stock options
have given managers an interest in maximizing the short-term stock price, which also benefits
financial market money managers. However, it is not clear that shareholders have benefited as
the costs of top management pay have become staggeringly large (Bebchuck, Grinstein, 2005)
and the long term profitability of companies may have been prejudiced by the focus on the
short-term share price.
This realignment of corporate manager interests to coincide with those of financial markets
has been facilitated by the destruction of union power. This has removed a countervailing
force that previously prevented managers from siding excessively with financial interests.
Corporations have also been encouraged to adopt a cult of debt finance. One reason is the tax
code, which treats interest payments more favorably than profits. A second reason is that ma-
nagers may have used debt as a tactic to drain free cash flow out of firms, thereby putting
pressure on workers and leaving less for other claimants on the firms’ income stream (Bronars
and Deere, 1991). A third reason is that debt financing increases leverage, thereby potentially
raising the rate of return on equity capital. Such financial engineering fits with the Wall Street
agenda that has demanded corporations earn higher rates of return.
The net result of these developments is that corporate behavior has become increasingly do-
minated by and beholden to financial markets. That means corporate managers may have im-
ported the behaviors of financial markets, which has impacted corporate investment and busi-
ness decision-making. From an agency theory perspective this is the desired outcome. How-
ever, it may not be good for corporations or the economy if financial market behaviors are
governed by short-termism (Palley 1995) and herd behavior (Palley 1997b). Moreover, it may
simply shift the agency problem from corporate managers to money managers in financial
markets.
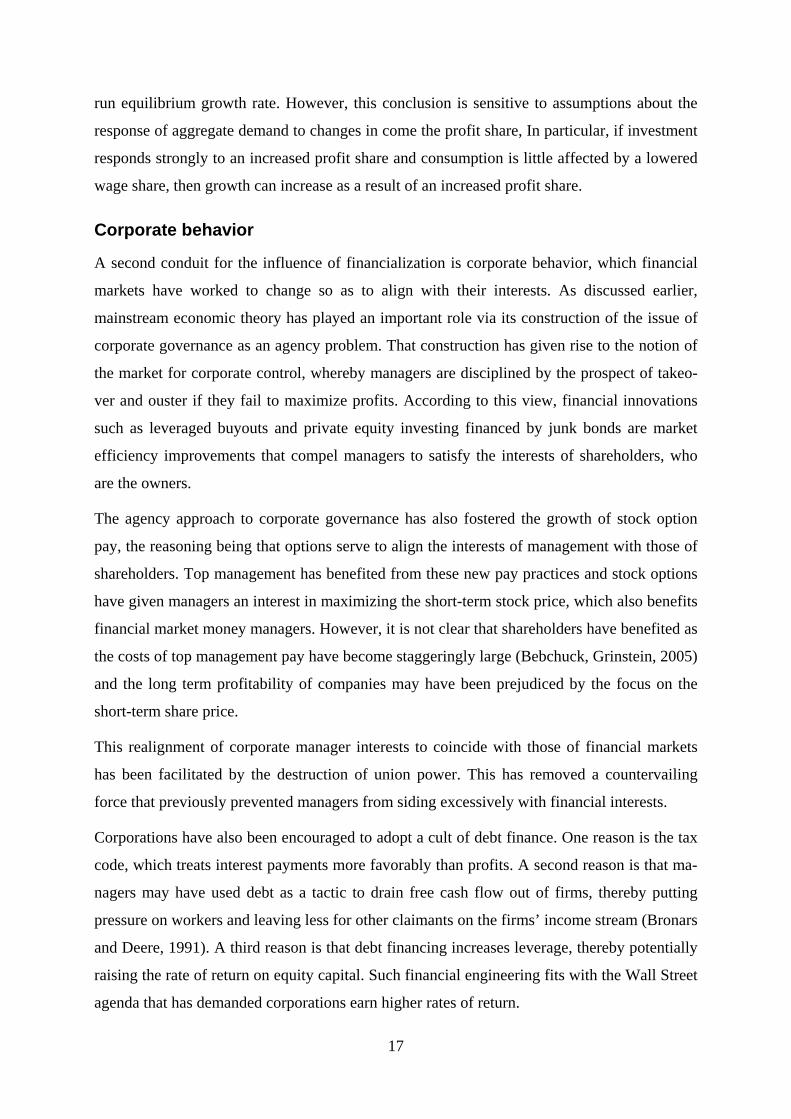
Evidence for these effects of financialization on corporate behavior is provided by changes in
the patterns of corporate financial behavior. Figure 4 shows nominal new equity issuance and
new credit market borrowing of non-financial corporations for the period 1959 – 2006. The
striking feature is the abrupt change in the pattern of new equity issuance that turned negative
after 1980. Post 1980, rather than being a net source of finance, the stock market has been a
net drain of finance.
-800
-600
-400
-200
0
200
400
600
60 65 70 75 80 85 90 95 00 05
New borrowing Net equity issuance
$ bi
llion
s
Figure 4. Non financial corporation net equity issuance and new borrowing, 1959-2006.Source: Federal Reserve, Flow of Funds, tables F2 and F4.
Figure 5 shows non-financial corporate new borrowing and equity issuance as a percent of
non-residential investment spending. This gives an indication of the scale of equity buy- 18
backs, which reached 43.9 percent of non-residential investment spending in 2006. Post-1980,
new borrowing and equity purchases exhibit a clear negative correlation that is indicative of
how firms have borrowed to finance equity buy-backs. This new pattern suggests changed
purpose of corporate borrowing. Before 1980 it financed investment spending, but since 1980
a significant portion of borrowing appears to be for purposes of equity buy-backs. This
contributes to raising the debt-equity ratio.
-60
-40
-20
0
20
40
60
60 65 70 75 80 85 90 95 00 05
New borrowing/Non-residential investmentNet equity issuance/Non-residential investment
Per
cent
(%)
Figure 5. Non-financial corporation new borrowing and net equityissuance as percent of non-residential investment, 1959-2006.
These patterns fit with the financialization thesis. Financial markets tend to prefer that corpo-
rations use debt to finance their activities owing to its tax advantages and the higher rates of
return on equity that leverage allows. Financial markets have also supported corporations pay-
ing management with stock options, which requires purchasing the underlying stock. Additio-
nally, rather than paying dividends that are highly taxed, markets prefer corporations to use
profits to re-purchase stock, which drives up the stock price and generates lower-taxed capital
gains. Finally, increased debt issuance transforms profit streams into interest payment
streams, which reduces corporate income available for other non-financial claimants.
19
20
Economic policy
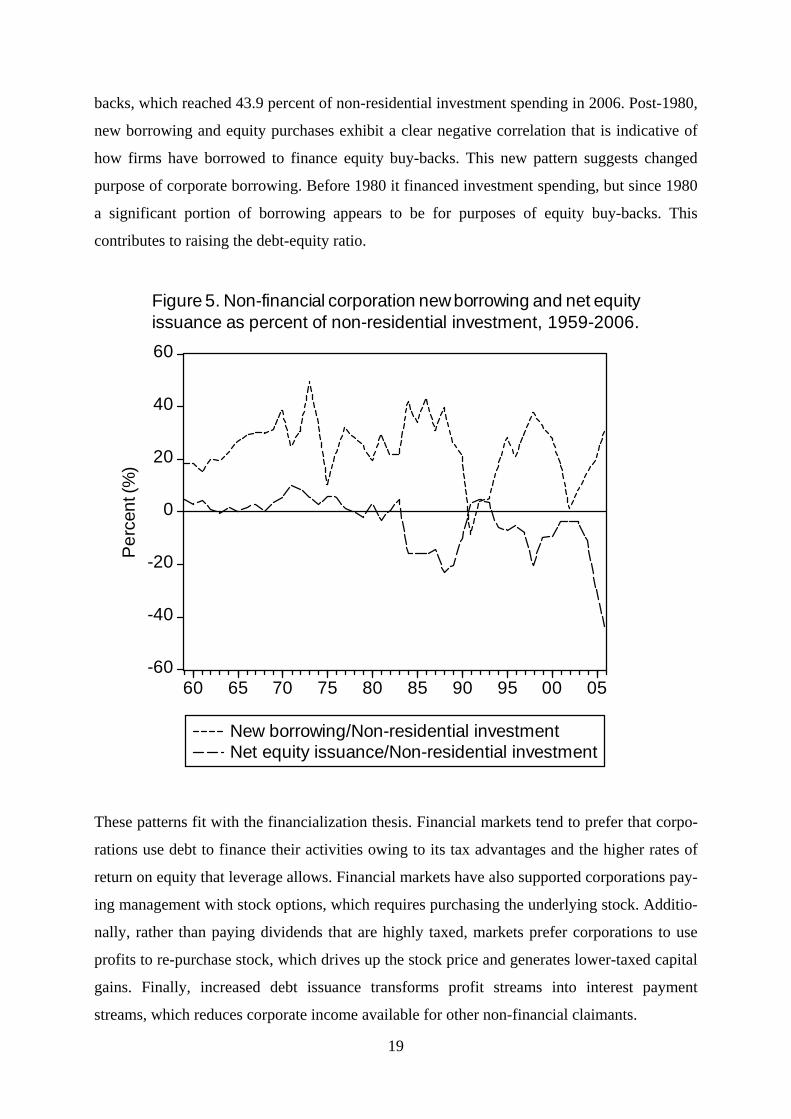
The third conduit of financialization is economic policy. Financial sector interests, supported
by other business interests, have promoted a policy framework favoring their agenda. That
framework has uncuffed financial markets and facilitated their expansion, and it has also hel-
ped corporations shift income from labor to capital to the benefit of financial sector interests.
The new policy framework has been designed to reverse the decline in rates of return to capi-
tal that occurred in the 1970s. Thus, short-term three-month real interest rates that were nega-
tive for much of the 1970s have been raised to approximately two-and-half percent. Likewise,
as shown in Table 11, pre- and after-tax profit rates have been pushed up significantly from
1979 lows.
Table 11
Corporate sector profit rates
Pre-tax profit rate
(%)
Post-tax profit rate
(%)
1973 11.7% 7.0%
1979 9.6 5.7
1989 10.6 7.0
2000 10.6 7.1
2005 11.9 8.6
Source: Mishel et al., 2007.
The new policy framework can be termed the neo-liberal box, the effect of which is to box in
workers.4 The box is shown in Figure 6, and it has four sides labeled globalization, small gov-
ernment, labor market flexibility, and abandonment of full employment, Workers are inside
the box.
“Globalization” refers to the collection of policies associated with free trade, capital mobility,
multi-national business, and global sourcing. It also includes the Washington Consensus deve-
lopment policy that spread the neo-liberal box agenda globally, thereby multiplying the agen-
4 The idea of describing policy with the metaphor of a box is attributable to Ron Blackwell of the AFL-CIO.
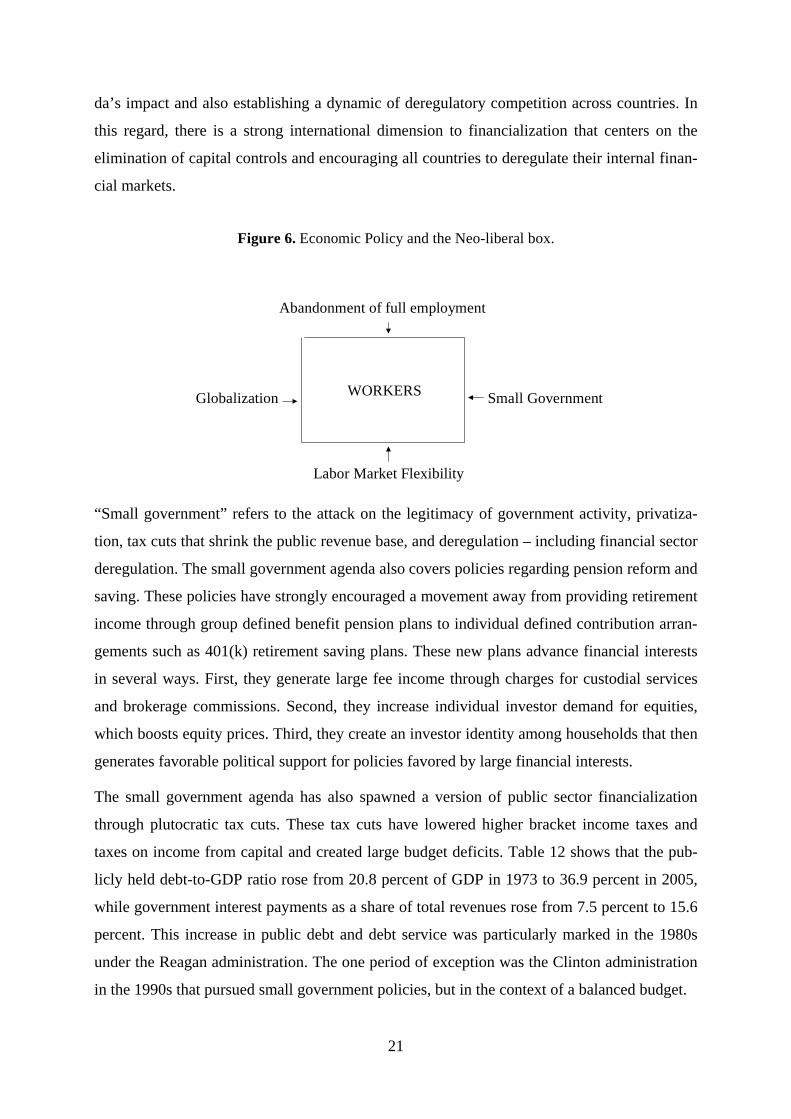
da’s impact and also establishing a dynamic of deregulatory competition across countries. In
this regard, there is a strong international dimension to financialization that centers on the
elimination of capital controls and encouraging all countries to deregulate their internal finan-
cial markets.
Figure 6. Economic Policy and the Neo-liberal box.
WORKERSGlobalization
Abandonment of full employment
Small Government
Labor Market Flexibility
“Small government” refers to the attack on the legitimacy of government activity, privatiza-
tion, tax cuts that shrink the public revenue base, and deregulation – including financial sector
deregulation. The small government agenda also covers policies regarding pension reform and
saving. These policies have strongly encouraged a movement away from providing retirement
income through group defined benefit pension plans to individual defined contribution arran-
gements such as 401(k) retirement saving plans. These new plans advance financial interests
in several ways. First, they generate large fee income through charges for custodial services
and brokerage commissions. Second, they increase individual investor demand for equities,
which boosts equity prices. Third, they create an investor identity among households that then
generates favorable political support for policies favored by large financial interests.
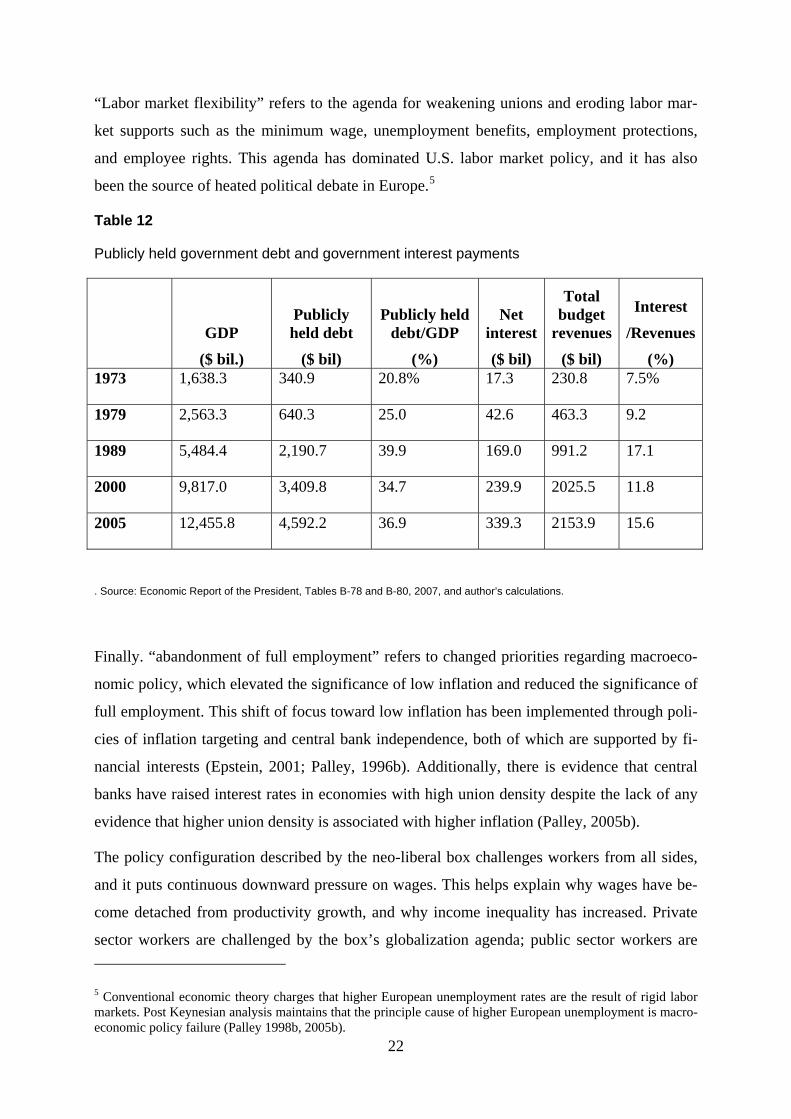
The small government agenda has also spawned a version of public sector financialization
through plutocratic tax cuts. These tax cuts have lowered higher bracket income taxes and
taxes on income from capital and created large budget deficits. Table 12 shows that the pub-
licly held debt-to-GDP ratio rose from 20.8 percent of GDP in 1973 to 36.9 percent in 2005,
while government interest payments as a share of total revenues rose from 7.5 percent to 15.6
percent. This increase in public debt and debt service was particularly marked in the 1980s
under the Reagan administration. The one period of exception was the Clinton administration
in the 1990s that pursued small government policies, but in the context of a balanced budget.
21
22
“Labor market flexibility” refers to the agenda for weakening unions and eroding labor mar-
ket supports such as the minimum wage, unemployment benefits, employment protections,
and employee rights. This agenda has dominated U.S. labor market policy, and it has also
been the source of heated political debate in Europe.5
Table 12
Publicly held government debt and government interest payments
GDP
($ bil.)
Publicly held debt
($ bil)
Publicly held debt/GDP
(%)
Net interest
($ bil)
Total budget
revenues
($ bil)
Interest
/Revenues
(%) 1973 1,638.3 340.9 20.8% 17.3 230.8 7.5%
1979 2,563.3 640.3 25.0 42.6 463.3 9.2
1989 5,484.4 2,190.7 39.9 169.0 991.2 17.1
2000 9,817.0 3,409.8 34.7 239.9 2025.5 11.8
2005 12,455.8 4,592.2 36.9 339.3 2153.9 15.6
. Source: Economic Report of the President, Tables B-78 and B-80, 2007, and author’s calculations.
Finally. “abandonment of full employment” refers to changed priorities regarding macroeco-
nomic policy, which elevated the significance of low inflation and reduced the significance of
full employment. This shift of focus toward low inflation has been implemented through poli-
cies of inflation targeting and central bank independence, both of which are supported by fi-
nancial interests (Epstein, 2001; Palley, 1996b). Additionally, there is evidence that central
banks have raised interest rates in economies with high union density despite the lack of any
evidence that higher union density is associated with higher inflation (Palley, 2005b).
The policy configuration described by the neo-liberal box challenges workers from all sides,
and it puts continuous downward pressure on wages. This helps explain why wages have be-
come detached from productivity growth, and why income inequality has increased. Private
sector workers are challenged by the box’s globalization agenda; public sector workers are
5 Conventional economic theory charges that higher European unemployment rates are the result of rigid labor markets. Post Keynesian analysis maintains that the principle cause of higher European unemployment is macro-economic policy failure (Palley 1998b, 2005b).

23
challenged by the small government agenda; and all workers are challenged by the labor mar-
ket flexibility agenda and the abandonment of full employment as the primary goal of mac-
roeconomic policy.
5 Financialization and the new business cycle
The combination of increased access to credit in financial markets and the new policy frame-
work described by the neo-liberal box, have together created a new business cycle since 1980
(Palley 2005c). The business cycles of Presidents Ronald Reagan, George H. Bush, Bill Clin-
ton, and George W. Bush, all share strong similarities and are distinctly different from pre-
1980 business cycles. These similarities are an over-valued dollar, trade deficits, disinflation
or low inflation, manufacturing job loss, asset price (equities and housing) inflation, widening
income inequality, detachment of worker wages from productivity growth, and rising house-
hold and corporate indebtedness.
The foundation of the new business cycle is financial boom and cheap imports. Financial
boom and asset price inflation provide consumers and firms with collateral to support debt-
financed spending. Borrowing is also supported by steady financial innovation that ensures a
flow of new financial products allowing increased leverage and widening the range of assets
that can be collateralized. Additionally, credit standards have been lowered in recent years,
which has made credit even more easily available to households, firms and financial investors.
Meanwhile, cheap imports ameliorate the impacts of wage stagnation, widening income ine-
quality, manufacturing job loss and increased economic insecurity.
This structure contrasts with the pre-1980 business cycle that rested on wage growth tied to
productivity growth and full employment. Wage growth, rather than borrowing, fuelled con-
sumption and demand growth. That then encouraged investment spending, which in turn dro-
ve productivity and output growth
The differences between the new and old business cycle are starkly revealed by policy attitu-
des toward the trade deficit. Prior to 1980 trade deficits were viewed as a serious problem,
being a demand leakage that undermined the virtuous circle of robust domestic demand and
output growth. Post-1980, trade deficits have been viewed as the outcome of choices made by
consenting economic agents, and they help maximize well-being. For the Federal Reserve,
trade deficits help with inflation control; and for politicians they help buy-off consumers who
face wage stagnation.

24
Finally, the new business cycle tacitly embeds a new monetary policy stance that replaces
concern with real wages with concern about asset prices. Whereas pre-1980 policy tacitly
focused on putting a floor under labor markets to preserve employment and wages, now pol-
icy tacitly puts a floor under asset prices. This policy behavior has been clearly visible with
the 2007 U.S. sub-prime mortgage crisis. It is not a case of the Fed intentionally bailing out
investors. Rather, the macro economy is now vulnerable to asset price declines so that the Fed
is obliged to step in to prevent such declines from inflicting broad macroeconomic damage.
However, that has the twin consequence of bailing out investors and also potentially creating
investor moral hazard. Such moral hazard encourages investors to chase even greater high risk
– return ventures because they know there is a good chance they will be bailed out by the Fed
if things go wrong.
Moreover, the Fed itself may suffer from cognitive dissonance about this. On one hand good
policy requires that investors bear the financial costs of bad decision-making. On the other
hand, the macroeconomic system created by financialization may require rising indebtedness
and asset prices to maintain growth. Consequently, not only does the Fed have reason to pre-
vent asset price declines, it also has reason to engage in serial blowing of asset price bubbles.
That certainly appears to be the lesson of the 2001–06 house price bubble.
6. What can be done?
Financialization and the new business cycle it has spawned raise serious concerns. Economic
growth has been tepid, median wages have stagnated, and income inequality and economic
insecurity have both risen. Moreover, there are concerns that the business cycle generated by
financialization may be unstable and end in prolonged stagnation. Remedying these failings
requires a fundamental change of policy paradigm so as to reconfigure the balance of econo-
mic power and the dynamic behind the business cycle.
Financial markets are at the heart of the financialization process, and that suggests there is an
urgent need to restore effective control over these markets. Today, the only effective policy
tool that monetary authorities have is the short-term interest rate. However, that tool is a blunt
instrument, equivalent to a blunderbuss. Thus, attempts to curtail financial speculation by rai-
sing interest rates can inflict serious collateral damage on the real economy. This suggests
complementing interest rate policy with a new financial sector regulatory framework based on

25
asset based reserve requirements (ABRR).6 Such a framework can help stabilize financial
markets and provide additional tool of monetary policy to supplement interest rate policy.
The policy framework described by the neo-liberal box also constitutes a key element of the
financialization program. That points to the need to challenge all sides of the box, and calls
for restoring restore full employment policy (Palley, 2007b); replacing the current corporate
globalization with a globalization that allows policy space and equitable development; replac-
ing the small government agenda with a progressive “better government” agenda; and replac-
ing the labor market flexibility agenda with a good jobs and productive workplaces agenda.
Changed corporate behavior is another key part of financialization, with corporations being
increasingly governed by the diktats of financial markets. Dealing with corporations involves
three distinct different policy agendas. One agenda is the mainstream corporate accountability
agenda that emphasizes reining in excessive CEO pay, lack of corporate accountability, and
misaligned incentives within firms. In a sense, this agenda recognizes that developments in
corporate governance over the last twenty years have actually aligned the interests of top ma-
nagers and money managers, rather than the interests of top managers and shareholders. A
second larger agenda concerns reframing the legal purpose and obligations of corporations so
that they also take into account interests of stakeholders other than just shareholders (Blair
and Stout, 1999). A third agenda is how to align the incentives of money managers so that
these managers represent the interests of savers in mutual funds.
Finally, policy has played a critical role advancing financialization, and policy is significantly
driven by politics and lobbying. That simple observation means political reform is also nee-
ded. In particular, there is need to address the political power of financial and non-financial
corporations, as well as wealthy individuals. Addressing this problem will require tackling
issues of lobbying and the influence of wealth on politics. It also concerns the way the democ-
ratic political process is organized. That includes disclosure requirements for politicians. It
also may require changing the rules of elections, perhaps replacing current “winner take all”
arrangements with forms of proportional representation that can give greater voice to those
without resources. The reality is that economic power affects politics, and politics affects eco-
nomic policy and economic outcomes, in turn impacting economic power. That means politics
and economic policy need to be linked, rather than being seen as independent spheres as has
historically been the case.
6 The workings of a system based on ABRR and its advantages are described by Palley (2000, 2003, 2004).
26
References
Ackley, G., “The Wealth – Saving Relationship,” Journal of Political Economy, April 1951. Arrow, K.J., and Debreu, G., “Existence of an Equilibrium for a Competitive Economy,” Econometri-
ca, 22 (1954), 262-290. Bebchuk, L.A. and Grinstein, Y., “The Growth of Executive Pay,” Oxford Review of Economic Poli-
cy, 21 (2005), 283 – 303. Bernanke, B. and Gertler, M., “The Financial Accelerator and the Flight to Quality,” Review of Eco-
nomics and Statistics, 78 (1996), 1 – 15. Blair, M.M., and L.A.Stout, “A Team Production Theory of Corporate Law,” Virginia Law Review,
85 No.2 (March 1999), 248 – 328. Brainard, W. and J. Tobin, “Asset Markets and the Cost of Capital,” in Belassa, B. and R. Nelson
(eds.), Economic Progress, Private Values, and Public Policy: Essays in Honor of William Fellner, New York: North Holland, 1977.
Bronars, S.G. and D.R.Deere. “The Threat of Unionization, the Use of Debt, and the Preservation of Shareholder Wealth,” Quarterly Journal of Economics, CVII (February 1991), 231 – 254.
Caskey, J. and S. Fazzari, “Aggregate Demand Contractions with Nominal Debt Commitments: Is Wage Flexibility Stabilizing?” Economic Inquiry, 25 (October 1987), 583 – 97.
Crotty, J.R., “Owner-Manager Conflict and Financial Theories of Investment Instability: A Critical Assessment of Keynes, Tobin, and Minsky,” Journal of Post Keynesian Economics, 12 (Summer 1990), 519 – 42.
De Long, J.B., A. Shleifer, L.H.Summers, and R.J. Waldman, “Noise Trader Risk in Financial Mar-kets,” Journal of Political Economy, 98 (1990), 703-38.
Dew-Becker, I., and R. J. Gordon, “Where Did the Productivity Growth Go? Inflation Dynamics and the Distribution of Income,” Brookings Papers on Economic Activity 36, no. 2 (2005), 67 – 127.
Dutt, A.K., “Consumption, Debt and Growth,” in M.Setterfield (ed.), Interactions in Analytical Politi-cal Economy, M.E.Sharpe, 2005.
Epstein, G., “Financialization, Rentier Interests, and Central Bank Policy,” manuscript, Department of Economics, University of Massachusetts, Amherst, MA, December 2001.
Fisher, I., “The Debt-Deflation Theory of Great Depressions,” Econometrica, 1 (October 1933), 337 – 57.
Flood, R.P. and P.M.Garber, “Market Fundamentals versus Price Level Bubbbles: The First Tests,” Journal of Political Economy, 88 (1980), 745 – 770.
Friedman, M., “The Case for Flexible Exchange Rates,” in Essays in Positive Economics, Chicago: Chicago University Press, 1953.
Gordon, R.J., and I. Dew-Becker, “Unresolved Issues in the Rise of American Inequality,” paper pre-sented at the Brookings Panel on Economic Activity, Washington, DC, September 7, 207.
Hein, E. and van Treeck, T., “Financialization in Kaleckian/Post-Kaleckian Models of Growth and Distribution,” IMK Working Paper, Dusseldorf, Germany, 2007.
Hirshleifer, J., “The Private and Social Value of Information and the Reward to Inventive Activity,” American Economics Review, 61 (1971), 561-74.
Jayadev, A., and G. Epstein, “The Correlates of Rentier Returns in the OECD Countries,” unpublished manuscript, Department of Economics, University of Massachusetts, Amherst, MA, January 2007.
Jensen, M.. J, and W.H. Meckling, “Theory of the Firm: Managerial Behavior, Agency Costs and Ownership Structure,” Journal of Financial Economics, 3 (1976), 305 – 360.
Kiyotaki, N., and J. Moore, “Credit Cycles,” Journal of Political Economy, 107 (1997), 211-48.
27
Lavoie, M., “Financialization Issues in a Post Keynesian Stock-flow Consistent Model,” paper pre-sented at a conference on Finance-led Capitalism, Berlin, Germany, October 26 – 27, 2007.
Levy, F., and P. Temin, “Inequality and Institutions in 20th Century America,” Manuscript, MIT, 2007. Minsky, H.P., Can “It” Happen Again? Essays on Instability and Finance, Armonk, NY: M.E.Sharpe,
1982. Mishel, L., J. Bernstein, and S. Allegreto, The State of Working America 2006/2007, Ithaca, NY Cor-
nell University Press, 2007 Modigliani, F., and A. Ando, “The Life Cycle Hypothesis of Saving: Aggregate Implications and
Tests,” American Economic Review, 53 (1963). Modigliani, F., and R. Brumberg, “Utility Analysis and the Consumption Function: An Interpretation
of Cross-Section Data,” in K.Kurihara, ed., Post Keynesian Economics, New Brunswick, NJ: Rut-gers University Press, 1954.
Palley, T.I., “Keynesian Models of Deflation and Depression Revisited,” Journal of Economic Behav-ior and Organization, forthcoming, 2007.
-------------, “Reviving Full Employment Policy: Challenging the Wall Street Paradigm,” EPI Briefing Paper #191, Economic Policy Institute, Washington DC, June 2007b.
------------, ““Class Conflict and the Cambridge Theory of Distribution,” in B.Gibson (ed.), The Eco-nomics of Joan Robinson: A Centennial Celebration, Cheltenham: E. Elgar, 2005a.
-------------, “The Causes of High Unemployment: Labor Market Sclerosis versus Macroeconomic Policy,” in Hein, Heise and Truger (eds.), Wages, Employment, Distribution and Growth, Pal-grave/Macmillan: London, 2005b. Also in Stanford and Vosko (eds.), Challenging the Market: The Struggle to Regulate Work and Income, McGill-Queens University Press, Montreal & King-ston:Canada, 2004.
-------------,“The Questionable Legacy of Alan Greenspan,” Challenge, 48-6 (November-December 2005c), 17 – 31.
------------,“Asset Based Reserve Requirements: Reasserting Domestic Monetary Control in an Era of Financial Innovation and Instability,” Review of Political Economy, 16 (January 2004), 43 – 58.
------------,“Asset Price Bubbles and the Case for Asset Based Reserve Requirements,” Challenge, 46 (May – June 2003), 53 – 72.
------------, “The Stock Market and Investment: Another Look at the Micro Foundations of q Theory,” Cambridge Journal of Economics, 25 (September 2001), 657 - 67. ------------, Stabilizing Finance: The Case for Asset-Based Reserve Requirements, Report issued by the Financial Markets Center, Philomont, VA, August 2000. ------------, "General Disequilibrium Analysis with Inside Debt," Journal of Macroeconomics, 21 (Fall 1999), 785 - 804. -------------, Plenty of Nothing: The Downsizing of the American Dream and the Case for Structural
Keynesianism, Princeton University Press, 1998. ------------, "Restoring Prosperity: Why the U.S. Model is not the Right Answer for the U.S. or Europe," Journal of Post Keynesian Economics, 20 (Spring 1998), 337-54. ------------, "Endogenous Money and the Business Cycle," Journal of Economics, 65 (1997a), 133-149.
------------,"Managerial Turnover and the Theory of Short-termism," Journal of Economic Behavior and Organization, 32 (1997b), 547-57.

28
-------------, "Inside Debt, Aggregate Demand, and the Cambridge Theory of Distribution," Cambridge Journal of Economics, 20 (1996a), 465-74.
--------------, "The Institutionalization of Deflationary Policy Bias," Monnaie et Production, Vol.X of Economies et Societes, 1996b, 247-68.
--------------, "Safety in Numbers: A Theory of Managerial Herd Behavior," Journal of Economic Be-havior and Organization, 28 (1995), 443-50.
-------------, “Debt, Aggregate Demand, and the Business Cycle: An Analysis in the Spirit of Kaldor and Minsky," Journal of Post Keynesian Economics, 16 (Spring 1994), 371-90.
Power, D., G. Epstein, and M. Abrena, “Trends in the Rentier Income Share in OECD Countries, 1960 – 2000,” Department of Economics, University of Massachusetts, Amherst, MA, April 2003.
Skott, P., and S. Ryoo, “Macroeconomic Implications of Financialization,” Working Paper, Depart-ment of Economics, University of Massachusetts, Amherst, MA, 2007-08.
Stockhammer, E., “Some Stylized Facts on the Finance-Dominated Accumulation,” unpublished manuscript, Dept. of Economics, VWI, Wirtschaftuniversitat, Wien, Austria, July 16, 2007
Tobin, J., Asset Accumulation and Economic Activity, Chicago: Chicago University Press, 1980.
----------, “Money, Capital, and Other Stores of Value,” American Economic Review, 51 (1961), 26 – 37.
Tobin, J., and W. Brainard, “Financial Intermediaries and the Effectiveness of onetary Control,” American Economic Review, 53 (May 1963), 383-400.

Publisher: Hans-Böckler-Stiftung, Hans-Böckler-Str. 39, 40476 Düsseldorf, Germany Phone: +49-211-7778-331, [email protected], http://www.imk-boeckler.de IMK Working Paper is an online publication series available at: http://www.boeckler.de/cps/rde/xchg/hbs/hs.xls/31939.html ISSN: 1861-2199 The views expressed in this paper do not necessarily reflect those of the IMK or the Hans-Böckler-Foundation. All rights reserved. Reproduction for educational and non-commercial purposes is permitted provided that the source is acknowledged.