ECG Interpretations Good
97
ECG interpretations
-
Upload
fahriansyah-mp-tmc -
Category
Documents
-
view
244 -
download
4
description
EKG
Transcript of ECG Interpretations Good
ECG interpretations
2
Course Objectives
To recognize the normal rhythm of the heart - “Normal Sinus Rhythm.”
To recognize the 17 most common rhythm disturbances (3-Lead)
To be shown an acute myocardial infarction on a 12-Lead ECG.
3
Learning Modules
ECG Basics How to Analyze a Rhythm Normal Sinus Rhythm Heart Arrhythmias Diagnosing a Myocardial
Infarction Advanced 12-Lead Interpretation
4
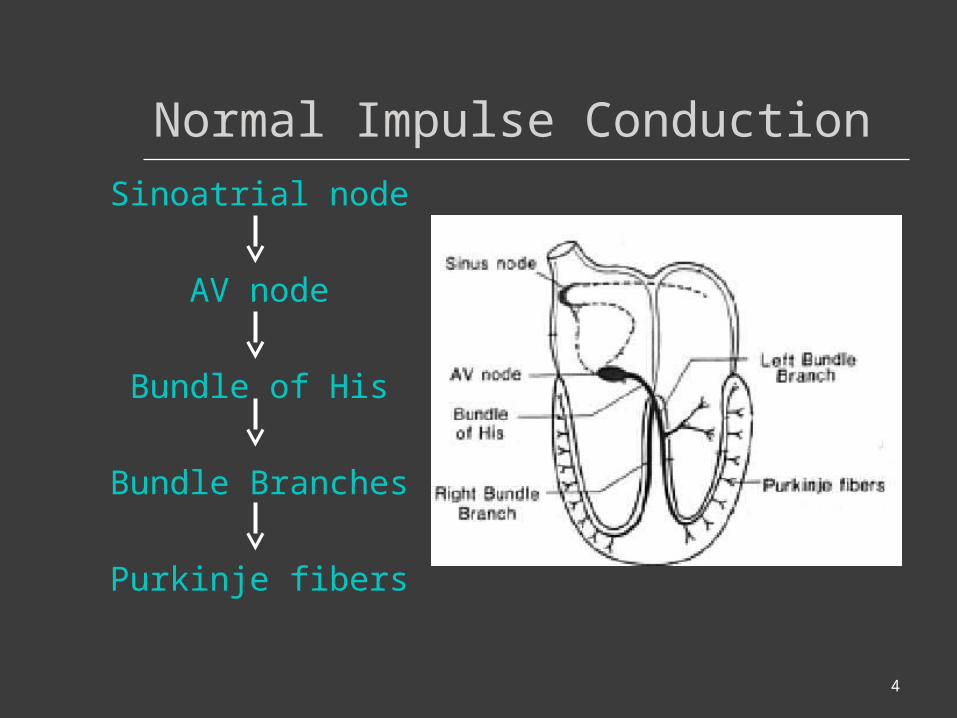
Normal Impulse Conduction
Sinoatrial node
AV node
Bundle of His
Bundle Branches
Purkinje fibers
5
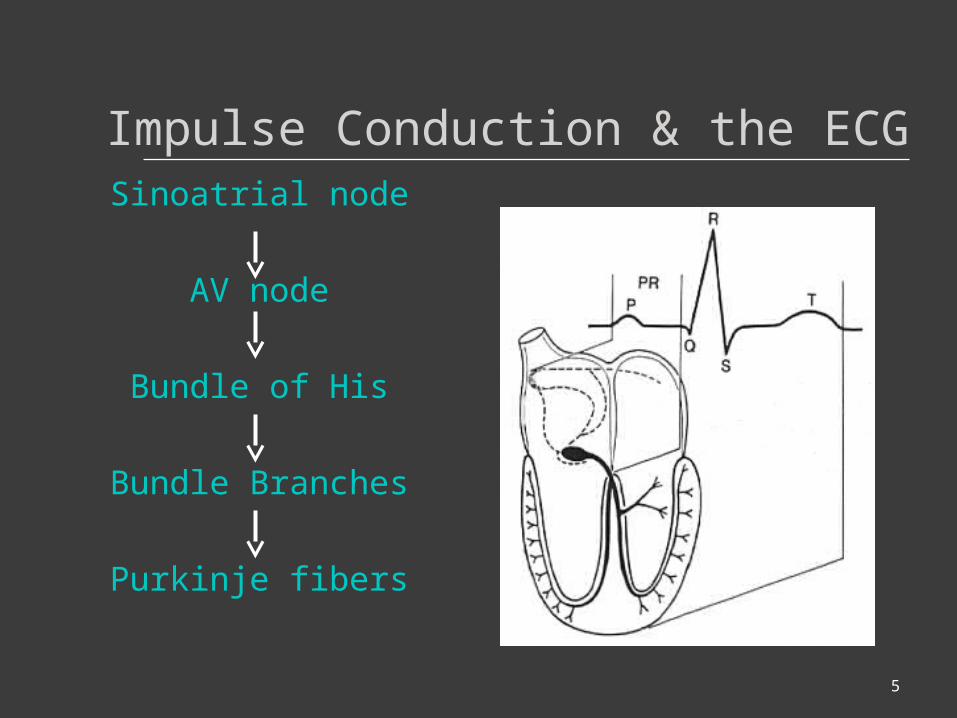
Impulse Conduction & the ECGSinoatrial node
AV node
Bundle of His
Bundle Branches
Purkinje fibers

6
The “PQRST”
P wave - Atrial depolarization
• T wave - Ventricular repolarization
• QRS - Ventricular depolarization

7
The PR Interval
Atrial depolarization +
delay in AV junction (AV node/Bundle of His)
(delay allows time for the atria to contract before the ventricles contract)
8
Pacemakers of the Heart
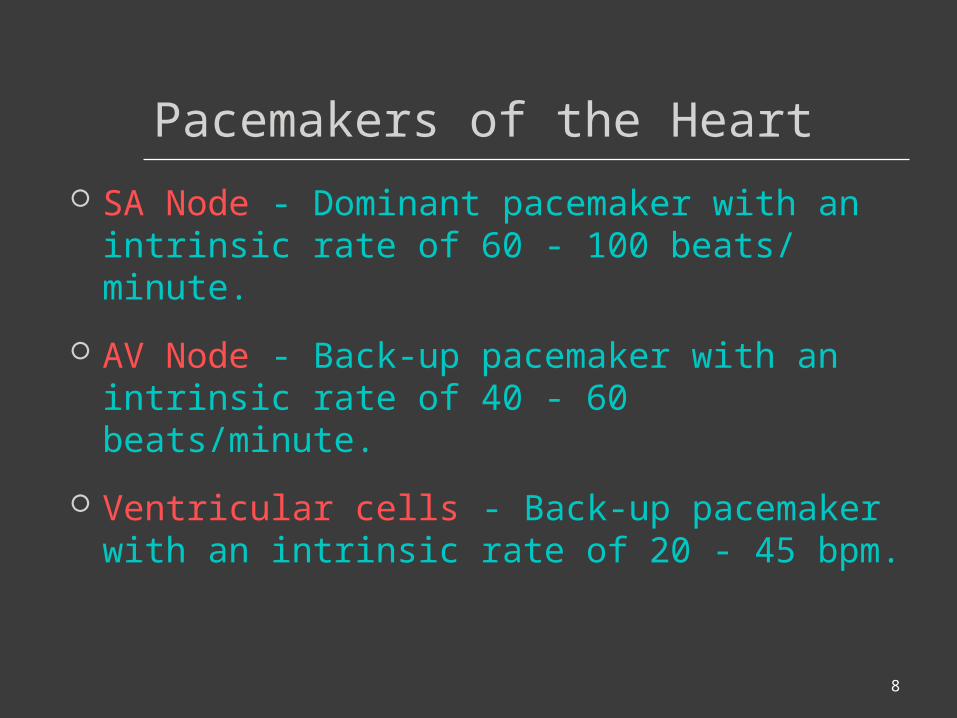
SA Node - Dominant pacemaker with an intrinsic rate of 60 - 100 beats/ minute.
AV Node - Back-up pacemaker with an intrinsic rate of 40 - 60 beats/minute.
Ventricular cells - Back-up pacemaker with an intrinsic rate of 20 - 45 bpm.

9
The ECG Paper
Horizontally One small box - 0.04 s One large box - 0.20 s
Vertically One large box - 0.5 mV
10
The ECG Paper (cont)
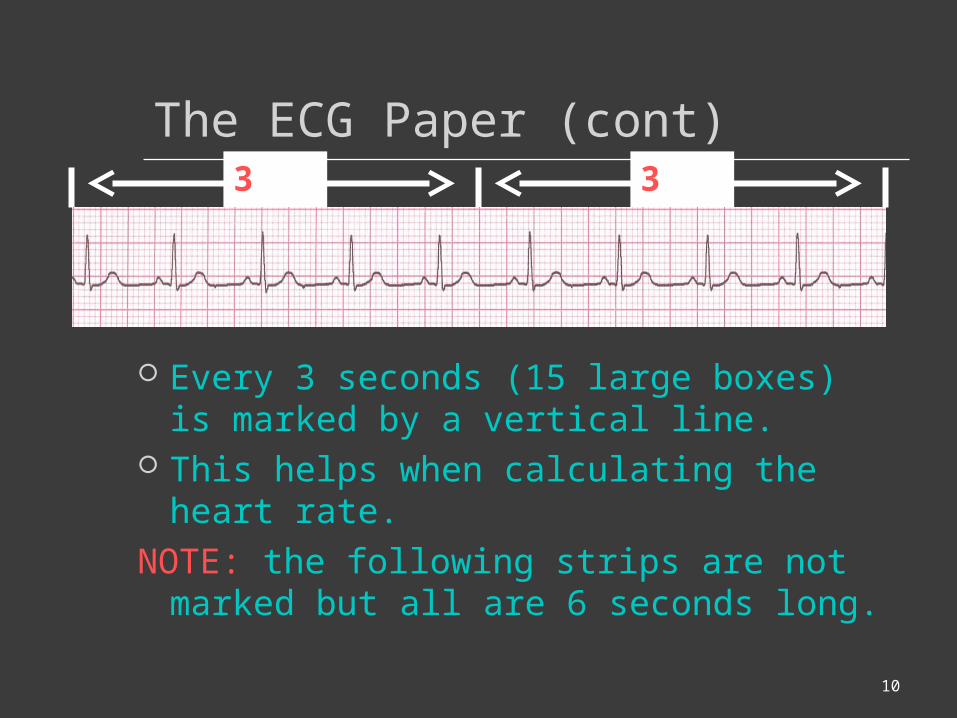
Every 3 seconds (15 large boxes) is marked by a vertical line.
This helps when calculating the heart rate.
NOTE: the following strips are not marked but all are 6 seconds long.
3 sec 3 sec
ECG Rhythm Interpretation
Really Very EasyHow to Analyze a Rhythm
12
Rhythm Analysis
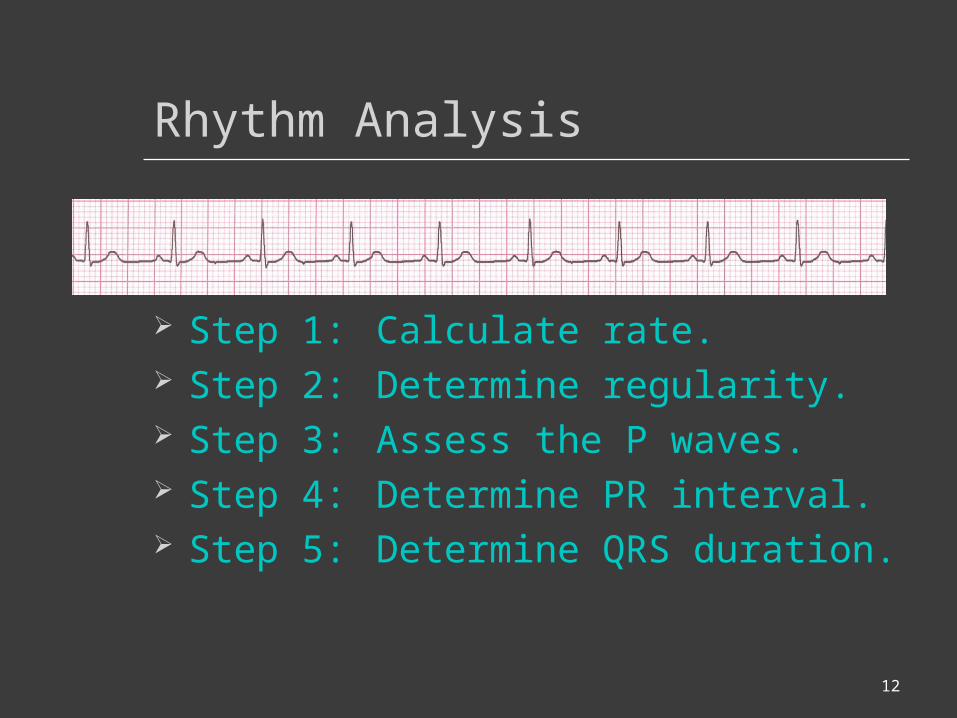
Step 1: Calculate rate. Step 2: Determine regularity. Step 3: Assess the P waves. Step 4: Determine PR interval. Step 5: Determine QRS duration.

13
Step 1: Calculate Rate
Option 1 Count the # of R waves in a 6
second rhythm strip, then multiply by 10.
Reminder: all rhythm strips in the Modules are 6 seconds in length.
Interpretation? 9 x 10 = 90 bpm
3 sec 3 sec

14
Step 1: Calculate Rate
Option 2 Find a R wave that lands on a bold line. Count the number of large boxes to the
next R wave. If the second R wave is 1 large box away the rate is 300, 2 boxes - 150, 3 boxes - 100, 4 boxes - 75, etc. (cont)
R wave
15
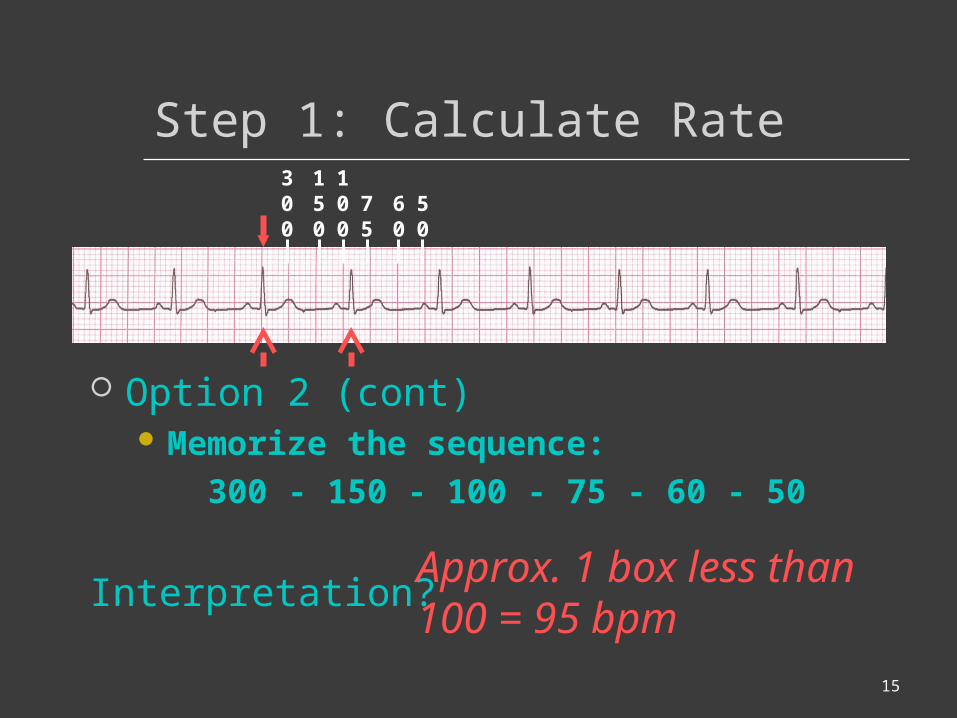
Step 1: Calculate Rate
Option 2 (cont) Memorize the sequence:
300 - 150 - 100 - 75 - 60 - 50
Interpretation?
300
150
100
75
60
50
Approx. 1 box less than 100 = 95 bpm
16
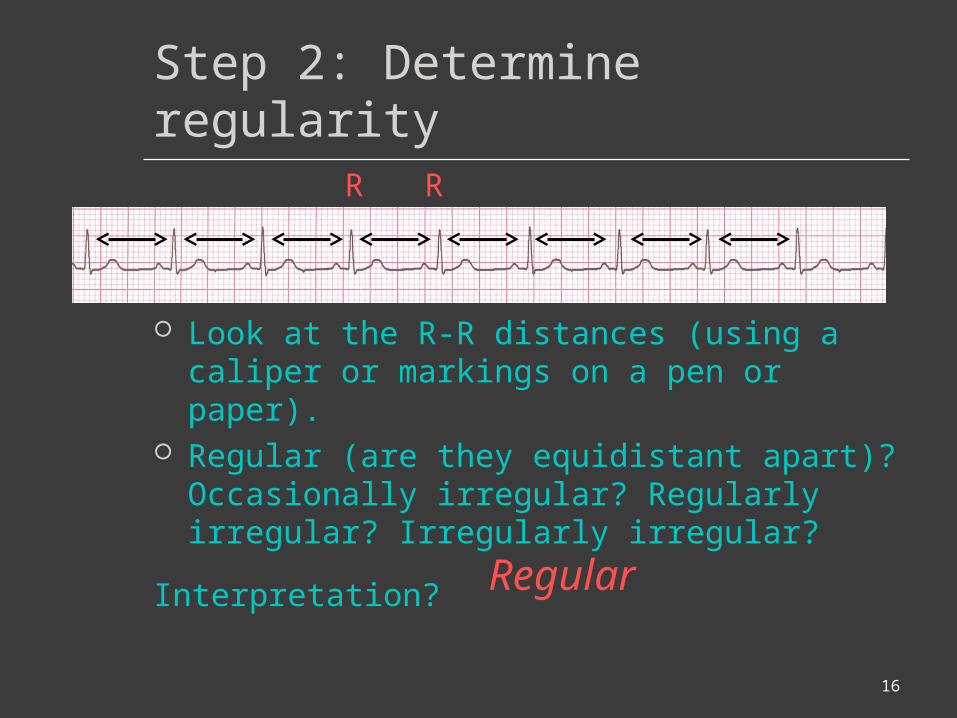
Step 2: Determine regularity
Look at the R-R distances (using a caliper or markings on a pen or paper).
Regular (are they equidistant apart)? Occasionally irregular? Regularly irregular? Irregularly irregular?
Interpretation? Regular
R R

17
Step 3: Assess the P waves
Are there P waves? Do the P waves all look alike? Do the P waves occur at a regular rate? Is there one P wave before each QRS?Interpretation? Normal P waves with 1 P
wave for every QRS
18
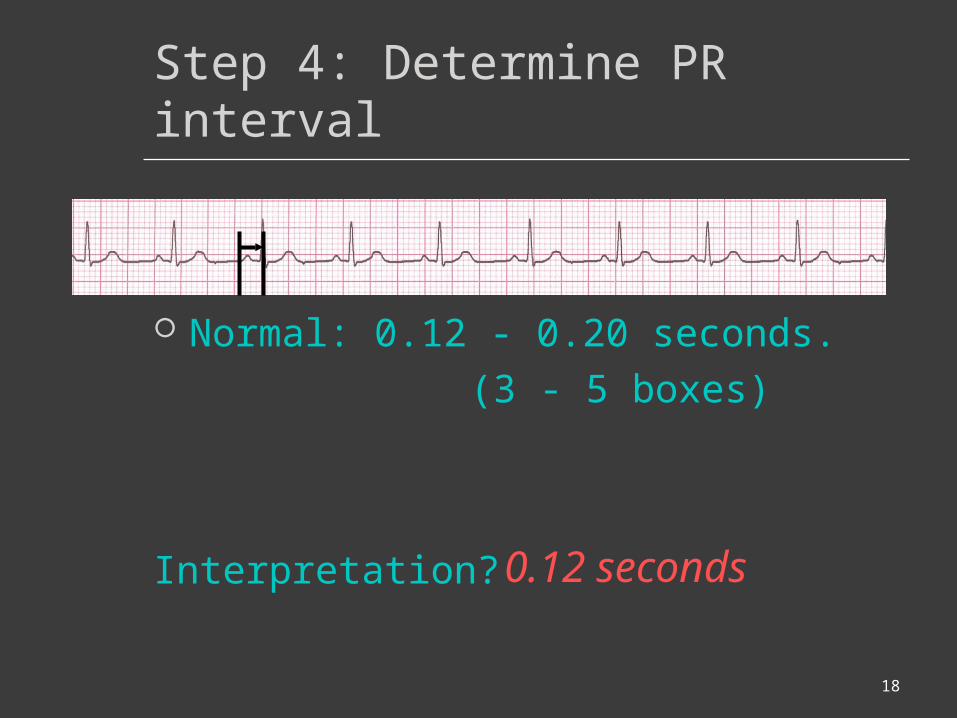
Step 4: Determine PR interval
Normal: 0.12 - 0.20 seconds. (3 - 5 boxes)
Interpretation? 0.12 seconds
19
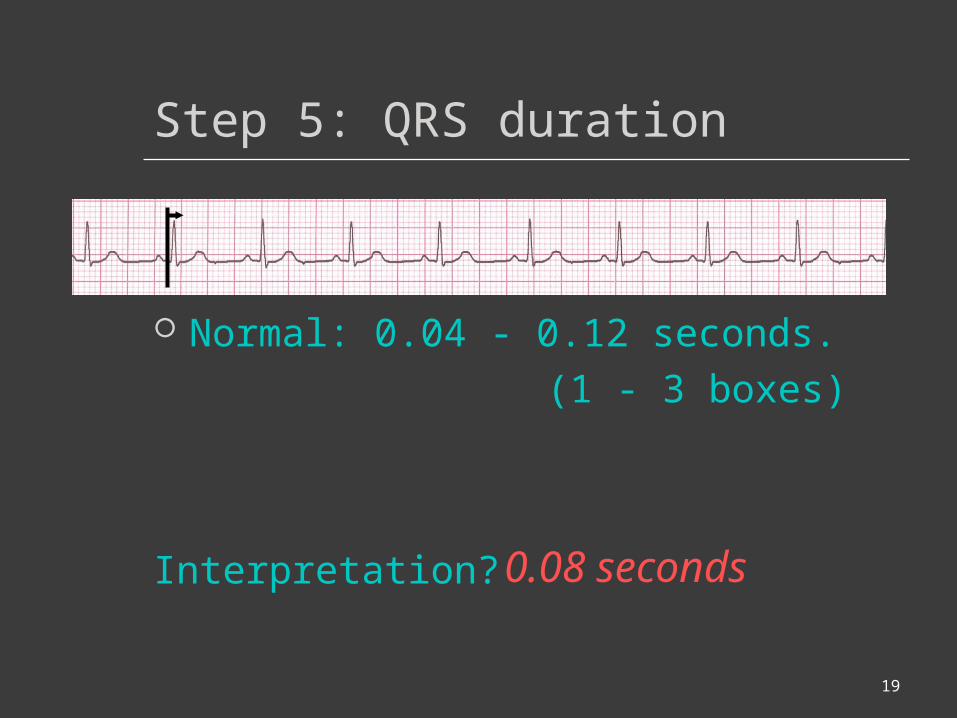
Step 5: QRS duration
Normal: 0.04 - 0.12 seconds. (1 - 3 boxes)
Interpretation? 0.08 seconds
20
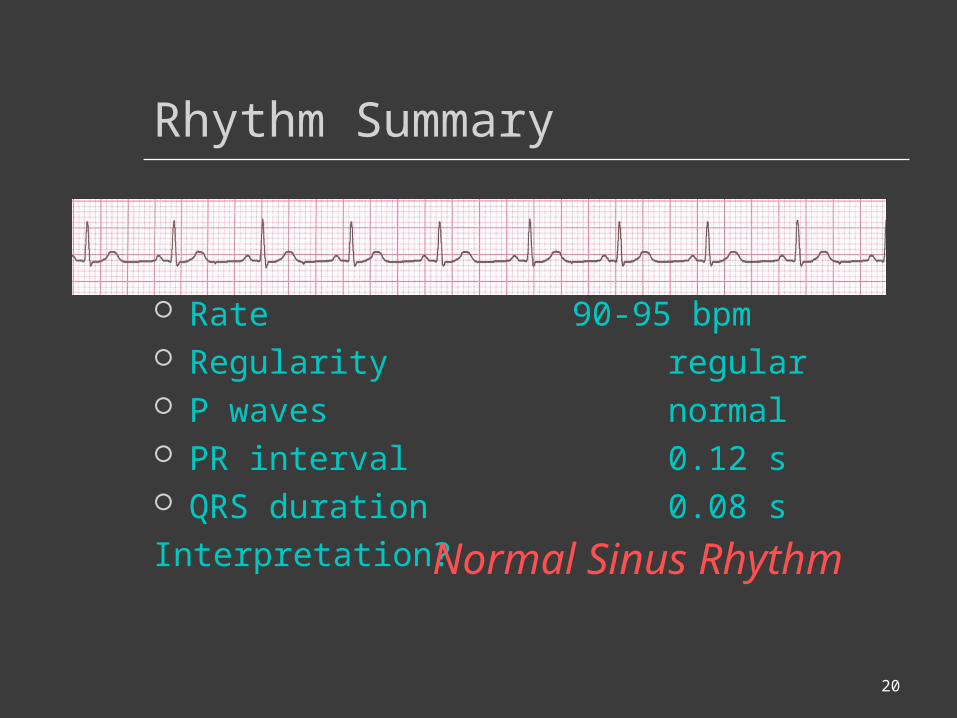
Rhythm Summary
Rate 90-95 bpm Regularity regular P waves normal PR interval 0.12 s QRS duration 0.08 sInterpretation? Normal Sinus Rhythm
21
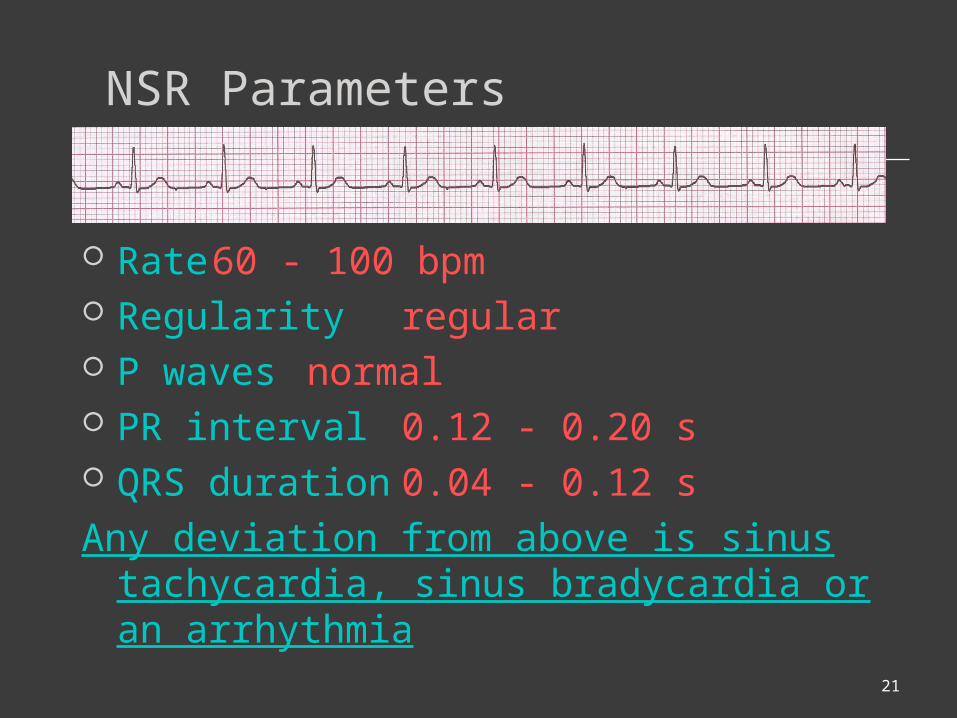
NSR Parameters
Rate 60 - 100 bpm Regularity regular P waves normal PR interval 0.12 - 0.20 s QRS duration 0.04 - 0.12 sAny deviation from above is sinus
tachycardia, sinus bradycardia or an arrhythmia

22
Arrhythmia Formation
Arrhythmias can arise from problems in the:• Sinus node• Atrial cells• AV junction• Ventricular cells
23
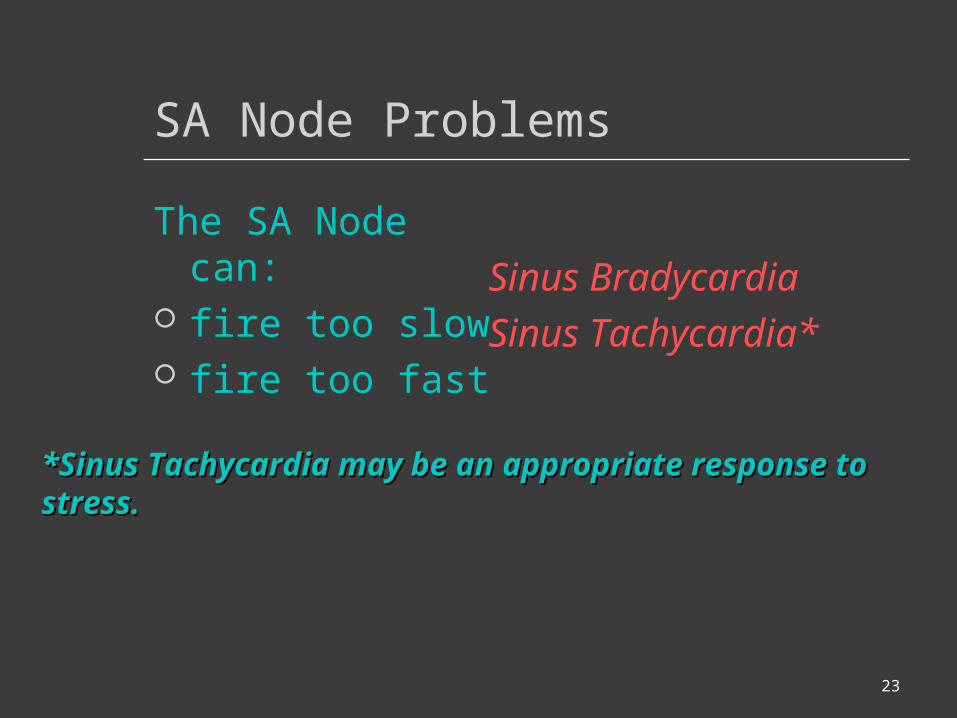
SA Node Problems
The SA Node can: fire too slow fire too fast
Sinus BradycardiaSinus Tachycardia*
*Sinus Tachycardia may be an appropriate response to stress.*Sinus Tachycardia may be an appropriate response to stress.

24
Atrial Cell Problems
Atrial cells can: fire occasionally
from a focus
fire continuously due to a looping re-entrant circuit
Premature Atrial Contractions (PACs)
Atrial Flutter

25
Atrial Cell Problems
Atrial cells can also:• fire continuously from multiple foci orfire continuously due to multiple micro re-entrant “wavelets”
Atrial Fibrillation
Atrial Fibrillation

26
Teaching Moment
Multiple micro re-entrant “wavelets” refers to wandering small areas of activation which generate fine chaotic impulses. Colliding wavelets can, in turn, generate new foci of activation.
Atrial tissue

27
AV Junctional Problems
The AV junction can:
fire continuously due to a looping re-entrant circuit
block impulses coming from the SA Node
Paroxysmal Supraventricular Tachycardia
AV Junctional Blocks
28
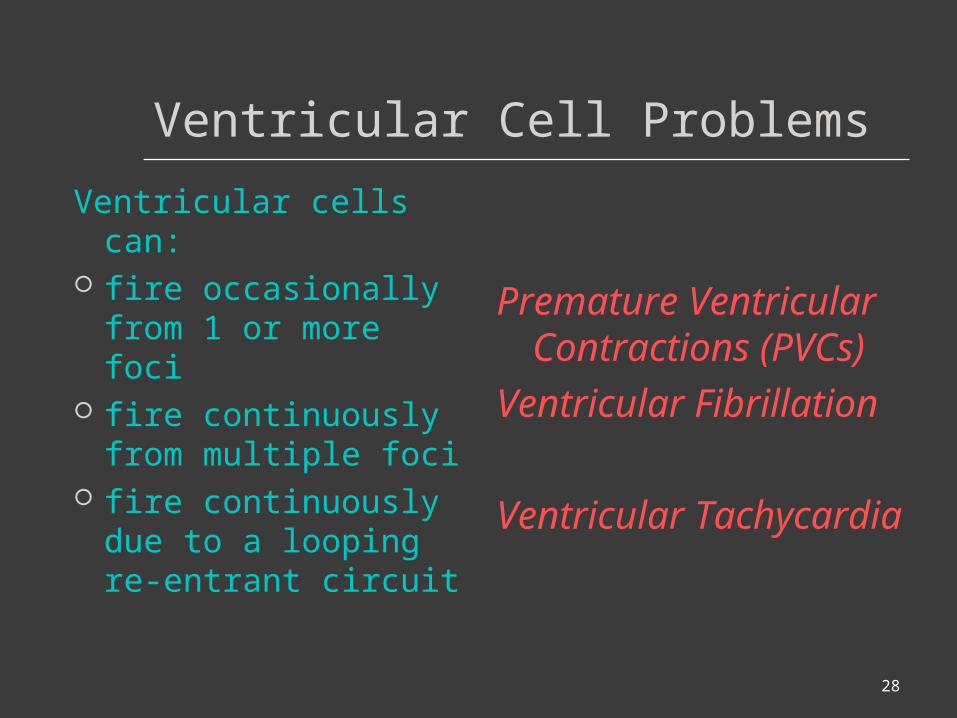
Ventricular Cell Problems
Ventricular cells can: fire occasionally
from 1 or more foci fire continuously
from multiple foci fire continuously
due to a looping re-entrant circuit
Premature Ventricular Contractions (PVCs)
Ventricular Fibrillation
Ventricular Tachycardia

29
Arrhythmias
Sinus Rhythms Premature Beats Supraventricular Arrhythmias Ventricular Arrhythmias AV Junctional Blocks
30
Sinus Rhythms
Sinus Bradycardia
Sinus Tachycardia Sinus Arrest Normal Sinus Rhythm
31
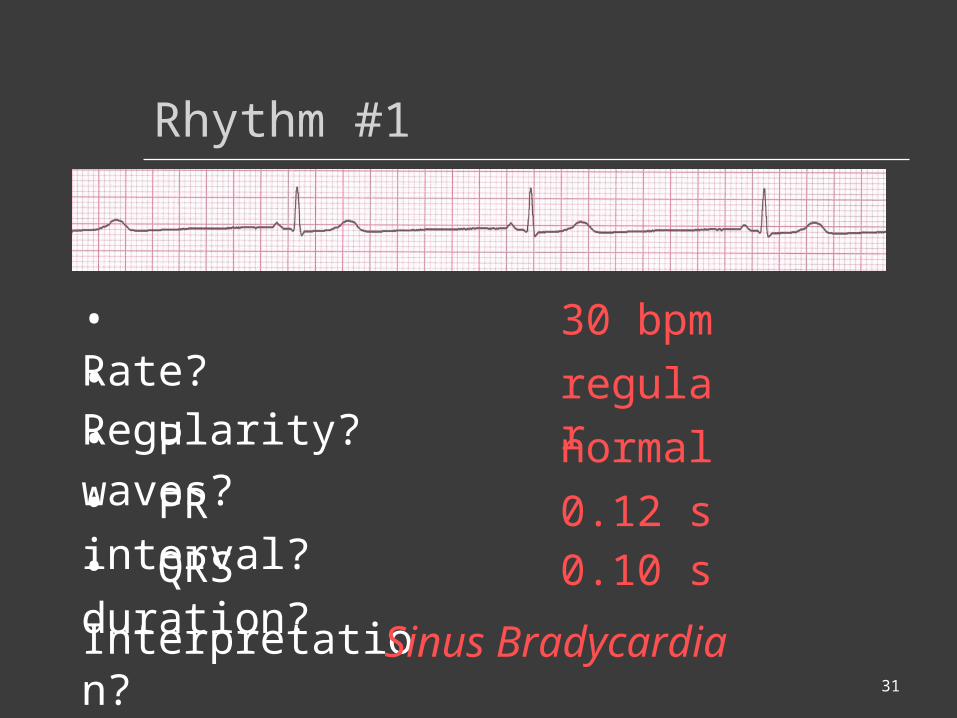
Rhythm #1
30 bpm• Rate?• Regularity? regular
normal
0.10 s
• P waves?
• PR interval? 0.12 s• QRS duration?
Interpretation? Sinus Bradycardia
32
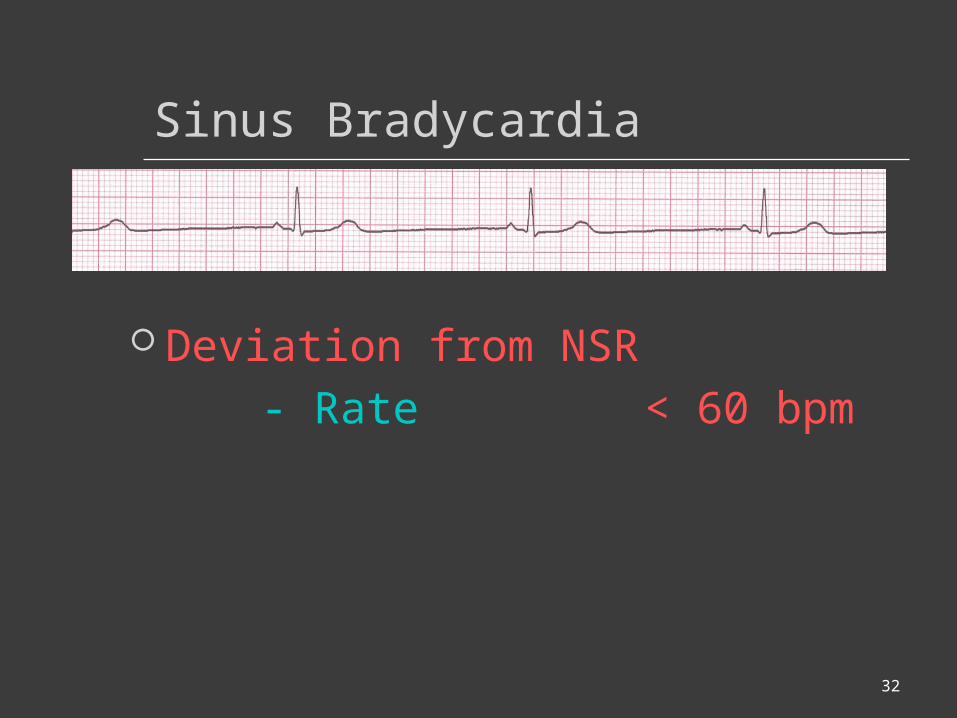
Sinus Bradycardia
Deviation from NSR- Rate < 60 bpm

33
Sinus Bradycardia
Etiology: SA node is depolarizing slower than normal, impulse is conducted normally (i.e. normal PR and QRS interval).
34
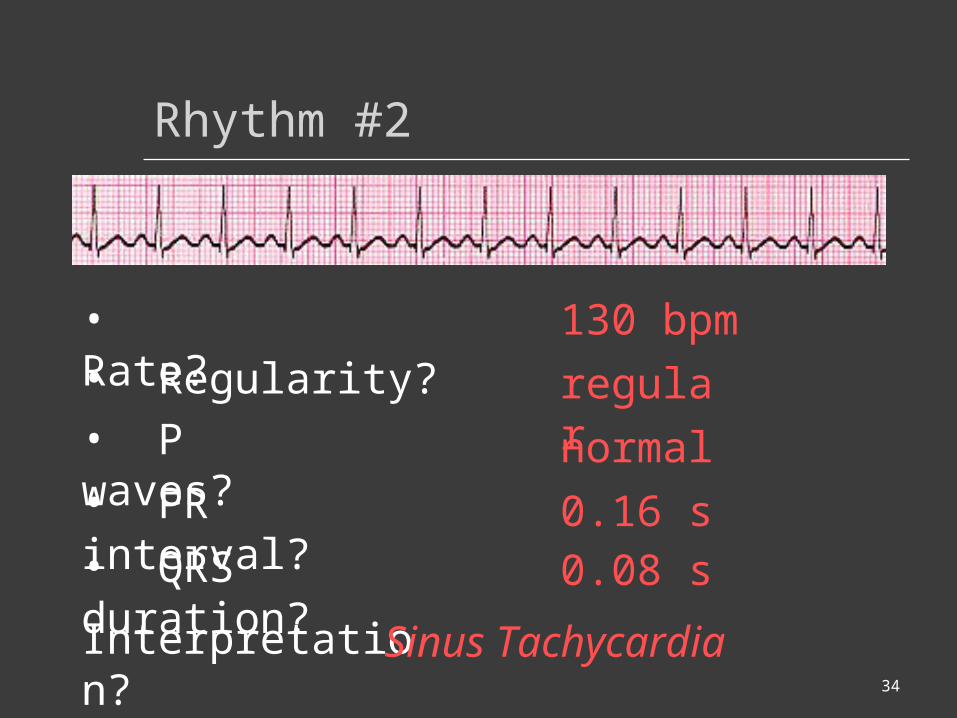
Rhythm #2
130 bpm• Rate?• Regularity? regular
normal
0.08 s
• P waves?
• PR interval? 0.16 s• QRS duration?
Interpretation? Sinus Tachycardia

35
Sinus Tachycardia
Deviation from NSR- Rate > 100
bpm
36
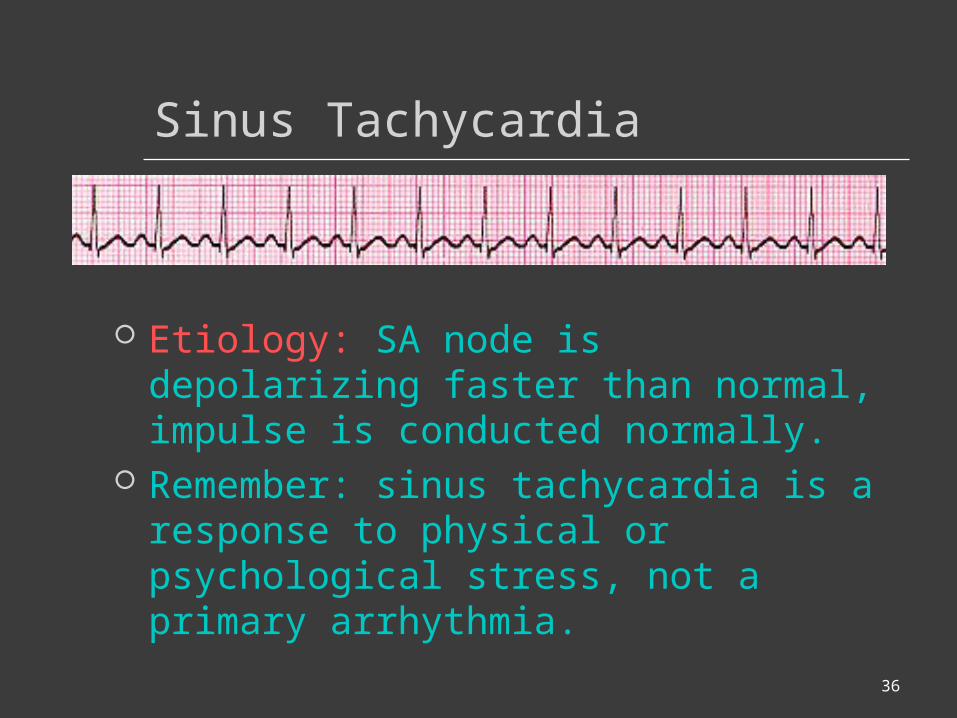
Sinus Tachycardia
Etiology: SA node is depolarizing faster than normal, impulse is conducted normally.
Remember: sinus tachycardia is a response to physical or psychological stress, not a primary arrhythmia.

37
Sinus Arrest
Etiology: SA node fails to depolarize and no compensatory mechanisms take over
Sinus arrest is usually a transient pause in sinus node activity
38
Premature Beats
Premature Atrial Contractions (PACs)
Premature Ventricular Contractions (PVCs)
39
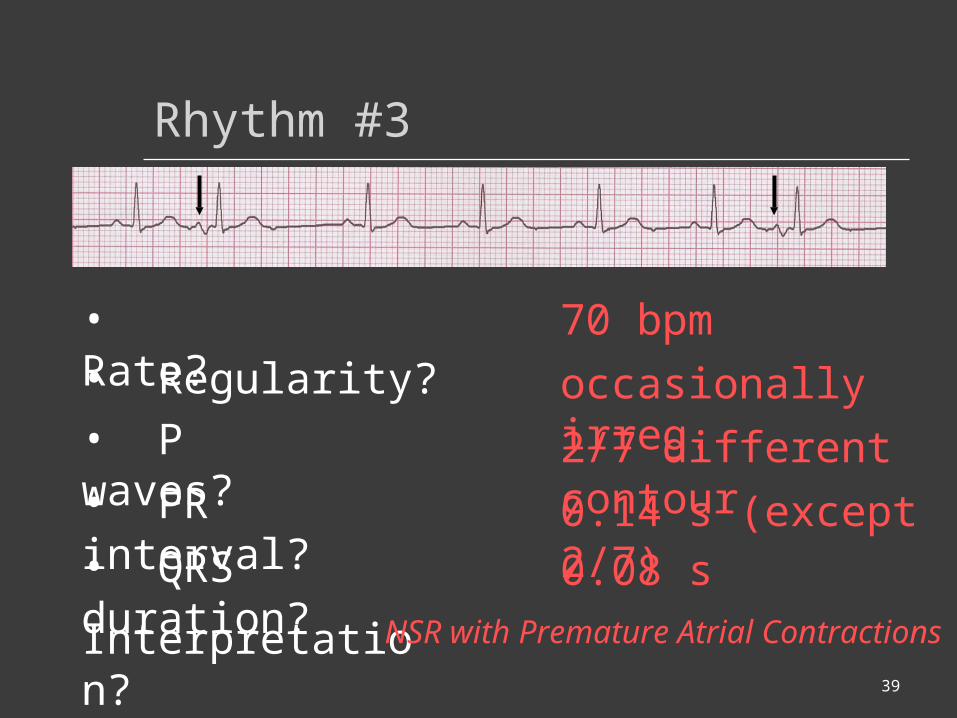
Rhythm #3
70 bpm• Rate?• Regularity? occasionally irreg.
2/7 different contour
0.08 s
• P waves?
• PR interval? 0.14 s (except 2/7)• QRS duration?
Interpretation? NSR with Premature Atrial Contractions

40
Premature Atrial Contractions
Deviation from NSRThese ectopic beats originate in the
atria (but not in the SA node), therefore the contour of the P wave, the PR interval, and the timing are different than a normally generated pulse from the SA node.
41
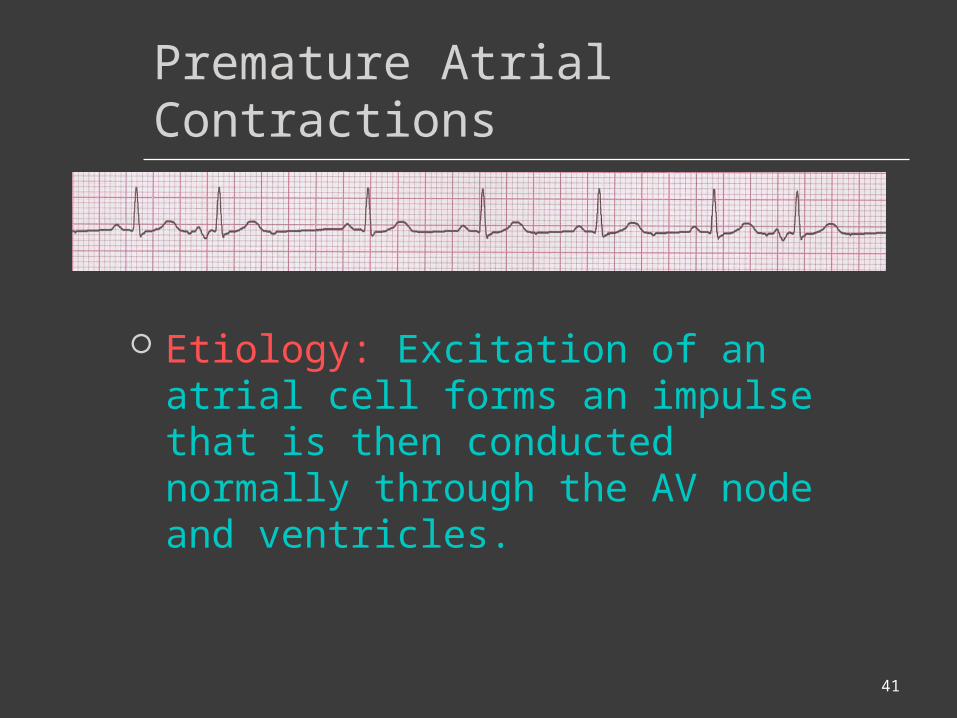
Premature Atrial Contractions
Etiology: Excitation of an atrial cell forms an impulse that is then conducted normally through the AV node and ventricles.
42
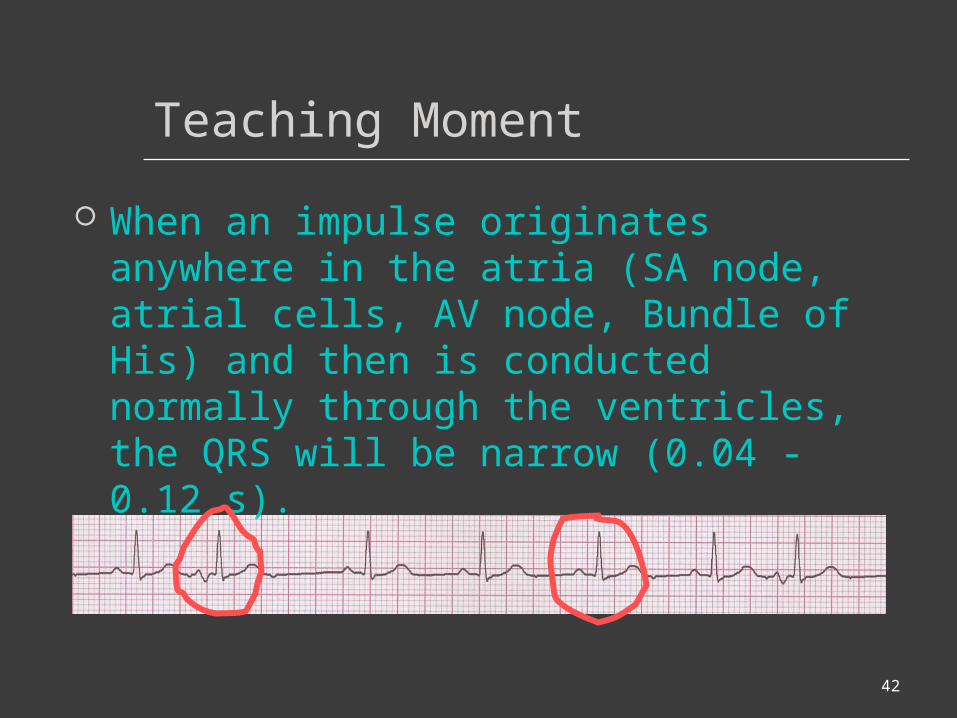
Teaching Moment
When an impulse originates anywhere in the atria (SA node, atrial cells, AV node, Bundle of His) and then is conducted normally through the ventricles, the QRS will be narrow (0.04 - 0.12 s).
43
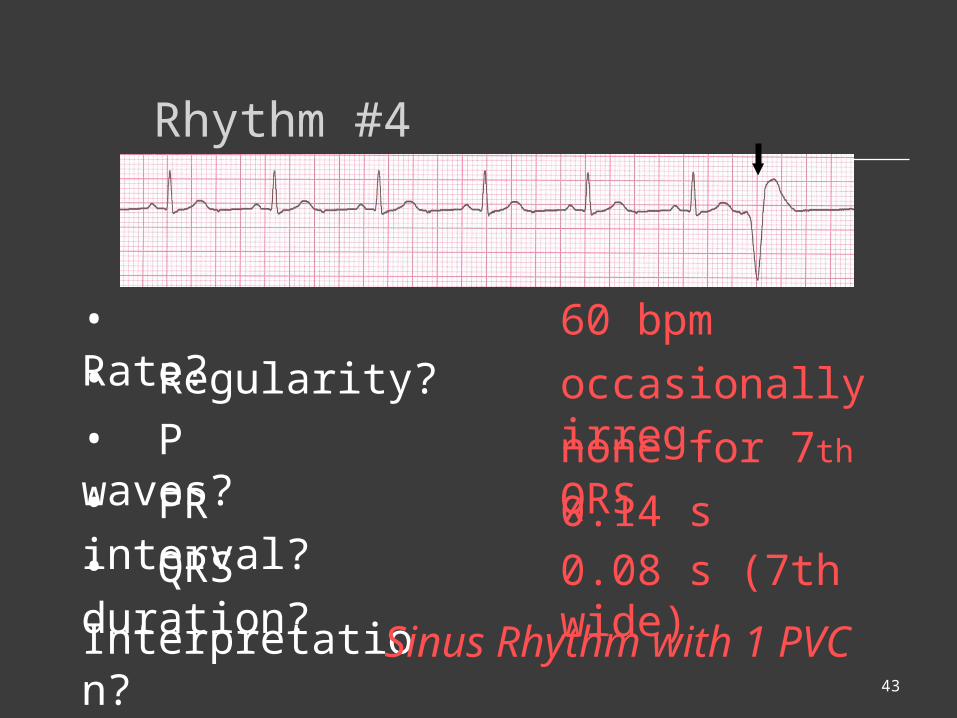
Rhythm #4
60 bpm• Rate?• Regularity? occasionally irreg.
none for 7th QRS
0.08 s (7th wide)
• P waves?
• PR interval? 0.14 s• QRS duration?
Interpretation? Sinus Rhythm with 1 PVC
44
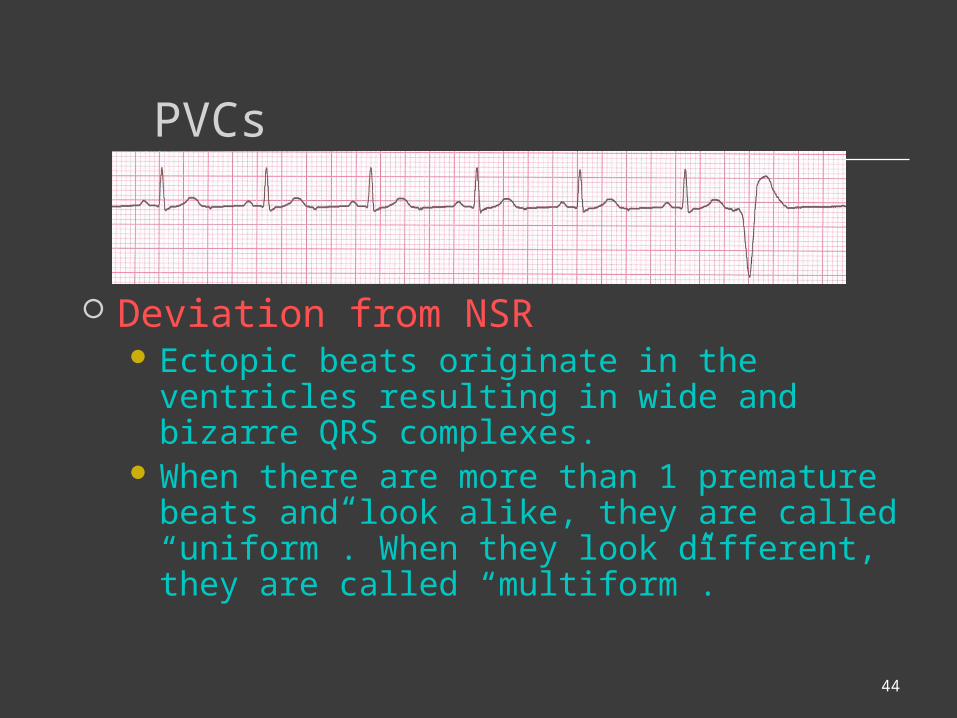
PVCs
Deviation from NSR Ectopic beats originate in the ventricles
resulting in wide and bizarre QRS complexes.
When there are more than 1 premature beats and look alike, they are called “uniform”. When they look different, they are called “multiform”.

45
PVCs
Etiology: One or more ventricular cells are depolarizing and the impulses are abnormally conducting through the ventricles.
46
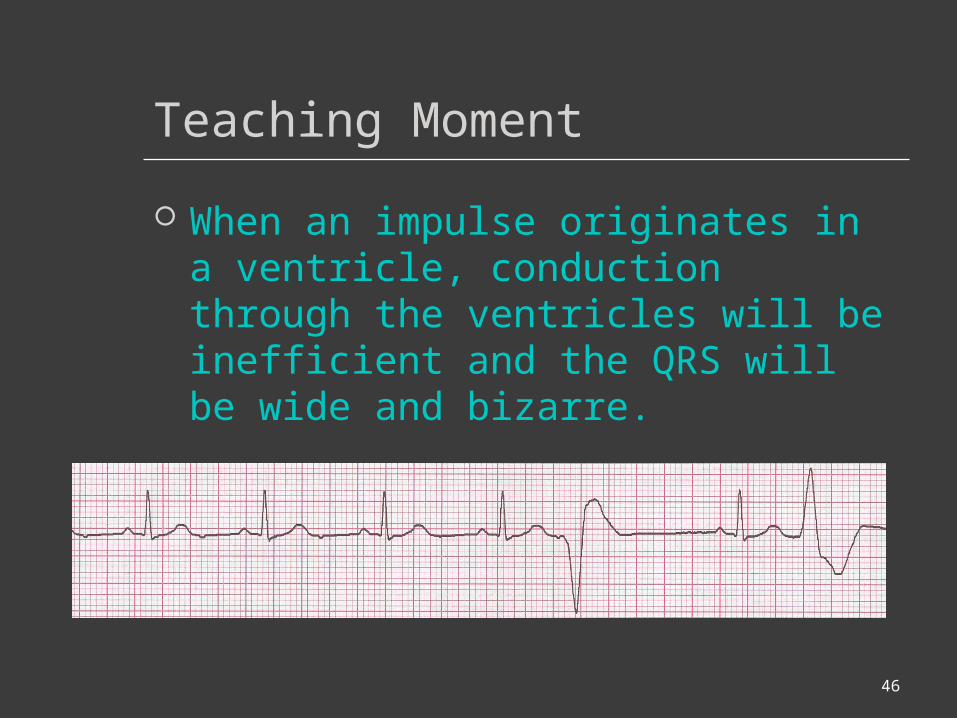
Teaching Moment
When an impulse originates in a ventricle, conduction through the ventricles will be inefficient and the QRS will be wide and bizarre.
47
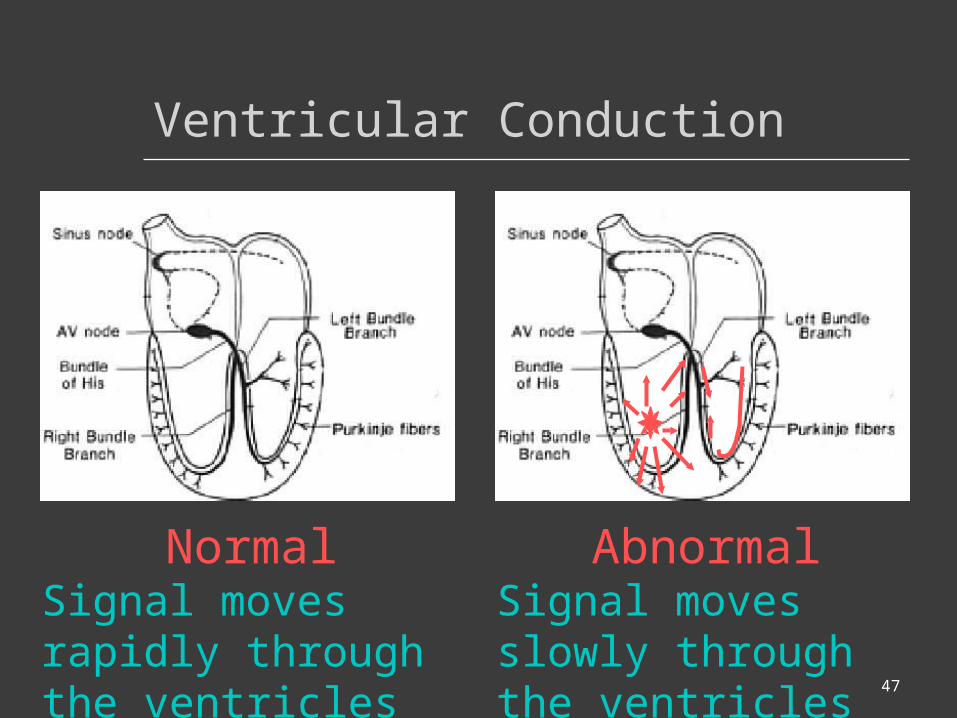
Ventricular Conduction
NormalSignal moves rapidly through the ventricles
AbnormalSignal moves slowly through the ventricles
48
Supraventricular Arrhythmias
Atrial Fibrillation
Atrial Flutter
Paroxysmal Supra Ventricular Tachycardia (PSVT)

49
Rhythm #5
100 bpm• Rate?• Regularity? irregularly irregular
none
0.06 s
• P waves?
• PR interval? none• QRS duration?
Interpretation? Atrial Fibrillation

50
Atrial Fibrillation
Deviation from NSRNo organized atrial depolarization, so
no normal P waves (impulses are not originating from the sinus node).
Atrial activity is chaotic (resulting in an irregularly irregular rate).
Common, affects 2-4%, up to 5-10% if > 80 years old
51
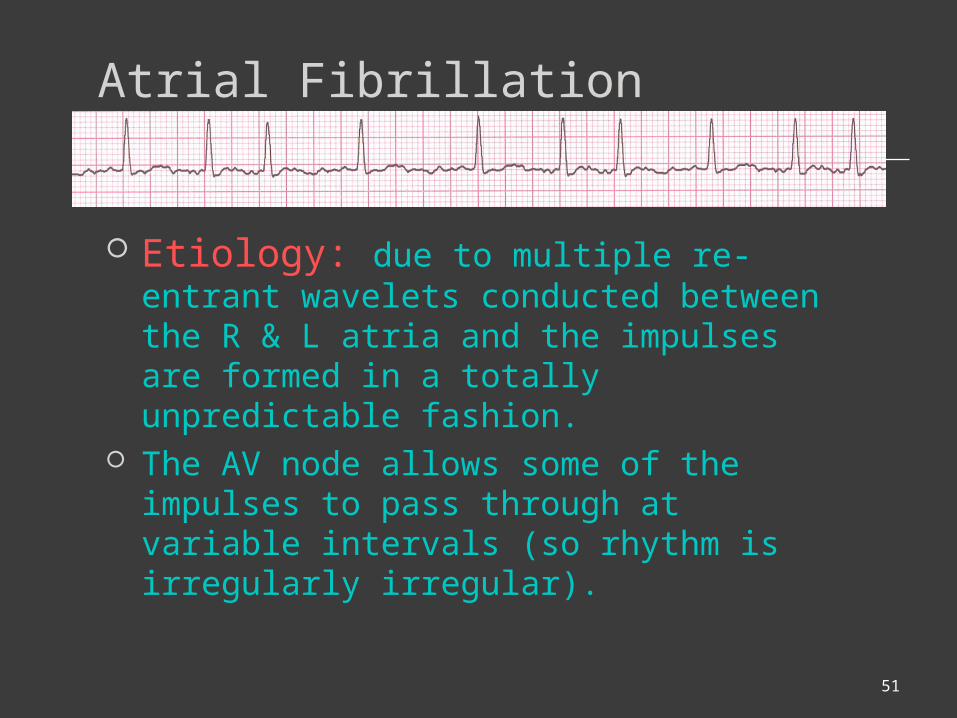
Atrial Fibrillation
Etiology: due to multiple re-entrant wavelets conducted between the R & L atria and the impulses are formed in a totally unpredictable fashion.
The AV node allows some of the impulses to pass through at variable intervals (so rhythm is irregularly irregular).

52
Rhythm #6
70 bpm• Rate?• Regularity? regular
flutter waves
0.06 s
• P waves?
• PR interval? none• QRS duration?
Interpretation? Atrial Flutter
53
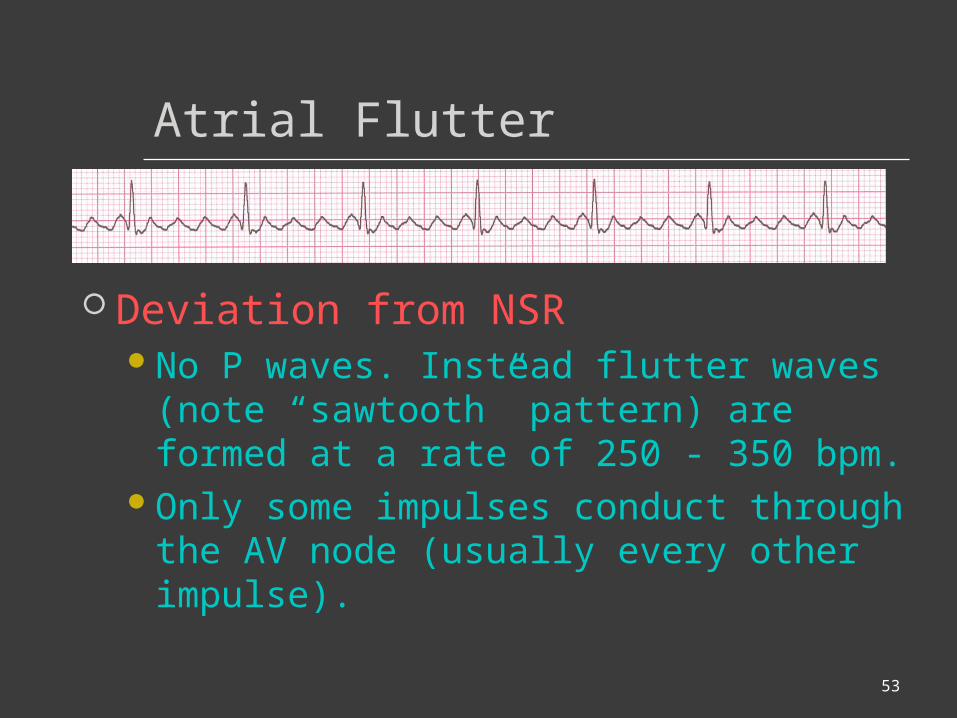
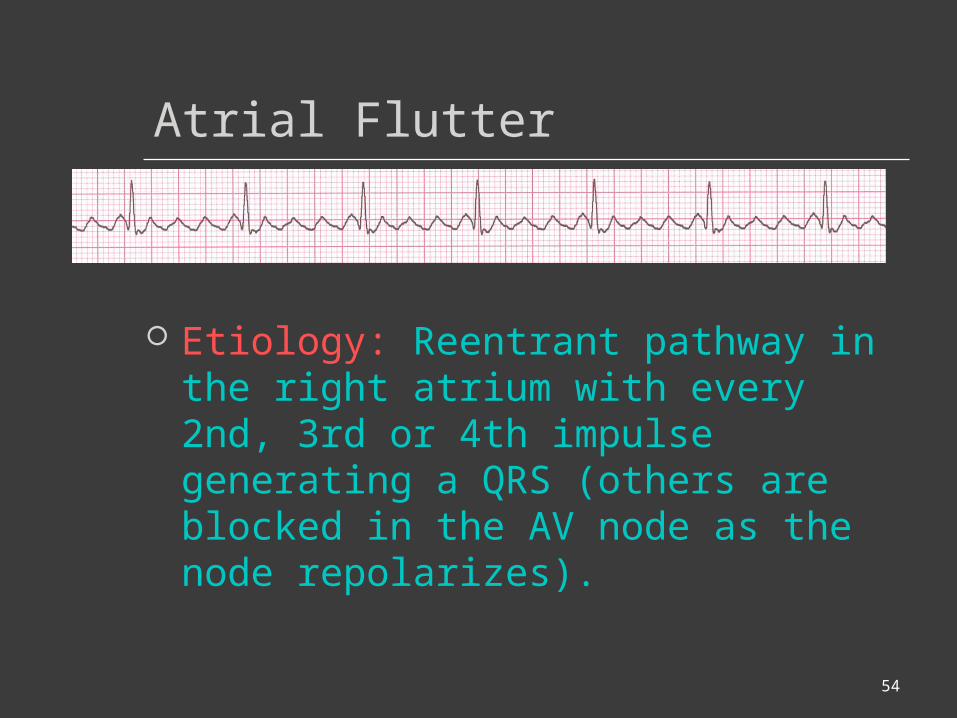
Atrial Flutter
Deviation from NSRNo P waves. Instead flutter waves
(note “sawtooth” pattern) are formed at a rate of 250 - 350 bpm.
Only some impulses conduct through the AV node (usually every other impulse).
54
Atrial Flutter
Etiology: Reentrant pathway in the right atrium with every 2nd, 3rd or 4th impulse generating a QRS (others are blocked in the AV node as the node repolarizes).
55
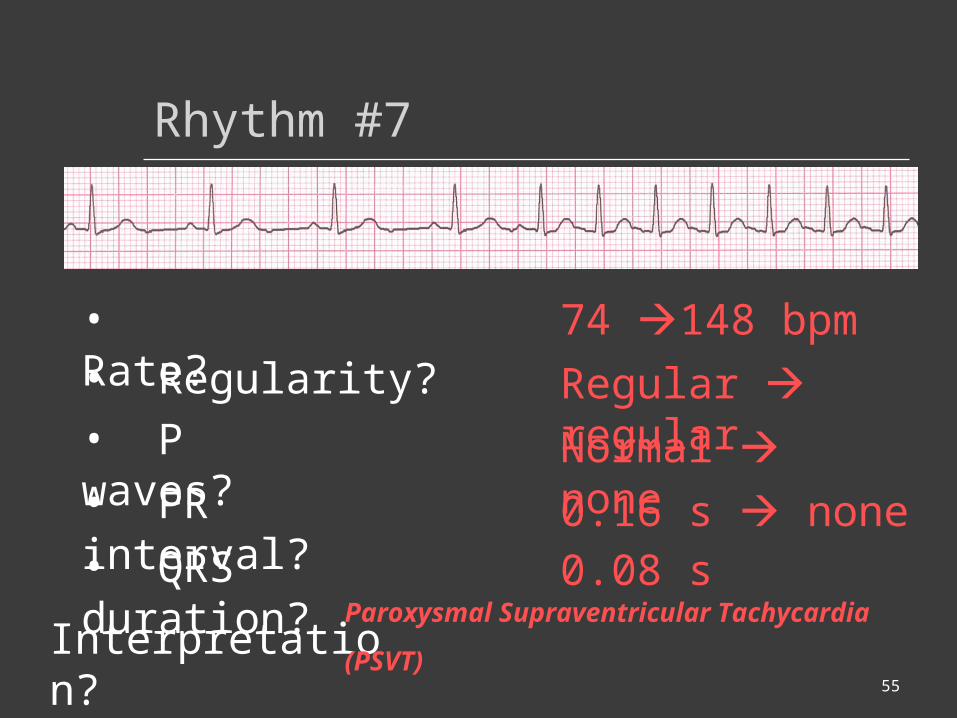
Rhythm #7
74 148 bpm• Rate?• Regularity? Regular regular
Normal none
0.08 s
• P waves?
• PR interval? 0.16 s none• QRS duration?
Interpretation?Paroxysmal Supraventricular Tachycardia
(PSVT)

56
PSVT:Paroxysmal Supra Ventricular Tachycardia
Deviation from NSRThe heart rate suddenly speeds up,
often triggered by a PAC (not seen here) and the P waves are lost.
57
AV Nodal Blocks
1st Degree AV Block
2nd Degree AV Block, Type I
2nd Degree AV Block, Type II
3rd Degree AV Block
58
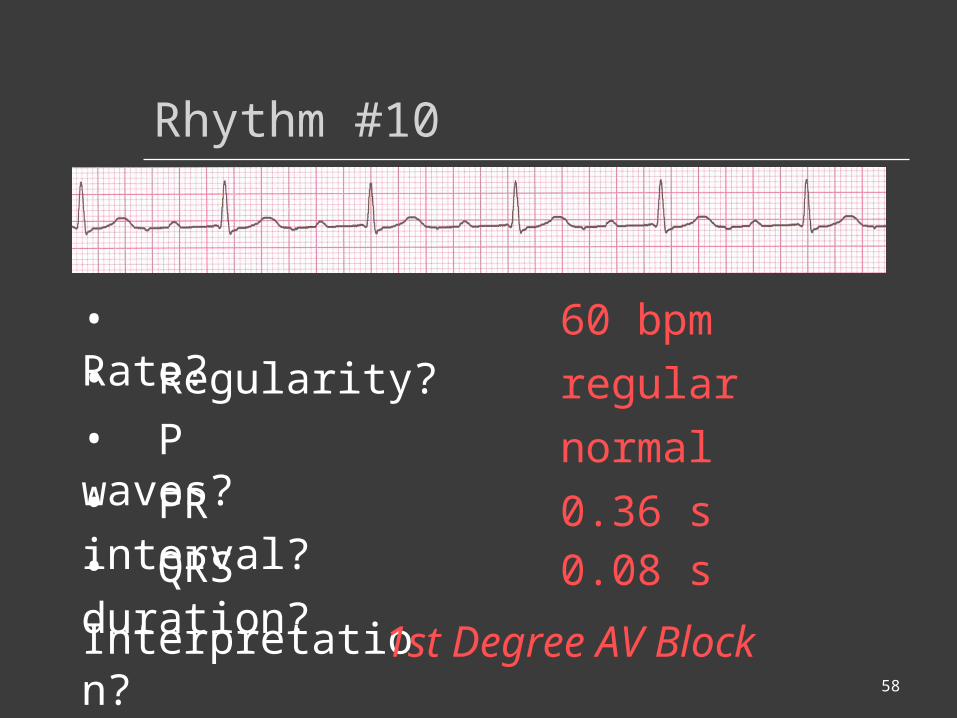
Rhythm #10
60 bpm• Rate?• Regularity? regular
normal
0.08 s
• P waves?
• PR interval? 0.36 s• QRS duration?
Interpretation? 1st Degree AV Block
59
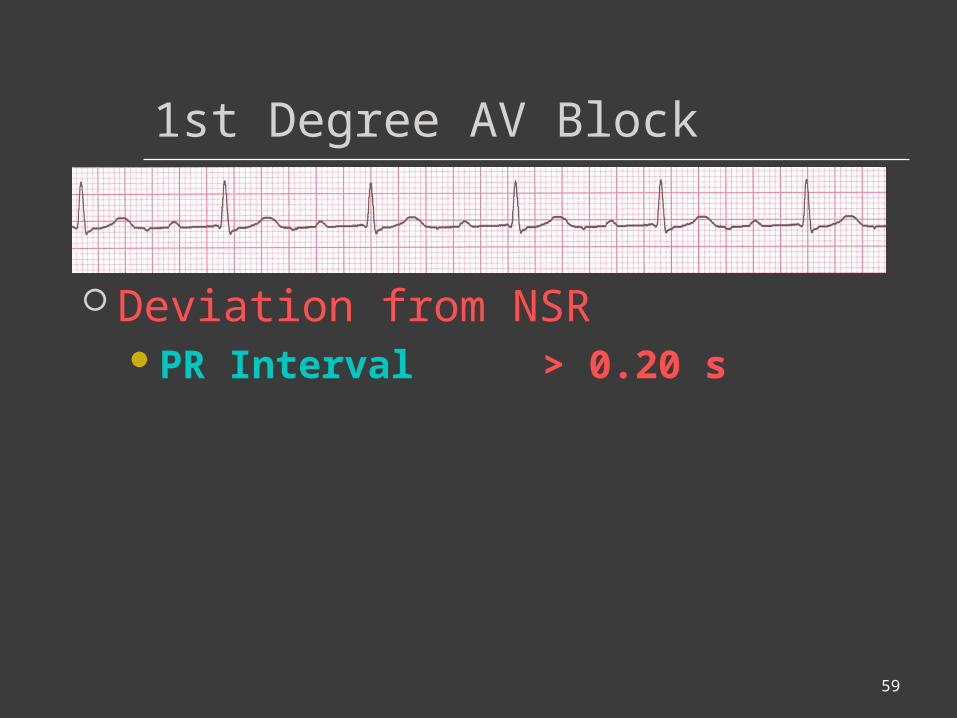
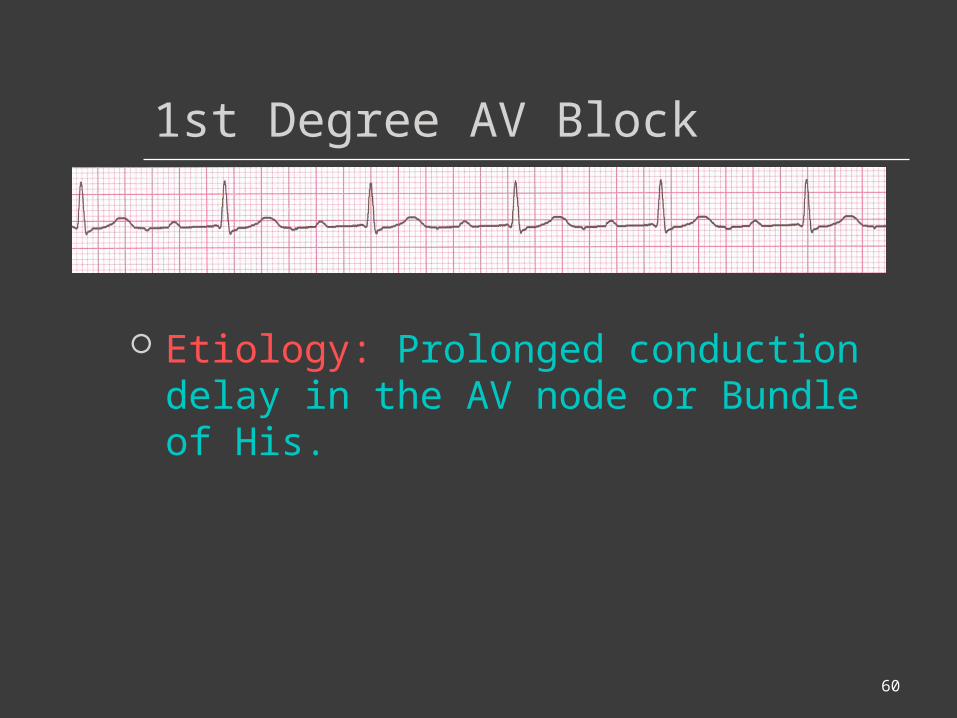
1st Degree AV Block
Deviation from NSRPR Interval > 0.20 s
60
1st Degree AV Block
Etiology: Prolonged conduction delay in the AV node or Bundle of His.
61
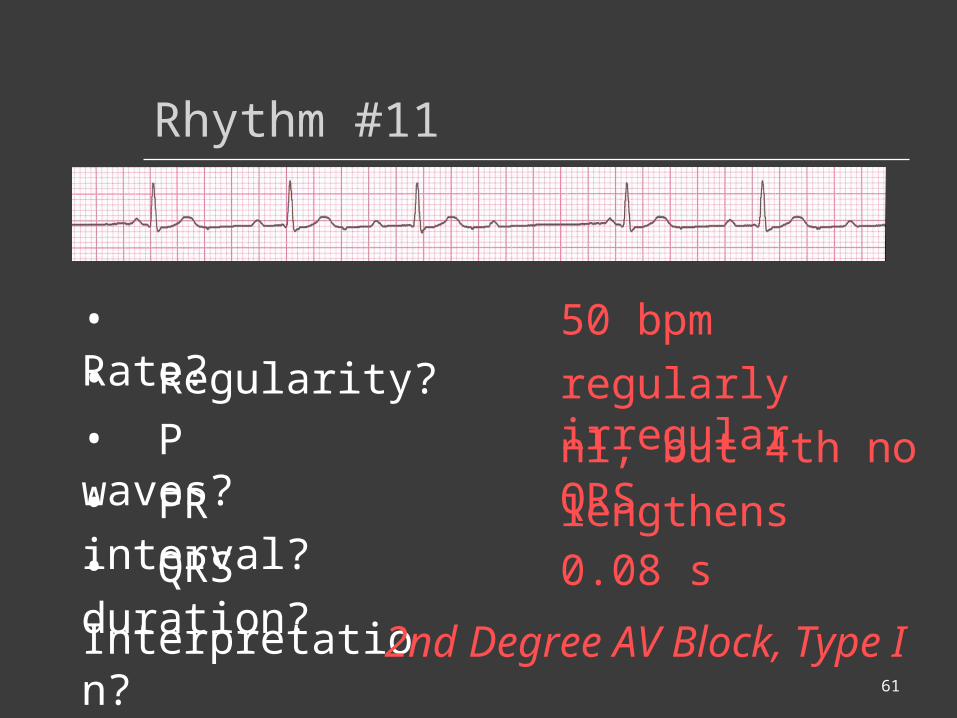
Rhythm #11
50 bpm• Rate?• Regularity? regularly irregular
nl, but 4th no QRS
0.08 s
• P waves?
• PR interval? lengthens• QRS duration?
Interpretation? 2nd Degree AV Block, Type I
62
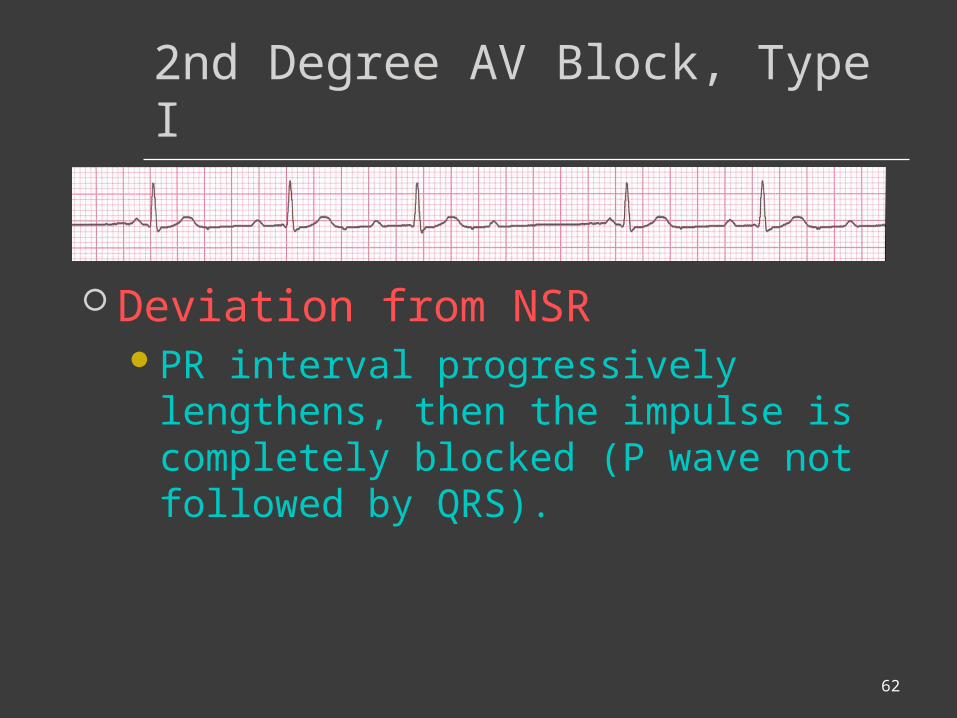
2nd Degree AV Block, Type I
Deviation from NSRPR interval progressively lengthens,
then the impulse is completely blocked (P wave not followed by QRS).
63
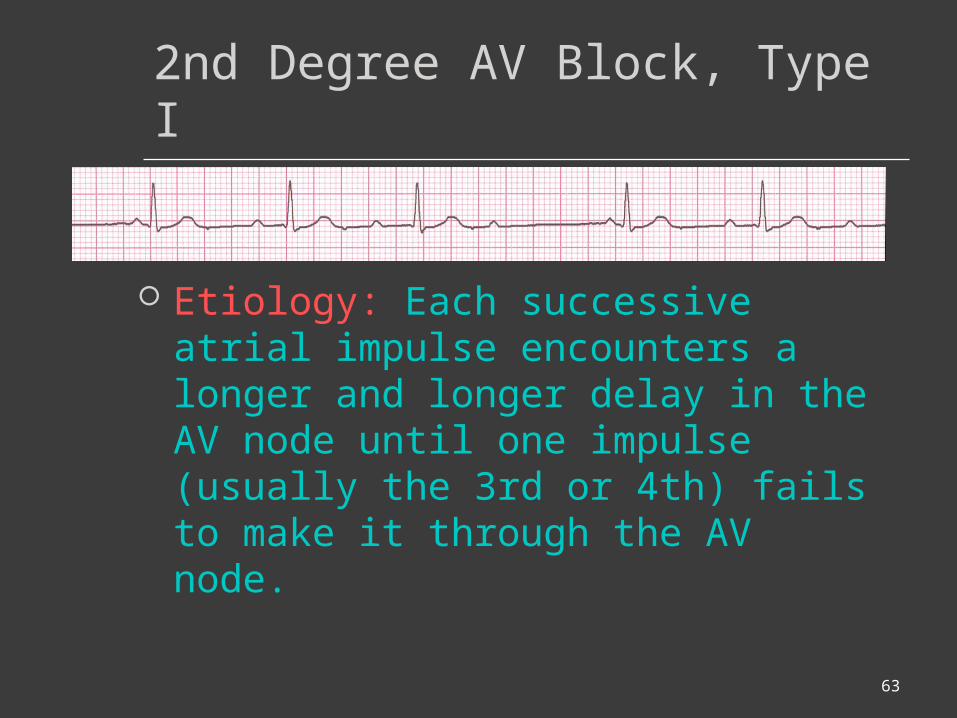
2nd Degree AV Block, Type I
Etiology: Each successive atrial impulse encounters a longer and longer delay in the AV node until one impulse (usually the 3rd or 4th) fails to make it through the AV node.
64
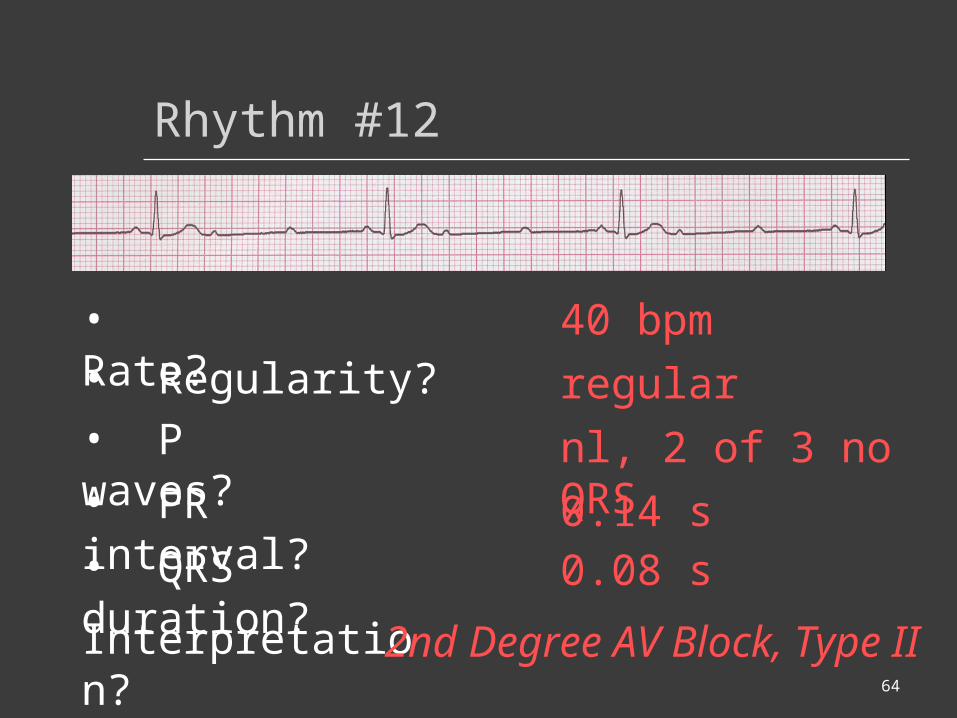
Rhythm #12
40 bpm• Rate?• Regularity? regular
nl, 2 of 3 no QRS
0.08 s
• P waves?
• PR interval? 0.14 s• QRS duration?
Interpretation? 2nd Degree AV Block, Type II
65
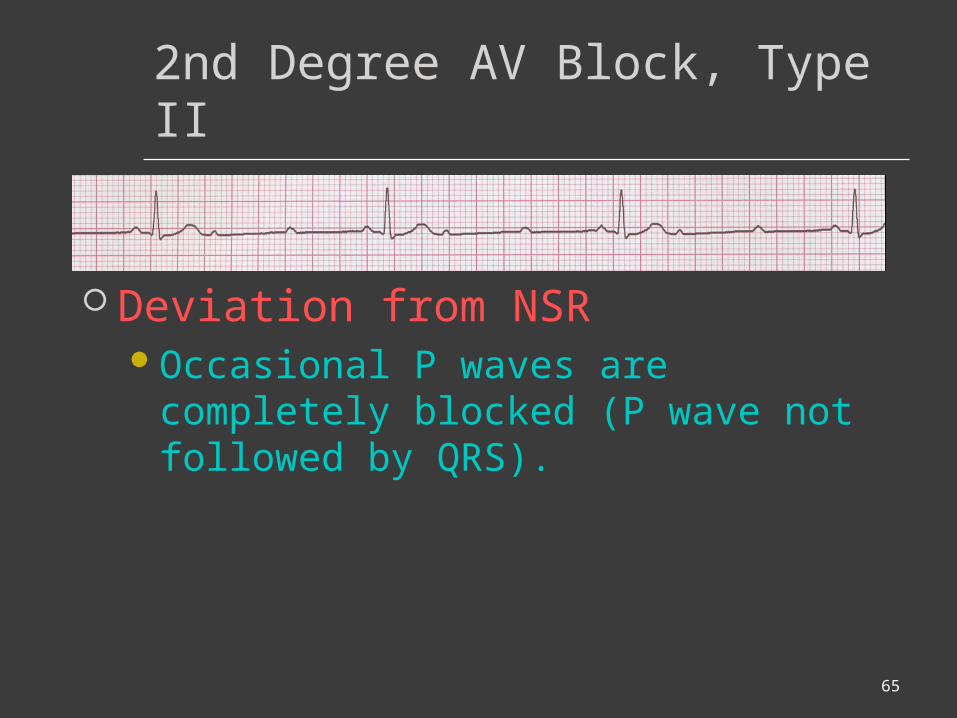
2nd Degree AV Block, Type II
Deviation from NSROccasional P waves are completely
blocked (P wave not followed by QRS).
66
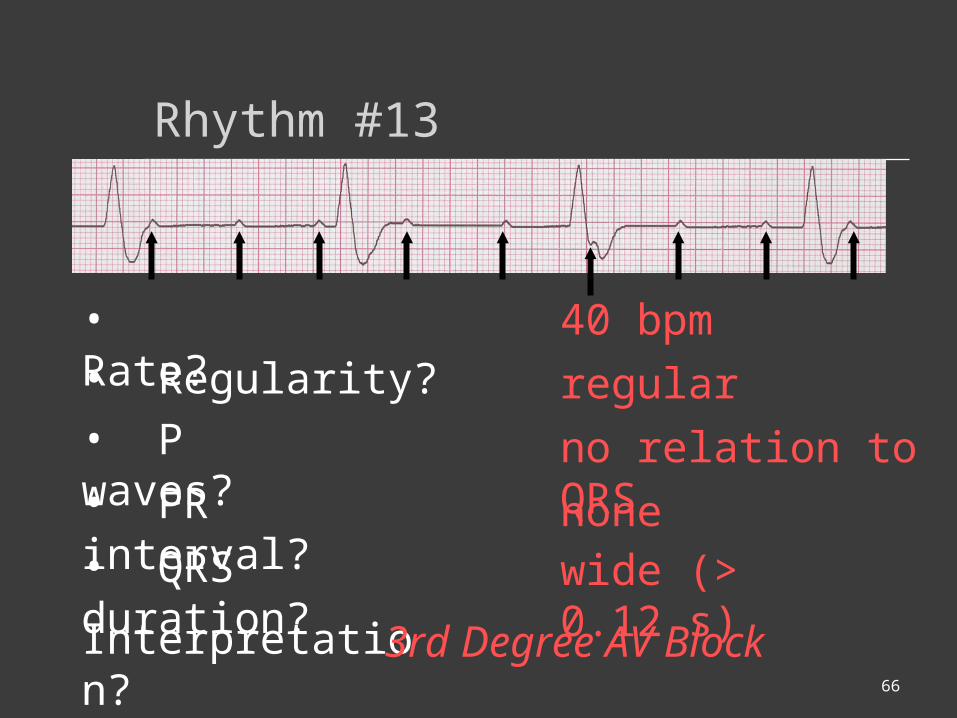
Rhythm #13
40 bpm• Rate?• Regularity? regular
no relation to QRS
wide (> 0.12 s)
• P waves?
• PR interval? none• QRS duration?
Interpretation? 3rd Degree AV Block
67
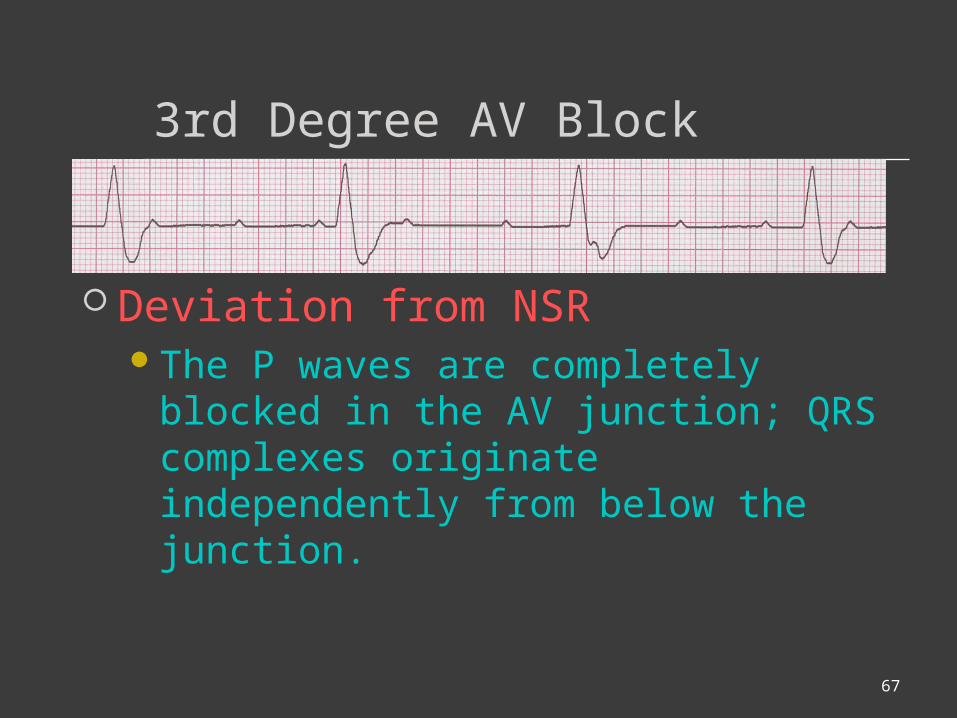
3rd Degree AV Block
Deviation from NSRThe P waves are completely blocked
in the AV junction; QRS complexes originate independently from below the junction.
68
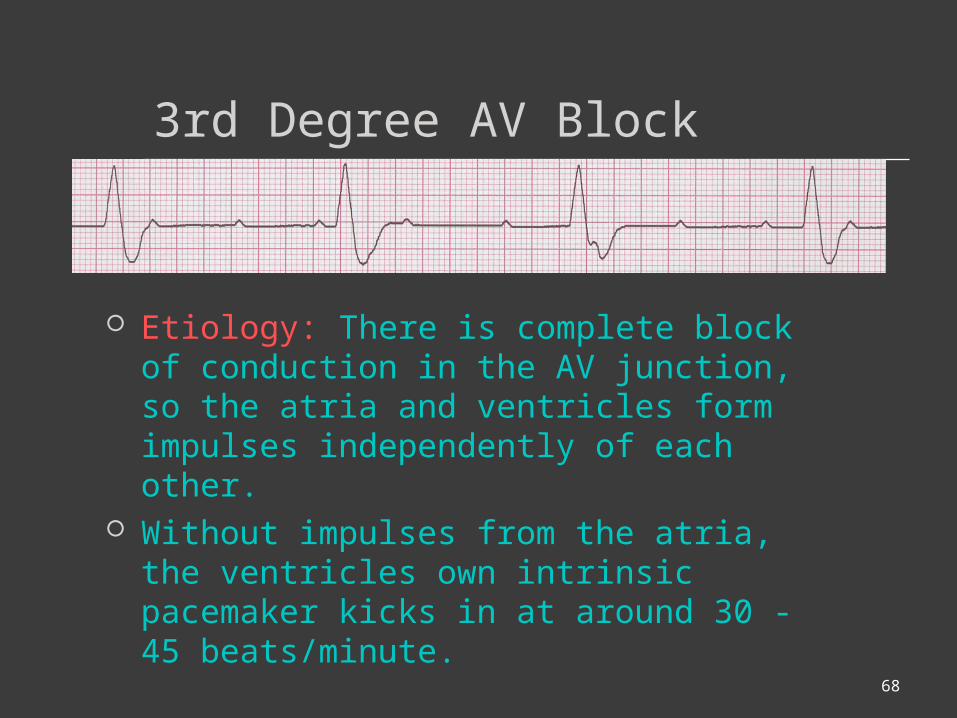
3rd Degree AV Block
Etiology: There is complete block of conduction in the AV junction, so the atria and ventricles form impulses independently of each other.
Without impulses from the atria, the ventricles own intrinsic pacemaker kicks in at around 30 - 45 beats/minute.
69
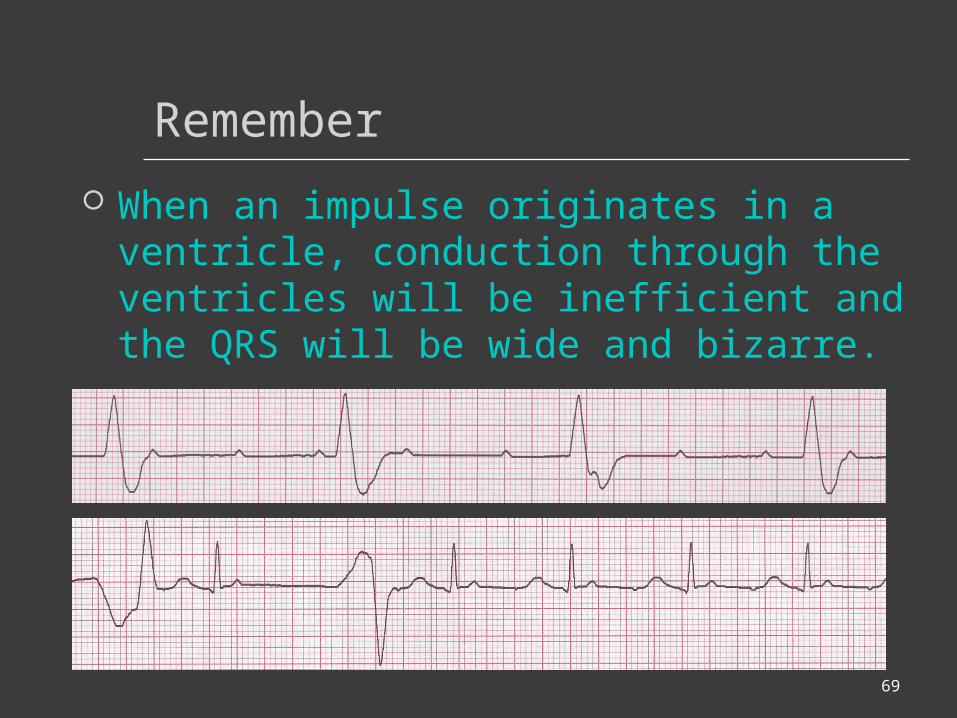
Remember
When an impulse originates in a ventricle, conduction through the ventricles will be inefficient and the QRS will be wide and bizarre.
70
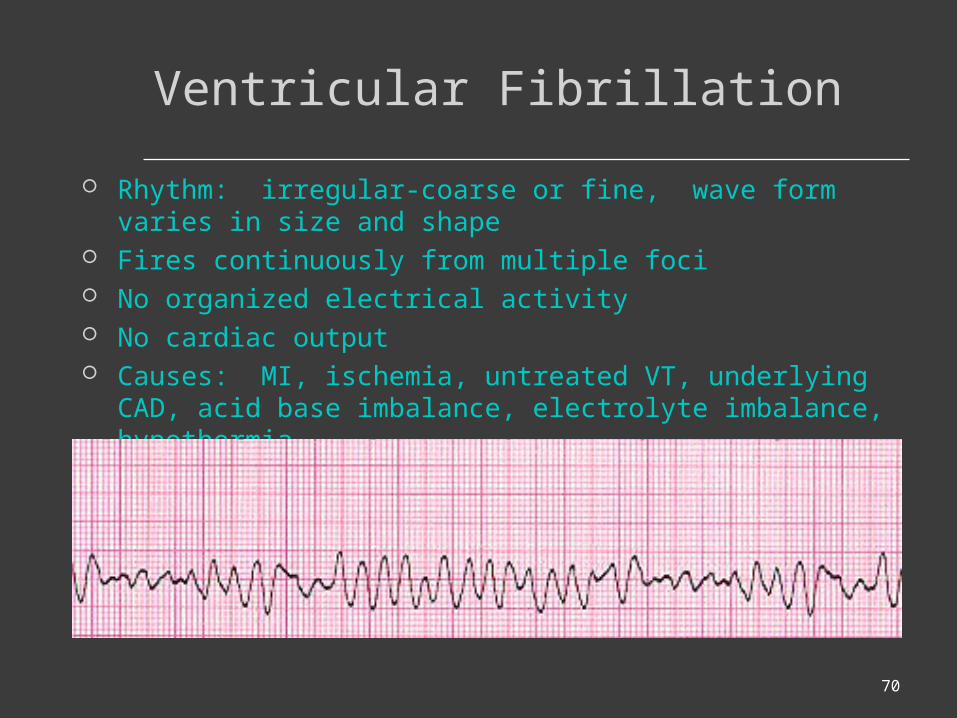
Ventricular Fibrillation
Rhythm: irregular-coarse or fine, wave form varies in size and shape
Fires continuously from multiple foci No organized electrical activity No cardiac output Causes: MI, ischemia, untreated VT, underlying CAD, acid
base imbalance, electrolyte imbalance, hypothermia,
71
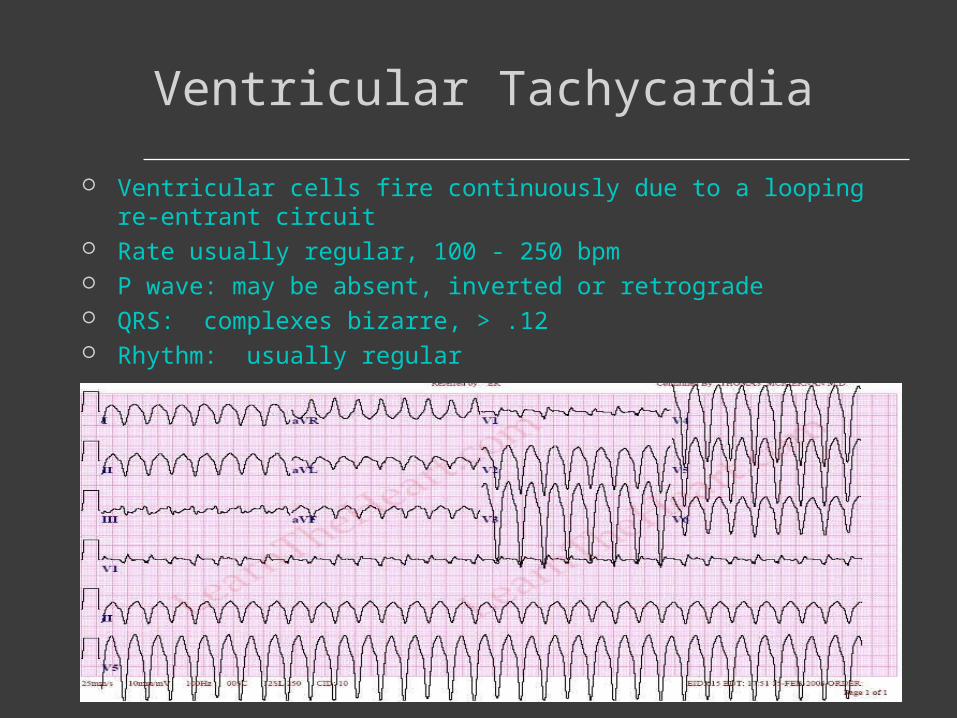
Ventricular Tachycardia
Ventricular cells fire continuously due to a looping re-entrant circuit
Rate usually regular, 100 - 250 bpm P wave: may be absent, inverted or retrograde QRS: complexes bizarre, > .12 Rhythm: usually regular
72
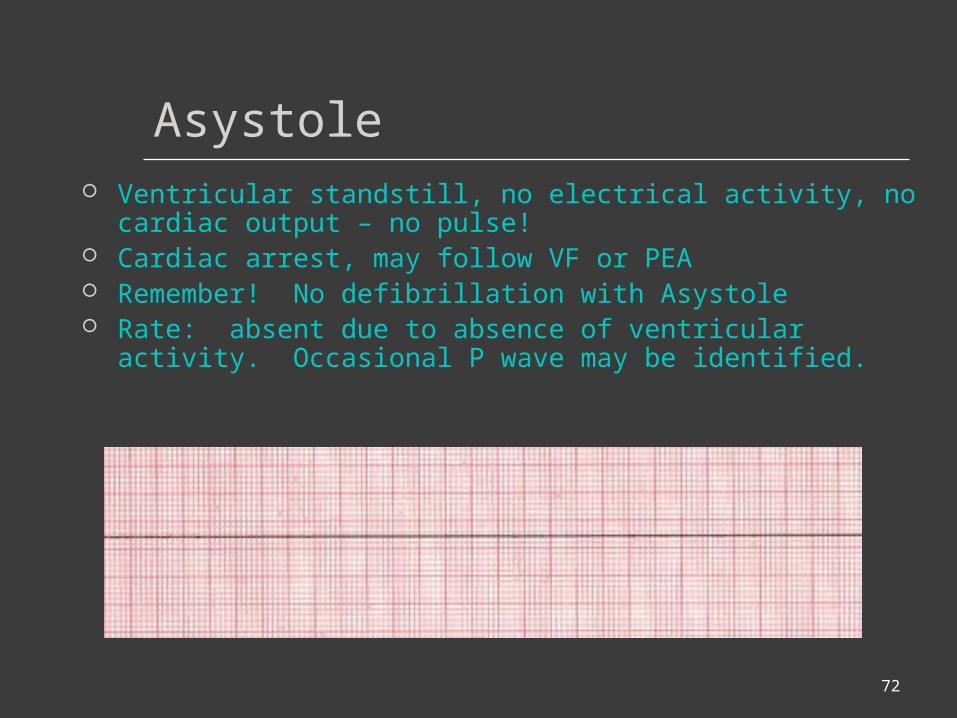
Asystole Ventricular standstill, no electrical activity, no cardiac
output – no pulse! Cardiac arrest, may follow VF or PEA Remember! No defibrillation with Asystole Rate: absent due to absence of ventricular activity.
Occasional P wave may be identified.
73
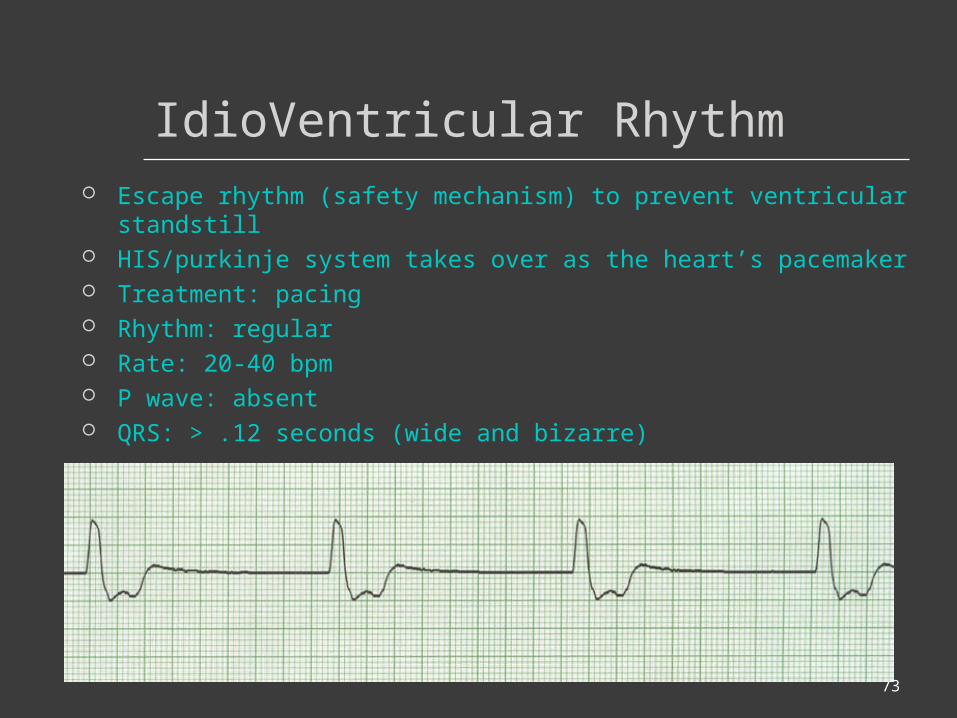
IdioVentricular Rhythm Escape rhythm (safety mechanism) to prevent ventricular
standstill HIS/purkinje system takes over as the heart’s pacemaker Treatment: pacing Rhythm: regular Rate: 20-40 bpm P wave: absent QRS: > .12 seconds (wide and bizarre)

74
Diagnosing a MI
To diagnose a myocardial infarction you need to go beyond looking at a rhythm strip and obtain a 12-Lead ECG.
Rhythm Strip
75
The 12-Lead ECG
The 12-Lead ECG sees the heart from 12 different views.
Therefore, the 12-Lead ECG helps you see what is happening in different portions of the heart.
The rhythm strip is only 1 of these 12 views.

76
The 12-Leads
The 12-leads include:
–3 Limb leads (I, II, III)
–3 Augmented leads (aVR, aVL,
aVF)–6 Precordial leads
(V1- V6)

77
Views of the Heart
Some leads get a good view of the:
Anterior portion of the heart
Lateral portion of the heart
Inferior portion of the heart
78
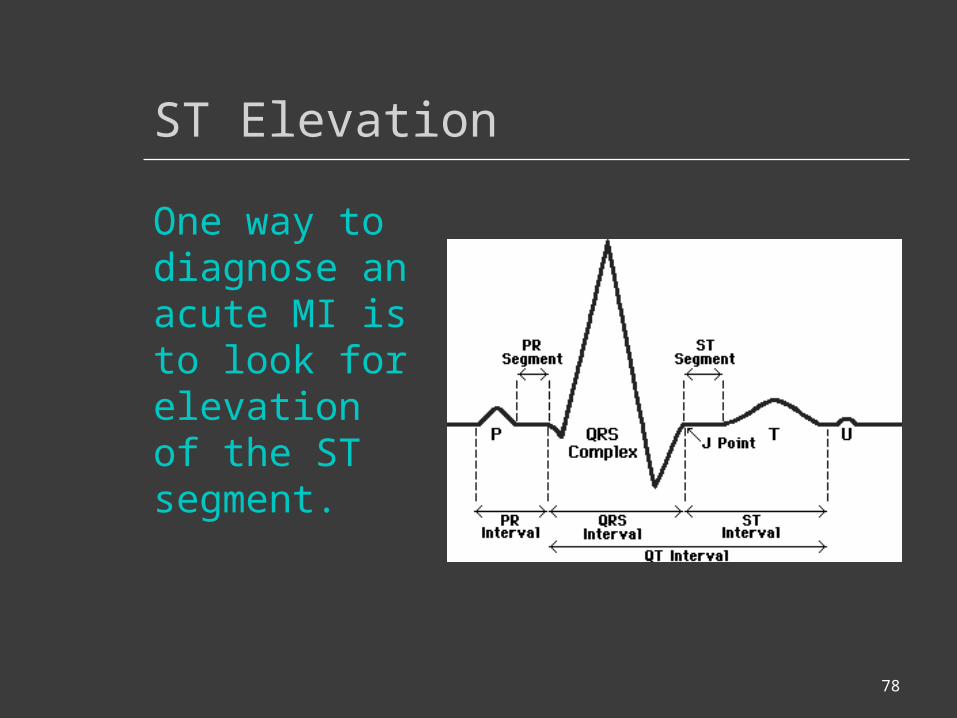
ST Elevation
One way to diagnose an acute MI is to look for elevation of the ST segment.

79
ST Elevation (cont)
Elevation of the ST segment (greater than 1 small box) in 2 leads is consistent with a myocardial infarction.
80
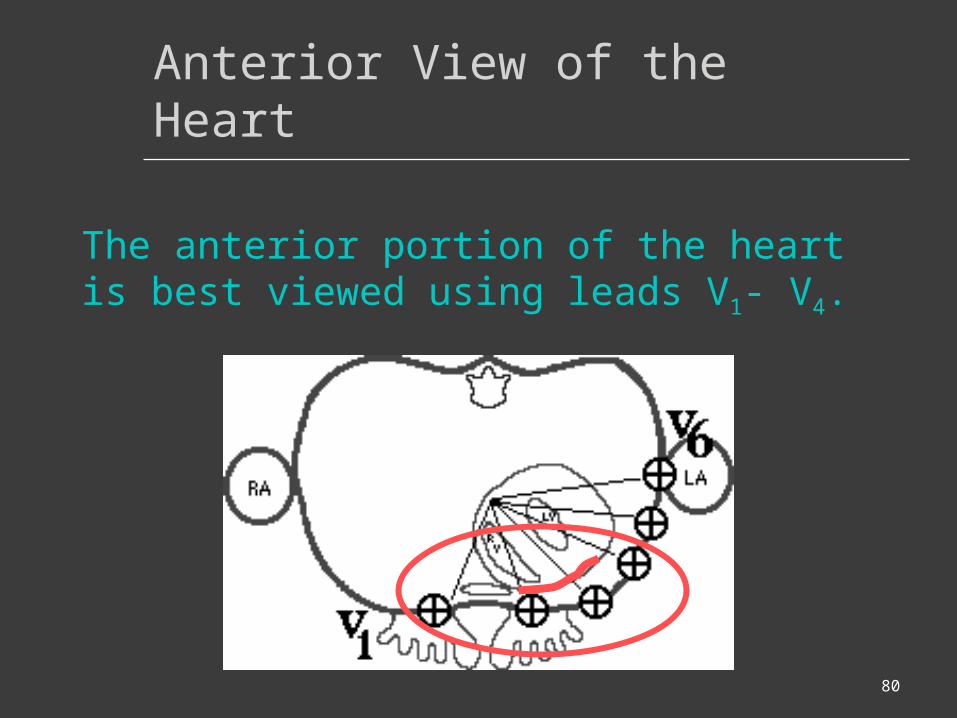
Anterior View of the Heart
The anterior portion of the heart is best viewed using leads V1- V4.
81
Anterior Myocardial Infarction
If you see changes in leads V1 - V4 that are consistent with a myocardial infarction, you can conclude that it is an anterior wall myocardial infarction.

82
Putting it all Together
Do you think this person is having a myocardial infarction. If so, where?
83
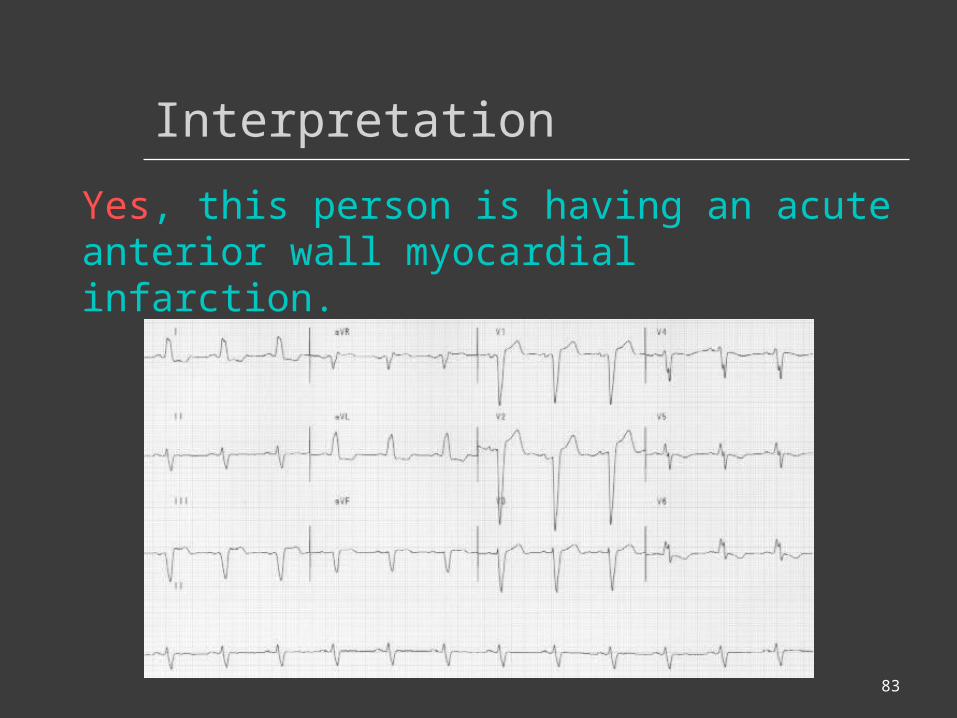
Interpretation
Yes, this person is having an acute anterior wall myocardial infarction.

84
Other MI Locations
Now that you know where to look for an anterior wall myocardial infarction let’s look at how you would determine if the MI involves the lateral wall or the inferior wall of the heart.
85
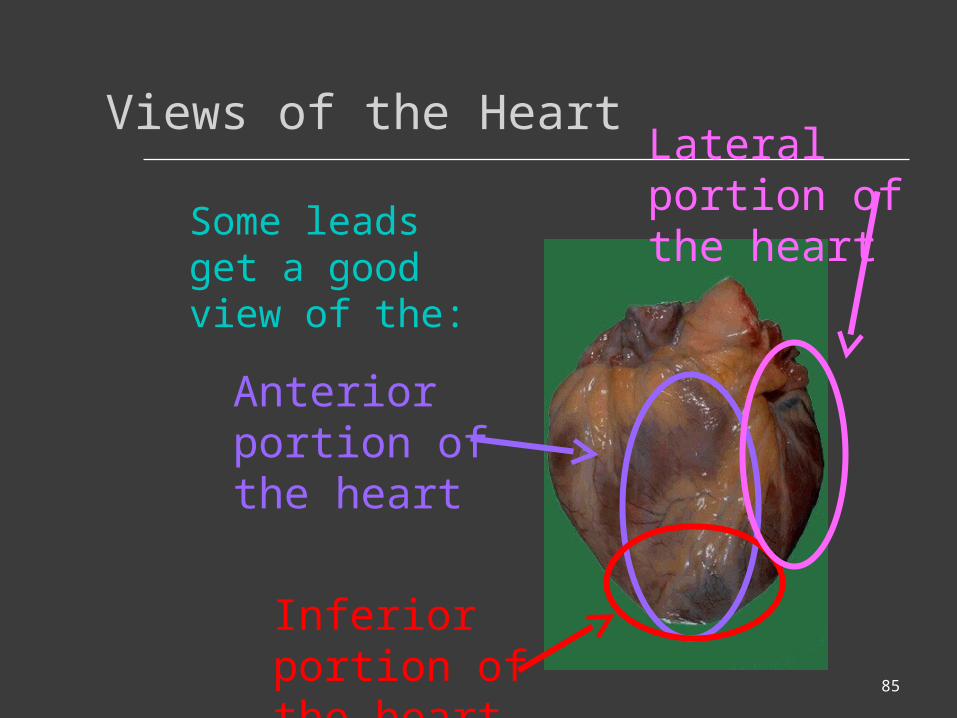
Views of the Heart
Some leads get a good view of the:
Anterior portion of the heart
Lateral portion of the heart
Inferior portion of the heart
86
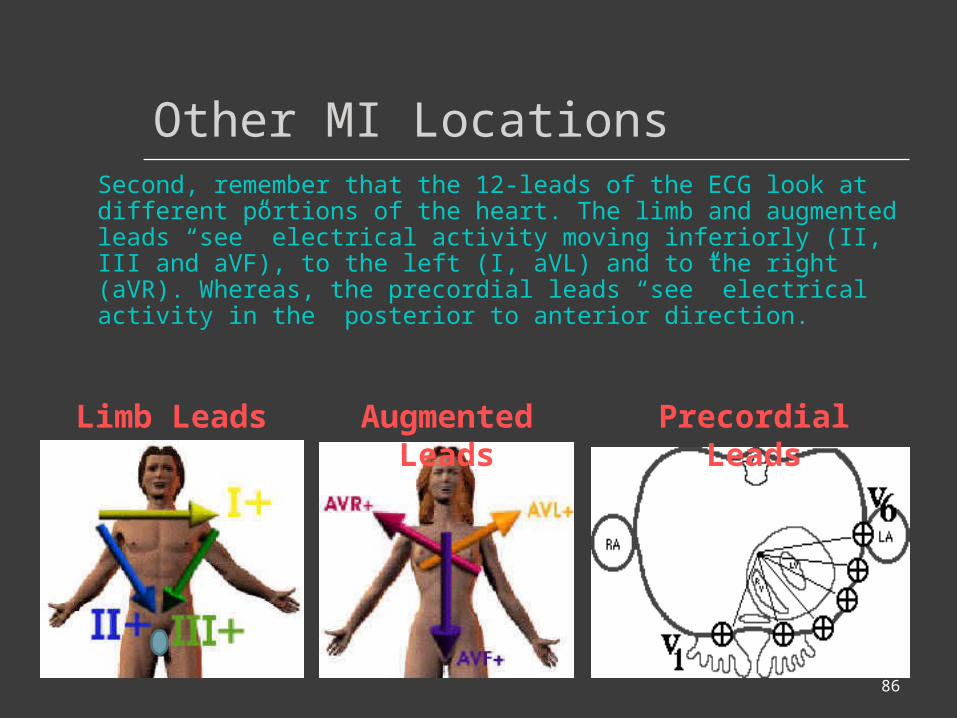
Other MI LocationsSecond, remember that the 12-leads of the ECG look at different portions of the heart. The limb and augmented leads “see” electrical activity moving inferiorly (II, III and aVF), to the left (I, aVL) and to the right (aVR). Whereas, the precordial leads “see” electrical activity in the posterior to anterior direction.
Limb Leads Augmented Leads Precordial Leads

87
Other MI Locations
Now, using these 3 diagrams let’s figure where to look for a lateral wall and inferior wall MI.
Limb Leads Augmented Leads Precordial Leads

88
Anterior MI
Remember the anterior portion of the heart is best viewed using leads V1- V4.
Limb Leads Augmented Leads Precordial Leads
89
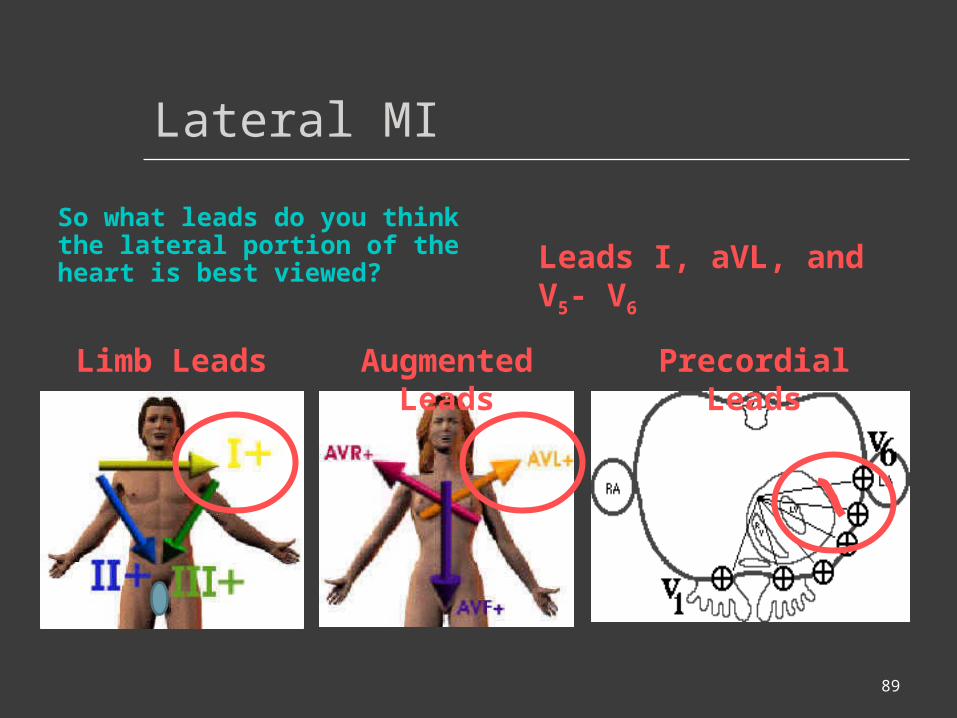
Lateral MI
So what leads do you think the lateral portion of the heart is best viewed?
Limb Leads Augmented Leads Precordial Leads
Leads I, aVL, and V5- V6

90
Inferior MI
Now how about the inferior portion of the heart?
Limb Leads Augmented Leads Precordial Leads
Leads II, III and aVF
91
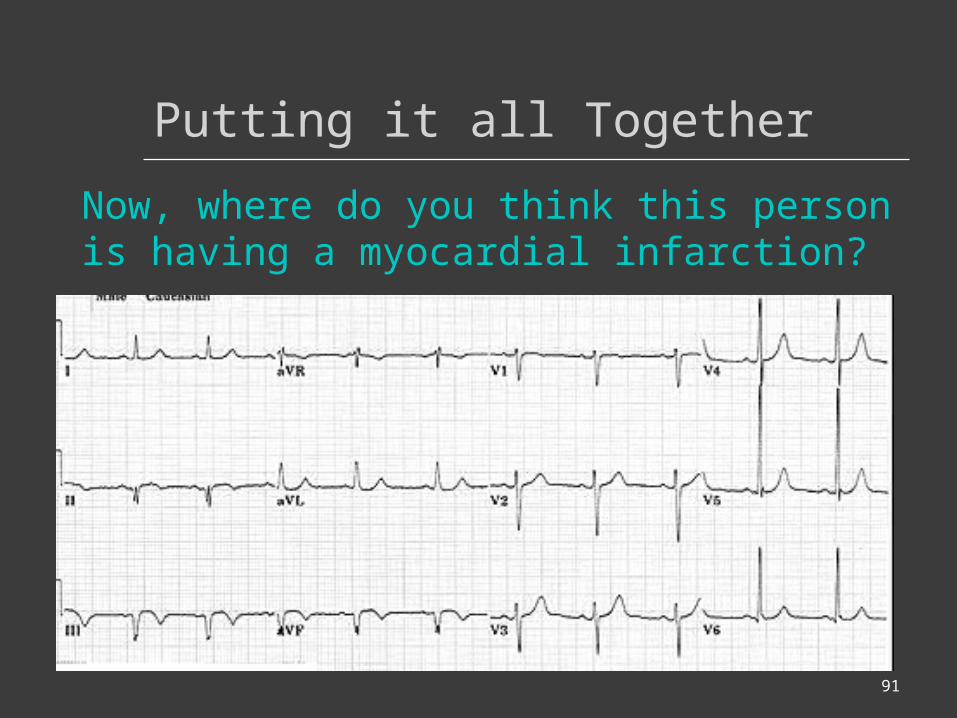
Putting it all Together
Now, where do you think this person is having a myocardial infarction?

92
Inferior Wall MI
This is an inferior MI. Note the ST elevation in leads II, III and aVF.

93
Putting it all Together
How about now?
94
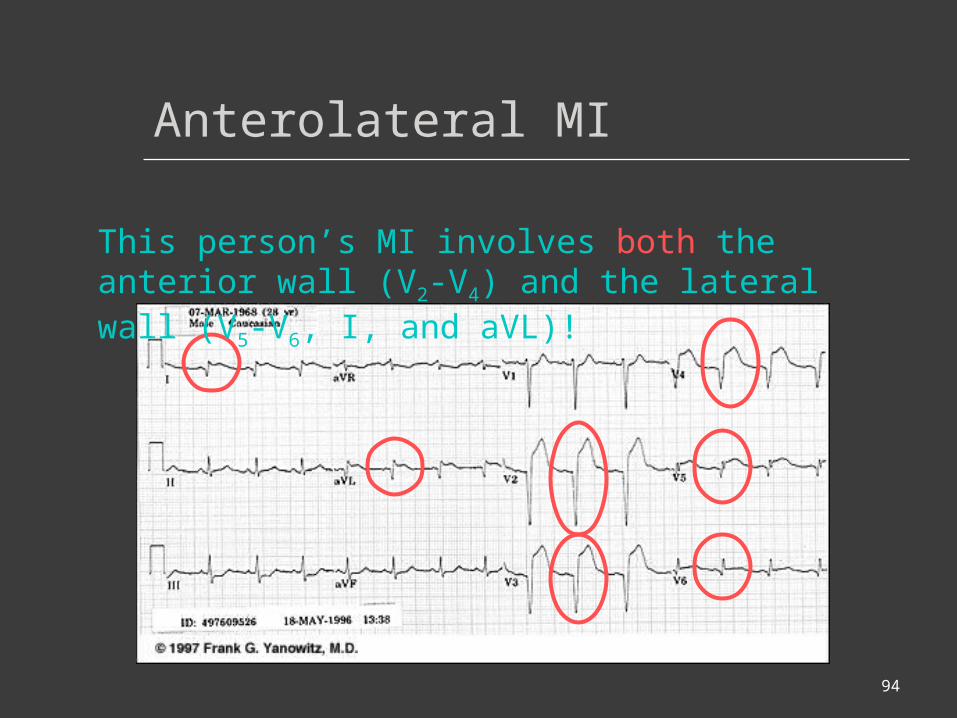
Anterolateral MI
This person’s MI involves both the anterior wall (V2-V4) and the lateral wall (V5-V6, I, and aVL)!
95
Reading 12-Lead ECGs
The best way to read 12-lead ECGs is to develop a step-by-step approach (just as we did for analyzing a rhythm strip). In these modules we present a 6-step approach:
1. Calculate RATE2. Determine RHYTHM3. Determine QRS AXIS4. Calculate INTERVALS5. Assess for HYPERTROPHY6. Look for evidence of INFARCTION
96
Rate Rhythm Axis Intervals Hypertrophy Infarct
In Module II you learned how to calculate the rate. If you need a refresher return to that module.
There is one new thing to keep in mind when determining the rate in a 12-lead ECG…
97
Rate Rhythm Axis Intervals Hypertrophy Infarct
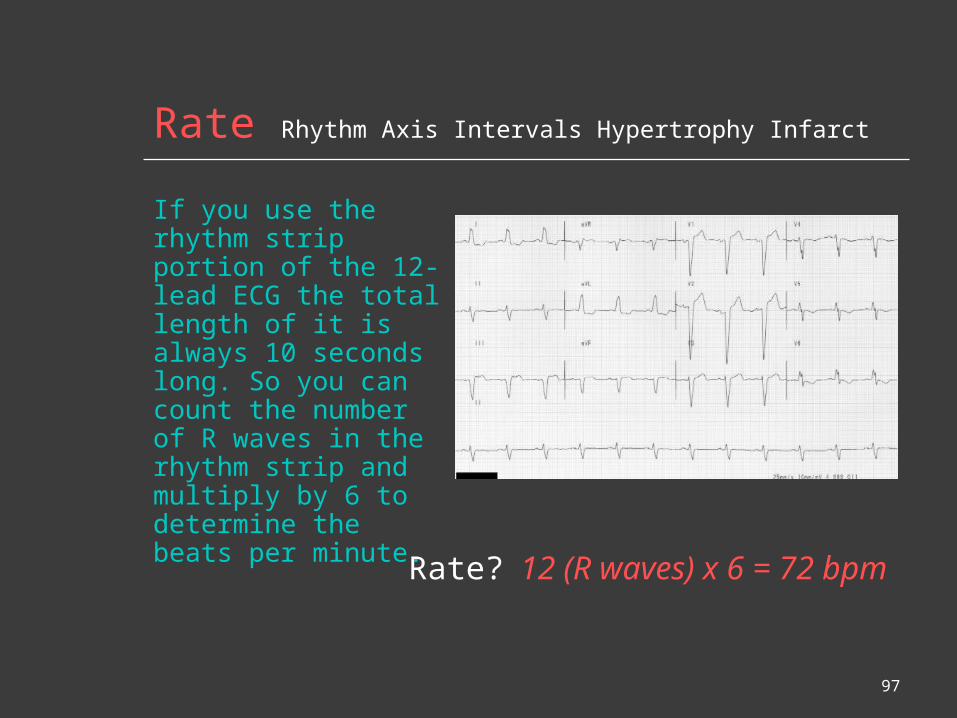
If you use the rhythm strip portion of the 12-lead ECG the total length of it is always 10 seconds long. So you can count the number of R waves in the rhythm strip and multiply by 6 to determine the beats per minute.
Rate? 12 (R waves) x 6 = 72 bpm