
Eastwood Harris Books, Project Management Training Books ...
50
PLANNING AND CONTROL USING MICROSOFT ® PROJECT 2010 AND PMBOK ® GUIDE FOURTH EDITION SAMPLE BOOK CHAPTERS COMPLETE BOOK MAY BE PURCHASED FROM www.eh.com.au © Eastwood Harris Pty Ltd i PLANNING AND CONTROL USING MICROSOFT ® PROJECT 2010 AND PMBOK GUIDE ® FOURTH EDITION BY PAUL EASTWOOD HARRIS
Transcript of Eastwood Harris Books, Project Management Training Books ...

PLANNING AND CONTROL USING MICROSOFT® PROJECT 2010 AND PMBOK® GUIDE FOURTH EDITION
SAMPLE BOOK CHAPTERS COMPLETE BOOK MAY BE PURCHASED FROM www.eh.com.au © Eastwood Harris Pty Ltd i
PLANNING AND CONTROL
USING
MICROSOFT® PROJECT 2010
AND
PMBOK GUIDE® FOURTH EDITION
BY
PAUL EASTWOOD HARRIS

PLANNING AND CONTROL USING MICROSOFT® PROJECT 2010 AND PMBOK® GUIDE FOURTH EDITION
SAMPLE BOOK CHAPTERS COMPLETE BOOK MAY BE PURCHASED FROM www.eh.com.au © Eastwood Harris Pty Ltd ii
©Copyright 1999–2010 by Eastwood Harris Pty Ltd. No part of this publication may be reproduced or used in any form or by any method without the written permission of the author. Windows XP, Microsoft® Project 2000, Microsoft® Project Standard 2002, Microsoft® Project Professional 2002, Microsoft® Project Standard 2003, Microsoft® Project Professional 2003, Microsoft® Office Project 2007, Microsoft® Project 2010 PowerPoint, Word, Visio and Excel are registered trademarks of Microsoft Corporation. Primavera Project Planner®, P3®, Primavera P6 Project Manager®, SureTrak Project Manager® and SureTrak® are registered trademarks of Oracle Corporation. Adobe® and Acrobat® are registered trademarks of Adobe Systems Incorporated. Asta Powerproject® is a registered trademark of Asta Developments plc. All other company or product names may be trademarks of their respective owners. Screen captures were reprinted with authorization from Microsoft Corporation. This publication was created by Eastwood Harris Pty Ltd and is not a product of Microsoft Corporation.
The Project Management Institute did not participate in the development of this material, and has not reviewed its contents for accuracy. PMI does not endorse or otherwise sponsor this material, and makes no warranty, guarantee, or representation, expressed or implied, as to the accuracy of the content. DISCLAIMER The information contained in this book is, to the best of the author’s knowledge, true and correct. The author has made every effort to ensure accuracy of this publication, but cannot be held responsible for any loss or damage arising from any information in this book. AUTHOR AND PUBLISHER Paul E Harris Eastwood Harris Pty Ltd PO Box 4032 Doncaster Heights 3109 Victoria Australia [email protected] http://www.eh.com.au Tel: +61 (0)4 1118 7701 Fax: +61 (0)3 9846 7700 Please send any comments on this publication to the author. ISBN 978-1-921059-39-1 B5 Paperback ISBN 978-1-921059-40-7 A4 Spiral Bound ISBN 978-1-921059-50-6 A4 eBook 16 October 2010

PLANNING AND CONTROL USING MICROSOFT® PROJECT 2010 AND PMBOK® GUIDE FOURTH EDITION
SAMPLE BOOK CHAPTERS COMPLETE BOOK MAY BE PURCHASED FROM www.eh.com.au © Eastwood Harris Pty Ltd iii
SUMMARY The book was written so it may be used as:
A training manual for a two-day training course, or A self-teach book, or A reference manual.
The screen shots for the book are mainly taken from Microsoft Project Professional 2010 but the book may also be used to learn Microsoft Office Project Standard 2010. The book has been written to be used as the basis of a two-day training course and includes exercises for the students to complete at the end of each chapter. Unlike many training publications, this course book may then be used by the students as a reference book. This publication is ideal for people who would like to quickly gain an understanding of how the software operates and how the software differs from Oracle Primavera Project Manager, P3, SureTrak and Asta Powerproject thus making it ideal for people who wish to convert from these products. CUSTOMIZATION FOR TRAINING COURSES Training organizations or companies that wish to conduct their own training may have the book tailored to suit their requirements. This may be achieved by removing, reordering or adding content to the book and by writing their own exercises. This book is available in both A4 spiral bound, which lies flat on the desk for training and/or self–teaching, and in B5 paperback as a reference manual. Please contact the author to discuss this service. AUTHOR’S COMMENT As a professional project planner and scheduler I have used a number of planning and scheduling software packages for the management of a range of project types and sizes. The first books I published were user guides/training manuals for Primavera SureTrak and P3 users. These were well received by professional project managers and schedulers, so I decided to turn my attention to Microsoft Project 2000, 2002, 2003, 2007 and now Microsoft Office Project 2010. This book follows the same proven layout of my previous books. I trust this book will assist you in understanding how to use Microsoft Project on your projects. Please contact me if you have any comments on this book. SPECIAL THANKS I would like to thank Martin Vaughn for reviewing my draft book and making valuable comments that I have used to improve the quality of this publication.

PLANNING AND CONTROL USING MICROSOFT® PROJECT 2010 AND PMBOK® GUIDE FOURTH EDITION
SAMPLE BOOK CHAPTERS COMPLETE BOOK MAY BE PURCHASED FROM www.eh.com.au © Eastwood Harris Pty Ltd iv
CURRENT BOOKS PUBLISHED BY EASTWOOD HARRIS Project Planning & Control Using Primavera® P6TM For all industries including Versions 4 to 7 ISBN 978-1-921059-33-9 B5 Paperback, I978-1-921059-34-6 A4 Spiral, 978-1-921059-47-6 eBook Planning & Control Using Microsoft® Project and PRINCE2 TM Updated for PRINCE2 TM 2009 and Microsoft® Office Project 2010 ISBN 1-921059-37-0 B5 Paperback, 1-921059-38-9- A4 Spiral, 978-1-921059-49-0 eBook Planning and Control Using Microsoft® Project 2010 and PMBOK® Guide Fourth Edition ISBN 1-921059-39-7 5 Paperback, 1-921059-40-0 A4 Spiral, 978-1-921059-50-6 eBook 99 Tricks and Traps for Microsoft® Office Project 2010 ISBN 978-1-921059-41-4 - 8" x 6" Paperback, 978-1-921059-51-3 eBook Planning & Control Using Microsoft® Project and PRINCE2TM Updated for PRINCE2 TM 2009 and Microsoft® Office Project 2007 ISBN 978-1-921059-29-2 B5 Paperback, 978-1-921059-30-8 A4 Spiral, 978-1-921059-45-2 eBook Planning and Control Using Microsoft® Project and PMBOK® Guide Fourth Edition Including Microsoft Project 2000 to 2007 ISBN 978-1-921059-31-5 B5 Paperback, 978-1-921059-32-2 A4 Spiral, 978-1-921059-46-9 eBook 99 Tricks and Traps for Microsoft® Office Project Including Microsoft® Project 2000 to 2007 ISBN 978-1-921059-19-3 A5 Paperback, 978-1-921059-42-1 eBook Project Planning and Scheduling Using Primavera® Contractor Version 6.1 Including Versions 4.1, 5.0 and 6.1 ISBN 978-1-921059-25-4 A4 Paperback, 978-1-921059-26-1 A4 Spiral, 978-1-921059-47-6 eBook SUPERSEDED BOOKS BY THE AUTHOR Planning and Scheduling Using Microsoft® Project 2000 Planning and Scheduling Using Microsoft® Project 2002 Planning and Scheduling Using Microsoft® Project 2003 Planning and Scheduling Using Microsoft Office Project 2007 PRINCE2TM Planning and Control Using Microsoft® Project Planning and Control Using Microsoft® Project and PMBOK® Guide Third Edition Project Planning and Scheduling Using Primavera Enterprise® - Team Play Version 3.5 Project Planning and Scheduling Using Primavera Enterprise® - P3e & P3e/c Version 3.5 Project Planning and Scheduling Using Primavera® Version 4.1 for IT Project Project Planning and Scheduling Using Primavera® Version 4.1 or E&C Planning and Scheduling Using Primavera® Version 5.0 - For IT Project Office Planning and Scheduling Using Primavera® Version 5.0 - For Engineering & Construction Project Planning & Control Using Primavera® P6 – Updated for Version 6.2 Planning Using Primavera Project Planner P3® Version 2.0 Planning Using Primavera Project Planner P3® Version 3.0 Planning Using Primavera Project Planner P3® Version 3.1 Project Planning Using SureTrak® for Windows Version 2.0 Planning Using Primavera SureTrak® Project Manager Version 3.0
PLANNING AND CONTROL USING MICROSOFT® PROJECT 2010 AND PMBOK® GUIDE FOURTH EDITION
SAMPLE BOOK CHAPTERS COMPLETE BOOK MAY BE PURCHASED FROM www.eh.com.au © Eastwood Harris Pty Ltd v
1 INTRODUCTION 1-1
1.1 Purpose 1-1
1.2 Required Background Knowledge 1-2
1.3 Purpose of Planning 1-2
1.4 Definition of Planning and Control 1-3
1.5 PMBOK® Guide Process Groups and Knowledge Areas 1-3
1.6 Project Planning 1-5
1.7 Levels of Planning 1-5
1.8 Monitoring and Controlling a Project 1-7
1.9 Project Planning Metrics 1-8
1.10 Planning Cycle 1-9
1.11 PMBOK® Guide Processes and Microsoft Project 1-10 2 CREATING A PROJECT SCHEDULE 2-1
2.1 Understanding Planning and Scheduling Software 2-1
2.2 Understanding Your Project 2-2
2.3 Level 1 – Planning Without Resources 2-3
2.3.1 Creating Projects 2-3
2.3.2 Defining the Calendars 2-3
2.3.3 Defining the Work Breakdown Structure - WBS 2-4
2.3.4 Defining Other Project Breakdown Structures 2-5
2.3.5 Project Breakdown Structure Functions in Microsoft Project 2-5
2.3.6 Defining Activities 2-6
2.3.7 Adding Tasks to the Schedule 2-7
2.3.8 Adding the Logic Links 2-8
2.3.9 Constraints 2-9
2.3.10 Risk Analysis 2-9
2.3.11 Stakeholder Analysis 2-9
2.3.12 Scheduling the Project 2-9
2.3.13 Formatting the Display – Views, Tables and Filters 2-10
2.3.14 Printing and Reports 2-10
2.3.15 Issuing and Optimizing the Schedule 2-10
2.4 Level 2 – Monitoring Progress Without Resources 2-11
2.4.1 Setting the Baseline 2-11
2.4.2 Tracking Progress 2-12
2.4.3 Managing Changes 2-12
2.4.4 Performance Measurement and Reporting 2-13
2.4.5 Corrective Action 2-13
2.5 Level 3 – Planning With Resources 2-14
2.5.1 Types of Resourced Schedule 2-14

PLANNING AND CONTROL USING MICROSOFT® PROJECT 2010 AND PMBOK® GUIDE FOURTH EDITION
SAMPLE BOOK CHAPTERS COMPLETE BOOK MAY BE PURCHASED FROM www.eh.com.au © Eastwood Harris Pty Ltd vi
2.5.2 Creating and Using Resources 2-15
2.5.3 Task Types 2-15
2.5.4 Schedule Optimization 2-15
2.6 Level 4 – Monitoring Progress of a Resourced Schedule 2-16
2.6.1 Updating Projects with Resources 2-16
2.6.2 Report Performance 2-16
2.7 Tools and Techniques for Scheduling 2-16
2.8 The Balance Between the Number of Activities and Resources 2-17
2.9 Managing Portfolios, Projects and Work Package Plans 2-17 3 NAVIGATION AND SETTING THE OPTIONS 3-1
3.1 Identify the Parts of the Project Screen 3-1
3.2 Customizing the Screen 3-2
3.2.1 Ribbon Toolbar 3-2
3.2.2 Quick Access Toolbar 3-3
3.3 Microsoft Project 2010 Windows 3-4
3.3.1 Understanding Windows in Microsoft Project 2010 3-4
3.3.2 Creating a New Window 3-4
3.3.3 Managing Windows 3-4
3.3.4 Resizing Windows 3-5
3.3.5 Splitting Views 3-5
3.3.6 Managing Details Forms 3-6
3.4 Status Bar 3-6
3.5 Forms Available from the Ribbon Groups 3-6
3.6 Right-clicking with the Mouse 3-6
3.7 Finding the Task Bars in the Gantt Chart 3-7
3.8 Setting up the Options 3-7
3.8.1 General Tab 3-7
3.8.2 Schedule Tab – Scheduling options for this project: 3-8
3.9 Mouse Pointers 3-10
3.10 Workshop 1 – Navigation and Setting Your Project Options 3-11 4 CREATING PROJECTS AND TEMPLATES 4-1
4.1 Starting Microsoft Project 2010 4-1
4.2 Creating a Blank Project 4-1
4.3 Opening an Existing Project 4-3
4.4 Re-opening a Project 4-3
4.5 Creating a Project Template 4-4
4.6 PMBOK® Guide File Naming Convention 4-4
4.7 Creating a New Project from a Template 4-4
4.8 Saving Additional Project Information 4-5
4.9 Using the Alt Key and Keystrokes to Access Commands 4-5
PLANNING AND CONTROL USING MICROSOFT® PROJECT 2010 AND PMBOK® GUIDE FOURTH EDITION
SAMPLE BOOK CHAPTERS COMPLETE BOOK MAY BE PURCHASED FROM www.eh.com.au © Eastwood Harris Pty Ltd vii
4.10 Saving a Project 4-6
4.11 Closing Microsoft Project 4-6
4.12 Workshop 2 - Creating a Project 4-7 5 DEFINING CALENDARS 5-1
5.1 Calendars and the PMBOK® Guide 5-2
5.2 Editing Calendars 5-2
5.2.1 Editing Working Days to Create Holidays 5-2
5.2.2 Editing a Calendar to Create an Exception 5-4
5.3 Creating a New Calendar 5-5
5.4 Assigning a Calendar to a Project 5-5
5.5 Calculation of Durations in Days 5-6
5.6 Effect on 2007 Calendars When Saving to 2000 – 2003 5-7
5.7 Selecting Dates 5-7
5.8 Workshop 3 Maintaining the Calendars 5-9 6 ADDING TASKS 6-1
6.1 Adding New Tasks 6-2
6.1.1 Adding a Task Under an Existing Task 6-2
6.1.2 Inserting a Task Between Existing Tasks 6-3
6.2 Understanding Change Highlight 6-3
6.3 Copying and Pasting Tasks 6-3
6.4 Milestones 6-4
6.5 Reordering Tasks by Dragging 6-4
6.6 Sorting Tasks 6-5
6.7 Task Information Form 6-5
6.8 Elapsed Durations 6-6
6.9 Indicators Column 6-6
6.10 Assigning Calendars to Tasks 6-7
6.10.1 Assigning a Calendar Using the Task Information Form 6-7
6.10.2 Assigning a Calendar Using a Column 6-7
6.11 Workshop 4 - Adding Tasks 6-9 7 ORGANIZING TASKS USING OUTLINING 7-1
7.1 Creating an Outline 7-1
7.2 Promoting and Demoting Tasks 7-2
7.3 Summary Task Duration Calculation 7-3
7.4 Summarizing Tasks 7-3
7.4.1 Summarize and Expand Summary Tasks to Show and Hide Subtasks 7-3
7.4.2 Roll Up All Tasks to an Outline Level 7-4
7.5 Project Summary Task 7-4
7.6 Workshop 5 - Entering Summary Tasks 7-5 8 FORMATTING THE DISPLAY 8-1

PLANNING AND CONTROL USING MICROSOFT® PROJECT 2010 AND PMBOK® GUIDE FOURTH EDITION
SAMPLE BOOK CHAPTERS COMPLETE BOOK MAY BE PURCHASED FROM www.eh.com.au © Eastwood Harris Pty Ltd viii
8.1 Formatting the Columns 8-2
8.1.1 Understanding Custom Fields 8-2
8.1.2 Inserting Columns 8-2
8.1.3 Format Columns Group 8-2
8.1.4 Deleting Columns 8-3
8.1.5 Adjusting the Width of Columns 8-3
8.1.6 Moving Columns 8-3
8.1.7 Formatting Columns Using the Table Function 8-4
8.2 Formatting Time Units 8-6
8.3 Formatting the Bars 8-6
8.3.1 Formatting All Task Bars Using the Bar Styles Form 8-7
8.3.2 Format Bar Styles Group Menu 8-9
8.3.3 Gantt Chart Styles Group Menu 8-9
8.3.4 Formatting Bars Using the Gantt Chart Wizard 8-10
8.4 Row Height 8-10
8.4.1 Setting Row Heights 8-10
8.4.2 Wrap Text Command 8-10
8.5 Format Fonts 8-11
8.5.1 Format Individual Cells Font Command 8-11
8.5.2 Format Text Styles 8-11
8.6 Format Timescale 8-12
8.6.1 Zoom Slider 8-12
8.6.2 Ribbon Menu 8-12
8.6.3 Format Timescale Command 8-13
8.6.4 Format Timescale Font 8-15
8.7 Format Gridlines 8-15
8.8 Format Links, Dependencies, Relationships, or Logic Lines 8-16
8.9 Format Colors 8-17
8.10 Workshop 6 - Formatting the Bar Chart 8-19 9 ADDING TASK DEPENDENCIES 9-1
9.1 Understanding Dependencies 9-3
9.2 Understanding Lags and Leads 9-4
9.3 Restrictions on Summary Task Dependencies 9-5
9.4 Displaying the Dependencies on the Gantt Chart 9-6
9.4.1 Graphically Adding a Dependency 9-6
9.4.2 Using the Link and Unlink Buttons 9-6
9.4.3 Task Linking Using the Keyboard 9-7
9.4.4 Adding and Deleting Predecessors with the Task Information Form 9-7
9.4.5 Predecessor and Successor Details Forms 9-8
9.4.6 Editing or Deleting Dependencies Using the Task Dependency Form 9-9

PLANNING AND CONTROL USING MICROSOFT® PROJECT 2010 AND PMBOK® GUIDE FOURTH EDITION
SAMPLE BOOK CHAPTERS COMPLETE BOOK MAY BE PURCHASED FROM www.eh.com.au © Eastwood Harris Pty Ltd ix
9.4.7 Autolink New Inserted Tasks or Moved Tasks 9-9
9.4.8 Editing Relationships Using the Predecessor or Successor Columns 9-9
9.5 Scheduling the Project 9-10
9.6 Workshop 7- Adding the Relationships 9-11 10 NETWORK DIAGRAM VIEW 10-1
10.1 Understanding the Network Diagram View 10-2
10.2 Adding and Deleting Tasks in the Network Diagram View 10-2
10.3 Adding, Editing and Deleting Dependencies 10-3
10.4 Formatting the Task Boxes 10-3
10.5 Formatting Individual Boxes 10-4
10.6 Formatting the Display and Relationship Lines 10-4
10.7 Early Date, Late Date and Float/Slack Calculations 10-6
10.8 Workshop 8 - Scheduling Calculations 10-7 11 CONSTRAINTS 11-1
11.1 Assigning Constraints 11-3
11.1.1 Using the Task Information Form 11-3
11.1.2 Using the Constraint Type and Constraint Date Column 11-3
11.1.3 Typing a Date into the Task Information or Details Form 11-4
11.1.4 Using the Task Details Form 11-4
11.2 Deadline Date 11-5
11.3 Changing Manually Scheduled Tasks to Auto Scheduled 11-5
11.4 Task Notes 11-6
11.5 Workshop 9 - Constraints 11-7 12 FILTERS 12-1
12.1 Understanding Filters 12-1
12.2 Understanding the Filter Menu 12-2
12.3 Applying an Existing Filter 12-3
12.4 Creating and Modifying Filters 12-4
12.5 Defining Filter Criteria 12-6
12.5.1 Simple Filters, Operator and Wild Cards 12-6
12.5.2 And/Or Filters 12-8
12.5.3 Multiple And/Or 12-9
12.5.4 Interactive Filter 12-9
12.6 AutoFilters 12-10
12.7 Workshop 10 - Filters 12-13 13 TABLES AND GROUPING TASKS 13-1
13.1 Understanding Project Breakdown Structures 13-2
13.2 Tables 13-2
13.2.1 Applying a Table to a View 13-3
13.2.2 Creating and Editing a Table 13-3

PLANNING AND CONTROL USING MICROSOFT® PROJECT 2010 AND PMBOK® GUIDE FOURTH EDITION
SAMPLE BOOK CHAPTERS COMPLETE BOOK MAY BE PURCHASED FROM www.eh.com.au © Eastwood Harris Pty Ltd x
13.3 Custom Fields 13-4
13.4 Grouping 13-7
13.4.1 Group by: Function 13-8
13.4.2 Using a Predefined Group 13-9
13.4.3 Creating a New Group 13-9
13.4.4 Grouping Resources in the Resource Sheet 13-10
13.5 Workshop 11 - Reorganizing the Schedule 13-11 14 VIEWS AND DETAILS 14-1
14.1 Understanding Views 14-4
14.2 Creating a New View 14-5
14.2.1 Creating a New Single View 14-5
14.2.2 Creating a Combination View 14-6
14.2.3 Copying and Editing a View 14-7
14.2.4 Copying a View to and from Another Project 14-7
14.3 Details Form 14-8
14.4 Timeline View 14-8
14.5 A Logical Process for Developing a View 14-9
14.6 Workshop 12- Organizing Your Data Using Views and Tables 14-11 15 PRINTING AND REPORTS 15-1
15.1 Printing 15-1
15.2 File, Print Form 15-2
15.2.1 Print and Printer Heading 15-2
15.2.2 Setting Heading 15-2
15.2.3 Buttons at the Bottom Right Hand Side of Print Form 15-3
15.3 Page Setup 15-3
15.3.1 Page Tab 15-4
15.3.2 Margins Tab 15-5
15.3.3 Header, Legend and Footer Tabs 15-6
15.3.4 Legend Tab 15-7
15.3.5 View Tab 15-8
15.4 Manual Page Breaks 15-9
15.5 Reports 15-10
15.5.1 Visual Reports 15-10
15.5.2 Reports 15-11
15.6 Completed Schedule Check List 15-12
15.7 Workshop 13 - Reports 15-13 16 TRACKING PROGRESS 16-1
16.1 Setting the Baseline 16-2
16.1.1 Setting Baseline Dates 16-2
16.1.2 Clearing and Resetting the Baseline 16-3

PLANNING AND CONTROL USING MICROSOFT® PROJECT 2010 AND PMBOK® GUIDE FOURTH EDITION
SAMPLE BOOK CHAPTERS COMPLETE BOOK MAY BE PURCHASED FROM www.eh.com.au © Eastwood Harris Pty Ltd xi
16.1.3 Displaying the Baseline Data 16-3
16.2 Practical Methods of Recording Progress 16-4
16.3 Understanding Tracking Progress Concepts 16-6
16.3.1 Task Lifecycle 16-6
16.3.2 Actual Start Date Assignment 16-6
16.3.3 Calculation of Actual & Remaining Durations of an In-Progress Task 16-6
16.3.4 Calculating the Early Finish Date of an In-Progress Task 16-7
16.3.5 Updating Completed tasks 16-9
16.3.6 Summary Bars Progress Calculation 16-9
16.3.7 Understanding the Current Date, Status Date & Update Project Date 16-9
16.4 Updating the Schedule 16-11
16.4.1 Move Project 16-11
16.4.2 Using Update Project 16-12
16.4.3 Update Tasks Form 16-13
16.4.4 Updating Tasks Using the Task Information Form 16-13
16.4.5 Updating Tasks Using the Task Details Form 16-14
16.4.6 Updating Tasks Using Columns 16-14
16.4.7 Reschedule Uncompleted Work To Start After 16-15
16.4.8 Updating Tasks Using Task, Schedule Functions 16-17
16.5 Simple Procedure for Updating a Schedule 16-17
16.6 Procedure for Detailed Updating 16-18
16.7 Comparing Progress with Baseline 16-19
16.8 In-Progress Schedule Check List 16-20
16.9 Corrective Action 16-21
16.10 Workshop 14 - Updating the Schedule and Baseline Comparison 16-23 17 CREATING RESOURCES AND COSTS 17-1
17.1 Creating Resources in the Resource Sheet 17-2
17.2 Grouping Resources in the Resource Sheet 17-3
17.3 Resource Information Form 17-4
17.3.1 General Tab 17-4
17.3.2 Costs Tab 17-5
17.3.3 Notes 17-5
17.3.4 Custom Fields 17-5
17.4 Resource Calendars 17-6
17.4.1 Editing a Resource calendar 17-6
17.4.2 Resource Calendars Calculations 17-6
17.4.3 Issues Using Resource Calendars 17-8
17.5 Workshop 15 - Defining Resources 17-9

PLANNING AND CONTROL USING MICROSOFT® PROJECT 2010 AND PMBOK® GUIDE FOURTH EDITION
SAMPLE BOOK CHAPTERS COMPLETE BOOK MAY BE PURCHASED FROM www.eh.com.au © Eastwood Harris Pty Ltd xii
18 ASSIGNING RESOURCES AND COSTS TO TASKS 18-1
18.1 Fixed Costs 18-2
18.2 Assigning Work without a Resource 18-2
18.3 Resource Definitions 18-3
18.4 Task Type and Effort-Driven 18-3
18.4.1 Task Type – Fixed Duration, Fixed Units, Fixed Work 18-3
18.4.2 Effort-Driven 18-4
18.5 Resource Calendars 18-4
18.6 Assigning Resources using the Resource Assignment Form 18-5
18.7 Assigning Resources Using the Task Details Form 18-6
18.8 Assigning Resources Using the Task Information Form 18-7
18.9 Assigning Resources from the Resource Column 18-7
18.10 Assignment of Resources to Summary Tasks 18-7
18.11 Rollup of Costs and Hours to Summary Tasks 18-8
18.12 Contour the Resource Assignment 18-9
18.13 Workshop 16 - Assigning Resources to Tasks 18-11 19 RESOURCE OPTIMIZATION 19-1
19.1 Resource Graph Form 19-2
19.2 Resource Graph View 19-2
19.3 Resource Tables View 19-4
19.4 Detailed Styles Form 19-5
19.5 Creating an S-Curve from Microsoft Project 19-5
19.6 Team Planner View 19-6
19.7 Printing Resource Profiles and Tables 19-7
19.8 Creating Resource Graphs, Crosstab Tables, S-Curves in a Spreadsheet 19-7
19.8.1 Export Time Phased Data Using Visual Reports 19-7
19.8.2 Export Using Time Phased Data Copy and Paste 19-8
19.8.3 Creating S-Curves in Excel 19-9
19.9 Resource Optimization 19-10
19.9.1 Resource Optimization through Leveling 19-10
19.9.2 Other Methods of Resolving Resource Peaks and Conflicts 19-10
19.9.3 Resource Leveling Function 19-11
19.9.4 Resource, Level group Ribbon Commands 19-12
19.10 Workshop 17 – Resource Graphs and Tables 19-13 20 UPDATING PROJECTS WITH RESOURCES 20-1
20.1 Understanding Baseline Dates, Duration, Costs and Hours 20-2
20.2 Understanding the Status Date 20-3
20.3 Formatting the Current Date and Status Date Lines 20-4
20.4 Information Required to Update a Resourced Schedule 20-5
20.5 Updating Dates and Percentage Complete 20-5

PLANNING AND CONTROL USING MICROSOFT® PROJECT 2010 AND PMBOK® GUIDE FOURTH EDITION
SAMPLE BOOK CHAPTERS COMPLETE BOOK MAY BE PURCHASED FROM www.eh.com.au © Eastwood Harris Pty Ltd xiii
20.6 Updating Resources 20-6
20.6.1 Updating Tasks with Fixed Costs Only 20-6
20.6.2 Forecasting Resource Hours 20-7
20.6.3 Forecasting Resource Hours and Costs Form 20-8
20.6.4 Using the Task Usage and Resource Usage Views 20-9
20.7 Splitting Tasks 20-10
20.8 Summary Tasks and Earned Value 20-11
20.9 Workshop 18 - Updating a Resourced Schedule 20-13 21 PROJECT OPTIONS 21-1
21.1 General 21-2
21.1.1 User Interface Options 21-2
21.1.2 Project view 21-2
21.1.3 Personalize your copy of Microsoft Office 21-3
21.2 Display 21-3
21.2.1 Calendar 21-4
21.2.2 Currency options for this project: 21-4
21.2.3 Show indicators and options buttons for: 21-4
21.2.4 Show these elements 21-4
21.3 Schedule 21-5
21.3.1 Calendar options for this project: 21-5
21.3.2 Schedule 21-7
21.3.3 Scheduling options for this project: 21-7
21.3.4 Schedule Alerts 21-10
21.3.5 Calculation 21-10
21.3.6 Calculation Options for this project: 21-11
21.4 Proofing 21-13
21.5 Save 21-14
21.5.1 Save projects 21-14
21.5.2 Save templates 21-15
21.5.3 Cache 21-15
21.6 Language 21-15
21.7 Advanced 21-16
21.7.1 General 21-16
21.7.2 Project Web App 21-17
21.7.3 Planning Wizard 21-17
21.7.4 General Options 21-17
21.7.5 Edit 21-18
21.7.6 Display 21-18
21.7.7 Display Options for this Project 21-19
21.7.8 Cross project linking options for this project: 21-20

PLANNING AND CONTROL USING MICROSOFT® PROJECT 2010 AND PMBOK® GUIDE FOURTH EDITION
SAMPLE BOOK CHAPTERS COMPLETE BOOK MAY BE PURCHASED FROM www.eh.com.au © Eastwood Harris Pty Ltd xiv
21.7.9 Earned Value options for this project: 21-20
21.7.10 Calculation options for this project: 21-20
21.8 Customize Ribbon 21-22
21.9 Quick Access Toolbar 21-22
21.10 Add-Ins 21-23
21.11 Trust Center 21-23
21.11.1 Macro Settings 21-24
21.11.2 Legacy Formats. 21-24
21.11.3 Privacy Options 21-25
21.12 Authors Recommended Setup for New Projects 21-25
21.13 Commands Removed From the Microsoft Project 2007 Options, View Form 21-26 22 MORE ADVANCED SCHEDULING 22-1
22.1 Working with Hourly Calendars 22-1
22.1.1 Adjusting Calendar Default Working Hours 22-1
22.1.2 Creating Calendar Periods with Alternate Working Hours 22-2
22.1.3 Working with Calendars with Different Hours per Day 22-3
22.1.4 Understanding Default Start and Default End Time 22-4
22.2 Managing Calendars 22-5
22.2.1 Deleting a Calendar 22-5
22.2.2 Copying Calendars between Projects 22-5
22.2.3 Renaming a Calendar 22-5
22.2.4 Copying a Base Calendar to Global.mpt for Use in Future Projects 22-5
22.2.5 Printing the Calendar 22-6
22.2.6 Display Times in 24-Hour Clock 22-6
22.3 Adding Tasks 22-7
22.3.1 Task Scheduling Mode - Manually Scheduled or Auto Scheduled 22-7
22.3.2 Copying Tasks from Other Programs 22-9
22.3.3 Dynamically Linking Cells to Other Programs 22-10
22.3.4 Milestones with a Duration 22-11
22.3.5 Splitting a In-progress Task 22-11
22.4 Formatting Bars 22-12
22.4.1 Format One or More Specific Task Bars 22-12
22.4.2 Hiding the Task Bar 22-13
22.4.3 Layout Form – Format Bars Options (Date, Height and Rollup) 22-13
22.5 Task Splitting 22-15
22.5.1 Splitting Tasks 22-15
22.5.2 Show bars splits 22-15
22.5.3 Bar Split Dates. 22-15
22.5.4 Split Task Duration 22-15
22.6 Logic 22-16

PLANNING AND CONTROL USING MICROSOFT® PROJECT 2010 AND PMBOK® GUIDE FOURTH EDITION
SAMPLE BOOK CHAPTERS COMPLETE BOOK MAY BE PURCHASED FROM www.eh.com.au © Eastwood Harris Pty Ltd xv
22.6.1 Unique ID Predecessor or Unique ID Successor Columns 22-16
22.6.2 Reviewing Relationships Using WBS Predecessor or Successor Columns 22-16
22.6.3 Task Drivers 22-16
22.6.4 Manually Scheduled Relationships 22-18
22.6.5 Schedule From Project Finish Date 22-18
22.6.6 Move Project 22-19
22.7 Custom Outline Codes and WBS 22-20
22.7.1 Custom Outline Codes 22-20
22.7.2 Define a Custom Outline Code 22-20
22.7.3 Outline Codes 22-24
22.7.4 User Defined WBS Function 22-24
22.8 Sharing Resources with Other Projects 22-26
22.9 Tracking Progress 22-27
22.9.1 Setting an Interim Baseline 22-27
22.9.2 Resetting the Baseline Using “Roll Up Baselines” 22-28
22.9.3 Status Date Calculation Options - New Tasks 22-31
22.9.4 Status Date Calculation Options - When Updating a Schedule 22-33
22.9.5 Stop and Resume Dates 22-33
22.9.6 Marking Up Summary Tasks 22-34
22.9.7 Moving Tasks Using Task, Tasks group Move 22-35
22.9.8 Progress Lines and Variance Columns 22-36 23 TOOLS AND TECHNIQUES FOR SCHEDULING 23-1
23.1 Understanding Menu Options 23-1
23.2 Cut, Copy and Paste Row 23-1
23.3 Cut, Copy and Paste Cell 23-1
23.4 Copy Picture 23-2
23.5 Fill Down 23-2
23.6 Clear Contents 23-3
23.7 Find and Replace 23-3
23.8 Go To 23-3
23.9 Insert Recurring Task 23-3
23.10 Copy or Cut-and-Paste to and from Spreadsheets 23-4
23.11 Paste Link – Cell Values in Columns 23-4
23.12 Unique Task, Resource and Assignment ID 23-4
23.12.1 Task Unique ID 23-4
23.12.2 Resource Unique ID 23-5
23.12.3 Resource Assignment Unique ID 23-5
23.13 Organizer 23-5
23.14 File Types 23-6
23.15 Recording a Macro 23-7

PLANNING AND CONTROL USING MICROSOFT® PROJECT 2010 AND PMBOK® GUIDE FOURTH EDITION
SAMPLE BOOK CHAPTERS COMPLETE BOOK MAY BE PURCHASED FROM www.eh.com.au © Eastwood Harris Pty Ltd xvi
24 WHAT IS NEW IN MICROSOFT PROJECT 2010 24-1
24.1 The Ribbon 24-2
24.2 The File Tab 24-2
24.3 Task Scheduling Mode - Manually Scheduled or Auto Scheduled 24-2
24.4 Task Inspector 24-3
24.5 Move Project 24-3
24.6 Top-down Summary Tasks 24-4
24.7 Renaming Columns 24-4
24.8 Add a New Column Using “Add New Column” Column 24-4
24.9 Zoom Slider 24-5
24.10 Zoom Command on Ribbon menu 24-5
24.11 Marking a Task Inactive 24-6
24.12 Multiple Task Linking 24-6
24.13 Wrap Text Command 24-6
24.14 Insert Summary Task 24-6
24.15 Right Mouse Clicking 24-7
24.16 Gantt Chart Styles Group Menu 24-7
24.17 Format Individual Cells Font Command 24-7
24.18 New Timeline and Team Planner Views 24-8
24.18.1 Timeline View 24-8
24.18.2 Team Planner View 24-9
24.19 Maintain Hierarchy in Current Group 24-9
24.20 AutoFilters 24-10
24.21 Using the Alt Key and Keystrokes to Access Commands 24-11
24.22 Assigning Resources from the Resource Column 24-11
24.23 Copy and Paste Enhancements 24-12
24.24 Display Number of Recently Opened Files 24-12
24.25 Automatically Add New Views, Tables, Filters, and Groups to the Global 24-12
24.26 Compatibility with Earlier Project Versions 24-13
24.27 Status Bar 24-13
24.28 Improvements in collaboration - SharePoint list Synchronization 24-13 25 APPENDIX 1 – SCREENS USED TO CREATE VIEWS 25-1 26 INDEX 26-1
PLANNING AND CONTROL USING MICROSOFT® PROJECT 2010 AND PMBOK® GUIDE FOURTH EDITION
SAMPLE BOOK CHAPTERS COMPLETE BOOK MAY BE PURCHASED FROM www.eh.com.au © Eastwood Harris Pty Ltd 8-1
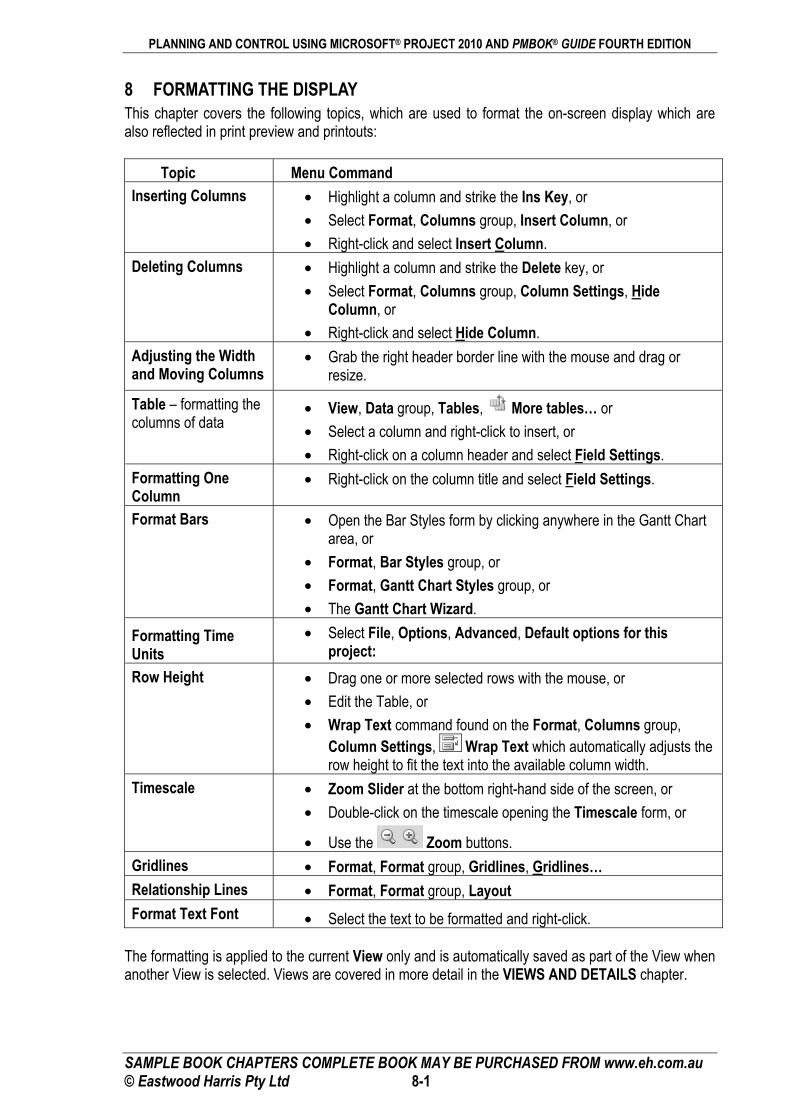
8 FORMATTING THE DISPLAY This chapter covers the following topics, which are used to format the on-screen display which are also reflected in print preview and printouts:
Topic Menu Command Inserting Columns • Highlight a column and strike the Ins Key, or
• Select Format, Columns group, Insert Column, or • Right-click and select Insert Column.
Deleting Columns • Highlight a column and strike the Delete key, or • Select Format, Columns group, Column Settings, Hide
Column, or • Right-click and select Hide Column.
Adjusting the Width and Moving Columns
• Grab the right header border line with the mouse and drag or resize.
Table – formatting the columns of data
• View, Data group, Tables, More tables… or • Select a column and right-click to insert, or • Right-click on a column header and select Field Settings.
Formatting One Column
• Right-click on the column title and select Field Settings.
Format Bars • Open the Bar Styles form by clicking anywhere in the Gantt Chart area, or
• Format, Bar Styles group, or • Format, Gantt Chart Styles group, or • The Gantt Chart Wizard.
Formatting Time Units
• Select File, Options, Advanced, Default options for this project:
Row Height • Drag one or more selected rows with the mouse, or • Edit the Table, or • Wrap Text command found on the Format, Columns group,
Column Settings, Wrap Text which automatically adjusts the row height to fit the text into the available column width.
Timescale • Zoom Slider at the bottom right-hand side of the screen, or • Double-click on the timescale opening the Timescale form, or
• Use the Zoom buttons. Gridlines • Format, Format group, Gridlines, Gridlines… Relationship Lines • Format, Format group, Layout Format Text Font • Select the text to be formatted and right-click.
The formatting is applied to the current View only and is automatically saved as part of the View when another View is selected. Views are covered in more detail in the VIEWS AND DETAILS chapter.

PLANNING AND CONTROL USING MICROSOFT® PROJECT 2010 AND PMBOK® GUIDE FOURTH EDITION
SAMPLE BOOK CHAPTERS COMPLETE BOOK MAY BE PURCHASED FROM www.eh.com.au © Eastwood Harris Pty Ltd 8-2
8.1 Formatting the Columns Microsoft Project has some column formatting functions which are intended to make it simple to add and format a new column. There are two methods of formatting the columns: • Inserting, editing and deleting columns of data using the Column Definition form. • Tables – A table may be created or an existing table edited with required columns using the
Table Definition form. You may set up the data columns in the way you want to see the information on the screen and in printouts. Therefore Tables may be created, edited and deleted and you may select which one is used to display the data with each View. One Table may be used with more than one View.
i
As time progresses with the option File, Options, Advanced, Automatically add new views, tables, filters, and groups to the global activated, a project that is created from the Blank Project will have many Views, Tables and Filters from old projects that may be irrelevant to the current project and it is suggested this be turned off.
8.1.1 Understanding Custom Fields A Custom Field is a task or resource field that may be renamed and user defined data entered in columns. These fields may be formatted only to accept specific data such as dates, costs, durations or text. These are covered in more detail in the TABLE AND GROUPING TASKS chapter.
8.1.2 Inserting Columns Insert a column by clicking on the column title where you require the new column. This will highlight the column. To insert a new column:
• Select Format, Columns group, Insert, Column… , or • Hit the Ins Key, or
• Right-click and select Insert Column… . Then select the column from the drop-down list. – • You may immediately start typing, which will take you to the appropriate position in the list. • In Microsoft Project 2010, when a column name that does not exist is typed into the header, then
an existing Text column will be renamed with the new title. Therefore the inserted column is a renamed text Custom Field.
8.1.3 Format Columns Group The Format, Columns group has the following functions:
• – Aligns the text to the left, center or right,
• – Wraps Text and increases the row height so all text is visible,
• – Column Settings has: – Hide Column which hides a
column but does not delete the data.

PLANNING AND CONTROL USING MICROSOFT® PROJECT 2010 AND PMBOK® GUIDE FOURTH EDITION
SAMPLE BOOK CHAPTERS COMPLETE BOOK MAY BE PURCHASED FROM www.eh.com.au © Eastwood Harris Pty Ltd 8-3
– Field Settings that opens the Field Settings form: NOTE: The picture displays Text2 Custom Field that has been renamed Contractor.
– Data Type which allows the data type of a Custom Field to be changed.
i
This will result in the loss of data if a field is changed, say for example from Text to Cost.
– Display Add New Column is a function new to Microsoft Project 2010. A column may be permanently displayed on the right-hand side of the screen titled Add New Column and clicking on this column will open up a drop-down box for the selection of the data type. This option will display or hide this column.
– Insert Column inserts a new column.
• Custom Fields opens the Custom Fields form covered in the TABLE AND GROUPING TASKS chapter.
8.1.4 Deleting Columns Delete a column by highlighting the column or by clicking on the title. Then:
• Select Column Settings, Hide Column, • Hit the Delete key, or • Right-click and select Hide Column.
i
1. There will be no confirmation of deleting a column, but you are allowed to undo the deletion.
2. The term “hide” means the column is removed from the Table in this project but the data is not deleted.
8.1.5 Adjusting the Width of Columns You may adjust the width of the column either manually or automatically. • For manual adjustment, move the mouse pointer to the right vertical line of the column in the
header. A mouse arrow will then appear and enable the column to be adjusted.
• For automatic adjustment, once again position the mouse pointer to the right vertical line of the column in the header and double left-click the mouse. The column width will automatically adjust to the best fit.
8.1.6 Moving Columns Columns in a Table may be moved by clicking on the column header. The mouse pointer will change to a and the column may be dragged to a new location.
PLANNING AND CONTROL USING MICROSOFT® PROJECT 2010 AND PMBOK® GUIDE FOURTH EDITION
SAMPLE BOOK CHAPTERS COMPLETE BOOK MAY BE PURCHASED FROM www.eh.com.au © Eastwood Harris Pty Ltd 8-4
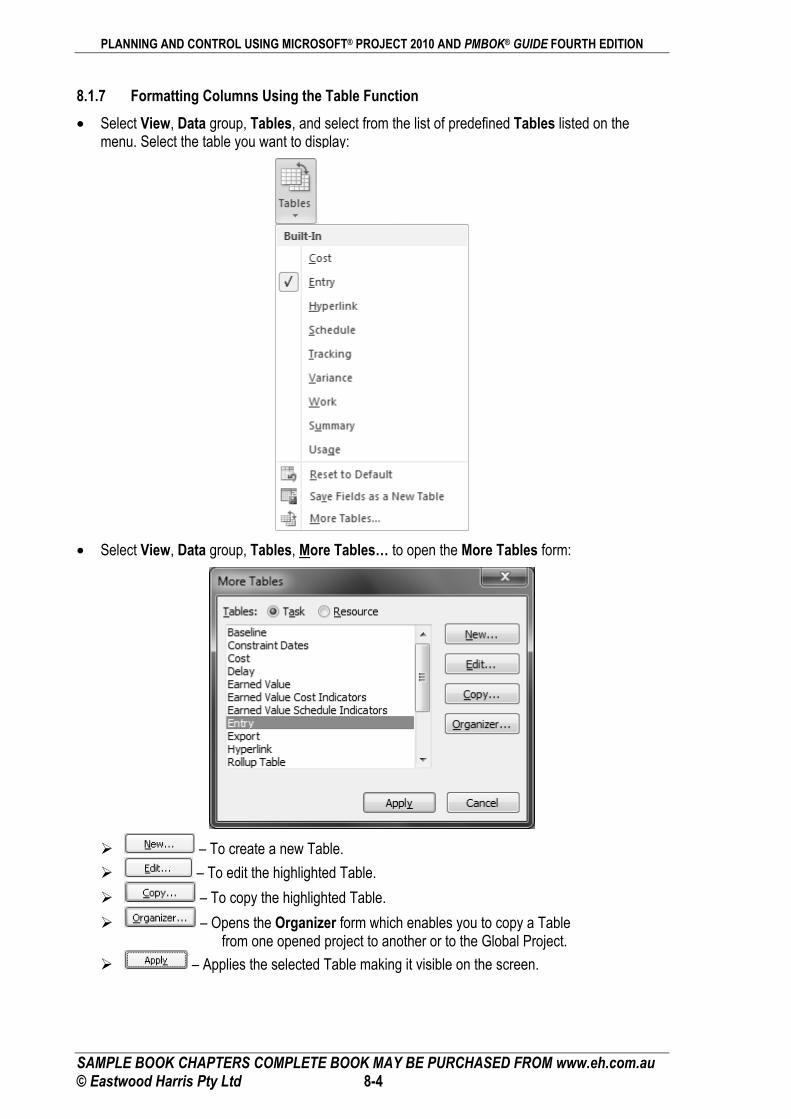
8.1.7 Formatting Columns Using the Table Function • Select View, Data group, Tables, and select from the list of predefined Tables listed on the
menu. Select the table you want to display:
• Select View, Data group, Tables, More Tables… to open the More Tables form:
– To create a new Table. – To edit the highlighted Table. – To copy the highlighted Table. – Opens the Organizer form which enables you to copy a Table
from one opened project to another or to the Global Project. – Applies the selected Table making it visible on the screen.
PLANNING AND CONTROL USING MICROSOFT® PROJECT 2010 AND PMBOK® GUIDE FOURTH EDITION
SAMPLE BOOK CHAPTERS COMPLETE BOOK MAY BE PURCHASED FROM www.eh.com.au © Eastwood Harris Pty Ltd 8-5
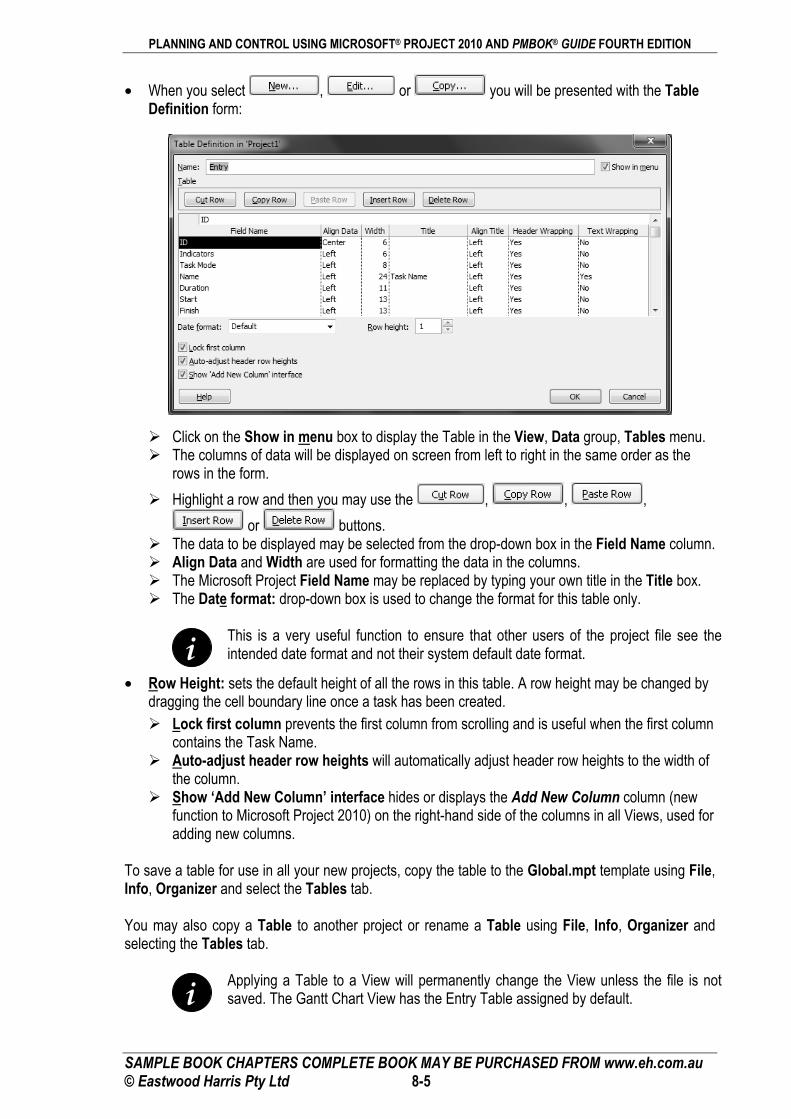
• When you select , or you will be presented with the Table Definition form:
Click on the Show in menu box to display the Table in the View, Data group, Tables menu. The columns of data will be displayed on screen from left to right in the same order as the
rows in the form. Highlight a row and then you may use the , , ,
or buttons. The data to be displayed may be selected from the drop-down box in the Field Name column. Align Data and Width are used for formatting the data in the columns. The Microsoft Project Field Name may be replaced by typing your own title in the Title box. The Date format: drop-down box is used to change the format for this table only.
i
This is a very useful function to ensure that other users of the project file see the intended date format and not their system default date format.
• Row Height: sets the default height of all the rows in this table. A row height may be changed by dragging the cell boundary line once a task has been created.
Lock first column prevents the first column from scrolling and is useful when the first column contains the Task Name.
Auto-adjust header row heights will automatically adjust header row heights to the width of the column.
Show ‘Add New Column’ interface hides or displays the Add New Column column (new function to Microsoft Project 2010) on the right-hand side of the columns in all Views, used for adding new columns.
To save a table for use in all your new projects, copy the table to the Global.mpt template using File, Info, Organizer and select the Tables tab. You may also copy a Table to another project or rename a Table using File, Info, Organizer and selecting the Tables tab.
i
Applying a Table to a View will permanently change the View unless the file is not saved. The Gantt Chart View has the Entry Table assigned by default.

PLANNING AND CONTROL USING MICROSOFT® PROJECT 2010 AND PMBOK® GUIDE FOURTH EDITION
SAMPLE BOOK CHAPTERS COMPLETE BOOK MAY BE PURCHASED FROM www.eh.com.au © Eastwood Harris Pty Ltd 8-6
8.2 Formatting Time Units Select File, Options, Advanced, Default options for this project:
• The Display options for this project: always specifies the time units, for example day, dy or d. • Uncheck the Add space before label check box to remove a space between the value and label
in date columns which allows a narrower Duration column to be displayed.
i
To make the Duration column width narrow, Days: should be set to d and the Add space before label unchecked. The column header could also be edited to Dur to ensure the header is also narrow. This will provide more space for other data.
8.3 Formatting the Bars Microsoft Project has several options for bar formatting: • All the bars may be formatted to suit user definable parameters, or • Individual bars may be formatted. This section will cover the formatting of all the bars and the next section will cover formatting individual bars. Most formatting only affects the current View. All bars in the Gantt Chart may be formatted to suit your requirements for display by: • Opening the Bar Styles form by double-clicking anywhere in the Gantt Chart area, or • Format, Bar Styles group, or • Format, Gantt Chart Styles group, or • The Gantt Chart Wizard, which is a simple way to format bars.
i
Many of the formatting menu options are designed for a schedule created from a Microsoft Project 2010 template. Some menu options will not operate as expected if you have opened a project created in an earlier version of Microsoft Project. For example, the author found the baseline bar was placed on top of the current schedule bar using the Ribbon commands. Users may have to use the manual method of formatting bars by opening the bars form.

PLANNING AND CONTROL USING MICROSOFT® PROJECT 2010 AND PMBOK® GUIDE FOURTH EDITION
SAMPLE BOOK CHAPTERS COMPLETE BOOK MAY BE PURCHASED FROM www.eh.com.au © Eastwood Harris Pty Ltd 8-7
8.3.1 Formatting All Task Bars Using the Bar Styles Form To format all the bars you must open the Bar Style form by: • Double-click anywhere in the Gantt Chart area, but not on an existing bar, as this will open the
Format Bar form for formatting an individual bar, or • Select Format, Bar Styles group, Format, Bar:
The following notes are the main points for using this function. Detailed information is available in the Help facility by searching for “Bar styles dialog box.” • Each bar listed in the table will be displayed on the bar chart.
• Bars may be deleted with the button, pasted using the button and new bars inserted using the button.
• The Name is the title you may assign to the bar and is displayed in the printout legend. To hide the bar on the legend precede the Name with an *. There are many bars with an * by them as default, as displayed in the picture above.
• The appearance of each bar is edited in the lower half of the form. The bar’s start point, middle and end points may have their color, shape, pattern, etc. formatted.
• When a new Milestone is created, the From and To must both be set to Task Finish. • Show For … Tasks allows you to select which tasks are displayed, similar to a filter. More than
one task type may be displayed by separating each type with a “,”. Bar types not required are prefixed with “Not.” For example, the Normal,Rolled Up,Split,Not Summary bar would not display a bar for a summary task. Should you leave this cell blank then all task types will be displayed in this format.
i
The bars may be placed on one of four rows numbered from 1 to 4, top to bottom. If multiple bars are placed on the same row then the bar at the top of the list will be drawn first and the ones lower down the list will be drawn over the top, thus potentially hiding the ones below in the list.

PLANNING AND CONTROL USING MICROSOFT® PROJECT 2010 AND PMBOK® GUIDE FOURTH EDITION
SAMPLE BOOK CHAPTERS COMPLETE BOOK MAY BE PURCHASED FROM www.eh.com.au © Eastwood Harris Pty Ltd 8-8
• From and To allow you to establish where the bars start and finish. The picture below shows how to format Total Float, Free Float and Negative Float. Unlike some other planning and scheduling software, the Negative Float is drawn from the Start Date of a task and not the Finish Date and therefore a separate bar is required for Negative and Positive Float.
i
The Negative Float bar is not automatically displayed by any Microsoft Project function, nor is it included in any View. This is one of the most important bars to show when a project finish date has been set using a constraint and this must always be manually created. You may wish to consider recording a macro to create the bar and this can be run when a negative float bar is required. Recording a macro is covered in para 23.15.
• The Text tab allows you to place text inside or around the bar:
• It is not possible to format the font in the Bar Styles form. Select Format, Format group Text Styles to open the Text Styles form and select the bar text font.
To show Critical and Non-critical tasks, the bars should be formatted as shown below, with particular attention paid to the Show For … Tasks column. Non-critical Tasks are formatted as Normal, Non-critical and Critical Tasks as Normal, Critical.

PLANNING AND CONTROL USING MICROSOFT® PROJECT 2010 AND PMBOK® GUIDE FOURTH EDITION
SAMPLE BOOK CHAPTERS COMPLETE BOOK MAY BE PURCHASED FROM www.eh.com.au © Eastwood Harris Pty Ltd 8-9
8.3.2 Format Bar Styles Group Menu Select the Format, Bar Styles group to view this group of commands:
• Format has two options: Bar formats of one or more selected bars and is covered in the next section. Bar Styles opens the Bar Styles form as discussed above to format all bars.
• The other buttons in the Format, Bar Styles groups will hide or display the bars as indicated, but these may not give the expected results with a project created in an earlier version of Microsoft Project.
Critical Tasks shades the Critical Tasks red. Slack displays the Free Float and NOT Total Float bar. Late Tasks displays tasks that are late compared to the Status Date. Baseline displays the Baseline bar. Slippage displays how much time the task is behind the Baseline.
i
Many of the formatting menu options are designed for a schedule created from a Microsoft Project 2010 template. Some menu options will not operate as expected if you have opened a project created in an earlier version of Microsoft Project. For example the author found the baseline bar was placed on top of the current schedule bar using the Ribbon commands. Users may have to use the manual method of formatting bars by opening the bars form or using the Gantt Chart Wizard.
8.3.3 Gantt Chart Styles Group Menu Select Format, Gantt Chart Styles group to see the option for coloring bars. This function is new to Microsoft Project 2010. The button at the bottom right-hand side opens the Bar Styles form.
i See warning above.
Click here to open the Bar Styles form

PLANNING AND CONTROL USING MICROSOFT® PROJECT 2010 AND PMBOK® GUIDE FOURTH EDITION
SAMPLE BOOK CHAPTERS COMPLETE BOOK MAY BE PURCHASED FROM www.eh.com.au © Eastwood Harris Pty Ltd 8-10
8.3.4 Formatting Bars Using the Gantt Chart Wizard The Gantt Chart Wizard is a popular function for people who used earlier versions of Microsoft Project. The wizard will overwrite any formatting you may have created. This is a straightforward method of formatting your bars and often this is the best method of formatting bars. It is very simple to use but will not display the Negative Float and Free Float bars. These will have to be added manually using the Bar Style form as described in the Bar Styles form section.
i
If the Gantt Chart Wizard button is not on your Microsoft Project default toolbars then this may be added to either the Quick Access Toolbar or the Ribbon. The author found that projects formatted with the Gantt Chart Wizard and projects created in earlier versions of Microsoft Project will have formatting that is incompatible with the Microsoft Project 2010 Format, Bar Styles group buttons. The use of the Baseline button resulted in the Baseline bar covering the current schedule bar so only the Baseline bar was visible. To resolve this issue users should either use only Gantt Chart Wizard or only the new Microsoft Project 2010 Format, Bar Styles group buttons, but not both. This issue may be rectified with software updates.
8.4 Row Height
8.4.1 Setting Row Heights Row heights may be adjusted to display text that would otherwise be truncated by a narrow column. The row height may be set in the Table Definition form by selecting View, Data group Tables, More Tables…. From this view select the table in which you wish to edit the row height in and click on the
button. Once the Table Definition form is open select the row height from the drop-down box next to Row height:. The row height of one or more columns may also be adjusted in a similar way to adjusting row heights in Excel, by clicking on the row and dragging with the mouse: • Highlight one or more rows that need adjusting by
dragging or Ctrl-clicking. If all the rows are to be adjusted, then click on the Select All button above row number 1, to highlight all the tasks.
Select All
button
• Then move the mouse pointer to the left-hand side of a horizontal row divider line. The pointer will change to a double-headed arrow . Click and hold with the left mouse button and drag the row or rows to the required height.
8.4.2 Wrap Text Command Microsoft Project 2010 has introduced a Wrap Text command found on the Format, Columns group, Column Settings, Wrap Text which automatically adjusts the row height to fit the text into the available column width.

PLANNING AND CONTROL USING MICROSOFT® PROJECT 2010 AND PMBOK® GUIDE FOURTH EDITION
SAMPLE BOOK CHAPTERS COMPLETE BOOK MAY BE PURCHASED FROM www.eh.com.au © Eastwood Harris Pty Ltd 8-11
8.5 Format Fonts There are two basic options for formatting fonts: • Either individual cells may be selected by Ctl-clicking or dragging with the mouse and formatted,
or • The fonts of tasks that meet preset criteria, such critical tasks may be formatted using the text
Styles command.
8.5.1 Format Individual Cells Font Command The Format, Font… function from Microsoft 2007 and earlier has been replaced with a right-click option and allows you to format any selected text in selected cells, rows or columns: • Select the text to be formatted, • Right-click and two toolbars are opened. The upper toolbar in the picture below has four buttons
that may be used for formatting individual cells:
8.5.2 Format Text Styles The Format, Format group, Text Styles command opens the Text Styles form and allows you to select a text type from the Item to Change: drop-down box and apply formatting to the selected item:
Text may be formatted by using any of the styles listed below: • All: This is all text including columns and rows,

PLANNING AND CONTROL USING MICROSOFT® PROJECT 2010 AND PMBOK® GUIDE FOURTH EDITION
SAMPLE BOOK CHAPTERS COMPLETE BOOK MAY BE PURCHASED FROM www.eh.com.au © Eastwood Harris Pty Ltd 8-12
• Non-critical, Critical, Milestone, Summary, Project Summary, Marked, Highlighted and External tasks,
• Row and Column titles, • Top, Middle and Bottom Timescale Tiers, and • Bar Text left, right, below, above and inside.
8.6 Format Timescale
8.6.1 Zoom Slider The Zoom Slider was introduced with Microsoft Project 2010 and replaced the View, Zoom… function. This may be found at the bottom right-hand side of the screen and provides a simple way of scaling the time scale in the Gantt Chart and all other time scaled views such as the Calendar, Usage and Network Diagram View.
i
This function works differently than other scheduling software in that it changes the scale and the displayed time units at the same time and may result in some undesirable time units being displayed. Once this function is used, your original timescale date formatting will be lost and may only be recovered with undo as this function applies its own formatting such as date formats. The author has found that more predictable results are achieved by using the traditional Zoom In and Zoom Out functions which may be added to the Quick Access Toolbar.
8.6.2 Ribbon Menu There are some new commands available with Microsoft Project 2010 on the Ribbon: • The Timescale: option is a quick method of selecting
the Minor Timescale, the lower line in the Timescale, • Zoom opens a self-explanatory menu, • Entire Project zooms the timescale to fit the whole
project Gantt Chart to fit in the available space, • Selected Tasks zooms the timescale to fit the bars of selected tasks to fit in the available space,
Drag this button to zoom the timescale.

PLANNING AND CONTROL USING MICROSOFT® PROJECT 2010 AND PMBOK® GUIDE FOURTH EDITION
SAMPLE BOOK CHAPTERS COMPLETE BOOK MAY BE PURCHASED FROM www.eh.com.au © Eastwood Harris Pty Ltd 8-13
8.6.3 Format Timescale Command The Timescale form provides a number of options for timescale display, which is located above the Bar Chart, and the shading of Nonworking time. To open the Timescale form: • Double-click on the timescale, or • Add the Timescale button to the Ribbon or Quick Access Toolbar.
There are many options here which are intuitive and will not be described in detail. Top Tier, Middle Tier and Bottom Tier Tab • These three timescales may have different scales. These are often set at “weeks and days” or
“months and weeks.” By default, the Top Tier timescale has been disabled. You may enable the three tiers together by selecting Three Tiers (Top, Middle, Bottom) from the Timescale options, Show:.
• The Label will affect how much space the timescale will occupy, so the selection of a long label will result in longer Task bars.
• Tick lines and Scale separator hide and display the lines between the text. • Size: controls the horizontal scale of the timescale and in association with the Label: are the two
main tools for scaling the horizontal axis in the Gantt Chart. • Choose the Use fiscal year function to display the financial year and then select the File,
Options, Calendar tab to choose the month in which the fiscal year starts. • Should you wish to number the time periods, for example; Week 1, Week 2, etc., there are a
number of sequential numbering options available at the bottom of the label list.

PLANNING AND CONTROL USING MICROSOFT® PROJECT 2010 AND PMBOK® GUIDE FOURTH EDITION
SAMPLE BOOK CHAPTERS COMPLETE BOOK MAY BE PURCHASED FROM www.eh.com.au © Eastwood Harris Pty Ltd 8-14
Nonworking Time Tab The Nonworking time tab allows you to format how the nonworking time is displayed. You may select only one calendar. The nonworking time may be presented as shading behind the bars, in front of the bars or hidden.
i
By default this is set to the Standard Calendar for each view and does not change when the Project Default Calendar is changed. Therefore if you change the Project Base calendar in the Project Information and you wish to see this new calendar in all views you will have to edit all the views.

PLANNING AND CONTROL USING MICROSOFT® PROJECT 2010 AND PMBOK® GUIDE FOURTH EDITION
SAMPLE BOOK CHAPTERS COMPLETE BOOK MAY BE PURCHASED FROM www.eh.com.au © Eastwood Harris Pty Ltd 8-15
8.6.4 Format Timescale Font To format the Timescale font, the Format, Format group, Text Styles command opens the Text Styles form: The timescale fonts may be formatted separately by selecting the appropriate line item under Item to Change:. A very tight timescale may be achieved by making the Bottom Timescale Tier a small font as displayed in the picture.
8.7 Format Gridlines Gridlines are important to help divide the visual presentation of the Bar Chart. This example shows Middle Tier Gridlines every week and Bottom Tier Gridlines every day.
To format the Grid Line select Format, Format group, Gridlines, Gridlines… to open the Gridlines form:
• Select the gridline from the drop-down box under Line to change:. • Select color and type from under Normal. • Date gridlines may be set to occur at intervals using the At interval option. Some of the titles for the gridlines are not intuitive, so some interpretation is given below:

PLANNING AND CONTROL USING MICROSOFT® PROJECT 2010 AND PMBOK® GUIDE FOURTH EDITION
SAMPLE BOOK CHAPTERS COMPLETE BOOK MAY BE PURCHASED FROM www.eh.com.au © Eastwood Harris Pty Ltd 8-16
• For Data Column and Row dividing lines, use Sheet Rows and Sheet Columns. • For Timescale and Column Titles, use Horizontal and Title Vertical. • Gantt Chart area, including lines for Project Start and Finish Date, Current and Status Date,
are clearly described. • Page Breaks will only display manually-inserted breaks. You may need to add the Insert Page
Break Button on the Quick Access Toolbar.
i
The earlier Microsoft Project option Manual page breaks check box in the Print form seemed to have disappeared from Microsoft Project 2010.
Microsoft Project has two dates that may be used to identify the Data Date, the date that the data has been collected for updating a project schedule. These two dates are the Status Date and Current Date which are set in the Project Information form: • By default Microsoft Project displays the Current Date as a dark dotted vertical line but this is
reset to the computer’s system date each time the project file is opened. It is suggested that this line be removed using the Gridline form and the Current Date is not used to identify the Data Date because the software changes it every time the schedule is opened.
• The Status Date never changes once set and therefore it is suggested that this line should be displayed as per the picture above.
i
Many laser printers will not print light gray lines clearly, so it is often better to use dark gray or black Sight Lines for better output.
8.8 Format Links, Dependencies, Relationships, or Logic Lines The Links, also known as Dependencies, Relationships, or Logic Lines, may be displayed or hidden by using the Layout form. • Select Format, Format group, Layout to open the Layout form and click on one of the three
radio buttons under Links to select the style you require:
The color of the Link is inherited from the color of the predecessor task.

PLANNING AND CONTROL USING MICROSOFT® PROJECT 2010 AND PMBOK® GUIDE FOURTH EDITION
SAMPLE BOOK CHAPTERS COMPLETE BOOK MAY BE PURCHASED FROM www.eh.com.au © Eastwood Harris Pty Ltd 8-17
To display Critical Path on the relationship lines you will need to format the bars with a different color. This is often set to red.
i
The color of the successors’ relationship lines is adopted from the task bar color. Therefore, re-formatting critical bars with the Format Bar form will also re-format the color of the successors’ relationship lines and they may no longer display the Critical Path color on the Logic Lines. This will effectively mask the Critical Path and could provide misleading results. The highest bar in the Bars form dictates the color of the relationship line and may not be the same as the color displayed in the Gantt Chart View. Oracle Primavera products format the relationship separately from the bars and are able to identify the Critical, Driving and Non-Driving relationships, which is not possible with Microsoft Project.
8.9 Format Colors Colors are formatted in a number of forms and there is no single form for formatting all colors: • Nonworking time colors in the Gantt Chart are formatted in the Timescale form,; double-click on
the timescale. • Text colors are formatted in the Text Styles and Font forms, found in the Format, Format
groups, Text Style. • Gridline colors are formatted in the Gridlines form, also found under the Format, Format group,
Gridlines. • Hyperlink colors are formatted under File, Options, Advanced, Display options for this
project:. • Timescale colors are with the File, Options, General tab, User Interface Options, Color
scheme: option. • The Logic Lines, also known as Dependencies, Relationships, or Links, inherit their color from
the predecessor’s bar color in the Gantt Chart view and may be formatted in the Network Diagram view by selecting Format, Format group, Layout.

PLANNING AND CONTROL USING MICROSOFT® PROJECT 2010 AND PMBOK® GUIDE FOURTH EDITION
SAMPLE BOOK CHAPTERS COMPLETE BOOK MAY BE PURCHASED FROM www.eh.com.au © Eastwood Harris Pty Ltd 8-18

PLANNING AND CONTROL USING MICROSOFT® PROJECT 2010 AND PMBOK® GUIDE FOURTH EDITION
SAMPLE BOOK CHAPTERS COMPLETE BOOK MAY BE PURCHASED FROM www.eh.com.au © Eastwood Harris Pty Ltd 8-19
8.10 Workshop 6 - Formatting the Bar Chart
Background Management has received your draft report and requests some changes to the presentation. Assignment Format your schedule as follows:
1. Select View, Data group, Tables, More tables… and create a new Table titled Review by copying the Entry table.
2. Add the Task Calendar column between Start and Duration columns in the Table Definition form.
3. Align Data for the Task Calendar to the left, 4. Remove the Task Mode column,
5. Check the Show in menu option.
6. Click to close the form and apply the Table. 7. To make the Duration Column narrower, select from the File, Options, Advanced tab,
Display options for this project: heading, select to display Days as “d” and uncheck Add space before label.
8. Right-click on the Duration column, select Field Settings to open the Field Settings form and enter a Title: of Dur and click to produce a narrow column.
9. Add the Zoom In and Zoom Out buttons to the Quick Access Toolbar and test their function.
Continued Over…

PLANNING AND CONTROL USING MICROSOFT® PROJECT 2010 AND PMBOK® GUIDE FOURTH EDITION
SAMPLE BOOK CHAPTERS COMPLETE BOOK MAY BE PURCHASED FROM www.eh.com.au © Eastwood Harris Pty Ltd 8-20
10. Double-click on the timescale; format the Middle Tier Timescale with Units: of Months with Label: of Jan ‘09 and Count: of 1 month, then format the Bottom Tier Timescale with Units: of Weeks with Label: of 26,2,…, Size: of 150% and Count: of 1 Week.
11. Select Format, Format group, Gridlines, Gridlines… and format the Gridlines with Middle Tier Columns to dotted black lines and Bottom Tier Columns to dashed black lines.
12. Click on the Format, Bar Styles, Critical Tasks to display the Critical bar. 13. Double-click in the bar chart area to open the Bar Styles form, click on the Text tab and scroll
through one bar at a time and remove all text from the all the bars. Ensure you highlight the text before deleting, if you make an error use the Undo key.
14. Add a new bar titled Task Name which does not display a bar and displays the Task Name to the right of the bar, as per the picture below. If you wish to remove the Task Name from the bars then you now only need to delete the one bar.
15. Check your result with the example shown below.
16. Save your OzBuild Bid project.
Text tab here

PLANNING AND CONTROL USING MICROSOFT® PROJECT 2010 AND PMBOK® GUIDE FOURTH EDITION
SAMPLE BOOK CHAPTERS COMPLETE BOOK MAY BE PURCHASED FROM www.eh.com.au © Eastwood Harris Pty Ltd 12-1
12 FILTERS This chapter covers the use of Filters to select which tasks are displayed on the screen and in printouts.
12.1 Understanding Filters Microsoft Project has the ability to display tasks that meet specific criteria. You may want to see only the incomplete tasks, or the work scheduled for the next couple of months, or the tasks that are in-progress, assigned a specific resource, responsibility, phase, discipline, system or belong to a physical area of a project. Microsoft Project defaults to displaying all tasks. It has a number of predefined filters available that you may use or edit and you may also create one or more of your own. There are Task filters that apply to Task views and Resource filters that apply to Resource views. Both types are created and applied in the same way. In this chapter we will focus on Task Filters but resource Filters are created in a similar way. There are two types of filters: • The first is where you select a Filter which exists or has been created using the Filters form. • The second is to create an AutoFilter which is very similar to the Excel AutoFilter (Drop-down
filter) function which is based on the selected column. Topic Menu Command • Apply a Filter Select View, Data group, Filter: drop-down box,
and then either:
• Select a filter from the list, or • Select More Filters… for a complete list of
filters. • Create or modify a Filter Select View, Data group, Filter: drop-down box,
More Filters… to open the More Filter form.
• Turn on AutoFilter Select View, Data group, Filter: drop-down box, Display AutoFilter.
• Apply an AutoFilter Click on the button in the column headers.

PLANNING AND CONTROL USING MICROSOFT® PROJECT 2010 AND PMBOK® GUIDE FOURTH EDITION
SAMPLE BOOK CHAPTERS COMPLETE BOOK MAY BE PURCHASED FROM www.eh.com.au © Eastwood Harris Pty Ltd 12-2
12.2 Understanding the Filter Menu The Filter menu is opened from the View, Data group, Filter: drop-down box, or you may put a Filter menu item on your Quick Access Toolbar. This may not display a complete list of available filters, as this list displays only filters selected to be displayed in the Filter Definition form and more may be available when selecting the More Filters… option.
• Custom filters are those that the user has created or were created as part of a template. • Built-In filters are those that exist as part of the Microsoft Project Global.mpt which is used to
create a project when no template has been used. • Clear Filter will remove all filters, both Filters and AutoFilters, and display all tasks. • New Filter will open the Filter Definition form, allowing the creation of a new filter. • More Filters… opens the More Filters form which will list all the filters available to the current
project. Only filters with the Show in menu check box checked in the Filter Definition form are displayed in the menu above.
• Display AutoFilter turns on and off the ability to use AutoFilters and hides or displays the arrow in the column headers which in turn enables or disables the AutoFilter function:
• Show Related Summary Rows will display any related and hidden Summary Rows as a result of applying a filter.
The current filter name is displayed in this box.

PLANNING AND CONTROL USING MICROSOFT® PROJECT 2010 AND PMBOK® GUIDE FOURTH EDITION
SAMPLE BOOK CHAPTERS COMPLETE BOOK MAY BE PURCHASED FROM www.eh.com.au © Eastwood Harris Pty Ltd 12-3
12.3 Applying an Existing Filter To apply a filter: • Select View, Data group, Filter: and select a filter from the drop-down list. • Select View, Data group, Filter, More Filters… to open the More Filters form. The More Filters form displays all filters available in a project: some of these may not be displayed in the Filter menu
• The two radio buttons at the top of the form allow you to select filters that operate either on a Task view or on a Resource view.
Task filters will operate using most task data such as dates, durations, text columns, number columns, outline and WBS.
Resource filters will operate on resource criteria only and not the task criteria. • Select the required filter from the list, and • Select either:
to shows all tasks but highlights the tasks that meet the criteria, or to display only the tasks that meet the criteria.

PLANNING AND CONTROL USING MICROSOFT® PROJECT 2010 AND PMBOK® GUIDE FOURTH EDITION
SAMPLE BOOK CHAPTERS COMPLETE BOOK MAY BE PURCHASED FROM www.eh.com.au © Eastwood Harris Pty Ltd 12-4
12.4 Creating and Modifying Filters New filters are created from the More Filters form. This may be opened by selecting View, Data group, Filters:, More Filters …:
• Click on to open the Organizer form where you may copy a filter to and from another open project, rename or delete a filter:
• Click on:
to create a new filter, or to edit an existing filter, or to copy an existing filter.

PLANNING AND CONTROL USING MICROSOFT® PROJECT 2010 AND PMBOK® GUIDE FOURTH EDITION
SAMPLE BOOK CHAPTERS COMPLETE BOOK MAY BE PURCHASED FROM www.eh.com.au © Eastwood Harris Pty Ltd 12-5
• The Filter Definition form will be displayed. The one-line example below will only display critical tasks.
• The filter may be edited in the Filter Definition form to display or highlight the required tasks. • Checking the Show in menu box will place the Filter in the menu. • Checking Show related summary rows will display any associated Summary tasks.
• Select to return to the More Filters form.
i
It is useful to place a space at the start of the filter name when creating a new filter as this will place the filter you have just created at the top of the More Filters form list.

PLANNING AND CONTROL USING MICROSOFT® PROJECT 2010 AND PMBOK® GUIDE FOURTH EDITION
SAMPLE BOOK CHAPTERS COMPLETE BOOK MAY BE PURCHASED FROM www.eh.com.au © Eastwood Harris Pty Ltd 12-6
12.5 Defining Filter Criteria The filter criteria are determined by four columns of information in the Filter Definition form: • And/Or functions when you have two or more lines of data in the Filter Definition form to operate
on. • Field Name defines the data field you want to operate on. • Test sets the criteria such as “Greater Than” or “Less Than” or “Equals.” • Value(s) is/are a date, number, Yes/No or text for the Test field to operate on. If more than one
value is to be considered, for example when a Test is “Between,” the two values are separated by a comma “,”. The example below is a filter that will only display detail tasks that will start between 1 Jan ‘12 and 20 Jan ‘12.
This chapter will not cover all the aspects of filter definitions but will cover the major principles, so you may experiment when you require a filter. There are a number of predefined filters with a standard Microsoft Project installation. You should inspect these to gain an understanding of how filters are constructed and applied.
12.5.1 Simple Filters, Operator and Wild Cards A simple Filter contains one line of data, therefore the And/Or function is not used. These are the most common filters and meet most common filtering requirements. These filters are used for purposes such as displaying tasks which: • Are not started, complete, or in-progress tasks. • Have a Start or Finish before or after a particular date. • Contain specific text. • Are within a range of dates.

PLANNING AND CONTROL USING MICROSOFT® PROJECT 2010 AND PMBOK® GUIDE FOURTH EDITION
SAMPLE BOOK CHAPTERS COMPLETE BOOK MAY BE PURCHASED FROM www.eh.com.au © Eastwood Harris Pty Ltd 12-7
There are some operands you should be aware of: • Some fields may have “Yes” or “No” entered in the Value(s). The task fields that may be filtered
using a “Yes” or “No” include: Summary – Indicates if the task is a summary or detail task, Critical – Indicates if the task is critical when the Total Slack is less than or equal to the value
entered in the Calculation tab or the Options form, Milestones and Effort-Driven.
The filter below will select all tasks that are Milestones:
• The Wildcard functions are similar to the DOS Wildcard functions and are mainly used for filtering text:
You may replace a single character with a “?”. Thus, a filter searching for a Task Name only containing “b?t” will display words like “bat”, “bit” and “but”.
You may replace a group of characters with an *. Thus, a filter searching for a word in a Task Name containing “b*t” will display words like “blot”, “blight” and “but”.
NOTE: For the Wildcard function to operate the equals Test must be used. This function does not work with other operands and in this mode works as a contains operand. • NA allows the selection of a blank value. The filter below displays tasks without either a Baseline
Start or Baseline Finish date:

PLANNING AND CONTROL USING MICROSOFT® PROJECT 2010 AND PMBOK® GUIDE FOURTH EDITION
SAMPLE BOOK CHAPTERS COMPLETE BOOK MAY BE PURCHASED FROM www.eh.com.au © Eastwood Harris Pty Ltd 12-8
• A Calculated Filter compares one value with another. The Value(s) field is selected from the drop-down box. The example below will display those tasks that are scheduled to start later than the Baseline start:
12.5.2 And/Or Filters The And/Or function allows a search for tasks which meet more than one criteria by using the And/Or option: • The filter below displays tasks with Slack less than 8 days And contain the word “Bid”:
• The filter below is similar to the one above but displays tasks with Slack less than 5 days Or contain the word “Bid”. It displays many more tasks:

PLANNING AND CONTROL USING MICROSOFT® PROJECT 2010 AND PMBOK® GUIDE FOURTH EDITION
SAMPLE BOOK CHAPTERS COMPLETE BOOK MAY BE PURCHASED FROM www.eh.com.au © Eastwood Harris Pty Ltd 12-9
12.5.3 Multiple And/Or Multiple And/Or statements are possible by placing a line with only an And/Or statement. The filter below selects tasks that have a Baseline Finish and are scheduled to finish late or are not completing their work quickly enough, shown as the Budgeted Cost of Work Performed (Earned Value) is less than the Budgeted Cost of Work Scheduled (Planned Value):
12.5.4 Interactive Filter These filters allow you to enter the Value(s) of the filtered field after applying the filter. The filter is tailored each time it is applied via a user-prompt. The filter below will ask you to enter a word in the task name. For this function to operate properly, the text in the Value(s) field must commence with a double quotation mark “and end with a double quotation and question mark”? :
After the filter is applied, you will be presented with the Interactive Filter form to enter the required text:

PLANNING AND CONTROL USING MICROSOFT® PROJECT 2010 AND PMBOK® GUIDE FOURTH EDITION
SAMPLE BOOK CHAPTERS COMPLETE BOOK MAY BE PURCHASED FROM www.eh.com.au © Eastwood Harris Pty Ltd 12-10
12.6 AutoFilters This function has been greatly enhanced in Microsoft project 2010. Microsoft Project AutoFilters are similar to the Excel AutoFilter function and allow you to select the filter criteria from drop-down menus in the column headers. This function allows both Grouping and Sorting of tasks, which will be covered in the TABLES AND GROUPING TASKS chapter. To create an AutoFilter based on one parameter: • Turn on the AutoFilter function by selecting View, Data group, Filter: drop-down box,
Display AutoFilter.
• The column headers will display the button in the column header. Click on this button in one of the columns to display a drop-down box:
• Select the required criteria from the check box list, or • Click on the Filters heading, as displayed above, to open up a second set of selections, which in
turn will provide many more options which will open the Custom AutoFilter form:

PLANNING AND CONTROL USING MICROSOFT® PROJECT 2010 AND PMBOK® GUIDE FOURTH EDITION
SAMPLE BOOK CHAPTERS COMPLETE BOOK MAY BE PURCHASED FROM www.eh.com.au © Eastwood Harris Pty Ltd 12-11
• Select the parameters you want to operate on from the four drop-down boxes and check the And or Or radio button.
• To save a drop-down filter as a normal filter, click on the button, which opens the Filter Definition form.
• You may now select another column and create a filter based on two parameters to reduce the number of tasks displayed.
• After an AutoFilter has been applied the indicator in the column heading changes to a
.
i
AutoFilters always select the associated summary tasks of any selected detail tasks.

PLANNING AND CONTROL USING MICROSOFT® PROJECT 2010 AND PMBOK® GUIDE FOURTH EDITION
SAMPLE BOOK CHAPTERS COMPLETE BOOK MAY BE PURCHASED FROM www.eh.com.au © Eastwood Harris Pty Ltd 12-12

PLANNING AND CONTROL USING MICROSOFT® PROJECT 2010 AND PMBOK® GUIDE FOURTH EDITION
SAMPLE BOOK CHAPTERS COMPLETE BOOK MAY BE PURCHASED FROM www.eh.com.au © Eastwood Harris Pty Ltd 12-13
12.7 Workshop 10 - Filters
Background Management has asked for some reports to suit their unique requirements. Assignment 1. They would like to see all the critical tasks.
Add the Filter button, found under View, Data group, to the Quick Access Toolbar. Apply the Critical tasks filter, found under View, Data group Filter button. You will see only tasks that are on the Critical Path and their associated Summary tasks.
2. They would like to see all the tasks with float less than 8 days:
Create a new filter titled Float Less Than 8 Days, Use the Filter button, or the View, Filter, More Filters… to open the Filters form. If you place a space at the start of the Filter name the filter will be placed at the top of the list
and make it easier to find filters you have created. Create a criteria to display a Total Slack of less than 8 days, Show the Summary tasks by checking Show related summary rows box, Show the filter in the menu, and Apply the filter.
You should see that extra tasks with float less than 8 days are now displayed.
3. They would like to see all the tasks with float less than, or equal to 8 days, OR contains the word “Bid.”
Copy the Float Less Than 8 Days filter, Assign a title to the filter: Float Less Than 8 Days or Contains “Bid”, Add the condition: Or Name (Task Name) contains Bid, Show in the menu, and Apply the filter. You should find that one extra task is now shown.
4. Copy the filter, title it Float Less Than 8 Days and Contains “Bid” and change the condition to
And to see the difference between Or and And options. 5. We now wish to create an AutoFilter that displays all the tasks containing the word “document”.
Apply the (No Filter) option, which is the same as the All Tasks option used in other forms.
Add the Display Auto Filter button to the Quick Access Toolbar and use this to ensure the Auto Filters are activated and each column header has a down arrow as per this picture:
Click on the down arrow in the Task Name header, Select Filters, Custom… to open the Custom Auto Filter form, Create a Custom Auto filter to contain tasks containing the word “document”.
6. Now apply the (No Filter) or the All Tasks Filter to remove the AutoFilter. 7. Save your OzBuild Bid project.

PLANNING AND CONTROL USING MICROSOFT® PROJECT 2010 AND PMBOK® GUIDE FOURTH EDITION
SAMPLE BOOK CHAPTERS COMPLETE BOOK MAY BE PURCHASED FROM www.eh.com.au © Eastwood Harris Pty Ltd 12-14
Answers to Workshop 10 After applying the Critical Filter:
Creating the Float Less Than 8 Days Filter:
After applying the Float Less Than 8 Days or Contains Filter:
Creating an AutoFilter that displays Task Names containing document: