East Staffordshire Borough Council RETAIL AND LEISURE ... · East Staffordshire Borough Council...
89
East Staffordshire Borough Council RETAIL AND LEISURE CAPACITY STUDY Final Report August 2007 ROGER TYM & PARTNERS 3 Museum Square Leicester LE1 6UF t 0116 249 3970 f 0116 249 3971 e [email protected] w www.tymconsult.com
Transcript of East Staffordshire Borough Council RETAIL AND LEISURE ... · East Staffordshire Borough Council...

East Staffordshire Borough Council RETAIL AND LEISURE CAPACITY STUDY
Final Report August 2007
ROGER TYM & PARTNERS 3 Museum Square Leicester LE1 6UF t 0116 249 3970 f 0116 249 3971 e [email protected] w www.tymconsult.com

This document is formatted for double-sided printing.

CONTENTS 1 INSTRUCTIONS AND OUTLINE OF REPORT ..................................................................1
Instructions .......................................................................................................................... 1 Structure of Remainder of Report ........................................................................................ 1
2 THE REQUIREMENTS OF NATIONAL PLANNING POLICIES ..........................................3 Introduction.......................................................................................................................... 3 The Government’s Objectives.............................................................................................. 3 Positive Planning for Town Centres: A Plan-led Approach .................................................. 4 Development Control ........................................................................................................... 9 Monitoring and Review ...................................................................................................... 12 Conclusions and Changes in Emphasis............................................................................. 13 Implications of the New White Paper of May 2007............................................................. 14
3 THE REGIONAL AND LOCAL PLANNING POLICY CONTEXTS .....................................15 Regional Planning Policy ................................................................................................... 15 Local Planning Policy......................................................................................................... 18 Town Centre Studies ......................................................................................................... 19
4 REVIEW OF KEY RETAIL AND LEISURE MARKET TRENDS.........................................21 Introduction........................................................................................................................ 21 Retail Sector ...................................................................................................................... 21 Leisure Sector.................................................................................................................... 32
5 PERFORMANCE ANALYSIS ...........................................................................................39 Introduction........................................................................................................................ 39 Performance Indicators...................................................................................................... 39 Summary of the Retail Performance of Burton and Uttoxeter ............................................ 47 Assessment of the Role of Other Non-Retail Uses ............................................................ 48
6 CURRENT PATTERNS OF RETAIL AND LEISURE VISITS ............................................53 Introduction........................................................................................................................ 53 Methodology ...................................................................................................................... 53 Comparison Shopping Patterns ......................................................................................... 55 Convenience (Food and Groceries) Shopping Patterns..................................................... 59 Leisure Patterns................................................................................................................. 63 Conclusions on Retail and Leisure Spending Patterns ...................................................... 64
7 QUANTITATIVE RETAIL CAPACITY ANALYSIS .............................................................67 Summary of Methodology and Data Inputs........................................................................ 67 Quantitative Assessment of Need for Further Comparison Sector Floorspace .................. 69 Quantitative Assessment of Need for Further Convenience Sector Floorspace ................ 72
8 ASSESSMENT OF SCOPE FOR ADDITIONAL COMMERCIAL LEISURE PROVISION ..77 Forecast Increases in Leisure Expenditure........................................................................ 77 Conversion of Expenditure Increases to Additional Leisure ‘Requirements’ ...................... 78 Summary of Scope for Additional Commercial Leisure Facilities....................................... 80
9 OVERALL CONCLUSIONS AND KEY RECOMMENDATIONS ........................................81 Introduction........................................................................................................................ 81 Summary of Performance Analysis and Key Qualitative Needs......................................... 81 Summary of Quantitative Need.......................................................................................... 82 Overall Summary and Key Recommendations .................................................................. 84 TO BE READ IN CONJUNCTION WITH: ANNEX 1 - Appendices to Main Report
ANNEX 2 – Retail & Leisure Capacity Spreadsheets


Retail and Leisure Capacity Study Final Report
Roger Tym & Partners M9153, August 2007 1
1 INSTRUCTIONS AND OUTLINE OF REPORT
Instructions 1.1 In December 2006, Roger Tym & Partners (RTP) was commissioned by East
Staffordshire Borough Council to undertake a Borough-wide Retail Capacity Study. The primary purpose of the study is to inform the Core Strategy, the Area Action Plan (AAP) that is currently being prepared for Burton-upon-Trent town centre and other Local Development Framework (LDF) documents.
1.2 The study brief set a number of key requirements for the Retail Capacity Study, which can be broadly summarised as follows:
an assessment of Burton’s and Uttoxeter’s position in the sub-regional retail hierarchy;
an assessment of the performance of Burton and Uttoxeter town centres in relation to key indicators of vitality and viability as set out in PPS6; and
reflecting the findings from the assessments referred to above, quantification of the capacity (quantitative need) for additional retail floorspace.
1.3 All LDF documents will be subject to independent examination and a binding report by an inspector and will become a statutory document in its own right. Thus, the evidence on which LDF documents are based needs to be robust and defensible. A mix of quantitative and qualitative research was therefore undertaken in the early stages of the study to enable a substantial body of original data on retail and town centre uses to be assembled. This research included a telephone survey of households, which enabled a detailed picture of existing shopping and leisure patterns to be built up, as well as a range of local consultations and an analysis of Burton and Uttoxeter town centres in relation to key performance indicators.
Structure of Remainder of Report 1.4 The remainder of our report is structured as follows:
Section 2 outlines the requirements of the national policy context insofar as it relates to town centres and the location of new retail and leisure developments.
Section 3 provides a review of the regional and local planning policy contexts.
Section 4 sets out the key national trends in various sub-sectors of the retail and leisure markets so as to provide a reference for the remainder of the study.
Section 5 sets out the findings of our assessment of Burton and Uttoxeter town centres in relation to a range of ‘performance indicators’, taking into account our appreciation of the key issues that are currently affecting – or which could have a bearing on – the centres’ performance as foci of retail services and leisure activity.
Section 6 provides our assessment of the current patterns of retail spending in the comparison and convenience sectors and the pattern of leisure visits, based on the results of a survey of 1,000 households resident within East Staffordshire's overall catchment area.
Section 7 assesses the quantitative need for further comparison and convenience retail floorspace in the periods up to 2011, 2016 and 2021 under various scenarios, taking into account claims on expenditure growth, and also provides an indication of quantitative need in the longer-term period to 2026 (which is the end-date of the emerging Regional Spatial Strategy).
Section 8 provides our broad assessment of the scope for further commercial leisure development in the Borough.

Retail and Leisure Capacity Study Final Report
Roger Tym & Partners M9153, August 2007 2
Section 9 outlines our overall conclusions and recommendations.
1.5 The report is accompanied by two separately bound volumes entitled:
i) Annex 1: Appendices to the Main Report; and
ii) Annex 2: Retail and Leisure Capacity Spreadsheets.

Retail and Leisure Capacity Study Final Report
Roger Tym & Partners M9153, August 2007 3
2 THE REQUIREMENTS OF NATIONAL PLANNING POLICIES
Introduction 2.1 The relevant national policy context, insofar as it relates to town centres and the
location of new retail and leisure developments, is set, in the main, by PPS6, which was published in March 2005. PPS6 replaces1 PPG6 (June 1996) and the subsequent Parliamentary answers of 5 December 1997 (Raynsford), 11 February 1999 (Caborn) and 10 April 2003 (McNulty). PPS6 also replaces the Government’s Responses to the Select Committees of July 1997 and May 2000.
2.2 PPS6 is structured under four sections which deal with:
the Government’s objectives;
the plan-led approach to positive planning for town centres;
the assessment of proposed developments; and
measuring and monitoring the vitality and viability of town centres.
The Government’s Objectives 2.3 The very first paragraph of PPS6 makes it clear that ‘sustainable development is the
core principle underpinning planning’ and that ‘the planning system has a key role in facilitating and promoting sustainable and inclusive patterns of development, including the creation of vital and viable town centres’. The Government’s key objective for town centres2, therefore, is to promote their vitality and viability (paragraph 1.3).
2.4 The Government’s second tier objectives are set out in paragraph 1.4; these can be summarised as:
enhancing consumer choice;
supporting efficient, competitive and innovative retail and leisure sectors and improving their productivity; and
improving accessibility to existing and new development by a choice of means of transport.
2.5 Paragraph 1.5 then sets out the Government’s wider objectives; these can be summarised as:
the promotion of social inclusion by ensuring access to a range of town centre uses and rectifying deficiencies;
the regeneration of deprived areas;
the promotion of economic growth;
the delivery of more sustainable patterns of development; and
the promotion of high quality and inclusive design, enhanced public realm and an accessible and safe environment.
2.6 Regional planning bodies (RPBs) and local authorities (LPAs) are therefore required to implement these Government objectives by planning positively for the growth and
1 See footnote on page 1 of PPS6. 2 See footnote 3 on page 5 of PPS6 which states that references to ‘town centres’ and ‘centres’ throughout
the policy statement apply to all types of centres described in Table 1 of Annex A, i.e. city, town, district and local centres, but not small parades of purely neighbourhood significance.

Retail and Leisure Capacity Study Final Report
Roger Tym & Partners M9153, August 2007 4
development of town centres, whilst not restricting competition or innovation (paragraphs 1.6 and 1.7). The main town centre uses to which PPS6 applies are retail, leisure, offices and arts, cultural and tourism facilities (paragraph 1.8), with housing said to be ‘…an important element in most mixed-use, multi-storey developments’ (paragraph 1.9).
Positive Planning for Town Centres: A Plan-led Approach
Introduction
2.7 The introduction to Section 2 of PPS6 calls upon RPBs and LPAs to:
actively promote growth and manage change in town centres;
define a network and hierarchy of centres, each performing their appropriate role to meet the needs of their catchments; and
adopt a proactive and plan-led approach to planning for town centres through regional and local planning.
2.8 We consider it appropriate to summarise the requirements in a different and more logical order, starting with the role of regional plans.
The Role of Regional Plans
2.9 Paragraphs 2.12 to 2.14 of PPS6 set out the requirements placed on RPBs in developing their Regional Spatial Strategies (RSSs). The over-riding requirement is for RPBs to set out a vision and strategy for the region’s growth, particularly for higher level centres, and provide a strategic framework for planning at the local level. In particular, RPBs must:
develop a strategic framework for the development of a network of centres, taking into account the need to avoid an over concentration of growth in the higher level centres;
make strategic choices about those centres of regional and sub-regional significance where major growth should be encouraged;
identify the need for new centres to be developed in areas of planned major growth;
assess the need for additional floorspace in the comparison retail, leisure and office sectors over the period of the RSS and for five yearly periods within it and, having regard to capacity and accessibility considerations, they must identify where the identified needs would best be met; and
identify the need for major town centre development of regional or sub-regional significance.
2.10 However, PPS6 is clear that new or expanded regional or sub-regional shopping centres located in out-of-centre locations are unlikely to meet the requirements of national policy (paragraph 2.14).
Networks and Hierarchies
2.11 Paragraphs 2.9 to 2.11 of PPS6 provide further advice in relation to the development of the network and hierarchy of centres, but – in this part of the policy statement – the advice is in relation to both the regional and local levels. Thus, authorities must plan carefully how to distribute any identified growth at both regional and local levels. In defining their spatial objectives, RPBs and LPAs:
‘…should consider whether there is a need to rebalance the network of centres to ensure that it is not overly dominated by the largest centres, that there is a more even distribution of town centre uses, and that people’s everyday needs are met at the local level’ (paragraph 2.9).

Retail and Leisure Capacity Study Final Report
Roger Tym & Partners M9153, August 2007 5
2.12 Thus, in developing the network and hierarchy, RPBs and LPAs are required to consider:
i) whether there is a need to avoid over concentration of growth in the higher level centres;
ii) the need for investment in those centres requiring to be regenerated; and
iii) the need to address deficiencies in the network (paragraph 2.9).
2.13 Any change in the role and function of centres – upward or downward – must come through the development plan process, rather than through planning applications, with higher order centres dealt with in the RSS and with lower order centres dealt with through development plan documents (paragraph 2.10).
Promoting Growth and Managing Change
2.14 Paragraphs 2.3 to 2.8 of PPS6 turn to the role of LPAs in promoting growth and managing change in town centres. Paragraph 2.3 states that LPAs should – within the regional planning context – actively plan for growth and the management of change in town centres over the period of their development plan documents by:
i) selecting appropriate existing centres to accommodate growth, making the best use of existing land and buildings, but extending the centres where appropriate;
ii) managing the role of existing centres through the promotion of specialist activities, or specific types of uses; and
iii) planning for new centres of an appropriate scale in areas of significant growth, or where there are deficiencies in the existing network.
2.15 Paragraph 2.4 urges that growth should be accommodated, wherever possible, through ‘…more efficient use of land and buildings within existing centres’. However, LPAs ‘…should also seek to ensure that the number and size of sites identified for development or redevelopment are sufficient to meet the scale and type of need identified’.
2.16 Where growth cannot be accommodated within existing centres, paragraph 2.5 advises LPAs to plan for:
i) the extension of the primary shopping area, if there is a need for additional retail provision; and
ii) the extension of the town centre, to accommodate other main town centre uses.
2.17 Of crucial importance, however, is the Government’s recognition that:
‘Extension of the primary shopping area or town centre may also be appropriate where a need for large developments has been identified and this cannot be accommodated within the centre. Larger stores may deliver benefits for consumers and local planning authorities should seek to make provision for them in this context’ (paragraph 2.6).
2.18 However, whilst PPS6 gives recognition to the role of large stores, there is no replication of the provisions of paragraph 3.3 of the now replaced PPG6 which had stated that ‘some types of retailers, such as large stores selling bulky goods, may not be able to find suitable sites either in or on the edge of the town centre’.
2.19 Where existing centres are in decline, PPS6 advises LPAs to ‘…assess the scope for consolidating and strengthening these centres by seeking to focus a wider range of uses there, promote the diversification of uses and improve the environment’ (paragraph 2.8). However, where a reversal of decline is not possible, LPAs are advised to consider a reclassification of the centre, so as to reflect its revised status in the hierarchy, and the adoption of policies which allow retail units to change to other uses, whilst seeking to retain vital services such as post offices and pharmacies.

Retail and Leisure Capacity Study Final Report
Roger Tym & Partners M9153, August 2007 6
The Role of Plans at the Local Level
2.20 Paragraphs 2.15 to 2.18 of PPS6 deal, specifically, with the role of the forward planning system at the local level. Paragraph 2.15 requires LPAs to adopt a positive and proactive approach to planning for the future of all types of centres within their areas. Thus, in line with the RSS and their community strategies, LPAs should, prepare a core strategy development plan document which sets out ‘…a spatial vision and strategy for the network and hierarchy of centres, including local centres, within their area, setting out how the role of different centres will contribute to the overall spatial vision for their area’.
2.21 Paragraph 2.16 urges LPAs to work with stakeholders and the community so as to:
i) assess the need for new floorspace for retail, leisure and other town centre uses, taking account of both quantitative and qualitative considerations;
ii) identify deficiencies in existing provision, assess the capacity of existing centres to accommodate new development and identify centres in decline where change needs to be managed;
iii) identify the centres where development will be focused, as well as the need for any new centres of local importance;
iv) define the extent of the primary shopping area and the town centre on their Proposals Map;
v) identify and allocate sites in accordance with the considerations set out in paragraphs 2.28 to 2.51;
vi) review existing land use allocations;
vii) promote investment in deprived areas by identifying opportunities for growth and improved access;
viii) set out criteria based policies for assessing proposals on sites not allocated in development plan documents; and
ix) distinguish between primary and secondary frontages.
2.22 Paragraphs 2.19 to 2.22 of PPS6 then proceed to highlight the need for high quality and inclusive design, the importance of accessibility and safety and the need for efficient use of land through the promotion of higher-density mixed-use development. Paragraphs 2.23 and 2.26 deal with the management of the evening economy and the need for a range of leisure, cultural and tourism activities and paragraph 2.27 seeks to promote the retention and enhancement of existing markets and, where appropriate, the creation of new ones.
Site Selection and Land Assembly
2.23 Paragraphs 2.28 to 2.52 deal with site selection and land assembly in the forward planning process. Paragraph 2.28 sets out the five key considerations for local authorities when they are selecting sites for development; these are to:
‘a) assess the need for development (paragraphs 2.32-2.40);
b) identify the appropriate scale of development (paragraphs 2.41-2.43);
c) apply the sequential approach to site selection (paragraphs 2.44-2.47);
d) assess the impact of development on existing centres (paragraph 2.48); and
e) ensure that locations are accessible and well serviced by a choice of means of transport (paragraphs 2.49-2.50).’
2.24 These considerations match the development control tests set out in paragraph 3.4 of PPS6. In applying them in the development plan preparation process, LPAs are required to work closely with retailers, leisure operators, developers, other

Retail and Leisure Capacity Study Final Report
Roger Tym & Partners M9153, August 2007 7
stakeholders and the wider community and paragraph 2.31 makes it clear that LPAs may need to make choices between competing development pressures in their town centres.
Need for Development
2.25 Paragraph 2.32 states that need assessments should be carried out as part of the plan preparation and review process, that they should be updated regularly and that LPAs should take account of the regional spatial strategy. Indeed, the LPAs’ assessments of need ‘…should inform and be informed by the regional needs assessments and form part of the evidence base for development plan documents’.
2.26 Further guidance on the assessment of need is to be published separately. Paragraphs 2.33 and 2.34 of PPS6 make it clear, however, that LPAs should place greater weight on quantitative need for specific types of retail and leisure developments taking into account population change, forecast change in expenditure for specific classes of goods and forecast improvements in productivity in the use of existing floorspace.
2.27 Nevertheless, an important qualitative consideration will be the need to improve the range of services and facilities in deprived areas (paragraph 2.35). Another consideration which may be taken into account in the assessment of qualitative need is the degree to which existing shops may be over-trading (paragraph 2.36). However, regeneration and employment impacts – whilst capable of being material considerations – are not indicators of retail need (paragraph 2.37).
2.28 LPAs are also required to assess the need for new office floorspace over the development plan document period. Paragraph 2.39 states that they should take account of the RSS which will incorporate employment forecasts and the identification of suitable broad locations where regionally significant office development should be located (paragraph 2.39). LPAs must also take account of the physical capacity of their town centres and their roles in the hierarchy in planning for new office development and they must consider the needs for other main town centre uses.
Appropriate Scale
2.29 Paragraph 2.41 states that:
‘In selecting suitable sites for development, local planning authorities should ensure that the scale of opportunities identified are directly related to the role and function of the centre and its catchment’.
2.30 As a consequence, paragraph 2.42 states that ‘…local centres will generally be inappropriate locations for large scale new development…’ and that LPAs ‘…should therefore consider setting an indicative upper limit for the scale of developments likely to be permissible in different types of centres…’. If a need is identified for larger format developments, paragraph 2.43 indicates that sites should be identified within or on the edge of ‘city centres’ and ‘town centres’, as defined in Table 1 of Annex A to PPS6.
Sequential Approach to Site Selection
2.31 Paragraph 2.44 of PPS6 sets the order of preference in applying the sequential approach, as follows:
first, locations within existing centres, but subject to caveats relating to suitability, availability and scale in relation to the function of the centre;
second, edge-of-centre locations, with a preference given to sites that are, or will be, well connected to the centre; and then
out-of-centre sites, with preference given to sites which are, or will be, well served by a choice of means of transport and those with a high likelihood of forming links with the centre.

Retail and Leisure Capacity Study Final Report
Roger Tym & Partners M9153, August 2007 8
2.32 It is important to note that the distance threshold for the purposes of the ‘edge-of-centre’ definition, varies from up to 300 metres from the primary shopping area for retail use, to within 300 metres of a town centre boundary for all other main town centre uses (as set out in Table 2 of Annex a of PPS6). It is also noteworthy that LPAs are required to give weight to those locations that best serve the needs of deprived areas when considering alternative sites at the same level in the sequential ranking (paragraph 2.44).
2.33 In line with the earlier advice in the now replaced PPG6, there is a requirement for flexibility and realism on the part of both LPAs and developers/operators when discussing the identification of sites for inclusion in development plan documents. Sites must be available, or likely to become available for development during the development plan document period, and capable of accommodating a range of business models, all parties having been flexible in relation to scale, format, car parking provision and the scope for disaggregation (paragraph 2.45).
2.34 A new requirement, however, is for development plan documents to include phasing policies so as to ensure that preferred locations are developed ahead of less central locations (paragraph 2.46).
2.35 Further guidance on the sequential approach is to be published separately (paragraph 2.47).
Assess Impact
2.36 If LPAs are proposing to allocate sites in ‘edge-of-centre’ or ‘out-of-centre’ locations, they must assess the potential impact on centres within the catchment area of the potential development (paragraph 2.48). In our assessment, this provision would seem to confirm that the Government is not seeking to impose a moratorium against ‘out-of-centre’ development, albeit that such development is likely to be rare. LPAs must also assess the potential impact on other centres of those allocations within a centre which would substantially increase its attraction vis-à-vis other centres (paragraph 2.48).
Ensure Locations are Accessible
2.37 Paragraph 2.49 of PPS6 confirms PPG13’s aspiration to reduce the need to travel, to reduce reliance on the private car and to ensure that everyone has good access to a range of facilities. As a consequence, in selecting sites for allocation, LPAs are required to have regard to the accessibility of the site by a choice of means of transport and the potential impact of its development on car use, traffic and congestion. In rural areas the focus for development is to be in market towns and large villages.
Other Relevant Matters
2.38 After assessing the sites against the five considerations set out in paragraph 2.28 of PPS6, LPAs are able to consider other matters such as physical regeneration, the likely net employment impact, the potential impact on economic growth and the potential impact on social inclusion (paragraph 2.51).
Assembling Sites
2.39 Paragraph 2.52 states that LPAs ‘…should allocate sufficient sites to meet the identified need for at least the first five years from the adoption of their development plan documents…’. LPAs are also required to consider the scope for site assembly using their CPO powers in order to ensure that suitable sites are brought forward for development.
Designation of New Centres
2.40 Paragraph 2.53 repeats the advice that ‘new centres should be designated through the plan-making process where the need for them has been established, such as in areas of significant growth, or where there are deficiencies in the existing network of centres,

Retail and Leisure Capacity Study Final Report
Roger Tym & Partners M9153, August 2007 9
with priority given to deprived areas…..whether this is done at the regional or local level will depend on the size of the proposed centre and its proposed role in the hierarchy of existing centres…’ PPS6 is clear, however, that existing out-of-centre facilities must not be regarded as ‘centres’, unless they are identified as such in the RSS and/or in development plan documents (paragraph 2.54).
Providing for Local Shopping and Other Services
2.41 Paragraphs 2.55 to 2.59 are concerned with the provision for local shopping and other services. There is emphasis on the need for a network of local centres, so as to meet people’s day-to-day needs and provide a focus for local services. LPAs are encouraged to seek to rectify any deficiencies in local provision, especially in deprived areas, through liaison with the local community, retail operators and other stakeholders. Further guidance on the preparation of strategies for smaller centres is to be published separately.
Rural Centres
2.42 Paragraphs 2.60 to 2.64 of PPS6 deal with rural centres. Market towns and villages, as expected, are to be the main service centres in rural areas and the focus for economic development. Paragraph 2.61 states that the Government is committed to helping market towns manage the process of change and to strengthen their role as service centres, but there is little guidance as to how this aspiration is to be achieved.
Development Control 2.43 Section 3 of PPS6 sets out the considerations to be taken into account by LPAs in
determining planning applications for all proposals relating to main town centre uses – whether in the form of new development, redevelopment, extensions, changes of use, renewals of extant planning permissions or applications to vary or remove existing conditions (paragraph 3.1).
2.44 First, it is important to note the provisions of paragraph 3.3, which states that:
‘The key considerations for identifying sites for allocation in development plan documents, as set out in Chapter 2, apply equally to the assessment of planning applications,’ so that Chapter 3 ‘…sets out only the additional detail relevant to the consideration of planning applications, and should be read in conjunction with Chapter 2’.
2.45 Thus, paragraph 3.4 sets out the same five tests for applicants as apply to LPAs in allocating sites in the development plan preparation process (as set out earlier in paragraph 2.28). We discuss each test in turn, but before doing so we emphasis the provisions of paragraph 3.5, which states that ‘…as a general rule the development should satisfy all these considerations’.
Assessing the Need for Development
2.46 The first point to note is that applicants are not required to demonstrate the need for retail proposals located within the primary shopping area, or for other main town centre uses located within the town centre (paragraph 3.8). However, paragraph 3.9 states that ‘…need must be demonstrated for any application for a main town centre use which would be in an edge-of-centre or out-of-centre location and which is not in accordance with an up to date development plan document strategy’ (our emphasis). There is no minimum floorspace size threshold below which the test of need does not apply.
2.47 Additional guidance on the assessment of quantitative need in relation to retail and leisure proposals is set out in paragraph 3.10, which states that the need assessment should be:
i) based on the assessment carried out for the development plan document, updated as required;

Retail and Leisure Capacity Study Final Report
Roger Tym & Partners M9153, August 2007 10
ii) related to the class of goods to be sold;
iii) assessed, normally, no more than five years ahead; and
iv) based on a catchment area that is well related to the size and function of the proposed development and which takes account of competing centres.
Scale
2.48 There is no further advice in relation to the issue of scale and paragraph 3.12 merely refers to advice already set out previously in Section 2.
The Sequential Test
2.49 The sequential test applies to ‘…all development proposals for sites that are not in an existing centre nor allocated in an up-to-date development plan document’ (paragraph 3.13, our emphasis). As is the case with the need test, there is no minimum floorspace size threshold below which the sequential test does not apply.
2.50 Paragraph 3.13 goes on to state that the relevant centres in which to search for sites will depend on:
the overall strategy set out in the development plan;
the nature and scale of the development; and
the catchment that the development seeks to serve.
2.51 In applying the sequential approach developers and operators are required to demonstrate flexibility in relation to scale, format, car parking provision and the scope for disaggregation. The key purpose of the exercise ‘…is to explore the possibility of enabling the development to fit onto more central sites by reducing the footprint of the proposal ‘ (paragraph 3.16); this may involve a reduction in floorspace, more innovative site layouts, multi-storey development and reduced car parking.
2.52 Nevertheless, PPS6 retains the onus on LPAs to be ‘…realistic in considering whether sites are suitable, viable and available’ (paragraph 3.16). LPAs are also required to ‘…take into account any genuine difficulties, which the applicant can demonstrate are likely to occur in operating the applicant’s business model from the sequentially preferable site, in terms of scale, format, car parking provision and the scope for disaggregation, such as where a retailer would be required to provide a significantly reduced range of products’.
2.53 Thus, PPS6 explicitly requires that, in determining applications, account be taken of the applicant's business model. Allied to this point, we note the definition of ‘retail warehouses’ provided in Table 3 of Appendix A to PPS6, namely: ‘Large stores specialising in the sale of household goods (such as carpets, furniture and electrical goods), DIY items and other ranges of goods, catering mainly for car-borne customers.’ There is an implicit recognition in the last part of the sentence, i.e. ‘…catering mainly for car-borne customers’, that retail warehouses require adjacent surface level car parking.
2.54 Paragraph 3.17 retains the requirement to apply the test of disaggregation so as to assess whether the constituent parts of a development proposal that comprises several components can be accommodated on sites in sequentially preferable locations. Whilst paragraph 3.18 would seem to reverse the provisions in draft PPS6 that would have enabled the promoter of a single retail unit to escape the test of disaggregation, we consider the new advice to be confusing and contradictory; the first sentence of paragraph 3.18 seems to say, in effect, that a single retailer or single leisure operator should not be expected to disaggregate, provided the scope for disaggregation has been demonstrated. This is a nonsense and, in our opinion, an early clarification of the provisions of paragraph 3.18 is essential.
Retail and Leisure Capacity Study Final Report
Roger Tym & Partners M9153, August 2007 11
2.55 Paragraph 3.19 retains the PPG6 tests of ‘availability within a reasonable period of time’, ‘suitability’ and ‘viability’ in applying the sequential test. However, the phrase ‘within a reasonable period of time’ is to be determined on the merits of each particular case.
Assessing Impact
2.56 Paragraph 3.20 requires impact assessments to be undertaken for any application for a main town centre use which would be in an edge-of-centre or out-of-centre location and which is not in accordance with an up-to-date development plan strategy. Paragraph 3.20 also provides that:
‘Where a significant development in a centre, not in accordance with the development plan strategy, would substantially increase the attraction of the centre and could have an impact on other centres, the impact on other centres will also need to be assessed’.
2.57 Paragraph 3.21 retains the PPG6 requirement to assess impact on a cumulative basis, taking into account recent permissions, developments under construction and completed developments. There is also an assertion at the end of paragraph 3.21 that ‘…the identification of need does not necessarily indicate that there will be no negative impact’.
2.58 In assessing potential impacts LPAs are required to consider the likelihood of:
risk to the spatial planning strategy for the area;
effects on future public or private investment;
negative and positive (through clawback) impacts on the turnover of existing centres;
changes to the range of services provided by centres;
impact on the number of vacant properties in the primary shopping area;
changes to the physical condition of the centre and to its role in the economic and social life of the community; and
implications for the evening and night-time economy.
2.59 The level of detail and type of evidence required is to be proportionate to the scale of the proposal, but impact assessments will be required for all retail and leisure proposals of over 2,500 sq.m gross and occasionally for smaller developments (paragraph 3.23).
Accessibility
2.60 In determining whether proposed developments are genuinely accessible, LPAs should assess distance from existing/proposed public transport facilities, frequency and capacity of public transport services and whether access for pedestrians, cyclists and disabled people is easy, safe and convenient.
2.61 LPAs must also assess whether the proposal is likely to have impacts on the overall distance travelled by car, local traffic levels and congestion, having taken account of any public transport and traffic management measures secured as a result of the development.
Local Issues and Material Considerations
2.62 Paragraph 3.28 confirms the advice in Chapter 2 in stating that material considerations may include physical regeneration, employment considerations, economic growth and social inclusion.

Retail and Leisure Capacity Study Final Report
Roger Tym & Partners M9153, August 2007 12
Extensions to Existing Development
2.63 Paragraph 3.29 confirms that all of the development control tests apply equally to proposals for extensions to facilities which are located in edge-of-centre and out-of-centre locations, but there is a floorspace threshold for extensions of 200 sq.m below which the sequential approach does not apply.
Ancillary Uses
2.64 Shops proposed as ancillary elements to petrol filling stations, motorway service areas, sports stadia, rail stations, airports and so on must be limited in scale, genuinely ancillary and have a limited range of goods.
Conditions
2.65 Paragraphs 3.31 and 3.32 retain PPG6’s stance in relation to the use of conditions which are designed to ensure that the character of a development cannot change over time so as to create a form of development which is unacceptable. Such conditions include:
prevention of sub-division;
controls on ancillary elements;
limits to internal alterations designed to increase floorspace by specifying the maximum floorspace to be permitted, including any floorspace created by mezzanines; and
limits to the ranges of goods to be sold and the mix of convenience and comparison goods.
2.66 Conditions are also advocated as a means for resolving issues relating to impacts on traffic and the amenity of local residents – for example, controls on the timing of deliveries.
Monitoring and Review 2.67 Paragraph 4.1 of PPS6 suggests that comprehensive monitoring is essential to the
effective planning and management of town centres. Reference is made to the provisions of the Planning and Compulsory Purchase Act 2004, which requires RPBs and LPAs to submit Annual Monitoring Reports that include analysis of performance against defined core output indicators, those of most relevance being:
the amount of completed retail, office and leisure development (Indicator 4a); and
the percentage of completed retail, office and leisure development in town centres (Indicator 4b).
2.68 Paragraph 4.3 identifies three further matters to be kept under review, as follows:
‘the network and hierarchy of centres (at both the regional and local levels);
the need for further development (as set out in Chapter 2); and
the vitality and viability of centres (at the local level)’
Measuring Vitality and Viability
2.69 The final paragraph of PPS6 sets out the key indicators to be used in measuring the vitality and viability of town centres and in monitoring their health; these can be summarised as follows:
the diversity of main town centre uses (by number, type and amount of floorspace);
the amount of retail, leisure and office floorspace in edge-of-centre and out-of-centre locations;

Retail and Leisure Capacity Study Final Report
Roger Tym & Partners M9153, August 2007 13
the potential capacity for growth or change in the network;
retailer representation;
shopping rents;
the proportion of vacant street level property;
commercial yields;
pedestrian flows;
accessibility;
customers’ and residents’ views and behaviour;
perception of safety and occurrence of crime; and
the state of the town centre’s environment.
Conclusions and Changes in Emphasis 2.70 In our assessment, the key changes in national policy emphasis arising as a result of
PPS6 are:
i) a requirement for a much more proactive plan-led approach to planning for town centres through regional and local planning;
ii) much more emphasis on the need to develop a network and hierarchy of centres at both the regional and local levels; and
iii) a much greater involvement on the part of the public sector in the management and implementation of changes in town centres and in the monitoring of their vitality and viability.
2.71 Thus, RPBs are required to:
i) set a vision and strategy for the region’s growth and a strategic framework for planning at the local level;
ii) develop a strategic framework for the development of a network of centres;
iii) make strategic choices about those centres of regional and sub-regional significance where major growth is to be encouraged;
iv) identify the need for new higher order centres;
v) assess the need for additional floorspace in the comparison retail, leisure and office sectors;
vi) identify where needs would best be met having regard to capacity and accessibility considerations; and
vii) identify the need for major town centre development of regional or sub-regional significance.
2.72 In turn RPBs and LPAs are required to consider:
i) whether there is a need to avoid an over-concentration of growth in the higher level centres;
ii) the need for investment in those centres requiring to be regenerated; and
iii) the need to address deficiencies in the network.
2.73 In preparing their development plan documents within the context set by the RSS, LPAs, in turn, must:
iv) select appropriate existing centres to accommodate growth, making the best use of existing land and buildings, but extending the centres where appropriate using
Retail and Leisure Capacity Study Final Report
Roger Tym & Partners M9153, August 2007 14
tools such as the Action Plans, CPOs and strategies to address transport, land assembly, crime prevention and enhanced design;
v) manage the role of existing centres through the promotion of specialist activities, or specific types of uses; and
vi) plan for new centres of an appropriate scale in areas of growth, or where there are deficiencies in the existing network.
2.74 Where growth cannot be accommodated within existing centres, LPAs are to plan for the extension of the primary shopping area, if there is a need for retail provision, and for the extension of the town centre as a whole to accommodate other main town centre uses.
2.75 The key considerations to apply in selecting sites for development remain similar to those identified in PPG6 and subsequent ministerial statements. However, there is more emphasis given to the issue of scale, so that LPAs are to consider setting indicative upper limits for the scale of development likely to be permissible in different types of centres.
2.76 Strong emphasis continues to be given to the sequential approach, but it does not appear that the Government is seeking to impose a moratorium against out-of-centre development, albeit that such development will be rare. If there is a need for larger stores, and they cannot be accommodated within the existing primary shopping area, they are to be directed to edge-of-centre locations. The guidance is unclear as to whether an individual retailer or leisure operator faces the test of disaggregation (paragraph 3.18), but all parties must demonstrate flexibility in relation to scale, format, design and the amount of car parking in seeking to promote development within existing centres.
2.77 We consider, however, that the new guidance is not particularly informative for LPAs that have town centres which face significant physical and environmental constraints to their expansion, such as spa towns, cathedral cities and so on. Nor is the policy statement of much assistance in helping RPBs and LPAs to choose between competing uses where the needs in the retail, leisure, office and cultural sectors are projected to substantially exceed the ability of existing centres – or indeed expanded centres – to accommodate them.
2.78 Finally, we note the Government’s intention to publish further guidance on undertaking assessments of the need for, and the likely impact of, proposals for retail and leisure developments (paragraph 2.38 of PPS6) and further guidance in relation to the sequential approach (paragraph 2.47 of PPS6).
Implications of the New White Paper of May 2007 2.79 Paragraph 7.55 of the May 2007 White Paper, which is entitled Planning for a
Sustainable Future, suggests that there will be a review of PPS6 so as to ‘…replace the need and impact tests with a new test which will have a strong focus on our town centre first policy, and which promotes competition and improves consumer choice avoiding the unintended effects of the current need test’. In our assessment, what is proposed in the White Paper is utterly unclear and LPAs will have to await the actual wording of the revision to PPS6 to understand the consequence. Little weight can be given, therefore, to this aspect of the White Paper.

Retail and Leisure Capacity Study Final Report
Roger Tym & Partners M9153, August 2007 15
3 THE REGIONAL AND LOCAL PLANNING POLICY CONTEXTS
Regional Planning Policy
Regional Planning Guidance for the West Midlands (RPG11, June 2004)
3.1 The former Office of the Deputy Prime Minister (ODPM) published Regional Planning Guidance for the West Midlands (RPG11) on 16 June 2004. RPG11 became the Regional Spatial Strategy (RSS) on commencement of the Planning and Compulsory Purchase Act 2004 and now forms part of the development plan for the purposes of Section 38(6) of the Act.
3.2 However, paragraph 1.31 of RPG11 recognises that it ‘...does not fully accord with the advice in PPG11...’ and that ‘... it is insufficiently regionally specific in places...’ Of fundamental importance in the context of this study is the recognition of the need for an early review of various aspects of RPG11, including the strategy for town and city centres. Thus, paragraph 7.58 of RPG11 states that the regional planning body must undertake further work in order to identify the centres where major new retail, leisure and office investment should be focused.
3.3 A review of RPG11 is currently underway in the form of the West Midlands Spatial Strategy and is considered later in this section.
Overview, Vision and Challenges
3.4 The long-term vision for the West Midlands Region, within the Government’s overarching aim of achieving sustainable development, is set out in paragraph 2.2 of RPG11, as follows:
‘The overall vision for the West Midlands is one of an economically successful, outward looking and adaptable Region, which is rich in culture and environment, where all people, working together, are able to meet their aspirations and needs without prejudicing the quality of life of future generations.’
3.5 Within the overall vision is the ambition to secure a Region with ‘...diverse and distinctive cities, towns, sub-regions and communities, with Birmingham as a “World City” at its heart’ (paragraph 2.4d).
3.6 Paragraph 3.4 of RPG11 identifies the following four major challenges in seeking to realise the vision for the region:
urban renaissance – developing the major urban areas (MUAs) in such a way that they can meet their own economic and social needs, so as to reverse the decentralisation of jobs and people facilitated by earlier strategies;
rural renaissance – addressing more effectively the major changes which are challenging the traditional roles of rural areas and the countryside;
diversifying and modernising the Region’s economy – ensuring that opportunities for growth are linked to needs, so as to reduce social exclusion; and
modernising the transport infrastructure of the West Midlands – to support the sustainable development of the Region.
Spatial Strategy
3.7 RPG11’s Spatial Strategy can be broadly summarised as enabling all parts of the Region to sustainably meet their own needs, in a mutually supportive way. Paragraphs 3.6 to 3.10 explain how different responses will be required in different parts of the Region, but that those responses should be complementary to each other. However, in both the MUAs and in the Region’s other large settlements there is a need for ‘…a

Retail and Leisure Capacity Study Final Report
Roger Tym & Partners M9153, August 2007 16
balanced network of vital and vibrant town and city centres as the strategic focus for major retail, leisure and office developments’
3.8 Paragraph 3.11 goes on to state that:
‘The key to the Spatial Strategy is achieving an urban renaissance in the four MUAs of Birmingham/Solihull, the Black Country, Coventry and the North Staffordshire conurbation. Nonetheless, the ultimate aim of the Spatial Strategy is a Region made up of a dynamic network of places, all important in their own right and with distinct characteristics, but with reinforcing economic, cultural and social functions. An important part of this is the development of a balanced network of town and city centres (PA11) that will act as the focus for major investment in retail, leisure and office developments.’
3.9 Thus, each of the MUAs needs to develop enhanced economic and social roles; each of the major shire towns beyond the MUAs must act as a focus for new investment so as to meet the economic, social and cultural needs of surrounding rural areas; and other main towns and villages must deliver improved local services and their own distinctive roles and character. The emphasis is very much on a role for each place, but with all places abiding by the principle of complementarity.
3.10 Three of the ten Spatial Strategy Objectives set out in paragraph 3.14 of RPG11 are particularly relevant to the study, these being:
‘c) to create a joined-up multi-centred Regional structure where all areas/centres have distinct roles to play;
e) to support the cities and towns of the Region to meet their local and sub-regional development needs; and
i) to promote the development of a network of strategic centres across the Region’
Urban Renaissance
3.11 The four MUAs within the Region are to be the main focus of urban renaissance. The MUAs are the major economic driver and source of employment opportunities for the Region and contain over half its population. The central aim of the RPG is to reverse decentralisation from these areas to the more rural parts of the Region.
3.12 Rejuvenated city, town and local centres are seen as being crucial in the creation of high quality living and working environments and as foci for regeneration (Policy UR1v and paragraphs 4.15 to 4.18). Indeed, Policy UR3: ‘Enhancing the Role of City, Town and District Centres’ recognises that city, town and district centres and, in particular, those centres identified in the network of town and city centres in Policy PA11, should be enhanced to play a leading role in the Region’s urban renaissance and as drivers of economic growth. Policy UR3 states that this will be achieved by, inter alia, developing place-specific strategies that promote a sense of identity and local distinctiveness.
3.13 Outside the MUAs, twelve ‘local regeneration areas’ (LRAs) are identified by Policy UR2, based on those areas that contain at least one of the most deprived 20 per cent of wards nationally. Nine of the LRAs are focused around centres that are within the network of 25 strategic town and city centres identified by Policy PA11; one of the nine is Burton-upon-Trent. Policy UR2 encourages local authorities, and other agencies, to develop regeneration strategies and improve access between concentrations of local deprivation within the LRA towns and areas of economic opportunity.
Prosperity for All
3.14 The future performance of the Region’s economy is seen as being critical to the success of the Spatial Strategy, with a clear link between economic performance and quality of life. A spatial focus for economic activity is given through the identification of:

Retail and Leisure Capacity Study Final Report
Roger Tym & Partners M9153, August 2007 17
i) six Regeneration Zones (five urban and one rural), reflecting the priorities of the Regional Economic Strategy (Policy PA2);
ii) three High-Technology Corridors (Policy PA3); and
iii) a network of 25 town and city centres, one of which is Burton-upon-Trent (Policy PA11).
3.15 The purpose of the network of 25 centres identified under Policy PA11 is explained in paragraphs 7.54 to 7.67 of RPG11. Paragraph 7.54 emphasises that the health of the centres ‘...will be a major determinant of the quality of life for everyone’ and paragraph 7.55 emphasises the need for complementarity between centres in promoting polycentricity. Thus, RPG11 does not set out a formal hierarchy of roles for the centres, other than identifying Birmingham as the regional capital and an international city (Policy PA12). Instead the role of the centres is meant to be complementary, within the ‘polycentric’ concept3.
3.16 Policy PA11 seeks to ensure that the network of 25 strategic town and city centres is the focus for major new retail developments (that is, those with gross floorspace of 10,000 sq.m and above, excluding floorspace dedicated to the retailing of convenience goods), and large-scale leisure and office developments (that is, those with a gross floorspace of 5,000 sq.m and above).
3.17 To support the drive to focus significant retail development in the strategic town and city centres, Policy PA13 does not envisage that ‘...any further large-scale (10,000 sq.m gross) out-of-centre retail developments or extensions to existing developments will be required during the period covered by this RPG’.
Emerging Regional Spatial Strategy
3.18 As indicated above, following the publication of the West Midlands RSS in June 2004, the Secretary of State recommended that some issues be immediately looked at and developed further. The Regional Planning Body (RPB) took the decision to carry out this task in a phased way.
3.19 Phase One of the review concentrated on the Black Country Study, where the aim was to ‘fast-track’ urban renaissance proposals through to implementation. The Phase One Draft Revision was subject to examination by an independent panel appointed by the Secretary of State in January 2007. The Panel Report has since been published and is now being considered by the Secretary of State.
3.20 Phase Two of the review, launched in November 2005, considers the issues of housing, employment, transport and waste. Spatial Options for Phase Two were published for consultation between January and March 2007. The options outlined in Phase Two in relation to retail and ‘strategic centres’ are based upon the findings of the West Midlands Regional Centres Study, which is discussed in more detail below.
3.21 Phase Three of the review is due to start later in 2007 and will look at critical rural services, recreational provision, regionally significant environmental issues and the development of a framework for provision of Gypsy and Traveller sites.
West Midlands Regional Centres Study
3.22 In January 2005, the West Midlands Regional Assembly appointed Roger Tym & Partners to undertake the West Midlands Regional Spatial Strategy – Regional Centres Study. The prime purpose of the study was to assist the RPB in identifying the centres in the Region where major new retail, leisure and office development should be focused in order to support urban regeneration, achieve a balanced network, minimise the risk of harm elsewhere, assist vulnerable centres and support the sustainability
3 As put forward in ‘A Polycentric Framework for the West Midlands’ (Ecotec, 2000).

Retail and Leisure Capacity Study Final Report
Roger Tym & Partners M9153, August 2007 18
agenda. In addition, we were required to identify where significant development would not be appropriate.
3.23 With regard to the retail sector, the study identified a likely ‘mid-point’ requirement for an additional 505,000 sq.m to 674,000 sq.m net floorspace in the period to 2021. In contrast, commitments for comparison retailing total approximately 203,000 sq.m sales area. Thus, the residual requirement for comparison goods floorspace ranges from 302,000 sq.m sales area to 471,000 sq.m sales area, which would equate to a range of around 430,000 sq.m gross to 670,000 sq.m gross.
3.24 In our final report, we advocated a strategy based on a more balanced distribution of forecast growth, directing development to all strategic centres in the Region, but concentrating on the eleven centres within the MUAs and the five Sub-Regional Foci Centres. Provision for significant investment in Birmingham, as the regional capital and emerging World City, should also be made.
3.25 We concluded that there is no need for any major change of direction in the review of the RSS; the desire to focus investment in the Region’s MUAs and in the Sub-Regional Foci Centres is well founded.
3.26 With specific regard to Burton-upon-Trent town centre we found, based on on-foot surveys of the centre and analysis of key vitality and viability indicators, that the town centre is generally performing well and is reasonably healthy, albeit with some room for improvement. Indeed, Burton performed well against a range of indicators, including trends in retail rents, yields, requirements, vacancy rates, diversity of uses and representation from large stores (‘high street’ chains). The main shortcoming identified in Burton was the lack of more high-profile retailers, with poor representation in this respect in comparison to similar-sized neighbouring centres such as Leamington Spa, Hereford and Telford.
3.27 The Regional Centres Study also considered the capacity for additional retail floorspace in each centre up to 2021. Our forecasts identified scope for between 16,000 sq.m and 19,000 sq.m of additional comparison retail floorspace (net sales area) in Burton-upon-Trent by 2021 using our recommended ‘mid-point range’, or up to 25,000 sq.m under our most optimistic forecast. Moreover, we concluded that Burton town centre has the physical capacity to accommodate significant retail growth, with sites such as the Riverside Centre and Rugby Club ground potentially available for redevelopment.
Local Planning Policy
East Staffordshire Local Plan, 2001-2011 (July 2006)
3.28 The adopted East Staffordshire Local Plan advises that the spatial strategy for the Borough ‘is broadly one of concentrating most development in the two urban centres of Burton-upon-Trent and Uttoxeter, and restricting new development in the countryside’. Furthermore, Policy CSP4 confirms that ‘both Burton-upon-Trent and Uttoxeter are towns with scope for regeneration to assist economic recovery and diversification and to improve the physical environment’.
3.29 With respect to retail and town centre policy, the Local Plan notes that whilst future expenditure growth is limited in terms of convenience retailing, it is potentially substantial in relation to comparison retail expenditure. However, with the exception of the site for a retail warehouse at Wellington Road, Burton-upon-Trent and existing retail commitments, the Local Plan allocates no new sites for comparison retailing.
3.30 The Local Plan explains that Uttoxeter is a typical market town, which serves as a centre for a wide area of the countryside. The Local Plan notes the Council’s aspiration to increase the prosperity of Uttoxeter and that, as such, the potential for Uttoxeter to accommodate some retail expansion will be seriously considered. Indeed, Uttoxeter is designated as an ‘Action Area’ in the Local Plan, in order to encourage the

Retail and Leisure Capacity Study Final Report
Roger Tym & Partners M9153, August 2007 19
revitalisation of the town centre and its surrounding area through selective redevelopment and enhancement.
3.31 Under the provisions of the Planning and Compulsory Purchase Act (2004), East Staffordshire’s Local Plan can be ‘saved’ for a period of up to three years post-adoption (to 2009). However, work has already commenced on the preparation of Development Plan Documents (DPDs) to feed into the Local Development Framework, which will eventually replace the adopted Local Plan. Consultation on the Issues and Options of the first DPD, the Core Strategy, is anticipated in July 2007.
Town Centre Studies
Chase & Partners - Burton-upon-Trent Retail Study (2000) and Addendum (2004)
3.32 Chase & Partners was appointed by East Staffordshire Borough Council in 2000 to research and present a retail study of Burton-upon-Trent town centre. The study included a health check of the town centre and also forecast future growth and the capacity for retail floorspace up to 2011.
3.33 In terms of the health of the town centre, the study concluded that ‘Burton-upon-Trent is a vital and viable centre’. Indeed, the health check reported that the town has a good range of comparison multiple retailers and an ‘excellent complement of modern food stores in and on its edge’. The study also found that the vacancy rate in the town centre was low, prime Zone A retail rents were improving, yields were static, and there were no obvious pockets of long-standing dereliction. In sum, the health check notes that ‘the picture to emerge is very encouraging’.
3.34 Furthermore, the quantitative analysis of retail spend found that in 2000, 80 per cent of expenditure on convenience goods generated within the primary catchment area was retained within Burton-upon-Trent and Swadlincote, whilst 55 per cent of expenditure on comparison goods was retained within Burton-upon-Trent town centre. The quantitative analysis was updated by an Addendum in 2004, which reported that the retention rate for expenditure on convenience goods remained static at 80 per cent. However, Chase & Partners stated that the retention rate for expenditure on comparison goods was lower than that identified in 2002, at 45 per cent.
Uttoxeter Masterplan (2003)
3.35 Uttoxeter is part of the Market Towns Initiative and one of three towns in Staffordshire to receive funding under this programme, promoted by the Countryside Agency and funded by Advantage West Midlands. Following the town’s inclusion in the Initiative the Uttoxeter Plus Board (a partnership made up of the Borough and County Councils, local people and businesses) was set up, with overall objectives to:
increase employment in the area;
improve the town centre for the benefit of residents and visitors;
improve facilities for users; and
improve all types of movement through the Uttoxeter Plus area.
3.36 The Borough Council, on behalf of the Uttoxeter Plus Board, instructed consultants Taylor Young, supported by GVA Grimley, to prepare a Masterplan and delivery strategy for the town centre. The final masterplan was submitted in September 2003, and incorporated an Urban Design Framework for development and environmental projects. However, further work has since been done in relation to the area east of Town Meadows Way and north of Brookside Road. A revised Design/Development Guidance document, superseding the Masterplan in this area, was approved in July 2004.
3.37 The overarching concept for the Masterplan is encapsulated in the following vision:

Retail and Leisure Capacity Study Final Report
Roger Tym & Partners M9153, August 2007 20
‘A multi-functional, attractive Town Centre that incorporates a wide-ranging mix of activities set within a high quality network of pleasant streets and spaces, which create a strong identity and a place where people want to live, work and visit. A Town Centre that builds upon its strategic location, its unique historic environment and its shops and markets, to attract and retain new investment for the benefit of local business and residential communities’.
3.38 The key features of the concept include revitalising the historic core of the town centre, taking on board the opportunities that the cattle market’s proposed relocation presents, and capitalising on the high quality townscape, whilst developing better linkages to the surrounding areas.
3.39 The Masterplan identifies a number of potential development sites, which could assist in achieving the overall aims of the Masterplan. Eight sites are identified as being of particularly high priority, because their development would have an immediate positive impact on the town centre and they are capable of making a significant contribution to the town centre. These high priority sites are as follows:
Cattle Market Site;
Cattle Market Car Park;
Maltings Shopping Precinct;
Angus McKinnon Car Sales and Storage;
JCB Main Site;
JCB Secondary Site;
JCB Storage Site; and
Wagon Park (JCB owned).
3.40 To help ensure implementation of the Masterplan and the promotion of these development sites, the Borough Council has identified Uttoxeter Town Centre as an Action Area in the adopted Local Plan, as detailed above.

Retail and Leisure Capacity Study Final Report
Roger Tym & Partners M9153, August 2007 21
4 REVIEW OF KEY RETAIL AND LEISURE MARKET TRENDS
Introduction 4.1 In this section, we outline the key national trends in various sub-sectors of the retail
and leisure markets, highlighting, wherever appropriate, those that we consider could have – or are already having – an impact in East Staffordshire. This review is drawn from a range of published data sources, including research by Verdict, the New Economics Foundation, CB Richard Ellis and Colliers CRE. The sector commentaries are prefaced by a résumé of overarching national trends in expenditure and sales.
Retail Sector
National Trends in Expenditure
4.2 Table 4.1 reports the short-term past trend in volume of retail sales (i.e. real change in constant prices) between 2000 and 2005. Non-food retailers in general have secured significantly higher growth in their volume of sales than food retailers (31.8 per cent compared to 19.7 per cent). The growth in volume of sales has been highest amongst textiles, clothing and footwear retailers (43.8 per cent), followed by retailers of household goods (31.2 per cent).
Table 4.1 Volume of Retail Sales in Great Britain at 2000 Prices (2000 = 100) All
Retailers Food
Retailers Non-
Specialised Stores
(Non-Food)
Textiles/ Clothing/ Footwear
Household Goods
Other Non-Food
Retailers
All Non-Food
2000 100.0 100.0 100.0 100.0 100.0 100.0 100.0
2001 106.1 104.1 105.9 109.4 110.9 105.9 108.5
2002 112.7 108.1 110.8 120.9 120.8 111.6 116.2
2003 116.4 111.9 113.6 128.7 127.7 117.5 121.3
2004 123.3 116.4 117.3 137.9 135.4 127.1 129.6
2005 125.8 119.7 119.3 143.8 131.2 118.0 131.8
% Change 2000 to
2005 25.8 19.7 19.3 43.8 31.2 18.0 31.8
Source: Retail Sales, ONS Economic Trends No.637 (December 2006), Table 5.8
4.3 Figure 4.1, which is reproduced from MapInfo’s Information Brief 06/2, presents an analysis of per capita retail expenditure over a longer period, from 1980 to 2005. The data reveal consistently higher rates of expenditure growth on comparison goods – for which the average real growth rate between 1983 and 2005 has been 5.2 per cent, per capita, per annum – than for convenience goods, for which the average growth rate over the same period has been a mere 0.5 per cent, per capita, per annum. Although there has been some cyclical variation in the comparison goods expenditure growth rate, the general trend has been upwards, with the growth rate exceeding 5 per cent in every year from 1997 to 2004. Moreover, although the growth rate slowed to 2.9 per cent between 2004 and 2005, the latest forecasts from Experian Business Strategies4 and Oxford Economic Forecasting5 suggest comparison goods expenditure growth rates of 3.8 per cent, per capita, per annum, and 4.4 per cent, per capita, per annum
4 Retail Planner Briefing Note 4.0, Experian, October 2006. 5 MapInfo Information Brief 06/02, September 2006.

Retail and Leisure Capacity Study Final Report
Roger Tym & Partners M9153, August 2007 22
respectively over the coming decade – the latter being used in our forecasts of future retail need, as detailed in Section 7 of this report.
Figure 4.1 Long-term Per Capita Retail Expenditure Trends
Source: MapInfo, Information Brief 06/02, September 2006

Retail and Leisure Capacity Study Final Report
Roger Tym & Partners M9153, August 2007 23
Overall Development Pipeline
4.4 Planning policy has substantially reduced the flow of new out-of-centre retail development, with developers encouraged to regenerate the more complicated edge-of-centre and in-centre sites. As a consequence, the UK is in the midst of a construction boom in town centre-located shopping centres, surpassing even the building boom of the 1970s. Whilst there are signs that this growth may now be slowing, Verdict still predicts that in-centre shopping space will increase by 6 per cent between 2005 and 20106.
4.5 In Quarter 3 of 2006, the shopping centre floorspace development pipeline stood at some 5.56 million sq.m floorspace gross, with an increase at all stages of the planning process, according to CB Richard Ellis7. There is a particularly strong pipeline of new shopping centre developments for at least two years ahead; with four 1 million+ sq.ft schemes scheduled to open, in Bristol (Broadmead), Liverpool (Paradise Street), White City and Derby (Eagle). Retail warehouse floorspace pipeline levels declined over the last six months to 2.28 million sq.m gross, their lowest level since June 2003, as planning restrictions continue to constrain their development.
Location of Retail Investment
Sales and Number of Outlets
4.6 Despite the increasing difficulty associated with securing planning permission for retail development in out-of-centre locations, Verdict asserts that the ‘town centre’8 accounted for 46 per cent of total retail sales in 2005, compared with 50 per cent in 1995 (Figure 4.2). Much of this erosion of ‘town centre’ sales can be attributed to the continued strength of existing retail facilities in out-of-centre locations and the growth in e-tail.
Figure 4.2 ‘Town Centre’ Share of Total Retail Sales, 1995-2005
50.4 50.449.7 49.5 49.3 49.4
48.5 48.247.6 47.2
46.3
4445464748495051
1995 1996 1997 1998 1999 2000 2001 2002 2003 2004 2005
%
Source: Verdict, UK Town Centre Retailing 2006, September 2006. Note: ‘High street’ figures include out-of-centre shopping malls, such as Bluewater.
4.7 The larger format of out-of-centre stores (compared with town centre stores, which typically have smaller footplates) means that retailers require fewer stores in order to increase sales, hence the relative decline of ‘high street’ sales. Nevertheless, whilst
6 Source: Verdict, UK Town Centre Retailing 2006, September 2006. 7 Source: CB Richard Ellis, UK Retail Briefing, Issue 2, 2006. 8 Verdict’s definition of ‘town centre’ is “deliberately broad” to include all areas that offer comparison shopping;
it includes traditional high streets, in-town shopping centres and regional ‘out-of-town’ (Verdict’s term) shopping malls such as Meadowhall, Merry Hill, the Trafford Centre, the Lakeside Mall and Bluewater. Verdict’s ‘out-of-town’ definition includes retail parks (minimum three retailers/50,000+ sq.ft of trading space). We therefore consider that Verdict’s ‘out-of-town’ definition embraces both ‘out-of-centre’ and ‘out-of-town’ locations as defined by Table 2 of PPS6.

Retail and Leisure Capacity Study Final Report
Roger Tym & Partners M9153, August 2007 24
the share of sales has drifted towards the out-of-centre retailers and e-tail (Figure 4.2), the ‘high street’ has steadily increased its share of all retail outlets over the past decade, largely as a result of Government policy (Figure 4.3). This trend looks set to continue, particularly with the virtual end of the development of new, out-of-centre regional shopping centres such as Lakeside and Bluewater and the focus instead on town centre schemes.
Figure 4.3 ‘Town Centre’ Outlet Numbers – Share of All Outlets, 1995-2005
54 54.154.6
55.3 55.1 55.354.9
55.856.2 56.1 56.2
52
53
54
55
56
57
1995 1996 1997 1998 1999 2000 2001 2002 2003 2004 2005
%
Source: Verdict, reported in Datamonitor, UK Town Centre Retailing 2006, September 2006
4.8 Verdict provides interesting information on the sales performance of 12 key ‘town centre’9 retail brands from a cross-section of retail sectors: Marks & Spencer, Boots, Argos, Next, Debenhams, John Lewis, Woolworths, Wilkinson, WH Smith, House of Fraser, Primark and HMV. According to Verdict these 12 key retailers collectively accounted for 28.1 per cent of all money spent at ‘high street’ retailers in 2005, up from 24.1 per cent in 2000 and from 22.9 per cent in 1995, indicating that these retailers are gradually gaining ground at the expense of smaller retailers. CB Richard Ellis confirms that larger retailers have increased their market share in recent years, but that this now appears to be plateauing10. However, the rapid expansion of large retailers has impacted significantly on smaller concerns, particularly those operating in secondary market towns.
4.9 Of the 12 retailers listed above, Woolworths and WH Smith achieved the lowest levels of sales growth between 2000 and 2005, with Woolworths’ sales actually decreasing by 6.9 per cent and WH Smith’s increasing by 1.1 per cent, which compares unfavourably with the ‘town centre’ average growth over the same period of 11.8 per cent11. By far the most significant growth in retail sales experienced over the same time period is that of Primark, which increased sales by 186.4 per cent. Next has embarked on the most aggressive expansion of any of the 12 and increased sales by 95.0 per cent over the five year period, whilst variety store retailer Wilkinson ranks third on turnover growth between 2000 and 2005, boosting its sales by 62.8 per cent.
4.10 National retail trends indicate a continuing contraction in the number of shop units; total store numbers in the UK declined by 12.1 per cent between 1995 and 2005. Whilst most of this decline is attributable to the closure of smaller and more specialist food retailers often located in neighbourhood centres, the number of town centre shops fell by 1.0 per cent during 2005, taking the total below 148,000 following a similar decline in 2004. Whilst there have been numerous retail failures over the past couple of years, much of the space they have vacated has been taken up by expanding retailers. The failure of Allders freed up units for use by Bhs, Debenhams and Primark,
9 See previous footnote for Verdict’s definition of ‘town centre’. 10 Source: CB Richard Ellis, UK Retail Briefing, Issue 2, 2006. 11 Source: Verdict, UK Town Centre Retailing 2006, September 2006.

Retail and Leisure Capacity Study Final Report
Roger Tym & Partners M9153, August 2007 25
and the closure of Littlewoods’ town centre stores has provided larger units for a range of retailers including New Look, Peacocks, Primark, Sports World and Wilkinson.
In-town Retail Development Trends
4.11 On the high street, Colliers CRE12 reports robust rental growth in market and sub-regional towns, fuelled by retailers competing for 2,000 to 4,000 sq.ft units, including Bon Marché, Savers, Ethel Austin and Clinton Cards. Relatively small units are also required by coffee shop operators and the mobile phone market also remains extremely active. Both sectors, together with computer games retailers Game and Gamestation, have underpinned demand for shop units of between 1,000 and 2,000 sq.ft.
4.12 Within the fashion sector, River Island, Zara, Arcadia, French Connection, H&M, Next and the Arcadia Group continue to acquire new stores. In addition to its requirement for large stores of around 30,000 sq.ft, Arcadia is also seeking smaller high street units for its individual brands. There has been a heightening of demand in the Use Class A2 sector, with significant activity from some banks and building societies, such as Abbey, as well as from betting shops, such as Paddy Power, William Hill and Coral.
4.13 Verdict13 forecasts that the average town centre store size is set to increase by 4.6 per cent to 2,187 sq.ft by 2011, with many retailers moving into larger units as they broaden their ranges. The sizes of units in many new shopping centre developments are being designed by developers with this in mind, evident from the likes of Primark, TK Maxx and Next securing anchor units in many schemes. Other fashion retailers, such as New Look, are also migrating to larger units in town centres to drive footfall and boost their sales densities.
4.14 Despite the recent increases in the cost of borrowing, demand from private individuals for units valued at under £2 million, with a covenant of 10 years or more, is still strong. Demand for units valued at between £2 to £5 million remains reasonably strong for smaller institutional funds and private individuals, for well located properties in the best towns, with prime yields at or about 4 per cent. However, the depth of demand for larger premises valued at between £5 to £15 million remains relatively limited, with overseas investors principally active in the market.
4.15 Verdict14 reports that, in the 12 months to December 2005, the average prime town centre retail rent rose by 3.6 per cent, its highest rate of increase for six years. The increase in rents suggests robust underlying demand for retail units. However, following disappointing trading performances at Christmas 2005, many retailers are less willing to pay higher rents and the annual prime rent rise in the year to June 2006 fell back to 2.9 per cent. The large stock of in-centre retail floorspace in the pipeline is also likely to temper retail rental increases in coming years.
Out-of-Centre Retail Trends
4.16 Bulky goods retailers are currently experiencing challenging trading conditions, which is having a knock-on effect on development activity, particularly in the DIY and furniture sectors. Conversely, high street names such as Next, New Look and Marks & Spencer continue to expand in out-of-centre locations.
4.17 Verdict reports that ‘out-of-town’ retailers accounted for 28.1 per cent of retail sales in 2000, with this figure rising to 30.5 per cent in 2005. However, given the noted difficulties experienced by certain sectors, the growth in ‘out-of-town’ retailers’ market share can primarily be attributed to the gain in share at grocers’ ‘out-of-town’ superstores, with Tesco, Sainsbury’s and Asda all extending their offer of non-food and, in doing so, gaining sales from high street retailers.
12 Source: Colliers CRE, Midsummer Retail Report 04, July 2004. 13 Source: Verdict, UK Retail Futures 2011: Sector Summary, March 2007. 14 Source: Verdict, UK Town Centre Retailing 2006, September 2006.

Retail and Leisure Capacity Study Final Report
Roger Tym & Partners M9153, August 2007 26
4.18 Increasingly, traditional high street retailers are seeking to diversify their formats and provide out-of-centre facilities. For example, Boots and WH Smith are investing in out-of-centre retail park stores, although they are finding it difficult to differentiate their offer sufficiently from their high street stores, and therefore tend to merchandise a greater proportion of lower value items in their out-of-centre stores. Clothing and footwear has also been moving into out-of-centre retail parks over the last 10 years. For instance, Next is focusing on out-of-centre development, using the Directory and online products to stock the larger format. However, while many leading high street retailers have opened out-of-centre stores, they often view it as exploiting an additional sales channel rather than an engine of growth, and the rate of new openings has been slow.
4.19 In May 2006, the Government closed the planning loophole which allowed retailers to increase the floorspace of their units by installing mezzanine floors, which in some cases enabled diversification into other product ranges. Both Next and TK Maxx have previously used mezzanines as a means of satisfying their pursuit of larger stores. Planning permission is now required to install a mezzanine floor of more than 200 sq.m (2,150 sq.ft).
Polarisation Towards Larger Centres
4.20 A significant and long term trend is the continuing polarisation by retailers towards larger schemes in larger centres - to the detriment of smaller centres – which is driven by a number of factors. Retailers recognise that greater efficiency can be achieved by having a strategic network of large stores offering a full range, rather than having a large network of smaller stores, and are therefore increasingly seeking to serve larger population catchments from larger stores. It is also driven by consumers, who are becoming more discerning and are increasingly prepared to travel further. According to Cambridge Econometrics, the number of shoppers visiting the top 50 UK retail centres in 2004was 10 per cent higher than in 2002, and 20 per cent higher than in 2000, whilst the number of shoppers visiting towns outside the top 100 was 4 per cent lower in 2004 than in 2002, and 13 per cent lower than in 200015.
4.21 There is therefore a concentration of comparison goods expenditure in a smaller number of larger centres; according to Cambridge Econometrics, 51 per cent of all comparison goods expenditure goes to the 100 largest centres. This is being reinforced by new development particularly in shopping centres and malls. Most of the shopping centre floorspace in the pipeline is destined for these same 100 centres, which will further reinforce their dominant market share. This concentration of retailing in larger centres is likely to threaten some medium and smaller towns.
4.22 The polarisation trend may have implications for centres in East Staffordshire District, perhaps best illustrated by the continuing influence of Derby city centre on the spending of residents within the study catchment area and the emergence and growth of substantial retail parks close to but outside of the catchment area (such as Kingsway Retail Park). The focus of retailers and developers is increasingly concentrated on larger developments in dominant city centres which are, or have the potential to become, ‘top 50’ destinations with strong catchments.
4.23 At the other end of the spectrum, the growth of the dominant foodstores and decline in unit numbers poses similar challenges for small town centres and district/local centres which rely on their convenience/service base. A clear picture is emerging of a network of large dominant superstores, and corresponding decline/diversification in the traditional smaller centre. We discuss this in greater detail, below.
15 Source: Cambridge Econometrics, in UK Retail Report (3rd Edition), BCSC, November 2004.

Retail and Leisure Capacity Study Final Report
Roger Tym & Partners M9153, August 2007 27
Trends in Key Retail Sectors
Clothing & Footwear
4.24 Clothing & footwear is the second largest area of town centre retail spending in the UK after food & grocery, accounting for £1 in every £5 spent by consumers16. Whilst the sector’s market share is lower than 10 years ago, it is higher than five years ago, reflecting the relatively buoyant nature of clothing demand and most shoppers’ preference for buying clothing & footwear in a shopping centre or high street that facilitates comparison shopping.
4.25 Changes are occurring in the traditional ‘high street’ fascias as evidenced by closures and rationalisation and the emergence of new retailers, although these changes are most likely to affect the larger centres, which the prominent retailers target. After a period of rationalisation and overall reduction in the number of outlets across the country, Arcadia - whose high street fascias include Top Shop/Man, Burton, Dorothy Perkins, Evans and Warehouse – is again actively looking for high street representation. New retailers have emerged in recent years, including international fashion stores such as Mango and H&M. Other fashion sector retailers including River Island, Alexon, Zara, French Connection, Monsoon, Next, Fat Face and Coast are all prospering and have stated an interest in securing additional stores.
4.26 In terms of market share, Marks & Spencer is by far the largest operator in the clothing & footwear sector. The company has become increasingly demand-led to produce more contemporary products at competitive prices. The revival of Marks & Spencer has principally been at the expense of competitors, such as Next, which had previously benefited from Marks & Spencer’s years of underperformance.
4.27 Primark is becoming an increasingly prominent presence on the high street and now has more than 100 stores throughout the UK. In the year to September 2006, Verdict estimates that Primark increased its selling space by almost 40 per cent, with new space increasingly located in prime locations. Despite offering some of the most competitive prices, Primark’s sales densities are also amongst the best due to its budget fashion offer driving frequent purchases.
Bulky Goods
4.28 The poor performance of the DIY sector in recent years has been well-documented. According to press commentators, the sector’s heavy reliance on a buoyant housing market is a primary cause of this downturn, for two reasons. First, it has reduced the incentive for consumers to withdraw large amounts of equity against their property. Secondly, allied with a sharp decline in the number of people moving home, it has led to a reduction in the number of occasions when consumers are likely to invest in their home.
4.29 Furthermore, DIY has become less fashionable than in recent years, with media attention waning of late and home improvement programmes becoming far less prevalent in prime time TV schedules. This has resulted in retail sales for the sector of £15.9bn in 2006, £700m below its 2004 peak17. However, Verdict predicts that DIY sales will grow once again in 2006, by 1.1 per cent. Thereafter, it is anticipated that sales growth will pick up pace as demand recovers in response to interest rates cuts from 2008. In total, Verdict expects DIY sales to grow 14.1 per cent in the five years from 2006 to 2011, with annual growth improving steadily to reach a peak of 3.4 per cent in 2011 – a far cry from the 10.0 per cent peak achieved in 2001.
4.30 The furniture and floorcoverings market has similarly suffered from difficult trading conditions of late. Verdict18 forecasts that the furniture market is set to grow by 13.2
16 Source: Verdict, UK Town Centre Retailing 2006, September 2006. 17 Source: Verdict, UK Retail Futures 2011: DIY & Gardening, March 2007. 18 Source: Verdict, UK Retail Futures 2011: Sector Summary, March 2007.

Retail and Leisure Capacity Study Final Report
Roger Tym & Partners M9153, August 2007 28
per cent between 2006 and 2011, significantly slower than in the previous decade. The state of the floorcoverings market is expected to show a marked improvement, with forecast growth of 4.7 per cent between 2006 and 2011, compared to 0.1 per cent between 2001 and 2006. However, annual growth will still underperform in relation to both the furniture & floorcoverings market and total retail, by quite some distance.
Other Comparison Sub-sectors
Department Stores
4.31 Despite the fact that department stores attract older, more affluent customers - whose numbers are growing as a result of demographic change – their recent performance has been muted, with stores having to reinvent themselves to maintain their relevance to shoppers and shore up their viability. Whilst some larger stores have prospered, smaller operators have found trading increasingly difficult, resulting in store closures (including the demise of Allders) and the acquisition of smaller players by stronger rivals. Total department store sales fell in 2004 and again in 2005, reducing the market size to 2001 levels (to £8,920m).
4.32 Most of the major department store operators are keen to obtain additional sales space and the present period is one of considerable activity in the department store sector. It remains the case, however, that stand-alone department store developments are rarely viable; consequently, new store acquisition openings are confined to shopping centre developments, where landlords/developers are prepared to contribute to the fit-out costs in order to secure an ‘anchor’ trader that will enhance the profile and lettability of the development.
4.33 Excluding Marks & Spencer, the largest department store operator is Debenhams, which now operates more than 125 stores throughout the UK and has an 18 per cent share of the market. Debenhams intends to expand growth both through the physical development of new stores and through the refurbishment of existing stores. However, Verdict19 considers that Debenhams’ stated plan to double store numbers to between 240 and 280 appears ambitious, particularly in the light of the continuing Marks & Spencer revival and further new store openings from John Lewis.
4.34 John Lewis is the UK’s second-biggest department store operator after Debenhams and has repositioned itself as a more contemporary proposition which has enabled it to broaden its appeal. John Lewis is again opening new stores after a four year hiatus; its 27th store was opened at the Trafford Centre in May 2006 and there are plans to add another 10 stores and increase space by 50 per cent by 2015.
Electricals
4.35 Over the last decade retail parks have become the clear location of choice for electrical specialists, with the combination of larger units and lower operating costs seen as being essential to prosper in a highly competitive market. The town centre retailers that survive tend to do so because they are protected from out-of-centre competition, either because the town is small and lacks the catchment to justify an out-of-centre store or due to the retailer specialising in a narrow niche that does not require a large format store (such as mobile phone and photographic specialists).
4.36 The difficulties of selling electricals in a town centre are well illustrated by the demise of Dixons, at least on the high street. Following an initial cull of 106 town centre stores in 2004, Dixons has struggled to generate the sales densities required to cover increasing rents at its remaining high street locations. In April 2006, the company announced the rebranding of the 190 remaining Dixons stores as Currys.digital, with the Dixons brand continuing solely as an online operation.
19 Source: Verdict, UK Town Centre Retailing 2006, September 2006.

Retail and Leisure Capacity Study Final Report
Roger Tym & Partners M9153, August 2007 29
4.37 Despite the near ubiquitous ownership of mobile phones, the rapid development of technology and the packaging of new handsets with annual contracts has encouraged their frequent replacement. To service this demand, mobile phone retailers have been expanding their store networks. Carphone Warehouse is the operator that has benefited most from the buoyant mobile sector and, in the year to March 2006, opened 68 additional UK stores taking its total to 669. Rapid expansion is also under way at rival Phones4U, which set a target of 100 store openings during 2006.
Factory Outlet Centres
4.38 Factory outlet centres (FOCs) are retail developments that incorporate stores offering discounted brand goods which are typically out of season, or end of season, or slightly defective, or which represent excess stock. Providers of FOCs have not sought town centre locations because manufacturers are unwilling to run the risk of cannibalising their full price high street sales. The retail units are owned and operated by:
the manufacturers of the branded goods;
companies operating as exclusive licensees or franchisees of a brand; or by
vertically integrated retailers such as Next which manufacture their labels and retail them on the high street or in out-of-centre locations.
4.39 Fashion and sports goods usually represent around two thirds of the floorspace in FOCs because of their vulnerability to changing market trends. Increasingly, FOC operators are seeking to attract commercial leisure operations, so as to extend visiting times.
4.40 Activity in FOC development continues, but at a very much slower pace than in the 1990s, and is confined to extensions to existing FOCs. In 2003 the First Secretary of State dismissed a major FOC proposal at an out-of-centre location at Burntwood, near Walsall, and the prospects for new FOC development have been made more remote given the publication of PPS6 in March 2005, which re-emphasises the Government’s ‘town centres first’ policy. Furthermore, given the recent success of value operators such as TK Maxx and Primark, the ‘uniqueness’ of FOCs has been diluted.
Convenience Sector
4.41 Table 4.2 provides details of the convenience sector’s total market share between 1996 and 2006, broken down as ‘superstores’, ‘smaller supermarkets and convenience stores’, ‘food specialists’ and ‘other stores’20. The table shows that in 1996, ‘superstores’ accounted for 43 per cent of total convenience sector sales, with ‘smaller supermarkets and convenience stores’ achieving a combined market share of 39 per cent. However, Verdict21 estimates that ‘superstores’ now account for 50 per cent of total convenience sector sales, compared to 36 per cent for ‘smaller supermarkets and convenience stores’. The overall market shares of ‘food specialists’ and ‘other stores’ also declined over the ten-year period.
4.42 Table 4.2 also shows that the total sales of the ‘superstores’ increased by 77 per cent between 1996 and 2006, compared to a corresponding increase over the same period of just 39 per cent for ‘small supermarkets and convenience stores’. The sales growth achieved by ‘food specialists’ and ‘other stores’ was lower still, at just 19 per cent and 18 per cent, respectively.
4.43 The New Economics Foundation (NEF) publication, Ghost Town Britain II (December 2003), looks at the nationwide impact of supermarkets on local shops and
20 Verdict’s definitions of these retailer types are thus: ‘superstores’ – grocery stores with a sales area greater
than 25,000 sq.ft; ‘smaller supermarkets and convenience stores’ – supermarkets, Co-ops and convenience stores with a sales area of less than 25,000 sq.ft; ‘food specialists’ – butchers, bakers, greengrocers, fishmongers and other food specialists; and ‘other stores’ – off-licenses and newsagents/tobacconists.
21 Source: Verdict, UK Grocery Retailers 2007, December 2006.

Retail and Leisure Capacity Study Final Report
Roger Tym & Partners M9153, August 2007 30
communities. According to the report, VAT figures show that between 1994 and 2002, the number of independent businesses selling food, tobacco and beverages fell by nearly 30,000, equating to more than 40 per cent of the nation’s stock of such shops. Furthermore, the report asserted that there were 953 fewer convenience stores in 2001 than in 2000. The analysis in our Table 4.2 would appear to verify the trends described by the NEF, which attributes the decline of small shops largely to the superstore operators, including Tesco in particular - which alone controls more than one-quarter of the food retail market – and Asda and Sainsbury’s, which also have substantial shares of the market.
Table 4.2 Convenience Market Share by Retailer Type, 1996-2006
Superstores Smaller Supermarkets &
Convenience Stores
Food Specialists Other Stores
Sales (£m)
Market Share
(%)
Sales (£m)
Market Share
(%)
Sales (£m)
Market Share
(%)
Sales (£m)
Market Share
(%)
Total Sales (£m)
1996 34,055 43.2 30,789 39.1 6,786 8.6 7,184 9.1 78,814
1997 36,505 44.1 31,975 38.7 6,773 8.2 7,398 9.0 82,651
1998 38,951 45.0 33,165 38.3 6,926 8.0 7,549 8.7 86,591
1999 41,284 45.9 33,862 37.6 6,925 7.7 7,906 8.8 89,977
2000 43,469 46.8 34,102 36.7 7,222 7.8 8,132 8.8 92,925
2001 46,468 47.5 35,447 36.3 7,347 7.5 8,520 8.7 97,782
2002 48,705 48.0 36,813 36.3 7,422 7.3 8,458 8.3 101,398
2003 51,433 48.5 38,532 36.4 7,579 7.2 8,434 8.0 105,978
2004 54,467 49.5 39,456 35.8 7,749 7.0 8,433 7.7 110,105
2005 57,082 49.9 40,974 35.8 7,911 6.9 8,450 7.4 114,417
2006 (Estimate) 60,278 50.4 42,779 35.8 8,067 6.7 8,473 7.1 119,597
Change %
1996-2001 36.4 15.1 8.3 18.6 24.1
2001-2006e 29.7 20.7 9.8 -0.6 22.3
1996-2006e 77.0 38.9 18.9 17.9 51.7
Source: Derived from Table 3 of UK Grocery Retailers 2007, Verdict (December 2006, which is based on 2003 prices.
4.44 The major foodstore operators are increasingly seeking to diversify into non–food markets. One pertinent example of this is Asda’s George clothing line which is now sold from dedicated stores branded with the George fascia; there are now more than 10 such stores in the UK. Tesco opened its pilot, 30,000 sq.ft non-food store – Tesco Home Plus – at the Crownpoint Shopping Park at Denton, Manchester, in October 2005. Although major supermarket operators are generally reluctant to shrink food retail space, as the food component of their businesses is also performing strongly, we note that Tesco’s Annual Review and Summary Financial Statement 2006 states that, ‘We are going to expand the trial, and more stores will open shortly in Bristol, Southampton and Telford’.
4.45 The expansion of foodstore operators’ non-food offers via their out-of-centre superstores – thereby providing a convenient one-stop shop for most food and non-food needs - represents a significant threat to high street retailers. Furthermore, out-of-centre space is cheaper than comparable space in town centres, making it easier for out-of-centre superstores to compete on price, while adjacent parking makes them much more convenient for bulkier household goods. Woolworths is one of the high

Retail and Leisure Capacity Study Final Report
Roger Tym & Partners M9153, August 2007 31
street names that have suffered most as a consequence of this trend. Boots, another key high street player, is also challenged by the expansion of foodstore operators’ non-food ranges, particularly as a result of the major supermarkets’ incursion into health & beauty products and in-store pharmacies.
E-tail and Home Shopping
E-tail
4.46 UK internet sales have increased significantly in recent years since consumer confidence in online retailing has risen as shoppers have found the internet increasingly easy to navigate, credit card use to be secure and delivery to be convenient and reliable. During 2005, 52 per cent of all UK adults shopped online according to research by the Association for Payments Clearing Services (APACS)22. APACS reports that 25 million Britons made a purchase over the internet in 2005, up 11 per cent on the number in 2004. Total online retail spending also increased from 262 million transactions in 2004 to 310 million in 2005, with the value of these transactions increasing from around £16bn in 2004 to £22bn in 2005.
4.47 APACS also reports23 that online Christmas shopping exceeded all expectations at the end of 2006, with some £7.66bn spent online by British consumers in the ten-week run-up to Christmas between 16 October and 24 December. This is 54 per cent more than the £4.98bn spent online during the same period in 2005, and more than double the £3.33bn recorded in the approach to Christmas 2004.
4.48 Certain sub-sectors are likely to be more affected by growth in e-tail than others, since the internet has particular attraction for certain types of retailing, including books, CDs and high value electrical goods. CD and DVD retailers, in particular, are beginning to suffer on the high street as a result of purchases made on the internet and Music Zone recently entered into administration as a result of difficult trading conditions.
4.49 Whilst the whole of the internet shopping sector continues to grow strongly, the fastest-growing online shopping sector is clothing & footwear. We consider that the ‘must try it on/feel it’ factor is likely to mean that multiple high street clothes & footwear retailers will generally remain competitive in the face of any further expansion of e-tail. Notwithstanding this, Colliers CRE advises that traditional UK fashion retailers need to follow the example set by those in other sectors and maximise the opportunities offered by the internet to companies with strong brand recognition, or they will risk losing market share to new competitors whose overheads are substantially lower, such as online clothes retailer ASOS.
Catalogue Shopping
4.50 In the pre-internet and digital television era, catalogue shopping played a key role in the home delivery market. However, the catalogue shopping market has seen a significant sales decline in recent years. Since 2002 traditional mail order has lost £1.25bn sales, drastically underperforming total retail sales24. At £7.5bn in 2006, the traditional mail order market has reached its lowest level for a decade after its fourth consecutive year of decline. In the 12 months to December 2006, traditional mail order declined by a further 4.4 per cent, the steepest decline recorded in 18 years.
4.51 Debenhams has now abandoned its mail order catalogue, moving its home shopping facility to the internet. Otto UK, the home shopping group that owns the Grattan and Freemans brands, is also looking to improve its internet offering, and is encouraging existing customers to buy online through advertising within the catalogues and
22 Source: APACS, reported in Interactive Media in Retail Group (IMRG) website news story (www.imrg.org),
August 2006. 23 Source: APACS, reported in IMRG website news story (www.imrg.org), January 2007. 24 Source: Verdict, Mail Order Retailers, December 2006.

Retail and Leisure Capacity Study Final Report
Roger Tym & Partners M9153, August 2007 32
corresponding digital communication. Thus, it is not just high street retailer channels which are having to adapt to the digital age.
Conclusions
4.52 The key conclusion from our analyses is that planning policy has begun to ‘bite’ in recent years, with it becoming increasingly difficult to secure planning permission for new retail floorspace in out-of-centre locations, vis-à-vis schemes in town centre locations. Whilst town centre and edge-of-centre locations are generally more complex than sites in out-of-centre locations, investor confidence in town centre schemes has been increasing in recent years, and there is now a construction boom in town centre-located shopping centres.
4.53 Other key trends in the retail markets include: increasing demand for small to medium (2,000 sq.ft to 4,000 sq.ft) footplates from retailers such as Bon Marché, Savers, Ethel Austin and Clinton Cards, and from coffee shops and mobile phone retailers; the continuing ‘polarisation’ by retailers towards larger centres; the increasing diversification into non-food markets by the major foodstore operators; and the continuing growth of e-tail.
Leisure Sector
Social and Economic Change
Personal Disposable Income and Social Structure
4.54 The leisure industry has benefited from the continued growth in household disposable income and final consumption. Competitive forces have reduced the price of essentials, allowing an ever increasing proportion of consumer expenditure to be spent on leisure items whether for in-home entertainment or spent outside the home.
4.55 Furthermore, the move away from the industrial base has led to a reduced requirement for skilled and unskilled manual jobs which are classified in the C2 and D social groupings. There are more jobs in commerce and a far greater proportion of women graduating and entering the professions has increased the proportion of the population falling under the ABC1 classifications. The ABC1 groupings are the categories that tend to be the largest users of leisure facilities, having a greater proportion of disposable income. According to Mintel, this trend is set to continue.
Demographic Trends
4.56 Population projections by the Government Actuary show that, nationally, the population will shift towards being more weighted towards the over 45 age group during the next twenty year period. However, between 2007 and 2012 there is also a small projected net increase (from 10.05 million to 10.35 million) in the population in the 15-29 age group, which is a group that is extremely active in the leisure market. People in this group are important because they have the highest propensity to indulge in a number of leisure activities including going to the cinema, eating out, visiting pubs, tenpin bowling and visiting nightclubs. There will be a net loss of population in the 0-14 and 30-44 age groupings, but all other groups will gain.
Household Composition
4.57 The household type forecast to experience the greatest increase over the next two decades is the one person household. Whereas, traditionally, an increase in one person households has been associated with the retired, the largest increases are forecast to be within people of working age, particularly amongst men. According to the ONS, the rise in one-person households is expected to account for 72 per cent of annual household growth between 2003 and 2026, a factor which has ramifications for the leisure industry.

Retail and Leisure Capacity Study Final Report
Roger Tym & Partners M9153, August 2007 33
4.58 There has also been a trend towards young adults remaining at home in their 20s and 30s. Currently there are around 2.2 million young adults of this age living with their parents, of which 63 per cent are male. In the 20-24 age group, 56 per cent of men live with their parents. This could also be a high spending group providing they are not foregoing spend to save for deposits on a house.
Leisure Time
4.59 Data from the Leisure Industries Research Consultancy (LIRC) shows that since 1998, the leisure time for the average full time worker has increased by 2.2 per cent, to 2,595 hours per annum. Some 57 per cent of households had access to the internet between January and April 200625, compared with 9 per cent in 1998. This implies that the total amount of leisure time now spent on the home computer will have increased, and sophisticated modes of access will also increase dwell time on computers.
4.60 For some time, there has been an increasing tendency to eat out and this has become established as a way of life. One of the most rapidly growing sectors in the mid 1990s was keep-fit. This is now an established market, though there has been a recent slow-down in health club development in recent years as the market approaches saturation26.
4.61 LIRC data also show that the total trend in leisure hours is set to increase from 160.0 billion hours in 2004 to 160.8 billion in 2008.
Growth in Leisure Expenditure and Changing Leisure Activities
4.62 Table 4.3 details changes in expenditure on various sub-sectors of the leisure market.
Table 4.3 Comparison Spend on Selected Leisure Activities 2000-2008 2000
£m 2001 £m
2002 £m
2003 £m
2004 £m
2005 £m
2006 £m
2007 £m
2008 £m
% Change 2000-2008
Bingo 523 552 595 602 606 664 637 641 676 29.25
Cinema* 623 620 724 678 739 769 803 840 879 41.10
Dancing/Discos 749 752 790 832 885 941 999 1,060 1,127 50.50
Spectator Sports 767 808 826 909 998 1,121 1,217 1,337 1,485 93.61
Eating Out 33,011 34,376 36,782 38,916 41,160 43,700 46,226 48,939 51,865 57.10
Alcoholic Drink** 18,080 18,790 19,990 20,430 21,370 22,3 23,33 24,4 25.5 41.10
Total Sightseeing 934 943 1,046 1,077 1,137 1,194 1,256 1,321 1,390 48.80
Total Gaming 7,082 7,152 7,583 8,129 8,389 8,890 8,630 8,905 9,376 32.40
Health & Fitness+ 1,420 1,583 1,641 1,763 1,814 2,033 2,077 2,190 2,381 67.70
Source: Leisure Industries Research Consultancy (2004 prices) * Relates to Gross Ticket Revenues only excluding VAT and concessionary income. ** This includes alcohol consumed in restaurants and hotels but adjusted for alcohol consumed at home. + Private sector estimates. Local Authority income excluded.
Eating Out
4.63 Within the last two to three year period there has been consolidation within the restaurant industry as some chains were expanding at a faster rate than demand. Many observers see the opportunity for huge growth in the eating out market. In 1990, 75 per cent of food consumption was in the home. According to the British Hospitality Association, by 2035 this ratio will have reduced to 50 per cent.
4.64 There is an increasing trend towards healthier eating, which has caused some fast food operators to change their menus for a healthier lifestyle. The public has not only become more discerning about food content but is also becoming more demanding about the speed and quality of service. This demand is known as ‘fast casual’ and has
25 Source: ONS website (www.statistics.gov.uk), August 2006 26 Source: Strutt & Parker, Leisure Comment, Spring 2006

Retail and Leisure Capacity Study Final Report
Roger Tym & Partners M9153, August 2007 34
been one of the largest growth areas in the USA; the same trend is now emerging in the UK.
Pubs
4.65 The Licensing Act, which came into effect in November 2005, has had an impact on some rural pubs. Later opening hours are likely to drive longer drinking times in city centres. Pubs are also being affected by the long-term decline in beer drinking and the switching to wine consumption. Some are of the opinion that supermarkets will be selling the majority of lager and ale in as little as three years, swapping the living room for the pub in terms of beer consumption. The impending smoking ban, to be enforced in all enclosed public spaces by summer 2007, is also likely to have a considerable effect on licensed premises, particularly those which are predominantly ‘wet’, with drink forming a very high proportion of turnover.
4.66 Social changes have also been driving this trend; employees are less likely to drink together. When employees do socialise, more wine will be drunk than beer. The drinks industry has also had to come to terms with women drinking more and having more disposable income. In order to combat these trends, 89 per cent of pubs now have a food offer.
4.67 According to Datamonitor27, the consumption of brewed drinks is declining in countries that have long been brewing strongholds such as France, Germany, the Netherlands and the UK. This is shown in Table 4.3.
Table 4.3 Per Capita Sales of Beer Across Europe, 2001-11 (Litres, Millions)
Country 2001 2006 2011 Average Annual
Change 2001-06 Projected Average
Annual Change 2006-11 Italy 34.3 37.4 40.0 1.7% 1.4% Spain 89.1 94.9 99.6 1.3% 1.0% Sweden 73.4 74.4 74.8 0.3% 0.1% Europe Total 96.6 95.9 95.4 -0.1% -0.1% Netherlands 106.0 105.1 104.0 -0.2% -0.2% UK 135.3 134.0 132.4 -0.2% -0.3% Germany 147.1 143.3 140.3 -0.5% -0.4% Rest of Europe 103.2 100.8 99.3 -0.5% -0.3% France 49.8 46.6 44.5 -1.3% -0.9%
Source: Datamonitor analysis
4.68 Nevertheless, while brewed drinks in general have been suffering a reverse in popularity, beer is still the primary drink within the category. Table 4.4 shows that beer consumption is down in France and Germany as young adults develop a taste for spirits in particular, but elsewhere – including the UK - beer is showing modest volume growth as a mature product.
Table 4.4 Beer Sub-Category Volume Sales Across Europe, 2001-11 (Litres, Millions)
Country 2001 2006 2011 Average Annual
Change 2001-06 Projected Average
Annual Change 2006-11
France 2,191.0 2,085.5 2,022.2 -1.0% -0.6% Germany 9,593.8 9,452.8 9,350.5 -0.3% -0.2% Rest of Europe 4,219.5 4,219.5 4,241.0 0.0% 0.1% Europe Total 28,151.6 28,472.6 28,806.2 0.2% 0.2% UK 5,967.0 6,086.4 6,199.9 0.4% 0.4% Netherlands 1,264.1 1,294.1 1,323.6 0.5% 0.5% Sweden 449.4 467.4 484.9 0.8% 0.7% Spain 2,836.8 3,076.3 3,252.5 1.6% 1.1% Italy 1,630.0 1,790.6 1,934.5 1.9% 1.6%
Source: Datamonitor analysis 27 www.datamonitor.com

Retail and Leisure Capacity Study Final Report
Roger Tym & Partners M9153, August 2007 35
4.69 The data in Table 4.4 do not appear to indicate that there is any particular decline in the UK beer market, which might have had implications for the brewing industry in Burton and therefore land availability in the town centre if Coors contracted.
4.70 Town centres have been affected by weekend binge drinking. The new Licensing Act allows individuals, businesses and authorities such as the police to request a review of an existing Premises Licence at any time which may ultimately lead to the revocation of the licence. Accordingly, some control may be gained over areas subject to persistent violent or anti-social behaviour, with a corresponding decrease in spending on drink in these areas likely.
Cinemas
4.71 Figure 4.4 indicates that cinema attendances in 2006 totalled 157 million, a significant downturn on the 176 million admissions in 2002; indeed, this represents a reduction in attendance of some 11 per cent in 4 years.
Figure 4.4 UK Cinema Audiences (Millions), 1997-2006
139135
139143
156
176
167171
165157
120125130135140145150155160165170175180
1997 1998 1999 2000 2001 2002 2003 2004 2005 2006
Adm
issi
ons
(in M
illio
ns)
Source: Nielsen EDI, reported in Pearl & Dean website (www.pearlanddean.com), March 2007
4.72 The last few years have seen a degree of consolidation amongst four of the major exhibitors. Over-expansion in the earlier part of this decade resulted in some of the major exhibitors making losses. Some of the original multiplexes will be closed as they become obsolete and do not justify expenditure on refurbishment. However, the year to 2006 saw a further increase in the total number of UK cinema screens, albeit at a much reduced rate of increase (Figure 4.5). More cinemas are beginning to have digital screens and widen their appeal as they broadcast live sport and other major events and this trend is likely to become more prevalent.

Retail and Leisure Capacity Study Final Report
Roger Tym & Partners M9153, August 2007 36
Figure 4.5 UK Cinema Screens, 1997-2006
35323486347534333420
3017
2825
2638
2383
3248
2000
2250
2500
2750
3000
3250
3500
3750
1997 1998 1999 2000 2001 2002 2003 2004 2005 2006
No.
of S
cree
ns
Source: CAA, reported in Pearl & Dean website (www.pearlanddean.com), March 2007
Leisure Parks and Retail and Leisure Parks
4.73 During the 1990s the multiplex cinema development boom was characterised by a willingness for cinemas and associated operators to occupy on a leasehold basis. Accordingly a large number of leisure and retail schemes became available on the market. Leisure parks are parks of more than 30,000 sq.ft dedicated specifically to leisure, whereas often there was a mix of both retail and leisure which helped to make any scheme more viable, known as retail and leisure parks. The following table shows the regional distribution of such parks; it would imply that the West Midlands region has provision which closely corresponds to the national average.
Table 4.5 National Provision of Leisure Parks and Retail and Leisure Parks
Region Parks Gross Internal Area (sq.ft)
Population per (sq.ft)
North West 27 4,565,032 1.48
North 12 1,360,829 1.84
Yorkshire 17 2,624,107 1.89
Scotland 17 2,632,009 1.92
Northern Ireland 4 772,069 2.19
West Midlands 17 1,903,062 2.70
South West 11 1,815,624 2.73
Wales 6 997,514 2.92
London & South East 33 4,329,556 3.55
East Midlands 9 665,447 6.33
Eastern 4 470,365 11.50
Total 152 22,135,614 2.67 Source: Trevor Wood Associates Database, December 2004
Impact of Planning Policy
4.74 There has been a tightening of Government policy towards driving retail and leisure developments to town centre locations and edge-of-town centre. Much improved architectural design has enhanced the town centre environments and many pub and bar operators have designed formats which have particular high street appeal. The challenge to many local authorities has been to design town centres which operate

Retail and Leisure Capacity Study Final Report
Roger Tym & Partners M9153, August 2007 37
through days and evenings, rather than become deserted after 6pm, when office workers and shoppers have left the area and the area becomes deserted or appears threatening by the presence of a large amount of drinkers. The effect of the Licensing Act is to extend drinking hours, although this is more likely to occur in town centres rather than in rural areas. The change in policy has caused more mixed use developments which combine leisure, retail and, occasionally, office space. Facilities for night-time leisure ensure that the parking facilities are utilised to their fullest extent.


Retail and Leisure Capacity Study Final Report
Roger Tym & Partners M9153, August 2007 39
5 PERFORMANCE ANALYSIS
Introduction 5.1 Our analysis of the retail performance of Burton and Uttoxeter town centres has
involved:
i) on-foot surveys of each town centre;
ii) photographic analysis;
iii) desk research in relation to the study centres and a range of comparator centres28; and
iv) face-to-face consultations with representatives of the business and property markets in each study town.
5.2 Our analysis of the retail performance of the study centres is based upon examination of a range of ‘performance indicators’, a number of which are specified in Section 4 of PPS6 as ‘important indicators’. The performance indicators involve measurement and analysis of retail rankings; the diversity of uses; representation from national multiple retailers; the retail property offer; retailer demand; commercial yield on non-domestic property; change in shopping rents; vacancy rates; and pedestrian flows. Each performance indicator is analysed in detail below to provide a comprehensive analysis of the retail performance of the centres, by benchmarking it against the performance of competitor centres.
5.3 The detailed performance analysis data are contained in Annex 1 (Appendices to the Main Report); all mentions of Appendices in this section relate to those in Annex 1.
Performance Indicators
Indicator 1: Retail Rankings
5.4 In previous retail studies, we have assessed the movement of centres in the national retail hierarchy using time-series data from Management Horizons Europe’s (MHE) UK Shopping Index, although MHE does not intend to publish an update of its Index 2003/04 until later in 2007. Nevertheless, Javelin Group’s Venuescore 2006 utilises a near-identical methodology for ranking the UK’s retail centres. For instance, the Javelin index is calculated using a weighted count of multiple retailers which mirrors that used by MHE, comprising fashion retailers, non-fashion multiples and anchor stores29. The Javelin index also adopts the same eight grades of retail centre in the UK, from ‘Major City’, through to ‘Local Centre’.
5.5 The only material difference between the Javelin and MHE indexes appears to be the fact that whereas MHE’s latest index ranked the UK’s top 1,672 retail centres, Javelin’s index ranks the top 2,226 centres. However, most of the additional centres in the Javelin index feature in the eighth grade of retail venue, ‘Local Centre’, and therefore have no effect on the ranking of Burton and Uttoxeter which are ranked within the third tier (‘Regional’) and sixth tier (‘Minor District’) of the Javelin index, respectively. We
28 The 13 centres for which we provide benchmark data are Derby, Stoke (Hanley), Solihull and
Wolverhampton, which are towns/cities classified in Javelin’s VenueScore 2006 as ‘Regional’ centres in West Midlands (as is Burton); Stafford (‘Sub-regional’); Tamworth, Lichfield, Cannock and Coalville (all ‘Major Districts’); and Swadlincote and Droitwich (‘Minor Districts’, which is the same as Uttoxeter). Birmingham and Nottingham, each of which is classified as a ‘Major City’, are also included as comparators.
29 For instance, in both the MHE and Javelin indexes, Premier Department Stores (for example Selfridges and Harrods) score 15 points; Major Department Stores (Harvey Nichols, John Lewis) score 10; Premier Variety Stores (M&S) score 8; Clothing Destinations (Next, Gap) score 2; and Other Multiple Operators (Monsoon, Top Shop) score 1 point.

Retail and Leisure Capacity Study Final Report
Roger Tym & Partners M9153, August 2007 40
therefore consider that comparing centres’ current positions in the Javelin index with their corresponding ranking in previous MHE indexes is valid.
Burton
5.6 Table 1 of Appendix 3 identifies the positions in the retail hierarchy of Burton and Uttoxeter in relation to the 13 comparator centres. Burton is one of only four centres in the table whose current ranking is better than in 2001, the others being Birmingham, Solihull and Lichfield. Each of the remaining centres has a 2006 ranking that is lower than in 2001. Indeed, Burton improved its position in the national rankings by some 40 places between 2001 and 2006, and its current 65th-position ranking places Burton above the considerably larger centre of Wolverhampton30 for the first time.
Uttoxeter
5.7 In contrast to Burton, Uttoxeter’s recent movement in the national retail rankings has been in the wrong direction. Of the 15 centres in Table 1 of Appendix 3, Uttoxeter’s position in the national rankings deteriorated to the greatest extent between 2000 and 2006, with Uttoxeter’s 2006 ranking of 791st position representing an alarming 294-place slippage since 2001 (497th position). Indeed, the extent of Uttoxeter’s slippage in the rankings means that its current ranking places it below the comparator centres of Swadlincote and Droitwich for the first time.
5.8 Furthermore, with the exception of Coalville, all of the comparator centres that Javelin classifies as ‘Major District’ or ‘Minor District’ have improved their position in the retail rankings since 2004. However, Uttoxeter has slipped in the rankings by 245 places over this relatively short period, and this therefore gives considerable cause for concern.
Indicator 2: Diversity of Uses
Burton
5.9 Experian’s latest GOAD survey of Burton town centre (December 2006) compares the representation of convenience, comparison, and service uses (and their respective sub-sectors) to UK averages, and hence it is possible to identify areas in which Burton may have a shortfall. The data are reproduced in Table 2 of Appendix 3.
5.10 The town centre contains 13 convenience outlets, which equates to 7.4 per cent of the total units compared to the UK average of 9.1 per cent. However, there is a good range of convenience outlets in Burton, with the town centre benefiting from three main supermarkets (Asda, Sainsbury's and Tesco), as well as two smaller supermarkets (Aldi and Lidl) and two frozen food outlets (Farmfoods and Iceland). Also present are two specialist health food shops, six bakers, a butcher, a greengrocer and five other convenience sector outlets. The town centre, therefore, has representation in all convenience sub-sectors apart from off-licenses and in this context we consider that it has a healthy convenience sector offer.
5.11 Table 2 of Appendix 3 also demonstrates that the 165 comparison goods outlets in the town centre equate to 55.2 per cent of the total units, which is significantly above the UK average of 46.4 per cent. The town has above-average representation in each of the clothing and footwear sub-sectors, which is a key determinant of a centre’s attractiveness to shoppers. No sub-sectors are significantly under-represented in numerical terms apart from ‘florists and gardens’, although outlets in this sub-sector typically only account for around 1 per cent of a centre’s total units (based on the UK average). Thus, in numeric terms at least, Burton town centre has a good representation of comparison outlets. We consider the nature of the specific retailers
30 Experian's latest Goad surveys indicate that Burton town centre contains around 63,500 sq.m (684,000
sq.ft) of comparison retail floorspace (gross), compared to the 79,000 sq.m (851,000 sq.ft) gross in Wolverhampton city centre.

Retail and Leisure Capacity Study Final Report
Roger Tym & Partners M9153, August 2007 41
present below under the heading ‘Presence of National Multiples and High Profile Retailers’.
5.12 The overall proportion of service outlets in Burton town centre (26.1 per cent) is below the UK average (30.3 per cent). Of particular note is the under-representation of outlets in the ‘restaurants, cafés, coffee bars, fast food & take-aways’ sub-sector, the 16 outlets in this sub-sector equating to 9.4 per cent of all town centre units which is notably below the UK average of 14 per cent.
Uttoxeter
5.13 Whilst the town centre’s supermarket provision is limited to the relatively small Iceland and Kwik Save stores, all convenience sub-sectors are represented. The 18 convenience outlets in Uttoxeter town centre (Table 2 of Appendix 3) equate to 11.6 per cent of total town centre units, which compares favourably with the UK average (9.1 per cent).
5.14 Table 2 of Appendix 3 shows that the 72 comparison units in Uttoxeter town centre equates to 46.5 per cent of total units, which mirrors the UK average. Despite this, Uttoxeter has significantly below-average representation in each of the clothing sub-sectors, with only one outlet in the ‘men’s and boy’s wear’ sub sector, only two ‘mixed and general clothing’ stores and just four outlets in the ‘women’s, girl’s and children’s clothing’ sub-sector, which is a key barometer of a centre’s retail strength. Conversely, the centre contains an above-average representation of charity shops. Some strengthening of the town centre’s clothing offer would therefore be welcome, although we note that a low proportion of clothing retailers is not untypical of centres operating within the same tier of the retail hierarchy as Uttoxeter.
5.15 At 34.8 per cent, the proportion of service outlets in the town centre is slightly above the UK average (32.6 per cent). There is a slight under-representation in the ‘restaurants, cafés, coffee bars, fast food & take-aways’ sub-sector, although the town centre does nevertheless contain 19 food and drink outlets.
Indicator 3: Presence of National Multiples and High Profile Retailers
Burton
5.16 As we mentioned above, Burton town centre’s convenience offer includes Asda, Sainsbury's, Tesco, Aldi, Lidl, Farmfoods and Iceland stores. The centre also contains Julian Graves, Holland & Barrett and Thornton’s outlets.
5.17 Burton contains a wide range of comparison multiples, as would be expected given the size and status of the centre, and is particularly well-served by large-store multiples. Analysis that we undertook for the West Midlands Centres Study in 2005/2006 showed that Burton was represented by 20 of RTP’s basket of 43 ‘large-store multiples’, which was the fourth-best performance of the 26 centres identified in Policy PA11 of RPG11 (after Birmingham, the Merry Hill Centre and Wolverhampton). Some of the ‘large-store multiples’ have since ceased trading, and our updated list now contains 39 fascias. Burton town centre currently contains 18 of these fascias, which remains a good level of representation.
5.18 Conversely, our analysis for the Centres Study found that Burton was not represented by any of the retailers listed in our basket of 97 ‘high-profile retailers’. As with the large-store multiples, some of the high-profile retailers have since ceased trading and our basket now contains 95 high-profile traders, of which Burton contains only one (Hinds).
5.19 The lack of high-profile comparison retailers explains why Burton achieves a score of 90 in Javelin’s ‘Market Position Index’ (the average index score being 100), as shown in Table 1 of Appendix 3. The town centre does not contain any fashion stores categorised by MHE as better than ‘middle’. A key deficiency relates to the town centre’s department store offer. At present the only department store is Beatties in the

Retail and Leisure Capacity Study Final Report
Roger Tym & Partners M9153, August 2007 42
Octagon Centre, and with a gross floorspace of around 17,500 sq.ft (1,600 sq.m) this is relatively modest by modern department store standards.
5.20 The town centre contains a wide range of service-sector multiples (such as banks, fast food outlets and travel agents). The recent development of Middleway Park to the north of Worthington Way – which includes a multiplex cinema as well as the prominent food & drink outlets Frankie & Benny’s, Chicago Rock and KFC - has enhanced the centre’s commercial leisure offer. Nevertheless, stakeholders reported anecdotally that there remains a lack of family-orientated eating places in the town centre, other than fast-food outlets.
Uttoxeter
5.21 Uttoxeter town centre’s existing convenience outlets are relatively small-scale and geared towards a local shopper base. Similarly, there are significantly fewer national comparison multiples in Uttoxeter than in Burton, which is unsurprising given its different role in the sub-regional retail hierarchy. The principle comparison outlets present are Woolworths, Boots, Mackays, Peacocks and Wilkinson, most of which operate towards the lower end of the retail spectrum. In terms of fashion outlets, Uttoxeter does not have any representation in the ‘luxury’, ‘upper’, ‘upper-middle’ or ‘middle’ categories, although again this is not unexpected given the size and function of the centre.
5.22 Service sector multiples have a reasonable presence in the town, with banks and building societies (in particular) being well-represented.
Indicator 4: Operator Demand
5.23 The commercial organisation, FOCUS, collects data on documented retailer requirements, and publishes the data twice-yearly. FOCUS also produces Town Reports for main centres, which include time-series data on the number of retail requirements.
5.24 It is worth emphasising from the outset that the level of demand for any centre is always influenced by whether any new development is proposed; hence if a major new development scheme was to emerge, the number of requirements would be expected to show a noticeable increase.
Analysis of published requirements by number
5.25 FOCUS’s most recent Town Report for Burton (April 2007) shows that the number of published retailer requirements for the town has recently declined slightly. The current (April 2007) number of requirements is 34, which compares to the recent peak of 46 (October 2004) and the longer-term high of 48 (April 1999).
5.26 As would be expected, there is a significantly higher number of published requirements for most of the centres that rank above Burton in the retail hierarchy, with Birmingham having 174 requirements in April 2007, Nottingham 166, Derby 104 and Solihull 99. The exception is Stoke (Hanley) with 38, which is only slightly higher than Burton’s 34. The number of requirements for the lower-ranking centres of Wolverhampton (62) and Lichfield (46) are also significantly higher than the Burton figure.

Retail and Leisure Capacity Study Final Report
Roger Tym & Partners M9153, August 2007 43
Figure 5.1 Change in the Number of Retailer Requirements – Burton, Uttoxeter and the Comparator Centres, April 2000 to April 2007
0
50
100
150
200
250
Apr-00
Apr-01
Apr-02
Apr-03
Apr-04
Apr-05
Apr-06
Apr-07
Nu
mb
er
of r
eq
uir
em
en
tsBirmingham
Nottingham
Derby
Stoke (Hanley)
Solihull
Burton-upon-Trent
Wolverhampton
Stafford
Tamworth
Lichfield
Cannock
Coalville
Swadlincote
Droitwich
Uttoxeter
Source: FOCUS Town Reports, April 2007
5.27 There has been a steady increase in the number of operators with Uttoxeter requirements in recent years, from four in April 2000 to the current figure of 22. This is an encouraging level of demand and outstrips the corresponding number of requirements for the higher-ranking centres of Cannock (21), Swadlincote (7) and Droitwich (19).
Analysis of published requirements by type
5.28 The FOCUS database includes more detailed information in relation to 19 operators with a current requirement for Burton (that is, lower than the figure of 34 as cited in the FOCUS Town Report). Two of the 19 detailed requirements are duplicate entries (Pets at Home and Pizza Hut). Of the remaining 17 Burton requirements, four are from operators that are specifically interested in locations outside of the town centre. Thus, the FOCUS database contains detailed information in relation to only 13 current requirements for Burton town centre.
5.29 The 13 Burton town centre requirements include a number of food & drink chains and service sector outlets. Only four of the town centre requirements are from comparison operators, and these include a discount store and a charity shop. Thus, Card Warehouse and HPJ Jewellers are the only mainstream comparison retailers that appear in the detailed FOCUS listing, which does not include any clothing and footwear retailers.
5.30 Overall, we conclude that the published requirements for Burton is somewhat disappointing – both in terms of number and operator type - given the centre’s size and lofty position in the national retail rankings.
5.31 Detailed information is provided in the FOCUS database for 15 operators with requirements for Uttoxeter (again, lower than the figure cited in the Town Report), one of which is a duplicate entry (Halfords). Three operators - Ask Central, Card Warehouse and Extra Care Charitable Trust - have requirements for both Uttoxeter

Retail and Leisure Capacity Study Final Report
Roger Tym & Partners M9153, August 2007 44
and Burton, although it is not possible to deduce from the FOCUS database whether these operators would be prepared to trade from both centres.
5.32 Four of the 14 operators with Uttoxeter requirements are only interested in out-of-centre locations. The 10 operators with town centre requirements include a frozen foods retailer (Farmfoods), a restaurant (Ask Central) and a service sector outlet (Johnsons Cleaners). The seven comparison retail operators that have current requirements for town centre space in Uttoxeter include a charity shop, a mobile phone operator, a card shop and a discount bookstore. The remaining three requirements are clothes retailers – Bon Marché, Edinburgh Woollen Mill and Ethel Austin. Thus, as with Burton, there is an absence of middle-order fashion retailers with requirements for Uttoxeter, although this is not untypical for centres of its size and function.
Analysis of operator requirements – primary RTP research
5.33 We contacted the agents acting for the most prominent retail and leisure operators that appear in the current FOCUS list, with a view to establishing their level of interest in East Staffordshire as an investment location31. We received a response from 10 of these operators. The agent acting for HPJ Jewellers stated that its client does not have a requirement for Burton (contrary to the position specified in the FOCUS database). More positively, Ask Central, Pizza Express, Zizzi, Edinburgh Woollen Mill and Farmfoods all confirmed their desire to be located in both Burton and Uttoxeter.
5.34 We also contacted a further 19 prominent retail and leisure operators32 not currently listed with FOCUS to establish whether they had any potential interest in either Burton or Uttoxeter. Despite following up the initial questionnaire by telephone, we received only four completed questionnaires from the operators without current FOCUS-listed requirements for East Staffordshire. Encouragingly, Next expressed an interest in Burton, and M&S Simply Food stated a potential interest in both towns. Two prominent department store operators also confirmed their interest in Burton, although for reasons of commercial confidentiality we cannot name them in this report.
5.35 Table 5.1 lists the operators that have confirmed an interest in Burton and/or Uttoxeter, and summarises their particular requirements. A recurring theme in the responses from the interested operators was a lack of suitable available sites/premises, which indicates a need for new appropriately sized retail units in good locations.
Table 5.1 Confirmed Operator Interest in Burton and/or Uttoxeter at April 2007
Company Comment Floorspace & Other Operational Requirements
FOCUS-listed operators Ask Central/ Pizza Express/ Zizzi
Confirmation of interest in Burton and a more tentative interest in Uttoxeter.
2,500-5,000 sq.ft sales area required. Close proximity to car parking and outdoor dining areas preferred.
Bon Marché Confirmation of interest in Uttoxeter (already in Burton).
2,500 sq.ft sales area + 700 sq.ft ancillary space.
Edinburgh Woollen Mill
Interested in both towns. Prime or good secondary location preferred.
1,500-2,500 sq.ft sales area + 1,000 sq.ft ancillary space.
Farmfoods Interested in Uttoxeter. 5,000-7,000 sq.ft sales area.
Halfords Interested in Uttoxeter, in an “edge-of-town location”.
4,000-5,000 sq.ft sales area. Parking for at least 15 cars required.
31 The operators with FOCUS-listed requirements for Burton and/or Uttoxeter that we followed up are: Bon
Marché, Card Warehouse, Costa, Edinburgh Woollen Mill, Ethel Austin, Farmfoods, Gondola Holdings (which owns the food & drink operators Ask Central, Pizza Express and Zizzi), Halfords, HPJ Jewellers, JD Wetherspoon, Pizza Hut, Trespass, Works Publishers Outlet and Wynsor World of Shoes.
32 The additional operators that we contacted are: Asda Living, B&Q, Currys, Gala, Gap, H&M Hennes, Homebase, Morrisons, M&S Simply Food, Netto, Next, Sainsbury's, Whitbread Group (which operates TGI Fridays, Beefeater and Brewers Fayre), Wickes, Yates’s and Zara. Some of these retailers already trade in east Staffordshire and questionnaires were tailored accordingly. We also contacted two prominent department store operators, although for reasons of commercial confidentiality we cannot name them here.

Retail and Leisure Capacity Study Final Report
Roger Tym & Partners M9153, August 2007 45
Company Comment Floorspace & Other Operational Requirements
JD Wetherspoon Interested in Uttoxeter. Site or building with 5,000 sq.ft of floorspace plus outside area.
Works Publishers Outlet
Tentative interest in Uttoxeter expressed; Uttoxeter is not a priority for the firm, but it would consider any new retail scheme.
2,500-2,500 sq.ft sales area + 500-1,000 sq.ft ancillary space.
Other Operators with an Interest in Burton/Uttoxeter, Not Listed With FOCUS
Prominent department store operator
Interested in Burton 20,000-60,000 sq.ft sales area; max gross size 80,000 sq.ft. Dept store preferred but would consider alternative smaller formats.
M&S Simply Food
Potential interest in both towns expressed, subject to an appropriate opportunity presenting itself.
5,000-12,000 sq.ft foot sales area (7,000-20,000 sq.ft gross). On-site car parking preferred.
Next Interested in Burton (already in Burton but undersized unit). Uttoxeter too small a catchment.
12,000 sq.ft sales area (20,000 sq.ft gross). Prime town centre location or retail park required.
Prominent department store operator
Interested in Burton 30,000-40,000 sq.ft sales area; min. 15,000 sq.ft GFI.
Indicator 4: The Retail Property Offer
Burton
5.36 Analysis of the FOCUS listings of April 2007 shows that the mean sales area requirement for the 13 operators with a current, published interest in Burton town centre is around 1,900 sq.ft (175 sq.m)33. The three comparison retailers on the FOCUS list (assuming that HPJ Jewellers does not have a current interest in Burton) have a slightly higher mean sales area requirement of around 2,300 sq.ft (215 sq.m).
5.37 Perhaps of more interest is the large floorspace requirements of Next and the two department store operators which expressed an interest in Burton. Our analysis of Experian’s GOAD data for Burton indicates that the 34 currently vacant units in Burton town centre (GOAD definition) have an ‘average’ gross floorspace of around 1,840 sq.ft (170 sq.m), which translates to an ‘average’ net sales area of approximately 1,285 sq.ft (119 sq.m)34. Thus, there is a noticeable absence of available units in the town centre of a sufficient size to satisfy the floorspace requirements of those operators that have confirmed an interest in Burton.
5.38 The appearance of some town centre property – for instance at Station Street and High Street – would benefit from improvement.
Uttoxeter
5.39 The mean sales area requirement of the 14 operators with town centre requirements is higher than in Burton, at around 2,500 sq.ft (230 sq.m), or around 2,050 sq.ft (190 sq.m) if the Farmfoods requirement is omitted. The mean figures for Burton and Uttoxeter are therefore similar.
5.40 The eight available (vacant) units in Uttoxeter town centre have an average gross floorspace of around 3,200 sq.ft (300 sq.m). However, this is skewed upwards by the inclusion of the large vacant unit at Trinity Square (which in any event has recently been re-occupied). Excluding that unit from the analysis, the average reduces to approximately 1,560 sq.ft (220 sq.m) gross, which translates to an ‘average’ net sales area of approximately 1,100 sq.ft (100 sq.m). As with Burton, this is significantly below the floorspace requirements of those operators with a confirmed interest in Uttoxeter.
33 Figures are derived from obtaining the median floorspace requirement for each operator and calculating the
mean of these figures. 34 The average sales floorspace is derived by applying a gross to net ratio of 70 per cent.

Retail and Leisure Capacity Study Final Report
Roger Tym & Partners M9153, August 2007 46
5.41 The scheme at the Cattlemarket site – for which planning permission exists to provide approximately 4,700 sq.m (gross) of new comparison retail floorspace – will provide larger units in the town centre.
Indicator 6: Retail Yields
Burton
5.42 Figure 1 of Appendix 3 shows that prime retail yields have improved recently in most of the comparator centres. In contrast, yields have remained static at 6.50 per cent in Burton since April 2001. Whilst the similar-ranking comparator centres of Stoke (Hanley) and Wolverhampton also had a yield of 6.50 per cent in 2001, yields in those centres have improved to current levels of 5.75 per cent and 5.50 per cent, respectively. Furthermore, at 4.75 per cent, current yields in Solihull are significantly keener than in Burton.
Uttoxeter
5.43 Prime retail yields in Uttoxeter now mirror those achieved in Burton (6.5 per cent), despite Uttoxeter being a much smaller and lower-ranking centre. Indeed, yields in the town have improved by 2.5 percentage points since April 2001, which is the best performance of the centres under consideration.
Indicator 7: Changes in Prime Zone A Shopping Rents
Burton
5.44 Figures 2 and 3 in Appendix 3 chart the movement in Zone A retail rents in Burton and the comparator centres35 in terms of absolute movement and percentage change over the period 1997 to 2006.
5.45 Figure 2 shows that, as would be expected, absolute Zone A rents in 2006 were highest in Birmingham (£325 per sq.ft) and Nottingham (£240 per sq.ft). The higher-ranking comparator centres of Hanley and Solihull also command high Zone A rents, at £210 per sq.ft, although Derby lags behind somewhat at £160 per sq.ft.
5.46 At £135 per sq.ft, Wolverhampton, which ranks below Burton in Javelin's VenueScore 2006, commands higher retail rents than Burton (£120 per sq.ft). The recent rate of improvement in Burton has been faster than in Wolverhampton and the gap has narrowed to £15 per sq.ft compared to £30 in June 2004.
5.47 Anecdotal stakeholder evidence apparently verifies that rents in Burton are on an upward trajectory. Whilst no actual figures were cited to us, the manager of Coopers Square asserted that it is the best-performing centre in the Grosvenor portfolio in terms of rental growth. Furthermore, rents achieved at Burton Place are also said to be rising.
Uttoxeter
5.48 Published time-series rental data are not available for Uttoxeter. However, at £40 per sq.ft, current prime Zone A rents in Uttoxeter are low, and some £10 per sq.ft lower than in the similar-ranking comparator centre of Droitwich. The owner of the Maltings Centre confirmed that, historically, rental growth in the town has been slow.
Indicator 8: Proportion of Vacant Street Level Property
Burton
5.49 The 34 vacant units in Burton town centre at the time of Experian's latest Goad survey (January 2006) equates to 11.4 per cent of all town centre units. This is slightly below
35 No published rental data are available for Swadlincote, and full time-series data are not available for
Lichfield, Coalville and Droitwich.

Retail and Leisure Capacity Study Final Report
Roger Tym & Partners M9153, August 2007 47
the UK average of 11.9 per cent. Thus, the overall proportion of vacant town centre units is not a cause for concern.
5.50 Anecdotal stakeholder evidence suggests that the town centre’s overall vacancy rate has remained fairly constant in recent years. The Manager of Coopers Square reported that the Centre has been fully let for the past seven years, and the Manager of Burton Place also reported low and static vacancy levels. There appears to be consensus that the three shopping centres in Burton are doing well relative to other parts of the town centre, which contain a higher amount of vacant property.
5.51 Experian's latest Goad plan shows that vacant units are generally well-dispersed across the town centre. The only notable concentrations of vacancy units are in secondary locations such as Union Street and at Station Street (west of Guild Street).
Uttoxeter
5.52 At 7.1 per cent, the overall vacancy rate in Uttoxeter at the time of the latest Goad survey (January 2005) was significantly better than the UK average (11.9 per cent). Furthermore, our field visits for this study confirm that the current vacancy rate in the town centre remains unchanged. Positively, the three adjoining units fronting Market Place that were vacant in January 2005 have since been occupied, and the eight presently vacant units are well-dispersed across the town centre.
Indicator 9: Pedestrian Flows
Burton
5.53 We are not aware of any formal pedestrian flow counts undertaken recently in Burton town centre, and are therefore reliant upon anecdotal stakeholder evidence and observations from our visits to the centre.
5.54 The Manager of Burton Place stated that footfall has risen by 4.6 per cent in the last year, which he attributed largely to the anchor Wilkinson's store. Average weekly footfall in the Centre is reported to be 82,000, although we do not have any time-series data to compare this with.
5.55 The Manager of the Octagon Centre reported a similar rate of improvement, with weekly average footfall levels increasing by 3.2 per cent between 2005 and 2006, from 98,682 to 101,797. Furthermore, the Manager estimated that footfall at the Centre in January 2007 was approximately 10 per cent ahead of January 2006. Footfall at the Centre was also said to have performed well against national benchmarks according to the Centre’s Manager, although we were not provided with any specific figures.
5.56 In summary, the anecdotal evidence appears to suggest that footfall levels in the town centre's three covered precincts – which account for approximately three quarters of the town centre’s total retail floorspace – are on an upward trajectory. If true, this would be in line with the so-called ‘polarisation trend’, whereby the highest-ranking centres are becoming increasingly stronger and, hence, busier.
Uttoxeter
5.57 The Manager of the Maltings Centre reported anecdotally that footfall levels at the Centre have increased slowly. However, as with Burton, we do not have access to any time-series pedestrian flow data and so we are unable to verify whether footfall in Uttoxeter is increasing.
Summary of the Retail Performance of Burton and Uttoxeter
Burton
5.58 On the whole, we conclude that Burton is a healthy town centre. This is evidenced by: Burton’s very good improvement in the national centre rankings over recent years, with Burton now ranking higher than Wolverhampton for the first time; a broad range of

Retail and Leisure Capacity Study Final Report
Roger Tym & Partners M9153, August 2007 48
convenience and comparison sector outlets; encouraging recent improvement in retail rents; a low level of street-level unit vacancy, with no particular concentrations of void units in the town centre; and apparently increasing levels of footfall.
5.59 Nevertheless, there is room for improvement in a number of key areas. Most notably, the town centre contains only one department store (Beatties), which is relatively small by modern standards. The current number of published retailer requirements for Burton – and the specific operators listed – is somewhat disappointing given the size and status of Burton. Nevertheless, through primary research undertaken for this study, we have identified a confirmed interest in Burton from a range of prominent comparison retail operators. Several high-profile food & drink operators have also confirmed an interest in Burton, which would help to address another key town centre deficiency.
5.60 Attracting the operators referred to above is presently constrained by the lack of available premises of the right size, configuration and trading environment.
Uttoxeter
5.61 Uttoxeter’s position in the national retail rankings has slipped alarmingly in recent years. However, the planned scheme at the Cattlemarket site will provide larger units than those which are presently available. We consider it likely that this scheme will attract a number of high-profile operators, and that Uttoxeter’s position in the retail rankings will consequently improve thereafter.
5.62 Uttoxeter town centre performs increasingly well in relation to most other key performance indicators for which data are available. Retail yields have shown considerable improvement in recent years – and are now on a par with those achieved in Burton - and the town centre’s overall vacancy rate is low. Whilst the centre contains only a few national multiple comparison operators, this is not untypical for centres of the size and function of Uttoxeter. Similarly, the town centre’s convenience sector offer is broadly commensurate with its role and function.
5.63 There is a good level of interest in Uttoxeter from a range of prominent comparison retailers, including Bon Marché and Edinburgh Woollen Mill. We consider that the introduction of these retailers would significantly enhance the centre’s offer. Our research has also uncovered an encouraging level of interest in Uttoxeter from food & drink operators, although we acknowledge that there is likely to be competition for these operators from the out-of-centre Town Meadows Way Retail Park.
Assessment of the Role of Other Non-Retail Uses 5.64 Below, assess the strength and development prospects of the residential and office
markets in East Staffordshire District and Burton-upon-Trent more specifically. The research to inform this part of our report was undertaken by Lambert Smith Hampton (LSH).
Offices
Demand
5.65 Burton-upon-Trent lies on the A38, with good links to the A50, M1 and M6. East Staffordshire competes with other sub-regions such as North Staffordshire and South Staffordshire.
5.66 The North Staffordshire market is focused on Stoke-on-Trent, which provides a more established and popular office market than Burton. This is due to a number of factors including Stoke’s status as a city and its superior proximity to the M6 and, hence, better communication links with the North West and West Midlands regional centres.
5.67 The South Staffordshire market has experienced significant growth since the opening of the M6 toll road in 2004. This new communication link has opened up pockets of the

Retail and Leisure Capacity Study Final Report
Roger Tym & Partners M9153, August 2007 49
county which previously had poor links with the national motorway network, and it has stimulated new development at key sub-regional sites such as the Kingswood Lakeside scheme near Cannock. The new link road has also improved access to Birmingham, making the area far more attractive to occupiers who are looking for proximity to the regional centre, but cheaper, larger floorplate accommodation.
5.68 Burton-upon-Trent is not able to compete with these stronger office markets. It is located to the extreme east of Staffordshire and has to compete against much more established office locations at Lichfield, Cannock and Stafford, all of which have better communication links. Burton is much closer to Nottingham and the East Midlands region, which does not have an office occupier market as strong as that of the West Midlands.
5.69 Within Burton-upon-Trent itself, the office market is divided between the town centre and locations close to key transport nodes.
5.70 According to instaffs (the Staffordshire inward investment agency), the majority of enquiries for space in Burton-upon-Trent are focused at out-of-centre locations, in particular, Centrum 100, Barberry Court and Lancaster Business Park. All of these are located close to major junctions with the A38, providing excellent access to the strategic road network.
5.71 The one location within the town centre that has generated any significant interest was the Imex Business Park; on the edge of Burton town centre, Imex is located directly off the A5189 and five minutes from the A38.
5.72 Information provided by local property market agent Rushton Hickman, indicates that the Burton town centre office market is particularly weak at the present time. There is a large amount of property becoming available within the town centre, much of it second hand space located above shops, which is proving difficult to let. This is primarily due to issues with congestion in the town centre, coupled with poor public transport links and parking facilities, and the increasing amount of good quality office space currently being developed in more accessible locations, close to the strategic road network.
5.73 The office market within Burton is relatively immature, with the majority of demand originating with local professional and service industries. External demand is low as Burton-upon-Trent is not considered, within the wider region/sub-region, as being a traditional office location. This has begun to change as competing areas such as south Derby and Lichfield have a lack of supply, and with space in Burton appearing to offer value for money.
Supply
5.74 There is currently 256,525 sq.ft (23,831 sq.m) of office space available in Burton-upon-Trent (source: FOCUS). Of this available space, 76,878 sq.ft (7,142 sq.m) is located in the town centre, within the Area Action Plan boundary. The available town centre space includes the Imex Business Park, located on Shobnall Road, which has 29,677 sq.ft (2,757 sq.m) available - almost half the total space available in the town centre.
5.75 Following discussions with officers in the Council’s Economic Regeneration section and inspection of the planning register, we are not aware of any extant planning permissions for new office developments, or indeed any currently undetermined applications for offices.
5.76 Rushton Hickman made us aware that the HMRC office on New Street may become vacant in the near future, due to the merger of the Inland Revenue and HM Customs and Excise. This would provide a large town centre site for redevelopment. It is likely that this building would be extremely difficult to re-let and LSH considers that redevelopment for offices would be constrained by achievable rental levels.

Retail and Leisure Capacity Study Final Report
Roger Tym & Partners M9153, August 2007 50
Rental Levels
5.77 For out-of-centre locations such as Centrum 100 - with good transport connections, parking and good quality development including air conditioning, suspended ceilings and floors - quoted rents are around £15 per sq.ft. LSH advised that actual rental levels are closer to £13-14 per sq.ft.
5.78 Within Burton town centre, rental levels are much lower, due to oversupply and the issues mentioned above. Quoted rental levels are around £8-9 per sq.ft. Recent deals have been achieving closer to £5-6 per sq.ft. Larger office space in the town centre struggles; for instance, Land Securities Trillium let approximately 5,000 sq.ft at Crown House in July 2006 at £3.91 per sq.ft.
Offices - Summary
5.79 Offices are currently struggling in Burton town centre, with areas on the edge of the town and closer to the strategic network preferred by occupiers. Values are currently very low with average rental values of £5-8 per sq.ft for smaller offices and comparable evidence of £4 per sq.ft for larger office floorplates. This level makes new development unviable as new offices require rental levels of approximately £15 per sq.ft. If land is gifted to developers then rental values of £12.50 per sq.ft are still viable; however, LSH considers it unlikely that space in Burton town centre could achieve this level at the present time. In LSH’s assessment, until congestion and parking issues are addressed or comprehensive public transport links are introduced, it is unlikely that this position will change in the near future.
Residential
5.80 Table 5.2 shows the growth in house prices across East Staffordshire Borough between 2001 and 2006. All types of property have increased significantly in price, in line with the healthy housing market. Over the last five years, the District has experienced average house price growth of 83 per cent. The rate of growth has slowed down over the last two years, across all residential property types.
Table 5.2 Chang e in Residential Property Prices, East Staffordshire Borough, 2001-2006
Detached Semi-Detached Terraced Flat/Maisonette Overall
Av Price
£
No of Trans-actions
Av Price£
No of Trans-actions
Av Price £
No of Trans-actions
Av Price£
No of Trans-actions
Av Price £
No of Trans-actions
2006 238,487 194 148,093 192 107,210 217 107,567 36 159,369 639
2005 240,035 128 136,877 187 104,090 235 99,003 51 142,813 601
2004 234,613 168 133,531 155 96,351 176 104,120 44 150,370 543
2003 197,049 209 109,614 236 80,771 245 119,073 28 125,592 718
2002 173,281 255 92,006 181 59,810 262 61,347 22 108,138 720
2001 134,202 260 67,146 220 44,800 170 44,632 14 87,207 664
5.81 Table 5.3 shows the average house prices in the DE14 1 postcode district, which covers much of Burton town centre. It is evident that only a small number of residential transactions have taken place in this area, which affects the reliability of the information. With this caveat, there has been a high growth in the average house price, of 135 per cent, although as in the District as a whole, the rate of growth has slowed in recent years. As with East Staffordshire as a whole, it is likely that this is due to a lack of product, with the lower value housing consisting of older terraced

Retail and Leisure Capacity Study Final Report
Roger Tym & Partners M9153, August 2007 51
properties. New properties command a premium and thus any new developments would influence the price trend upwards.
Table 5.3 Change in Residential Property Prices 2001-2006, Postcode District DE14 1
Detached Semi-Detached Terraced Flat/Maisonette Overall
Av Price
£
No of Trans-actions
Av Price £
No of Trans-actions
Av Price £
No of Trans-actions
Av Price £
No of Trans-actions
Av Price £
No of Trans-actions
2006 172,166 3 121,000 3 89,843 8 0 0 114,160 14
2005 0 0 118,375 4 111,541 12 83,650 3 108,575 19
2004 0 0 127,650 3 92,289 23 84,530 5 94,459 31
2003 212,665 3 70,333 3 74,387 16 0 0 92,690 22
2002 167,497 7 54,090 5 49,455 10 0 0 88,067 22
2001 0 0 59,666 3 42,908 6 0 0 48,494 9
5.82 The DE14 3 postcode district, which also covers part of the town centre, shows much more robust evidence for house prices than district DE14 1, although it also covers areas outside the study area boundary which since 2001 have shown a much more mature residential market. As with the other areas considered, average house price growth has been strong at 80 per cent, with a slow down/fluctuation in price growth in 2005/6.
Table 5.4 Change in Residential Property Prices 2001-2006, Postcode District DE14 3
Detached Semi-Detached Terraced Flat/Maisonette Overall
Av Price
£
No of Trans-actions
Av Price £
No of Trans-actions
Av Price £
No of Trans-actions
Av Price £
No of Trans-actions
Av Price £
No of Trans-actions
2006 181,533 12 132,612 31 89,611 56 106,248 10 113,486 109
2005 180,707 19 127,082 28 90,914 57 91,543 8 115,233 112
2004 191,445 25 108,366 25 82,834 33 110,554 23 120,486 106
2003 154,300 23 103,640 28 72,762 53 53,680 5 97,023 109
2002 129,320 27 87,870 17 52,945 64 0 0 77,536 108
2001 102,271 32 65,615 22 34,901 46 0 0 63,216 100
5.83 In summary, price growth across all the areas reviewed has been strong over the five year period 2001-2006, albeit the rate of growth slowed considerably during 2005/6. The number of houses sold has remained relatively static, other than in DE14 1, although the small number of transactions here may skew the results.
New Development
5.84 There have been a number of successful developments in Burton town centre over the last couple of years. These include Grants Yard, by Peveril Homes, off Station Street, which provided a mix of 1- and 2-bedroom apartments, and 2- and 3-bedroom town houses. The development was finished in 2006 and some of the properties are beginning to reappear on the market for sale and rent. Typical prices range from £400-£500 per calendar month (pcm) to rent an apartment and £750-850 pcm to rent a town house. Capital values range from £95,000-£120,000 for apartments and £125,000-135,000 for 2-bed town houses and £150,000-£170,000 for 3-bed town houses. These

Retail and Leisure Capacity Study Final Report
Roger Tym & Partners M9153, August 2007 52
prices are also indicative of other similar developments at Wyllie Mews, and Caxton Court.
5.85 There is a major new development at the old Heritage Brewery site, off Orchard Street on the western boundary of the study area. This is a large development of 1- and 2-bed apartments and 3- and 4-bed town houses. The development is being undertaken as a joint venture between Cameron Homes and George Wimpey.
Table 5.5 Indicative Property Prices, Heritage Brewery Site, Burton
Apartments £ 98,000 – £110,000 (1 bed) £120,000 - £145,000 (2 bed) £275,000 (3-bed penthouse)
3-Bed Town house £150,000 – £170,000
4-Bed Town house £175,000 – £185,000
5.86 LSH’s discussions with local agents revealed that Burton town centre has a relatively healthy residential property market. Demand has increased over the last 3-4 years with primarily young professional first time buyers and a heavy interest from investor speculators. The large number of investors in the market has meant that a number of new build properties have come back onto the market for sale and for rent.
5.87 There is currently a large amount of town centre residential stock on the market; however, agents are happy that this is being steadily taken up, with little worry over an excess of supply which could lead to a localised depression in the residential market. The relatively robust nature of the town centre in retail terms makes the town popular with younger purchasers and ensures there is a steady stream of enquiries from potential residents who are looking for good quality affordable space.
5.88 LSH was informed that the town centre could still accommodate further residential development, although agents considered that phasing of development was an important factor in preventing over supply, which in such a small town centre market could prove disastrous.
5.89 Agents consider apartments and 2- and 3-storey town houses to be the most appropriate product as they could provide high density schemes; although they do acknowledge that there is very little family housing on the market.
Residential - Summary
5.90 Residential property is doing well in the town centre. Historically there has been a small number of residential properties within the town centre, and values have been low. However, over the last five years, property prices have almost doubled. New residential development has also increased, with developments at Wyllie Mews - Grants Yard, Caxton Court and Heritage Brewery. Properties mainly consist of 2 bed apartments and 3- and 4-bed town houses with values of approximately £120,000-£140,000 for a 2-bed apartment and £150,000-£170,000 for a 3-bed town house. There is very little family housing in the town centre, however.

Retail and Leisure Capacity Study Final Report
Roger Tym & Partners M9153, August 2007 53
6 CURRENT PATTERNS OF RETAIL AND LEISURE VISITS
Introduction 6.1 This section of our report falls into two main parts. First, we provide a brief overview of
the methodology that we employ to establish current patterns of convenience and comparison shopping, using the results of the survey of households. Secondly, we describe the existing patterns and destinations for various forms of retail and leisure activity.
Methodology 6.2 Our assessment of current patterns of convenience (food) and comparison (non-food)
spending is based on a comprehensive telephone survey of 1,000 households resident in nine ‘zones’ encompassing the overall catchment area (OCA) for East Staffordshire District’s retail centres. In defining the OCA we took into account the findings from the household survey that was undertaken for the West Midlands Regional Centres Study in 2005. We purposely decided not to extend the OCA further towards Derby, given that the north eastern boundary of the OCA as drawn is approximately 10 miles from Burton town centre. The results from the household survey apparently justify our approach. At 29 per cent, zone 4 achieved the lowest comparison sector retention rate, with Derby accounting for a significant proportion of the expenditure leakage; thus it is clear that any flows to Burton from the south Derby area are weak. We elaborate on shopping patterns later in this section of our report.
6.3 The OCA, and its nine constituent zones, is depicted in Figure 6.1. Only OCA zones 1, 7, 8 and 9 are located entirely within East Staffordshire District; the other zones also cover parts of Derbyshire Dales, South Derbyshire and North West Leicestershire Districts, these areas having been included to accurately reflect the overall catchment of East Staffordshire’s centres.
Figure 6.1 Expenditure Zones (East Staffordshire’s Overall Catchment Area)

Retail and Leisure Capacity Study Final Report
Roger Tym & Partners M9153, August 2007 54
6.4 The survey was undertaken in February 2007 by NEMS. The findings are based on a fully representative sample, with a minimum of 77 responding households from each of the nine survey zones shown in Figure 6.1, and with all results weighted to reflect the actual distribution of households across the catchment area in the year 2004.
6.5 NEMS states that the 95 per cent confidence interval is plus or minus 3.2 percentage points; thus, for example, when the sample survey suggests that 56.3 per cent of responding households spend most money on clothes and shoes in Burton town centre, we can be 95 per cent confident that the actual proportion of the total population who spend most on clothes and shoes in Burton town centre is between 53.1 per cent and 59.5 per cent (56.3 ± 3.2).
6.6 Many of the monetary figures given in this section of our report are to two decimal places and many of the percentages quoted are to one decimal place. However, this convention is merely to help the reader to trace the origin of figures which have been drawn from the spreadsheet tables that are presented in the separately bound Annex 2 entitled ‘Retail and Leisure Capacity Spreadsheets’36; we do not wish to imply a spurious level of accuracy and hence our reference to the statistical confidence level in paragraph 6.4 above.
6.7 The telephone survey of households sought to establish current patterns of shopping for the following types of goods:
i) main food and groceries;
ii) top-up shopping for food and groceries;
iii) clothes and shoes;
iv) furniture, carpets, soft household furnishings;
v) DIY and decorating goods;
vi) audio-visual, and domestic appliances such as fridges, cookers and other electrical goods; and
vii) specialist non-food items such as china, glass, books, jewellery, chemists’ goods, photographic goods, musical instruments and sports equipment.
6.8 In the comparison sector, in order to improve the accuracy of the sample and to provide every opportunity for visits to smaller retail centres to be recorded, household survey respondents were asked to give details of their last two shopping trips for each of the five comparison sectors (defined in the last five numbered bullets under paragraph 6.7). Each of the two responses is afforded equal weighting.
6.9 This procedure allows for market shares to be calculated for each of the five types of comparison purchases. We then calculate overall ‘composite’ comparison market shares through the application of a second weight to reflect the proportion of expenditure on each type of goods, as shown in Table 6.1.
36 All mentions of ‘Spreadsheets’ in this section relate to those contained in Annex 2.

Retail and Leisure Capacity Study Final Report
Roger Tym & Partners M9153, August 2007 55
Table 6.1 Second Weighting Used in the Comparison Sector – Proportion of Expenditure on Each Type of Goods
Comparison Sub-sector Weighting (%)
Clothes and shoes 23.5
Furniture, carpets, soft household furnishings 14.2
DIY and decorating goods 10.8
Domestic appliances such as fridges, cookers and other electrical goods 15.3
Specialist non-food items such as china, glass, books, jewellery, photographic goods, musical instruments and sports equipment 36.2
Total 100
6.10 In the convenience sector, the results of the two types of food and groceries expenditure (main and top-up) are merged – through the application of a weight which reflects the estimated proportion of expenditure accounted for by each type – so as to form a composite pattern of convenience spending, expressed as market shares for each destination centre or foodstore, for each survey zone. The weights – which reflect the national market share of the large supermarket operators vis-à-vis the smaller operators and independents and our qualitative assessment of the convenience offer in East Staffordshire’s OCA are as follows:
Main food and groceries = 71% of expenditure
Top-up food and groceries = 29% of expenditure
All convenience expenditure = 100%
6.11 The market shares for each zone are then applied to the pot of expenditure available to the residents of each zone – which is calculated using data on population and per capita spending from MapInfo – in order to express the patterns of shopping in absolute money terms, and so allow the turnover of each centre or store to be calculated. All monetary figures are expressed in year 2004 prices because MapInfo’s expenditure data use this price base.
Comparison Shopping Patterns 6.12 Spreadsheet 2 sets out the OCA and zone populations for base year 2007, and then
for reporting years 2011, 2016, 2021 and 2026. Spreadsheet 3 sets out the ‘goods-based’ per capita comparison expenditure in 2007 – which varies across the nine survey zones – and for each of the subsequent reporting years. Spreadsheet 4 then calculates the overall pot of money available in each zone and the OCA for the base year and each required reporting year. The total comparison expenditure for the 212,044 residents of the East Staffordshire OCA in 2007 amounts to some £613.54m, after an adjustment has been made for the comparison goods spend that is ‘lost’ to special forms of trading such as the internet, mail-order and TV shopping.
6.13 Spreadsheet 5 sets out the market shares – derived from the survey of households – achieved by each of the various centres, stores and retail parks located within and beyond East Staffordshire, expressed as percentages. Spreadsheet 6 then converts the spending patterns to absolute money flows through the application of the percentage market share for each centre to the pot of money available to residents in each zone. Thus, Spreadsheet 6 shows that residents of zone 1 (Uttoxeter town centre and outlying area) have £37.79m available to spend on comparison goods at 2007; of this total, £15.49m is spent in Uttoxeter town centre. When the money flows to Uttoxeter town centre from each zone are added together, Spreadsheet 6 shows that, at 2007, £27.39m of the comparison expenditure of the catchment area’s residents flows to Uttoxeter town centre (4.5 per cent of the total pot of expenditure available).
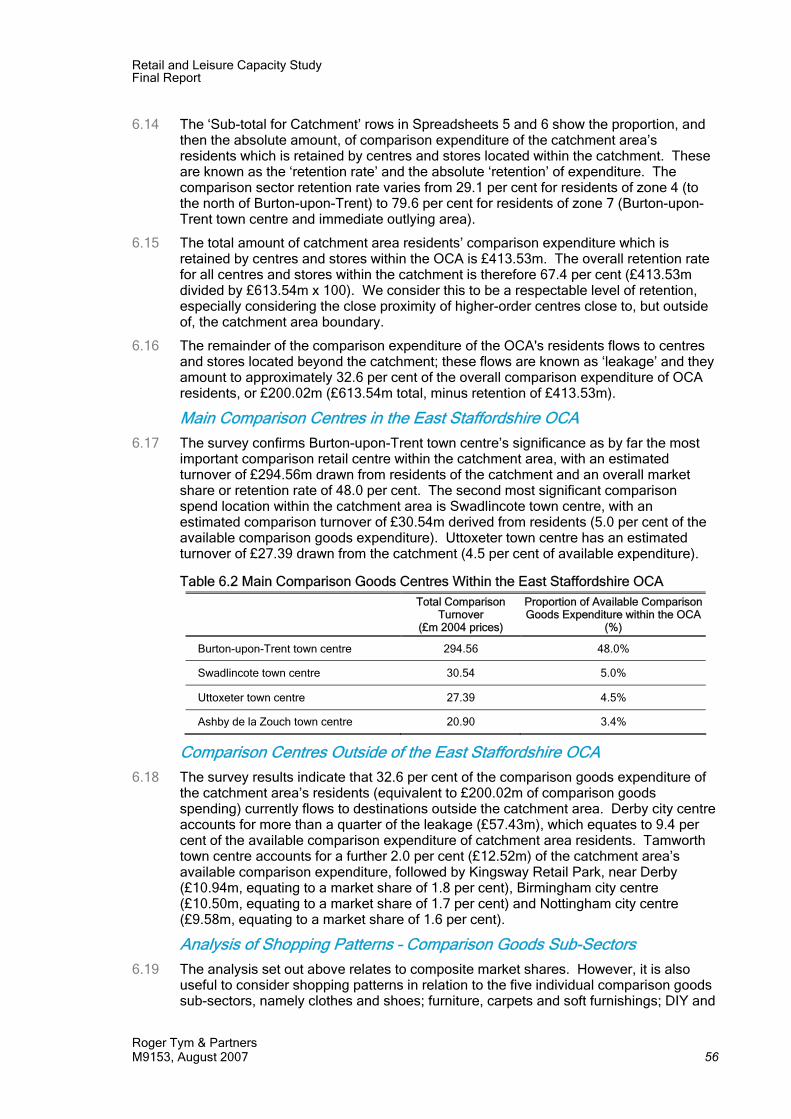
Retail and Leisure Capacity Study Final Report
Roger Tym & Partners M9153, August 2007 56
6.14 The ‘Sub-total for Catchment’ rows in Spreadsheets 5 and 6 show the proportion, and then the absolute amount, of comparison expenditure of the catchment area’s residents which is retained by centres and stores located within the catchment. These are known as the ‘retention rate’ and the absolute ‘retention’ of expenditure. The comparison sector retention rate varies from 29.1 per cent for residents of zone 4 (to the north of Burton-upon-Trent) to 79.6 per cent for residents of zone 7 (Burton-upon-Trent town centre and immediate outlying area).
6.15 The total amount of catchment area residents’ comparison expenditure which is retained by centres and stores within the OCA is £413.53m. The overall retention rate for all centres and stores within the catchment is therefore 67.4 per cent (£413.53m divided by £613.54m x 100). We consider this to be a respectable level of retention, especially considering the close proximity of higher-order centres close to, but outside of, the catchment area boundary.
6.16 The remainder of the comparison expenditure of the OCA's residents flows to centres and stores located beyond the catchment; these flows are known as ‘leakage’ and they amount to approximately 32.6 per cent of the overall comparison expenditure of OCA residents, or £200.02m (£613.54m total, minus retention of £413.53m).
Main Comparison Centres in the East Staffordshire OCA
6.17 The survey confirms Burton-upon-Trent town centre’s significance as by far the most important comparison retail centre within the catchment area, with an estimated turnover of £294.56m drawn from residents of the catchment and an overall market share or retention rate of 48.0 per cent. The second most significant comparison spend location within the catchment area is Swadlincote town centre, with an estimated comparison turnover of £30.54m derived from residents (5.0 per cent of the available comparison goods expenditure). Uttoxeter town centre has an estimated turnover of £27.39 drawn from the catchment (4.5 per cent of available expenditure).
Table 6.2 Main Comparison Goods Centres Within the East Staffordshire OCA Total Comparison
Turnover (£m 2004 prices)
Proportion of Available Comparison Goods Expenditure within the OCA
(%)
Burton-upon-Trent town centre 294.56 48.0%
Swadlincote town centre 30.54 5.0%
Uttoxeter town centre 27.39 4.5%
Ashby de la Zouch town centre 20.90 3.4%
Comparison Centres Outside of the East Staffordshire OCA
6.18 The survey results indicate that 32.6 per cent of the comparison goods expenditure of the catchment area’s residents (equivalent to £200.02m of comparison goods spending) currently flows to destinations outside the catchment area. Derby city centre accounts for more than a quarter of the leakage (£57.43m), which equates to 9.4 per cent of the available comparison expenditure of catchment area residents. Tamworth town centre accounts for a further 2.0 per cent (£12.52m) of the catchment area’s available comparison expenditure, followed by Kingsway Retail Park, near Derby (£10.94m, equating to a market share of 1.8 per cent), Birmingham city centre (£10.50m, equating to a market share of 1.7 per cent) and Nottingham city centre (£9.58m, equating to a market share of 1.6 per cent).
Analysis of Shopping Patterns – Comparison Goods Sub-Sectors
6.19 The analysis set out above relates to composite market shares. However, it is also useful to consider shopping patterns in relation to the five individual comparison goods sub-sectors, namely clothes and shoes; furniture, carpets and soft furnishings; DIY and

Retail and Leisure Capacity Study Final Report
Roger Tym & Partners M9153, August 2007 57
decorating goods; audio-visual and domestic appliances; and specialist items such as china, glass, books, jewellery, photographic goods, musical instruments and sport equipment.
Clothes and Shoes Sub-Sector
6.20 Clothes and shoes is a critically important comparison sub-sector in terms of the success or otherwise of a town centre; analysis of shopping patterns in this sub-sector is therefore of considerable utility. Table 6.3 shows that Burton-upon-Trent town centre achieves the highest clothes and shoes market share for all zones, except zone 4, and the highest market share for the catchment (54 per cent). Even in zone 4, Burton-upon-Trent town centre still accounts for 37 per cent of residents’ clothes and shoes expenditure. The second most significant centre is Derby city centre, which accounts for the highest market share in zone 4 (43 per cent), and for 11 per cent of all clothes and shoes expenditure throughout the catchment. Uttoxeter town centre accounts for just 3 per cent of total clothes and shoes expenditure throughout the catchment.
Table 6.3 Clothes and Shoes Sub-sector - Market Shares of Town/City Centres by Zone
Town/City Centres’ Overall Clothes & Shoes Market Shares by Zone Market Share Zone 1 Zone 2 Zone 3 Zone 4 Zone 5 Zone 6 Zone 7 Zone 8 Zone 9 All
Zones
Highest B-u-T
TC (29%)
B-u-T TC
(22%)
B-u-T TC
(48%)
Derby CC
(43%)
B-u-T TC
(56%)
B-u-T TC
(34%)
B-u-T TC
(72%)
B-u-T TC
(62%)
B-u-T TC
(52%)
B-u-T TC
(54%)
2nd Highest
U’eter TC
(26%)
U’eter TC
(18%)
Derby CC
(32%)
B-u-T TC
(37%)
S’cote TC
(13%)
Ashby TC
(15%)
Derby CC
(7%)
Derby CC
(13%)
L’field CC
(13%)
Derby CC
(11%)
3rd Highest
Hanley TC
(11%)
Derby CC
(15%)
A’bourne TC
(8%)
N’ham CC
(5%)
Derby CC
(7%)
Tam’th TC
(10%)
B’ham CC
(3%)
B’ham CC
(4%)
U’eter TC
(7%)
S’cote TC
(4%)
Furniture, Carpets and Soft Household Furnishings Sub-Sector
6.21 Burton-upon-Trent town centre achieves the highest market share for expenditure on furniture/carpets/soft furnishings amongst residents in zones 5, 6, 7, 8 and 9, and has the highest overall market share across the catchment (43 per cent). Derby city centre is the second most important location for spending on furniture/carpets/soft furnishings, achieving a 10 per cent market share across the OCA as a whole. Uttoxeter town centre is also of significance, having the highest market share in the sub-sector in zones 1 and 2, and a 5 per cent overall share of the furniture/carpets/soft furnishings market (Table 6.4).
Table 6.4 Furniture/Carpets/Soft Household Furnishings Sub-sector - Market Shares of Town/City Centres by Zone
Town/City Centres’ Overall Furniture/Carpets/Soft Household Furnishings Market Shares by Zone Market
Share Zone 1 Zone 2 Zone 3 Zone 4 Zone 5 Zone 6 Zone 7 Zone 8 Zone 9 All
Zones
Highest U’eter
TC (43%)
U’eter TC
(28%)
Derby CC
(36%)
Derby CC
(40%)
B-u-T TC
(45%)
B-u-T TC
(23%)
B-u-T TC
(64%)
B-u-T TC
(52%)
B-u-T TC (54%)
B-u-T TC
(43%)
2nd Highest
B-u-T TC
(10%)
B-u-T TC
(9%)
B-u-TTC
(34%)
B-u-T TC
(21%)
S’cote TC
(11%)
Ashby TC
(19%)
Derby CC
(8%)
Derby CC
(13%)
U’eter TC
(13%)
Derby CC
(10%)
3rd Highest
Staff’d TC
(8%)
Stoke TC
(9%)
K’sway RP
(13%)
N’ham CC
(13%)
Derby CC
(8%)
C’ville TC
(10%)
Ikea, N’ham (5%)
N’ham CC
(4%)
C’nock & R’ley TCs
(8%)
U’eter TC
(5%)

Retail and Leisure Capacity Study Final Report
Roger Tym & Partners M9153, August 2007 58
DIY and Decorating Goods Sub-Sector
6.22 Burton-upon-Trent town centre achieves the highest market share for expenditure on DIY and decorating goods amongst residents in zones 5, 6, 7, 8 and 9, and the highest market share – by some distance - for the OCA as a whole (Table 6.5). In zone 7, the Burton-upon-Trent ‘core’ zone, the centre accounts for some 86 per cent of residents’ available DIY and decorating goods expenditure. Kingsway Retail Park, incorporating a B&Q Supercentre and situated a short distance to the west of Derby city centre, achieves the highest market share from residents in zones 3 and 4, attracting 36 per cent and 69 per cent in those zones, respectively. Uttoxeter town centre achieves the third highest overall market share for expenditure on this comparison sub-sector, attaining 5 per cent of available expenditure within the OCA.
Table 6.5 DIY and Decorating Goods Sub-sector - Market Shares of Town/City Centres by Zone
Town/City Centres’ Overall DIY and Decorating Goods Market Shares by Zone Market Share Zone 1 Zone 2 Zone 3 Zone 4 Zone 5 Zone 6 Zone 7 Zone 8 Zone 9 All
Zones
Highest U’eter
TC (35%)
U’eter TC
(38%)
K’sway RP
(36%)
K’sway RP
(69%)
B-u-T TC
(71%)
B-u-T TC
(22%)
B-u-T TC
(86%)
B-u-T TC
(74%)
B-u-T TC
(42%)
B-u-T TC
(57%)
2nd Highest
D’fields RP
(25%)
Meir Park RP(12%)
B-u-TTC
(32%)
Derby CC
(15%)
S’cote TC
(8%)
C’ville TC
(17%)
K’sway RP
(6%)
Derby CC
(8%)
U’eter TC
(18%)
K’way RP (8%)
3rd Highest
Meir Park RP (16%)
D’fieldsRP
(8%)
Derby CC
(11%)
B-u-T CC
(9%)
K’sway RP
(5%)
L’boro TC
(12%)
Derby CC
(3%)
N’ham CC
(6%)
L’field CC
(15%)
U’eter TC
(5%)
Audio-Visual and Domestic Appliances Sub-Sector
6.23 Table 6.6 shows that Burton-upon-Trent town centre achieves the highest market share for expenditure on domestic appliances in zones 5, 6, 7, 8 and 9, and accounts for 42 per cent of the aggregate available expenditure for this sub-sector within the OCA. Derby city centre achieves the highest market share of domestic appliance expenditure in zones 2 and 3, with Uttoxeter town centre and Kingsway Retail Park (which also incorporates Currys and Comet stores) being the top-performing destinations in zones 1 and 4, respectively.
Table 6.6 Domestic Appliances Sub-sector - Market Shares of Town/City Centres by Zone
Town/City Centres’ Overall Domestic Appliances Market Shares by Zone Market Share Zone 1 Zone 2 Zone 3 Zone 4 Zone 5 Zone 6 Zone 7 Zone 8 Zone 9 All
Zones
Highest U’eter
TC (38%)
Derby CC
(18%)
Derby CC
(31%)
K’sway RP
(45%)
B-u-T TC
(43%)
B-u-T TC
(22%)
B-u-T TC
(63%)
B-u-T TC
(58%)
B-u-T TC
(54%)
B-u-T TC
(42%)
2nd Highest
B-u-T TC
(10%)
U’eter TC
(16%)
B-u-TTC
(29%)
Derby CC
(24%)
S’cote TC
(23%)
Ashby TC
(19%)
Derby CC
(8%)
Derby CC
(14%)
Joint 2nd L’field
CC (13%)
Derby CC
(10%)
3rd Highest
D’fields RP
(8%)
B-u-T TC
(11%)
K’sway RP
(20%)
B-u-T CC
(9%)
Derby CC
(9%)
T’worth TC
(10%)
M’way RP
(7%)
N’ham CC
(6%)
Joint 2nd M’way
RP (13%)
S’cote TC
(7%)
‘Other’ Comparison Goods Sub-Sector
6.24 The final comparison goods sub-sector relates to other non-food items such as china, glass, books, jewellery, photographic goods, musical instruments and sports equipment. Table 6.7 shows that Burton-upon-Trent town centre again secures the highest market share in a majority of zones, and attracts 50 per cent of residents’

Retail and Leisure Capacity Study Final Report
Roger Tym & Partners M9153, August 2007 59
available specialist goods expenditure throughout the catchment. Ashby de la Zouch town centre attracts the highest market share in zone 6 (41 per cent), Derby city centre does the same in zone 4 (43 per cent), and Uttoxeter town centre achieves the highest share in zones 1 and 2 (53 per cent and 38 per cent, respectively). Derby city centre, attracting 9 per cent of available expenditure within the OCA, and Swadlincote town centre, achieving 7 per cent, are the second and third most significant retail destinations in this sub-sector.
Table 6.7 ‘Other’ Comparison Goods Sub-sector - Market Shares of Town/City Centres by Zone
Town/City Centres’ Overall ‘Other’ Comparison Goods Market Shares by Zone Market Share Zone 1 Zone 2 Zone 3 Zone 4 Zone 5 Zone 6 Zone 7 Zone 8 Zone 9 All
Zones
Highest U’eter
TC (53%)
U’eter TC
(38%)
B-u-T TC
(29%)
Derby CC
(43%)
B-u-T TC
(50%)
Ashby TC
(41%)
B-u-T TC
(77%)
B-u-T TC
(56%)
B-u-T TC (53%)
B-u-T TC
(50%)
2nd Highest
B-u-T TC
(14%)
B-u-T TC
(19%)
Derby CC
(22%)
B-u-T TC
(24%)
S’cote TC
(22%)
Burton TC
(22%)
Derby CC
(5%)
T’bury DC
(11%)
L’field CC
(20%)
Derby CC
(9%)
3rd Highest
Derby CC
(7%)
Derby CC
(11%)
Joint 3rd Ash’ne TC & T’bury
DC (15%)
Will’tonLC
(5%)
Derby CC
(6%)
B’ham CC
(5%)
B’ham CC
(3%)
Derby CC
(9%)
Joint 3rd B’ham CC & U’eter TC (6%)
S’coteTC
(7%)
Convenience (Food and Groceries) Shopping Patterns 6.25 Spreadsheet 2 of Annex 2 sets out the OCA and zone populations for base year 2007,
and then for each of the subsequent reporting years. Spreadsheet 13 set out the ‘goods-based’ per capita convenience expenditure in 2007 – which varies across the nine survey zones – and for each of the reporting years. Spreadsheet 14 then calculates the overall pot of money available in each zone and the OCA for base year and each required reporting year. The total convenience expenditure for the 212,044 residents of the East Staffordshire OCA in 2007 amounts to some £336.69m, after an adjustment has been made for the convenience goods spend that is accounted for by special forms of trading such as the internet.
6.26 Spreadsheet 15 sets out the market shares – derived from the survey of households – achieved by each of the grocery stores named by respondents, expressed as percentages. Spreadsheet 16 then converts the spending patterns to absolute money flows through the application of the percentage market share for each centre to the pot of money available to residents in each zone. Thus, residents of zone 1 (Uttoxeter town centre and outlying area) have £19.75m available to spend on convenience goods at 2007; of this total, £12.06m is spent at the Tesco superstore at Brookside Road, Uttoxeter. When the money flows to the Tesco superstore at Brookside Road, Uttoxeter from each zone are added together, Spreadsheet 16 shows that £24.52m of the convenience expenditure of the residents of the East Staffordshire OCA flows to that store.
6.27 The ‘Sub-total for Catchment’ rows in Spreadsheets 15 and 16 show the proportion (the ‘retention rate’), and then the absolute amount, of convenience expenditure of the catchment area’s residents which is retained by centres and stores located within the catchment. The convenience sector retention rate varies from 31.8 per cent for residents of zone 4 (to the north of Burton-upon-Trent) to 96.6 per cent for residents of zone 7 (Burton-upon-Trent town centre and immediate outlying area). The total amount of OCA residents’ convenience expenditure which is retained by centres and stores within the catchment area is £294.51m.
6.28 The overall convenience sector retention rate, therefore, is about 87.5 per cent (£294.51m divided by £336.69m x 100), which we consider to be a relatively healthy

Retail and Leisure Capacity Study Final Report
Roger Tym & Partners M9153, August 2007 60
level of retention. The remainder of the convenience expenditure of the catchment area’s residents flows to centres and stores located beyond the catchment; these flows are known as ‘leakage’ and they amount to approximately 12.5 per cent of the overall convenience expenditure of the catchment area’s residents, or £42.18m (£336.69m total, minus retention of £294.51m).
Main Convenience Stores within the East Staffordshire OCA
6.29 The survey findings show that two stores each account for more than 9 per cent of the total convenience goods expenditure available to the residents of the East Staffordshire OCA, these being the Tesco superstore at Bond End Wharf, Burton-upon-Trent (9.8 per cent) and the Sainsbury’s at Union Street, Burton-upon-Trent (9.6 per cent). The two stores account for an estimated £32.95m and £32.17m of the convenience goods expenditure of residents of the catchment, respectively.
6.30 Four other individual foodstores located within the OCA achieve market shares of 7 per cent or greater. Two of these are within East Staffordshire District; the Morrisons superstore at Wellington Road, Burton-upon-Trent, which accounts for 8.9 per cent (£30.01m) of the convenience goods expenditure available within the catchment, and the Tesco store at Brookside Road, Uttoxeter which accounts for a further 7.3 per cent (£24.52m).
6.31 A total of seven stores located within the OCA collectively account for more than half of the convenience expenditure of the catchment’s residents (Table 6.8).
Table 6.8 Main Convenience Stores within the East Staffordshire OCA
Estimate* of Total Convenience
Turnover £m (2004 Prices)
Proportion of Available Convenience Goods
Expenditure within the OCA (%)
Tesco, Bond End Wharf, Burton-upon-Trent 32.95 9.8
Sainsbury’s, Union Street, Burton-upon-Trent 32.17 9.6
Morrisons, Wellington Road, Burton-upon-Trent 30.01 8.9
Tesco, Resolution Road, Ashby de la Zouch 25.89 7.7
Tesco, Brookside Road, Uttoxeter 24.52 7.3
Morrisons, Coppice Side, Swadlincote 24.35 7.2
Sainsbury’s, Civic Way, Swadlincote 21.40 6.4
Total 184.35 54.8%
* These are estimates because the survey findings are subject to the confidence interval referred to in paragraph 6.4 and because of the weighting estimates referred to in paragraph 6.7.
6.32 The survey results indicate that approximately 12.5 per cent of the convenience expenditure of the OCA’s residents flows to stores and centres outside the catchment. The main named destinations for households who shop in convenience stores outside the catchment are the Sainsbury’s superstore at Kingsway Retail Park, near Derby, which accounts for £6.09m of the expenditure that leaks from the catchment (1.8 per cent of the total convenience goods expenditure of the catchment area’s residents) and the Asda superstore at Sinfin district centre, Derby, which accounts for a further £4.75m of the total leakage (1.4 per cent of the total convenience goods expenditure within the catchment).
Analysis of Convenience Market Shares by Individual Zone
6.33 Analysis of individual zones shows that in six zones (zones 1, 2, 5, 6, 7 and 8), more than 88 per cent of available convenience expenditure is retained within the OCA. This reflects the accessibility of the Tesco superstore in Uttoxeter (primarily serving zones 1

Retail and Leisure Capacity Study Final Report
Roger Tym & Partners M9153, August 2007 61
and 2), the Sainsbury’s and Morrisons superstores in Swadlincote (zone 5), the Tesco superstore in Ashby de la Zouch (zone 6) and the Morrisons, Sainsbury’s and Tesco superstores in Burton-upon-Trent (primarily serving zones 7 and 8).
6.34 Zones 3 and 9 retain 57.2 per cent and 64.1 per cent of total convenience goods expenditure, respectively, reflecting the proximity of convenience goods stores around Derby and Lichfield. Zone 4 has a retention rate of just 31.8 per cent, which again reflects the availability of large convenience stores around Derby and, in particular, the Tesco superstore at Mickleover. The market shares of individual foodstores in each zone are shown in Table 6.9.
Table 6.9 Convenience Sector – Market Shares of Individual Foodstores/Centres by Zone
Stores’ Overall Convenience Market Shares by Zone Market Share Zone 1 Zone 2 Zone 3 Zone 4 Zone 5 Zone 6 Zone 7 Zone 8 Zone 9 All
Zones
Highest
Tesco U’eter (61%)
Tesco U’eter (61%)
Tesco, M’over, Derby (16%)
Tesco, M’over, Derby (32%)
M’sons S’cote (27%)
Tesco Ashby (53%)
Tesco B-u-T (23%)
M’sons B-u-T (29%)
Tesco U’eter (13%)
Tesco B-u-T (10%)
2nd Highest
S’field U’eter (9%)
S’field U’eter (9%)
S’burys Ash’ne (15%)
S’burys K’way, Derby (15%)
S’burys S’cote (23%)
S’field Ashby (14%)
S’burys B-u-T (22%)
S’burys B-u-T (17%)
S’burysB-u-T(11%)
S’burysB-u-T (10%)
3rd Highest
Tesco E’press U’eter (5%)
Tesco Meir Park, Stoke (5%)
Tesco U’eter (8%)
Asda, Sinfin, Derby (13%)
S’field S’cote (11%)
M’sons C’ville (6%)
M’sons B-u-T (15%)
Tesco U’eter (6%)
M’sons B-u-T (10%)
M’sonsB-u-T (10%)
Analysis of Shopping Patterns – Convenience Goods Sub-Sectors
6.35 The analysis set out above relates to composite market shares. Below, we briefly consider shopping patterns in relation to ‘main’ and ‘top-up’ spending.
Convenience Shopping Patterns - ‘Main’ Spend Destinations
6.36 Table 6.10 shows that the Tesco store in Burton-upon-Trent accounts for 12 per cent of all ‘main’ food shopping trips across the OCA as a whole, followed by the Morrisons and Sainsbury's stores – also in Burton – which each account for around 11 per cent of ‘main’ convenience shopping trips.
6.37 At individual zone level, the Tesco store in Uttoxeter achieves the highest proportion of ‘main’ convenience shopping trips for residents in zones 1, 2 and 9. The Tesco store at Mickleover, Derby accounts for the highest proportion of main convenience trips for residents in the northern part of the OCA (zones 3 and 4), which is unsurprising given its proximity to Derby.

Retail and Leisure Capacity Study Final Report
Roger Tym & Partners M9153, August 2007 62
Table 6.10 Convenience Sector – Market Shares of Individual Foodstores/Centres by Zone (‘Main’ Shopping Trips)
Stores’ Convenience Market Shares by Zone (Main Food Shopping Trips) Market Share Zone 1 Zone 2 Zone 3 Zone 4 Zone 5 Zone 6 Zone 7 Zone 8 Zone 9 All
Zones
Highest
Tesco U’eter (68%)
Tesco U’eter (66%)
Tesco Derby (20%)
Tesco Derby (38%)
M’sons S’cote (33%)
Tesco Res Rd Ashby (41%)
Tesco B-u-T (25%)
M’sons B-u-T (38%)
Tesco U’eter (15%)
Tesco B-u-T (12%)
2nd Highest
S’field U’eter (7%)
S’field U’eter (7%)
S’burys A’brne (14%)
S’burys Derby (20%)
S’burys S’cote (27%)
Tesco Nott Rd Ashby (41%)
S’burys B-u-T (24%)
S’burys B-u-T (20%)
S’burys B-u-T (14%)
M’sons B-u-T (11%)
3rd Highest
M’sons B-u-T (3%)
Tesco Meir (5%)
Tesco U’eter / M’sons B-u-T (each 10%)
Asda Derby (18%)
S’field S’cote (10%)
M’sons C’ville (7%)
M’sons B-u-T (18%)
Tesco B-u-T (11%)
M’sons B-u-T/ M’sons Rugeley/ Tesco B-u-T (each 13%)
S’burys B-u-T (11%)
Convenience Shopping Patterns - ‘Top-up’ Spend Destinations
6.38 A total of 71 per cent of households across the OCA indicated that they undertake top-up convenience shopping trips in addition to their main food shopping trips. The stores cited by those respondents are displayed in table 6.11.
Table 6.11 Convenience Sector – Market Shares of Individual Foodstores/Centres by Zone (‘Top-up’ Shopping Trips)
Stores’ Convenience Market Shares by Zone (Top-Up Trips) Market Share Zone 1 Zone 2 Zone 3 Zone 4 Zone 5 Zone 6 Zone 7 Zone 8 Zone 9 All
Zones
Highest
Tesco U’eter (20%)
Tesco U’eter (32%)
‘Other stores’, Hatton (24%)
Co-op Will’ton (24%)
S’field S’cote (12%)
Tesco Ashby (23%)
Co-op Str’ton B-u-T (13%)
‘Other stores’, Barton (17%)
‘Other stores’ Yoxall (26%)
Co-op Str’ton B-u-T (5%)
2nd Highest
Tesco E’press U’eter (15%)
S’field U’eter (11%)
S’burys A’brne (12%)
Tesco E’press Hilton Derby (23%)
S’burys S’cote (11%)
S’field Ashby (17%)
Tesco B-u-T (11%)
‘Other stores’, R’leston (13%)
M’sons Rugeley (9%)
Tesco B-u-T (5%)
3rd Highest
Iceland U’eter / S’field U’eter (each 9%)
Spar R’cster U’eter (9%)
Tesco E’press Hilton Derby (5%)
Tesco M’over Derby (13%)
M’sons S’cote (8%)
‘Other stores’, Ashby (9%)
S’burys B-u-T (8%)
Co-op Str’ton B-u-T (12%)
Tesco U’eter (7%)
S’burys B-u-T (4%)
6.39 The results show that whilst some respondents do use larger foodstores for top-up shopping, smaller supermarkets and local shops also feature strongly in the responses, confirming that top-up food shopping is more of a locally based activity than main food shopping. Overall, the Co-op store at Stretton in Burton was used for top-up shopping by just over 5 per cent of OCA residents, making it the most popular store for top-up shopping. Local shops in zones also account for the greatest number of top-up shopping trips for residents in zones 3, 8 and 9.
6.40 Other smaller stores which attract a reasonable proportion of top-up expenditure within their local area include the Spar store in Rocester (zone 2), local shops in Ashby de la Zouch (zone 6), and the Co-op store at Stretton as well as other local shops in Rolleston on Dove (zone 8).
6.41 Table 6.10 shows that the Tesco store in Burton-upon-Trent accounts for 12 per cent of all ‘main’ food shopping trips across the OCA as a whole, followed by the Morrisons

Retail and Leisure Capacity Study Final Report
Roger Tym & Partners M9153, August 2007 63
and Sainsbury's stores – also in Burton – which each account for around 11 per cent of ‘main’ convenience shopping trips.
Leisure Patterns 6.42 The survey of households included a number of questions that asked residents within
the East Staffordshire OCA where they spent the most money on certain types of leisure activity including visits to restaurants; cafés, bars and pubs; cultural venues; bingo halls, casinos and bookmakers; sports venues; and, establishments offering personal services, such as hairdressers and beauty parlours (Table 6.10).
Restaurants
6.43 Some 75 per cent of all households surveyed across the OCA as a whole indicated that they visit restaurants. Considering responses from residents across the OCA as a whole, the most popular destination for visits to a restaurant is Burton-upon-Trent town centre (35 per cent of responses), followed by Ashby de la Zouch town centre (7 per cent), Derby city centre (6 per cent), Swadlincote town centre (5 per cent) and Uttoxeter town centre (4 per cent). Burton-upon-Trent town centre is also the principal destination to eat at a restaurant for residents in zones 5, 7 and 8, and the joint most popular destination – along with Derby city centre – for residents of zone 9. Uttoxeter town centre is the most popular destination for residents in zones 1 and 2, Derby city centre is the main destination for residents in zone 4, and Ashby de la Zouch town centre is most popular for zone 6 residents.
Cafés, Bars & Pubs
6.44 Overall, 72 per cent of all households questioned visit cafés, bars and pubs. Burton-upon-Trent town centre achieves – by some distance – the best market share among residents that do visit pubs, with 34 per cent. However, it is the main destination for drinks for residents of just two zones, these being zone 7 (71 per cent) and zone 8 (37 per cent). As expected, the nearest main towns to residents in each survey zone achieve the highest market share for café, bar and pub use. Therefore, with the exception of zones 1 and 2, where Uttoxeter town centre is the principal destination for residents, and zones 7 and 8, residents of the other five zones cited different principal centres for visits to cafés, bars and pubs.
Cinema, Theatre & Concert
6.45 The household survey indicates that 41 per cent all respondents do not visit cultural services such as cinemas, theatres and concert halls. The most popular destination for visits to such venues is Burton-upon-Trent town centre (50 per cent), followed by Derby city centre (11 per cent), Birmingham city centre (6 per cent) and Uttoxeter town centre (6 per cent). No other location was cited by five per cent or more of respondents who visit restaurants.
Bingo, Casino & Bookmaker
6.46 A very high proportion of respondents do not play games of chance, that is, visiting the bingo, a casino or bookmaker (90 per cent). For those residents of the catchment that do, the most popular destination is again Burton-upon-Trent (53 per cent), and then Derby city centre (11 per cent), Swadlincote (6 per cent) and Uttoxeter town centre (5 per cent). No other location received more than five per cent of the games of chance market share of the catchment.
Recreation and Sporting Services
6.47 According to the household survey, only 37 per cent of OCA residents engage in recreational and sporting activity, whether it be attending a sporting fixture, taking an active part in playing sport or undertaking other recreational activities (such as ten-pin bowling). The dominant destination for residents that engage in such activities is

Retail and Leisure Capacity Study Final Report
Roger Tym & Partners M9153, August 2007 64
Burton-upon-Trent, which achieves a 39 per cent overall market share, and serves as the prime location for residents in zones 5, 7, 8 and 9. Other destinations that are important for recreational and sporting activity are Swadlincote town centre, which achieves an overall market share of 11 per cent, and Derby city centre, which is the destination for 8 per cent of OCA residents’ recreational and sporting activities.
Personal Services
6.48 Just under two-thirds (65 per cent) of residents stated that they use personal services, such as hairdressers and beauty parlours. The most popular location for residents that do use such services is Burton-upon-Trent town centre (32 per cent), followed by Swadlincote town centre and Uttoxeter town centre (both 10 per cent), Ashby de la Zouch town centre (9 per cent), and then Derby city centre (6 per cent). No other location was cited by more than five per cent of respondents.
Table 6.10 Town/City Centre Where Most Money is Spent on Leisure Activities Main Destination by Category of Leisure Pursuit
Survey Zone Restaurants Cafés, Bars
& Pubs
Cinema, Theatre,
Concert & Museum
Bingo, Casino &
Bookmaker Sports
Personal Services, e.g. Hairdresser,
Barber & Beauty Parlour
1 Uttoxeter TC
Uttoxeter TC
Uttoxeter TC
Uttoxeter TC
Uttoxeter TC
Uttoxeter TC
2 Uttoxeter TC
Uttoxeter TC
Uttoxeter TC Stafford TC Uttoxeter
TC Uttoxeter
TC
3 Ashbourne TC
AshbourneTC
Joint 1st – Burton-
upon-Trent TC & Derby
CC
Derby CC
Ashbourne TC
Derby CC
4 Derby CC
Derby CC
Burton-upon-Trent
TC
Derby CC
Derby CC
Derby CC
5 Burton-
upon-Trent TC
SwadlincoteTC
Burton-upon-Trent
TC
Burton-upon-Trent
TC
Burton-upon-Trent
TC
SwadlincoteTC
6 Ashby de la Zouch TC
Ashby de la Zouch TC
Burton-upon-Trent
TC
Ashby de la Zouch TC
Ashby de la Zouch TC
Ashby de la Zouch TC
7 Burton-
upon-Trent TC
Burton-upon-Trent
TC
Burton-upon-Trent
TC
Burton-upon-Trent
TC
Burton-upon-Trent
TC
Burton-upon-Trent TC
8 Burton-
upon-Trent TC
Burton-upon-Trent
TC
Burton-upon-Trent
TC
Burton-upon-Trent
TC
Burton-upon-Trent
TC
Burton-upon-Trent TC
9
Joint 1st – Burton-
upon-Trent TC &
Lichfield CC
Abbots Bromley
LC
Burton-upon-Trent
TC
Burton-upon-Trent
TC
Burton-upon-Trent
TC
Uttoxeter TC
Main Spend Destination (across all
zones)
Burton-upon-Trent
TC
Burton-upon-Trent
TC
Burton-upon-Trent
TC
Burton-upon-Trent
TC
Burton-upon-Trent
TC
Burton-upon-Trent TC
Conclusions on Retail and Leisure Spending Patterns 6.49 The survey of households has shown that:
i) town centres, retail parks and individual stores located within the East Staffordshire OCA retain, collectively, some 67 per cent of the comparison expenditure of residents of the catchment, which we consider to be a very good level of retention;
Retail and Leisure Capacity Study Final Report
Roger Tym & Partners M9153, August 2007 65
ii) the main outflows (or leakage) of comparison expenditure are to Derby city centre (£57.43m) and Tamworth town centre (£12.52m), equating to composite market shares of about 9 per cent and 2 per cent, respectively;
iii) town centres and individual foodstores located within the East Staffordshire OCA retain, collectively, some 87 per cent of the convenience expenditure of residents of the catchment, which again is a healthy level of retention;
iv) only two zones have a convenience goods retention rate of less than 60 per cent, these being zone 3 (57 per cent) and zone 4 (32 per cent). The relatively low retention rate achieved in each of these zones reflects the availability of large convenience stores around Derby and, in particular, the Tesco superstore at Mickleover; and
v) Burton-upon-Trent town centre is the prime destination for each of the six leisure activities featured in the questionnaire. Burton-upon-Trent town centre achieves a market share of at least 30 per cent for all leisure sub-sectors and accounts for more than 50 per cent of the catchment area residents’ total visits to cultural facilities and games of chance establishments.
6.50 Thus, based on our performance analyses, our assessment of qualitative needs and the results of the survey of households, we consider that the East Staffordshire OCA is currently performing relatively well. Accordingly, there may be only limited scope to increase the OCA’s market share (or retention) of both comparison and convenience goods expenditure from the current base position of 67 per cent and 87 per cent, respectively. We return to this issue in Section 7.


Retail and Leisure Capacity Study Final Report
Roger Tym & Partners M9153, August 2007 67
7 QUANTITATIVE RETAIL CAPACITY ANALYSIS
Summary of Methodology and Data Inputs 7.1 The main steps in the assessment of the quantitative capacity for further retail
floorspace are conceptually the same for both the comparison and convenience goods sectors. The methodology is summarised below, together with information on the various data inputs that we have used for our assessment of quantitative retail capacity:
i) use the household survey data to establish the comparison and convenience goods spending patterns of residents of East Staffordshire’s overall catchment area (OCA) and assess the overall retention of expenditure by centres and stores located within the OCA;
ii) forecast the growth in the comparison and convenience goods expenditure of the OCA’s residents from 200737 to 2026, taking account of population change and real growth, over and above inflation, in per capita spending levels;
iii) consider the future retention rate – the proportion of the expenditure of the OCA’s residents that is spent in centres and stores located within the OCA;
iv) make allowances for ‘claims’ on retail expenditure growth, which are:
o the growth in ‘turnover efficiency’ (turnover per sq.m sales area) for existing retailers, of 2.25 per cent, per annum, for comparison retailers (this being the mid-point figure from Experian’s 2.0 to 2.5 per cent, per annum range38) and of 0.2 per cent, per annum for convenience retailers (this being the lower figure from Experian's suggested range of 0.2 to 1.2 per cent, per annum39);
o our best estimate of the likely growth over time in Special Forms of Trading (SFT), of which e-tail will be of most significance; and
o existing commitments for retail development; and then
v) convert the resulting residual expenditure (that is, growth in retained expenditure, less the three ‘claims’ on it) to a potential sales floorspace ‘capacity’.
7.2 Each of the data inputs is important, but four particularly critical inputs are the rate of population change; the rate of per capita expenditure growth; the assumed retention rate; and the allowance made for SFT.
Population Growth
7.3 MapInfo provided initial population data for each of the nine zones for the year 2004. The forecast level of future growth has been principally derived from population data provided by Staffordshire County Council’s Research Unit40, which has allowed us to model population growth at zone level. For areas lying outwith the East Staffordshire District boundary, we have used multipliers derived from Office for National Statistics population forecasts.
7.4 We have modelled two alternative population scenarios; Scenario A (‘low population growth’) assumes that the OCA population in East Staffordshire in the period to 2026 will increase in accordance with the proposed West Midlands Regional Spatial
37 Per capita retail expenditure data for the OCA we sourced from MapInfo, with bespoke data provided for
each of the nine survey zones. 38 Experian, Retail Planner Briefing Note 4.0 (October 2006), page 21. 39 Footnote 8 on page 8 of Experian’s Retail Planner Briefing Note 2.2 (April 2005), which is reproduced as
footnote 14 of Retail Planner Briefing Note 4.0. 40 Forecasts produced by Staffordshire County Council on 12 December 2006 using POPGROUP software.
Retail and Leisure Capacity Study Final Report
Roger Tym & Partners M9153, August 2007 68
Strategy Spatial Option 1, and Scenario B (‘high population growth’) assumes that the East Staffordshire population will grow in accordance with Spatial Option 341.
7.5 For each of the two scenarios, the population in zones 1 to 9 in the forecasting years 2007, 2011, 2016, 2021 and 2026 was calculated by estimating the population in each ward by rolling forward the 2004 MapInfo data to the required forecasting year, and then summing together the ward populations which form each particular zone.
7.6 Using this method, under Scenario A (low population growth), the resident population across the entire East Staffordshire OCA is forecast to increase from 209,958 in the 2007 base year to 230,201 in 2026. This equates to a total population increase of 10 per cent over the study period. Under the high population growth Scenario B, the resident population across the OCA is forecast to increase from 212,044 in 2007 to 245,243 in 2026, equating to a 16 per cent increase42.
Per Capita Expenditure Growth Rates
7.7 As an alternative to projections of expenditure growth based on past trends, MapInfo has teamed up with Oxford Economics Forecasting (OEF) to produce forecasts for goods based expenditure growth in the period up to 2016, as set out in Table 2 of Information Brief 06/02. MapInfo sits on the fence and makes no recommendation as to whether the past trends projections or the OEF forecasts are to be preferred. However, we prefer the MapInfo/OEF forecasts, as opposed to their past trends projections, which MapInfo acknowledges have inherent weaknesses: ‘…The projections are derived solely from past trends and take no account of current economics or future expectations. Convenience goods retail expenditure has been erratic over the last 40 years.’ In contrast, MapInfo states that the forecasts are: ‘…consistent with past trends, but are also based upon expected changes in other economic variables of interest...’
7.8 Accordingly, we have used goods based43 per capita expenditure growth rates of 4.4 per cent, per annum (comparison sector) and 0.9 per cent, per annum (convenience sector), these being the forecasts for the 2005-2016 period specified in Table 2 of Information Brief 05/02. No forecasts are provided for the period beyond 2016; in the absence of any other evidence we have applied the same growth rates over the period to 2026.
Variation of the Retention Rate
7.9 A further critical variable is the overall future retention rate assumption. The current retention rate identified by the household survey for the comparison sector is 67 per cent and the convenience sector retention rate is 87 per cent. For both sectors, we consider the rate to be healthy. Although retention levels rise or fall slowly over time, in response to the changing positions of centres in the regional retail hierarchy, forecasting increases significantly above the current level may be unrealistically ambitious given the strong competing centres that lie in relatively close proximity to the OCA’s boundary, such as Derby, Nottingham and Birmingham.
7.10 Given the presence of these higher-order centres, a significant element of comparison expenditure outflow will be inevitable and is a normal part of the functioning of the retail hierarchy. The so called ‘polarisation’ trend means that many of the UK’s top quality retailers are now unwilling to consider locating in any centre which ranks below 50 in the national rankings. Burton is placed 65th in the Venuescore 2006 centre rankings, with Uttoxeter placed 791st. The nearby centres of Derby, Nottingham and
41 West Midlands Regional Assembly, West Midlands Regional Spatial Strategy – Phase Two Revision
(January 2007), Housing Chapter 42 The 2007 population is different for the two scenarios because we had to grow the 2004 population data (as
supplied by MapInfo) using the different growth rates associated with each RSS Spatial Option. 43 PPS6 states (paragraph 3.10) that assessments of retail ‘need’ should be made using goods based data,
and that ‘business based cases will not be appropriate.’

Retail and Leisure Capacity Study Final Report
Roger Tym & Partners M9153, August 2007 69
Birmingham are ranked 43rd, 7th and 2nd respectively. Similarly, it is inevitable – and entirely legitimate – that some convenience goods expenditure will always flow to nearby destinations that lie outwith the catchment (such as the Asda store at Sinfin District Centre, Derby, and the Sainsbury’s store at Kingsway Retail Park, Derby).
7.11 Given this, and the current healthy retention rates, we do not consider it realistic to plan for an increase in the catchment’s retention. Therefore, our quantitative analysis assumes constant market shares, so that the retention rate established for the 2007 base position (from the survey of households) stays the same in 2011, 2016, 2021 and 2026. Thus, in the comparison sector the retention rate remains constant at 67 per cent, and in the convenience sector it is fixed at 87 per cent.
Special Forms of Trading
7.12 We have based our allowance for increases in expenditure claimed by SFT over the study period on those cited by Experian in Table 6.2 of Retail Planner Briefing Note 2.3D44. In the comparison goods sector, Experian estimates that ‘non-store retail sales’ will account for 8.6 per cent of total expenditure at 2007 and 12.0 per cent by 2011, and we deduct this proportion of spend from applicable reporting periods’ total OCA comparison goods expenditure. Estimates are only provided until 2014, at which point Experian estimates that non-store comparison sales will plateau at 12.4 per cent. We subsequently use this figure as our estimate of the comparison expenditure claimed by SFT at 2016, 2021 and 2026.
7.13 In the convenience goods sector, Experian forecasts that SFT will account for 4.3 per cent of total expenditure at 2007 and 6.2 per cent by 2011. Again, forecasts are only provided until 2014, at which point it is estimated that non-store convenience sales will plateau at 6.5 per cent. However, many convenience goods internet sales are simply taken from the shelves of the operator’s nearest superstore and so we are wary of overestimating convenience goods non-store sales. Accordingly, we have halved Experian’s projections on the basis that, in our assessment, around 50 per cent of such purchases will actually be taken off a local foodstore’s shelves. Thus, we estimate that non-store convenience goods sales will account for 2.2 per cent of total expenditure at 2007, 3.1 per cent at 2011, and 3.2 per cent at 2016, 2021 and 2026.
Quantitative Assessment of Need for Further Comparison Sector Floorspace
7.14 We have not sought to establish the individual capacities for either Burton-upon-Trent or Uttoxeter town centres, because the assessment of the capacity of individual centres based on constant market shares means little. Rather, we have taken a macro approach which assesses the overall amount of residual expenditure likely to be generated by residents of the whole of the OCA area, prior to making recommendations as to where, geographically, any residual should be met, taking into account the hierarchy of existing centres and the sequential approach.
Forecast Growth in Comparison Expenditure of OCA Residents
7.15 Spreadsheets 2 to 10 and 22 to 30 of Annex 2 provide the projections for population, per capita spending and the overall comparison goods spend for residents of each of the nine zones, under the two population senarios. Table 7.1 below summarises the projected growth in comparison spending for residents in the whole of the East Staffordshire OCA, derived by applying the MapInfo/OEF forecast comparison expenditure growth rate of 4.4 per cent, per capita, per annum, as detailed in paragraph 7.1. The total increase in comparison goods expenditure that arises over the 2007-26 study period under the low population growth Scenario A (£839.2m)
44 Experian, Retail Planner Briefing Note 2.3D, Estimates & Projections of the Share of E-tailing in UK Retail Spending, December 2005

Retail and Leisure Capacity Study Final Report
Roger Tym & Partners M9153, August 2007 70
equates to a growth of 138.1 per cent, and the increase under the high population growth Scenario B (£927.5m) amounts to a 151.2 per cent increase.
Table 7.1 Projected Growth in the Comparison Expenditure of Residents of the East Staffordshire Overall Catchment Area, £m (2004 Prices)
2007 2011 2016 2021 2026 Change 2007-11
Change 2011-16
Change 2016-21
Change 2021-26
Change2007-26
£m £m £m £m £m £m £m £m £m £m
Scenario A - Low Population Growth
607.5 706.6 897.0 1139.6 1446.7 99.1 190.4 242.6 307.1 839.2
Scenario B - High Population Growth
613.5 722.8 931.2 1199.0 1541.0 109.2 208.4 267.8 342.1 927.5
7.16 Table 7.2 below sets out the amount of comparison expenditure which is retained by all centres and stores located within the catchment area and the growth in retained expenditure that results. Thus, the overall growth in retained expenditure in the OCA up to 2026 would amount to £558.6m under the low population growth Scenario A, and to £623.5m under the high population growth Scenario B.
Table 7.2 Comparison Expenditure Retained by Centres/Stores Located in the East Staffordshire Overall Catchment Area, £m (2004 Prices)
2007 2011 2016 2021 2026 Change 2007-11
Change 2011-16
Change 2016-21
Change 2021-26
Change 2007-26
£m £m £m £m £m £m £m £m £m £m
Scenario A - Low Population Growth
409.1 474.9 601.6 763.0 967.7 65.8 126.7 161.4 204.7 558.6
Scenario B - High Population Growth 413.5 486.8 626.7 806.7 1037.1 73.3 139.9 180.0 230.4 623.5
Allowances for Claims on Comparison Expenditure Growth
7.17 Table 7.3 summarises the main deductions for the claims on the initial surplus of comparison expenditure – i.e. the allowances for existing retail planning commitments and for increased floorspace efficiency - for both population growth scenarios. There are five comparison retail commitments to take account of in the OCA. These developments together comprise some 13,490 sq.m (145,205 sq.ft) of new comparison floorspace (net sales area). We estimate that this new floorspace and allowances for increased floorspace efficiency will together account for some £104.8m of the initial surplus of comparison expenditure at 2011 under Scenario A, and £105.2m under Scenario B.
Table 7.3 Initial Comparison Retail Expenditure Residual
Change Change Change Change Change Scenario A - Low Population Growth 2007-11 2011-16 2016-21 2021-26 2007-26
Goods Base £m £m £m £m £m
Initial Surplus 65.8 126.7 161.4 204.7 558.6
Claims on Capacity 104.8 60.5 67.6 75.5 298.6
Residual -39.0 66.2 93.8 129.1 260.0
Change Change Change Change Change
Scenario B - High Population Growth 2006-11 2011-16 2016-21 2021-26 2007-26
Goods Base £m £m £m £m £m
Initial Surplus 73.3 139.9 180.0 230.4 623.5
Claims on Capacity 105.2 61.0 68.2 76.3 301.0
Residual -32.0 78.9 111.7 154.1 322.6

Retail and Leisure Capacity Study Final Report
Roger Tym & Partners M9153, August 2007 71
7.18 Table 7.3 shows that the range in the comparison goods residual under the two different population growth models at 2026 is from £260.0m to £322.6m. Around half of the overall residual can be attributed to the final 2021-2026 reporting period; the total residual apparent at 2021 is £121.0m under low population growth Scenario A and £158.6m under high population growth Scenario B. It should also be noted that under both scenarios there is a negative residual at 2011, due to the relatively large amount of comparison floorspace within the OCA that is currently committed in the planning pipeline.
7.19 The overall range in comparison expenditure residual, achieved by applying different population growth models, is relatively wide. However, even if the high population growth scenario proposed by West Midlands Regional Spatial Strategy Spatial Option 3 was not to be achieved, there is still a substantial expenditure residual available to support new comparison retail floorspace within the study area.
Converting Residual Comparison Expenditure to Net Sales Floorspace Requirements45
7.20 In order to translate residual expenditure into floorspace, we use a floorspace efficiency rate at 2011 of £5,516 per sq.m net. This is derived by combining the current floorspace efficiency rate of Burton-upon-Trent ‘high street’ comparison-type retail developments of £6,539 per sq.m net in the year 2007, and a lower efficiency rate of £2,200 per sq.m net which is closer to what could be expected to be achieved by a range of ‘bulky goods’ or retail warehouse-type stores, in the ratio of 85 per cent (‘high street’) to 15 per cent (‘bulky goods’). We then incorporate a 2.25 per cent, per annum forecast growth rate to calculate a composite floorspace efficiency rate which equates to £5,516 per sq.m net in 2011, £6,165 per sq.m net in 2016, £7,098 per sq.m net in 2026, and £7,701 per sq.m net in 2026.
7.21 Table 7.4 draws together the findings and converts the residual expenditure totals for each of the population growth scenarios into theoretical net sales46 floorspace requirements.
7.22 For the OCA as a whole, the quantitative need up to 2026 ranges from around 33,653 sq.m (362,044 sq.ft) net under low population growth Scenario A, to around 42,753 sq.m (460,189 sq.ft) net under high population growth Scenario B. Again, it should be emphasised that around half of this requirement arises between 2021 and 2026; in the period 2007-2021, the quantitative need equates to 16,886 sq.m (181,759 sq.ft) net under Scenario A, and to 22,741 sq.m (244,782 sq.ft) net under Scenario B.
45Our floorspace forecasts for both the comparison and convenience sectors should be treated as indicative
only. Long-term forecasts to 2021 and 2026, whilst valuable for strategic planning purposes, should be regarded as subject to increasing uncertainty in the later parts of the study period and should be kept under regular review.
46 Typical net to gross ratios are 70 per cent for ‘high street’ comparison retail and 80 to 90 per cent for comparison retail warehouses.

Retail and Leisure Capacity Study Final Report
Roger Tym & Partners M9153, August 2007 72
Table 7.4 Conversion of Expenditure Surplus to Comparison Floorspace Requirements
Scenario A – Low Population Growth
COMPARISON 2007-11 2011-16 2016-21 2007-21 2021-26 2007-26
Goods Base Residual (£m) -39.0 66.2 93.8 121.0 129.1 260.0
Assumed Floorspace Efficiency, £ per sq.m sales area 5,516 6,165 7,098 7,701
Floorspace Requirement, sq.m sales area -7,075 10,742 13,219 16,886 16,767 33,653
Scenario B – High Population Growth
COMPARISON 2007-11 2011-16 2016-21 2007-21 2021-26 2007-26
Goods Base Residual (£m) -32.0 78.9 111.7 158.9 154.1 322.6
Assumed Floorspace Efficiency, £ per sq.m sales area 5,516 6,165 7,098 7,701
Floorspace Requirement, sq.m sales area -5,793 12,791 15,743 22,741 20,012 42,753
7.23 The comparison expenditure capacity forecasts should be interpreted with some care. First, as we have indicated above, almost half of the expenditure residual available to support new floorspace identified under each of growth scenarios does not arise until the 2021-26 period. Notwithstanding this, both the low and high population growth floorspace requirements arising by 2021 are still significant.
7.24 Secondly, the positive capacity residual in the comparison sector does not necessarily imply that there is scope for further out-of-centre development; it will be necessary to evaluate any individual proposals as they come forward in the light of the specific format of retailing proposed, and the scale of identified requirements. Indeed, any proposals which come forward in out-of-centre locations will need to be subject to the stringent application of the five key national policy tests and there must be no risk of any harm to the vitality and viability of the catchment’s town centres.
7.25 Nevertheless, it is evident that – even when assuming no increase in the retention rate from its current level of 67 per cent – there is scope for a significant amount of additional comparison retail development within the East Staffordshire OCA during the periods up to 2021 and 2026. Such development will be necessary in order to meet the shopping needs of local residents and thereby assist in maintaining the current retention rate for the catchment area.
Summary of Quantitative Need in the Comparison Sector
7.26 There is a clear quantitative need for additional comparison retail floorspace in the East Staffordshire OCA. In the period to 2021, the range is from around 16,900 sq.m (181,800 sq.ft) net when assessed on the basis of low future population growth (Scenario A), to around 22,750 sq.m (244,800 sq.ft) net based on high future population growth (Scenario B). In the 2007-26 period, the overall comparison retail floorspace requirement range increases to around 33,700 sq.m (362,000 sq.ft) net under Scenario A, to around 42,800 sq.m (460,200 sq.ft) under Scenario B. As previously discussed, the identified floorspace requirements are based on a static retention rate, which we consider to be the most realistic scenario to plan for given the healthy current retention rate of 67 per cent.
Quantitative Assessment of Need for Further Convenience Sector Floorspace
7.27 As with the comparison sector, we have not sought to establish the individual capacities for each of the various centres within the OCA area, and have instead taken a macro approach which assesses the overall amount of residual expenditure likely to

Retail and Leisure Capacity Study Final Report
Roger Tym & Partners M9153, August 2007 73
be generated by residents of the whole of the OCA area. We then make recommendations as to where, geographically, any residual should be met, taking into account the hierarchy of existing centres and the sequential approach.
7.28 The OCA as a whole retains 87 per cent of available convenience expenditure, which is a healthy overall level of expenditure retention given the close proximity of large foodstores close to, but outside of, the OCA boundary. Although some zones (in particular, zone 4) retain a relatively low proportion of expenditure, they are located close to food stores which have a legitimate claim on expenditure (such as the Asda store at Sinfin District Centre, Derby, and the Sainsbury’s store at Kingsway Retail Park, Derby). Thus, the potential to increase the retention rate is limited.
7.29 However, given the localised nature of convenience shopping, it would be undesirable from a policy perspective if there were to be any material reduction in the convenience goods retention level. Therefore, our assessment proceeds on the basis of a static retention rate of 87 per cent over the reporting periods. Again, we quantify the future need for convenience goods floorspace under both low and high population growth scenarios.
Forecast Growth in Convenience Expenditure of OCA Residents
7.30 Spreadsheets 2, 12 to 19, 22, and 32 to 40 of Annex 2 provide the projections for population, per capita spending and the overall convenience goods spend for residents of each of the nine OCA zones. Table 7.5 below summarises the projected growth in convenience spending for residents in the whole of the OCA area, derived by applying the MapInfo/OEF forecast comparison expenditure growth rate of 0.9 per cent, per capita, per annum. The total increase in convenience goods expenditure that arises over the 2006-26 study period under the low population growth scenario (£95.4m) equates to a growth of 28.6 per cent, and the increase under the high population growth scenario (£119.9m) amounts to a 35.6 per cent increase.
Table 7.5 Projected Growth in the Convenience Expenditure of Residents of the East Staffordshire Overall Catchment Area, £m (2004 Prices)
2007 2011 2016 2021 2026Change2007-11
Change 2011-16
Change 2016-21
Change 2007-21
Change 2021-26
Change2007-26
£m £m £m £m £m £m £m £m £m £m £m
Scenario A - Low Population Growth 333.4 348.9 373.8 400.5 428.8 15.5 24.9 26.7 67.1 28.3 95.4
Scenario B - High Population Growth 336.7 356.8 387.9 421.2 456.6 20.1 31.1 33.3 84.7 35.3 119.9
7.31 Table 7.6 below sets out the amount of convenience expenditure which is retained by all foodstores located within the catchment area and the growth in retained expenditure that results. The overall growth in retained expenditure in the OCA up to 2026 amounts to £81.2m under the low population growth Scenario A, and to £104.0m under the high population growth Scenario B.
Table 7.6 Convenience Expenditure Retained by Centres/Stores Located in the East Staffordshire Overall Catchment Area, £m (2004 Prices)
2007 2011 2016 2021 2026Change2007-11
Change 2011-16
Change 2016-21
Change 2007-21
Change 2021-26
Change2007-26
£m £m £m £m £m £m £m £m £m £m £m
Scenario A - Low Population Growth 291.5 304.5 325.6 348.4 372.7 13.0 21.1 22.8 56.9 24.3 81.2
Scenario B - High Population Growth 294.5 311.9 338.8 367.7 398.5 17.4 26.9 28.9 73.2 30.8 104.0

Retail and Leisure Capacity Study Final Report
Roger Tym & Partners M9153, August 2007 74
Allowances for Claims on Convenience Expenditure Growth
7.32 Before the increases in retained convenience expenditure can be converted into theoretical floorspace requirements, it is necessary to allow for food retail planning commitments. In the case of the East Staffordshire catchment, we understand that there are four significant foodstore commitments, the most notable of which is the proposal for an extension to the Tesco foodstore at Town Meadows Way, Uttoxeter. This proposed development comprises 2,495 sq.m of additional gross convenience floorspace, and we estimate that it will account for £21.5m of the initial surplus of convenience expenditure at 2011.
7.33 A further deduction is necessary in order to allow for the likely growth in productivity amongst existing retailers within the OCA of 0.2 per cent, per annum, as detailed in paragraph 7.1. This growth represents a ‘claim’ on the forecast increase in retained expenditure, and thus not all of the increase will be available to support new floorspace.
Residual Expenditure – Convenience Sector
7.34 Table 7.7 summarises the main deductions for the claims on the initial surplus of convenience expenditure, under each of the population growth scenarios. The table shows a significant overall positive residual at 2026 under both scenarios.
7.35 The range in the convenience goods residual under the two different population growth models at 2026 is from £44.6m to £67.3m. As in the comparison retail sector, a significant proportion of the overall residual can be attributed to the final 2021-2026 reporting period; the total residual apparent at 2021 is £23.3m under low population growth Scenario A and £36.5m under high population growth Scenario B. As with comparison goods expenditure, under both scenarios there is a negative residual at 2011, due to the relatively large amount of convenience floorspace within the OCA that is currently committed by way of extant planning permissions.
7.36 The overall range in convenience expenditure residual, achieved by applying different population growth models, is significant. The range is – proportionally at least – greater than that achieved for comparison goods expenditure due to the relatively low forecasted convenience expenditure growth rate. As such, most of the identified residual can be attributed to future increases in population.
Table 7.7 Initial Comparison Retail Expenditure Residual
Scenario A - Low Population Growth
Change 2007-11
Change 2011-16
Change 2016-21
Change 2007-21
Change 2021-26
Change 2007-26
Goods Base £m £m £m £m £m £m
Initial Surplus 13.0 21.1 22.8 56.9 24.3 81.2
Claims on Capacity 27.2 3.2 3.2 33.6 3.3 36.6
Residual -14.2 17.9 19.5 23.2 21.0 44.6
Scenario B - High Population Growth
Change 2007-11
Change 2011-16
Change 2016-21
Change 2007-21
Change 2021-26
Change 2007-26
Goods Base £m £m £m £m £m £m
Initial Surplus 17.4 26.9 28.9 73.2 30.8 104.0
Claims on Capacity 27.2 3.2 3.3 33.7 3.3 36.8
Residual -9.9 23.7 25.7 39.5 27.5 67.3

Retail and Leisure Capacity Study Final Report
Roger Tym & Partners M9153, August 2007 75
Converting Residual Expenditure to Net Convenience Retail Floorspace Requirements
7.37 In order to translate residual expenditure into floorspace requirements, we use an assumed sales density of £8,000 per sq.m net in the 2007 base year, which corresponds to the average turnover efficiency of all major foodstore operators47. The lower levels of expenditure growth in the convenience sector (in relation to the comparison sector) indicate a reduced need to take account of increases in floorspace efficiency. However, it is still necessary to make some allowance for increased turnover of new floorspace in the future and we do so by increasing the ‘base’ floorspace efficiency by 0.2 per cent, per annum to calculate a floorspace efficiency rate of £8,080 per sq.m net in 2011, £8,161 per sq.m net in 2016, £8,227 per sq.m net in 2021, and £8,310 per sq.m net in 2026.
7.38 Table 7.9 draws together the findings and converts the outputs from each of the convenience expenditure scenarios – the residual expenditure totals – into theoretical net sales48 floorspace requirements. Although there is a negative floorspace requirement in the 2007-11 period under both population growth scenarios, positive floorspace requirements arise in the 2011-16, 2016-21 and 2021-26 periods, which more than offset the initial negative residual.
7.39 For the OCA as a whole, the quantitative need up to 2026 ranges from around 5,348 sq.m (57,565 sq.ft) net under low population growth Scenario A, to around 8,113 sq.m (87,327 sq.ft) net under high population growth Scenario B. More than a third of this requirement arises between 2021 and 2026; in the period 2007-2021, the quantitative need equates to 2,819 sq.m (30,343 sq.ft) net under Scenario A, and to 4,799 sq.m (51,656 sq.ft) net under Scenario B.
Table 7.8 Conversion of Expenditure Surplus to Convenience Floorspace Requirements
Scenario A – Low Population Growth
2007-11 2011-16 2016-21 2007-21 2021-26 2007-26
Goods Base Residual (£m) -14.2 17.9 19.5 23.2 21.0 44.6
Assumed Floorspace Efficiency, £ per sq.m sales area 8,080 8,161 8,227 8,310
Floorspace Requirement, sq.m sales area -1,755 2,198 2,376 2,819 2,529 5,348
Scenario B – High Population Growth
2007-11 2011-16 2016-21 2007-21 2021-26 2007-26
Goods Base Residual (£m) -9.9 23.7 25.7 39.5 27.5 67.3
Assumed Floorspace Efficiency, £ per sq.m sales area 8,080 8,161 8,227 8,310
Floorspace Requirement, sq.m sales area -1,221 2,901 3,119 4,799 3,314 8,113
Summary of Quantitative Need in the Convenience Sector
7.40 Forecast expenditure increases in the convenience sector are much more modest than in the comparison sector. The resultant quantitative requirements for further convenience goods floorspace in the periods up to 2021 and 2026 are therefore considerably smaller than in the comparison retail sector. Under the low population growth Scenario A, there is scope for around 5,300 sq.m (57,600 sq.ft) of additional convenience floorspace (net sales area) in the period to 2026, based on the floorspace
47 Mintel, Retail Rankings, 2006 48 The typical gross to net ratio for convenience retail stores is 60 per cent.

Retail and Leisure Capacity Study Final Report
Roger Tym & Partners M9153, August 2007 76
efficiency of typical supermarket operators. Under the high population growth Scenario B, there is scope for around 8,100 sq.m (87,300 sq.ft) of additional convenience floorspace (net sales area) in the period to 2026.
7.41 The convenience floorspace requirements arising in the shorter period to 2021 are in the range 2,800 sq.m (30,300 sq.ft) net under Scenario A to 4,800 sq.m (51,700 sq.ft) net under Scenario B.
7.42 These floorspace requirements relate to the growth in retained expenditure for the whole of the catchment area and development to meet most, or all of it, should be channelled to the existing town, district and local centres within the catchment if at all possible. Development that could help to improve the localised retention rate in zones 3, 4 and 9 should be viewed favourably, subject to the sequential approach and having ensured that the proposed quantum of floorspace is of an appropriate scale.

Retail and Leisure Capacity Study Final Report
Roger Tym & Partners M9153, August 2007 77
8 ASSESSMENT OF SCOPE FOR ADDITIONAL COMMERCIAL LEISURE PROVISION
Forecast Increases in Leisure Expenditure 8.1 The approach to the assessment of quantitative need in the leisure sector is less well
developed than in the retail sector. Furthermore, development in the leisure sector has historically been very market-led, and it is only recently that leisure has been brought into the range of uses covered by the sequential approach.
8.2 Nevertheless, Experian49 and MapInfo50 have recently published information on leisure spending in six COICOPS (Classification of Individual Consumption by Purpose) categories. Analysis of the information reveals the following pattern of leisure spend across the East Staffordshire OCA:
Table 8.1 Breakdown of Leisure Spend in the East Staffordshire OCA in 2004 COICOPS Categories Description
Spend Per Capita £
% of Total Leisure Services Spend
11.1.1 Restaurants, cafés, bars, etc 1,209 62.8
9.4.2 Cultural services 199 10.4
11.2 Accommodation services 193 10.0
9.4.3 Games of chance 157 8.2
9.4.1 Recreational and sporting services 91 4.8
12.1.1 Personal services (hairdressers etc) 74 3.9
TOTAL ‘LEISURE SERVICES’ SPEND 1,924 100.0
8.3 Table 8.1 shows that restaurants, cafés and bars account for around three fifths of the average per capita spend on leisure services. Cultural services and accommodation services are the second and third highest categories, but each of these accounts for just 10 per cent of leisure services spend. Furthermore, commercially oriented property developments, such as cinemas, account for only a small fraction of spend on cultural services (5.1 per cent), with bingo halls accounting for just 6 per cent of spend on games of chance, and with casinos accounting for just 14 per cent of spend on games of chance51.
8.4 Bearing in mind the structure of current spend on leisure services, our next step in the assessment of leisure need was to calculate the growth in leisure spend for residents of East Staffordshire’s overall catchment area (OCA) in the period 2007 to 2021. We sourced per capita leisure expenditure data from our in-house MapInfo dataset for residents of the same nine zones that we used for the retail forecasts (as depicted in Figure 6.1). This is set out in Spreadsheet CL1, which also shows how the leisure spend is projected forward to the year 2021, using Experian’s recommended growth rate for spending on leisure services of 1.4 per cent, per capita, per annum for the period 2005 to 201552. For completeness, we also project leisure spend forward to 2026. However, for the purposes of planning for commercial leisure needs, we caution
49 Experian, Retail Planner Briefing Note 4.0 (October 2006), Table 2.1. 50 MapInfo, 2004 Leisure Goods & Services Expenditure at Output Area Level: Product Guide (March 2007),
and associated leisure expenditure dataset 51 Betting accounts for the greatest proportion of ‘games of chance’ expenditure (36 per cent, according to the
Leisure Industries Research Council). 52 Experian, Retail Planner Briefing Note 4.0, Table 3.2 (we do not have access to the corresponding MapInfo
forecasts). Experian's forecasts do not go beyond 2015; in the absence of any better information we have therefore also applied the 1.4 per cent, per annum forecast growth rate to the post-2015 period.

Retail and Leisure Capacity Study Final Report
Roger Tym & Partners M9153, August 2007 78
against looking beyond 2021, which is itself a long time period in the commercial leisure sector; the remainder of this section proceeds on this basis.
8.5 Spreadsheet CL1 reveals that, using the ‘high population growth’ scenario (‘RSS Option 3’) as the basis, the total leisure spend for residents within the East Staffordshire OCA is projected to grow from £640.4m in 2007 to £700.1m by 2011, £780.9m by 2016 and again to £869.3m by 2021. Growth in spending on leisure services therefore amounts to 35.7 per cent in the period up to 2021. This far exceeds the total projected population growth in this period, of 7.1 per cent under the ‘low population growth’ scenario (RSS Option 1) and 11.5 per cent under the high population growth scenario (RSS Option 3).
8.6 In absolute terms, the growth in leisure services spend within the OCA in the period to 2021 amounts to £228.9m. Applying MapInfo’s current market shares (from Table 8.1 above), some 62.8 per cent of this (£143.7m) will be for restaurants, cafés and bars. In contrast, the growth that would be absorbed by cinemas at current market shares of leisure spending would be less than 1 per cent (£1.2m), with bingo halls (£1.3m) and casinos (£1.7m) each also absorbing less than 1 per cent of the growth.
Conversion of Expenditure Increases to Additional Leisure ‘Requirements’
Cinemas
8.7 Data from Dodona suggest that the average multiplex screen accounts for an annual spend of £301,000 in ticket revenue, whereas an independent screen accounts for £148,000 per annum in ticket revenue. Thus, the £1.2m increase in cinema expenditure arising in the East Staffordshire OCA by 2021 as a consequence of population growth and increases in per capita leisure expenditure is theoretically sufficient to support around three multiplex cinema screens within the OCA, or about six additional independent screens.
8.8 However, residents within the OCA already have a comparatively good choice of cinemas within a reasonable drive-time. As well as the 9-screen Cineworld multiplex at Middleway Park in Burton, the OCA contains the 3-screen Cineworld facility at Meadows Way Retail Park in Uttoxeter, which opened in September 2006. There are also two multiplex cinemas in Derby, outside of but relatively close to the OCA boundary: the 11-screen Showcase facility, 12 miles from Burton, and the 10-screen Odeon complex (formerly UCI), 14 miles from Burton. Derby also has the single-screen Metro Cinema.
8.9 In our assessment, therefore, the Burton area – and the OCA more generally - is unlikely to be viewed by multiplex operators as a priority location for additional cinema screen provision.
8.10 As part of the Regional Centres Study, we analysed cinema provision within a 25-minute drive-time of each non-metropolitan centre, and within a 15-minute drive-time of each metropolitan centre. These drive-times were specified as appropriate by the property market agent King Sturge, which was a sub-consultant to RTP on the study. The findings for the non-metropolitan areas – updated to reflect the recent opening of the Cineworld facility in Uttoxeter, which post-dated completion of the Centres Study - are reproduced below as Table 8.2.
8.11 The table confirms that Burton-on-Trent is unlikely to be viewed by multiplex operators as a top priority location for further investment in cinema provision. This is based on a comparison of the actual population within Burton town centre’s 25-minute drive-time catchment - of 364,078 persons - and the theoretical population required to support the current provision of 34 screens within a 25-minute drive-time from Burton, of 440,000 persons (at 20,000 persons per screen, which is the average for the West Midlands region). Thus, there is a population ‘deficit’ in the Burton ‘catchment’ of 315,922

Retail and Leisure Capacity Study Final Report
Roger Tym & Partners M9153, August 2007 79
persons. The non-metropolitan centres that we considered to be priorities for further cinema provision are those highlighted in red at the bottom of the table.
Table 8.2 Cinemas Within a 25–minute Drivetime of Burton-upon-Trent, and other Non-Metropolitan Centres In the West Midlands Region
Town
No of Cinemas Within 25 Minute
Drivetime
No of Screens Within 25
Minute Drivetime
Actual PopnWithin 25
Minute Drivetime
Required Popn for Current
No. of Screens Within
25 MinutesSurplus/
Deficit
BURTON ON TRENT 4 34 364,078 680,000 -315,922WORCESTER 5 28 340,820 560,000 -219,180SHREWSBURY 2 18 196,712 360,000 -163,288KIDDERMINSTER 5 32 486,331 640,000 -153,669NUNEATON 4 40 663,163 800,000 -136,837TELFORD 2 18 313,141 360,000 -46,859STAFFORD 3 23 476,800 460,000 16,800CANNOCK 5 40 857,125 800,000 57,125LEAMINGTON SPA 5 19 463,048 380,000 83,048STRATFORD UPON AVON 3 9 279,544 180,000 99,544HEREFORD 1 1 122,167 20,000 102,167LICHFIELD 5 28 663,454 560,000 103,454RUGBY 2 17 447,618 340,000 107,618REDDITCH 3 26 648,806 520,000 128,806TAMWORTH 3 15 567,204 300,000 267,204
Based on a popn. density of 20,000 persons per screen, which is the average for the 'West Midlands' region (source: Cinema Advertising Association)
Bingo
8.12 Two Gala clubs are available in Derby, although at 13 and 16 miles from Burton these will only be attractive to a minority of OCA residents. This is borne out by the household survey which shows that Derby city centre is the destination for just 11 per cent of those respondents who visit bingo clubs, bookmakers or casinos. Nevertheless, a Mecca bingo facility is available at Middleway Park in Burton. This explains why Burton-upon-Trent town centre was cited by more than half of household survey residents (53 per cent) who indicated that they use this type of facility.
8.13 The additional £1.3m in bingo expenditure arising in the OCA by 2021 is probably insufficient to support a Gala or Mecca-type club, which currently generate average annual net stakes of around £1.47m per branch. However, the £1.3m is sufficient to support at least two neighbourhood clubs, for which annual net stakes average around £444,000 per branch.
Casinos
8.14 The additional £1.7m in casino expenditure arising by 2021 – at constant market shares – is substantially below the level required to support a small-scale ‘traditional’ casino, which generate average annual turnovers of around £3.6m per casino53.
Food and Drink
8.15 Of those respondents that visit restaurants, the principal town centres within the OCA – Burton, Uttoxeter, Swadlincote and Ashby de la Zouch – collectively account for around 51 per cent of all responses, with other locations within the OCA accounting for a further 15 per cent of total responses. Restaurants in named locations outside of the OCA currently account for around 33 per cent of respondents’ last visits to such facilities. The remaining respondents stated ‘don't know’ or ‘it varies’.
53 Source – The Gambling Commission

Retail and Leisure Capacity Study Final Report
Roger Tym & Partners M9153, August 2007 80
8.16 A similar pattern is evident in relation to pubs and bars, with about 28 per cent of respondents stating that they do not use such facilities. Of those respondents who do use pubs and bars, the main centres within the OCA account for around 53 per cent of responses, with other locations within the catchment accounting for around 15 per cent of respondents’ last visits.
8.17 These findings demonstrate that, at present, existing restaurants and bars/pubs within the OCA account for approximately two thirds of visits to such facilities, with restaurants and bars/pubs outside the OCA accounting for about 30 per cent of visits to restaurants and pubs/bars. It follows that if these current market shares persist, then around two thirds of the £143m growth in food and drink expenditure arising by 2021 will be available for facilities located within the East Staffordshire OCA, which equates to around £94m.
8.18 It should be noted that not all of the £94m would be available for new restaurants and pubs/bars. In the same way that an allowance is made in the retail sector for existing operators to improve their turnover efficiency, it is reasonable to assume that some of the growth in available food and drink expenditure should be directed to existing operators (to allow them to grow their business, re-fit their premises, and so on). In our opinion, an allowance of at least half the growth in food & drink expenditure should be made for existing restaurateurs and pub/bar operators.54
8.19 The £47m ‘residual’ would be sufficient to support a range of new, good-quality restaurants (which generate annual turnovers of around £850,000 to £1m, with some high-profile names taking in excess of £1m per annum) - as well as several branded pubs/bars, which have a typical annual turnover of between £870,000 and £1m.
Summary of Scope for Additional Commercial Leisure Facilities 8.20 Overall, spending on leisure in the East Staffordshire OCA is forecast (using local data
and national growth projections) to grow by 35 per cent (a gain of £229m) in the period up to 2021. How this growth might be expended locally depends very much on what opportunities the market supplies – thus, current spending patterns can only provide a guide to what might happen in the future.
8.21 On current spending patterns in the catchment, almost two-thirds of this spending growth (some £143m) will go to eating and drinking outside the home (restaurants, cafés and bars). Capturing a sizeable proportion of this growth in expenditure through the provision of a better and more appealing choice of restaurants, cafés and bars/pubs will be vital to the future health of the various centres within the catchment.
8.22 The rest of the expenditure growth will go to a wide mix of activities (for instance, bingo halls and cinemas), with no single activity capturing any significant market growth. In our assessment Burton-upon-Trent – and the OCA more generally - is unlikely to be viewed by multiplex operators as a priority location for additional cinema provision. There does, however, appear to be scope for at least one or two neighbourhood bingo clubs.
8.23 As we have stressed, the approach to the assessment of quantitative need in the leisure sector is less well developed than in the retail sector and so the quantitative ‘needs’ that we have identified should be treated as an indicative guide. Furthermore, the sector is dynamic, changing and operator-led. If an investor feels capable of attracting customers by diverting spending from other facilities, the planning system does not prevent additional development provided it meets other criteria for vital and viable town centres.
54 Unlike in the retail sector, there is a dearth of published advice on what proportion of expenditure growth in
the food & drink sector should be ring-fenced for existing restaurant/pub/bar operators.

Retail and Leisure Capacity Study Final Report
Roger Tym & Partners M9153, August 2007 81
9 OVERALL CONCLUSIONS AND KEY RECOMMENDATIONS
Introduction 9.1 The purpose of this Retail Capacity Study is to provide a robust evidence base on the
capacity for additional retail (and, to a lesser extent, commercial leisure) development in forthcoming years, which East Staffordshire Borough Council (ESBC) can use to inform the preparation of the Core Strategy, Burton-upon-Trent Area Action Plan (AAP) and other LDF documents. In order to assist ESBC with this, we pull together, below, the principal findings from the various lines of research that informed the study, and the retail and leisure capacity exercises, in order to identify key quantitative and qualitative needs.
Summary of Performance Analysis and Key Qualitative Needs
Burton
Retail
9.2 On the whole, we conclude that Burton is a healthy town centre. This is evidenced by: Burton’s very good improvement in the national centre rankings over recent years, with Burton now ranking higher than Wolverhampton for the first time; a broad range of convenience and comparison sector outlets; encouraging recent improvement in retail rents; a low level of street-level unit vacancy, with no particular concentrations of void units in the town centre; and apparently increasing levels of footfall.
9.3 Nevertheless, there is room for improvement in a number of key areas. Most notably, the town centre contains only one department store (Beatties), which is relatively small by modern standards. The current number of published retailer requirements for Burton – and the specific operators listed – is somewhat disappointing given the size and status of Burton. Through primary research undertaken for this study, we have identified a confirmed interest in Burton from a range of prominent retail operators. Several high-profile food & drink operators have also confirmed an interest in Burton, which would help to address another key town centre deficiency.
9.4 Attracting the operators referred to above is presently constrained by the lack of available premises of the right size, configuration and trading environment.
Offices and Residential
9.5 Offices are currently struggling in Burton town centre, with areas on the edge of the town and closer to the strategic network preferred by occupiers. Rental values are currently very low, which makes new development unviable, and Lambert Smith Hampton (LSH) considers it unlikely that space in Burton town centre could achieve rents of a sufficient level to make office development viable at the present time. In LSH’s assessment, a reversal of this position will require congestion and parking issues to be addressed and/or the introduction of comprehensive public transport links.
9.6 The residential property market in Burton town centre is faring better than the office market. Historically there have been few residential properties in the town centre, and values have been low. However, over the last five years, property prices have almost doubled and the amount of new residential development in the town centre area has increased. There remains very little family housing in the town centre area, however although this is not something that is unique to Burton.
Uttoxeter
9.7 Uttoxeter town centre’s position in the national retail rankings has slipped alarmingly in recent years. However, the planned scheme at the Cattlemarket site will provide larger

Retail and Leisure Capacity Study Final Report
Roger Tym & Partners M9153, August 2007 82
units than those which are presently available. We consider it likely that this scheme will attract a number of high-profile operators, and that Uttoxeter’s position in the retail rankings will consequently improve thereafter.
9.8 Uttoxeter performs increasingly well in relation to most other key performance indicators for which published data are available. Retail yields have shown considerable improvement in recent years – and are now on a par with those achieved in Burton - and the town centre’s overall vacancy rate is low. Whilst the centre contains only a few national multiple comparison operators, this is not untypical for centres of the size and function of Uttoxeter. Similarly, the town centre’s convenience sector offer is broadly commensurate with its role and function.
9.9 There is a good level of interest in Uttoxeter from a range of prominent comparison retailers, including Bon Marché and Edinburgh Woollen Mill. We consider that the introduction of these retailers would significantly enhance the centre’s offer. Our research has also uncovered an encouraging level of interest in Uttoxeter from food & drink operators, although we acknowledge that there is likely to be competition for these operators from the out-of-centre Town Meadows Way Retail Park.
Summary of Quantitative Need
Comparison Retail Sector
9.10 Our quantitative capacity work shows that there is a goods based capacity for additional comparison sector sales floorspace up to 2021 in the range 16,900 sq.m (181,800 sq.ft) net when assessed on the basis of low future population growth (Scenario A), to around 22,750 sq.m (244,800 sq.ft) net based on high future population growth (Scenario B). These floorspace requirements are based on a static retention rate, which we consider to be the most realistic scenario to plan for given the healthy current retention rate of 67 per cent.
9.11 In the longer 2007-26 period, the overall comparison retail floorspace requirement range increases to around 33,700 sq.m (362,000 sq.ft) net under Scenario A, to around 42,800 sq.m (460,200 sq.ft) under Scenario B.
9.12 It is important to emphasise that around half of the comparison retail floorspace requirements identified for the overall study period 2007-26 arise in the post-2021 period, under both the ‘low’ and the ‘high’ population scenarios. Furthermore, primarily as a consequence of existing retail commitments already in the planning pipeline, no floorspace capacity arises until the post-2011 period. This is shown clearly in summary Table 9.1.
Table 9.1 Summary of Goods Based Comparison Retail Floorspace Requirements Arising in the Periods to 2021 and 2026
Floorspace Requirement, sq.m sales area
2007-11 2011-16 2016-21 2007-21 2021-26 2007-26
Low Population Growth (Scenario A) -7,075 10,742 13,219 16,886 16,767 33,653
High Population Growth (Scenario B) -5,793 12,791 15,743 22,741 20,012 42,753
9.13 The comparison retail floorspace requirements set out in Table 9.1 (as with the convenience sector requirements summarised in Table 9.2) are indicative only, and should be treated as guidelines. Long-term forecasts, whilst valuable for strategic planning purposes, should be regarded as subject to increasing uncertainty in the later parts of the study period and should be kept under regular review.
Convenience Retail Sector
9.14 Forecast expenditure increases in the convenience sector are much more modest than in the comparison sector. The resultant quantitative requirements for further

Retail and Leisure Capacity Study Final Report
Roger Tym & Partners M9153, August 2007 83
convenience goods floorspace in the periods up to 2021 and 2026 are therefore considerably smaller than in the comparison retail sector. The convenience requirements arising by 2021 are in the range 2,800 sq.m (30,300 sq.ft) net under Scenario A to 4,800 sq.m (51,700 sq.ft) net under Scenario B.
9.15 In the longer-term period 2007-26, there is scope for around 5,300 sq.m (57,600 sq.ft) under the low population growth Scenario A, rising to around 8,100 sq.m (87,300 sq.ft) under the high population growth Scenario B. Thus, as in the comparison sector, a significant proportion of the convenience retail floorspace requirements identified for the overall study period 2007-26 arise in the post-2021 period, under both the ‘low’ and the ‘high’ population scenarios.
Table 9.2 Conversion of Expenditure Surplus to Convenience Floorspace Requirements
Floorspace Requirement, sq.m sales area
2007-11 2011-16 2016-21 2007-21 2021-26 2007-26
Low Population Growth (Scenario A) -1,755 2,198 2,376 2,819 2,529 5,348
High Population Growth (Scenario B) -1,221 2,901 3,119 4,799 3,314 8,113
9.16 As in the comparison sector, these floorspace requirements are based on a static retention rate, given that centres and individual foodstores located within the East Staffordshire OCA collectively retain around 87 per cent of available expenditure, which is a healthy overall level of retention. Similarly, no convenience floorspace capacity arises in the initial 2007-11 forecasting period.
9.17 Furthermore, our identified floorspace requirements relate to the growth in retained expenditure for the whole of the catchment area and development to meet most, or all of it, should be channelled to the existing town, district and local centres within the catchment if at all possible. Development that could help to improve the localised retention rate in zones 3, 4 and 9 should be viewed favourably, subject to the sequential approach and having ensured that the proposed quantum of floorspace is of an appropriate scale.
Commercial Leisure Sector
9.18 For the purposes of planning for commercial leisure needs, we caution against looking beyond 2021, which is itself a long time period in the commercial leisure sector. In the period to 2021, spending on leisure services in the East Staffordshire OCA is forecast (using local data and national growth projections) to grow by 35 per cent (a gain of £229m). How this growth might be expended locally depends very much on what opportunities the market supplies – thus, current spending patterns can only provide a guide to what might happen in the future.
9.19 On current spending patterns in the catchment, almost two-thirds of this spending growth (some £143m) will go to eating and drinking outside the home (restaurants, cafés and bars). Capturing a sizeable proportion of this growth in expenditure through the provision of a better and more appealing choice of restaurants, cafés and bars/pubs will be vital to the future health of the various centres within the catchment.
9.20 The rest of the expenditure growth will go to a wide mix of activities, including bingo halls and cinemas, with no single activity capturing any significant market growth. In our assessment Burton-upon-Trent – and the OCA more generally - is unlikely to be viewed by multiplex operators as a priority location for additional cinema provision. There does, however, appear to be scope for at least one or two neighbourhood bingo clubs.
9.21 The approach to the assessment of quantitative need in the leisure sector is less well developed than in the retail sector and so the quantitative ‘needs’ that we have identified should be treated as an indicative guide. Furthermore, the sector is dynamic,

Retail and Leisure Capacity Study Final Report
Roger Tym & Partners M9153, August 2007 84
changing and operator-led. If an investor feels capable of attracting customers by diverting spending from other facilities, the planning system does not prevent additional development provided it meets other criteria for vital and viable town centres.
Overall Summary and Key Recommendations 9.22 Our study has identified sufficient expenditure availability to support substantial quanta
of additional comparison retail floorspace within the East Staffordshire OCA area by 2021, with a similar quantum of floorspace capacity arising in the 2021-26 period. Floorspace requirements in the convenience retail sector are more modest.
9.23 In the comparison sector, centres and stores within the catchment area currently retain some 67 per cent the available comparison expenditure which we consider to be a relatively healthy level of aggregate expenditure retention. We therefore recommend that the Borough Council’s policy aspiration target should be to at least maintain the retention rate at its current level of 67 per cent. This does not mean ‘doing nothing’, however; given the ever-increasing competition posed by centres outside of the OCA, there will be a need to enhance the retail offer within the OCA in both quantitative and qualitative terms in order to maintain the existing retention rate. In our assessment the attraction of a new high-profile department store is fundamental to the achievement of this goal.
9.24 Similarly, for the convenience sector, we recommend that the Council’s policy aspiration should be to at least maintain the level of expenditure that is collectively retained by centres and stores located within the catchment, which is currently healthy at 87 per cent. There may be scope to increase the overall level of convenience expenditure retention slightly above 87 per cent, although given the presence of large foodstores close to, but outside of, the OCA, we do not consider it realistic to plan for a significant increase in the convenience sector retention rate.
9.25 Our work also indicates that, as a result of anticipated population growth and forecast increases in expenditure availability, there is scope for complementary facilities in the food and drink sector including a range of good-quality restaurants/cafés and bars, as well as one or two neighbourhood bingo clubs.
9.26 We fully endorse the Borough Council’s apparent commitment to adopting a proactive approach to planning for new development in Burton-upon-Trent as the OCA’s principal town. This is crucial in order to accommodate the new comparison retail and other related town centre uses necessary to maintain the aggregate level of expenditure retention and help to consolidate the town centre’s standing in the wider sub-regional hierarchy, which has improved in recent years. The delivery of new, appropriately sized retail units in good locations is an essential pre-requisite to the achievement of these ambitions.