East Riding of Yorkshire Council
112
East Riding of Yorkshire Council Allocations Development Plan Document Sustainability Appraisal Part II Scoping Report Consultation May 2010 Part II Scoping Report (Draft)3 FINAL
Transcript of East Riding of Yorkshire Council

East Riding of Yorkshire Council
Allocations Development Plan Document Sustainability Appraisal
Part II Scoping Report
Consultation
May 2010
Part II Scoping Report (Draft)3 FINAL


EAST RIDING OF YORKSHIRE COUNCIL –
SUSTAINABILITY APPRAISAL OF THE ALLOCATIONS DEVELOPMENT PLAN DOCUMENT
Part II Scoping Report
East Riding of Yorkshire Council Allocations Development Plan Document Sustainability Appraisal
Part II Scoping Report
May 2010 Notice
This document and its contents have been prepared and are intended solely for East Riding of Yorkshire Council information and use in relation to Sustainability Appraisal of the ERYC Allocations DPD.
This report may not be used by any person other than East Riding of Yorkshire Council without East Riding of Yorkshire's express permission. In any event, Atkins accepts no liability for any costs, liabilities or losses arising as a result of the use of or reliance upon the contents of this report by any person other than East Riding of Yorkshire.
Document History
JOB NUMBER: 5039046 DOCUMENT REF: 5039415 ERYC Allocations DPD SA - Part II SR V4.1.doc
4 Final Report CS/LP LP/MH MH MH 8/4/10
3 Final draft CS/LP LP/MH MH MH 26/2/10
2 Second draft CS/LP MH MH MH 12/2/10
1 Draft for Comment CS/LP CW MH MH 23/12/09
Revision Purpose Description Originated Checked Reviewed Authorised Date
Part II Scoping Report (Draft)3 FINAL

EAST RIDING OF YORKSHIRE COUNCIL –
SUSTAINABILITY APPRAISAL OF THE ALLOCATIONS DEVELOPMENT PLAN DOCUMENT
Part II Scoping Report
Part II Scoping Report (Draft)3 FINAL
EAST RIDING OF YORKSHIRE COUNCIL –
SUSTAINABILITY APPRAISAL OF THE ALLOCATIONS DEVELOPMENT PLAN DOCUMENT
Part II Scoping Report
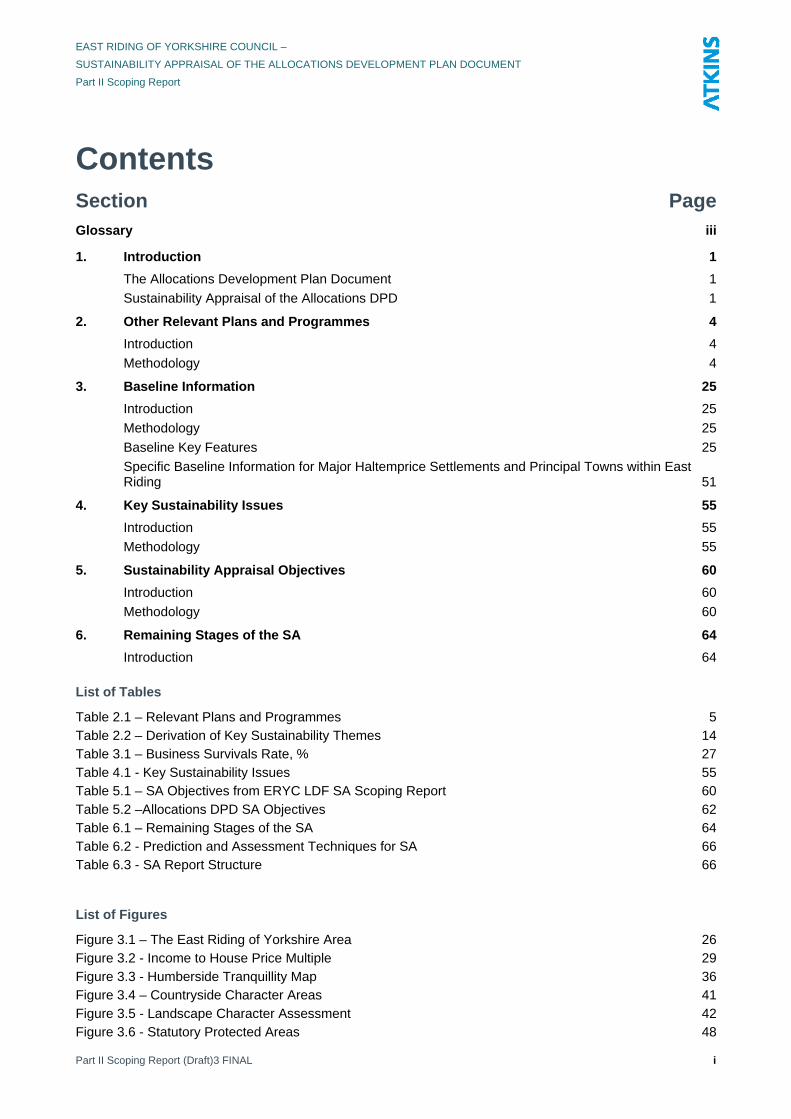
Contents Section Page Glossary iii
1. Introduction 1
The Allocations Development Plan Document 1
Sustainability Appraisal of the Allocations DPD 1
2. Other Relevant Plans and Programmes 4
Introduction 4
Methodology 4
3. Baseline Information 25
Introduction 25
Methodology 25
Baseline Key Features 25
Specific Baseline Information for Major Haltemprice Settlements and Principal Towns within East Riding 51
4. Key Sustainability Issues 55
Introduction 55
Methodology 55
5. Sustainability Appraisal Objectives 60
Introduction 60
Methodology 60
6. Remaining Stages of the SA 64
Introduction 64
List of Tables
Table 2.1 – Relevant Plans and Programmes 5 Table 2.2 – Derivation of Key Sustainability Themes 14 Table 3.1 – Business Survivals Rate, % 27 Table 4.1 - Key Sustainability Issues 55 Table 5.1 – SA Objectives from ERYC LDF SA Scoping Report 60 Table 5.2 –Allocations DPD SA Objectives 62 Table 6.1 – Remaining Stages of the SA 64 Table 6.2 - Prediction and Assessment Techniques for SA 66 Table 6.3 - SA Report Structure 66
List of Figures
Figure 3.1 – The East Riding of Yorkshire Area 26 Figure 3.2 - Income to House Price Multiple 29 Figure 3.3 - Humberside Tranquillity Map 36 Figure 3.4 – Countryside Character Areas 41 Figure 3.5 - Landscape Character Assessment 42 Figure 3.6 - Statutory Protected Areas 48
Part II Scoping Report (Draft)3 FINAL i

EAST RIDING OF YORKSHIRE COUNCIL –
SUSTAINABILITY APPRAISAL OF THE ALLOCATIONS DEVELOPMENT PLAN DOCUMENT
Part II Scoping Report
Figure 3.7 - Landscape and Heritage Assets and Designations in East Ridings 50
Appendices Appendix A - Baseline Tables 68
List of Tables
Table A.1 - Baseline Data, Indicators and Trends for Social Issues 69 Table A.2 - Baseline Data, Indicators and Trends for Environmental Issues 76 Table A.1 - Baseline Data, Indicators and Trends for Economic Issues 99
Part II Scoping Report (Draft)3 FINAL ii

EAST RIDING OF YORKSHIRE COUNCIL –
SUSTAINABILITY APPRAISAL OF THE ALLOCATIONS DEVELOPMENT PLAN DOCUMENT
Part II Scoping Report
Part II Scoping Report (Draft)3 FINAL iii
Glossary
Abbreviation Definition
AQMA Air Quality Management Area
BAP Biodiversity Action Plan
BVPIs Best Value Performance Indicators
CQC Countryside Quality Counts
DPD Development Plan Document
EIA Environmental Impact Assessment
ERYC East Riding of Yorkshire Council
GVA Gross Value Added
IRS Integrated Regional Strategy
JSP Joint Structure Plan for Kingston-Upon-Hull and the East Riding of Yorkshire
LDD Local Development Document
LDF Local Development Framework
LDS Local Development Scheme
LNR Local Natural Reserve
LPA Local Planning Authority
LBAP Local Biodiversity Action Plan
NNR National Nature Reserve
NO2; NOx Nitrogen dioxide; oxides of nitrogen
ODPM Office of the Deputy Prime Minister
PCPA Planning and Compulsory Purchase Act 2004
PPC PPS PPG
Pollution Prevention and Control Planning Policy Statement Planning Policy Guidance
RIGS Regionally Important Geological Sites
PM10 Fine particles
RPG Regional Planning Guidance
RSDF Regional Sustainable Development Framework
RSS Regional Spatial Strategy
SA Sustainability Appraisal
SM Scheduled Monument
SAP Standard Assessment Procedure
SEA Strategic Environment Assessment
SMP Shoreline Management Plan
SPA Special Protection Areas
SPD Supplementary Planning Document
SPZ Source Protection Zones
SSSI Site of Special Scientific Interest
SUDS Sustainable Urban Drainage System
UA Unitary Authority
WWTW Waste Water Treatment Works

EAST RIDING OF YORKSHIRE COUNCIL –
SUSTAINABILITY APPRAISAL OF THE ALLOCATIONS DEVELOPMENT PLAN DOCUMENT
Part II Scoping Report
1. Introduction The Allocations Development Plan Document
1.1 East Riding of Yorkshire Council (ERYC) is required by the Planning and Compulsory Purchase Act 2004 (PCPA) to replace their four Local Plans with a Local Development Framework (LDF) for the Unitary Authority Area.
1.2 Comprising a ‘folder’ of Local Development Documents (LDDs), the East Riding LDF, together with the ‘Yorkshire and Humber Plan’- Regional Spatial Strategy for Yorkshire and Humber (RSS), will provide the spatial strategy and planning policy for the East Riding.
1.3 ERYC is progressing with the development of the Core Strategy which sets the key elements of the planning framework for the East Riding. It will comprise a vision and a number of objectives for the area for the period up to 2026. It will also include a spatial strategy and suite of development management policies and identify preferred areas of growth for future development around larger settlements.
1.4 As part of the LDF, the Council is also preparing an Allocations Development Plan Document (DPD). The DPD will allocate specific sites for development (or conservation) in the East Riding and establish when they will be developed, and by whom. The DPD will contain:
Specific site allocations for a range of uses, including retail, employment and housing for the period up to 2026;
A proposals map showing the allocated sites identified through the DPD;
Requirements to be met in order for the allocated sites to be developed, involving issues such as suitable access, screening, flood prevention measures, etc; and
A broad indication of how the allocations will be implemented.
Sustainability Appraisal of the Allocations DPD 1.5 ERYC is required under the PCPA to undertake Sustainability Appraisal (SA) of its DPDs,
including the Allocations DPD. SA takes a long-term view on the effects of a plan, taking into account environmental, social and economic effects.
1.6 When preparing or revising DPDs, it is also a statutory requirement to conduct an environmental assessment in accordance with the Strategic Environment Assessment (SEA) Regulations 2004. The objective of SEA is
“to provide for a high level of protection of the environment and to contribute to the integration of environmental considerations in the preparation of plans and programmes with a view to promoting sustainable development.”
1.7 Although the requirements to carry out SA and SEA are distinct, the ODPM’s guidance of November 2005 states that it is possible to satisfy both through a single appraisal process and provides a methodology for doing so. This methodology goes further than the SEA methodology (which is primarily focused on environmental effects) requiring the examination of all the sustainability-related effects, whether they are social, economic or environmental. However, those undertaking the SA should ensure that in doing so they meet the requirements of the SEA Regulations.
1.8 This report is a Part II SA Scoping Report, which updates and refines the initial LDF SA Scoping Report completed in 2006, and is tailored to the role and purpose of the SA of the Allocations DPD.
Part II Scoping Report (Draft)3 FINAL 1

EAST RIDING OF YORKSHIRE COUNCIL –
SUSTAINABILITY APPRAISAL OF THE ALLOCATIONS DEVELOPMENT PLAN DOCUMENT
Part II Scoping Report
1.9 It sets out the results of the scoping stage of the combined SA/SEA process for the Allocations DPD. To be consistent with terminology used in the ODPM Guidance, throughout this report, the term SA is used to refer to this combined SEA/SA process.
The SA Process 1.10 According to ODPM guidance, the main stages in the SA process are as follows:
Stage A – Setting the context and objectives, establishing the baseline, proposing the scope, and consultation on the proposed scope of the Sustainability Appraisal;
Stage B – Developing and refining options and assessing effects;
Stage C – Preparing the Sustainability Appraisal Report;
Stage D – Consultation on the draft plan and the Sustainability Appraisal Report; and
Stage E – Monitoring implementation of the plan.
Relationship of the Allocations DPD SA Scoping Report to the LDF SA Scoping Report
1.11 In March 2006 a LDF SA Scoping Report was released for consultation by the Council. This document was designed to cover the first stage of the SA processes for the various LDDs that will make up the East Riding LDF. It sets out all of the elements common to SA of the LDDs, with the recognition that an additional (Part II) Scoping Report may be required for the SA of each LDD to further focus the SA processes.
1.12 The LDF SA Scoping Report set out a set of SA objectives against which the LDF would be appraised. These objectives were subsequently slightly amended in the SA processes conducted for other DPDs, produced or being produced by the Council, to make each SA process fit for purpose. The development of the SA for the Allocations DPD has drawn on the LDF SA Scoping Report and SA reports produced for the other DPDs and supplemented it as follows to produce this Part II Scoping Report:
Task A1: The policy context analysis undertaken for the LDF SA Scoping Report has been adopted as the basis for the policy context analysis of the SA for the Allocations DPD. It has, however, been updated and supplemented with the inclusion of several additional plans not included in the LDF SA Scoping Report.
Task A2: The scoping process for the SA of the Allocations DPD has drawn on the baseline data collected for the LDF SA Scoping Report to gain a better understanding of the wider local and regional context. The data have been updated where new information has become available since the publication of the LDF SA Scoping Report.
Task A3: Key issues identified in the LDF SA Scoping Report have been reviewed and amended to better reflect the nature and scope of influence of the Allocations DPD.
Task A4: The SA objectives derived for the LDF SA Scoping Report and SAs of other DPDs have been used as the starting point for those to be applied to the SA of the Allocations DPD. They have then been subsequently modified, expanded or scoped out (removed) to take account of the additional policy information identified in Task A1 above and specific local sustainability issues identified in Task A3 in order to make them applicable to the Allocations DPD.
Purpose of this Allocations DPD SA Scoping Report 1.13 This Scoping Report summarises Stage A of the SA process outlined above. It sets out:
Part II Scoping Report (Draft)3 FINAL 2

EAST RIDING OF YORKSHIRE COUNCIL –
SUSTAINABILITY APPRAISAL OF THE ALLOCATIONS DEVELOPMENT PLAN DOCUMENT
Part II Scoping Report
Other plans, programmes and sustainability objectives relevant to the Allocations DPD not covered by the LDF SA Scoping Report;
Baseline information relevant to the SA of the Allocations DPD;
Key environmental and sustainability issues relevant to the Allocations DPD;
The SA Framework including SA objectives and indicators. The SA framework is defined on the basis of the analyses in tasks 1 and 2 above;
Proposals for the structure and level of detail of the Allocations DPD SA Report.
1.14 Overall, the purpose of the Scoping Report is to establish the SA scope and methodology, and to provide the basis for consultation related to the range and level of detail of the SA Report and the baseline on which it will be established.
SA Consultation 1.15 The requirements for consultation on the Scoping Report arise directly from the SEA Directive
which specifies that “when deciding on the scope and level of detail of the information that must be included in [the SA Report], the responsible authority shall consult the consultation bodies”. The SEA consultation bodies comprise Natural England, English Heritage and the Environment Agency. The SA guidance goes further by suggesting consultation with other consultation bodies comprising representatives of other interests including economic interests including local businesses, social interests including community service providers, transport planners and providers, and non-governmental organisations. The Scoping Report consultation has been programmed for 4th May to 12th July 2010.
Part II Scoping Report (Draft)3 FINAL 3

EAST RIDING OF YORKSHIRE COUNCIL –
SUSTAINABILITY APPRAISAL OF THE ALLOCATIONS DEVELOPMENT PLAN DOCUMENT
Part II Scoping Report
Part II Scoping Report (Draft)3 FINAL 4
2. Other Relevant Plans and Programmes Introduction
2.1 The SEA Directive states that the Environmental Report should provide information on:
‘The plan’s relationship with other relevant plans and programmes’ and “the environmental protection objectives, established at international, [European] Community or national level, which are relevant to the plan... and the way those objectives and any environmental considerations have been taken into account during its preparation” (Annex 1 (a), (e))
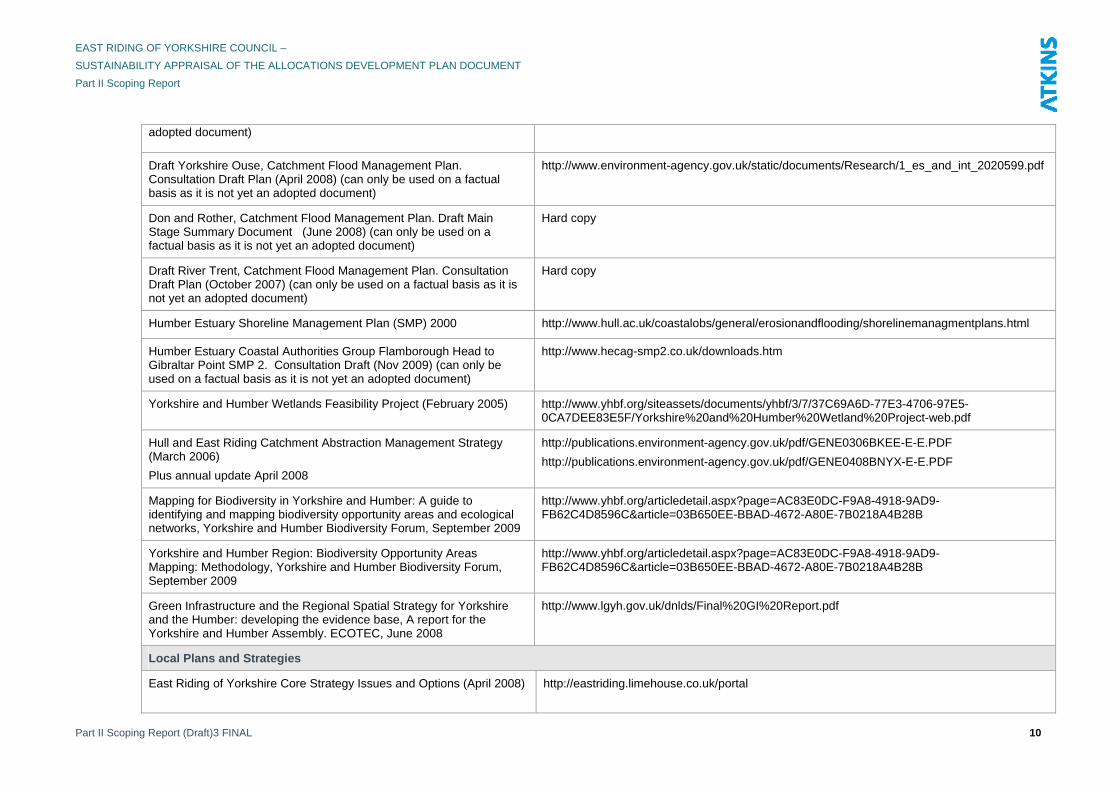
Methodology 2.2 Relevant international, national, regional and local plans, policies and programmes that might
influence the Allocations DPD have been identified and are set out in Table 2.1 below. This includes existing development plans and other plans and policies prepared by ERYC.
2.3 At the regional level the key documents are the RSS (May 2008), which sets out a strategy to guide planning and development in the Yorkshire and the Humber region to the year 2026, and the Regional Sustainable Development Framework (RSDF) Update 2003 – 2005 for Yorkshire and the Humber. In the future the RSS will be replaced by the Integrated Regional Strategy (IRS) for the Yorkshire and Humber.
2.4 The identified relevant plans and programmes were analysed to derive a set of key sustainability themes relevant to the national, regional and local context. This analysis, presented in Table 2.1, was closely informed by consultation with ERYC officers during the preparation of the LDF SA Scoping Report. The review of relevant plans and programmes forms the first step in the development of the draft SA framework which is presented in Section 5.

EAST RIDING OF YORKSHIRE COUNCIL –
SUSTAINABILITY APPRAISAL OF THE ALLOCATIONS DEVELOPMENT PLAN DOCUMENT
Part II Scoping Report
Table 2.1 – Relevant Plans and Programmes
Plan / programme Data source
International Plans and Programmes
European Directives Conservation of Natural Habitats and of Wild Flora and Fauna (92/43/EEC), Noise Directive (86/188/EEC), Conservation of Wild Birds Directive (79/409/EEC), Freshwater Fisheries Directive (78/659/EEC), Urban Wastewater Treatment Directive (91/271/EEC), Hazardous Waste Directive (91/689/EEC), Water Framework Directive (2000/60/EC), Air Quality Directive ( 96/62/EC) and their daughter directives, Landfill Directive 1999/31/EC.
EU 6th Environmental Action Plan, September 2002-2012 www.europa.eu.int
EU Biodiversity Action Plan, 2008 http://ec.europa.eu/environment/nature/info/pubs/docs/brochures/bio_brochure_en.pdf
EU review of the Sustainable Development Strategy - A platform for action 2005
http://eur-lex.europa.eu/LexUriServ/LexUriServ.do?uri=COM:2005:0658:FIN:EN:PDF
National Plans and Programmes
Securing the Future - UK Government sustainable development strategy, March 2005
http://www.defra.gov.uk/sustainable/government/publications/uk-strategy/documents/SecFut_complete.pdf
Planning for a Sustainable Future: White Paper, 2007 http://www.communities.gov.uk/publications/planningandbuilding/planningsustainablefuture
The Air Quality Strategy for England, Scotland, Wales and Northern Ireland, July 2007
http://www.defra.gov.uk/environment/airquality/strategy/index.htm
PPGs and PPSs PPS1: Delivering Sustainable Development, PPS1: Planning and Climate Change Supplement, PPS3: Housing, PPS4: Planning for Sustainable Economic Growth, PPS7: Sustainable Development in Rural Areas, PPG8: Telecommunications, PPS9: Biodiversity and Geological Conservation, PPS10: Planning for Sustainable Waste Management, PPS11: Regional Spatial Strategies, PPS12: Local Spatial Planning, PPG13: Transport, PPG15: Planning and Historic Environment, PPG16: Archaeology and Planning, PPG17: Planning for Sport, Open Space and Recreation, PPG20: Coastal planning, PPS22: Renewable Energy (including the companion guide); PPS23: Planning and Pollution Control, PPG24: Planning and Noise, PPS25: Development and the flood risk and practise guide,
English Nature Position Statements http://www.naturalengland.org.uk/ourwork/policy/positionstatements/default.aspx
Natural England Position http://www.naturalengland.org.uk/about_us/whatwedo/default.aspx
Part II Scoping Report (Draft)3 FINAL 5

EAST RIDING OF YORKSHIRE COUNCIL –
SUSTAINABILITY APPRAISAL OF THE ALLOCATIONS DEVELOPMENT PLAN DOCUMENT
Part II Scoping Report
English Heritage Regional Plans
English Heritage Strategy 2005 – 2010
http://www.english-heritage.org.uk/hc/server/show/nav.10743
http://www.english-heritage.org.uk/server/show/nav.11485
The Historic Environment: A Force for Our Future (DCMS 2001) http://www.culture.gov.uk/images/publications/historic_environment_review_part3.pdf
National Waste Strategy 2007 http://www.defra.gov.uk/ENVIRONMENT/waste/strategy/strategy07/pdf/waste07-strategy.pdf
Wildlife and Countryside Act 1981 http://www.defra.gov.uk/wildlife-countryside/index.htm http://www.naturenet.net/law/wca.html
Countryside and Rights of Way Act 2000 http://www.defra.gov.uk/wildlife-countryside/cl/
National Biodiversity Action Plan (UK Biodiversity Action Plan Steering Group 1994)
www.ukbap.org.uk
Climate Change Act 2008 http://www.opsi.gov.uk/acts/acts2008/pdf/ukpga_20080027_en.pdf
The Planning Response to Climate Change: Advice on better practice http://www.communities.gov.uk/documents/planningandbuilding/pdf/147597.pdf
Living Places: cleaner, safer, greener, ODPM 2002 http://www.publications.parliament.uk/pa/cm200203/cmselect/cmodpm/673/673.pdf
ODPM: Safer Places: The Planning System and Crime Prevention, February 2004
http://www.communities.gov.uk/documents/planningandbuilding/pdf/147627.pdf
Accessible Natural Greenspace Standards, English Nature
Understanding the relevance
and application of the Access to
Natural Green Space Standard
English Nature, 1995: Research Report No. 153, Accessible Natural Greenspace in Towns and Cities - a Review of Appropriate Size and Distance Criteria,. Updated info:
http://naturalengland.etraderstores.com/NaturalEnglandShop/product.aspx?ProductID=9d028d4b-eb27-4545-a1fe-3064f70c2f7a
http://www.naturalengland.org.uk/Images/Greenspace%20-%20ANGSt%20report%20%202008_tcm6-7737.pdf
The Future of Transport White Paper, July 2004 http://www.dft.gov.uk/about/strategy/whitepapers/previous/fot/
Transport 10 Year Plan 2000: Delivering better transport – progress report
http://www.dft.gov.uk/about/strategy/whitepapers/previous/progressreport.pdf
DfT, Towards a Sustainable Transport System, Oct 2007 http://www.dft.gov.uk/about/strategy/transportstrategy/pdfsustaintranssystem.pdf
DfT, Delivering A Sustainable Transport System, Nov 2008 http://www.dft.gov.uk/about/strategy/transportstrategy/dasts/
A Practical Guide to the Strategic Environmental Assessment Directive http://www.communities.gov.uk/documents/planningandbuilding/pdf/practicalguidesea.pdf
Sustainability Appraisal of Regional Spatial Strategies and Local Development Documents, November 2005
http://www.communities.gov.uk/documents/planningandbuilding/pdf/142520.pdf
Part II Scoping Report (Draft)3 FINAL 6

EAST RIDING OF YORKSHIRE COUNCIL –
SUSTAINABILITY APPRAISAL OF THE ALLOCATIONS DEVELOPMENT PLAN DOCUMENT
Part II Scoping Report
Strategic Environmental Assessment Guidance for Transport Plans and Programmes TAG Unit 2.11, December 2004
http://www.webtag.org.uk/webdocuments/2_Project_Manager/11_SEA/pdf/2.11.pdf
Neighbourhood Renewal Unit Programmes http://www.regionalforum.org.uk/publications_resources/knowledgebase/500/560/53.pdf
The Rural Strategy 2004 http://www.defra.gov.uk/rural/pdfs/strategy/rural_strategy_2004.pdf
Rural White Paper: Our countryside: the future a fair deal for Rural England, 2000
www.defra.gov.uk/rural/pdfs/ruralwp/rural.pdf
Housing Market Renewal http://www.englishpartnerships.co.uk/pathfinders.htm
http://www.communities.gov.uk/housing/housingsupply/housingmarketrenewal/
Making Space for Water http://www.defra.gov.uk/environ/fcd/policy/strategy.htm
Coastal Zone Management Plan – towards a sustainable coast (2002) http://library.coastweb.info/659/
Future Water, the Government’s Water Strategy for England (Feb 2008)
http://www.defra.gov.uk/Environment/water/strategy/pdf/future-water.pdf
River Basin Initial Characterisation Maps http://webarchive.nationalarchives.gov.uk/20080305115859/http://www.defra.gov.uk/environment/water/wfd/article5/index.htm
Policy and Practice for the Protection of Groundwater 2005 http://publications.environment-agency.gov.uk/pdf/GEHO1006BLMU-e-e.pdf
The Code for Sustainable Homes: Setting the standard in sustainability for new homes (February 2008)
http://www.communities.gov.uk/documents/planningandbuilding/pdf/codesustainhomesstandard.pdf
Strategy for Sustainable Construction (June 2008) http://www.berr.gov.uk/files/file46535.pdf
Water Framework Directive Advice to Planning Authorities in England and Wales (February 2006)
http://library.coastweb.info/432/1/wfd_planning_advice.pdf
Health is Global: a UK government Strategy 2008-2013 http://www.dh.gov.uk/en/Publicationsandstatistics/Publications/PublicationsPolicyAndGuidance/DH_088702
The Energy Challenge, Energy Review Report (July 2006), Department of Trade and Industry (DTI)
http://www.dti.gov.uk/files/file31890.pdf
Planning for the Protection of European Sites: Appropriate Assessment - Guidance For Regional Spatial Strategies and Local Development
http://www.communities.gov.uk/archived/publications/planningandbuilding/planning2
Part II Scoping Report (Draft)3 FINAL 7

EAST RIDING OF YORKSHIRE COUNCIL –
SUSTAINABILITY APPRAISAL OF THE ALLOCATIONS DEVELOPMENT PLAN DOCUMENT
Part II Scoping Report
Documents (August 2006)
Delivering Affordable Housing, Department for Communities and Local Government (DCLG) (November 2006)
http://www.communities.gov.uk/publications/housing/deliveringaffordablehousing
Building a Greener Future: Towards Zero Carbon Development (Consultation Draft), DCLG, 2007
http://www.communities.gov.uk/archived/publications/planningandbuilding/buildinggreener
Planning for Biodiversity and Geological Conservation: A Guide to Good Practice, ODPM, (August 2005)
http://www.communities.gov.uk/publications/planningandbuilding/planningbiodiversity
Circular 06/05: Biodiversity and Geological Conservation – Statutory Obligations and Impact Within the Planning System 2005
http://www.communities.gov.uk/publications/planningandbuilding/circularbiodiversity
Circular 03/07: Town and Country Planning (Control of Advertisements) (England) Regulations 2007
http://www.communities.gov.uk/publications/planningandbuilding/circulartown
Natural England’s Green Infrastructure Guidance (Catalogue Code: NE176), Natural England, 2009
http://naturalengland.etraderstores.com/NaturalEnglandShop/Product.aspx?ProductID=cda68051-1381-452f-8e5b-8d7297783bbd
Securing biodiversity: A new framework for delivering priority habitats and species in England, Defra and Natural England 2008
http://naturalengland.etraderstores.com/NaturalEnglandShop/NE127
Natural Environment and Rural Communities (NERC) Act 2006 http://www.opsi.gov.uk/acts/acts2006/ukpga_20060016_en_1
Guidance on the Improved Local Biodiversity Indicator (NI 197), Defra, 2008
http://www.defra.gov.uk/corporate/about/what/localgovindicators/documents/ni197-guidance-revised.pdf
Regional Plans and Programmes
Yorkshire and Humber Climate Change Plan 2009-2014 http://www.yourclimate.org/
The Yorkshire and Humber Plan: Regional Spatial Strategy to 2026 http://www.goyh.gov.uk/497763/docs/199734/199799/689582/1_Y_H_Published_RSS_May_2008.pdf
Yorkshire and Humber Regional Sustainable Development Framework 2003-2005 July 2003
http://www.yhassembly.gov.uk/dnlds/Building%20the%20Benefits.pdf
The Regional Economic Strategy for Yorkshire & Humber 2006-2015 http://www.yorkshire-forward.com/about/what-we-do/strategy/the-res
Achieving Low Carbon and Sustainable Transport Systems in Yorkshire and Humber (March 2008)
http://www.lgyh.gov.uk/The%20Library/Other%20Research/Transport/
Identification of Regional Transport Priorities Final Report, Yorkshire http://www.yhassembly.gov.uk/dnlds/Identification%20of%20Regional%20Transport%20Prioriti
Part II Scoping Report (Draft)3 FINAL 8

EAST RIDING OF YORKSHIRE COUNCIL –
SUSTAINABILITY APPRAISAL OF THE ALLOCATIONS DEVELOPMENT PLAN DOCUMENT
Part II Scoping Report
and Humber Assembly June 2003 es%20(June%2003).pdf
Yorkshire and Humber Regional Freight Strategy, July 2004 http://www.lgyh.gov.uk/dnlds/Yorkshire%20and%20Humber%20Regional%20Freight%20Strategy%20(July%202004).pdf
Yorkshire and Humber Regional Biodiversity Strategy 2009 http://www.yhbf.org/siteassets/documents/yhbf/0/3/03CA8C87-EADC-48FD-89FA-9E844FC4A98D/RBS_web.pdf
Historic Environment Strategy for Yorkshire and the Humber Region: 2009 to 2013
http://microsite.yhub.org.uk/siteassets/documents/Historic%20Environment%20Forum/4/D/4D126D03-AADD-4F24-B0D9-1BA63D505929/RHES_final-sm.pdf
Regional Forestry Strategy (July 2005)
Delivery plan (November 2007)
http://www.forestry.gov.uk/pdf/yth-rff-2005-strategic-framework.pdf/$FILE/yth-rff-2005-strategic-framework.pdf
http://www.valueoftrees.org/siteassets/documents/yorkshireforestry/E/9/E93B2F04-5B86-4EA6-A15A-34E64D47E2BA/Delivery%20Plan.pdf
Yorkshire Forward (the RDA) Corporate Plan 2008/11 (July 2008) http://www.yorkshire-forward.com//sites/default/files/documents/Corporate%20Plan%202008%20-%202011.pdf
Planning for Renewable Energy Targets in Yorkshire and Humber, 2004
http://www.gos.gov.uk/goyh/menvrur/enrgy/247547/
The Regional Energy Infrastructure Strategy for Yorkshire and the Humber (February 2007)
http://www.yorkshire-forward.com/sites/default/files/documents/Regional%20Energy%20Strategy.pdf
Yorkshire and Humber Regional Housing Strategy 2005-2021 http://www.barnsley.gov.uk/bguk/docs/Housing%20Strategy%20and%20Plans/Regional%20Housing%20Strategy.pdf
Regional Environmental Enhancement Strategy for Yorkshire and the Humber 2003
http://www.yhub.org.uk/resources/Regional%20Projects/enviroYHREF.pdf
Countryside Character Areas Volume 3 for Yorkshire and the Humber 1999/2001
http://www.naturalengland.org.uk/Images/countrysidecharactervol3yorkshirea_humberintro_tcm2-21112_tcm6-4987.pdf
Hull and Coastal Streams, Catchment Flood Management Plan. Draft main stage summary document (June 2008) (can only be used on a factual basis as it is not yet an adopted document)
http://www.jubileeriver.co.uk/Hull%20CFMP%20summary.pdf
Aire Catchment Flood Management Plan. Consultation Summary Document (March 2007) (can only be used on a factual basis as it is not yet an adopted document)
http://images.leeds.ac.uk/flooding/CFMP%20main%20flier.pdf
River Derwent Catchment Flood Management Plan. Summary Report (Dec 2009) (can only be used on a factual basis as it is not yet an
http://publications.environment-agency.gov.uk/pdf/GENW0309BPTP-E-E.pdf
Part II Scoping Report (Draft)3 FINAL 9
EAST RIDING OF YORKSHIRE COUNCIL –
SUSTAINABILITY APPRAISAL OF THE ALLOCATIONS DEVELOPMENT PLAN DOCUMENT
Part II Scoping Report
adopted document)
Draft Yorkshire Ouse, Catchment Flood Management Plan. Consultation Draft Plan (April 2008) (can only be used on a factual basis as it is not yet an adopted document)
http://www.environment-agency.gov.uk/static/documents/Research/1_es_and_int_2020599.pdf
Don and Rother, Catchment Flood Management Plan. Draft Main Stage Summary Document (June 2008) (can only be used on a factual basis as it is not yet an adopted document)
Hard copy
Draft River Trent, Catchment Flood Management Plan. Consultation Draft Plan (October 2007) (can only be used on a factual basis as it is not yet an adopted document)
Hard copy
Humber Estuary Shoreline Management Plan (SMP) 2000 http://www.hull.ac.uk/coastalobs/general/erosionandflooding/shorelinemanagmentplans.html
Humber Estuary Coastal Authorities Group Flamborough Head to Gibraltar Point SMP 2. Consultation Draft (Nov 2009) (can only be used on a factual basis as it is not yet an adopted document)
http://www.hecag-smp2.co.uk/downloads.htm
Yorkshire and Humber Wetlands Feasibility Project (February 2005) http://www.yhbf.org/siteassets/documents/yhbf/3/7/37C69A6D-77E3-4706-97E5-0CA7DEE83E5F/Yorkshire%20and%20Humber%20Wetland%20Project-web.pdf
Hull and East Riding Catchment Abstraction Management Strategy (March 2006)
Plus annual update April 2008
http://publications.environment-agency.gov.uk/pdf/GENE0306BKEE-E-E.PDF
http://publications.environment-agency.gov.uk/pdf/GENE0408BNYX-E-E.PDF
Mapping for Biodiversity in Yorkshire and Humber: A guide to identifying and mapping biodiversity opportunity areas and ecological networks, Yorkshire and Humber Biodiversity Forum, September 2009
http://www.yhbf.org/articledetail.aspx?page=AC83E0DC-F9A8-4918-9AD9-FB62C4D8596C&article=03B650EE-BBAD-4672-A80E-7B0218A4B28B
Yorkshire and Humber Region: Biodiversity Opportunity Areas Mapping: Methodology, Yorkshire and Humber Biodiversity Forum, September 2009
http://www.yhbf.org/articledetail.aspx?page=AC83E0DC-F9A8-4918-9AD9-FB62C4D8596C&article=03B650EE-BBAD-4672-A80E-7B0218A4B28B
Green Infrastructure and the Regional Spatial Strategy for Yorkshire and the Humber: developing the evidence base, A report for the Yorkshire and Humber Assembly. ECOTEC, June 2008
http://www.lgyh.gov.uk/dnlds/Final%20GI%20Report.pdf
Local Plans and Strategies
East Riding of Yorkshire Core Strategy Issues and Options (April 2008) http://eastriding.limehouse.co.uk/portal
Part II Scoping Report (Draft)3 FINAL 10

EAST RIDING OF YORKSHIRE COUNCIL –
SUSTAINABILITY APPRAISAL OF THE ALLOCATIONS DEVELOPMENT PLAN DOCUMENT
Part II Scoping Report
Bridlington Area Action Plan second preferred options (August 2009) http://eastriding.limehouse.co.uk/portal
Joint Structure Plan for Kingston Upon Hull and the East Riding of Yorkshire adopted 2005 – saved policies
http://www.eastriding.gov.uk/planning/jsp
Hull and East Riding Joint Minerals DPD issues and options report (April 2008) – saved policies
http://www.eastriding.gov.uk/corp-docs/forwardplanning//html/minerals.html
Joint Waste Development Plan Document – Issues and Options: Hull and East Riding (April 2008)
http://hullcc-consult.limehouse.co.uk/portal/planning/jwdpd/jwdpd-io?pointId=95999
Joint Sustainable Waste Management Strategy for Hull and East Riding (February 2008)
http://www.target45plus.org.uk/target45/
East Riding Cultural Strategy (2003 – 2007) http://www.eastriding.gov.uk/corp-tourism/docs/CulturalStrategy.pdf
Housing Site Assessment Methodology, East Riding Local Development Framework (2007)
http://www.eastriding.gov.uk/corp-docs/forwardplanning/docs/ldf/housing/Housing%20Methodology%20May%2007.pdf
East Riding Community Plan 2006-2016 and 2008 update (Sustainable Community Plan)
http://www.eastriding.gov.uk/hyperlinks/pdf/community_strategy_final.pdf www.eastriding.gov.uk/EasySiteWeb/GatewayLink.aspx?alId=8326
East Riding Sustainable Modes of Travel Strategy (2008)_ http://www.eastriding.gov.uk/roads/pdf/sustainable_travel_final.pdf
East Riding Economic Development Strategy 2007-2011, 2007 http://www.eastriding.gov.uk/corp-docs/business/economicdevelopmentstrategy2007.pdf
Regeneration Strategy Schedules http://www.eastriding.gov.uk/business-and-economy/strategies-programmes-partners-and-funding/strategies/
Rural Strategy (2005) http://www.eastriding.gov.uk/business-and-economy/strategies-programmes-partners-and-funding/strategies/
East Riding of Yorkshire Council, Final Second Local Transport Plan 2006 - 2011
http://www.eastriding.gov.uk/az/FACE_CATEGORY_page_PROC?pParentCat=3001&pType=2
East Riding of Yorkshire Stage 2 Employment Land Review: Final Report, (June 2007)
http://www.eastriding.gov.uk/corp-docs/forwardplanning/docs/ldf/employment/Stage%202%20Final%20Report.pdf
Employment Land Review Partial Update (July 2009) http://www.eastriding.gov.uk/corp-docs/forwardplanning/docs/ldf/employment/ELRPartialUpdate.pdf
Part II Scoping Report (Draft)3 FINAL 11
EAST RIDING OF YORKSHIRE COUNCIL –
SUSTAINABILITY APPRAISAL OF THE ALLOCATIONS DEVELOPMENT PLAN DOCUMENT
Part II Scoping Report
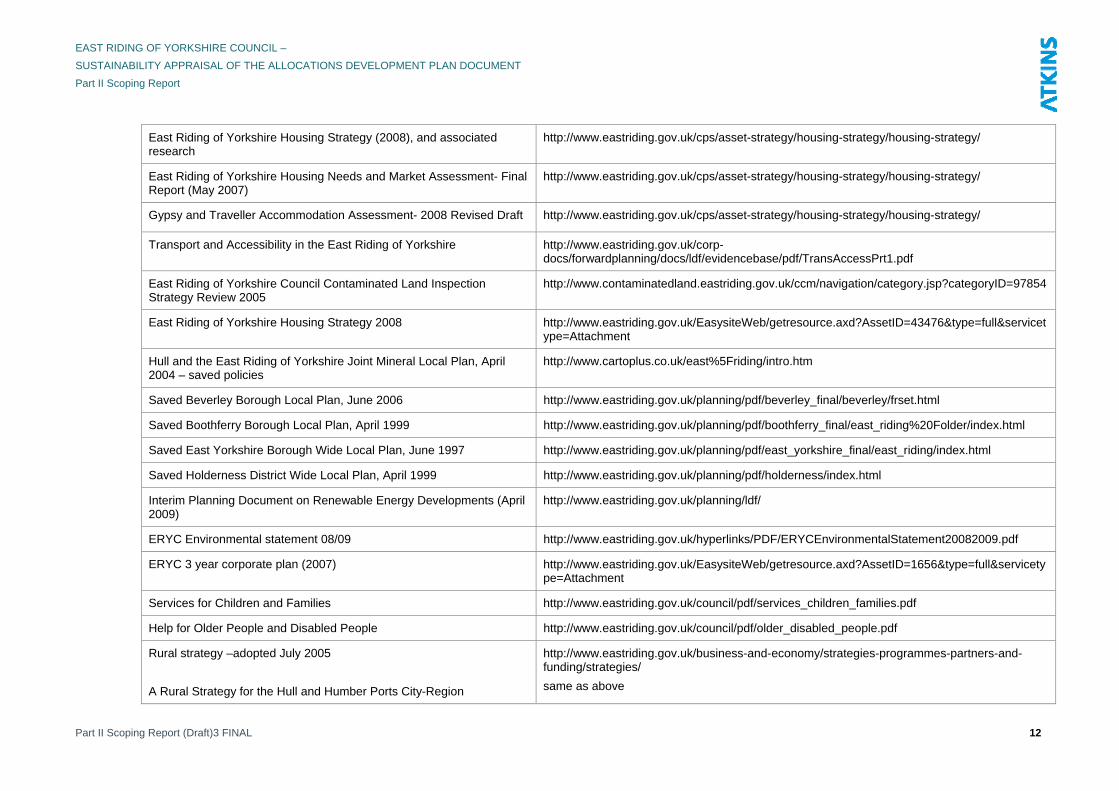
East Riding of Yorkshire Housing Strategy (2008), and associated research
http://www.eastriding.gov.uk/cps/asset-strategy/housing-strategy/housing-strategy/
East Riding of Yorkshire Housing Needs and Market Assessment- Final Report (May 2007)
http://www.eastriding.gov.uk/cps/asset-strategy/housing-strategy/housing-strategy/
Gypsy and Traveller Accommodation Assessment- 2008 Revised Draft http://www.eastriding.gov.uk/cps/asset-strategy/housing-strategy/housing-strategy/
Transport and Accessibility in the East Riding of Yorkshire http://www.eastriding.gov.uk/corp-docs/forwardplanning/docs/ldf/evidencebase/pdf/TransAccessPrt1.pdf
East Riding of Yorkshire Council Contaminated Land Inspection Strategy Review 2005
http://www.contaminatedland.eastriding.gov.uk/ccm/navigation/category.jsp?categoryID=97854
East Riding of Yorkshire Housing Strategy 2008 http://www.eastriding.gov.uk/EasysiteWeb/getresource.axd?AssetID=43476&type=full&servicetype=Attachment
Hull and the East Riding of Yorkshire Joint Mineral Local Plan, April 2004 – saved policies
http://www.cartoplus.co.uk/east%5Friding/intro.htm
Saved Beverley Borough Local Plan, June 2006 http://www.eastriding.gov.uk/planning/pdf/beverley_final/beverley/frset.html
Saved Boothferry Borough Local Plan, April 1999 http://www.eastriding.gov.uk/planning/pdf/boothferry_final/east_riding%20Folder/index.html
Saved East Yorkshire Borough Wide Local Plan, June 1997 http://www.eastriding.gov.uk/planning/pdf/east_yorkshire_final/east_riding/index.html
Saved Holderness District Wide Local Plan, April 1999 http://www.eastriding.gov.uk/planning/pdf/holderness/index.html
Interim Planning Document on Renewable Energy Developments (April 2009)
http://www.eastriding.gov.uk/planning/ldf/
ERYC Environmental statement 08/09 http://www.eastriding.gov.uk/hyperlinks/PDF/ERYCEnvironmentalStatement20082009.pdf
ERYC 3 year corporate plan (2007) http://www.eastriding.gov.uk/EasysiteWeb/getresource.axd?AssetID=1656&type=full&servicetype=Attachment
Services for Children and Families http://www.eastriding.gov.uk/council/pdf/services_children_families.pdf
Help for Older People and Disabled People http://www.eastriding.gov.uk/council/pdf/older_disabled_people.pdf
Rural strategy –adopted July 2005
A Rural Strategy for the Hull and Humber Ports City-Region
http://www.eastriding.gov.uk/business-and-economy/strategies-programmes-partners-and-funding/strategies/
same as above
Part II Scoping Report (Draft)3 FINAL 12

EAST RIDING OF YORKSHIRE COUNCIL –
SUSTAINABILITY APPRAISAL OF THE ALLOCATIONS DEVELOPMENT PLAN DOCUMENT
Part II Scoping Report
East Riding of Yorkshire Council Climate Change Strategy 2003-2005, April 2003
http://www.idea.gov.uk/idk/aio/399855
Humber Economic Development Action Plan (HEDAP) 2004 – 2009 http://www.humberforum.co.uk/newsstory.asp?id=182
East Riding Biodiversity Action Plan 2001-2006, May 2001 http://www.ukbap.org.uk/lbap.aspx?id=502
Draft East Riding of Yorkshire Biodiversity Action Plan, 2010 (can only be used on a factual basis as it is not yet an adopted document)
Available on request
Draft Local Wildlife Site Guidelines, 2003 Available on request
ERYC Strategic Flood Risk Assessment (2010) http://www.eastriding.gov.uk/corp-docs/forwardplanning/html/sfra.html
The East Riding Coastal Zone Management Plan 2002 (under review) http://library.coastweb.info/659/1/iczm.pdf
Wind companies (incl. UU) - wind companies (with planning applications)
Available on request
Countryside Access, Rights of Way Improvement Plan Available on request
Night Blight in Yorkshire and the Humber, 2003 www.cpre.org.uk/filegrab/light-pollution-map-yh.pdf?ref=1755
Our Landscape for Today and Tomorrow - An Assessment of the Landscape North and South of the Humber with Management Guidelines, 1995
Available on request
Town Centres and Retail Study (including issues and recommendations reports for major settlements), February 2009
http://www.eastriding.gov.uk/corp-docs/forwardplanning/docs/retail/retail.html
Bridlington Town Centre AAP Renewable Energy Appraisal 2009 http://www.bridlingtonregeneration.com/Ease/servlet/ShowFile?siteID=1744&fileID=10833&nameAAP%20Renewable%20Energy%20Appraisal.pdf
Landscape Character Assessment for the East Riding of Yorkshire, 2005
http://www.eastriding.gov.uk/corp-docs/forwardplanning/html/lca.html
Gateway Hull and East Riding Housing Market Renewal Pathfinder Strategy
http://www.gatewayhull.co.uk/media-centre/publications/scheme-submission/
Part II Scoping Report (Draft)3 FINAL 13

EAST RIDING OF YORKSHIRE COUNCIL –
SUSTAINABILITY APPRAISAL OF THE ALLOCATIONS DEVELOPMENT PLAN DOCUMENT
Part II Scoping Report
Table 2.2 – Derivation of Key Sustainability Themes
Source Relevance to Appraisal
Sustainability Theme National/International Regional Local SEA Topics
Improve the health and well-being of the population through reducing inequalities in health, improving access to health, leisure and sports facilities and promoting active lifestyles.
Assessing Needs and Opportunities: A Companion Guide to PPG17, Game Plan: a strategy for delivering Government’s sport and physical activity objectives 2002, Active Design Sport England, Code for Sustainable Homes 2006 and 2008, Planning and Climate Change - Supplement to PPS 1 2007, Health is Global: a UK Government Strategy 2008-2013
The Regional Economic Strategy for Yorkshire & Humber 2006-2015, The Yorkshire and Humber Plan: RSS to 2026, Yorkshire Plan for Sport 2004-2008
The East Riding Community Plan 2006 – 2016 (and 2008 update): Our East Riding, East Riding of Yorkshire Council Final Second Local Transport Plan 2006 – 2011, Housing Site Assessment Methodology 2007, East Riding of Yorkshire Housing Strategy 2008 (Consultation Draft), Town Centres and Retail Study (including issues and recommendations reports for major settlements) 2009
Population, Human Health
Ensure the spatial aspect of increasing participation in sport and active recreation.
Assessing Needs and Opportunities: A Companion Guide to PPG17, Game Plan: a strategy for delivering Government’s sport and physical activity objectives 2002, Active Design Sport England, Health is Global: a UK Government Strategy 2008-2013
Yorkshire Plan for Sport 2004-2008, The Yorkshire and Humber Plan: Regional Spatial Strategy to 2026
2008 update to East Riding Community Plan 2006-2016 (Sustainable Community Plan), Town Centres and Retail Study (including issues and recommendations reports for major settlements) 2009
Population, Human Health
Reduce air pollution and ensure the continuation of the improvement in air quality.
The Future of Transport DfT White Paper, Air Quality Strategy DEFRA, Code for Sustainable Homes 2006 and 2008, Climate Change Act 2008, Planning and Climate Change - Supplement to PPS 1 2007, Health is Global: a UK Government Strategy 2008-2013, Strategy for Sustainable Construction 2008
RSS12 , Yorkshire and Humber Sustainable Development Framework, Regional Transport Priorities, Sustainable Transport Systems
East Riding of Yorkshire Council Final Second Local Transport Plan 2006 – 2011,2008 update to East Riding Community Plan 2006-2016 (Sustainable Community Plan), East Riding Sustainable Modes of Travel Strategy 2008
Air, Human Health, Population
Part II Scoping Report (Draft)3 FINAL 14

EAST RIDING OF YORKSHIRE COUNCIL –
SUSTAINABILITY APPRAISAL OF THE ALLOCATIONS DEVELOPMENT PLAN DOCUMENT
Part II Scoping Report
Source Relevance to Appraisal
Sustainability Theme National/International Regional Local SEA Topics
Mitigate noise and light pollution. PPG24, PPS23, Circular 03/07: Town and Country Planning (Control of Advertisements) (England) Regulations 2007
CPRE: Night Blight in Yorkshire and the Humber
Sustainable Design and Construction Policy, ERYC Local Transport Plan 2006-11, Night Blight in Yorkshire and the Humber, Hull and East Riding of Yorkshire Joint Minerals Plan
Human Health, Population
Reduce road traffic and congestion through modal shift to more sustainable modes.
PPS11, PPG13, PPG15, The Future of Transport, The Energy Challenge, Energy Review Report 2006, Department of Trade and Industry, MPS1, Planning and Climate Change - Supplement to PPS 1 2007, Building a Greener Future: Towards Zero Carbon Development (Consultation Draft) 2007, Climate Change Act 2008, DfT Towards a Sustainable Transport System 2007, DfT Delivering A Sustainable Transport System 2008
Regional Spatial Strategy for Yorkshire and Humber 2008, The Regional Economic Strategy for Yorkshire & Humber 2006-2015
ERYC Sustainable Energy Strategy, East Ridings Economic Development Strategy, The East Riding Community Plan 2006 – 2016: Our East Riding, 2008 update to East Riding Community Plan 2006-2016 (Sustainable Community Plan), East Riding of Yorkshire Council Final Second Local Transport Plan 2006 – 2011, Town Centres and Retail Study (including issues and recommendations reports for major settlements) 2009
Air, Human Health, Landscape, Population
Improve efficiency in land use through the re-use of previously developed land and existing buildings, promoting site development at locations that are easily accessible.
UK Sustainable Development Strategy, PPS9, PPG15, PPS3, Strategy for Sustainable Construction, Code for Sustainable Homes 2006 and 2008, Planning for a Sustainable Future: White Paper 2007
Regional Spatial Strategy for Yorkshire and Humber (May 2008), The Regional Economic Strategy for Yorkshire & Humber 2006-2015
East Riding of Yorkshire Council Final Second Local Transport Plan 2006 – 2011, East Riding of Yorkshire Stage 2 Employment Land Review 2007, East Riding of Yorkshire Housing Strategy 2008, Town Centres and Retail Study (including issues and recommendations reports for major settlements) 2009
Human Health, Landscape, Population
Part II Scoping Report (Draft)3 FINAL 15

EAST RIDING OF YORKSHIRE COUNCIL –
SUSTAINABILITY APPRAISAL OF THE ALLOCATIONS DEVELOPMENT PLAN DOCUMENT
Part II Scoping Report
Source Relevance to Appraisal
Sustainability Theme National/International Regional Local SEA Topics
Reduce social exclusion, improve equality of opportunity and develop community spirit and involvement.
PPG17, Planning for a Sustainable Future: White Paper 2007, Delivering Affordable Housing Department for Communities and Local Government 2006, Planning and Climate Change - Supplement to PPS 1 2007, Health is Global: a UK Government Strategy 2008-2013
Regional Spatial Strategy for Yorkshire and Humber (May 2008)
The East Riding Community Plan 2006 – 2016: Our East Riding, 2008 update to East Riding Community Plan 2006-2016 (Sustainable Community Plan), East Riding of Yorkshire Housing Needs and Market Assessment 2007, East Riding of Yorkshire Council Final Second Local Transport Plan 2006 – 2011, East Riding of Yorkshire Housing Strategy 2008, Stage 2 Employment Land Review,2007, Town Centres and Retail Study (including issues and recommendations reports for major settlements) 2009
Human Health, Population
Improve opportunities for access to education, employment, recreation, health, community services and cultural opportunities for all sectors of the community.
PPG17, PPS6, Planning for a Sustainable Future: White Paper 2007, Health is Global: a UK Government Strategy 2008-2013
The Regional Economic Strategy for Yorkshire & Humber 2006-2015, Housing Site Assessment Methodology 2007, Historic Environment Strategy for Yorkshire and the Humber Region: 2009 to 2013, Regional Spatial Strategy for Yorkshire and Humber 2008
The East Riding Community Plan 2006 – 2016: Our East Riding, 2008 update to East Riding Community Plan 2006-2016 (Sustainable Community Plan), East Riding of Yorkshire Council Final Second Local Transport Plan 2006 – 2011, East Riding of Yorkshire Stage 2 Employment Land Review 2007, East Riding of Yorkshire Housing Strategy 2008, Town Centres and Retail Study (including issues and recommendations reports for
Human Health, Landscape, Population
Part II Scoping Report (Draft)3 FINAL 16

EAST RIDING OF YORKSHIRE COUNCIL –
SUSTAINABILITY APPRAISAL OF THE ALLOCATIONS DEVELOPMENT PLAN DOCUMENT
Part II Scoping Report
Source Relevance to Appraisal
Sustainability Theme National/International Regional Local SEA Topics
major settlements) 2009
Raise educational and achievement levels and develop opportunities for everyone to acquire the skills needed to find and remain in work.
Learning and Skills Council Strategic Framework to 2004 Corporate Strategy
Yorkshire and Humber Sustainable Development Framework, Framework for Regional Employment and Skills Action, Regional Economic Strategy
The East Riding Community Plan 2006 – 2016: Our East Riding, 2008 update to East Riding Community Plan 2006-2016 (Sustainable Community Plan), East Riding Economic Development Strategy 2007-2011, East Riding Cultural Strategy
Human Health, Population
Maintain high and stable levels of employment.
Planning for a Sustainable Future: White Paper 2007, PPS4, Health is Global: a UK Government Strategy 2008-2013
The Regional Economic Strategy for Yorkshire & Humber 2006-2015, Leeds City Region Development Programme 2006, Regional Spatial Strategy for Yorkshire and Humber 2008
East Riding Economic Development Strategy 2007-2011, The East Riding Community Plan 2006 – 2016: Our East Riding, 2008 update to East Riding Community Plan 2006-2016 (Sustainable Community Plan), East Riding of Yorkshire Stage 2 Employment Land Review 2007
Population
Improve the vitality of towns and local centres and encourage urban renaissance.
PPS6, Our Towns & Cities: the future delivering an urban renaissance 2000, Towards an Urban Renaissance 1999, English Heritage Strategy 2005-2010
Regional Spatial Strategy for Yorkshire and Humber 2008, The Regional Economic Strategy for Yorkshire & Humber 2006-2015
East Riding Economic Development Strategy 2007-2011, The East Riding Community Plan 2006 – 2016: Our East Riding, 2008 update to East Riding Community Plan 2006-2016 (Sustainable Community Plan), East Riding of Yorkshire Stage 2 Employment Land Review 2007, East Riding of Yorkshire Housing Strategy
Material Assets, Human Health, Landscape, Population
Part II Scoping Report (Draft)3 FINAL 17

EAST RIDING OF YORKSHIRE COUNCIL –
SUSTAINABILITY APPRAISAL OF THE ALLOCATIONS DEVELOPMENT PLAN DOCUMENT
Part II Scoping Report
Source Relevance to Appraisal
Sustainability Theme National/International Regional Local SEA Topics
2008, Town Centres and Retail Study (including issues and recommendations reports for major settlements) 2009
Reduce the fear of crime. National Crime reduction advice, PPS1, Safer Places ODPM, Living places ODPM, Circular 03/07: Town and Country Planning (Control of Advertisements) (England) Regulations 2007, Health is Global: a UK Government Strategy 2008-2013
Yorkshire and Humber Sustainable Development Framework
The East Riding Community Plan 2006 – 2016: Our East Riding, 2008 update to East Riding Community Plan 2006-2016 (Sustainable Community Plan), East Riding of Yorkshire Council Final Second Local Transport Plan 2006 - 2011, Town Centres and Retail Study (including issues and recommendations reports for major settlements) 2009
Human Health, Population
Reduce waste generation and disposal and achieve sustainable management of waste through increased levels of recycling.
National Waste Strategy, PPS10, Code for Sustainable Homes 2008, Strategy for Sustainable Construction June 2008
Regional Spatial Strategy for Yorkshire and Humber 2008, Yorkshire and Humber Regional Waste Strategy 2003, The Regional Economic Strategy for Yorkshire & Humber 2006-2015
East Riding Economic Development Strategy, ERYC Local Agenda 21 Plan, Joint Minerals Development Plan Document Issues and Options, Joint Waste Development Plan Document – Issues and Options: Hull and East Riding 2008, Joint Sustainable Waste Management Strategy for Hull and East Riding 2008
Soil, Water
Reduce waste at source (by, for example composting).
National Waste Strategy, PPS10, Planning and Minerals: Practice Guide 2006, Code for Sustainable Homes 2008
Yorkshire and Humber Regional Waste Strategy 2003
East Riding of Yorkshire and Hull Joint Sustainable Waste Management Strategy 2006, Joint Waste Development
Soil, Water
Part II Scoping Report (Draft)3 FINAL 18

EAST RIDING OF YORKSHIRE COUNCIL –
SUSTAINABILITY APPRAISAL OF THE ALLOCATIONS DEVELOPMENT PLAN DOCUMENT
Part II Scoping Report
Source Relevance to Appraisal
Sustainability Theme National/International Regional Local SEA Topics
Plan Document – Issues and Options: Hull and East Riding 2008
Maintain and improve the quality of surface and groundwater.
PPS25, PPS23, Making space for water Defra, Future Water Defra Water Strategy for England 2008, Water Framework Directive, Planning for a Sustainable Future: White Paper 2007, Code for Sustainable Homes 2006 and 2008
Regional Spatial Strategy for Yorkshire and Humber 2008
East Riding of Yorkshire Council Housing Site Assessment Methodology, East Riding Local Development Framework 2007, East Riding of Yorkshire Council Contaminated Land Inspection Strategy Review 2005, Joint Waste Development Plan Document – Issues and Options: Hull and East Riding 2008, East Riding and Hull Joint Sustainable Waste Management Strategy 2008
Biodiversity, Flora and Fauna, Soil, Water
Reduce the use of non-renewable resources and protect local mineral and water assets.
MPS1, Planning and Minerals: Practice Guide 2006, Code for Sustainable Homes 2008, EU Biodiversity Action Plan for Conservation of Natural Resources, UK Sustainable Development Strategy, PPS9
Regional Spatial Strategy for Yorkshire and Humber 2008, Sustainable Development Framework, Yorkshire and Humber Regional Waste Strategy, Yorkshire and Humber Regional Biodiversity Strategy 2009
ERYC Environmental Policy, Bridlington Town Centre Area Action Plan Renewable Energy Appraisal, Kingston Upon Hull and the East Riding of Yorkshire Joint Structure Plan 2005, Kingston Upon Hull and the East Riding of Yorkshire Joint Minerals Plan
Climatic Factors, Material Assets, Soil, Water
Manage and mitigate the risk of flooding. Code for Sustainable Homes 2008, Planning and Climate Change - Supplement to PPS 1 2007, Climate Change Act 2008, PPS25, Coastal Zone Management Plan
Regional Spatial Strategy for Yorkshire and Humber 2008, The Regional Economic Strategy for Yorkshire & Humber 2006-2015, Humber Estuary Coastal Advisory
East Ridings of Yorkshire Strategic Flood Risk Assessment, East Riding Economic Development Strategy 2007-2011, East Riding of Yorkshire Council
Climatic Factors, Population, Water
Part II Scoping Report (Draft)3 FINAL 19

EAST RIDING OF YORKSHIRE COUNCIL –
SUSTAINABILITY APPRAISAL OF THE ALLOCATIONS DEVELOPMENT PLAN DOCUMENT
Part II Scoping Report
Source Relevance to Appraisal
Sustainability Theme National/International Regional Local SEA Topics
Group Shoreline Management Plan 1998, Humber Estuary Shoreline Management Plan 2000, Flamborough Head to Gibraltar Point Shoreline Management Plan Draft 2009, Yorkshire and Humber Wetlands feasibility project, Catchment Flood Management Plans for Hull and Coastal Streams, Aire, Derwent, Yorkshire Ouse, Don and Rother and Trent
Housing Site Assessment Methodology, East Riding Local Development Framework 2007, East Riding Integrated Coastal Zone Management Plan 2002, East Riding of Yorkshire Housing Strategy 2008
Address the causes of climate change through reducing emissions of greenhouse gases (GHGs).
Planning for a Sustainable Future: White Paper 2007, Code for Sustainable Homes 2008, Building a Greener Future: Towards Zero Carbon Development (Consultation Draft) 2007, Climate Change Act 2008, Planning and Climate Change - Supplement to PPS 1 2007, PPG22, Government’s Transport Sustainable Development Objectives, UK climate change programme DEC 2006, UK Climate Change Act 2008
Regional Spatial Strategy for Yorkshire and Humber 2008, The Regional Economic Strategy for Yorkshire & Humber 2006-2015, The Regional Energy Infrastructure Strategy 2007
2008 update to East Riding Community Plan 2006-2016 (Sustainable Community Plan), East Riding Sustainable Modes of Travel Strategy 2008
Climatic Factors
Adapt to the effects of climate change. Planning for a Sustainable Future: White Paper 2007, Code for Sustainable Homes 2008, Climate Change Act 2008, Planning and Climate Change - Supplement to PPS 1 2007
Yorkshire and Humber Regional Energy Infrastructure Strategy 2007, Yorkshire and Humber Regional Biodiversity Strategy 2009, The Yorkshire and Humber Plan: Regional Spatial Strategy to 2026, Humber Estuary Coastal Advisory Group Shoreline
East Riding Integrated Coastal Zone Management Plan 2002, East Riding Sustainable Modes of Travel Strategy 2008, 2008 update to East Riding Community Plan 2006-2016 (Sustainable Community Plan), East Riding Economic
Biodiversity, Flora and Fauna, Climatic Factors, Population, Water
Part II Scoping Report (Draft)3 FINAL 20

EAST RIDING OF YORKSHIRE COUNCIL –
SUSTAINABILITY APPRAISAL OF THE ALLOCATIONS DEVELOPMENT PLAN DOCUMENT
Part II Scoping Report
Source Relevance to Appraisal
Sustainability Theme National/International Regional Local SEA Topics
Management Plan 1998
Humber Estuary Shoreline Management Plan 2000, Flamborough Head to Gibraltar Point Shoreline Management Plan 2 Draft 2009
Development Strategy 2007-2011
Increase energy efficiency and increase renewable energy production.
Planning for a Sustainable Future: White Paper 2007, The DTI Energy Challenge, Energy Review Report 2006, Code for Sustainable Homes 2008, Building a Greener Future: Towards Zero Carbon Development (Consultation Draft) 2006, Climate Change Act 2008, Planning and Climate Change - Supplement to PPS 1 2007, Strategy for Sustainable Construction 2008
Regional Spatial Strategy for Yorkshire and Humber 2008, Planning for Renewable Energy Targets in Yorkshire and Humber 2004, The Regional Economic Strategy for Yorkshire & Humber 2006-2015, Regional Energy Infrastructure Strategy 2007
ERYC Sustainable Energy Strategy, EYRC Local Agenda 21 Plan, Sustainable Design and Construction Policy, Kingston Upon Hull and the East Riding of Yorkshire Joint Structure Plan 2005, ERYC Climate Change Strategy, East Riding Economic Development Strategy 2007-2011
Climatic Factors
Protect and enhance heritage assets and their setting and improve accessibility for all.
PPG15, PPG16, English Heritage Strategy 2005 – 2010, The Historic Environment: A Force for Our Future, Planning for a Sustainable Future: White Paper 2007, MPS1, Planning and Minerals: Practice Guide 2006
Regional Spatial Strategy for Yorkshire and Humber 2008, RSS Historical Environment Study, The Regional Economic Strategy for Yorkshire & Humber 2006-2015, The Yorkshire and Humber Plan: Regional Spatial Strategy to 2026, Historic Environment Strategy for Yorkshire and the Humber Region: 2009 to 2013
Housing Site Assessment Methodology East Riding LDF 2007, East Riding of Yorkshire Housing Strategy 2008 (Consultation Draft)
Cultural Heritage, Landscape, Population
Protect, manage and restore soil resources and geological site.
MPS1, Planning and Minerals: Practice Guide 2006, First Soil Action Plan for England Defra,
Regional Spatial Strategy for Yorkshire and Humber 2008, Yorkshire and Humber
East Riding of Yorkshire Environmental Policy, Hull and East Riding of Yorkshire
Biodiversity, Flora and Fauna Landscape, Material Assets,
Part II Scoping Report (Draft)3 FINAL 21

EAST RIDING OF YORKSHIRE COUNCIL –
SUSTAINABILITY APPRAISAL OF THE ALLOCATIONS DEVELOPMENT PLAN DOCUMENT
Part II Scoping Report
Source Relevance to Appraisal
Sustainability Theme National/International Regional Local SEA Topics
EU Initiative on Soil Protection, Geological Conservation Strategy, English Nature, PPS9, Planning for Biodiversity and Geological Conservation
Regional Biodiversity Strategy 2009
Joint Minerals Plan, East Riding of Yorkshire Housing Site Assessment Methodology, East Riding Local Development Framework 2007, Joint Waste Development Plan Document – Issues and Options: Hull and East Riding 2008, East Riding and Hull Joint Sustainable Waste Management Strategy 2008
Soil
Promote sustainable use and management of the countryside.
MPS1, Planning and Minerals: Practice Guide 2006, The Countryside and Rights of Way Act 2000; Rural White Paper: Our Countryside: The Future - A Fair Deal for Rural England – Summary, UK Rural Strategy 2004, PPS7, PPG17, NERC Act 2006, Securing biodiversity: A new framework for delivering priority habitats and species in England 2008
Regional Spatial Strategy for Yorkshire and Humber 2008, The Regional Economic Strategy for Yorkshire & Humber 2006-2015, Historic Environment Strategy for Yorkshire and the Humber Region: 2009 to 2013
East Riding of Yorkshire Environmental Policy, The East Riding Community Plan 2006 – 2016: Our East Riding, 2008 update to East Riding Community Plan 2006-2016 (Sustainable Community Plan), Kingston Upon Hull and the East Riding of Yorkshire Joint Structure Plan 2005, East Riding Cultural Strategy, East Riding Rural Strategy 2005, East Riding Economic Development Strategy 2007-2011, East Riding Housing Site Assessment Methodology 2007
Cultural Heritage, Landscape, Material Assets
Maintain landscape character. MPS1, Planning and Minerals: Practice Guide 2006, Circular 03/07: Town and Country Planning (Control of Advertisements) (England) Regulations 2007, Planning for a
Regional Spatial Strategy for Yorkshire and Humber 2008, Sustainable Development Framework, RSS Biodiversity and Natural Environment Study, Historic Environment
East Riding of Yorkshire Environmental Policy, The East Riding Community Plan 2006 – 2016: Our East Riding, 2008 update to East Riding Community Plan
Cultural Heritage, Landscape, Material Assets
Part II Scoping Report (Draft)3 FINAL 22

EAST RIDING OF YORKSHIRE COUNCIL –
SUSTAINABILITY APPRAISAL OF THE ALLOCATIONS DEVELOPMENT PLAN DOCUMENT
Part II Scoping Report
Source Relevance to Appraisal
Sustainability Theme National/International Regional Local SEA Topics
Sustainable Future: White Paper 2007, The Countryside and Rights of Way Act 2000, Rural White Paper: Our Countryside: The Future - A Fair Deal for Rural England – Summary, UK Rural Strategy 2004, PPS7, English Heritage Strategy 2005-2010
Strategy for Yorkshire and the Humber Region: 2009 to 2013
2006-2016 (Sustainable Community Plan), East Riding Cultural Strategy, Kingston Upon Hull and the East Riding of Yorkshire Joint Structure Plan 2005, Countryside Character areas, East Riding Economic Development Strategy 2007-2011, East Riding Housing Site Assessment Methodology 2007, East Riding of Yorkshire Stage 2 Employment Land Review 2007, Landscape Character Assessment for the East Riding of Yorkshire 2005
Protect, enhance and improve biodiversity and important wildlife habitats.
Planning for a Sustainable Future: White Paper 2007, Planning for the Protection of European Sites: Appropriate Assessment - Guidance For Regional Spatial Strategies and Local Development Documents 2006, ODPM Circular 06/2005 (Defra Circular 01/2005): Biodiversity and Geological Conservation – Statutory Obligations and Impact Within the Planning System, Planning for Biodiversity and Geological Conservation: A Guide to Good Practice ODPM 2005, Code for Sustainable Homes 2006 and 2008, Planning and Climate Change - Supplement to PPS 1, 2007, UK Sustainable Development Strategy, PPS9,
Regional Spatial Strategy for Yorkshire and Humber 2008, The Regional Economic Strategy for Yorkshire & Humber 2006-2015, Yorkshire and Humber Regional Biodiversity Strategy 2009, Green Infrastructure and the Regional Spatial Strategy for Yorkshire and the Humber: developing the evidence base, Yorkshire and Humber Region: Biodiversity Opportunity Areas Mapping: Methodology 2009, Mapping for Biodiversity in Yorkshire and Humber: A guide to identifying and mapping biodiversity opportunity areas and ecological networks 2009
East Ridings of Yorkshire Economic Development Strategy, Kingston Upon Hull and the East Riding of Yorkshire Joint Minerals Plan, East Ridings of Yorkshire Biodiversity Action Plan 2001, Draft East Ridings of Yorkshire Biodiversity Action Plan 2010, Draft Local Wildlife Site Guidelines 2003, East Riding Economic Development Strategy 2007-2011, Housing Site Assessment Methodology 2007
Biodiversity, Fauna and Flora, Climatic Factors, Soil, Water
Part II Scoping Report (Draft)3 FINAL 23

EAST RIDING OF YORKSHIRE COUNCIL –
SUSTAINABILITY APPRAISAL OF THE ALLOCATIONS DEVELOPMENT PLAN DOCUMENT
Part II Scoping Report
Part II Scoping Report (Draft)3 FINAL 24
Source Relevance to Appraisal
Sustainability Theme National/International Regional Local SEA Topics
Natural England’s Green Infrastructure Guidance 2009

EAST RIDING OF YORKSHIRE COUNCIL –
SUSTAINABILITY APPRAISAL OF THE ALLOCATIONS DEVELOPMENT PLAN DOCUMENT
Part II Scoping Report
3. Baseline Information Introduction
3.1 The SEA Directive says that the Environmental Report should provide information on:
‘relevant aspects of the current state of the environment and the likely evolution thereof without implementation of the plan” and the “environmental characteristics of the areas likely to be significantly affected’ (Annex I (b) (c))
‘any existing environmental problems which are relevant to the plan or programme including, in particular, those relating to any areas of a particular environmental importance, such as areas designated pursuant to Directives 79/409/EEC and 92/43/EEC’ (Annex I (c))
3.2 In addition to the requirements of the SEA Directive, the statutory SA process requires the collection of additional information on social and economic characteristics of the plan area.
Methodology 3.3 Baseline information provides the basis for predicting and monitoring effects and helps identify
sustainability problems and alternative ways of dealing with them. Sufficient information about the current and likely future state of the plan area is required to allow the plan’s effects to be adequately predicted.
3.4 The ODPM’s (now the Department for Communities and Local Government - DCLG) guidance emphasises that the collection of baseline data and the development of the SA framework should inform each other. The review and analysis of relevant plans and programmes will also influence data collection. The collection of baseline data should not be viewed as a one-off exercise conducted at Stage A only. It is likely that further data collection may well be needed at later stages as the SA develops. In deciding what and how much baseline data to collect, the key determining factor will be the level of detail required to appraise the plan against the SA objectives.
3.5 A preliminary set of baseline data has been extracted from a wide range of available publications and datasets. Sources have included, among others, national government and government agency websites, census data, ERYC Information Online, and previous SA/SEA work for the area and region. No primary research has been conducted.
3.6 Baseline information and data have been summarised in this section and are presented in detail in Appendix A. The aim is to give an overview of the economic, social and environmental characteristics of the plan area and how these compare to the region and the rest of the country.
Baseline Key Features 3.7 The East Riding of Yorkshire is located in the Yorkshire and Humber Region and covers an area
of 240,770 hectares. The Council became England’s largest Unitary Authority (UA) by area in April 1996 when it took over responsibilities from three boroughs and one district (Beverley, Boothferry, East Yorkshire and Holderness) and part of the former Humberside County Council.
3.8 East Riding is diverse in nature with four distinct types of area – the coastal strip (85 kilometres long), the Humber Estuary, the Wolds and the hinterlands of the major urban areas of Hull, York and Doncaster.
3.9 East Riding has a population of approximately 333,000. The largest town is Bridlington with 35,500 people. The other major settlements are Beverley (30,500), Goole (17,500), Driffield
Part II Scoping Report (Draft)3 FINAL 25

EAST RIDING OF YORKSHIRE COUNCIL –
SUSTAINABILITY APPRAISAL OF THE ALLOCATIONS DEVELOPMENT PLAN DOCUMENT
Part II Scoping Report
(10,000) and the ‘Haltemprice’ settlements to the west of the City of Hull: Cottingham (17,000); Anlaby/Willerby/Kirkella (23,500); and Hessle (15,000). However, about half the population live in rural communities of fewer than 5,000 people. Many of these rural communities are scattered and geographically isolated. The RSS requires an additional 1,150 net dwellings per annum in East Riding to 2026, assuming that average household sizes do not change. This means that East Riding’s population is likely to grow by around 47,000 by 2026.
3.10 East Riding is bounded by: the North Sea to the east, North Yorkshire County (with its constituent District Councils of Scarborough, Ryedale and Selby) and the Unitary Authorities of York and Doncaster to the north and west and North Lincolnshire and North East Lincolnshire UAs across the Humber Estuary. It also encircles Kingston Upon Hull Unitary Authority (see Figure 3.1).
3.11 The following sections describe the key baseline conditions of the economic, environmental and social aspects found for the area covered by the East Riding of Yorkshire Unitary Authority.
Figure 3.1 – The East Riding of Yorkshire Area
Source: East Riding of Yorkshire Council 2010
Local Economy 3.12 East Riding has the lowest GDP per head in the sub-region of £10,051 and only 80.1% of the UK
average. GDP per head has also increased at a slower rate than for the sub-region and UK.
3.13 The East Riding has a relatively high number of businesses per 1,000 head of adult population, at 41, compared to only 33 for the sub-region and 40 for the UK.
3.14 There were 12,350 active businesses in East Riding during 2007, compared with 11,555 in 2004 and 12,030 in 2006.
3.15 In 2008 there were 1,260 business births in East Riding. The data show a gradual decline in business birth rates from 1,610 in 2004. The business birth rate in 2007 was 11.7%, compared with the UK rate of 13.1%.
Part II Scoping Report (Draft)3 FINAL 26

EAST RIDING OF YORKSHIRE COUNCIL –
SUSTAINABILITY APPRAISAL OF THE ALLOCATIONS DEVELOPMENT PLAN DOCUMENT
Part II Scoping Report
3.16 In 2008 there were 1,180 business deaths. This is a slightly lower number than the number of business deaths in 2007 (1,245) and comparable with 2004 (1,200). A business death rate in 2007 was 10.1%, compared with the UK rate of 9.9%.
3.17 However, the East Riding five-year survival rate for businesses born in 2003 and still active in 2008 is 52.9%, which is higher than the UK rate of 46.6%.
Table 3.1 – Business Survivals Rate, %
Births 2003 Births 2004 Births 2005 Births 2006 Births 2007
One Year Survival
92.7
94.7
93.6
97.8
93.4
Two Year Survival
80.9
80.1
79.7
84.2
-
Three Year Survival
70.2
68.0
64.0
- -
Four Year Survival
61.4
68.0
- - -
Five Year Survival
52.9
- - - -
Source: Office for National Statistics, Business Demography 2008
3.18 According to the East Riding Local Strategic Partnership’s Economic Development Strategy, East Riding’s major economic assets are:
The Humber Estuary and the Port of Goole;
Strong economic clusters, especially food and drink (which includes agriculture and fishing), logistics, chemicals, caravan and portable building manufacture;
The potential of the coast and Wolds as major tourism and leisure destinations and locations for modern, environmentally aware organisations; and
Good educational attainment rates overall and the proximity of York, Hull and Lincoln Universities to promote the development of innovative and technologically based businesses.
Employment 3.19 Many people living in rural areas have been badly affected by a decline in agriculture, a significant
reduction in jobs as agriculture becomes increasingly automated requiring less labour, a correspondingly increase in low paid and seasonal work and a decrease in public transport with the effect that services are increasingly hard to access.
3.20 Unemployment in the ERYC area as recorded between October 2007 and September 2008 was 4%. This rate is below the national average of 5.3% and below the Yorkshire and the Humber rate of 5.9%.
3.21 Jobseekers Allowance (JSA) claimants are relatively low in ERYC at 3.5% compared with the region’s 4.8% and the national 4.1%. The wards with the highest level of JSA claimants in the UA area are Bridlington South, South East Holderness, Bridlington Central & Old Town, Goole South, Minster and Woodmansey and Hessle.
3.22 Despite longer than national average working hours, wage levels are below national average.
3.23 There are above average employment rates in East Riding. In 2007 there were 11,540 VAT registered businesses which, pro rata by population is above the national average.
Part II Scoping Report (Draft)3 FINAL 27

EAST RIDING OF YORKSHIRE COUNCIL –
SUSTAINABILITY APPRAISAL OF THE ALLOCATIONS DEVELOPMENT PLAN DOCUMENT
Part II Scoping Report
Population 3.24 The population of the East Riding has been rising fast in recent years: between 2001 and 2006, its
population rose by 5.3%, compared with 3.6% for Yorkshire and Humber, and 3.3% for England. The East Riding Housing Strategy 2008 states that East Riding’s population is predicted to increase further by nearly a quarter by 2029 at a rate above both the regional and national average.
3.25 According to 2007 population estimates, 49.1% of the population were male and 50.9% female. Children under five accounted for approximately 5% of the resident population of East Riding of Yorkshire. This is slightly lower than for England and Wales overall.
3.26 East Riding is characterised by an increasing proportion of the indigenous population in the 50+ age group. In mid-2007, 23.4% of the resident population in East Riding was of retirement age (65 and over for males or 60 and over for females) compared with 19% in England and Wales, and 20.2% for the region. The average age of the population, calculated from ONS 2007 mid year population estimates, in East Riding was 41.2 years. The average age for England and Wales was 38.6 years. Evidence from the 2001 Census suggests that the 25-44 age band, the most economically active group, has fallen by 2% since 1991 and made up about 30% in 2003. This compares with 35% for England and Wales.
3.27 There are high levels of inward migration from both within the region and elsewhere within the UK. In the twenty years between 1982 and 2002, the population of East Riding increased by 16.6% due to migration, compared with an increase of 1.5% for Yorkshire and the Humber region as a whole. Since 2002, the population has increased again by a further 5%. Population density of East Riding averaged 138 people per square kilometre, compared with an average of 336 for the region and 392 for England overall.
3.28 Short-to-medium term national population projections anticipate further population growth in this area. The population for Yorkshire and The Humber is projected to rise by 7.4% to 5.4 million by the year 2028 based on the 2003 mid-year estimates of population. These projections assume recent population trends will continue. The East Riding is estimated to have a significant increase above the regional average (more than ten per cent over the 25 year period). The population as a whole is projected to continue to age, with decreases in the younger age bands and increases in the older ages. This is in line with the patterns seen in the national projections.
Housing 3.29 Average household size in East Riding was 2.36 people compared with an average of 2.4 people
for England and Wales, in 2001.
3.30 Average house prices in 2009 were below the national but above the regional averages. Average house prices have dropped back to 2005 levels in line with regional and national trends, due to the recession and difficulties in obtaining mortgages.
3.31 However, despite the recent drop in house prices, there has been a significant rise of 127% in house prices in the East Riding, compared with 86% for England as a whole, between April 2001 and April 2009.
3.32 The recent data, set out in the 2009 East Riding Annual Monitoring Report (AMR), indicate that average house prices in East Riding were approximately £137,243 and average households earnings were £33,061 in 2008.
3.33 Whilst there was a significant drop in average house prices between 2008 and 2009, the affordability of housing remains an issue across large parts of the East Riding. The average house price in most areas is at least five times the local income despite the variation in house prices. In general, this is a result of there being an incidence of high house prices in the relatively high-income areas (such as in the northern part of the East Riding) but low incomes in those
Part II Scoping Report (Draft)3 FINAL 28

EAST RIDING OF YORKSHIRE COUNCIL –
SUSTAINABILITY APPRAISAL OF THE ALLOCATIONS DEVELOPMENT PLAN DOCUMENT
Part II Scoping Report
areas where house prices are lower. Figure 3.2 shows the affordability of homes in East Riding in 2008.
3.34 The percentage of households priced out of the market in East Riding in 2007 ranged from 54% for flats to 86% for detached houses.
3.35 Social housing accounted for less than 10% of homes in East Riding in 2007. The HNMA identifies an annual requirement of 1,455 affordable homes in East Riding for the period 2006 to 2011. About 83% of housing in ERYC in 2007 was owner occupied; and 7% is privately rented. About 1% of the houses in the district are second homes (1,600).
3.36 The Council currently requires 40% of all new housing on schemes of more than 15 houses (or on sites in excess of 0.5ha) to be affordable. This is an ‘interim’ approach based on RSS policy, which is likely to be revised as part of the Core Strategy’s development.
3.37 The percentage of dwellings built on previously developed land in the East Riding between April 2007 and March 2008 was relatively high at 50.4%.
Figure 3.2 - Income to House Price Multiple
3.38
Source: East Riding of Yorkshire Council, 2009
Human Health 3.39 According to the 2001 census, the proportion of people deemed to have health that is ‘good’ is
higher (68.82%) than the regional average (66.96%) but approximately equal to that in England and Wales (68.55%). The percentage of people with a limiting long-term illness and the number of households with one or more persons with a limiting long-term illness is slightly below the national average (18.11 and 33.17 respectively, compared to the England and Wales averages of 18.23 and 34.05). Similarly, the number of people with general health considered ‘not good’ is 8.74%, below the regional and national average (10.2% and 9.2% respectively).
3.40 Life expectancy of both females and males is higher (81.9 and 78.6 respectively) than the regional average (81.1 and 76.9) and in England and Wales (81.8 and 77.6). The data also indicate a lower standard mortality rate (99) than the regional (105) and national average (100).
Part II Scoping Report (Draft)3 FINAL 29

EAST RIDING OF YORKSHIRE COUNCIL –
SUSTAINABILITY APPRAISAL OF THE ALLOCATIONS DEVELOPMENT PLAN DOCUMENT
Part II Scoping Report
3.41 In 2004 only 28% of adults in Yorkshire did enough physical activity to benefit their health (i.e. achieve the Department of Health physical activity guidelines), compared with 30.4% nationally. The 2008 target is 32%. The percentage of adults who took part in 30 minutes of moderate intensity sport and active recreation three times a week was 18% in 2004; the 2008 target is 22%. The Health Poverty Index for East Riding shows modelled levels of obesity and high blood pressure were above the national average in 2008.
3.42 The percentage of schoolchildren who spent at least two hours a week on high-quality physical education and school sport within and beyond the curriculum was 61% in 2004; the target for 2008 was 75%. 30.5% of children travelled to school by car in 2006/07. The target is to reduce this to 29% by 2010/11. In 2006/07, 9.2% of primary school age children were classed as obese; the target is to reduce this to 8.4% by 2010/11.
Education and Skills 3.43 According to the Office of National Statistics (ONS) annual population survey in 2007, the
percentage of people with Degree and Higher Degree level qualifications or equivalent was above (27%) the regional average (23.8%) and below the national average (28.6%). The ONS survey also identified that People with fewer than 5 GCSEs at grades A-C, foundation GNVQ, NVQ 1, intermediate 1 national qualification (Scotland) or equivalent made up 84.1%, which is higher than the regional 77% and the national 78.1% averages. The percentage of people in East Riding with no qualifications was 10.8% which is lower than the regional average of 14.5% and the national average of 13.1%.
Crime and the Fear of Crime 3.44 Crime statistics show that the overall rate of crime in the East Riding was lower (30.9) than in the
region (61.7) and in England (54) in 2007/8. Violent crime rate scores significantly lower (12.1) than regional and national average (18 and 17.6 respectively). The rate of burglary, robbery and automotive crime is also lower than regional and national rates.
3.45 Overall, the East Riding is a safe place to live and compares well with England and Wales average rates for all categories of crime. However, public perception does not fully reflect this. About a quarter of respondents in the Household Survey 2004 felt fairly or very unsafe outdoors at night and over half believed crime was increasing in the East Riding.
Deprivation 3.46 The Indices of Multiple Deprivation 2007 ranks East Riding as 232 out of 354 local authorities in
terms of deprivation (1 being the most deprived). In a similar measure in 2004, East Riding was ranked relatively worse at 208. This suggests that East Riding is less deprived than the average for the rest of the country and that its relative positive rating is improving. That said, there are pockets of deprivation, in areas to the south and west of Bridlington, Withernsea and around Goole, with parts of these towns being ranked as amongst the 10% most deprived areas in England. Furthermore, the local authority still has relatively high indexes of income deprivation and employment deprivation.
Transport 3.47 Car ownership in ERYC is substantially higher than the national average, with 75% of households
owning at least one car. In recent years public transport use has grown. The Major Haltemprice Settlements (Hessle, Cottingham, Anlaby, Willerby and Kirk Ella) represent the best served area in the East Riding in respect of buses, focussed primarily on journeys to and from Hull. There is a good level of services within and between the Principal Towns, as well as Hedon, Pocklington and Withernsea, connected by a Core Network of routes. A Secondary Bus Network exists linking some of the East Riding’s largest villages to key centres of employment and services.
Part II Scoping Report (Draft)3 FINAL 30

EAST RIDING OF YORKSHIRE COUNCIL –
SUSTAINABILITY APPRAISAL OF THE ALLOCATIONS DEVELOPMENT PLAN DOCUMENT
Part II Scoping Report
3.48 Some 33% of workers travel further than 10 kilometres to work, which is not surprising given the rural nature of the district. Despite the continued increase in car ownership, there is still a widespread need for public transport in rural areas. Some of the routes operated by the bus companies are subsidised, recognising the commercial realities of providing services in rural areas with dispersed populations. However, even subsidised routes cannot meet the full needs of people living in some of the more remote parts of the East Riding. Furthermore, the needs of many vulnerable people and groups are not catered for through mainstream services.
3.49 In response to these issues, a number of Community Transport Schemes have been established in different parts of the East Riding which aim to provide access to key services for people with particular transport needs. In respect of road transport, there are essentially four types of service available:
MiBus – Dial-a-ride service to various towns throughout the East Riding (provided by different community groups in the East Riding – see below);
Car scheme – Lifts to medical appointments, to access day care, shop or socialise;
Community group hire – Community groups (e.g. scout group, over 60s) can hire a minibus; and
Medibus – Pre-arranged trips to medical appointments.
3.50 The MiBus schemes are contracted routes, available on particular days for customers to request a place (demand responsive services). These services fill the gaps left by more conventional services and are funded by the Council.
3.51 A number of Community Transport Operators are involved in delivering the types of transport schemes listed above, with good coverage of the rural parts of the East Riding. All of the Community Transport Operators in the East Riding are now under contract with the Council to deliver at least one service (i.e. home to school travel, social services, demand responsive services).
Greenhouse Gas Emissions and Climate Change 3.52 The consequences of climate change are already observed in the East Riding. Sea level and
mean annual temperatures are on a rise with mean sea levels on the Humber Estuary and along the Yorkshire coast having risen at rates of between 1.5 and 3.6 millimetres per year over the last 80 years. As climate change continues, it is likely that the number of extreme weather events, in particular, heatwaves, heavy winter rainfalls and storms, will increase.
3.53 Total CO2 emissions in 2006 (3,026 kilotonnes) showed a 17% increase from 2005 (2,607 kilotonnes) levels, even though annual domestic per capita emissions have decreased from 3.4 tonnes to 2.9 tonnes over the same period. This is due to increased CO2 emissions from the industrial and commercial sector and road transport.
3.54 Industry’s contribution in 2006 totalled 1,436 kilotonnes (47.5%) compared to 1,001 kilotonnes (38.5%) in 2005. Domestic and road transport shares in 2006 were 892 kilotonnes (29.5%) and 689 kilotonnes (23%) respectively. In 2005 domestic and road transport contributions were 890 kilotonnes (34%) and 716 kilotonnes (27.5%) respectively. Domestic CO2 emissions per capita in 2006 were 2.9 tonnes, which is lower than the Yorkshire and the Humber average of 3.3 tonnes.
3.55 The area holds high potential for wind energy utilisation: indicative target potential grid connected renewable energy capacity for 2010 is 41 megawatts (MW) in East Riding, based on maximum technical potential and taking account of local constraints.
3.56 By the end of 2009, installed grid-connected renewable energy capacity in the East Riding totalled approximately 39.1 MW- all wind energy. The total grid connected renewable energy in the East
Part II Scoping Report (Draft)3 FINAL 31

EAST RIDING OF YORKSHIRE COUNCIL –
SUSTAINABILITY APPRAISAL OF THE ALLOCATIONS DEVELOPMENT PLAN DOCUMENT
Part II Scoping Report
Riding either with planning permission or operational totals 157.8 MW of which 127.1 MW is wind energy.
3.57 ERYC in partnership with Community Energy Solutions (CES) have piloted air source heat pumps. The Community Energy Renewables Project, lead by CES, aims to reduce levels of fuel poverty in rural East Riding of Yorkshire, to increase the profile of this technology and to encourage more people to see it as an alternative when their heating system needs replacing. Having worked together for over two years, CES and ERYC have reached hundreds of households who, due to their remote locations, have previously relied on coal, oil, LPG or storage heaters to heat their homes. By installing air source heat pumps, a low carbon, cost effective heating solution, into homes, the project reduces household heating costs, improves the warmth of peoples’ homes, assists in reducing fuel poverty and leads to indirect cuts in carbon emissions.
3.58 A measurement used to assess overall energy efficiency is the standard assessment procedure (SAP). This runs from 1 (highly inefficient) to 100 (highly efficient). The SAP indicates that energy efficiency of authority dwellings in East Riding is higher (78%) than the national (69.9%) average.
3.59 The Council aims to achieve the target of a 30% improvement in energy efficiency for houses by 2010 based on 1995 figures set out under Home Energy Conservation Act.
Contaminated Land 3.60 The ERYC Contaminated Land Strategy was published in 2001. It sets out how the Council has
implemented its inspection duties in identifying contaminated land under part IIA of the Environmental Protection Act 1990.
3.61 According to the Strategy the Council, in order to address the contaminated land issues and contribute to the wider community and management aims, will:
identify and remove unacceptable risks to human health due to land contamination;
bring land which has been damaged by contamination back into beneficial use, creating new opportunities for economic and residential development;
by removing risks to the environment from land contamination, move towards sustainable economic growth and ensure that future generations are not burdened by a legacy of environmental damage;
be open and transparent with regard to contaminated land issues and ensure that members of the public have full access to information;
ensure that inspection is carried out in a rational, ordered and efficient manner and that resources are concentrated on the most pressing and serious problems first.
3.62 The Strategy was reviewed in 2003 and then again in 2005. A further review is currently underway. A revised prioritisation exercise identified 550 sites within East Riding where there is considered to be a greater risk of contamination from over 15,500 potential contaminated sites.
Water Quality and Flood Risk 3.63 The main water courses in East Riding are the River Humber, River Hull, Watton Beck, River
Derwent, Great Ouse, River Aire and River Trent.
3.64 East Riding has sites monitored for chemical and biological river water quality by the Environment Agency. The General Quality Assessment (GQA) Scheme assesses the basic chemical quality of rivers and grades it into good, fair, poor and bad. The biological grading is based on a procedure known as the River Invertebrate Prediction and Classification System (RIVPACS). Species groups recorded at a site are compared with those which would be expected to be present in the absence of pollution and other harmful substances,
Part II Scoping Report (Draft)3 FINAL 32

EAST RIDING OF YORKSHIRE COUNCIL –
SUSTAINABILITY APPRAISAL OF THE ALLOCATIONS DEVELOPMENT PLAN DOCUMENT
Part II Scoping Report
3.65 In 2002-2006 the following trends for chemical and biological quality were observed in East Riding:
Chemical quality was classified as 46.2% Good, 35.1% Fair, 16.4% Poor and 2.2% Bad. In comparison measurements in the Yorkshire and the Humber region as a whole were 64.9% Good, 27.1% Fair, 7.2% Poor and 0.8% Bad.
Biological quality was classified as 58.0% Good, 34.8% Fair, 3.7% Poor and 3.5% Bad. In comparison measurements in the Yorkshire and the Humber region as a whole were 64.1% Good, 27.0 Fair, 6.6 Poor, 2.3% Bad.
3.66 The biological and chemical quality of rivers has improved greatly since 1990. This is due mainly to the major clean-up of discharge from industry and sewage treatment works. However, many rivers still have high levels of pollution. The biological and chemical quality of rivers is expected to improve over the next few years due to the Fresh Water Fish Directive. This directive will set up stricter discharge conditions from Waste Water Treatment Works (WWTW) into urban watercourses. As a consequence, a number of WWTWs in the East Riding are planned to be upgraded over the next five years.
3.67 The Environment Agency has defined 13 Groundwater Source Protection Zones (SPZs) under the National Groundwater Protection Policy to protect aquifers and groundwater flows. The SPZs are divided into sectors dependant on a location's potential significance for affecting the integrity of groundwater in the aquifer. Contamination of these aquifers could have a serious effect on the public water supply. SPZs, particularly those parts closest to the abstraction points, will be a significant constraint on the location of development, and the LDF must ensure that the integrity of water resources is not prejudiced.
3.68 Rising sea levels are one of the most certain aspects of a changing climate. The Yorkshire and Humber region has the second largest area at risk from flooding in the country, with the Wash in Norfolk having the largest. As a result of the low lying, flat landscape areas along the Humber Estuary and River Hull, these areas are particularly at risk. Potential impacts in East Riding include:
Increased risk of tidal flooding from the overtopping and breaching of coastal defences due to increased sea levels and more storminess. Tidal gates and pumping stations will have to be operated more frequently with possible effects on estuarine and river ecology;
The area of land within the 1 in 200 year tidal indicative floodplain map will increase. This area is defined as high flood risk in Government planning policy (PPS 25);
Drains into the Humber estuary will be tide-locked more frequently because of higher sea levels causing drainage problems.
3.69 Within the East Riding the low-lying areas around Barmston drain, south of Hornsea, Tunstall drain and the north bank of the Humber, including Sunk Island, and parts of Easington are the most susceptible to risk from coastal and/or estuarine flooding.
3.70 Significant floods affected large parts of East Riding in June 2007. This resulted in approximately 6,000 households experiencing some damage to their property, 3,000 of which were forced to leave their homes and move into temporary accommodation.
3.71 The Environment Agency flood maps of the area indicate that major flood defences are located along the coastline and the main water courses. There are about 235 kilometres of flood defences in the area covered by the Humber Estuary SMP. Most are simple earth embankments, varying between two and five metres in height. Many of the banks have stone or concrete protection on their seaward faces and in some places wave walls have been built on top to improve the standard of protection. Close to urban areas many of the defences include vertical reinforced concrete or sheet piled walls. The defences are surveyed regularly to check their condition. The most recent surveys show that most are in ‘good’ or ‘fair’ condition overall, although there are
Part II Scoping Report (Draft)3 FINAL 33

EAST RIDING OF YORKSHIRE COUNCIL –
SUSTAINABILITY APPRAISAL OF THE ALLOCATIONS DEVELOPMENT PLAN DOCUMENT
Part II Scoping Report
problems with individual parts of the structures in places, such as where foundations are being undermined by erosion.
3.72 A Strategic Flood Risk Assessment (SFRA) has been carried out for East Riding and spatial planning and development control recommendations formulated. As a result development within the flood risk zone is strongly controlled by the planning system. DCLG’s PPS25 on Development and Flood Risk was used; in particular the sequential approach applied in determining the location for future developments. This favours in descending order sites from ‘low risk’ through to ‘high risk’. Exceptions can be granted to ‘high risk’ sites, depending on vulnerability classification, that contribute significantly to addressing social and economic issues in areas of need. In these cases particular attention should be paid to the development’s design to ensure its safe operation and no increased risk of flooding elsewhere is incurred. Provisions for escape/evacuation, effective flood warning and emergency planning should also be made.
3.73 The towns of Bridlington, Hornsea and Withernsea as well as the village of Mappleton and the gas terminals at Easington are defended against coastal erosion. The rural areas between the defended frontages in the East Riding are currently eroding at a rate of approximately 0.5 – 2.0 metres per year on average and if natural processes continue, there will be properties at risk from coastal erosion along these frontages within the timeframe of the Shoreline Management Plan (from present day to 2105).
Air Quality 3.74 There are currently no designated Air Quality Management Areas (AQMAs) within East Riding.
East Riding has no significant emissions from industrial point sources. However, non-point sources associated with agricultural activities are quite significant in this region. In particular, intensive livestock farming results in methane emissions, ammonia depositions close to livestock farms and odour. Slurry spreading potentially leads to losses of nutrients, including nitrogen and phosphorus to air, soil and water.
3.75 ERYC operates five urban background real-time air quality monitoring stations in the main conurbations: two at Beverley, one at each of Bridlington, Goole and Preston.
3.76 The air quality Objectives for carbon monoxide, nitrogen dioxide, benzene, 1,3-butadiene, lead and sulphur dioxide are currently being met and should still do so by their prescribed attainment dates. PM10 concentrations are also currently meeting the Objectives. The more recently proposed EU Stage 2 indicative limit values for PM10, which are to be achieved by 2010, and the subsequent UK provisional objectives are lower and are likely to be exceeded at two junctions within the East Riding. These junctions are A164/B1230 in Beverley and Promenade/Cross Street in Bridlington. The busiest road (the A63) may also need further investigation in this regard; however, it should be stressed that the revised PM10 objectives remains provisional and it is by no means certain that they will be incorporated into UK legislation.
3.77 The following industrial sites releasing emissions to the atmosphere are monitored by the Environment Agency:
Hanson Quarry Products Europe Ltd, Beverley - waste landfilling, a number of substances including methane (319 tonnes in 2004) are released to atmosphere;
Croda Chemicals Ltd, Goole - processes organic chemicals and releases various emissions to atmosphere;
Scotts Co (UK) Ltd, North Humberside - processes chemical fertilisers and releases emissions to both controlled water and atmosphere;
Kemira Chemicals (UK) Ltd, North Humberside - processes inorganic chemicals and releases emissions to atmosphere;
Part II Scoping Report (Draft)3 FINAL 34

EAST RIDING OF YORKSHIRE COUNCIL –
SUSTAINABILITY APPRAISAL OF THE ALLOCATIONS DEVELOPMENT PLAN DOCUMENT
Part II Scoping Report
Humberside Wastewise Waste Management Services Ltd, Bridlington - landfilling of waste and releases various emissions, including CO2 (12,600 tonnes in 2004) and methane (2,150 tonnes in 2004) to atmosphere.
Tranquillity 3.78 Tranquil areas are generally defined as being largely natural and free from intrusive man-made
noise and structures. Tranquillity is threatened by the steadily increasing urbanised area, the development of the road network, the growth in road and air traffic and the expansion of energy infrastructure.
3.79 The East Riding is ranked as seventh for tranquillity among 87 English Unitary Authorities. The mean tranquillity score for East Riding is 5.9, which is higher than the Yorkshire and the Humber score of 4.16 and England average of -9.34. The positive tranquillity score indicates that countryside features that make its visitors feel tranquil predominate, whilst negative scores suggest that countryside character detracts from feelings of tranquillity. Amongst all English Unitary Authorities Northumberland has the highest score of 28.6 and Slough Unitary Authority has the lowest of -79.5.
Part II Scoping Report (Draft)3 FINAL 35

EAST RIDING OF YORKSHIRE COUNCIL –
SUSTAINABILITY APPRAISAL OF THE ALLOCATIONS DEVELOPMENT PLAN DOCUMENT
Part II Scoping Report
Figure 3.3 - Humberside Tranquillity Map
Source: Campaign to Protect Rural England: County tranquillity maps
Landscape 3.80 Traditionally the area has been associated with agriculture and 90% of the land is still in some
form of agricultural use today. The eastern coastal area covers approximately 150 kilometres of coastline. It is has very diverse landscape features and includes two stretches of designated Heritage Coast.
3.81 Countryside Character Volume 3: Yorkshire and the Humber (1998) identifies five national Countryside Character Areas within the East Riding: the Yorkshire Wolds, the Vale of York, Humberhead Levels, Holderness, and the Humber Estuary (see Figure 3.4). The main characteristics of these areas are as follows:
The Yorkshire Wolds (JCA27):
3.82 Underlying features:
Prominent escarpment and foothills rising from the Vales of York and Pickering and falling to the plain of Holderness;
Defined by the presence of the Chalk but with small areas of Jurassic rocks along the western fringe;
A large-scale landscape of rounded, rolling hills, with big skies and long views from the escarpment and plateaux, contrasting with the more enclosed, sheltered valleys;
Fertile, chalky soils supporting mainly arable farming;
Pattern of large, regular fields crossed by drove ways and enclosure roads with wide verges, resulting mainly from late Parliamentary enclosure; and
High chalk cliffs where the outcrop reaches the coast at Flamborough Head.
3.83 Cultural elements:
Part II Scoping Report (Draft)3 FINAL 36

EAST RIDING OF YORKSHIRE COUNCIL –
SUSTAINABILITY APPRAISAL OF THE ALLOCATIONS DEVELOPMENT PLAN DOCUMENT
Part II Scoping Report
Important archaeological remains with a particular concentration of prehistoric earthworks including burial mounds;
A generally lightly settled landscape with predominantly brick - but sometimes chalk and pantile - buildings, large scattered farmsteads on high ground, small villages in valleys, and small market towns at the fringes; and
Parkland and estate landscapes with large country houses, estate villages and estate woodlands.
3.84 Changing elements:
The fertile, chalky soils support mainly arable farming though there are remnants of unimproved or semi-improved chalk grassland in steep-sided dry valleys, often defined by a hedge at the break of slope and sometimes showing signs of scrub encroachment.
There has been a significant new planting of small scattered woodland blocks on higher land and steeper slopes in the west and north, and a significant increase in the area of woodlands with a Woodland Grant Scheme management agreement
3.85 The overall CQC assessment (1990-98) for the Yorkshire Wolds indicates that although some of the trends in agriculture are inconsistent with the existing character, for the other elements changes are largely consistent. The 1999-2003 CQC overall assessment classifies Yorkshire Wolds Joint Character Areas (JCA) as an enhancing area. Apart from the pressures of development which are locally transforming character, the other elements that shape the character of this area mostly show changes that would strengthen their contribution to character, although boundary and river and coastal management initiatives could be extended.
The Vale of York (JCA 28):
3.86 Underlying features:
Low lying, generally flat or gently undulating land, crossed by obvious ridges formed by the York and Escrick glacial moraines;
Underlain by glacial deposits resting on Triassic sandstone and mudstone and Lower Jurassic mudstone to the east; and
Floodplains of several major rivers notably the Ouse, the Derwent and the Wharfe, but also the Ure, Nidd and Foss.
3.87 Cultural elements:
Distinctive character of settlements, especially the linear villages with buildings set back behind wide grass verges;
Distinctive mottled brick used in buildings, combined with pantile roofs;
Scattered, large, brick-built farmsteads; and
Focus on city of York with roads radiating from the city and York Minster providing a focal point visible in views from the surrounding area.
3.88 Changing elements:
Washland and hay meadows in the river floodplains;
Medium- to large-sized open fields intensively cultivated for arable crops but with some dairy farming;
Low, flailed, intermittent hedges forming field boundaries with sparse, scattered hedgerow trees;
Remnants of heathland commons on sandy soils; and
Part II Scoping Report (Draft)3 FINAL 37
EAST RIDING OF YORKSHIRE COUNCIL –
SUSTAINABILITY APPRAISAL OF THE ALLOCATIONS DEVELOPMENT PLAN DOCUMENT
Part II Scoping Report
Scattered small woods, with more extensive conifer plantations on sandy soils, together creating an impression of wooded farmland in some areas.
3.89 The overall CQC assessment (1990-98) for the Vale of York indicates that although patterns of change are mixed, it has been classified as predominantly inconsistent change due to the more extensive changes associated with agriculture and development. The 1999-2003 CQC overall assessment classifies The Vale of York Joint Character Areas (JCA) as a neglected area. The agricultural character remains weakened, and there is little evidence of restoration of boundary, historic or semi-natural features. There is some evidence of strengthening of woodland character, however, given the pressure of development the overall JCA is judged to have remained weakened or possibly diverging,
Humberhead Levels (JCA39):
3.90 Underlying features:
A flat landscape occupying the area of the former pro-glacial Lake Humber;
Very low-lying, commonly at or below mean high-water mark;
Surface geology of drift deposits, including glacial tills, clays, peat, sand and gravel and wind-blown sand, giving local variations in character;
Broad floodplains of major navigable rivers draining to the Humber Estuary with extensive areas of washlands and some alluvial flood meadows; and
Essentially flat, very open character with occasional rising ground formed by ridges of sand and outcrops of Mercia Mudstone.
3.91 Cultural elements:
Widespread evidence of drainage history in rivers, old river courses, ditches, dykes and canals; and
Important areas of historic landscape such as the more enclosed agricultural landscape at Fishlake, the remnant open fields of the Isle of Axholme and the unique ‘cable’ landscape of Thorne.
3.92 Changing elements:
Rich high-quality land which is intensively farmed and includes substantial areas of warp land;
Very large open fields divided by dykes, with relatively few hedgerows or field trees;
Peat bogs of international ecological and historical importance, which are widely exploited for commercial peat extraction;
Areas of remnant heath and large, isolated conifer plantations on poor sandy soils; and
Modern motorways on embankments and large installations, notably power stations, which are often prominent in the flat landscape.
3.93 The overall CQC assessment (1990-98) for the Humberhead Levels shows that although woodland change is small and consistent with character, the changes in agriculture and development, together with semi-natural processes, suggests that these more extensive changes are inconsistent overall. The 1999-2003 CQC overall assessment classifies The Humberhead Levels Joint Character Areas (JCA) as a diverging area. Changes in agricultural character and development patterns continue to transform the area; these changes are not outweighed by enhancements in woodland and management of historic features.
Part II Scoping Report (Draft)3 FINAL 38

EAST RIDING OF YORKSHIRE COUNCIL –
SUSTAINABILITY APPRAISAL OF THE ALLOCATIONS DEVELOPMENT PLAN DOCUMENT
Part II Scoping Report
Holderness (JCA40):
3.94 Underlying features:
Low-lying, predominantly flat or gently undulating plateau jutting into the North Sea and dividing it from the Humber Estuary; and
Glacial landscape of till deposits, gravels and alluvium over chalk, with many glacial features such as drumlin mounds, hummocky terrain, moraine-like ridges and kettle holes.
3.95 Cultural elements:
Winding roads linking dispersed villages and hamlets, with village churches providing important landmarks in the generally flat landscape; and
Vernacular buildings of red brick and red pantile with some older buildings, especially churches, built in limestone. Use of cobbles near the coast.
3.96 Changing elements:
Rapidly eroding, soft clay, cliff coast;
High-quality agricultural land used predominantly for large-scale arable cultivation and intensive livestock farming;
Fields bounded by ditches in some areas, especially the floodplain of the river Hull, but by hedges on higher ground;
Sparse tree and woodland cover leading to a generally open landscape with long views – enclosed by the wolds to the north and west; and
Highly fragmented, though locally prominent, remnants of semi-natural vegetation including Hornsea Mere and various carr, swamp and damp grassland habitats.
The overall Countryside Quality Counts (CQC) assessment of change in the character of the English Landscape (1990-98) for the Holderness area shows marked changes in woodland, agriculture and development. The latter two are generally inconsistent with existing character, while woodland change has been more positive. The 1999-2003 CQC assessment classifies Holderness Joint Character Areas (JCA) as a neglected area. Although woodland character has been strengthened, slow changes in agricultural landscape, in river and coastal elements and more marked changes in development patterns are tending to transform the character of the area. The overall character therefore remains weakened or neglected.
The Humber Estuary (JCA41):
3.97 Underlying features:
Expansive, flat, low-lying, sometimes remote estuarine landscape dominated by the Humber and with an ever-changing character due to tidal influences; and
Dominance of sky and open views over the estuary, mudflats and salt marshes, where flood embankments allow.
3.98 Cultural elements:
Urban and industrial influences especially around Hull and on the south bank.
3.99 Changing elements:
A predominantly reclaimed, formerly inter-tidal landscape of rectilinear fields with boundaries formed by dykes, drains and embankments;
A landscape of mainly arable farming with some conspicuous areas of market gardening, particularly around Hull; and
Part II Scoping Report (Draft)3 FINAL 39

EAST RIDING OF YORKSHIRE COUNCIL –
SUSTAINABILITY APPRAISAL OF THE ALLOCATIONS DEVELOPMENT PLAN DOCUMENT
Part II Scoping Report
Part II Scoping Report (Draft)3 FINAL 40
Internationally important coastal mudflats and other wetland and coastal habitats, including the Spurn peninsula.
3.100 The overall CQC assessment (1990-98) for the Humber Estuary shows that while changes are small, patterns are mixed with trends in agriculture and development that are inconsistent with the character area description; and woodland and semi-natural being more consistent. The 1999-2003 CQC assessment classifies the Humber Estuary Joint Character Areas (JCA) as a diverging area. Woodland is probably of secondary importance for overall character and the judgement that the JCA shows changes inconsistent with character is based on agriculture and settlement, both of which continue to diverge from the landscape visions suggested for the area. River and coastal features, which are also a key theme, show no sign of significant enhancement
3.101 A Landscape Character Assessment for the East Riding of Yorkshire area was published in November 2005. The Assessment identifies and describes 23 landscape character types within the East Riding (see Figure 3.5), and makes judgements about the quality, value, sensitivity and capacity for new development in each landscape character area identified.
3.102 According to this study the East Riding has a varied landscape and quality of the landscape across the district also varies. Several high quality landscapes have been identified, including the Yorkshire Wolds, the Derwent River corridor, Thorn and Hatfield Moors in the Humberhead levels, Sunk Island Farmland in the Humber Estuary and the two heritage Coasts, namely Spurn Point and the Flamborough Coast. There are areas within landscape character types that have been identified as of poor quality. These areas tend to be pockets within character areas where landscape character has been affected by development and the introduction of detractors. Therefore areas of poor landscape quality tend to be located on the edge of settlements but may also be in rural locations where industrial development has taken place. The remainder of the landscape of the East Riding is assessed to be ordinary or good.

EAST RIDING OF YORKSHIRE COUNCIL –
SUSTAINABILITY APPRAISAL OF THE ALLOCATIONS DEVELOPMENT PLAN DOCUMENT
Part II Scoping Report
Figure 3.4 – Countryside Character Areas
Source: East Riding of Yorkshire Landscape Character Assessment 2005
Part II Scoping Report (Draft)3 FINAL 41

EAST RIDING OF YORKSHIRE COUNCIL –
SUSTAINABILITY APPRAISAL OF THE ALLOCATIONS DEVELOPMENT PLAN DOCUMENT
Part II Scoping Report
Part II Scoping Report (Draft)3 FINAL 42
Figure 3.5 - Landscape Character Assessment
Source: East Riding of Yorkshire Landscape Character Assessment 2005

EAST RIDING OF YORKSHIRE COUNCIL –
SUSTAINABILITY APPRAISAL OF THE ALLOCATIONS DEVELOPMENT PLAN DOCUMENT
Part II Scoping Report
Geology 3.103 The geology of the area consists of Triassic red-beds in the east, Jurassic clays, limestones and
sandstones, and Chalk Wolds, with a covering of Quaternary boulder clay in Holderness.
3.104 There are a number of Sites of Special Scientific Interest (SSSI) designated for their geological or biological, or both geological and biological, features in East Riding. Sites designated for their geology are:
Dimlington Cliff;
Enthorpe Railway Cutting;
Everthorpe Quarry;
Kelsey Hill Gravel Pits;
Melton Bottom Chalk Pit;
Rifle Butts Quarry;
Roos Bog;
Skipsea Bail Mere; and
Withow Gap, Skipsea.
3.105 There are a number of declared Regionally Important Geological Sites (RIGS) within the East Riding of Yorkshire area:
Figure 3.1 – Regionally Important Geological Sites
Arras Road Chalk Pit - Turonian Coniacian Chalk; Kiplingcotes Marls, Arras Flint and Enthorpe Marls
Kiplingcotes Station Quarry - Turonian Chalk; type section of Kiplingcotes Flints and Marls; site of large ammonites found by C W & E V Wright; former SSSI
Atwick TA191513 - 12.64ha elongated area of alluvium exposed in cliff section
Lambwath Mere near Withernwick - relatively complete Holocene record
Barmston Mere near Skipsea early- to mid-Holocene record
Langtoft East Chalk Pit - tilted Burnham Chalk Formation
Bessingby Chalk Pit - Lower Campanian Chalk; former SSSI
Langtoft West Chalk Pit - the junction between the Burnham Chalk Formation and the Flamborough Chalk Formation
Bishop Wilton Chalk Pit - Cenomanian Turonian Chalk
Little Weighton to Willerby railway cutting - Chalk (added 1998 - including a 50m boundary around the site)
Bracken Quarry, Bainton - base of the Flamborough Chalk Formation
Mappleton TA218448 - late glacial to early/mid holocene environmental history
Brandesburton Gravel Pits - Devensian sands and gravels
Mappleton Sea defences - boulders from Scandinavia forming a useful teaching resource (added July 2000) Coastal exposure, good public access
Branmere near Aldbrough - late glacial deposits Middleton on the Wolds Chalk Pit - Burnham Chalk Formation; type section of the Middleton Marl; used to be worked by hand; former SSSI
Brantingham Dale - dry valley Nafferton Grange Chalk Pit- Lower Campanian Chalk; youngest in situ exposed in Yorkshire
Part II Scoping Report (Draft)3 FINAL 43

EAST RIDING OF YORKSHIRE COUNCIL –
SUSTAINABILITY APPRAISAL OF THE ALLOCATIONS DEVELOPMENT PLAN DOCUMENT
Part II Scoping Report
Brigham Quarry - Devensian sands and gravels Newbold Wold Chalk Pit - Turonian Chalk; Deepdale Marls
Burdale Quarry - Turonian Chalk North Cave Wetlands - 100 acres of former gravel pits now owned by the Yorkshire Wuildlife Trust - Lowest Jurassic and possibly uppermost Triassic under Quaternary gravels
Cess Dell near Thorpe Garth - kettle hole North Grimston Quarries - Upper Jurassic - Corallian limestones: Malton Oolite and Urchin Dirt Beds
East Leys Pit - Lower Campanian Chalk Pocklington Beck - mid- to late-Holocene record
Eppleworth Quarry - Coniacian Chalk; Eppleworth Flint and De La Pole Flint; also Quaternary till, loess and head deposits
Redcliff, North Ferriby - moraine and lacustrine sediments of Lake Humber, late Devensian. Public access but may be hazardous
Fairy Stones, Burdale - chalk fault breccia Routh Quarry - late-glacial/Holocene sequence;
Goodmanham Channel - glacial overflow channel Ruston Parva Chalk Pit - Lower Campanian Chalk
Goodmanham Black Band exposure - Cenomanian-Turonian boundary
Sand le Mere beach - late glacial to early-Holocene and sea level change
Gransmoor Quarry - Devensian Flandrian mere deposits filling a kettle hole
Sands Top Quarry, North Newbald -Cave Oolite, Middle Jurassic, and karst features
St. Austin's Stone, Drewton - chalk fault breccia Hornhill Top Quarry, near Bainton - top of the Burnham Chalk Formation
Hornsea Mere - geomorpholgy - last of the Devensian Flandrian meres of Holderness
Seaton TA161464 - Late-Devensian valley connecting Hornsea Mere to River Hull valley
Hornsea Old Mere Skipsea Bail Mere TA158558- dry mere with pollen record of lake sediments from the late Devensian (circa 12,000 BC)
Hotham Crossroads Pits - Rhaetian to Hettangian Skipsea Low Mere - continuous pollen record for late-glacial, early- and mid-Holocene
Snevver Scar - glacial drainage channel Humber Bridge Country Park - Turonian Chalk; Barton Marls; former SSSI
Jarret's Ings near Brigham - late glacial to recent Holocene
Sunderland Bottom - part of floodplain of the upper Keyingham valley
Weaverthorpe East Pit - tilted Coniacian Chalk Kelsey Hill Gravel Pits (I & II) - late Devensian glacial outwash, yielding mammalian bones
Keyingham Gravel Pits Willerby Railside Pit - Coniacian Chalk
Keyingham Gravel Pits Willow Garth - (added 1995) Late glacial to early Flandrian pollen record
Kilnwick Percy Quarry - Turonian Chalk; Ulceby Marl & Ulceby Oyster Bed
Wold Newton Monument - brick obelisk at the site of meteorite impact of 13th December 1795; former SSSI
Kiplingcotes Nature Reserve - Turonian Chalk; Deepdale Marls
Part II Scoping Report (Draft)3 FINAL 44

EAST RIDING OF YORKSHIRE COUNCIL –
SUSTAINABILITY APPRAISAL OF THE ALLOCATIONS DEVELOPMENT PLAN DOCUMENT
Part II Scoping Report
Biodiversity, Flora and Fauna 3.106 The East Riding is very rich in biodiversity. Well known examples of important habitats include:
the ancient flood meadows of the Lower Derwent Valley;
the chalk grasslands of the Wolds;
the wetlands of the River Hull valley;
the remnants of lowland heath in the eastern Vale of York;
the mudflats and saltmarshes of the Humber Estuary;
the sand dunes of the Spurn Peninsula;
the towering chalk cliffs of the Flamborough Headland; and
the offshore chalk reef habitats of the North Sea.
3.107 The varied habitats of the East Riding support a range of important species, including:
strongholds for water vole and otter;
significant over-wintering populations of golden plover, black tailed godwit and curlew;
breeding bittern and avocet;
important farmland bird populations including grey partridge, tree sparrow, yellowhammer and skylark;
populations of great crested newt, common toad and grass snake;
migratory fish including sea and river lamprey, Atlantic salmon, eel and smelt;
the UK’s largest mainland seabird nesting colony with gannets, kittiwakes, razorbills and puffins;
rare plants including greater water parsnip and purple milk vetch;
a range of rare invertebrate; and
significant local species such as barn owl, brown hare and others.
3.108 The Council is currently in the process of developing a Local Biodiversity Action Plan (LBAP). The LBAP emphasises the importance of habitat networks (i.e. ‘space for nature’) and a wider multi-functional green infrastructure (i.e. ‘space for both nature and people’) within the Authority. Strengthening and expanding green infrastructure in the East Riding has a key role in facilitating the movement of species between site based biodiversity in areas where semi-natural habitats are fragmented. This is essential to allow species to colonise new sites or replacement sites as climate conditions change and to allow genetic exchange between species meta-populations. Habitat networks help to reduce isolation of genetic populations of species and to allow for expansion.
3.109 In addition to important habitats and species, the East Riding also has a wide range of designated sites from the national to the local level. In June 2009, East Riding had 46 SSSI covering about 2% (4,150 hectares) of the County. There are also five Special Areas of Conservation (SAC) sites, five Special Protection Areas (SPA), two European Marine Sites and two Ramsar sites within the East Riding. SSSI sites designated for their biology or both biology and geology include:
Table 3.2 – Sites of Special Scientific Interest
Allerthorpe Common Flamborough Railway Newbald Becksies
Part II Scoping Report (Draft)3 FINAL 45

EAST RIDING OF YORKSHIRE COUNCIL –
SUSTAINABILITY APPRAISAL OF THE ALLOCATIONS DEVELOPMENT PLAN DOCUMENT
Part II Scoping Report
(biological) Cutting (biological) (biological)
Fordon Chalk Grasslands (biological)
Newton Mask (biological) Barn Hill Meadows (biological)
Beckhead Plantation (biological)
Hoddy Cows Spring (biological)
Pocklington Canal (biological)
Hornsea Mere (biological) Pulfin Bog (biological) Bishop Wilton Deep Dale (biological)
Horse Dale And Holm Dale (biological)
River Derwent (biological) Boynton Willow Garth (biological and geological)
Brantingham Dale (biological)
Hotham Meadow (biological)
River Hull Headwaters (biological)
Bryan Mills Field (biological)
Humber Estuary (biological and geological)
South Cliffe Common (biological)
Burton Bushes (biological) Keasey Dale (biological) The Lagoons (biological and geological)
Kiplingcotes Chalk Pit (biological)
Tophill Low (biological) Cinquefoil Brow And Wood Dale (biological)
Cottam Well Dale (biological)
Lambwath Meadows (biological)
White Carr Meadow (biological)
Derwent Ings (biological) Leven Canal (biological) Wyedale (biological)
Melbourne And Thornton Ings (biological)
Drewton Lane Pits (biological and geological)
Millington Wood And Pastures (biological and geological)
Flamborough Head (geological and biological)
3.110 SAC sites are:
Flamborough Head;
Humber Estuary;
Lower Derwent Valley;
River Derwent; and
Thorne Moor.
3.111 Ramsar sites are:
Lower Derwent Valley; and
Humber Estuary (also in N. Lincolnshire).
3.112 Special Protection Areas (SPA) in the East Riding are:
Lower Derwent Valley;
Hornsea Mere;
Flamborough Head and Bempton Cliffs;
Humber Flats, Marshes and Coast Phase 1; and
Thorne and Hatfield Moors.
Part II Scoping Report (Draft)3 FINAL 46

EAST RIDING OF YORKSHIRE COUNCIL –
SUSTAINABILITY APPRAISAL OF THE ALLOCATIONS DEVELOPMENT PLAN DOCUMENT
Part II Scoping Report
Part II Scoping Report (Draft)3 FINAL 47
3.113 There are three National Nature Reserves (NNRs): Lower Derwent Valley, Spurn and a small part of Humberhead Peatlands in the East Riding managed by Natural England. There are also 13 Local Natural Reserves (LNRs) in the East Riding:
Danes Dyke; Flamborough
Eastrington Ponds, Eastrington;
Flamborough Outer Headland;
South Landing, Flamborough;
Howden Marsh, Howden;
Southorpe Bridge, Hornsea;
Sigglesthorne Station, Great Hatfield;
Humber Bridge Country Park, Hessle;
Hudson’s Way, Market Weighton;
Broompark and Mayfield, Goole;
Millington Wood;
Sugar Mill Ponds, Rawcliffe; and
Beverley Parks.
3.114 In addition to statutory designated sites, there is a large number of non-statutory designated sites, known as Local Wildlife Sites (LWS). LWS (formerly known as Sites of Interest for Nature Conservation (SINCs) are present within all areas of the East Riding and represent a comprehensive network of sites of substantive nature conservation value. Currently there are over 600 candidate LWS that are being surveyed on an ongoing basis to establish a sound register of these sites. Some may be removed from the register and other new sites may be added following survey.
3.115 The area’s wildlife richness and diversity is under pressure and some loss has already occurred. Once-common plants and animals are now seldom seen and others have been lost from the area altogether. Some natural habitats that used to be widespread are now limited to isolated fragments. The main reasons for this are development and an intensive cultivation of land, which now has a sparse tree and woodland cover.

EAST RIDING OF YORKSHIRE COUNCIL –
SUSTAINABILITY APPRAISAL OF THE ALLOCATIONS DEVELOPMENT PLAN DOCUMENT
Part II Scoping Report
Figure 3.6 - Statutory Protected Areas
Source: East Riding of Yorkshire Council 2010
Part II Scoping Report (Draft)3 FINAL 48

EAST RIDING OF YORKSHIRE COUNCIL –
SUSTAINABILITY APPRAISAL OF THE ALLOCATIONS DEVELOPMENT PLAN DOCUMENT
Part II Scoping Report
Cultural Heritage 3.116 The East Riding is rich in heritage, as shown in Figure 3.7 below. The Council is responsible for
the protection of the built heritage, which includes more than 2,500 buildings listed for their special architectural or historic interest (Listed Buildings) and 99 Conservation Areas. The Conservation Areas designated as per July 2009 are listed in Appendix A.
3.117 Listed Buildings are so designated due to their national importance. There are 2,408 Listed Buildings in the East Riding, of which 103 (4.3%) are Grade 1, 162 (6.7%) are Grade II*, 2,116 (88%) are Grade II. The remaining listed buildings are Grades B, C and DL.
3.118 There are over 400 medieval villages and hamlets in the East Riding many of which survive as settlements today with recognisable historic cores. A particularly distinctive feature of many villages in the East Riding is the presence of a village pond and the absence of curbing.
3.119 The Community Plan also has a target of facilitating three village design statements per year. These describe the local communities’ views on what is special or distinctive about the village. These can become material considerations in the statutory planning process.
3.120 There are around 30 historic towns in the East Riding, the best known of which is Beverley whose centre contains sensitive archaeological areas of major importance. Bridlington and Brough also contain a rich archaeological heritage and there are a number of smaller market towns with surviving medieval cores including Driffield, Hedon, Howden, Market Weighton, Pocklington and South Cave.
3.121 The area has a rich base of archaeological assets including around 350 Scheduled Monuments (SMs) and many other ‘unscheduled’ archaeological remains, much of which could be of national importance.
3.122 The East Riding also has seven Registered Parks and Gardens and the Registered Battlefield at Stamford Bridge.
3.123 East Riding’s historic environment is one of its greatest assets, which creates a rich and diverse historic landscape and townscape. This enriches the local economy by attracting tourists and making it an attractive place in which to live.
Part II Scoping Report (Draft)3 FINAL 49

EAST RIDING OF YORKSHIRE COUNCIL –
SUSTAINABILITY APPRAISAL OF THE ALLOCATIONS DEVELOPMENT PLAN DOCUMENT
Part II Scoping Report
Figure 3.7 - Landscape and Heritage Assets and Designations in East Ridings
Source: East Riding of Yorkshire Council 2010
Part II Scoping Report (Draft)3 FINAL 50

EAST RIDING OF YORKSHIRE COUNCIL –
SUSTAINABILITY APPRAISAL OF THE ALLOCATIONS DEVELOPMENT PLAN DOCUMENT
Part II Scoping Report
Waste Management 3.124 The total volume of municipal waste produced in East Riding has decreased since 2007. The
proportion of this municipal waste which was sent to landfill has decreased slightly over this period, with an increase in the volume of recycled and composted waste. These trends broadly reflect those observed for England as a whole. However, the proportion of waste sent to landfill is significantly higher in East Riding than the average proportion sent to landfill across England.
3.125 36% of the municipal waste was recycled or composted. This is higher than the regional average of 30% and the national average of 34%.
3.126 The volume of household waste produced per capita in East Riding has reduced since 2006/07. The proportion of this waste which has been diverted from landfill has also reduced but is higher than that for England as a whole.
3.127 Between 2007/2008 69% of household waste went to landfill but East Riding recycled and composted 31% of household waste. This local percentage of waste recycled and recovered is lower than the regional and national average of 34%.
3.128 Within the East Riding, refuse including brick rubble, engine oil, garden refuse, household chemicals and carpets can be disposed of at a number of household waste recycling sites (HWRS) which are provided by the Council. In addition, more general household items such as glass, paper, cans and textiles can be taken to a number of local recycling facilities. Recycling facilities of 'white goods' such as fridges and cookers are provided by ERYC through a bulky item collection service. Currently, there are 83 East Riding of Yorkshire recycling sites and kerbside collection is almost 100% across the District.
3.129 The main sites are operated by Waste Recycling Group on behalf of the council at the following locations: Airmyn, Beverley; Carnaby, Driffield, Hornsea, Market, Pocklington, Preston, Withernsea.
Specific Baseline Information for Major Haltemprice Settlements and Principal Towns within East Riding
3.130 This section presents the baseline characteristics of the East Riding’s larger settlements which represent key areas of change as identified in the emerging Core Strategy. Most new development will be focused within and around those settlements, as they provide good access to key services and facilities andpublic transport services, as well as offering signifi economic opportunities and supporting wider rural catchment areas. New development within the existing urban centres will also provide opportunities for tackling the existing issues of deprivation.
The Major Haltemprice Settlements 3.131 Around 55,000 people (18% of the East Riding population) live in the villages immediately west of
Hull. These comprise Cottingham, Anlaby, Willerby, Kirkella and Hessle. These settlements have high population concentrations and are well located in close proximity to Hull, thus benefiting from the services and facilities on offer here. They are also well connected to Hull by public transport, particularly in Cottingham and Hessle. However, there is a significant deficit of affordable housing in the settlements, and the Primary Care Trust has identified constraints in the health provision.
3.132 The settlements are commonly characterised by relatively high levels of skilled employees, who generally commute to either Hull or within East Riding.
Part II Scoping Report (Draft)3 FINAL 51

EAST RIDING OF YORKSHIRE COUNCIL –
SUSTAINABILITY APPRAISAL OF THE ALLOCATIONS DEVELOPMENT PLAN DOCUMENT
Part II Scoping Report
3.133 Much of the land between the settlements is classed as Grade 2 agricultural land, and is valued for its role in avoiding coalescence between the settlements. There are also a large number of areas designated and protected for their environmental value. The area around Cottingham, Anlaby and Willerby is a Groundwater Source Protection Zone and much of the area is at risk of from flooding. However, there exists a potential for mitigating against future flood risk through the creation of floodwater attenuation basins between the settlements.
3.134 Their close proximity to Hull means that the Major Haltemprice Settlements benefit from good transport links, particularly by road, bus and railway. However, the A164 and A63 (T) are currently near full capacity during peak periods thereby resulting in congestion.
Beverley 3.135 Beverley is a historic market town with a high quality built environment and the designated SSSI at
Burton Bushes, making it a popular tourist destination. Household surveys show that residents of Beverley have a high level of satisfaction with the town.
3.136 The town centre healthcheck vitality and viability index has noted that the condition of the town stayed relatively stable between 2001 and 2006. Since 2006, recent improvements in leisure and sports facilities and a feeling of safety within the town may have increased Beverley’s scoring. However, this is likely to have been counteracted by the lack of good quality hotel accommodation and recent increases in the number of vacant retail units. Beverley has a good diversity of town centre land uses and the second largest amount of retail floorspace in the East Riding after Bridlington, many of its shops are independents, thus contributing to the distinctive nature of the town. This, plus the markets held in the town and the pedestrianisation of some town centre streets, serves to promote pedestrian flows, although a slight drop in footfall has been noted in recent years. The vacancy rate of premises within Beverley town centre in 2009 was 9% - an increase since 2001 but still below the national average of 10%.
3.137 Strong links between Beverley and Hull mean that demand for housing is high, thereby elevating house prices and creating pressure for greenfield development adjacent to and within the town. There thus exists a large affordable housing deficit and deprivation in certain parts of the town is high.
3.138 In 2009, Beverley has the highest concentration of jobs within the East Riding, particularly public sector (including local authority) employment and manufacturing. The 2009 Town Centre and Retail Study for the East Riding identified Beverley as a Principal Centre as a result of its existing high number of retail and service outlets. There is currently a high demand for office and retail space. Flemingate and Grovehill have been identified as areas for potential development opportunities.
3.139 Parts of Beverley are at risk of flooding (Flood Zone 3).
3.140 Beverley suffers from congestion, particularly within the town centre. However, a number of transport schemes have been planned for the town, in order to alleviate this, most notably a Southern Relief Road and Park and Ride facility. Beverley acts as a transport hub with a railway station and a radial network of bus services into the surrounding area. In particular, the town benefits from good bus and rail links to Hull, Scarborough and other towns within the East Riding, which may be further enhanced by the potential reopening of the Beverley to York railway.
3.141 The Town Centres and Retail Study Update 2010 identified that Beverley has the highest floorspace capacity of any centre in the Study, with the capacity to support new development of between 0.7 and 1.7 hectares. However, potential development opportunities within Beverley are constrained, principally as a result of the historic and compact nature of the centre’s built environment. This report also identified a need for additional policing of youth activity, especially at weekends in order to minimise antisocial activity, a lack of leisure facilities and a limited evening economy except for pubs. Additionally, the need to boost tourism in the town has been identified.
Part II Scoping Report (Draft)3 FINAL 52

EAST RIDING OF YORKSHIRE COUNCIL –
SUSTAINABILITY APPRAISAL OF THE ALLOCATIONS DEVELOPMENT PLAN DOCUMENT
Part II Scoping Report
Bridlington 3.142 Bridlington is the largest town in the East Riding, and is an East Coast resort with strong heritage
and convenient links to the Flamborough Head and Bempton Cliffs Heritage Coastlines and Sewerby Hall, and as such is partially reliant on its tourist industry.
3.143 House prices in Bridlington are generally low. The town currently suffers from a housing shortfall, particularly of affordable housing. Many younger people move out of Bridlington when they are able, leaving the town with a skewed population profile with more older residents.
3.144 The decline of the traditional seaside resort and the dominance of low-skilled jobs and low economic activity/high unemployment rates mean that there are some deprived areas within Bridlington which are in particular need of regeneration. There are a number of industrial estates within the town, supported by the large Carnaby estate on the outskirts of Bridlington.
3.145 Bridlington is surrounded by Grade 2 agricultural land which also serves as a ‘green buffer’ between the town and Sewerby. Other environmental assets in Bridlington include the SSSI and SAC from North Sands through Sewerby Rocks and around Flamborough Head and Scheduled Monuments at Hilderthorpe, Sewerby and in the Old Town of Bridlington itself.
3.146 The majority of Bridlington is located in low risk flood zones. However, given the town’s close proximity to the sea, coastal management is required to reduce the rate of coastal erosion, particularly in the light of the increase in extreme weather events as a result of projected climate change. There is a groundwater source protection zone in the north west of the town. The environmental quality of Bridlington is reduced by seasonal surges in traffic levels, predominantly as a result of summer tourism. A Park and Ride facility is being constructed in order to help reduce this effect.
Driffield 3.147 Driffield is a key town within the Yorkshire Wolds, with close links to, amongst other attractions,
the Driffield Navigation and the River Hull Headwaters SSSI. Much of the town is designated as a Conservation Area and its traditional charm has been maintained. However, the quality of the open spaces and landscaping within the town is considered to be poor.
3.148 Driffield is the smallest of the Principal Towns within the East Riding, is more rural in nature and is not characterised by any particular areas of deprivation. Despite this, the town suffers from a deficit of affordable housing and the outmigration of younger portions of the population.
3.149 Driffield is an integral part of the River Hull employment corridor and was identified as a Principal Centre in the East Riding Town Centre and Retail Study undertaken in 2009, due to its diverse mix of retail outlets. Employment opportunities within the town are predominantly agricultural and manufacturing with a large industrial estate is located at Kelleythorpe, However, a large proportion of residents of Driffield commute to higher paid employment opportunities elsewhere in the District.
3.150 Driffield is situated on the edge of the Yorkshire Wolds, an area designated as being of high landscape value with high quality rolling open farmland. There are a number of SSSIs located in the vicinity of the town, including the River Hull Headwaters which is assessed as being in an ‘unfavourable condition’. Scheduled Monuments are located to the north and west of the town, with Grade 2 agricultural land to the north and east. There is a substantial amount of previously developed land available for development at Alamain Barracks. However, greenfield allocations around the town may need to be considered as well to accommodate all of the town’s likely housing requirement, as the available previously developed land is finite. The southern part of Driffield is also located within a high flood risk area.
3.151 Driffield is located on an important north-south route from Hull to North Yorkshire and as such benefits from good bus and rail links, particularly to Bridlington, Hull, Scarborough and Beverley.
Part II Scoping Report (Draft)3 FINAL 53

EAST RIDING OF YORKSHIRE COUNCIL –
SUSTAINABILITY APPRAISAL OF THE ALLOCATIONS DEVELOPMENT PLAN DOCUMENT
Part II Scoping Report
Accessibility within the town is considered to be fair, with appropriate levels of provision of non-motorised modes of transport including pedestrian networks, bus and rail services. However, Driffield town centre does suffer from some congestion.
3.152 The Town Centres and Retail Study Issues and Recommendations Report 2009 identified that the town currently has good physical capacity for growth but that this should be carefully located and designed so as to ensure that new retail developments do not threaten existing shops or markets in the town centre. This report also identified a need for additional policing of youth activity, especially at weekends in order to minimise antisocial activity. There also exists a potential to enhance the tourist opportunities within Driffield, and the leisure and entertainment facilities.
Goole 3.153 Goole town has a poor image and suffers from low quality housing and a disproportionately high
number of terraced properties, particularly in its most deprived areas. A Housing Market Renewal area has been identified and the poor social quality of the town is being addressed.
3.154 The town includes a high concentration of jobs with strong employment prospects, particularly as a result of the local port and transport links. However, the majority of these jobs are low paid and low skilled occupations. Goole also suffers from insufficient business stock and low levels of self employment.
3.155 The location of Goole is such that the town is at a high risk from flooding and extreme events as a result of climate change. This is exacerbated by the flat low lying land that surrounds the town. The land to the north and south of Goole is predominantly Grade 1 and to the west is Grade 2. There are a number of environmentally designated areas in the town and its environs, most notably the River Don, Ouse and the Humber Estuary SSSI and two local wildlife sites located to the north east of the town.
3.156 Goole is located on the E20 east-west route from Hull to Liverpool and as such benefits from good multi-modal transport links by water, rail and road. However, it does suffer from limited bus services to adjoining settlements and rural areas.
Part II Scoping Report (Draft)3 FINAL 54

EAST RIDING OF YORKSHIRE COUNCIL –
SUSTAINABILITY APPRAISAL OF THE ALLOCATIONS DEVELOPMENT PLAN DOCUMENT
Part II Scoping Report
4. Key Sustainability Issues Introduction
4.1 The requirement to identify sustainability problems and issues arises from the SEA Directive, where the Environmental Report required under the Directive should include:
‘any existing environmental problems which are relevant to the plan or programme including, in particular, those relating to any areas of a particular environmental importance, such as areas designated pursuant to Directives 79/409/EEC and 92/43/EEC’ (Annex I (d))
Methodology 4.2 Analysis of key sustainability issues relevant to East Riding area has been carried out. This work
has been based on consultation and discussion with key council officers, review of previous SA work, the review of relevant plans and programmes, and analysis of the baseline data. The analysis of sustainability issues has been iterative and is on-going. As the SA develops with further stakeholder involvement the analysis of key issues is likely to evolve. This will in turn influence the development of the baseline and the SA framework, in particular the identification and selection of indicators and targets.
4.3 Table 4.1 below presents the results of the preliminary analysis of key sustainability issues.
Table 4.1 - Key Sustainability Issues
No Key Issues Implications for Allocations DPD
SEA Topic
1
Local economy
The East Riding’s Gross Value Added (GVA) is the lowest per capita of any of the Humber authority areas and below the regional and national averages.
The DPD should ensure that an adequate number of sites for employment and mixed uses is identified and that they are located where they are likely to have most effect in improving the local economy.
Material Assets,
Population
2
Weaknesses of local employment market
Generally the area has a relatively low level of unemployment: 4% in 2008. Challenges faced by different areas can be specified as follows: there is lack of jobs opportunities in rural centres; most jobs in coastal areas have a seasonal character and there is insufficient demand for highly-skilled professionals in urban areas. Some wards have a high number of income support claimants.
See recommendation for the issue on Local economy above.
(The Core Strategy should also include a criteria based policy to help determine small employment proposals in coastal and rural areas.)
Population
3
Unbalanced demographic profile
The East Riding is characterised by:
A high percentage of pensionable age people as a result of: declining birth rates and growing numbers of retirees moving to the region (although there are signs this may be slowing);
Rising percentage of population aged 80+;
Shrinking pool of economically active residents (25-44 age group).
The DPD should:
Encourage co-location of housing and employment sites, where this is likely to lead to an influx of working age people and young families with children;
Consider the potential additional burden on essential local services in adjacent areas where the proportion of economically inactive population is already high;
Ensure that housing allocations allow for a sufficient percentage of affordable housing to be accommodated in the areas of most need.
Population
Part II Scoping Report (Draft)3 FINAL 55

EAST RIDING OF YORKSHIRE COUNCIL –
SUSTAINABILITY APPRAISAL OF THE ALLOCATIONS DEVELOPMENT PLAN DOCUMENT
Part II Scoping Report
No Key Issues Implications for Allocations SEA DPD Topic
4
Localised deprivation and social isolation
Deprivation levels vary widely across the East Riding area. Very high levels of deprivation are found in some of the larger settlements. For example, Bridlington South, Bridlington Old Town, Bridlington North, Goole and South East Holderness are in the 33% most deprived wards in the country. Parts of areas to the south and west of Bridlington, Withernsea and around Goole are ranked as amongst the 10% most deprived areas in England. Isolated pockets of deprivation are also found in other parts of the area.
The DPD should:
Explore spatial planning options aimed at addressing localised deprivation. Focusing new housing, employment and mixed use development in or adjacent to the areas with significant concentrations of deprivation to help tackle deprivation;
Ensure that housing allocations allow for a sufficient percentage of affordable housing to be accommodated in the areas of most need.
Population, Human Health
5
Housing provision
The AMR indicates that the affordability of housing is an issue across the whole of the East Riding despite the variation in house prices, with the average house price in most areas being at least five times the local income. In general, this is a result of there being an incidence of high house prices in the relatively high-income areas (such as in the Pocklington area) but low incomes in those areas where house prices are lower.
Percentage of households priced out of market in East Riding in 2007 ranged from 54% for flats to 86% for detached houses.
There has been a net loss in the socially rented housing stock in the East Riding that provides its primary source of affordable housing.
There is also a lack of sufficient provision for gypsy and traveller pitches.
The DPD should:
Ensure that there is a sufficient number of housing site allocations that are above the relevant threshold for accommodating affordable housing, in particular in the areas where the ratio of income to house is particularly high;
Ensure that site allocations includsufficient provision of pitches for
e
Gypsies and Travellers.
Population, Material Assets
6
Noise pollution
Noise pollution is a major source of annoyance and stress and evidence suggests it may limit children’s learning. It can have a significant effect on the environment and on the quality of life enjoyed by individuals and communities. Different land uses have different sensitivity to noise and can also generate different levels of noise, and therefore, some land uses may not be being compatible with each other.
The DPD should:
Ensure that, wherever practicable, noise-sensitive developments, such as housing, hospitals or schools, are separated from major sources of noise (such as road, rail and air transport and certain types of industrial development);
Ensure that new development thatlikely to be a significant source of noise is not located adjacent
is
to the existing sensitive land uses;
Ensure that noise levels are adequately controlled or reduced when it is not possible to achieve a separation of conflicting land uses.
Population, Human Health
7 hibits
rt to the named above key services is inadequate.
y services people need are
d
ans
t.
Population,
Assets
Accessibility
The rural nature of much of the East Riding inaccess to key services such as employment, education, medical services, shopping and leisure facilities. Provision of public transpo
Sites allocation process should ensure that the keclose by.
Allocation of larger housing and employment sites that can potentially accommodate more development shoulbe encourage close to public transport nodes and in areas where there are plto improve public transport provision. Availability of cycle lanes and walking paths should also be taken into accoun
Material
Part II Scoping Report (Draft)3 FINAL 56

EAST RIDING OF YORKSHIRE COUNCIL –
SUSTAINABILITY APPRAISAL OF THE ALLOCATIONS DEVELOPMENT PLAN DOCUMENT
Part II Scoping Report
No Key Issues Implications for Allocations SEA DPD Topic
Linkages and integration wi
th the LTP should be fully explored.
8 interlands
t
ultural
rofile and built environment in village communities.
n of
s that would pport rural employment.
Population,
Assets
Changing character of traditional village life
Many dormitory villages exist within the hof Hull, York and Doncaster. These are economically linked to the urban areas and mosare expanding to accommodate migration from neighbouring urban centres. This leads to changeof traditional lifestyle (e.g. decline in agricactivities and fishing), and emergence of communities that are not self-sufficient in providing local jobs and services, with associated changes to the socio-economic p
The DPD should ensure the allocatiosites is in accordance with the LDF settlement hierarchy and encourage allocation of employment sitesu
Material
Vulnerability and weaknesses of tourism sect
Economic dependence on the tourist industryEast Riding, particularly the coastal area, is increasing. Physical factors, such as remoteness of the area, coastal erosion and frequent stormput limits on the development of the industry. Investments in tourist infrastructure rather than in services for local residents and the seasonal type of jobs associated with the tourism indus
or
in
s,
try reduce the overall sustainability of the region.
ke
raft
cess, Rights f Way Improvement Plan.
Population
The DPD production process should taaccount of the recommendations with regard to future development in the coastal areas set out in the HumberEstuary Coastal Authorities Group Flamborough Head to Gibraltar Point DSMP2, East Riding Integrated Coastal Zone Management Plan, Climate Change Strategy and Countryside Aco
Material Assets,
9 els
high fear of crime exists in a number of areas. with the aim to regenerate them.
Population Fear of crime
Although the East Riding has relatively low levof crime compared to the national average, a disproportionately
The DPD may have indirect positive effects on reducing the levels of the perception of crime by focusing new development in areas of high deprivation
10 ith
e largely rural nature of much of the East Riding.
t to more sustainable transport modes.
A
Population
High levels of car usage
Substantially higher than the national average, w75% of households owning at least one car and the proportion rising. Car dependency is primarily due to th
The DPD should give preference to development along the existing public transport corridors and confluence ofemployment, housing and services.
Linkages and integration with the LTP should be fully explored to promote a modal shif
ir, ClimaticFactors,
11
ated GHG emissions and
d
strial and commercial sector and road
dland cover is less than the national average.
mplications for ‘High levels of car
carbon
damaging to the existing carbon sinks.
Population
Growing transport-rellack of carbon sinks
Total CO2 emissions in 2006 showed a 17% increase from 2005 levels, even though annual domestic per capita emissions have decreasefrom 3.4 tonnes to 2.9 tonnes over the same period. This is due to increased CO2 emissions from the indutransport.
The regional and local percentage of woo
See the iusage’.
The DPD should encourage site allocations on the previously developed land and in areas that have a low sequestration potential, avoiding
Climatic Factors,
12
higher than the regional and national average.
ing and
management initiatives.
Population,
Health
Rising amounts of waste
The amount of household waste generated in the East Riding is increasing at a rate of 6% per year.
The percentage of waste recycled and recovered has increased in recent years and is
Although, minimisation of waste may be outside the scope of influence of the Allocations DPD, encouraging more concentrated, compact development within urban areas may help provide greater opportunities for recyclother local sustainable waste
Soil, Water,
Human
13
st and most versatile
st
d
d at of higher
quality where possible.
So al Assets
High amount of beagricultural land
Agricultural sector was historically one of the moimportant sectors in the area, reflecting its rich resources of best and most versatile agricultural
The site allocation process should avoior minimise the loss of best and most versatile agricultural land. Poorer lanshould be preferred to th
il, Materi
Part II Scoping Report (Draft)3 FINAL 57

EAST RIDING OF YORKSHIRE COUNCIL –
SUSTAINABILITY APPRAISAL OF THE ALLOCATIONS DEVELOPMENT PLAN DOCUMENT
Part II Scoping Report
No Key Issues Implications for Allocations SEA DPD Topic
land. Urban extensions and development in the countryside maand.
y lead to the loss of this high quality l
14
from over 15,500 potential contaminated sites.
nities
into productive use where practicable.
Soil, Human Health
Presence of contaminated land
A revised prioritisation exercise identified 550 sites within East Riding where there is considered to bea greater risk of contamination
The DPD should ensure that opportufor tackling the existing problems of environmental pollution are maximisedthrough remediation and aim to bring contaminated land back
15 y showing signs of climate
3.6
hire coast;
ld overload
g and planned developments needing
with aking bodies,
P2, East
ood Risk Management Strategies.
Population,
Fauna, Flora
Adaptation to climate change impacts
East Riding is alreadchange impacts:
Mean sea level has risen by between 1.5 andmm per year (over the last 80 years) on the Humber Estuary and along the Yorks
Rising temperatures observed;
Greater number of wet winter days.
The greater number of wet winter days will lead to decreased infiltration rates, which is likely to causean increase in surface water. This cousewer networks and cause flooding.
The impacts of climate change will continue and will become more and more apparent over the coming decades. These impacts are especially important for planning of coastal development with some existinto review.
Effective response to climate change impacts requires close coordination other relevant plan mparticularly the EA.
The DPD development should take account of the recommendations withregards to future development in the coastal areas set out in Humber Estuary Coastal Authorities Group Flamborough Head to Gibraltar Point Draft SMRiding Integrated Coastal Zone Management Plan, Climate Change Strategy, various Catchment Flood Management Plans and Fl
Climatic Factors, Human Health,
Material Assets,
16
re developments in the flood plain area is critical.
having regard to the
tes allocation process
Assets
High risk of flooding
The Yorkshire and Humber region has the second largest area at risk from flooding in the country as a result of the low-lying and flat landscape as well as changing climate. Effective management of existing and futu
The DPD should ensure that site allocations are made taking into account sensitivity of future land uses and the findings of the forthcoming Strategic Flood Risk Assessment andnational guidance.
The EA should be consulted on this matter during the siwhere necessary.
Human Health, Material
17
d constraints on wind energy
nd of
nergy and reduction of GHG
le
.1 MW is wind energy (end of 2009
d degradation of landscape and visual amenity.
ning
tion of renewable energy schemes.
Landscape, Fauna
Potential for andevelopment
The area holds high potential for wind energy utilisation, which can help meet the regional anational targets for an increase in the use renewable eemissions.
By the end of 2009, installed grid-connected renewable energy capacity in the East Riding totalled approximately 39.1 MW- all of which is wind energy. The total grid connected renewabenergy in the East Riding either with planning permission or operational totals 157.8 MW of which 127figures).
Wind energy developments may be a contentious issue due to perceive
The development of the Allocations DPDshould have regard to Interim PlanDocument on Renewable Energy Developments, and Planning for Renewable Energy Targets in Yorkshireand Humber and other relevant documents when considering potential sites to avoid co-location of conflicting uses and avoid occupation of land thatwas identified as suitable for accommoda
Climatic Factors,
Part II Scoping Report (Draft)3 FINAL 58

EAST RIDING OF YORKSHIRE COUNCIL –
SUSTAINABILITY APPRAISAL OF THE ALLOCATIONS DEVELOPMENT PLAN DOCUMENT
Part II Scoping Report
No Key Issues Implications for Allocations SEA DPD Topic
18
Increasing pressure on environmental resources The area’s natural resources and landscape are under increasing pressure from human activity. Main issues include:
Lowering of water tables by drainage and irrigation techniques (Holderness, Humberhead Levels, Vale of York);
Industrial development affecting sensitive habitats in the Humber Estuary;
Agricultural intensification resulting in removal of hedges, trees, woodland and remaining grasslands as well as polluting surface and ground water (Humber Estuary, Humberhead Levels, Vale of York). This trend has shown some reversal more recently with incentives to move towards environmental stewardship of agricultural land;
Urban fringe development and construction pressures (Holderness, Humberhead Vale of York) having effect similar to agricultural inten
Levels,
sification of habitat
ge
ater run
ses that it enters and possible sewer
this change is increasing overall sustainability.
fragmentation;
Agricultural intensification and urban frindevelopment removes areas of natural drainage; this leads to more surface woff, which can cause pollution of the watercourflooding;
Loss of chalk grassland is resulting in a return of scrub and woodland (Yorkshire Wolds). But
The DPD should ensure that the sites allocation process takes account of the local landscape designation and important landscape features. Allocating uses that may have significant visual effects on the areas of high value should be avoided.
Consideration of natural resource degradation effects should be placed more firmly at the heart of spatial planning policy. The often indirect and longer term nature of such adverse effects requires needs to be more effectively factored in to development strategies and sites allocation in those areas most at risk.
Site allocations process should ensure protection of sites designated for their nature conservation interest, protected species, BAP species and habitats, protection of open countryside and coast, protection of landscape corridors. Habitats fragmentation and disruption of natural processes on the coast should be avoided.
Restriction of developments in Source Protection Zones (SPZ), especially in SPZ 1.
Landscape, Soil, Water, Biodiversity, Flora, Fauna
Part II Scoping Report (Draft)3 FINAL 59

EAST RIDING OF YORKSHIRE COUNCIL –
SUSTAINABILITY APPRAISAL OF THE ALLOCATIONS DEVELOPMENT PLAN DOCUMENT
Part II Scoping Report
5. Sustainability Appraisal Objectives Introduction
5.1 The SEA Directive does not specifically require the use of objectives or indicators in the SEA process, but they are a recognised and useful way in which environmental effects can be described, analysed and compared at key stages in the plan’s development.
5.2 The SA approach described in the ODPM’s guidance is very much objectives-led, and the SA framework comprises the key component in completing the remaining stages of the SA, providing a systematic and easily understood tool around which to structure both supporting information and the prediction and assessment of sustainability effects arising from the implementation of the plan.
5.3 A key means of predicting and assessing the sustainability effects of the Allocations DPD will be through use of a Sustainability Appraisal Site Assessment Methodology (SASAM) which will help determine the suitability of potential site allocations throughout the plan’s production. The SA objectives agreed through this Scoping Report will form a key reference point in devising decision-making criteria to be included in the SASAM.
Methodology 5.4 The SA objectives derived for the LDF SA Scoping Report and other DPDs, including the Core
Strategy, Bridlington Area Action Plan (AAP) and Minerals DPD (see Table 5.1) have been used as a starting point for those to be applied to the SA of the Allocations DPD. The SA objectives developed for the Joint Waste DPD for Hull and the East Riding of Yorkshire have also been examined. Those reviewed objectives have, however, been subsequently modified, expanded or scoped out to provide a locational focus required for this SA. Location specific SA criteria were devised to cover, for example, accessibility to schools, healthcare facilities and other community services and amenities, accessibility to public transport, identify specific natural and built environment constraints as appropriate for the proposed site use. The amendments made to the SA objectives were also based on the analysis of the updated list of relevant plans and programmes identified in Section 2, more settlement specific baseline data in Section 3, the updated sustainability issues identified in Section 4, and reference to the existing housing site assessment methodology currently being used by the Council to assess candidate sites for housing development1.
Table 5.1 – SA Objectives from ERYC LDF SA Scoping Report
ID Sustainability objective
1 To reduce health inequalities
2 To reduce crime and the fear of crime
3 To reduce social exclusion and improve equality of opportunity amongst social groups
4 To improve accessibility and public transport links to key services and employment areas
5 To improve housing affordability
6 To maintain overall levels of education and skills and retain local highly skilled labour
7 To improve air quality
1 http://www.eastriding.gov.uk/corp-docs/forwardplanning/docs/ldf/housing/interactive2/index.html
Part II Scoping Report (Draft)3 FINAL 60

EAST RIDING OF YORKSHIRE COUNCIL –
SUSTAINABILITY APPRAISAL OF THE ALLOCATIONS DEVELOPMENT PLAN DOCUMENT
Part II Scoping Report
8 To reduce the growth of road traffic
9 To encourage more efficient use of land
10 To reduce waste arisings and the amount of waste sent to landfill
11 To improve the quality of local fresh water resources
12 To reduce levels of atmospheric GHG by reducing emissions and increasing extent of carbon sinks
13 To minimise the impacts of climate change by developing in a way that reduces risk from flooding and coastal erosion
14 To reduce carbon based energy use by increasing energy efficiency and production of renewable energy
15 To protect and enhance biodiversity and important wildlife habitats, and to conserve geology
16 To protect and enhance heritage assets and their settings
17 To protect and enhance the countryside and landscape quality
18 To maintain and strengthen the economy of East Riding
19 To increase diversity of employment
20 To support the renaissance of rural areas
Changes to the SA objectives 5.5 Table 5.2 below presents the SA Framework developed for the assessment of the Allocations
DPD. Two LDF SA objectives have been excluded from the allocations SA framework, as the indicators developed to measure the progress in achieving them were deemed to be beyond the sphere of influence of the site allocation process. These scoped out SA objectives are as follows:
Objective 2: Reduce crime and the fear of crime. The Allocations DPD has limited capacity to influence this issue, which will be addressed by the Core Strategy development management policies and relevant design guidance. Some indirect positive effects may be likely as a result of the stimulation of the regeneration in the areas with significant levels of deprivation but this will be covered by the SA objective 3;
Objective 10: Reduce waste arisings and the amount of waste sent to landfill. The Allocations DPD has limited capacity to influence this issue, which will be addressed by a strategic waste policy within the Core Strategy, the Joint Waste DPD and relevant design and construction guidance. Positive effects may arise from site allocations that encourage more concentrated, compact development within urban areas, as this may help provide greater opportunities for recycling and other local sustainable waste management initiatives. However, this will be covered by decision making questions establishing the location of the site allocation with regards to the settlement hierarchy (see SASAM).
5.6 Two new SA objectives were proposed, as their consideration was deemed to be important in the site allocation process. These scoped in objectives are:
To minimise noise and light pollution. Including an SA objective of this type recognises another environmental constraint. New development may be a sensitive receptor to noise pollution or be a significant source of noise in itself (see Issue 6 - Noise pollution in Section 4);
Part II Scoping Report (Draft)3 FINAL 61
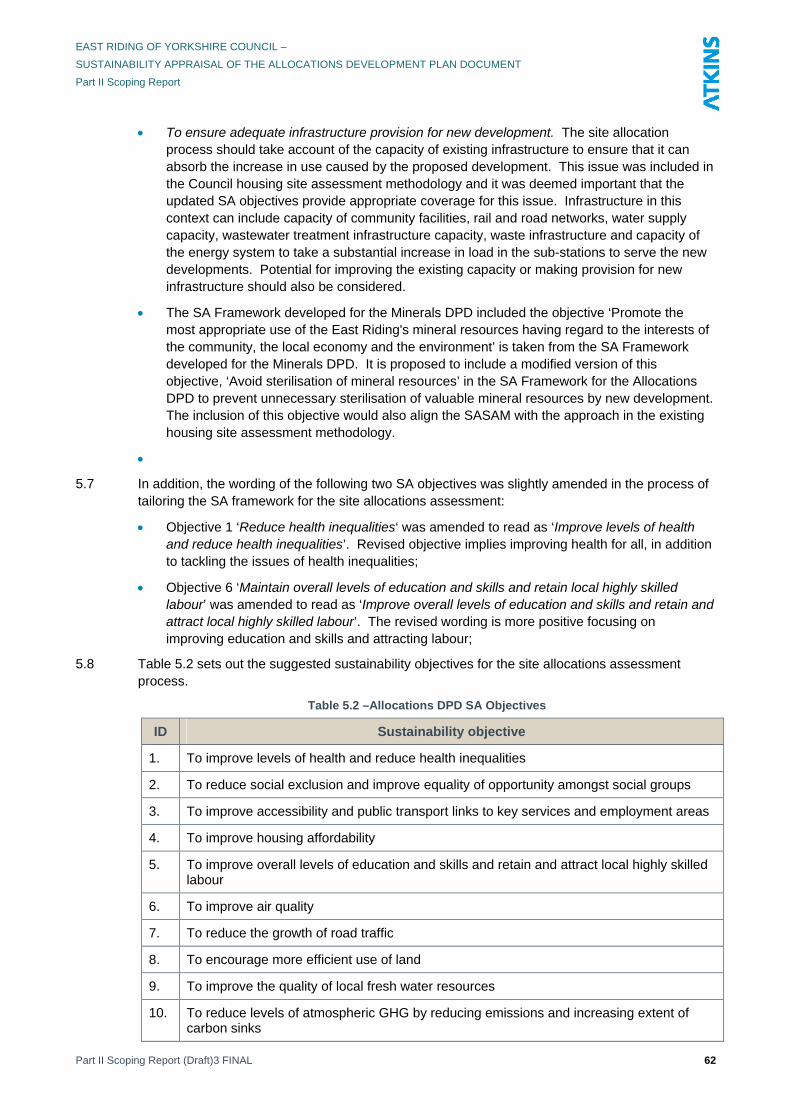
EAST RIDING OF YORKSHIRE COUNCIL –
SUSTAINABILITY APPRAISAL OF THE ALLOCATIONS DEVELOPMENT PLAN DOCUMENT
Part II Scoping Report
To ensure adequate infrastructure provision for new development. The site allocation process should take account of the capacity of existing infrastructure to ensure that it can absorb the increase in use caused by the proposed development. This issue was included in the Council housing site assessment methodology and it was deemed important that the updated SA objectives provide appropriate coverage for this issue. Infrastructure in this context can include capacity of community facilities, rail and road networks, water supply capacity, wastewater treatment infrastructure capacity, waste infrastructure and capacity of the energy system to take a substantial increase in load in the sub-stations to serve the new developments. Potential for improving the existing capacity or making provision for new infrastructure should also be considered.
The SA Framework developed for the Minerals DPD included the objective ‘Promote the most appropriate use of the East Riding's mineral resources having regard to the interests of the community, the local economy and the environment’ is taken from the SA Framework developed for the Minerals DPD. It is proposed to include a modified version of this objective, ‘Avoid sterilisation of mineral resources’ in the SA Framework for the Allocations DPD to prevent unnecessary sterilisation of valuable mineral resources by new development. The inclusion of this objective would also align the SASAM with the approach in the existing housing site assessment methodology.
5.7 In addition, the wording of the following two SA objectives was slightly amended in the process of tailoring the SA framework for the site allocations assessment:
Objective 1 ‘Reduce health inequalities‘ was amended to read as ‘Improve levels of health and reduce health inequalities’. Revised objective implies improving health for all, in addition to tackling the issues of health inequalities;
Objective 6 ‘Maintain overall levels of education and skills and retain local highly skilled labour’ was amended to read as ‘Improve overall levels of education and skills and retain and attract local highly skilled labour’. The revised wording is more positive focusing on improving education and skills and attracting labour;
5.8 Table 5.2 sets out the suggested sustainability objectives for the site allocations assessment process.
Table 5.2 –Allocations DPD SA Objectives
ID Sustainability objective
1. To improve levels of health and reduce health inequalities
2. To reduce social exclusion and improve equality of opportunity amongst social groups
3. To improve accessibility and public transport links to key services and employment areas
4. To improve housing affordability
5. To improve overall levels of education and skills and retain and attract local highly skilled labour
6. To improve air quality
7. To reduce the growth of road traffic
8. To encourage more efficient use of land
9. To improve the quality of local fresh water resources
10. To reduce levels of atmospheric GHG by reducing emissions and increasing extent of carbon sinks
Part II Scoping Report (Draft)3 FINAL 62

EAST RIDING OF YORKSHIRE COUNCIL –
SUSTAINABILITY APPRAISAL OF THE ALLOCATIONS DEVELOPMENT PLAN DOCUMENT
Part II Scoping Report
11. To minimise the impacts of climate change by developing in a way that reduces risk from flooding and coastal erosion
12. To reduce carbon based energy use by increasing energy efficiency and production of renewable energy.
13. To protect and enhance biodiversity and important wildlife habitats, and to conserve geology
14. To protect and enhance heritage assets and their settings
15. To protect and enhance the countryside and landscape quality
16. To minimise noise and light pollution
17. To maintain and strengthen the economy of East Riding
18. To increase diversity of employment
19. To support the renaissance of rural areas
20. To avoid sterilisation of mineral resources
21. To ensure adequate infrastructure provision for new development
5.9 The SA framework in the LDF SA Scoping Report and SA reports prepared for other DPDs
comprises the SA objectives together with indicators developed to measure progress in achieving these objectives. The SA indicators have been replaced with decision-making criteria for all relevant SA objectives for the assessment of the site allocations; at the ‘potential sites’ stage of the Allocations DPD, these have been set out in the Sustainability Appraisal Site Assessment Methodology (SASAM) briefing note, which is also out for consultation at the same time as this Part II SA Scoping Report.
Part II Scoping Report (Draft)3 FINAL 63

EAST RIDING OF YORKSHIRE COUNCIL –
SUSTAINABILITY APPRAISAL OF THE ALLOCATIONS DEVELOPMENT PLAN DOCUMENT
Part II Scoping Report
6. Remaining Stages of the SA Introduction
6.1 This chapter of the Scoping Report describes how the remaining stages of the SA will be carried out and the format that will be used in producing the final SA Report.
6.2 The SA process detailed in the ODPM guidance covers five stages, A to E. This Scoping Report has covered Stage A by:
Identifying and reviewing other relevant policies, plans and programmes, and sustainable development objectives that will affect or influence the Planning Framework;
Collecting relevant social, environmental and economic baseline information;
Identifying key sustainability issues for the SA to address;
Developing the SA framework; and
Providing the basis for consultation on the scope of the SA.
6.3 Table 6.1 shows the remaining steps involved in the SA, based on the ODPM guidance.
Table 6.1 – Remaining Stages of the SA
Stage B – Developing and refining options and assessing effects
Assess Plan objectives against the SA framework
Develop strategic options
Predict effects of options taken forward
Evaluate effects of options taken forward
Considering ways of mitigating adverse effects and maximising beneficial effects
Propose measures to monitor the significant effects of implementing Plan
Stage C – Preparing the Sustainability Appraisal Report
Preparing SA Report
Stage D – Consultation on the SA Report and draft Plan
Public participation on the SA Report and draft Plan
Assessing significant changes
Making decisions and providing information
Stage E – Monitoring the significant effects of implementing the Plan
Finalising aims and methods for monitoring
Responding to adverse effects
6.4 It should be noted that the first task of Stage B (assessing plan objectives against the SA
framework) will not be undertaken as part of the SA of the ERYC Allocations DPD. This is because the DPD allocates sites to meet the Local Development Framework’s objectives, as included in the Core Strategy and assessed through the SA of the Core Strategy. As such, the Allocations DPD does not set out specific objectives of its own and the ODPM guidance’s first step of Stage B will not be undertaken.
Part II Scoping Report (Draft)3 FINAL 64

EAST RIDING OF YORKSHIRE COUNCIL –
SUSTAINABILITY APPRAISAL OF THE ALLOCATIONS DEVELOPMENT PLAN DOCUMENT
Part II Scoping Report
Assessment of Effects
Predicting Effects
6.5 This task will comprise systematic prediction of changes to the sustainability baseline arising from implementation of the DPD. These can be compared both with each other and with the ‘do nothing’ or ‘business as usual’ scenario. As required by the SEA Directive, predicted effects will be fully characterised in terms of their magnitude, the time period over which they occur, whether they are permanent or temporary, positive or negative, probable or improbable, frequent or rare, and whether there are cumulative and/or synergistic effects. Ideally, the effects of the evolving Plan should be predicted and assessed during the plan-making process to ensure that the final Plan is as sustainable as possible.
Evaluating Effects
6.6 Assessing the significance of predicted sustainability effects is essentially a matter of judgement. Judgements of significance should be systematically documented, in terms of the particular characteristics of the effect which are deemed to make it significant and whether and what uncertainty and assumptions are associated with the judgement. The assessment of significance should also include information on how the effect may be avoided or its severity reduced, in the case of adverse effects, or enhanced in the case of beneficial effects.
6.7 When carrying out this evaluation, the following will be considered for each Plan option, in line with the ODPM guidance:
a) What exactly is proposed?
b) Will the option have a likely significant adverse effect in relation to each of the SA objectives?
c) If so, can the effect be avoided or can the severity be reduced?
d) If not, can the option be changed or eliminated?
e) If the effect cannot be avoided, can the alternative be changed or eliminated?
f) If its effect is uncertain, or depends on how the plan is implemented, how can the uncertainty be reduced?
Methodologies for Assessing Effects
6.8 Table 6.2 below, based on Annex 12 of the ODPM guidance, provides a useful summary of the range of techniques that can be used in the prediction and assessment of effects. In addition to expert judgement, network analysis2 can prove especially useful in the prediction of secondary, cumulative and synergistic effects3. GIS are useful in assessing the spatial/distributional characteristics of certain types of effect.
2 Network analysis is uses diagrammatic representations of links between actions and outputs or outcomes to explore chains or networks of causal relationships. 3 Cumulative effects arise, for instance, where several developments each have insignificant effects but together have a significant effect; or where several individual effects of a plan or development (e.g. noise, dust and visual) have a combined effect. Secondary effects are effects that are not a direct result of a plan, but occur away from the original effect or as a result of a complex pathway. Synergistic effects interact to produce a total effect greater than the sum of the individual effects.
Part II Scoping Report (Draft)3 FINAL 65

EAST RIDING OF YORKSHIRE COUNCIL –
SUSTAINABILITY APPRAISAL OF THE ALLOCATIONS DEVELOPMENT PLAN DOCUMENT
Part II Scoping Report
Table 6.2 - Prediction and Assessment Techniques for SA
Technique Prediction Assessment
Expert judgement ✓ ✓
Public participation ✓
Quality of Life Capital ✓
Geographical information systems (GIS) ✓ ✓
Network analysis ✓
Modelling ✓
Scenario/sensitivity analysis ✓
Multi-criteria analysis ✓
Carrying capacity, ecological footprints ✓
Compatibility assessment ✓
6.9 It will be important to provide some realistic indication of the accuracy of predictions, but
particularly in cases where predictions are close to expected thresholds, or are the result of cumulative, synergistic or indirect effects. The network analysis techniques mentioned above could be used to identify which effects will fall into this category.
Mitigation
For significant sustainability effects predicted to arise from implementation of the Plan, recommendations will be proposed in the SA Report for mitigation measures to prevent, reduce or offset adverse effects, and enhance positive effects.
Monitoring
A framework for monitoring on-going sustainability effects arising from the Plan as they are implemented will be proposed in the SA Report, providing methods by which the sustainability performance of the Plan can be recorded. The monitoring framework will be clearly linked to the objectives and indicators developed for the SA framework.
SA Report
The SA Report incorporates the SEA Environmental Report, as required by the SEA Directive.
Table 6.3 below presents the proposed structure and level of detail for the SA Report, taken from Appendix 15 of the ODPM guidance. The SA Report will show that the Directive’s requirements in relation to the Environmental Report have been met through clearly sign-posting in the SA report the distinct information required by the Directive.
Table 6.3 - SA Report Structure
Structure of report Information to include
Components making up the environmental report
Table sign-posting the components of the SA Report which make up the Environmental Report for the purposes of the SEA Directive
Part II Scoping Report (Draft)3 FINAL 66

EAST RIDING OF YORKSHIRE COUNCIL –
SUSTAINABILITY APPRAISAL OF THE ALLOCATIONS DEVELOPMENT PLAN DOCUMENT
Part II Scoping Report
Part II Scoping Report (Draft)3 FINAL 67
Structure of report Information to include
1. Summary and outcomes Non-technical summary
A statement of significant effects of Plan
Statement on the difference the SA process has made
How to comment on the report
2. Appraisal Methodology Approach adopted to the SA
When the SA was carried out
Who carried out the SA
Who was consulted, when and how
Difficulties encountered in compiling information or carrying out the assessment.
3. Background Purpose of the SA and the SA Report
Plan objectives and outline of contents
Compliance with the SEA Directive/Regulations
4. Sustainability objectives, baseline and context
Links to other strategies, plans and programme and sustainability objectives
Description of the social, environmental and economic baseline characteristics and the predicted future baseline
Main social, environmental and economic issues and problems identified
Limitations of the information, assumptions made etc.
The SA framework
5. Plan issues and options Main strategic options consider and how they were identified
Comparison of the social, environmental and economic effects of the options
How social, environmental and economic issues were considered in choosing the preferred options
Other options considered, and why these were rejected
Any proposed mitigation measures
6. Plan policies Significant social, environmental and economic effects of the preferred options
How social, environmental and economic problems were considered in developing the options
Proposed mitigation measures
Uncertainties and risks
7. Implementation Links to other tiers of plans and programmes and the project level (environmental impact assessment, design guidance, etc)
Proposals for monitoring

EAST RIDING OF YORKSHIRE COUNCIL –
SUSTAINABILITY APPRAISAL OF THE ALLOCATIONS DEVELOPMENT PLAN DOCUMENT
Part II Scoping Report
Appendix A - Baseline Tables
Part II Scoping Report (Draft)3 FINAL 68

EAST RIDING OF YORKSHIRE COUNCIL –
SUSTAINABILITY APPRAISAL OF THE ALLOCATIONS DEVELOPMENT PLAN DOCUMENT
Part II Scoping Report
Table A.1 - Baseline Data, Indicators and Trends for Social Issues
Indicator Quantified data (East Riding) Comparators (Quantified data for the Yorkshire and the Humber Region and/or
England and Wales)
Trends and targets where identified
Issue identified Associated SEA topics
Source
Population and age structure
East Riding -
2007: 333,000 people
49.1% male; 50.9% female.
Children under five: 5%
2007 average population age: 41.2 years
Population predicted to rise by 7.4% to 5.4 mill by 2028
Yorkshire and Humber –
5,177,200 people
49.3% male; 50.7% female
Proportion of population aged 0-15: 18.8%
Great Britain –
59,216,200 people
49.1% male; 50.9% female
Children under five: 6%
Proportion of population aged 0-15: 18.9%
2007 average population age for England and Wales: 38.6 years
East Riding -
2003: 317,000 people
2001 Census: 314,113 people
48.8% male; 51.2% female
Children under five: 5%
Proportion of population aged 0-15:
2006 – 17.6%
2005 – 17.9%
2004 – 18.1%
In the twenty years between 1982 and 2002 the population of East Riding grew by 16.6 per cent, compared with an increase of 1.5 per cent for Yorkshire and The Humber region as a whole. Average population age in East Riding is above that for England and Wales.
Declining proportion of younger people in the population.
Population ONS mid-year population estimates – 2007: http://www.nomisweb.co.uk/reports/lmp/la/2038432012/report.aspx?town=east%20riding#tabrespop
Also: http://neighbourhood.statistics.gov.uk/dissemination/LeadTableView.do?a=3&b=276822&c=east+riding&d=13&e=13&g=390682&i=1001x1003x1004&m=0&r=1&s=1246015372046&enc=1&dsFamilyId=1818
Resident population estimates by broad age band, ONS - 2007
Percentage of people of pensionable age
East Riding -
2007: 23.4%
Yorkshire and Humber - 20.2%
UK - 19%
East Riding -
2001: 22%
Proportion of people of pensionable age (60 plus for females, 65 plus for males) is gradually increasing, in line with the rest of the country. However, East Riding has an older population compared to regional and national figures.
Population, Material Assets
ONS mid year estimates 2007: http://www.eastriding.gov.uk/corp-docs/researchgroup/Reports/2007_mid-year_population.pdf
East Riding -
Around 3% of pop is non-white
Yorkshire and Humber - 6.52%
England and Wales - 9.08%
2001:
East Riding: 1.2%
1991:
East Riding: 0.54%
Regional: 5.80%
England and Wales: 7.10%
The area has a low percentage of the population from minority ethnic groups compared to many other areas.
Population Housing Strategy 2008 EYRC Census 2001 http://www.eastriding.gov.uk/corp-docs/researchgroup/Reports/BridlingtonSouth.pdf
Ethnic minority population
Population density per
East Riding - Yorkshire and Humber - 336 Population density in East Riding is increasing
Population ERYC Annual Monitoring
Part II Scoping Report (Draft)3 FINAL 69

EAST RIDING OF YORKSHIRE COUNCIL –
SUSTAINABILITY APPRAISAL OF THE ALLOCATIONS DEVELOPMENT PLAN DOCUMENT
Part II Scoping Report
Indicator Quantified data (East Riding) Comparators (Quantified data Trends and targets where Issue identified Associated Source for the Yorkshire and the Humber Region and/or
England and Wales)
identified SEA topics
138.3 England and Wales - 392.2 slightly as a result of increasing population.
Report 2008 square kilometre
Average Household size
East Riding -
2.36 people in 2001.
England and Wales - 2.4 people in 2001.
None identified Average household size in the East Riding is similar to that for England and Wales as a whole.
Population Census 2001
Average dwelling price
East Riding -
First quarter of 2009: £148,923,
Yorkshire and Humber:
First quarter of 2009: £141,962
This is the second lowest regional average dwelling price in England, and is lower than that of Wales.
East Riding 2008: £159,109
Between 2002 and 2003 average dwelling prices in Yorkshire and the Humber increased by 22.4%, compared with England where the average rise was 12.2%.
House prices in East Riding are above the Yorkshire and Humber average but still significantly lower than average prices for the rest of the UK.
Population, Material assets
Land Registry of England and Wales
East Riding Annual Monitoring Report 2008
East Riding -
10.8%
Yorkshire and The Humber – 14.5%
Great Britain – 13.1%
http://www.nomisweb.co.uk/reports/lmp/la/2038432012/report.aspx?town=east%20riding#tabrespop
Percentage of ERY population with no qualification (2007)
East Riding -
27%
Yorkshire and The Humber: 23.8%
Great Britain – 28.6%
In Yorkshire and the Humber 74 % of 17 year olds continued to participate in post-compulsory education, compared with 78% in England and Wales
http://www.nomisweb.co.uk/reports/lmp/la/2038432012/report.aspx?town=east%20riding#tabrespop
Neighbourhood Statistics
(April 2001)
Percentage of ERY with NVQ4 and above (HND, Degree and Higher Degree level qualifications or equivalent) (2007)
Pupils achieving 5 or more GCSEs graded A* to C
East Riding -
2007/8: 63.1%
Yorkshire and The Humber – 62.1%
England – 64.5%
East Riding -
2004/5 – 58.6%
2005/6 – 60.2%
2006/7 – 62.2%
East Riding performs broadly in line with regional and national patterns, both of which show a gradual improvement in this measure in recent years.
Population DCLG - NRU, Floor Targets – 2007/8
Burglary offences in a
East Riding -
April 2007 – March 2008: 813
Yorkshire and The Humber – 35,504
East Riding -
April 2006 – March 2007:
Declining local levels of burglaries, in line with
Material Assets Neighbourhood Statistics / Home Office – April 2007 – March 2008
Part II Scoping Report (Draft)3 FINAL 70

EAST RIDING OF YORKSHIRE COUNCIL –
SUSTAINABILITY APPRAISAL OF THE ALLOCATIONS DEVELOPMENT PLAN DOCUMENT
Part II Scoping Report
Indicator Quantified data (East Riding) Comparators (Quantified data Trends and targets where Issue identified Associated Source for the Yorkshire and the Humber Region and/or
England and Wales)
identified SEA topics
dwelling England and Wales – 269,400 1,165
April 2005 – March 2006: 1,079
April 2004 – March 2005: 1,203
regional and national decline. Also, lower levels of crime compared to national and regional averages.
http://www.neighbourhood.statistics.gov.uk/dissemination/LeadTableView.do;jsessionid=ac1f930d30d609c01ea18c514cb8913eb996e3ccb686?a=7&b=276822&c=east+riding&d=13&g=390682&i=1001x1003x1006&k=burglary&m=0&r=1&s=1246282806773&enc=1&domainId=3&dsFamilyId=904&nsjs=true&nsck=true&nssvg=false&nswid=1003
Burglary Rate per 1000 households
East Riding -
April 2007 – March 2008: 5.9
Yorkshire and The Humber – 16.7
England – 12.8
East Riding -
2003/4 – 10.5
2004/5 – 8.8
2005/6 – 7.9
2006/7 – 8.4
Declining local levels of burglaries, in line with regional and national decline. Also, lower levels of crime compared to national and regional averages.
Population, Material Assets
DCLG - NRU, Floor Targets – 2007/8
Overall Crime Rate (recorded crime BCS comparator) rate per 1000 persons
East Riding -
April 2007 – March 2008: 30.9
Yorkshire and The Humber – 61.7
England – 54
East Riding -
2003/4 – 48.5
2004/5 – 42.2
2005/6 – 41.2
2006/7 – 40.5
Declining local levels of burglaries, in line with regional and national decline. Also lower levels of crime compared to national and regional averages.
Population, Material Assets
DCLG - NRU, Floor Targets – 2007/8
East Riding -
April 2007 – March 2008: 4.7
Yorkshire and The Humber Average – 12.7
England Average – 11.2
East Riding -
2003/4 – 11.6
2004/5 – 9.3
2005/6 – 8.1
2006/7 – 7.2
Declining local levels of vehicle crime, in line with regional and national decline. Also lower levels of crime compared to national and regional averages.
Material Assets DCLG - NRU, Floor Targets – 2007/8
Vehicle Crime Rate per 1000 persons
Robbery Rate per 1000 persons
East Riding -
April 2007 – March 2008: 0.2
Yorkshire and The Humber – 1.1
England – 1.6
East Riding -
2003/4 – 0.4
2004/5 – 0.4
2005/6 – 0.2
Declining local levels of robberies, in line with regional and national decline. Also lower levels of crime compared to national and regional
Material Assets DCLG - NRU, Floor Targets – 2007/8
Part II Scoping Report (Draft)3 FINAL 71

EAST RIDING OF YORKSHIRE COUNCIL –
SUSTAINABILITY APPRAISAL OF THE ALLOCATIONS DEVELOPMENT PLAN DOCUMENT
Part II Scoping Report
Indicator Quantified data (East Riding) Comparators (Quantified data Trends and targets where Issue identified Associated Source for the Yorkshire and the Humber Region and/or
England and Wales)
identified SEA topics
2006/7 – 0.3 averages.
East Riding -
April 2007 – March 2008: 12.1
Yorkshire and The Humber Average – 18
England Average – 17.6
East Riding -
2003/4 – 16.1
2004/5 – 13.2
2005/6 – 12.7
2006/7 – 14.2
Declining local levels of violent offences, in line with regional and national decline. Also lower levels of crime compared to national and regional averages.
Population DCLG - NRU, Floor Targets – 2007/8
Violent offences against the person per 1000 persons
2007 Indices of Multiple Deprivation: East Riding of Yorkshire has an overall rank of 232 out of 354 local authorities (a low score indicates greater deprivation). Rank of Income Scale: 63 Rank of Employment Scale: 56 Rank of extent: 180 Rank of local concentration: 168
Data based on super output areas which can be aggregated to local authority and national (England) scale. Regional figures not available. English figure is a rank of 354 local authorities
East Riding -
2004: Overall Rank: 208 Rank of Income Scale: 63 Rank of Employment Scale: 56 Rank of extent: 171 Rank of local concentration: 153
East Riding is less deprived than most areas in England and its ranking has improved suggesting that levels of deprivation have improved. However, the authority still has a relatively high level of income and employment deprivation.
Population DCLG 2007 IMD
http://www.communities.gov.uk/communities/neighbourhoodrenewal/deprivation/deprivation07/
Deprivation
Disability Living Allowance and Attendance Allowance
East Riding -
2008:
Disability Living Allowance: 15,260 people (4.86% of ERYC’s total population in 2001)
Yorkshire and The Humber – Disability Living Allowance: 285,350 people (5.75% of the Region’s total population in 2001)
England –
Disability Living Allowance: 2,453,310 people (4.99 % of England’s total population in 2001).
East Riding - 2003: Disability Living Allowance: 12,650 people (4.9% of ERYC’s total population in 2001) Attendance Allowance: 7,480 people (12.3% of ERYC’s total population in 2001). England and Wales – 2003: Disability Living Allowance: 5.1% total population in 2001 Attendance Allowance: 14.4% total population in 2001
The Disability Living Allowance is a benefit paid to people under 65, who are disabled, and need help with personal care and/or getting around.
Attendance Allowance is paid to people aged 65 or over who are disabled, either physically or mentally, and who need supervision or assistance with personal care over a prolonged period of time.
Population Neighbourhood Statistics - DWP
Part II Scoping Report (Draft)3 FINAL 72

EAST RIDING OF YORKSHIRE COUNCIL –
SUSTAINABILITY APPRAISAL OF THE ALLOCATIONS DEVELOPMENT PLAN DOCUMENT
Part II Scoping Report
Indicator Quantified data (East Riding) Comparators (Quantified data Trends and targets where Issue identified Associated Source for the Yorkshire and the Humber Region and/or
England and Wales)
identified SEA topics
East Riding -
2007/08:
No. of presentations – 1187
No. of acceptances - 465
Yorkshire and The Humber – No. of presentations – 18540
No. of acceptances – 7350
England –
No. of presentations – 130840
No. of acceptances – 63170
No. of presentations
2006/07 – 1152
2005/06 – 1256
2004/05 – 1186
No. of acceptances –
2006/07 – 403
2005/06 – 454
2004/05 – 451
Appears as though levels of homelessness in East Riding have remained broadly constant in the past few years.
Local authorities' action under the homelessness provisions of the Housing Acts – 2007/8
http://www.communities.gov.uk/documents/housing/xls/141476.xls
Homelessness
East Riding -
2007/08: 50.15%
England – 79.1% 57.5% (2006/07)
44.8% (2005/06)
49% (2004/05)
The proportion of housing built on previously developed land is low in comparison to the rest of England, reflecting the fact that this is largely a greenfield area.
Material Assets, Landscape
DCLG (BV106) – 2007/8 http://www.communities.gov.uk/localgovernment/performanceframeworkpartnerships/bestvalue/bestvalueperformance/
% of new housing development on previously developed land
East Riding -
2001: 20.24% of households are without a car or van
England and Wales – Average of 26.8% with no car or van 29.4% owned 2+ cars
In the East Riding, most people travel by car. Car usage here is substantially higher than the national average, with 75% of households owning at least one car.
The number of car owners is growing. As car ownership increases, the use of public transport declines and there is sometimes insufficient support for such services to make them viable.
Population, Human Health
ONS Regions in Figures
A draft community cohesion strategy for the East Riding of Yorkshire, 2004
% of households without a car
Noise Levels
Noise hotspots are found at the main road networks and isolated noise generators (airports, railways).
Fewer noise hotspots than bigger agglomerations such as London, the South East, Midlands and the North West. However, this is partly due to the limited data coverage.
Noise hotspots are found at the main road networks and isolated noise generators (airports, railways).
Human Health Defra noise map – roads. No coverage for rail, airports for the area. http://www.defra.gov.uk/environment/noise/mapping/index.htm
Part II Scoping Report (Draft)3 FINAL 73

EAST RIDING OF YORKSHIRE COUNCIL –
SUSTAINABILITY APPRAISAL OF THE ALLOCATIONS DEVELOPMENT PLAN DOCUMENT
Part II Scoping Report
Indicator Quantified data (East Riding) Comparators (Quantified data Trends and targets where Issue identified Associated Source for the Yorkshire and the Humber Region and/or
England and Wales)
identified SEA topics
Noise Complaints
East Riding -
number of requests for service and inspections dealt with:
2002/3 - 1153
2003/4 - 1167
Cost of noise control per head of population (315,717) is £00.68
Noise complaints slightly increased from 2002/03 to 2003/04
As a result of noise complaint from a new industrial development in 2004 the Ombudsman found maladministration in that the Council did not pursue planning enforcement action sufficiently vigorously.
Population, Human Health
East Riding Environmental Control Service 2003/04
The Local Government;
Ombudsman’s Home Page
East Riding -
2005/7:
Male: 78.6
Female: 81.9
2005/7
Yorkshire and The Humber –Males: 76.9
Females: 81.1
England –
Males: 77.6
Females: 81.8
Males:
2002/4 – 77.4
2003/5 – 77.6
2004/6 – 78.1
Females:
2002/4 – 81.1
2003/5 – 81.1
2004/6 – 81.7
Life expectancy is slowly improving at local, regional and local level for both sexes. Life expectancy is slightly higher in East Riding than regional and national averages.
Human Health DCLG - NRU, Floor Targets – 2005/7
Life expectancy
East Riding -
SMR – 99
(95 for males; 103 for females)
Yorkshire and The Humber – 105 (105 for males and 104 for females)
England – 100
East Riding: SMR - 97
(95 for males 99 for females)
The mortality ratio is slightly lower in East Riding compared to the national average and is even lower than the regional ratio.
Human Health Deaths by local authority of usual residence, numbers and SMRs by sex, 2004 registrations
http://www.statistics.gov.uk/STATBASE/Expodata/Spreadsheets/D9075.xls
Standard Mortality Ratio (SMR)
East Riding -
2001: 68.82%
2001:
Yorkshire and The Humber – 66.96%
England and Wales – 68.55%
The percentage of people considered in good health is higher than regional and national averages.
Human Health Neighbourhood Statistics
2001 Census, Office of National Statistics
General Health considered ‘good’
East Riding -
2001: 8.74%
2001:
Yorkshire and The Humber – 10.29%
England and Wales – 9.22%
Overall health status is likely to deteriorate with the increasing number of retired people in the area.
The percentage of people considered in not good health is lower than regional and national averages.
Human Health Neighbourhood Statistics 2001 Census, Office of National Statistics
General Health considered ‘not good’
Limiting long- East Riding - 2001: The proportion of people with long-term limiting
Population, 2001 Census
Part II Scoping Report (Draft)3 FINAL 74

EAST RIDING OF YORKSHIRE COUNCIL –
SUSTAINABILITY APPRAISAL OF THE ALLOCATIONS DEVELOPMENT PLAN DOCUMENT
Part II Scoping Report
Indicator Quantified data (East Riding) Comparators (Quantified data Trends and targets where Issue identified Associated Source for the Yorkshire and the Humber Region and/or
England and Wales)
identified SEA topics
term illness 2001:
Percentage of whole population with a limiting long-term illness: 18.11
Average number of households with one or more persons with a limiting long-term illness: 33.17
England and Wales – Percentage of whole population with a limiting long-term illness: 18.23
Average number of households with one or more persons with a limiting long-term illness: 34.05
illnesses in East Riding in 2001 was broadly similar to that observed in England and Wales.
Human Health
East Riding -
30.5% of children travelled to school by car in 2006/07.
2004:
Adults who achieve the Department of Health physical activity guidelines:
Yorkshire - 28%
UK - 30.4%
Adults who take part in 30 minutes of moderate intensity sport and active recreation three times a week:
Yorkshire - 18%
Schoolchildren who spend at least two hours a week on high-quality physical education and school sport within and beyond the curriculum:
Yorkshire - 61%
2008:
Adults who achieve the Department of Health physical activity guidelines:
Yorkshire - 32%
Adults who take part in 30 minutes of moderate intensity sport and active recreation three times a week:
Yorkshire - 22%
Schoolchildren who spend at least two hours a week on high-quality physical education and school sport within and beyond the curriculum:
Yorkshire - 75%
Reduce % of children travelling by car in East Riding to 29% by 2010/11.
Reduce the obesity in primary school age children in reception in East Riding from a 2006/07 baseline of 9.2% to 8.4% by 2010/11.
Level of participation in physical activities in the region is lower than nationwide.
Population, Human Health
Yorkshire Plan for Sport 2004-2008
East Riding of Yorkshire Council Sustainable Modes of Travel Strategy 2008:
http://www.eastriding.gov.uk/roads/pdf/sustainable_travel_final.pdf
Level of physical activity
Suicide Mortality Rate per 100000 persons
East Riding -
2005/07: 8.2
Yorkshire and The Humber – 8.3
England – 7.9
2002/4 – 8.5
2003/5 – 8.3
2004/6 – 8.6
In 2001 and 2002 suicide rate in ERYC (9.7 and 9.2) was slightly higher compared to the national (8.9 and 8.7) and regional (8.8 and 8.5) rates, but
Human Health DCLG - NRU, Floor Targets – 2005/7
Part II Scoping Report (Draft)3 FINAL 75

EAST RIDING OF YORKSHIRE COUNCIL –
SUSTAINABILITY APPRAISAL OF THE ALLOCATIONS DEVELOPMENT PLAN DOCUMENT
Part II Scoping Report
Indicator Quantified data (East Riding) Comparators (Quantified data Trends and targets where Issue identified Associated Source for the Yorkshire and the Humber Region and/or
England and Wales)
identified SEA topics
has been lower for all other years since 1997.
East Riding -
2007: 0.8
Yorkshire and The Humber – 0.6
England – 0.5
2004 – 0.9
2005 – 0.8
2006 – 0.7
Targets by 2010:
Total KSI – 40% reduction by 2010 (value – 182)
The road casualty rate has remained broadly similar in East Riding in the past few years, and has slightly decreased. It is however higher than both national and regional averages.
Human Health DCLG - NRU, Floor Targets – 2007
Road casualty rate (KSI) per 1000 persons
East Riding -
2008: 79% (132 schools)
23% in 2004/05
Target: 80% by 2010/11
This measure has improved considerably in recent years and has met targets.
Human Health, Air
ERYC Sustainable Modes of Travel Strategy 2008 http://neighbourhood.statistics.gov.uk/dissemination/LeadTableView.do?a=3&b=276822&c=east+riding&d=13&e=13&g=390682&i=1001x1003x1004&m=0&r=1&s=1246015372046&enc=1&dsFamilyId=1818
Percentage of schools with completed Travel Plans
East Riding -
2006/7: 30.5%
Target: 29% by 2010/11 Human Health, Air
ERYC Sustainable Modes of Travel Strategy 2008
Proportion of children travelling to school by car
Table A.2 - Baseline Data, Indicators and Trends for Environmental Issues
Quantified data (East Riding) Comparators (Quantified data for the Yorkshire and the Humber Region and/or
England and Wales)
Trends and targets where identified
Issue identified Associated SEA topics
Source Indicator
No. and area of designated sites
46 SSSIs covering 4150 hectares of the County – includes five SAC sites and five SPA and two Ramsar sites
SAC sites are:
Flamborough Head;
The wide variety of different designations reflects the area’s wildlife richness.
Landscape, Biodiversity, Flora and Fauna, Water, Soil
Natural England, 2009
Joint Nature Conservation Committee
http://www.jncc.gov.uk/pag
Part II Scoping Report (Draft)3 FINAL 76

EAST RIDING OF YORKSHIRE COUNCIL –
SUSTAINABILITY APPRAISAL OF THE ALLOCATIONS DEVELOPMENT PLAN DOCUMENT
Part II Scoping Report
Indicator Quantified data (East Riding) Comparators (Quantified data Trends and targets where Issue identified Associated Source for the Yorkshire and the Humber Region and/or
England and Wales)
identified SEA topics
Humber Estuary;
Lower Derwent Valley;
River Derwent;
Thorne Moor.
Ramsar sites are:
Lower Derwent Valley; and
Humber Estuary (also in N. Lincolnshire).
SPA are:
Lower Derwent Valley;
Hornsea Mere;
Flamborough Head and Bempton Cliffs;
Humber Flats, Marshes and Coast Phase 1; and
Thorne and Hatfield Moors.
There are three NNRs: Lower Derwent Valley and Spurn and a small part of Humberhead Peatlands in the East Riding managed by Natural England.
13 LNRs exist in East Riding:
Danes Dyke;
Eastrington Ponds;
Flamborough Outer Headland;
South Landing;
Howden Marsh;
Southorpe Bridge;
Sigglesthorne Station;
Humber Bridge Country
e-1390
http://www.jncc.gov.uk/page-23
Part II Scoping Report (Draft)3 FINAL 77

EAST RIDING OF YORKSHIRE COUNCIL –
SUSTAINABILITY APPRAISAL OF THE ALLOCATIONS DEVELOPMENT PLAN DOCUMENT
Part II Scoping Report
Indicator Qua fied data (East Riding) nti Comparators (Quantified data Trends and targets where Issue identified Associated Source for the Yorkshire and the Humber Region and/or
England and Wales)
identified SEA topics
Park;
Hudson’s Way;
Broompark and Mayfield;
Millington Wood;
Sugar Mill Ponds; and
Beverley Parks
Important species and habitats
Important habitats include:
ancient flood meadows of the Lower Derwent Valley;
chalk grasslands of the Wolds;
wetlands of the River Hull valley;
remnants of lowland heath in the eastern Vale of York;
mudflats and saltmarshes of the Humber Estuary;
sand dunes of the Spurn Peninsula;
towering chalk cliffs of the Flamborough Headland; and
offshore chalk reef habitats of the North Sea.
Important species include:
water vole and otter; over-wintering populations of
golden plover , black tailed godwit and curlew;
breeding bittern and avocet; farmland bird populations
including grey partridge, tree sparrow, yellowhammer and skylark;
great crested newt, common toad and grass snake;
migratory fish including sea and river lamprey, Atlantic
The UK Steering Group Report has produced action plans for approx. 400 priority species and 39 habitats.
There is currently no LBAP in place. The Council is currently in the process of developing a new LBAP.
Trends of species loss and habitat fragmentation.
The region’s richness and diversity is under pressure and some has been lost already. Once-common plants and animals are now seldom seen and others have been lost from the area altogether. Some natural habitats that used to be widespread are now limited to isolated fragments.
The key issues include coastal squeeze, recreational development pressure, sea level rise, other climate change impacts, agricultural intensification, renewable energy development (both issue and opportunity), and habitat fragmentation.
Biodiversity, Flora and Fauna
Draft LBAP, communication with ERYC Biodiversity Officer Yorkshire and Humber Regional Spatial Strategy: Biodiversity and Natural Environment Study, 2005
Part II Scoping Report (Draft)3 FINAL 78

EAST RIDING OF YORKSHIRE COUNCIL –
SUSTAINABILITY APPRAISAL OF THE ALLOCATIONS DEVELOPMENT PLAN DOCUMENT
Part II Scoping Report
Indicator Qua g) ntified data (East Ridin Comparators (Quantified data Trends and targets where Issue identified Associated Source for the Yorkshire and the Humber Region and/or
England and Wales)
identified SEA topics
salmon, eel and smelt; the UK’s largest mainland
seabird nesting colony with gannets, kittiwakes, razorbills and puffins;
rare plants including greater water parsnip and purple milk vetch;
a range of rare invertebrate; and
local species such as barn owl, brown hare and others.
Water Quality (Chemical quality classified under the General Quality Assessment (GQA) scheme and Biological quality under River Invertebrate Prediction and Classification System (RIVPACS)
The Main water courses in ERYC are the River Humber, River Hull, Watton Beck, River Derwent, Yorkshire, Great Ouse, River Aire and River Trent.
East Riding has sites monitored for chemical and biological river water quality by the Environment Agency. The General Quality Assessment (GQA) Scheme assesses the basic chemical quality of rivers and grades it into good, fair, poor and bad. The biological grading is based on a procedure known as the River Invertebrate Prediction and Classification System (RIVPACS). Species groups recorded at a site are compared with those which would be expected to be present in the absence of pollution and other harmful substances, For 2002-2006 the following trends for chemical and biological quality were observed in East Riding:
In comparison measurements of chemical quality in the Yorkshire and the Humber region as a whole were 64.9% Good, 27.1% Fair, 7.2% Poor and 0.8% Bad
Measurements of biological quality in the Yorkshire and the Humber region as a whole were 64.1% Good, 27.0 Fair, 6.6 Poor, 2.3% Bad
For 2002-2006 data the trend in chemical quality of ER waters compared to the rest of the region shows lower Good and higher Fair, Poor and Bad quality.
For biological quality ER waters compared to the rest of the region were lower Good and Poor and higher Fair and Bad quality.
About 2.5% of the total river length in England has been designated as Sites of Special Scientific Interest.
32% of SSSI river and stream features reported are in favourable condition. 11% of A/SSSI features reported are unfavourable-recovering. 56% unfavourable and 1% destroyed.
River and stream features are generally in poor condition compared to other habitats, freshwater or otherwise.
Water DEFRA
http://www.defra.gov.uk/environment/statistics/inlwater/iwriverquality.htm
Joint Nature Conservation Committee
http://www.jncc.gov.uk/page-3571
Part II Scoping Report (Draft)3 FINAL 79

EAST RIDING OF YORKSHIRE COUNCIL –
SUSTAINABILITY APPRAISAL OF THE ALLOCATIONS DEVELOPMENT PLAN DOCUMENT
Part II Scoping Report
Indicator Quantified data (East Riding) Comparators (Quantified data Trends and targets where Issue identified Associated Source for the Yorkshire and the Humber Region and/or
England and Wales)
identified SEA topics
Chemical quality was classified as 46.2% Good, 35.1% Fair, 16.4% Poor and 2.2% Bad. Biological quality was classified as 58.0% Good, 34.8% Fair, 3.7% Poor and 3.5% Bad
The main threat to the quality of groundwater sources is the leaching of nitrate fertilisers making them unsuitable for drinking water supply.
Nitrate levels are greater than the drinking water standard of 50 milligrams per litre at many locations in the sandstone of the Vale of York and the chalk Wolds of East Yorkshire and North Lincolnshire.
The Environment Agency has defined 13 Groundwater Source Protection Zones (SPZs) under the National Groundwater Protection Policy to protect aquifers and groundwater flows. The SPZs are divided into sectors dependant on a location's potential significance for affecting the integrity of groundwater in the aquifer. Contamination of these aquifers could have a serious effect on the public water supply.
There are a range of SPZs designated across the region and the country
SPZs, particularly those parts closest to the abstraction points, will be a significant constraint on the location of development, and the LDF must ensure that the integrity of water resources is not prejudiced.
Water Environment Agency
Groundwater
Contaminated Land
The third review of the East Riding of Yorkshire Council Contaminated Land Inspection Strategy is currently underway. A revised prioritisation exercise identifies 550 sites within East Riding where there is considered to be a greater risk of contamination from over 15,500
East Riding does not have the same level of contaminated land as some parts of the region (e.g. South Yorkshire).
The council has completed the prioritisation of high-risk sites according to the Contaminated Land Inspection Strategy Review (2003). In carrying out the process the Council resolved to concentrate, initially, on the investigation of the 415 ‘priority sites’ in view of the high overall number of
Soil ERYC Contaminated Land Inspection Strategy 2ND Review, 2005 Communication with ERYC Planning Officer on the third review of the Strategy
Part II Scoping Report (Draft)3 FINAL 80

EAST RIDING OF YORKSHIRE COUNCIL –
SUSTAINABILITY APPRAISAL OF THE ALLOCATIONS DEVELOPMENT PLAN DOCUMENT
Part II Scoping Report
Indicator Quantified data (East Riding) Comparators (Quantified data Trends and targets where Issue identified Associated Source for the Yorkshire and the Humber Region and/or
England and Wales)
identified SEA topics
potential contaminated sites.
contaminated sites. It was resolved to treat the remaining sites as a second phase for the purposes of prioritisation.
The Yorkshire and Humber region, with the exception of the Wash in Norfolk, has the largest area at risk from flooding in the country. As a result of the low lying, flat landscape areas along the Humber Estuary and River Hull, these areas are particularly at risk.
Significant floods affected large parts of the East Riding in June 2007. This resulted in approximately 6,000 households experiencing some damage to their property, 3,000 of which were forced to leave their homes and move into temporary accommodation.
The Environment Agency flood maps of the area indicate that major flood defences are located along the coastline and the main water courses. There are about 235 kilometres of flood defences in the area covered by the Humber Estuary Shoreline Management Plan. . The defences are surveyed regularly to check their condition. The most recent surveys show that most are in "good" or "fair" condition overall.
Yorkshire and The Humber –
More than 244,000 people in the region live in an area at risk of flooding and a sixth of the region's land area lies within the tidal (sea) or fluvial (river) floodplain
More than 90% of the region’s 1,700 km of flood defences are in good or fair condition.
This region is the largest area at risk from flooding in the country
Water, Landscape
Environment Agency: Flood Map; East Riding of Yorkshire Council Climate Change Strategy 2003-2005, April 2003
Extent of floodplain
National average household per capita consumption of water litres per head per day in 2003 was 154.
Water OFWAT Water resources
UK National Air ERYC has no significant emissions from industrial, point or
Human health based Air, Climatic ERYC http://www.airpollution.eas
Part II Scoping Report (Draft)3 FINAL 81
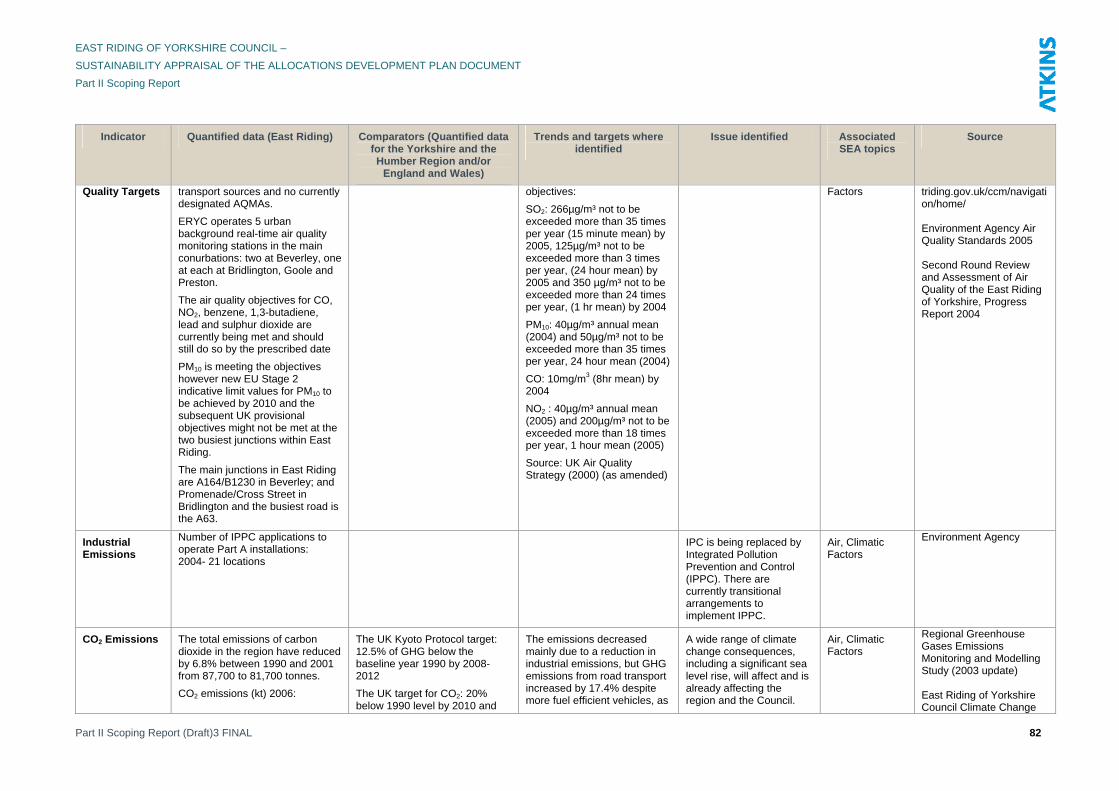
EAST RIDING OF YORKSHIRE COUNCIL –
SUSTAINABILITY APPRAISAL OF THE ALLOCATIONS DEVELOPMENT PLAN DOCUMENT
Part II Scoping Report
Indicator Quantified data (East Riding) Comparators (Quantified data Trends and targets where Issue identified Associated Source for the Yorkshire and the Humber Region and/or
England and Wales)
identified SEA topics
Quality Targets
transport sources and no currently designated AQMAs.
ERYC operates 5 urban background real-time air quality monitoring stations in the main conurbations: two at Beverley, one at each at Bridlington, Goole and Preston.
The air quality objectives for CO, NO2, benzene, 1,3-butadiene, lead and sulphur dioxide are currently being met and should still do so by the prescribed date
PM10 is meeting the objectives however new EU Stage 2 indicative limit values for PM10 to be achieved by 2010 and the subsequent UK provisional objectives might not be met at the two busiest junctions within East Riding.
The main junctions in East Riding are A164/B1230 in Beverley; and Promenade/Cross Street in Bridlington and the busiest road is the A63.
objectives:
SO2: 266µg/m³ not to be exceeded more than 35 times per year (15 minute mean) by 2005, 125µg/m³ not to be exceeded more than 3 times per year, (24 hour mean) by 2005 and 350 µg/m³ not to be exceeded more than 24 times per year, (1 hr mean) by 2004
PM10: 40µg/m³ annual mean (2004) and 50µg/m³ not to be exceeded more than 35 times per year, 24 hour mean (2004)
CO: 10mg/m3 (8hr mean) by 2004
NO2 : 40µg/m³ annual mean (2005) and 200µg/m³ not to be exceeded more than 18 times per year, 1 hour mean (2005)
Source: UK Air Quality Strategy (2000) (as amended)
Factors triding.gov.uk/ccm/navigation/home/ Environment Agency Air Quality Standards 2005 Second Round Review and Assessment of Air Quality of the East Riding of Yorkshire, Progress Report 2004
Number of IPPC applications to operate Part A installations: 2004- 21 locations
IPC is being replaced by Integrated Pollution Prevention and Control (IPPC). There are currently transitional arrangements to implement IPPC.
Air, Climatic Factors
Environment Agency
Industrial Emissions
CO2 Emissions The total emissions of carbon dioxide in the region have reduced by 6.8% between 1990 and 2001 from 87,700 to 81,700 tonnes.
CO2 emissions (kt) 2006:
The UK Kyoto Protocol target: 12.5% of GHG below the baseline year 1990 by 2008-2012
The UK target for CO2: 20% below 1990 level by 2010 and
The emissions decreased mainly due to a reduction in industrial emissions, but GHG emissions from road transport increased by 17.4% despite more fuel efficient vehicles, as
A wide range of climate change consequences, including a significant sea level rise, will affect and is already affecting the region and the Council.
Air, Climatic Factors
Regional Greenhouse Gases Emissions Monitoring and Modelling Study (2003 update) East Riding of Yorkshire Council Climate Change
Part II Scoping Report (Draft)3 FINAL 82

EAST RIDING OF YORKSHIRE COUNCIL –
SUSTAINABILITY APPRAISAL OF THE ALLOCATIONS DEVELOPMENT PLAN DOCUMENT
Part II Scoping Report
Indicator Quantified data (East Riding) Comparators (Quantified data Trends and targets where identified
Issue identified Associated Source for the Yorkshire and the SEA topics Humber Region and/or
England and Wales)
Industry and Commercial: 1,436
Domestic: 892
Road Transport: 689
Total: 3,026
Domestic per capita CO2 (tonnes): 2.9
80% lower than the 1990 baseline by 2050.
Desirable targets for new residential buildings to achieve appropriate rating against national building standards, Code for Sustainable Homes: all new dwellings meeting Code level 3 by 2010, Code level 4 by 2013 and Code level 6 by 2016) or BREEAM (‘Very Good’/ ’Excellent’ standard. This would correspondingly require 25% CO2 emissions reduction by 2010, 44% by 2013 and ‘zero carbon’ by 2016 compared to 2006 (Part L Building Regulations).
Regional target: 20% of GHG below 1990 levels by 2010
Local target:
to work to achieve targets set out under Home Energy Conservation Act to reduce CO2 by 30% by 2010;
to reduce the emission of GHG resulting from the delivery of Council services by 10% by end of 2004.
distance travelled on the region’s roads increased to 39.2 billion vehicle kilometres.
Total CO2 emissions show a 17% increase from 2005 levels, even though domestic per capita emissions have decreased from 3.4 tonnes to 2.9 tonnes over the same period:
CO2 emissions (kt) 2005:
East Riding –
Industry and Commercial: 1,001
Domestic: 890
Road Transport: 716
Total: 2,607
Domestic per capita CO2 (tonnes): 3.4
2006
Yorkshire and the Humber: Domestic per capita CO2 (tonnes): 3.3
However, progress is being made in some areas such as reduced CO2 emissions.
Strategy 2003 – 2005 East Riding of Yorkshire Council Sustainable Energy Strategy 2003 2008 Climate Change Act: http://www.opsi.gov.uk/acts/acts2008/pdf/ukpga_20080027_en.pdf Code for Sustainable Homes: Setting the standard in sustainability for new homes (Feb 2008): http://www.communities.gov.uk/documents/planningandbuilding/pdf/codesustainhomesstandard.pdf
Energy Efficiency
Average SAP rating of authority dwellings (1 (highly inefficient) to 100 (highly efficient)): 78
England – 69.9 2006/07 - 76
2005/06 - 73
2004/05 – 72
The Council are a Beacon Council for their work in eradicating Fuel Poverty.
Air, Climatic Factors
DCLG -BVPI (BV63) – 2007/08 http://www.communities.gov.uk/localgovernment/performanceframeworkpartnerships/bestvalue/bestvalueperformance/ ERYC Sustainable Energy Strategy 2003
Renewable By the end of 2009, installed grid-connected renewable energy
Renewable electricity generated as a percentage of total
UK target: 10% of UK energy should be met from RE by
The Council aims to increase use of RE in new
Air, Climatic East Riding of Yorkshire Council Sustainable
Part II Scoping Report (Draft)3 FINAL 83

EAST RIDING OF YORKSHIRE COUNCIL –
SUSTAINABILITY APPRAISAL OF THE ALLOCATIONS DEVELOPMENT PLAN DOCUMENT
Part II Scoping Report
Indicator Quantified data (East Riding) Comparators (Quantified data Trends and targets where Issue identified Associated Source for the Yorkshire and the Humber Region and/or
England and Wales)
identified SEA topics
Energy (RE)
capacity in the East Riding totalled approximately 39.1 MW- all of which is wind energy. The total grid connected renewable energy in the East Riding either with planning permission or operational totals 157.8MW of which 127.1MW is wind energy (end of 2009 figures).
electricity in the UK 2003 was 2.7.
Yorkshire and Humber region:
About 1.6% in 2002
Regional installed capacity by 2002:
Wind: 26.13 MW
Biomass: 26.7 MW
Small hydro: 0 MW
Solar Photovoltaics: 0.15 MW
2010
Regional target by 2010: 9.4% electricity consumption and 5.1% of current generating capacity
Installed capacity:
Wind: 464.9 MW
Biomass:189.7 MW
Small hydro: 3 MW
Solar Photovoltaics: 16 MW
Regional target by 2021: Possibly 20% electricity consumption and 14.1% of current generating capacity
Local target: procure 25% of ERYC electricity requirement from RE sources, dependent upon national market availability
and existing buildings, to encourage zero-emissions fuels and vehicle technologies and invest into a number of RE installations. Wind energy is seen as the most promising in the short term.
Factors
Energy Strategy 2003
East Riding of Yorkshire Council Climate Change Strategy 2003 – 2005
Progress on Regional Implementation of the Energy White Paper, 2004
Development of a Renewable Energy Assessment and Targets for Yorkshire and the Humber, 2002
Planning for Renewable Energy Targets in Yorkshire and Humber, 2004
Planning permissions and associated monitoring
http://www.gos.gov.uk/goyh/menvrur/enrgy/247547/
3,172 million vehicle km in 2003 East Riding experienced over 21% traffic growth between 1993 and 2003 (an average of 2.1% each year).
Air, Climatic Factors, Population, Human health
DfT’s National Road Traffic Survey- as seen in the Provisional LTP2
Traffic flows for all motor vehicles in the East Riding
6,414,812
England – 48,522,192 average of all transport authorities
2006/07 – 5,852,922
2005/06 – 5,380,655
2004/05 – 5,254,118
Target to be confirmed
Population, Human Health, Air
DCLG –BV 102 – 2007/08
http://www.communities.gov.uk/localgovernment/performanceframeworkpartnerships/bestvalue/bestvalueperformance/
Total number of passenger journeys made annually on all local buses
Modal Split Journeys to junior school:
Cycling - 3.75%
Walking – 51%
Nationally, the average distance cycled fell by 14% between 1991/93 and 2002 to 33 miles per person per year, and the actual number of trips fell by 21%.
Trend:
The proportion of pupils cycling to school has decreased sharply, car use has doubled, and bus and train patronage have remained
Population, Human Health, Air
SEA of LTP2, Provisional LTP2
Part II Scoping Report (Draft)3 FINAL 84

EAST RIDING OF YORKSHIRE COUNCIL –
SUSTAINABILITY APPRAISAL OF THE ALLOCATIONS DEVELOPMENT PLAN DOCUMENT
Part II Scoping Report
Indicator Quantified data (East Riding) Comparators (Quantified data Trends and targets where Issue identified Associated Source for the Yorkshire and the Humber Region and/or
England and Wales)
identified SEA topics
Journeys to secondary school:
Cycling – 4.5%
Walking – 44%
2001- journeys to work by:
cycling – 5% (decreased from 7% in 1991)
steady over past 20 yrs. Reflecting an increasing car ownership.
Target: will be clarified in 2006/07
33% travel further than 10km to work
Census 2001 Distance travelled to work
Conservation of Energy
Local target: to work towards the Home Energy Conservation Act target of a 30% rise in home energy efficiency by 2010.
East Riding of Yorkshire Council Sustainable Energy Strategy 2003
30 historic towns, the best known of which are: Beverley (containing sensitive archaeological areas of major importance), Bridlington and Brough (which contain a rich archaeological heritage) and a number of smaller market towns with surviving medieval cores including Driffield, Hedon, Howden, Market Weighton, Pocklington and South Cave. East Riding also has approximately 400 scheduled monuments, of which 190 were considered to be at risk in 2009
Cultural Heritage English Heritage
http://www.mkweb.co.uk/archaeology/home.asp?r=32994 - #
English Heritage At Risk Register 2009
Archaeological Sites
No. of Listed Buildings and proportion at risk
In February 2010, ERYC had 2,408 Listed Buildings with a significant number found in Beverley, Bridlington and Hedon.
103 listed Grade I
162 listed Grade II*
England –
Approximately 372,905 listed buildings. 2.5% are grade I listed, 5.5% are grade II* listed, 92% are grade II listed. Also:
19446 scheduled
Cultural Heritage English Heritage Buildings at Risk Register 2009
listed buildings: http://www.english-heritage.org.uk/server/sho
Part II Scoping Report (Draft)3 FINAL 85

EAST RIDING OF YORKSHIRE COUNCIL –
SUSTAINABILITY APPRAISAL OF THE ALLOCATIONS DEVELOPMENT PLAN DOCUMENT
Part II Scoping Report
Indicator Quantified data (East Riding) Comparators (Quantified data Trends and targets where Issue identified Associated Source for the Yorkshire and the Humber Region and/or
England and Wales)
identified SEA topics
2116 are Grade II
11 buildings classed as ‘at risk’ by EH.
There is also one Protected Wreck at Filey Bay, North Yorkshire, near to the northern boundary of East Riding
There are no world heritage sites but there is one historic park and one battlefield, both of which are considered to be at risk.
monuments
1563 registered historic parks and gardens
39 designated wrecks
15 world heritage sites
w/nav.1373
http://lbonline.english-heritage.org.uk/SearchForm.aspx
Number of conservation areas
The Conservation Areas in East Riding are Adlingfleet, Airmyn, Aldbrough, Allerthorpe, Atwick, Bainton, Barmby Moor, Bessingby, Beswick, Beverley (Town), Beverley (Grosvenor Place), Bewholme, Bishop Burton, Bishop Wilton, Brandesburton, Brantingham, Bridlington (Old Town), Bridlington Hilderthorpe, Bridlington Quay, Brough, Bugthorpe. Burton Agnes, Burton Pidsea, Catwick, Cherry Burton, Cottingham, Cranswick, Driffield (North), Driffield (South), Dunnington, Easinton, East Cottingwith, Ellerker, Elloughton, Elloughton (Dale Road), Etton, Everingham, Flamborough, Foster-on-the-Wolds, Garton-on-the-Wolds, Goodmanham, Great Hatfield, Halsham (West), Hendon, Hendon Haven), Hessle (Southfield), Hessle (Town), Hilston, Holmpton, Hornsea, Hotham, Howden, Kilham, Kirby Underdale, Kirk Ella, Langtoft, Lelley, Leven, Lockington, Londesborough, Long Riston (new), Lund, Market Weighton,
England – 9080 conservation areas
Previously 80 conservation areas in the borough
Number of Conservation Areas within the Borough is growing.
Cultural Heritage ERYC – website – list of conservation areas, 28/7/2009
http://www.eastriding.gov.uk/atoz/details.aspx?id=619§ion=5
Part II Scoping Report (Draft)3 FINAL 86

EAST RIDING OF YORKSHIRE COUNCIL –
SUSTAINABILITY APPRAISAL OF THE ALLOCATIONS DEVELOPMENT PLAN DOCUMENT
Part II Scoping Report
Indicator Quantified data (East Riding) Comparators (Quantified data Trends and targets where Issue identified Associated Source for the Yorkshire and the Humber Region and/or
England and Wales)
identified SEA topics
Nafferton, North Cave, North Dalton, North Ferriby (Parkfield), North Ferriby (village), North Newbald, Ottringham, Patrington, Paull, Pocklington, Preston, Rawcliffe, Roos, Seaton, Sewerby, Shiptonthorpe, Sigglesthorne, Skidsby, Sledmere, Snaith, South Cave, South Newbald, Sproatley, Stamford Bridge, Sunk Island, Swanland, Swine, Tibthorpe, Tickton, Tunstall, Walkington, Warter, Welton, West Ella, Wetwang, Winestead, Withernwick, Wald Newton, Wyton
The Council manages and maintains 14 parks and gardens across the East Riding. Sewerby Park is a major tourist attraction and receives 160,000 visitors a year. The Council manages and maintains 1,800 hectares of parks, 46 play areas, verges, 6 cemeteries, school grounds and 55 playing fields.
Cultural Heritage ERYC web site: Parks and Open Spaces http://www.eastriding.gov.uk/cs/streetscene/environmental-operations/parks/
Urban Open Space
The last Woodland Census of the East Riding area was carried out between 1979 and 1982. This census revealed that the total area of woodland was 8702 ha at this time.
Hull and the East Riding has only 2.6% woodland cover.
The regional and local woodland cover is less than the national average and it is suggested that the area would benefit from an increase in tree cover.
Landscape Small Wood Association: HEYwood http://initiatives.smallwoods.org.uk/index.php?link=directory.php&id=2107 East Riding Biodiversity Action Plan 2001-2006, May 2001
Woodland
Landscape Character - Countryside Character Areas
1. Holderness:
low-lying, predominantly flat or gently undulating plateau jutting into the North Sea and dividing it from the Humber Estuary;
Rapidly eroding, soft clay,
Variety of landscape character areas across England, including one for Yorkshire and Humber.
Various character area specific measures for shaping the future are suggested, including: Appropriate woodland
planting High quality design Restoration of historic
Landscape Natural England: http://www.naturalengland.org.uk/ourwork/landscape/englands/character/areas/yorkshumber.aspx
Part II Scoping Report (Draft)3 FINAL 87
EAST RIDING OF YORKSHIRE COUNCIL –
SUSTAINABILITY APPRAISAL OF THE ALLOCATIONS DEVELOPMENT PLAN DOCUMENT
Part II Scoping Report
Indicator Qua fied data (East Riding) nti Comparators (Quantified data Trends and targets where identified
Issue identified Associated Source for the Yorkshire and the SEA topics Humber Region and/or
England and Wales)
cliff coast;
High-quality agricultural land used predominantly for large-scale arable cultivation and intensive livestock farming;
Sparse tree and woodland cover leading to a generally open landscape with long views – enclosed by the wolds to the north and west;
Highly fragmented, though locally prominent, remnants of semi-natural vegetation including Hornsea Mere and various carr, swamp and damp grassland habitats.
2. Yorkshire Wolds:
Prominent escarpment and foothills rising from the Vales of York and Pickering and falling to the plain of Holderness;
Remnants of unimproved or semi-improved chalk grassland in steep sided dry valleys, often defined by a hedge at the break of slope and sometimes showing signs of scrub encroachment. Important archaeological remains with a particular concentration of prehistoric earthworks including burial mounds;
A large-scale landscape of rounded, rolling hills, with big skies and long views from the escarpment and
features to provide new wetland landscapes and wildlife habitats
Wider coastal and riparian restoration
Part II Scoping Report (Draft)3 FINAL 88
EAST RIDING OF YORKSHIRE COUNCIL –
SUSTAINABILITY APPRAISAL OF THE ALLOCATIONS DEVELOPMENT PLAN DOCUMENT
Part II Scoping Report
Indicator Quantified data (East Riding) Comparators (Quantified data Trends and targets where Issue identified Associated Source for the Yorkshire and the Humber Region and/or
England and Wales)
identified SEA topics
plateaux, contrasting with the more enclosed, sheltered valleys;
Fertile, chalky soils supporting mainly arable farming;
High chalk cliffs where the outcrop reaches the coast at Flamborough Head;
Limited extent of woodland, mainly confined to steep slopes, escarpments and the hills formed from Jurassic rocks.
3. Vale of York:
Low lying, generally flat or gently undulating land, crossed by obvious ridges formed by the York and Escrick glacial moraines;
Floodplains of several major rivers notably the Ouse, the Derwent and the Wharfe, but also the Ure, Nidd and Foss;
Medium to large sized open fields intensively cultivated for arable crops, but with some dairy farming;
Low, flailed, intermittent hedges forming field boundaries with sparse, scattered hedgerow trees;
Scattered small woods, with more extensive conifer plantations on sandy soils, together creating an impression of wooded farmland in some areas;
Part II Scoping Report (Draft)3 FINAL 89

EAST RIDING OF YORKSHIRE COUNCIL –
SUSTAINABILITY APPRAISAL OF THE ALLOCATIONS DEVELOPMENT PLAN DOCUMENT
Part II Scoping Report
Indicator Qua g) ntified data (East Ridin Comparators (Quantified data Trends and targets where Issue identified Associated Source for the Yorkshire and the Humber Region and/or
England and Wales)
identified SEA topics
Remnants of heathland commons on sandy soils
4. Humberhead Levels:
Widespread evidence of industrial activity including mine buildings, former spoil tips, and iron and steel plants;
Complex mix of built-up areas, industrial land, dereliction and farmed open country;
Many areas affected by urban fringe pressures creating fragmented and downgraded landscapes;
Substantial areas of intact agricultural land in both arable and pastoral use;
Small, fragmented remnants of pre-industrial landscape and semi-natural vegetation, including many areas of woodland, river valley habitats, subsidence flashes and other relict habitats.
5. Humber Estuary:
Expansive, flat, low-lying, sometimes remote estuarine landscape dominated by the Humber and with an ever changing character due to tidal influences;
Dominance of sky and open views over the estuary, mudflats and salt marshes, where flood embankments allow;
Part II Scoping Report (Draft)3 FINAL 90

EAST RIDING OF YORKSHIRE COUNCIL –
SUSTAINABILITY APPRAISAL OF THE ALLOCATIONS DEVELOPMENT PLAN DOCUMENT
Part II Scoping Report
Indicator Quantified data (East Riding) Comparators (Quantified data Trends and targets where Issue identified Associated Source for the Yorkshire and the Humber Region and/or
England and Wales)
identified SEA topics
A predominantly reclaimed former inter-tidal landscape of rectilinear fields with boundaries formed by dykes, drains and embankments;
A landscape of predominantly arable farming with some conspicuous areas of market gardening, particularly around Hull;
Internationally important coastal mudflats and other wetland and coastal habitats, including the Spurn peninsula.
Countryside Quality Counts (CQC)
Changes identified:
1. Holderness:
Woodlands - Relatively low existing woodland cover expanded by about 26% through planting. Planting mostly in scattered small blocks – but large area NE of Beverley. Some Woodland Grant Scheme (WGS) uptake for existing woodlands
Boundary features - Statistics 2000 suggests that hedges and fences are major boundary types, and that hedges have been stable, while fences have expanded. Some limited statistics agreements for hedgerow management.
Agriculture - Marked expansion (5%) of set-aside and increase in ‘other’ farm types. No increase in
The 1999-2003 CQC assessment classifies Holderness Joint Character Areas (JCA) as a neglected area. Although woodland character has been strengthened, slow changes in agricultural landscape, in river and coastal elements and more marked changes in development patterns are tending to transform the character of the area. The overall character therefore remains weakened or neglected
Countryside Agency: http://www.countryside-quality-counts.org.uk/cap/yorkhumb/index_yh.htm
Part II Scoping Report (Draft)3 FINAL 91

EAST RIDING OF YORKSHIRE COUNCIL –
SUSTAINABILITY APPRAISAL OF THE ALLOCATIONS DEVELOPMENT PLAN DOCUMENT
Part II Scoping Report
Indicator Qua g) ntified data (East Ridin Comparators (Quantified data Trends and targets where Issue identified Associated Source for the Yorkshire and the Humber Region and/or
England and Wales)
identified SEA topics
stocking density but pig numbers has increased.
Settlement & development - Concentrated development at Beverley, Gt Driffield and Hull for residential. Out of town commercial development in north – Carnaby Industrial estate
Semi-natural habitats - Some statistics payments for area features – such as lowland pasture – neutral grassland SSSI in unfavourable recovering condition.
River & coastal management - CS payments for management of waterside vegetation, more limited agreement for coastal vegetation
2. Yorkshire Wolds:
Woodlands - New planting accounts for an increase of about 7% in woodland area. New planting reinforces existing patterns. High uptake of WGS for existing woodland. Good coverage of WGS within small Ancient Woodland (AW) component.
Boundary features – Statistics 2000 suggests that while hedges and fences are the major boundary types, hedges have been stable and the length of fences has increased markedly. Some statistics agreements for hedgerow management and
The 1999-2003 CQC overall assessment classifies Yorkshire Wolds Joint Character Areas (JCA) as an enhancing area. Apart from the pressures of development which are locally transforming character, the other elements that shape the character of this area mostly show changes that would strengthen their contribution to character, although boundary and river and coastal management initiatives could be extended.
Part II Scoping Report (Draft)3 FINAL 92

EAST RIDING OF YORKSHIRE COUNCIL –
SUSTAINABILITY APPRAISAL OF THE ALLOCATIONS DEVELOPMENT PLAN DOCUMENT
Part II Scoping Report
Indicator Qua ) ntified data (East Riding Comparators (Quantified data Trends and targets where Issue identified Associated Source for the Yorkshire and the Humber Region and/or
England and Wales)
identified SEA topics
sheep fencing. Agreement rates for linear features above national average.
Agriculture - Shift from crops and fallow to set-aside, and loss of grassland cover. Grazing levels are constant. Expansion of general cropping and other. Statistics grassland agreements and attention to arable margins
Settlement & development - Development in rural areas has taken place at rates similar to regional average. Some pressure of redevelopment in towns and village envelopes in peri-urban zone, mainly for residential.
Semi-natural habitats - Good uptake of statistics for area semi-natural features esp. for calcareous grassland management and regeneration of limestone grassland.
River & coastal management - Some limited cliff and dune management and management of waterside vegetation.
3. Vale of York:
Woodlands - New planting has added about 8% to existing area – which is low. Blocks scattered throughout the area – reinforces fragmented pattern. Good coverage of WGS
The 1999-2003 CQC overall assessment classifies The Vale of York Joint Character Areas (JCA) as a neglected area. The agricultural character remains weakened, and there is little evidence of restoration of boundary, historic or semi-natural
Part II Scoping Report (Draft)3 FINAL 93

EAST RIDING OF YORKSHIRE COUNCIL –
SUSTAINABILITY APPRAISAL OF THE ALLOCATIONS DEVELOPMENT PLAN DOCUMENT
Part II Scoping Report
Indicator Quantified data (East Riding) Comparators (Quantified data Trends and targets where Issue identified Associated Source for the Yorkshire and the Humber Region and/or
England and Wales)
identified SEA topics
agreements for existing woodlands and AW (which cover only about 6% of woodland area)
Boundary features – Statistics 2000 suggests that fences and hedges are most common boundary types and that sock of hedges is roughly constant. Increase in fences more marked. Some evidence of statistics agreements for hedgerow management and fencing; uptake rates above national average.
Agriculture - Some grassland loss and shift from crops and fallow to set-aside. No increase in stocking density. Some evidence of farm amalgamation and expansion in the number of mixed and esp. other farm types
Settlement & development - Marked development pressure for residential in urban areas, towns and villages, together with urban fringe, village enveloped esp. in peri-urban zone.
Semi-natural habitats - Strong uptake of statistics agreements for area features – but no evidence of agreements for heath restoration.
River & coastal management- Some statistics agreements for
features. There is some evidence of strengthening of woodland character, however, given the pressure of development the overall JCA is judged to have remained weakened or possibly diverging
Part II Scoping Report (Draft)3 FINAL 94

EAST RIDING OF YORKSHIRE COUNCIL –
SUSTAINABILITY APPRAISAL OF THE ALLOCATIONS DEVELOPMENT PLAN DOCUMENT
Part II Scoping Report
Indicator Qua ) ntified data (East Riding Comparators (Quantified data Trends and targets where Issue identified Associated Source for the Yorkshire and the Humber Region and/or
England and Wales)
identified SEA topics
management of waterside vegetation. 11% increase in pig numbers
4. Humberhead Levels:
Woodlands - Relatively low existing woodland cover – but expanded by about 6% by new planting. Some planting associated with conifer north of Selby, and in valley of Idle in south. Relatively low uptake of WGS for existing woodland.
Boundary features - agreements for hedgerow management
Agriculture - Grassland area stable, but shift of crops and fallow to set-aside. Small increase in stocking rates. Increase in number of ‘other’ farm types. Some limited statistics agreements for pasture management, but neutral grassland SSSI are mostly in unfavourable recovering condition class.
Settlement & development - Development rates in rural areas higher than regional average, with significant conversions to commercial and residential in open countryside, isolated farm, hamlet and village. Semi-natural habitats - No evidence of statistics agreements for heathlands or specifically for mires – but some management of
The 1999-2003 CQC overall assessment classifies The Humberhead Levels Joint Character Areas (JCA) as a diverging area. Changes in agricultural character and development patterns continue to transform the area; these changes are not outweighed by enhancements in woodland and management of historic features.
Part II Scoping Report (Draft)3 FINAL 95
EAST RIDING OF YORKSHIRE COUNCIL –
SUSTAINABILITY APPRAISAL OF THE ALLOCATIONS DEVELOPMENT PLAN DOCUMENT
Part II Scoping Report
Indicator Quantified data (East Riding) Comparators (Quantified data Trends and targets where Issue identified Associated Source for the Yorkshire and the Humber Region and/or
England and Wales)
identified SEA topics
waterside land. SSSI cover 3% of CCA – bulk of which is bog – mostly in unfavourable declining condition. Fen marsh swamp is mostly recovering.
Historic features - Some statistics agreements for management of historic landscapes
River & coastal management - Some management of waterside vegetation.
5. Humber Estuary:
Woodlands - Woodland planting has been limited – cover characteristically low. However, no evidence of use of woodland for screening.
Boundary features - Statistics 2000 suggests fences and hedges are the most common boundary types in these types of landscape – fences have expanded but hedges are more stable. Low rates of statistics uptake especially for hedgerow management.
Agriculture - Small reduction in total cultivated area, but grasslands appear more stable and shift into set-aside. Reduction in number of farm units.
Settlement & development - Marked conversion from undeveloped to developed in rural locations. Marked
The 1999-2003 CQC assessment classifies the Humber Estuary Joint Character Areas (JCA) as a diverging area. Woodland is probably of secondary importance for overall character and the judgement that the JCA shows changes inconsistent with character is based on agriculture and settlement, both of which continue to diverge from the landscape visions suggested for the area. River and coastal features, which are also a key theme, show no sign of significant enhancement
Part II Scoping Report (Draft)3 FINAL 96

EAST RIDING OF YORKSHIRE COUNCIL –
SUSTAINABILITY APPRAISAL OF THE ALLOCATIONS DEVELOPMENT PLAN DOCUMENT
Part II Scoping Report
Indicator Qua ) ntified data (East Riding Comparators (Quantified data Trends and targets where Issue identified Associated Source for the Yorkshire and the Humber Region and/or
England and Wales)
identified SEA topics
commercial developments around Immingham and Barton-upon-Humber
Semi-natural habitats - Limited habitat creation – but SSSI which cover 7% of area are all in favorable condition.
River & coastal management - Limited statistics agreements for coastal vegetation
Landscape character types
Vale of York: Flat Open Farmland, Open Farmland, River Corridors
Humberhead Levels: River Corridors, Open Farmland, Wooded Open Farmland, Foulness Open Farmland, M62 Corridor Farmland, Drained Open Farmland
Yorkshire Wolds: Complex Sloping Farmland, Jurassic Hills Farmland, Sloping Wooded Farmland, Open High Rolling Farmland, Central Dissected Plateau, Wolds Valley Farmland
Holderness: Sloping Farmland, Farmed Urban Fringe, Low Lying Drained Farmland, Open Farmland: Coastal Farmland
Humber Estuary: Low Lying Drained Farmland, Farmed Urban Fringe, Humber Banks
Countryside Agency
Tranquillity East Riding of Yorkshire is ranked as No.7 (where No.1 is most tranquil) among 87 English Unitary Authorities.
The East Riding of Yorkshire mean tranquillity score: 5.9
Mean tranquillity score Yorkshire and the Humber - 4.16 England - 9.34
In the Yorkshire and the Humber area North Yorkshire has the highest level of tranquillity, followed by Humber with spots of low tranquillity (Kingston upon Hull).
Landscape, Human Health
Campaign to Protect Rural England: http://www.cpre.org.uk/campaigns/landscape/tranquillity/local-tranquillity-scores
Part II Scoping Report (Draft)3 FINAL 97

EAST RIDING OF YORKSHIRE COUNCIL –
SUSTAINABILITY APPRAISAL OF THE ALLOCATIONS DEVELOPMENT PLAN DOCUMENT
Part II Scoping Report
Indicator Quantified data (East Riding) Comparators (Quantified data Trends and targets where Issue identified Associated Source for the Yorkshire and the Humber Region and/or
England and Wales)
identified SEA topics
Tranquillity of South and West Yorkshire is significantly lower.
Agriculture
90% of the land area is classified as agricultural land
81% of Humberside is agricultural yet there is also a large city in Kingston upon Hull
In the UK 2003 area covered by:
Agricultural land - Grasses & rough grazing 1: 50%
Agricultural land - Crops & bare fallow: 19%
Agricultural land – Other 2: 4%
Forest & woodland 3: 12%
Urban land & land not otherwise specified 4: 14%
Inland water 5: 1%
Landscape The National Land & Property
Stamford Bridge Yorkshire and the Humber - 7 Registered Battlefields
England - 43 historic battlefields
English Heritage
http://www.english-heritage.org.uk/server.php?search_word=&terms=all&inTitles=on&catId%5B1%5D%5B%5D=&catId%5B2%5D%5B%5D=002002006&catId%5B3%5D%5B%5D=&Y1=&Y2=&show=nav.8650&contentType=conBattlefield&searchType=EHBattleField&submit=Search
Registered Battlefields
Registered Parks and Gardens
Burton Constable
Dalton Hall
Houghton Hall
Londesborough Park
English Heritage
Part II Scoping Report (Draft)3 FINAL 98

EAST RIDING OF YORKSHIRE COUNCIL –
SUSTAINABILITY APPRAISAL OF THE ALLOCATIONS DEVELOPMENT PLAN DOCUMENT
Part II Scoping Report
Indicator Quantified data (East Riding) Comparators (Quantified data Trends and targets where Issue identified Associated Source for the Yorkshire and the Humber Region and/or
England and Wales)
identified SEA topics
Risby Hall
Thwaite Hall
Sledmere House
64% Yorkshire and The Humber – 67%
England – 72%
2000/1
60%
Satisfaction is increasing at all levels, though East Riding is somewhat behind comparators
DCLG - NRU, Floor Targets – 2003/4
Percentage of residents satisfied with local parks and open spaces
Table A.1 - Baseline Data, Indicators and Trends for Economic Issues
Quantified data (East Riding) Comparators (Quantified data for the Yorkshire and the Humber Region and/or
England and Wales)
Trends and targets where identified
Issue identified Associated SEA topics
Source Indicator
East Riding –
2004/05:
19.21%
England – 38.07% 2002/03 – 10.6
2003/04 – 12.0
2003/04 – 8.8
Material Assets DCLG –BV 96 – 2004/05 http://www.communities.gov.uk/localgovernment/performanceframeworkpartnerships/bestvalue/bestvalueperformance/ Information many of these sources taken from: https://www.nomisweb.co.uk/reports/lmp/la/2038432012/report.aspx?town=east%20riding#tabrespop
Percentage of principal roads in need of repair
Measure of Productivity
East Riding – 16,471 (2001) Yorkshire and The Humber – 14,041
England – 15,585
(2001)
2000 – 12,411 Population, Material Assets
ODPM- NRU, Floor Targets
Part II Scoping Report (Draft)3 FINAL 99

EAST RIDING OF YORKSHIRE COUNCIL –
SUSTAINABILITY APPRAISAL OF THE ALLOCATIONS DEVELOPMENT PLAN DOCUMENT
Part II Scoping Report
Indicator Quantified data (East Riding) Comparators (Quantified data Trends and targets where Issue identified Associated Source for the Yorkshire and the Humber Region and/or
England and Wales)
identified SEA topics
East Riding – 59.3% Yorkshire and The Humber – 62.3%
Great Britain – 62.2%
2003
59.6%
Population ONS mid-year population estimates - 2007
Working age people
East Riding –
NVQ4 and above - 53,100 (27%)
NVQ3 and above - 96,600 (49.2%)
NVQ2 and above – 133,900 (68.1%)
NVQ1 and above - 165,300 (84.1%)
Other Qualifications - 10,000 (5.1%)
No Qualifications - 21,200 (10.8%)
Yorkshire and The Humber –
NVQ4 and above – 23.8%
NVQ3 and above – 42.3%
NVQ2 and above – 61.3%
NVQ1 and above – 77%
Other Qualifications – 8.5%
No Qualifications – 14.5%
Great Britain –
NVQ4 and above – 28.6%
NVQ3 and above – 46.4%
NVQ2 and above – 64.5%
NVQ1 and above – 78.1%
Other Qualifications – 8.8%
No Qualifications – 13.1%
Mar 2003-Feb 2004
NVQ4 and above - 47,600 (25.1%)
NVQ3 and above - 85,100 (44.8%)
NVQ2 and above - 125,200 (66.0%)
NVQ1 and above - 158,500 (83.6%)
Other Qualifications - 9,900 (5.2%)
No Qualifications - 21,300 (11.2%)
Population ONS annual population survey - Jan 2007-Dec 2007
Qualifications of working age population
East Riding – 59.6% Yorkshire and The Humber – 60.9%
Great Britain – 61.4%
Population NOMIS and midyear population estimates (2003)
Percentage of Working Age based on total population
East Riding – 3.04% Yorkshire and The Humber – 3.71%
Great Britain – 3.35%
Population Neighbourhood Statistics
(April 2001)
Unemployment (people aged 16-74)
% of unemployed, based on economically active
East Riding – 4% Yorkshire and The Humber – 5.9%
Great Britain – 5.3%
Jan 2004- Dec 2004
3.2%
According to the 2001 Census, of the people in East Riding of Yorkshire who were unemployed, 25.43% were aged 50 and over, 6.96% had never worked and 30.13% were long-term unemployed
Population ONS annual population survey - Oct 2007-Sep 2008
% of East Riding – 3.5% Yorkshire and The Humber – July 2005 The wards with the highest Population, ONS claimant count with
Part II Scoping Report (Draft)3 FINAL 100

EAST RIDING OF YORKSHIRE COUNCIL –
SUSTAINABILITY APPRAISAL OF THE ALLOCATIONS DEVELOPMENT PLAN DOCUMENT
Part II Scoping Report
Indicator Quantified data (East Riding) Comparators (Quantified data Trends and targets where Issue identified Associated Source for the Yorkshire and the Humber Region and/or
England and Wales)
identified SEA topics
Jobseekers Allowance (JSA) claimants as a proportion of resident working-age people
4.8%
Great Britain – 4.1%
1.9% numbers of Income Support claimants are:
Bridlington South;
South East Holderness;
Bridlington Central & Old Town;
Goole South;
Hessle
Material Assets rates and proportions - May 2009
East Riding – 81.1% Yorkshire and The Humber – 78.3%
Great Britain – 78.8%
Jan 2004-Dec 2004
77.6%
Population, Material Assets
NOMIS - ONS annual population survey (October 2007 – September 2008)
Percentage of economically active from working age people
Percentage of economically inactive working age people
East Riding – 18.9% out of which 3.2% want a job and 15.7% do not want a job)
Yorkshire and The Humber – 21.7 % out of which 5.2% want a job and 16.5% do not want a job)
Great Britain – 21.2% out of which 5.6% want a job and 15.6% do not want a job)
Jan 2004 – Dec 2004
22.4%
out of which 3.0% want a job and 19.4% do not want a job)
Population, Material Assets
NOMIS - ONS annual population survey (October 2007 – September 2008)
East Riding – 0.76 Yorkshire and The Humber – 0.86
Great Britain – 0.88
Population, Material Assets
ONS jobs density - 2006 Job Density representing the ratio of total jobs to working-age population
New firms: VAT registrations per 10,000 adult persons
East Riding – 35.2 Yorkshire and The Humber – 31
England – 38.8
2003 – 39.4
2004 – 34.1
2005 – 34.9
Material Assets ODPM- NRU, Floor Targets – 2006
Part II Scoping Report (Draft)3 FINAL 101
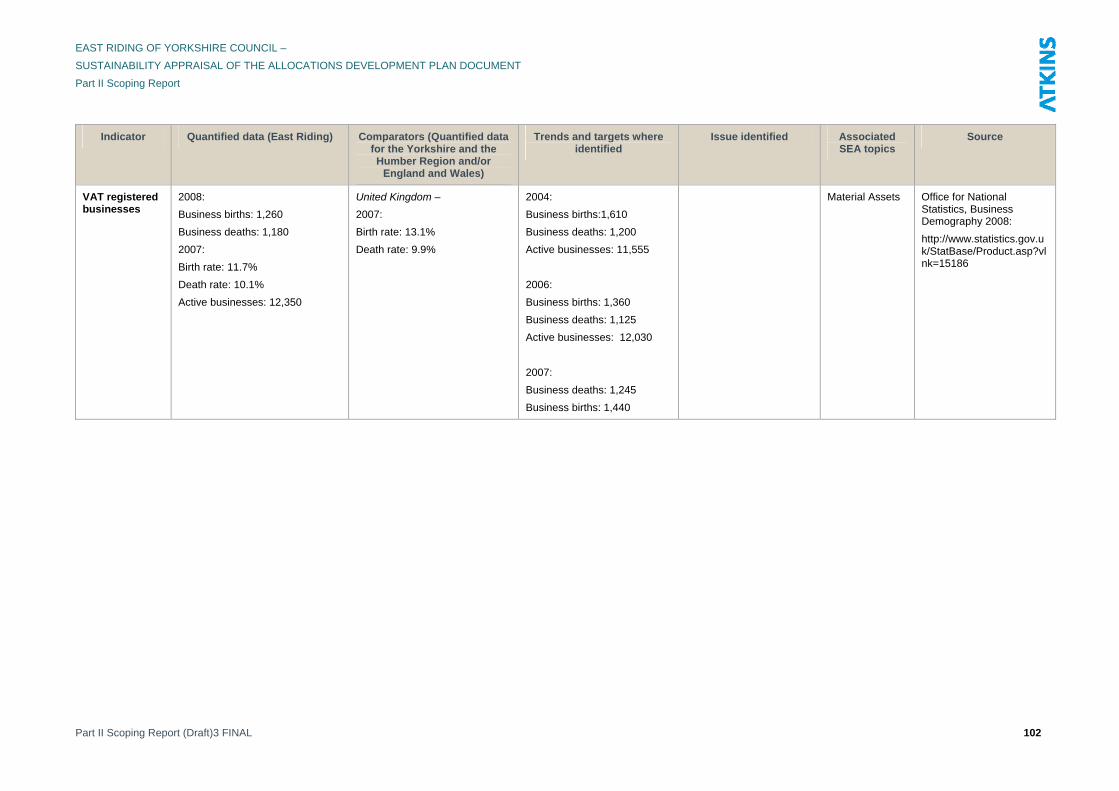
EAST RIDING OF YORKSHIRE COUNCIL –
SUSTAINABILITY APPRAISAL OF THE ALLOCATIONS DEVELOPMENT PLAN DOCUMENT
Part II Scoping Report
Part II Scoping Report (Draft)3 FINAL 102
Indicator Quantified data (East Riding) Comparators (Quantified data for the Yorkshire and the Humber Region and/or
England and Wales)
Trends and targets where identified
Issue identified Associated SEA topics
Source
VAT registered businesses
2008:
Business births: 1,260
Business deaths: 1,180
2007:
Birth rate: 11.7%
Death rate: 10.1%
Active businesses: 12,350
United Kingdom –
2007:
Birth rate: 13.1%
Death rate: 9.9%
2004:
Business births:1,610
Business deaths: 1,200
Active businesses: 11,555
2006:
Business births: 1,360
Business deaths: 1,125
Active businesses: 12,030
2007:
Business deaths: 1,245
Business births: 1,440
Material Assets Office for National Statistics, Business Demography 2008:
http://www.statistics.gov.uk/StatBase/Product.asp?vlnk=15186

EAST RIDING OF YORKSHIRE COUNCIL –
SUSTAINABILITY APPRAISAL OF THE ALLOCATIONS DEVELOPMENT PLAN DOCUMENT
Part II Scoping Report
This page has been left intentionally blank.
Part II Scoping Report (Draft)3 FINAL 103

EAST RIDING OF YORKSHIRE COUNCIL –
SUSTAINABILITY APPRAISAL OF THE ALLOCATIONS DEVELOPMENT PLAN DOCUMENT
Part II Scoping Report
Part II Scoping Report (Draft)3 FINAL 104
This page has been left intentionally blank.

EAST RIDING OF YORKSHIRE COUNCIL –
SUSTAINABILITY APPRAISAL OF THE ALLOCATIONS DEVELOPMENT PLAN DOCUMENT
Pa
Part II Scoping Report (Draft)3 FINAL 105
rt II Scoping Report Atkins is an international Design, Engineering & Management Consultancy. Our clients choose Atkins to plan, design and enable their major projects across a wide range of disciplines both in the UK and overseas. We are the largest engineering consultancy in the UK and the largest multi-disciplinary consultancy in Europe. Our unrivalled reputation rests on the skills of the 15,000 specialists within the organisation. Our clients are varied and include governments, local and regional authorities, funding agencies and commercial and industrial enterprises. We help our clients to realise their objectives by developing and delivering practical solutions, adding value to their businesses through the application of our experience, innovative thinking and state-of-the-art technology.
Atkins Limited 5th Floor, Milford House 1 Milford Street Swindon Wiltshire SN1 1DW
Contact: Mark Hewlett
Telephone number: +44 (0) 1793 516961
Fax number: +44 (0) 1793 516916
Email: [email protected]
Web address: www.atkinsglobal.com/environment