
East of the River Action for Substance Abuse … · East of the River Action for Substance Abuse...
24
East of the River Action for Substance Abuse Elimination Epidemiologic Profile of Substance Use, Suicide & Problem Gambling Submitted by Executive Director: Bonnie Weyland Smith, MPH, CPH East of the River Action for Substance Abuse Elimination January 2013
Transcript of East of the River Action for Substance Abuse … · East of the River Action for Substance Abuse...

East of the River Action for Substance Abuse Elimination Epidemiologic Profile of Substance Use, Suicide & Problem Gambling
Submitted by Executive Director: Bonnie Weyland Smith, MPH, CPH East of the River Action for Substance Abuse Elimination
January 2013

Contributors
Bonnie Weyland Smith, MPH, CPH .......................................................................................... – Executive Director, ERASE Inc.
Christine Miskell, DVM, MPH ........................................................................................... ERASE Contracted Research Analyst
Melisa Luginbuhl ..................................................................................................................... Project Coordinator, ERASE Inc.
Ashley Murphy ................................................................................................................. Prevention Coordinator, ERASE, Inc.
Cephus Nolen .......................................................................................................... ERASE BOD/ East Hartford Youth Services
Sheryl Sprague ........................................................................................................................................ Glastonbury LPC Chair
Christine Turner .................................................................................................................... Enfield Youth and Family Services
Heather Wlochowski .................................................................................................... Manchester Youth and Family Services
Joann Moriarty ........................................................................................................ South Windsor Youth and Family Services
Kimberly McTighe ................................................................................................................ Vernon Youth and Family Services
Tammy Blew-Gowash ....................................................................................................................................... Somers Teacher
Emily Dickinson ........................................................................................................... Glastonbury Youth and Family Services
Peggy Tunick .......................................................................... Andover, Hebron, and Marlborough Youth and Family Services
Nancy Dunn ......................................................................................................................... Tolland Youth and Family Services
Deborah Stauffer ............................................................................................................... Ellington Youth and Family Services
Abbreviations
CT DPH ..................................................................................................................... Connecticut Department of Public Health
CNAW .................................................................................................................... Community Needs Assessment Workgroup
CT SDE....................................................................................................................................... State Department of Education
DMHAS ........................................................................................... Department of Mental and Health and Addiction Services
DAWN ......................................................................................................................................... Drug Abuse Warning Network
ERASE........................................................................................................... East of the River for Substance abuse Elimination
LPC ...................................................................................................................................................... Local Prevention Council
NHTSA ............................................................................................................. National Highway Traffic Safety Administration
NIDA ...................................................................................................................................... National Institute on Drug Abuse
NSDUH ....................................................................................................................... National Survey on Drug Use and Health
SEOW .............................................................................................................. State Epidemiologic and Outcomes Workgroup
SPF ......................................................................................................................................... Strategic Prevention Framework
YRBSS ......................................................................................................................... Youth Risk Behavior Surveillance System

Executive Summary
East of the River Action for Substance Abuse Elimination, Inc. (ERASE) is one of Connecticut’s 13-Regional Action Councils for substance abuse prevention and wellness. ERASE serves 15-towns east of the Connecticut River. The ERASE Region is known as sub-region 4-A for the Department of Mental Health and Addiction Services (DMHAS). DMHAS is one of ERASE’s funders and partners on many prevention initiatives, including the creation of this Prevention Priority Profile. ERASE provides funding and technical assistance to the 13 local substance abuse prevention councils (LPCs) which are the grassroots prevention innovators for the 15 towns which make up the sub-region. The members of these LPCs are ERASE’s community partners and contributors to this body of work.
In this 2012 Priority Prevention Process ERASE and its partners made several determinations:
Marijuana use among youth and adults is a growing concern for communities, with little proven prevention practices deemed effective to reduce and prevent use;
Communities have more capacity and readiness to address suicide prevention and postvention than they have ever in the past;
Prescription drug abuse is on the rise, particularly among young adults, however school survey data does not reflect the magnitude of the problem sufficiently, since it is a problem that magnifies in young adults;
Heroin is a significant problem in communities but the “underground” nature of heroin’s drug trade and users make it difficult to quantify at the local level;
Alcohol use, specifically underage drinking, continues to be a serious concern; however communities feel more equip than ever to implement effective prevention strategies.
Within this Prevention Priority Profile there is a an Introduction including the background of ERASE, Inc., the history of this Prevention Priority Process, the demographics of Sub-Region 4-A, and the methods, process and data sources used to create the report. Each of the six substances and two related behaviors ERASE was asked to examine locally, by DMHAS, has its own Epidemiological Profile which includes information on the national, state-wide, sub-regional and to the extent available, town-level magnitude and impact of the substance use or behavior. Additionally, the profile notes the sub-region’s capacity to address the substance abuse problem or behavior, as well as ERASE and the LPC’s, strengths and limitations regarding prevention and gathering data of the mentioned issue.
Lastly, the report’s Conclusion notes how the key informants who participated in ERASE’s Prevention Priority Process used data and their knowledge of the community they represent to rank the substances and behavior based on magnitude, impact, changeability and community readiness and capacity. The final page of this report includes the numerical ranking of the six substances and two behaviors of the processes’ participants’, which was used to make the final determination of the order of prevention priorities for this report. The outcome of this report will be used by ERASE and its community partners to evaluate current prevention strategies and plan for future initiatives.

Table of Contents.
Introduction.............................................................................................................................................................................. 1 Purpose .................................................................................................................................................................................... 1 Demographics of Sub-Region 4A .............................................................................................................................................. 1 Local Prevention Councils (LPC) of Sub-Region 4A ................................................................................................................... 1 Methods and Process ............................................................................................................................................................... 2 National and State Surveys: Including NSDUH, YRBSS, and CT SHS ......................................................................................... 2 Alcohol Use ............................................................................................................................................................................... 3 Tobacco Use ............................................................................................................................................................................. 6 Prescription Drug Use ............................................................................................................................................................... 9 Marijuana Use ........................................................................................................................................................................ 11 Heroin Use .............................................................................................................................................................................. 14 Cocaine Use ............................................................................................................................................................................ 15 Problem Gambling .................................................................................................................................................................. 16 Suicide .................................................................................................................................................................................... 17 Conclusions............................................................................................................................................................................. 19
1
Introduction
Purpose
East of the River Action for Substance Abuse Elimination (ERASE) produced the Prevention Priority Report with assistance from community members in response to a request from the CT Department of Mental Health and Addiction Services (DMHAS) for a data driven analysis on the impact of 8 substances and related behaviors of concern in Sub-Region 4A. The report describes the consumption patterns and consequences of alcohol abuse, tobacco, marijuana, heroin, cocaine, prescription drug abuse, suicide and problem gambling. It also serves to establish the priority ranking of each substance and behavior based on primary and secondary data qualitative sources as well as quantitative feedback from key stakeholders in the Sub-Region 4-A. The outcomes of this process will guide ERASE in strategic planning for sub-region-wide prevention initiatives and Local Prevention Council technical assistance for community-level planning.
Demographics of Sub-Region 4A
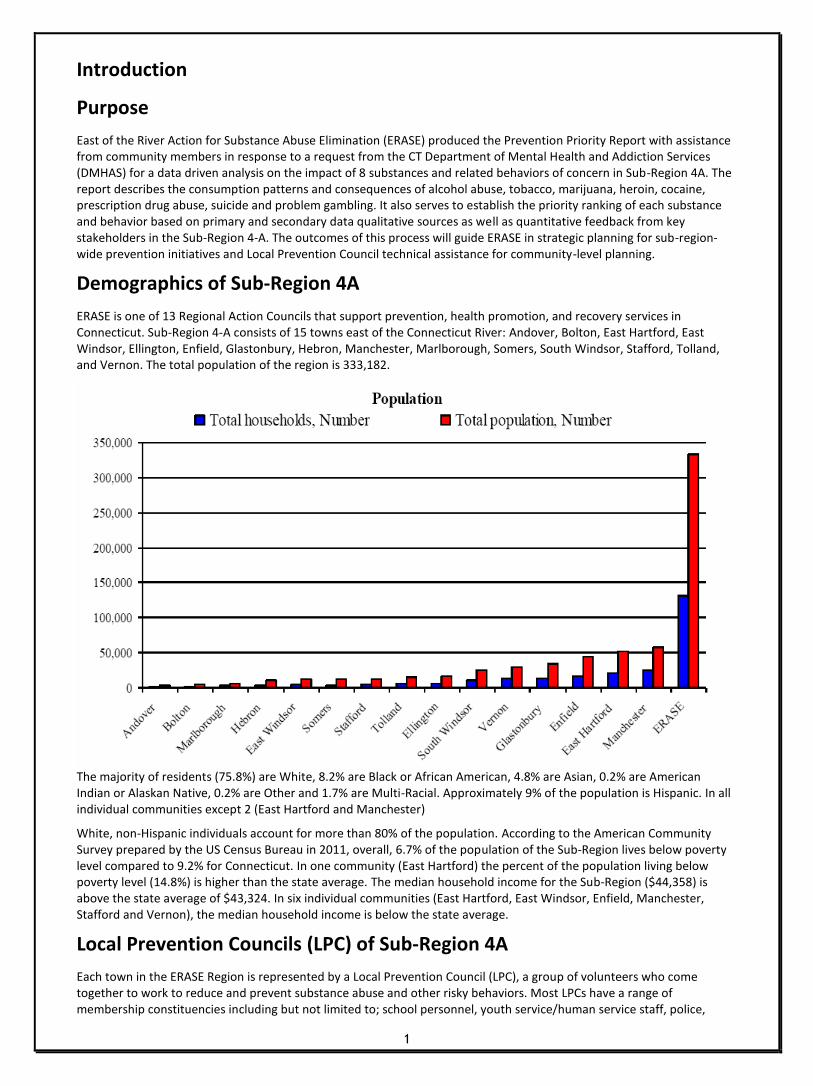
ERASE is one of 13 Regional Action Councils that support prevention, health promotion, and recovery services in Connecticut. Sub-Region 4-A consists of 15 towns east of the Connecticut River: Andover, Bolton, East Hartford, East Windsor, Ellington, Enfield, Glastonbury, Hebron, Manchester, Marlborough, Somers, South Windsor, Stafford, Tolland, and Vernon. The total population of the region is 333,182.
The majority of residents (75.8%) are White, 8.2% are Black or African American, 4.8% are Asian, 0.2% are American Indian or Alaskan Native, 0.2% are Other and 1.7% are Multi-Racial. Approximately 9% of the population is Hispanic. In all individual communities except 2 (East Hartford and Manchester)
White, non-Hispanic individuals account for more than 80% of the population. According to the American Community Survey prepared by the US Census Bureau in 2011, overall, 6.7% of the population of the Sub-Region lives below poverty level compared to 9.2% for Connecticut. In one community (East Hartford) the percent of the population living below poverty level (14.8%) is higher than the state average. The median household income for the Sub-Region ($44,358) is above the state average of $43,324. In six individual communities (East Hartford, East Windsor, Enfield, Manchester, Stafford and Vernon), the median household income is below the state average.
Local Prevention Councils (LPC) of Sub-Region 4A
Each town in the ERASE Region is represented by a Local Prevention Council (LPC), a group of volunteers who come together to work to reduce and prevent substance abuse and other risky behaviors. Most LPCs have a range of membership constituencies including but not limited to; school personnel, youth service/human service staff, police,

2
parents, youth, parks and recreation representatives, business leaders, the faith community, government officials, housing officials, mental health professionals and other non-profit groups. Several LPCs in the region are chaired by school or youth service staff, making the focus of these groups primarily on youth and families. The towns of Andover, Hebron and Marlborough come together to form a regional council, as these are communities rural in character and have a regional middle and high school. All other towns have independent LPCs that vary in their capacity and readiness to implement needs assessment, planning and initiatives. ERASE has a very strong relationship with the LPCs in the sub-region. The strong relationship has allowed LPCs to increase their readiness and capacity. ERASE has been able to put additional dollars in the communities to help several LPCs with their capacity besides the resources they receive from DMHAS. ERASE has also helped LPCs apply for additional state and federal funding. ERASE believes in the vitality of the LPCs and continues to provide support in helping their communities. ERASE has established a Prevention Committee, where all of the LPCs are represented. The Prevention Committee allows for regional collaboration, learning opportunities, regional prevention initiatives, and an overall increase in our capacity.
Methods and Process
ERASE produced this Sub-Regional Priority Profile with assistance from community members in support of the DMHAS SPF process and to facilitate a data driven analysis of the impact of 8 target substances and related behaviors of concern in Sub-Region 4A. The profile describes the consumption patterns and consequences of alcohol use, tobacco use, prescription drug misuse, marijuana use, heroin use, cocaine use, problem gambling, and suicide. In order to gather the data required for this report, below is the list of data sources both quantitative and qualitative that were integral to selecting the priority substance/behaviors.
Student Surveys-from 2008-2012, 10 of ERASE's 13 school systems surveyed students within grades 6-12 on substance abuse and related behaviors. 8 of these school systems used the ERASE Student Use Survey. One used an adapted Governor's Prevention Initiative for Youth assessment and another used the SEARCH Institute with a substance abuse supplementary questionnaire.
National and State Surveys: Including NSDUH, YRBSS, and CT SHS
Secondary Data: Including arrests, motor vehicle accidents and fatalities, treatment admissions, school suspensions and expulsions compiled by DMHAS and the State Epidemiologic and Outcomes Workgroup (SEOW) from state and federal sources.
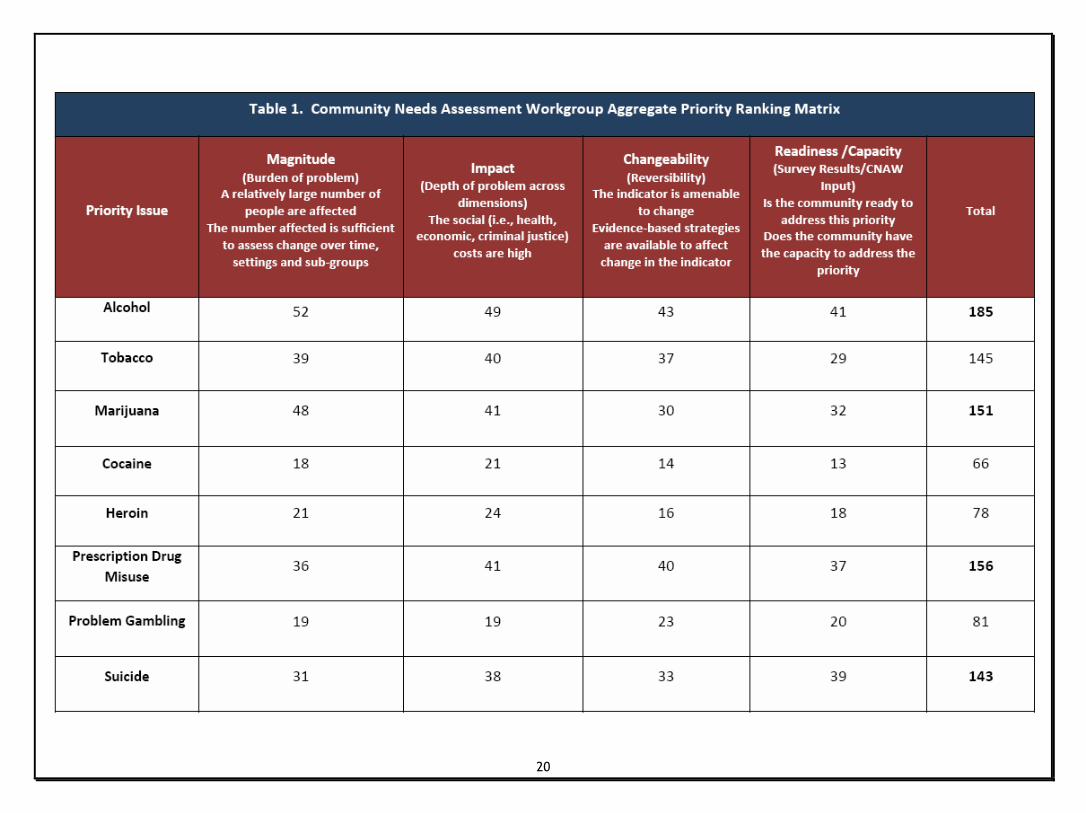
Community Needs Assessment Workgroup (CNAW) - January 2013 ERASE convened a CNAW with members of LPCs to review the profiles of the 8 domains. 11 community leaders and the ERASE staff participated in the CNAW. Participants examined the 8 profiles and provided information on the 8 substances/behaviors of concern about the community they represent and completed a priority matrix (Table 1).The CNAW was very successful in creating opportunity for discussion and dialogue pertaining to the 8 substances/behaviors. The trust and strength between ERASE and the LPCs allowed for an open, fair, and honest assessment of the communities priorities. The CNAW was an integral part of identifying the top substances/behaviors.
Community Readiness Assessment-Since 2006 the State of Connecticut has used a community readiness assessment to determine how prepared communities are to address underage drinking and other drugs. Key leaders from each RAC region complete the survey, responding to questions based on their perception of community opinions. The information for the ERASE region is used to indicate how community attitudes have changed overtime. The CNAW was able to use this information in addition to the profiles to help with selecting priority substances.
Youth Perceptions of Priorities-in March 2012 over 300 middle and high school students ranked their perception of priority substances as part of the evaluation of an annual youth leadership conference.The CNAW also used this information in helping select the top substances.

3
Alcohol Use (Ranked 1st)
Magnitude
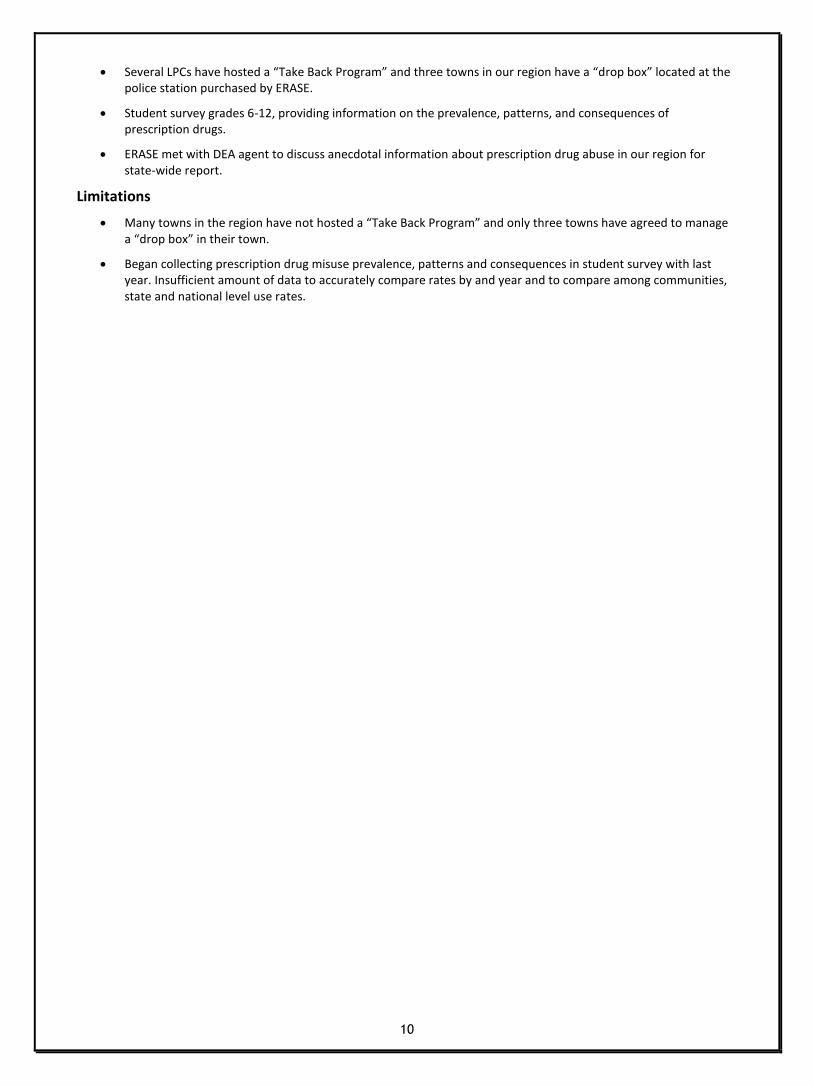
Alcohol is the most widely used and abused substance in the United States. According to the 2010 National Survey on Drug Use and Health (NSDUH), 51.8% of Americans and 59.4% of Connecticut residents aged 12 or older reported being current drinkers. According to the Youth Risk Behavior Surveillance System (YRBSS) in 2011, the rate of recent alcohol use among Connecticut high school youth (41.5%) was higher than the national average (38.7%). Local youth survey data show that in the Sub-Region 4A the rate of recent alcohol use among high school youth for 2010-11 (32.9%) was below these state and national averages for 2011.
Impact
The consequences and impacts of alcohol use, abuse and dependence include increased crime, long and short term negative health effects and unintentional injury and death.
According to the US Centers for Disease Control:
Excessive alcohol use is the 3rd leading lifestyle-related cause of death in the US.
Excessive alcohol use is responsible for 2.3 million years of potential life lost (YPLL) annually.
The economic costs of excessive alcohol consumption in 2006 were estimated at $223.5 billion.
In Sub-Region 4A:
The rate of motor vehicle accidents under the influence of alcohol was the third or fourth highest (range 7.7-8.5 per 10,000) among all RACs in each year from 2007-2010 (NHTSA). In each of those years, the rate in Sub-Region 4A was also above the state average (range 6.6-7.2 per 10,000). In 2010, the rates in twelve individual communities (range 6.7 to 15.3) were above the state average of 6.6
The rate of fatal motor vehicle accidents under the influence of alcohol (4.9 per 100,000) in 2010 was higher than the state average of 3.2 per 100,000 (NHTSA). The rates for five individual communities (range 7.6-23.2) were above the state average.
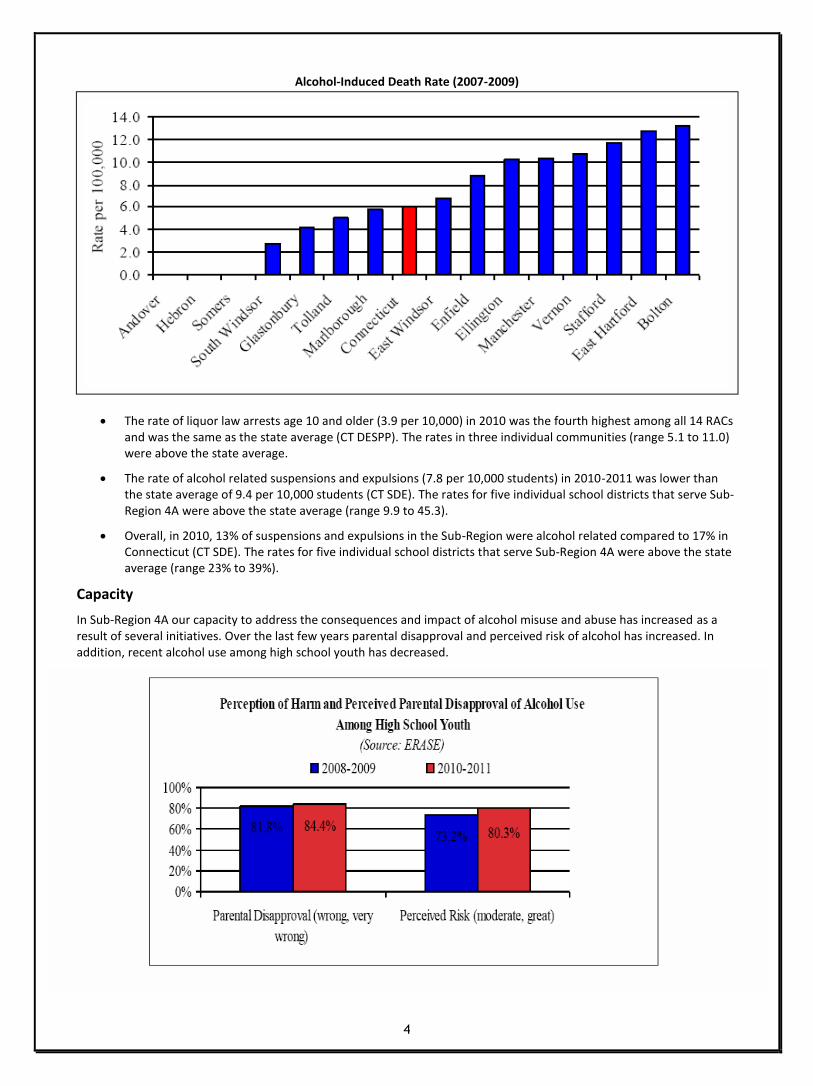
The rate of DUI arrests for individuals 21 and older (47.6 per 10,000) in 2010 was the third highest among the RACs and was higher than the state average of 39.1 per 10,000 (CT DESPP). The rates in seven individual communities (range 47.0 to 128.6) were above the state average. Eight of fifteen individual communities had an alcohol-induced death rate above the state average of 6.1 per 100,000 in 2007-2009 (CT DPH).
4
The rate of liquor law arrests age 10 and older (3.9 per 10,000) in 2010 was the fourth highest among all 14 RACs and was the same as the state average (CT DESPP). The rates in three individual communities (range 5.1 to 11.0) were above the state average.
The rate of alcohol related suspensions and expulsions (7.8 per 10,000 students) in 2010-2011 was lower than the state average of 9.4 per 10,000 students (CT SDE). The rates for five individual school districts that serve Sub-Region 4A were above the state average (range 9.9 to 45.3).
Overall, in 2010, 13% of suspensions and expulsions in the Sub-Region were alcohol related compared to 17% in Connecticut (CT SDE). The rates for five individual school districts that serve Sub-Region 4A were above the state average (range 23% to 39%).
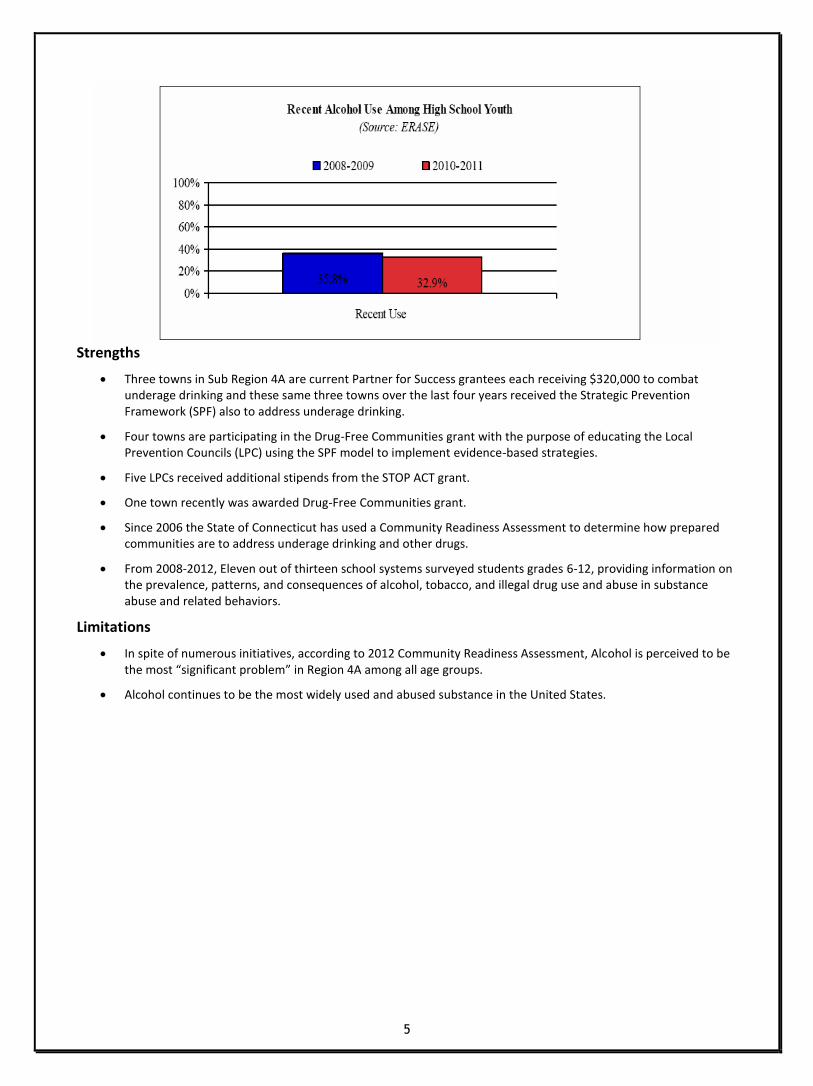
Capacity
In Sub-Region 4A our capacity to address the consequences and impact of alcohol misuse and abuse has increased as a result of several initiatives. Over the last few years parental disapproval and perceived risk of alcohol has increased. In addition, recent alcohol use among high school youth has decreased.
Alcohol-Induced Death Rate (2007-2009)
5
Strengths
Three towns in Sub Region 4A are current Partner for Success grantees each receiving $320,000 to combat underage drinking and these same three towns over the last four years received the Strategic Prevention Framework (SPF) also to address underage drinking.
Four towns are participating in the Drug-Free Communities grant with the purpose of educating the Local Prevention Councils (LPC) using the SPF model to implement evidence-based strategies.
Five LPCs received additional stipends from the STOP ACT grant.
One town recently was awarded Drug-Free Communities grant.
Since 2006 the State of Connecticut has used a Community Readiness Assessment to determine how prepared communities are to address underage drinking and other drugs.
From 2008-2012, Eleven out of thirteen school systems surveyed students grades 6-12, providing information on the prevalence, patterns, and consequences of alcohol, tobacco, and illegal drug use and abuse in substance abuse and related behaviors.
Limitations
In spite of numerous initiatives, according to 2012 Community Readiness Assessment, Alcohol is perceived to be the most “significant problem” in Region 4A among all age groups.
Alcohol continues to be the most widely used and abused substance in the United States.

6
Tobacco Use (Ranked 5th)
Magnitude
After alcohol, tobacco is the second most commonly used substance in the United States. According to the 2010 NSDUH, the percentage of Americans aged 12 or older reporting recent cigarette use declined from 26.0% in 2002 to 23.0% in 2010. In 2009-2010, the rate of recent cigarette use among CT residents ages 12 or older was 21.2% (NSDUH).
According to the YRBSS in 2011, the rate of recent cigarette use among Connecticut high school youth (15.9%) was lower than the national average (18.1%). Local youth survey data show that 30 Day tobacco use among high school youth in Sub-Region 4A has been declining in recent years.
Impact
According to the US Surgeon General, of every three young smokers, one will quit and one will die of tobacco related causes. Nearly all tobacco use begins in childhood and adolescence. In fact, 80% of adult cigarette smokers who smoke daily, report that they started smoking by the age of 18.
The US Centers for Disease Control reports the following:
Each year in the United States adverse health effects from cigarette smoking account for an estimated 443,000 deaths (nearly 1 in every 5 deaths).
More deaths are caused each year by tobacco use than by HIV, illegal drug use, motor vehicle injuries, suicides and murders combined.
Smoking causes an estimated 90% of all lung cancer deaths among men and 80% of all lung cancer deaths among women.
Compared to nonsmokers, smokers are at increased risk of a variety of chronic health problems including coronary heart disease, stroke, lung cancer and COPD.
The EPA estimates that each year exposure of children to second-hand smoke results in increased numbers of asthma attacks and severity of symptoms in 200,000 to 2 million children with asthma, 150,000 to 300,000 lower respiratory tract infections in children under 18 months of age and respiratory tract infections resulting in 7,500 to 15,000 hospitalizations.
In Sub-Region 4A:
Nine of fifteen communities had lung cancer death rates above the state average of 49.9 per 100,000 in 2007-2009 (range 53.5 to 108.3, CTDPH).

7
The rate of tobacco related suspensions and expulsions (24.6 per 10,000 students) in 2010-2011 was higher than the state average of 21.0 per 10,000 students (CT SDE).
Overall, 41% of suspensions and expulsions in the Sub-Region were tobacco related compared to 37% in Connecticut (CT SDE).
In 2008-2010, the percentage of tobacco retailers who were non-compliant was 11.0% compared to a state average of 13.3% (CT DMHAS). Six individual communities in Sub-Region 4A had non-compliance rates above the state average (range 14.3% to 33.3%).
Capacity
In Sub-Region 4A our capacity to address the consequences and impact of tobacco use continues to increase as a result of state programs and additional funding for tobacco-use prevention. Since 2008, age of initiation of tobacco use continues to increase, on the other hand perception of harm among high school youth has decreased.

8
Strengths
From 2008-2012, Eleven out of thirteen school systems surveyed students grades 6-12, providing information on the prevalence, patterns, and consequences of alcohol, tobacco, and illegal drug use and abuse in substance abuse and related behaviors.
The CT Prevention Network with ERASE as applicant and state-wide coordinator was awarded $168,774.00 from CT DPH to provide tobacco-use prevention program to youth ages 5-14.
DMHAS Tobacco Prevention and Enforcement Program inspected over 600 tobacco retailers in Sub-Region 4A during 2008-2010.
Limitations
In spite of law prohibiting minors from possessing tobacco products, Police report this has been ineffective as they do not have time to enforce.
Community members report difficulties in prioritizing tobacco-use as a priority substance for prevention since other drugs, particularly alcohol, are used at higher rates and have more immediate physical, social and legal consequences.

9
Prescription Drug Use (Ranked 2nd)
Magnitude
The US Centers for Disease control reports that prescription drug abuse is the fastest growing drug problem in the United States. Many individuals who misuse prescription drugs mistakenly believe that these substances are safer than illicit drugs because they are prescribed by healthcare professionals.
According to the National Institute on Drug Abuse, data from several national surveys suggest that prescription medications, including those used to treat pain, attention deficit disorders and anxiety, are being abused at a rate second only to marijuana among illicit drug users. In 2010, NSDUH estimated that 2.4 million individuals aged 12 and older used prescription medications for the first time in the past year. This estimate was similar to the 2009 estimate (2.6 million) but lower than the 2004 estimate (2.8 million).
According to the 2011 YRBSS, 20.7% of high school youth in the United States report ever having taken a prescription drug without a doctor’s prescription. The rate among Connecticut high school youth was 9.6%. Local survey data indicate that the lifetime rate of prescription medication misuse from 2010-2012 (9.7%) was below the national average and was nearly the same as the state average.
Impact
The Drug Abuse Warning Network (DAWN), which monitors emergency department visits across the nation, reported that in 2010 that 1.3 million emergency department visits could be attributed to prescription drug misuse or abuse. Emergency department visits involving misuse or abuse of pharmaceutical products increased 115% between 2004 (626,000 visits) and 2010 (1.3 million visits).
In Sub-Region 4A:
The rate of pharmaceutical related suspensions and expulsions (1.3 per 10,000 students) in 2010-2011 was lower than the state average of 2.0 per 10,000 students (CT SDE).
Overall, 2% of suspensions and expulsions in the Sub-Region were pharmaceutical related compared to 4% in Connecticut (CT SDE).
Capacity
In Sub-Region 4A our capacity to address the consequences and impact of prescription drug misuse continues to increase from recent years as a result of awareness trainings and implementation of “Take Back Program” among several LPCs, drop boxes in police stations and questions added to student surveys.
Strengths
Funding on behalf of Purdue Pharmaceutical to implement “Teen Influencer” trainings presented to teachers and coaches in our region assisted in raising awareness on the signs, symptoms, and risks of prescription drug misuse.
10
Several LPCs have hosted a “Take Back Program” and three towns in our region have a “drop box” located at the police station purchased by ERASE.
Student survey grades 6-12, providing information on the prevalence, patterns, and consequences of prescription drugs.
ERASE met with DEA agent to discuss anecdotal information about prescription drug abuse in our region for state-wide report.
Limitations
Many towns in the region have not hosted a “Take Back Program” and only three towns have agreed to manage a “drop box” in their town.
Began collecting prescription drug misuse prevalence, patterns and consequences in student survey with last year. Insufficient amount of data to accurately compare rates by and year and to compare among communities, state and national level use rates.

11
Marijuana Use (Ranked 3rd)
Magnitude
Marijuana is the most commonly abused illicit drug in the United States. According to NSDUH, in 2010 there were 2.4 million Americans aged 12 or older who used marijuana for the first time in the past 12 months. That corresponds to about 6,600 new users every day. This estimate was similar to the estimates from 2008 and 2009 but higher than the estimates for 2002-2007. Among all youth ages 12-17, an estimated 5.2% had used marijuana for the first time in the past year. This rate was similar to the rate in 2009 (5.4%).
According to the YRBSS, after increasing between 1991 and 1999, the national rates for lifetime and recent marijuana use among high school youth declined between 1999 and 2009 (lifetime: 47.2% to 36.8%; recent :26.7% to 20.8%). However, both rates increased in 2011 (lifetime: 39.9%; recent: 23.1%). In 2011, the rate of lifetime (39.6%) marijuana use among CT high school youth was essentially the same as the national average while the rate of recent marijuana use among CT high school youth (24.1%) was higher than the national average. Local survey data show that the rate of recent marijuana use among high school youth in Sub-Region 4A from 2010-2012 was 20.4%.
Impact
The short term effects of marijuana intoxication include distorted perceptions, impaired coordination, difficulty with thinking, problem solving, learning and memory (NIDA). A meta-analysis of 48 studies found that marijuana use was associated with reduced educational attainment (lower grades and chances of graduation). In another study, heavy marijuana users had lower college completion rates and were more likely to have an annual household income of less than $30,000. Heavy users also reported a negative impact of marijuana use on physical and mental health, cognitive abilities, social life and career status. Other studies have linked marijuana use with increased absenteeism, tardiness, accidents, workers' compensation claims and job turnover. Studies have also shown an association between chronic marijuana use and increased rates of anxiety, depression and schizophrenia but it is not clear at this time if marijuana use actually causes mental health problems, makes them worse or is indicative of attempts at self-medication and management of existing symptoms.
According to the University of Washington Alcohol and Drug Abuse Institute, driving under the influence of marijuana increases the risk of motor vehicle crashes by a factor of 2 or 3.
In Sub-Region 4A:
In 2009, three individual communities had rates of marijuana dependence treatment admissions (range 12.3 to 16.7) that were higher than the state average of 11.3 per 10,000 (CT DMHAS).
Specific data regarding marijuana related school suspensions and expulsions are not available. However, because marijuana is the most commonly abused illicit drug, it might be assumed that marijuana use contributes to a large percentage of the illegal drug related school suspensions and expulsions each year. The rate of illegal drug related suspensions and expulsions (26.0 per 10,000 students) in the Sub-Region in 2010-2011 was higher than

12
the state average of 24.1 per 10,000 students (CT SDE). Rates in seven individual communities (range 30.6 to 82.8) were above the state average.
Overall, 44% of suspensions and expulsions in the Sub-Region were related to illegal drugs compared to 43% in Connecticut (CT SDE).
n 2010, the rate of fatal motor vehicle accidents under the influence of drugs (1.2 per 100,000) was lower than the state average of 1.6 per 100,000 (NHTSA). The rate in 13 individual communities was 0. The rates in the remaining 2 communities (Enfield and East Windsor) were above the state average. The rates in those communities were 4.4 and 2.4, respectively.
Capacity
In Sub-Region 4A our capacity to address the consequences and impact of marijuana use has not increased in recent years. ERASE and community members are aware of the significant problems with marijuana use but new state laws regarding possession of marijuana and the popularity of medical marijuana has decreased the perception of harm among youth. In addition the age of initiation has not changed over the last few years in spite of perceived parental disapproval increasing.
Strengths
The 2012 Community Readiness Assessment indicated community leaders felt most community residents in Region 4A disagree “that the occasional use of marijuana is not harmful”.

13
From 2008-2012, Eleven out of thirteen school systems surveyed students grades 6-12, providing information on the prevalence, patterns, and consequences of alcohol, tobacco, and illegal drug use and abuse in substance abuse and related behaviors.
Limitations
Community members are unsure of effective strategies to deter marijuana use especially that address policy and enforcement because of the recent changes to state laws.
Community members report many parents and middle aged adults use marijuana regularly.
The new state laws regarding marijuana possession and medical marijuana has confused many people throughout the region to include, law enforcement, school administrators, parents, youth and those working in prevention

14
Heroin Use (Ranked 7th)
Magnitude
According to NSDUH, in 2010, 140,000 people ages 12 or older had used heroin for the first time in the past 12 months. This number is similar to but lower than the number in 2009 (180,000) and similar to but higher than those from between 2002 to 2008 which ranged from 91,000 to 118,000 per year.
Nationwide, 2.9% of high school youth report ever having used heroin in their lifetime. This rate has remained steady from 1999-2011(YRBSS). In 2011, the rate of lifetime heroin use among CT high school youth was also 2.9%. Local survey data show that the rate of lifetime heroin use among high school youth in Sub-Region 4A from 2010-2012 was 3.5%.
Impact
For many, heroin addiction is a lifelong battle characterized by repeated cycles of drug use and abstinence. Users are at increased risk for crime, incarceration, health problems and death. In one 33 year long longitudinal NIDA-supported study conducted at UCLA, the death rate among a group of heroin addicts was 50-100 times the rate in the general population ( NIDA NOTES, Vol. 16, No. 4, October , 2001).
Heroin use is associated with serious health consequences including collapsed veins, bacterial infections, viral infections (including HIV Hepatitis), liver and kidney disease, spontaneous abortion, depressed breathing and fatal overdose (NIDA, AATOD). Regular users often have difficulty concentrating and staying awake. The need to obtain heroin and get high can lead to lateness, absenteeism, poor performance and possible job loss. When finances are insufficient to support the addict's need, family stability and housing can be threatened and the need to resort to criminal activity to support the addiction may arise.
In Sub-Region 4A:
The rate of illegal drug related suspensions and expulsions (26.0 per 10,000 students) in the Sub-Region in 2010-2011 was higher than the state average of 24.1 per 10,000 students (CT SDE). Rates in seven individual communities (range 30.6 to 82.8) were above the state average.
In 2010, six individual communities had juvenile drug arrest rates higher than the state average of 424.9 per 100,000. (CT DPS)
Capacity
In Sub-Region 4A our capacity to address the consequences and impact of heroin abuse is challenging. ERASE and community members are aware of the significant problems heroin abuse causes. Distribution and consumption of heroin remains illegal making it difficult to measure use rates and consequences. The data we have pertaining to lifetime heroin use rates among high school shows for that age group heroin is not a problem. Anecdotally, we know the population for most heroin users are post high school age, not attending college and not working, making outreach difficult. According to sources involved with the East Central Narcotics Task Force of CT, most heroin dealers are from Hartford and East Hartford and heroin is the second most illicit drug confiscated.
15
Cocaine Use (Ranked 8th)
Magnitude
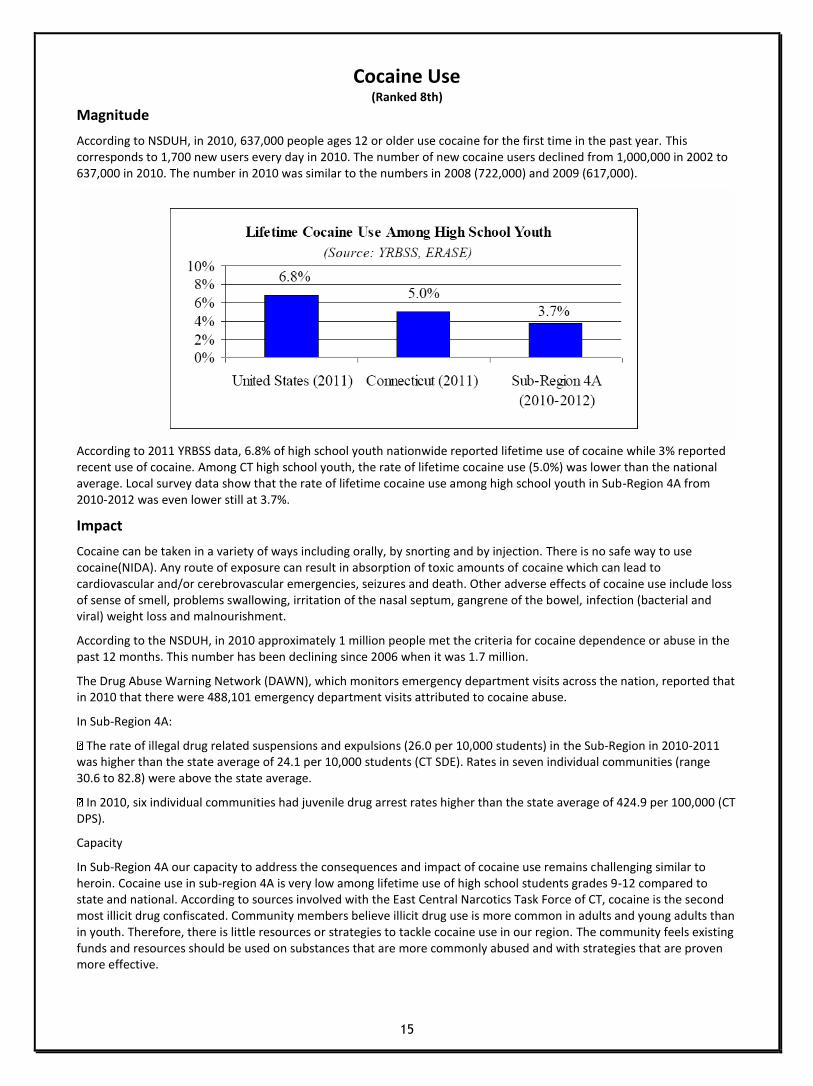
According to NSDUH, in 2010, 637,000 people ages 12 or older use cocaine for the first time in the past year. This corresponds to 1,700 new users every day in 2010. The number of new cocaine users declined from 1,000,000 in 2002 to 637,000 in 2010. The number in 2010 was similar to the numbers in 2008 (722,000) and 2009 (617,000).
According to 2011 YRBSS data, 6.8% of high school youth nationwide reported lifetime use of cocaine while 3% reported recent use of cocaine. Among CT high school youth, the rate of lifetime cocaine use (5.0%) was lower than the national average. Local survey data show that the rate of lifetime cocaine use among high school youth in Sub-Region 4A from 2010-2012 was even lower still at 3.7%.
Impact
Cocaine can be taken in a variety of ways including orally, by snorting and by injection. There is no safe way to use cocaine(NIDA). Any route of exposure can result in absorption of toxic amounts of cocaine which can lead to cardiovascular and/or cerebrovascular emergencies, seizures and death. Other adverse effects of cocaine use include loss of sense of smell, problems swallowing, irritation of the nasal septum, gangrene of the bowel, infection (bacterial and viral) weight loss and malnourishment.
According to the NSDUH, in 2010 approximately 1 million people met the criteria for cocaine dependence or abuse in the past 12 months. This number has been declining since 2006 when it was 1.7 million.
The Drug Abuse Warning Network (DAWN), which monitors emergency department visits across the nation, reported that in 2010 that there were 488,101 emergency department visits attributed to cocaine abuse.
In Sub-Region 4A:
The rate of illegal drug related suspensions and expulsions (26.0 per 10,000 students) in the Sub-Region in 2010-2011 was higher than the state average of 24.1 per 10,000 students (CT SDE). Rates in seven individual communities (range 30.6 to 82.8) were above the state average.
In 2010, six individual communities had juvenile drug arrest rates higher than the state average of 424.9 per 100,000 (CT DPS).
Capacity
In Sub-Region 4A our capacity to address the consequences and impact of cocaine use remains challenging similar to heroin. Cocaine use in sub-region 4A is very low among lifetime use of high school students grades 9-12 compared to state and national. According to sources involved with the East Central Narcotics Task Force of CT, cocaine is the second most illicit drug confiscated. Community members believe illicit drug use is more common in adults and young adults than in youth. Therefore, there is little resources or strategies to tackle cocaine use in our region. The community feels existing funds and resources should be used on substances that are more commonly abused and with strategies that are proven more effective.
16
Problem Gambling (Ranked 6th)
Magnitude
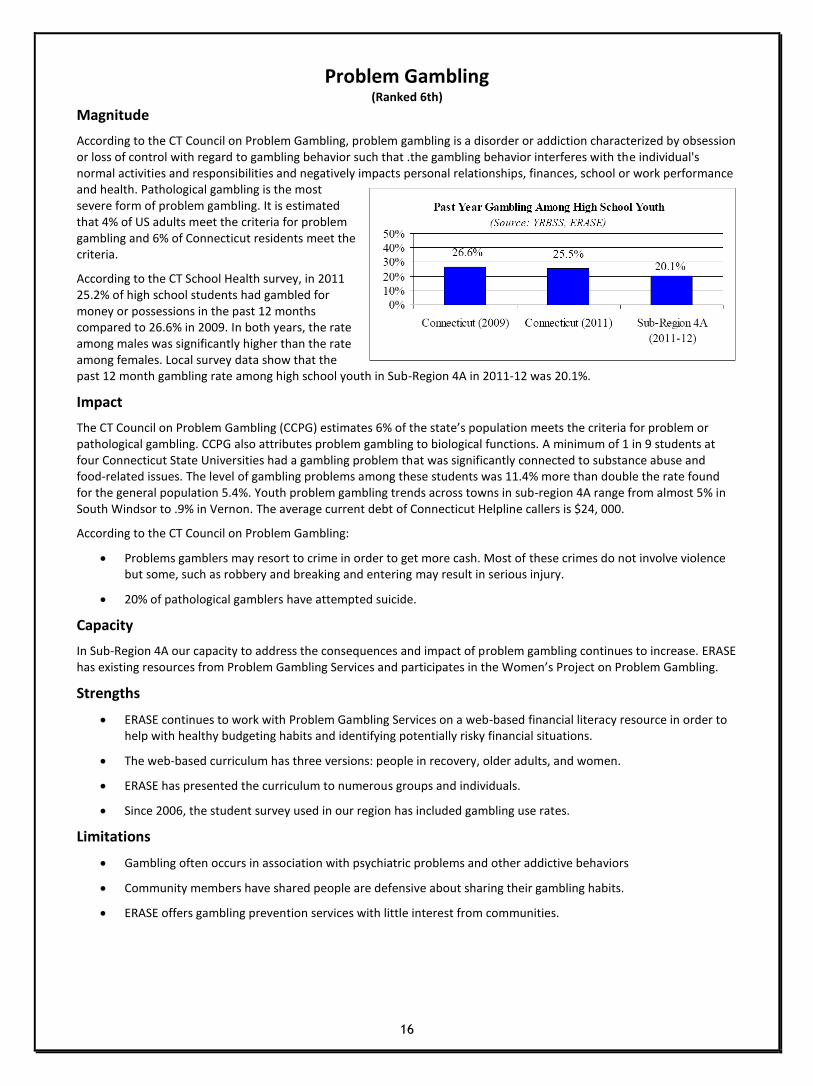
According to the CT Council on Problem Gambling, problem gambling is a disorder or addiction characterized by obsession or loss of control with regard to gambling behavior such that .the gambling behavior interferes with the individual's normal activities and responsibilities and negatively impacts personal relationships, finances, school or work performance and health. Pathological gambling is the most severe form of problem gambling. It is estimated that 4% of US adults meet the criteria for problem gambling and 6% of Connecticut residents meet the criteria.
According to the CT School Health survey, in 2011 25.2% of high school students had gambled for money or possessions in the past 12 months compared to 26.6% in 2009. In both years, the rate among males was significantly higher than the rate among females. Local survey data show that the past 12 month gambling rate among high school youth in Sub-Region 4A in 2011-12 was 20.1%.
Impact
The CT Council on Problem Gambling (CCPG) estimates 6% of the state’s population meets the criteria for problem or pathological gambling. CCPG also attributes problem gambling to biological functions. A minimum of 1 in 9 students at four Connecticut State Universities had a gambling problem that was significantly connected to substance abuse and food-related issues. The level of gambling problems among these students was 11.4% more than double the rate found for the general population 5.4%. Youth problem gambling trends across towns in sub-region 4A range from almost 5% in South Windsor to .9% in Vernon. The average current debt of Connecticut Helpline callers is $24, 000.
According to the CT Council on Problem Gambling:
Problems gamblers may resort to crime in order to get more cash. Most of these crimes do not involve violence but some, such as robbery and breaking and entering may result in serious injury.
20% of pathological gamblers have attempted suicide.
Capacity
In Sub-Region 4A our capacity to address the consequences and impact of problem gambling continues to increase. ERASE has existing resources from Problem Gambling Services and participates in the Women’s Project on Problem Gambling.
Strengths
ERASE continues to work with Problem Gambling Services on a web-based financial literacy resource in order to help with healthy budgeting habits and identifying potentially risky financial situations.
The web-based curriculum has three versions: people in recovery, older adults, and women.
ERASE has presented the curriculum to numerous groups and individuals.
Since 2006, the student survey used in our region has included gambling use rates.
Limitations
Gambling often occurs in association with psychiatric problems and other addictive behaviors
Community members have shared people are defensive about sharing their gambling habits.
ERASE offers gambling prevention services with little interest from communities.

17
Suicide (Ranked 4th)
Magnitude
Nationwide, the percentage of high school youth who had seriously considered attempting suicide in the past 12 months declined from 29.0% in 1991 to 13.8% in 2009 and increased again to 15.8% in 2011 (YRBSS 2011). The 2011 rate in CT was 14.6%. Between 1991 and 2011, there was an overall significant decrease in the national prevalence of high school youth who had made a suicide plan from 18.6% to 12.8%. However, the prevalence did increase from 10.9% in 2009 to 12.8% in 2011. Nationwide, 7.8% of high school youth had attempted suicide one or more times in the past 12 months. The rate in CT was 6.7%. Overall, the national prevalence of having attempted suicide decreased between 2001 and 2009 from 8.8% to 6.3% and increased from 2009 to 2011 from 6.3% to 7.8%.
Impact
According to the US Centers for Disease Control (CDC), suicide is the 10th leading cause of death in the United States. In 2010, more than 38,000 people dies by suicide and more than 1 million individuals reported having attempted suicide in the past year. CDC also reports on average a single suicide costs $1.1 million. Once study estimated that approximately 7% of Americans knew someone who dies of suicide in the past 12 months. Surviving the loss of a family member of friend to suicide is a risk factor for suicide. In 2011, CDC reported that overall suicide rates tend to rise and fall along with the economy. From 1928-2007, the largest increase in overall suicide rate occurred in the Great Depression. This is important to keep in mind given the current state of the economy.
In Sub-Region 4A:
From 2007-2009, the suicide rate in 9 individual communities was above the state average of 8.2 per 100,000.

18
Capacity
In sub-Region 4A, our capacity to address suicide has increased from previous years. In April 2012, Manchester Community College in partnership with ERASE was awarded funding from the Department of Mental Health and Addiction Services for the Garret Lee Smith memorial Act. As part of the grant activities, ERASE’s Prevention Coordinator has been trained as a trainer in “Question, Persuade and Refer (QPR) a suicide prevention gatekeeper program that educates communities, students and professionals on how to identify someone in distress and direct them to appropriate resources and help.
**Inconsistency in how “felt so sad or hopeless..” question was asked on multiple surveys.
Strengths:
Trained staff in QPR
Continued partnership on the Garret Lee Smith Suicide Prevention Grant for the amount of $75,000 through June 2014.
ERASE representation on CT Youth Suicide Advisory Board
Currently establishing a partnership with Jordan Matthew Porco Memorial Foundation
Data from ERASE youth surveys and Manchester Community College Core, American College Health Assessment.
Limitations:
Limited data on youth suicide, only 3 towns have asked if youth have seriously considered attempting suicide in the past year and MCC mental health questions were asked only as recent as Spring 2012 on Alcohol Core Survey.

19
Conclusions
Priority Substances/Behaviors
The ranking of these substances was determined by the CNAW and ERASE staff using student survey data, youth perception and secondary indicator data, and community readiness data. The data used to prioritize substances represent the perceptions and use rates of over 50% of youth in the Region over time (2008-2012). The LPCs that participated reflect the diverse race/ethnicity, culture and socioeconomic status of the Region, ranging from urban to rural. Student survey data are consistent with secondary data collected on social indicators of youth and young adult substance abuse arrests, DUI’s, treatment admissions and key leader perceptions of priority problems in the region.
The following is a list, in priority order, of the top 8 substances/behaviors of concern:
1. Alcohol- youth ages 12-18, young adults ages 19-25, adults and seniors
2. Prescription/over-the-counter drug misuse
3. Marijuana
4. Suicide
5. Tobacco
6. Problem Gambling
7. Heroin
8. Cocaine
Feedback on Top 4 Substances/Behaviors
Alcohol: Continues to be a significant problem among all communities in the sub-region. Many communities focus on social media relating to access, and drinking and driving. Unfortunately the CNAW members shared parents still feel it is ok for kids to drink occasionally in their home. Community Readiness identified alcohol as the most significant problem.
Marijuana: The difficulty with marijuana use shared by CNAW members is the perception “it’s like a cigarette.” With the legality of marijuana being in question, members in the communities to include parents, students, and law enforcement has decreased the perception that marijuana is dangerous and illegal. CNAW members also feel changing the attitudes towards marijuana use will be difficult.
Prescription Drug Misuse: The data is not showing a rise in misuse but CNAW members shared they are seeing more cases of prescription drug misuse. They also shared it is much easier to hide and feel doctors are over prescribing.Many of the members felt they have to capacity to address prescription misuse and there are effective strategies to address this problem. Currently only a few towns sponsor a prescription drug drop box and a take back program.
Suicide: CNAW members showed a great deal of concern based on what they see in schools. According to CNAW members seeing a many students claiming to be depressed, and more girls cutting. CNAW members say suicide in their towns are linked to substance abuse problems. Suicide has moved up to the 4th ranking substance/behavior. Schools are reluctant to implement suicide prevention programs and only a couple of schools are allowing questions added to student survey.
20


