East Cleveland Property Inventory report...ously mentioned issues, and the foreclosure crisis which...
39
East Cleveland Property Inventory report Western Reserve Land Conservancy Thriving Communies Instute October 2014
Transcript of East Cleveland Property Inventory report...ously mentioned issues, and the foreclosure crisis which...

East Cleveland
Property Inventory
report
Western Reserve Land Conservancy
Thriving Communities Institute
October 2014

2

3
Thanks to those who made this project possible
Footbridge at Forest Hills Park in East Cleveland http://connect.cleveland.com/user/npaige/photos.html
This report was made possible through the generosity of the Cleveland Foundation, whose commitment to greater Cleveland and its neighborhoods has had a significant positive impact on our region. We would also like to thank the City of East Cleveland and its' Mayor, Gary Norton Jr. and Michael Smedley, the Mayor's executive assistant, who spent hours helping to formulate this study. We would also like to thank Northeast Ohio Alliance for Hope (NOAH) and the staff that participated in this survey work that included Trevelle Harp, BJ (Dana) Eddings, Pia Hoffman, Kelvin Tolbert, Che Gadison and Gloria Smith Morgan. A commitment of col-laboration from these partners and individuals contributed to success of this project.

4
W estern Reserve Land Conservancy is a nonprofit conser-
vation organization dedicated to preserving the natural
resources of northern Ohio. We work with landowners, commu-
nities, government agencies, park systems and other nonprofit
organizations to permanently protect natural areas and farm-
land. In March 2011, Western Reserve Land Conservancy
launched Thriving Communities Institute, a region-wide effort to
help revitalize our urban centers, and named nationally known
expert Jim Rokakis as its director.
Today, Thriving Communities is working with communities and organizations throughout the region
to transform vacant and unproductive properties into new opportunities to attract economic
growth, add green space to our cities and support safe, beautiful neighborhoods. Our cities have
thrived in the past, and we believe they will thrive again in the future.
TCI was established to create an urban presence in the cities of Northeast Ohio. The primary objec-
tive was to establish County Land Reutilization Corporations, commonly referred to as county land
banks, in these counties to give communities additional blight fighting tools. The mission of TCI
expanded to include the raising of additional funds to remove blighted properties from these com-
munities. To date TCI has raised 182 million dollars for blight removal statewide. Most recently,
TCI played a critical role in convincing Cuyahoga County government to issue 50 million dollars in
demolition bonds. The County has stressed the need to be strategic in the expenditure of these
dollars. The detailed survey work provided by the property analysis contained herein will allow for
a strategic expenditure of these funds and ensure that the City of East Cleveland will receive its fair
share of these demolition dollars—and other funds—as the community attempts to move forward
out of this crisis.
Western Reserve Land Conservancy’s Thriving Communities Institute:
Helping revitalize Ohio’s cities
5
East Cleveland Property Inventory Report
Table of Contents Executive Summary………………………………………………………………………………6 Background………………………………………………………………………………………….7 How the Inventory Was Completed……………………………………………………..9 The “What”, “Where” and “Who” of East Cleveland’s Vacant and Occupied Properties ………………………………………………………..11 What’s Next? Charting a Land and Housing Plan Going Forward in East Cleveland………………………………………………………...14 Conclusion………………………………………………………………………………………….17 Appendix…………………………………………………………………………………………….18 Overview Map…………………………………………………………………………………….19 Precinct Maps……………………………………………………………………………………..20

6
Executive Summary This report describes the findings of a property survey in the City of East Cleveland, Ohio. The survey was implemented by the Western Reserve Land Conservancy’s Thriving Communities Institute, in partnership with the Northeast Ohio Alliance for Hope (NOAH). The parcel-by-parcel sur-vey was undertaken to create a general inventory of the city’s housing stock and, in particular, the vacant, abandoned properties that can cause economic, social, and safety issues within a community.
In accordance with the East Cleveland’s mission to “pursue innovative governance that is accessible, accountable, efficient and stable,”1 this survey is a pioneering step towards data-driven demolition planning and will assist the City of East Cleveland in their four-pronged land and housing strategy to more effectively target blight moving forward. This strategy includes eliminating the threat of blight, maximizing return on investment, moving beyond blight-light (the reduced, but still present danger of vacant, abandoned lots), and infill development.
In addition to this document, the Western Reserve Land Conservancy provided a spreadsheet data-set and web-based mapping application, as well as visual aids in the form of tables and maps that will provide a com-prehensive view of the City’s housing stock.
Image 1: Photo of Survey Team
___________________ 1
See: http://www.eastcleveland.org/about/about-us-a-community-rising/.
East Cleveland

7
Background Once known as the “Beverly Hills of the North Coast”,2 the City of East Cleveland has spiraled into decline in recent years. The city faced periods of fiscal emergency caused by a declining property tax base, fiscal mis-management and political corruption. East Cleveland withstood more distress than any City of Cleveland neighborhood. This turmoil has contributed to a loss of confidence in the city and an out-migration of its population. However, the current Mayor of East Cleveland, Gary Norton Jr., perhaps the most involved and capable mayor that the city has seen in decades, in partnerships with the Cuyahoga County Land Bank and University Circle Incorporated, is moving the city in a positive direction.
A small city of only 3.1 square miles, East Cleveland hit its residential peak of approximately 40,000 residents in 1950. During this time, suburbs thrived as automobile dependence encouraged more and more Americans to live outside of the city. The city’s population was relatively stable until 1990, but as a result of the previ-ously mentioned issues, and the foreclosure crisis which ravaged East Cleveland just as it did City of Cleve-land neighborhoods, the number of East Cleveland residents declined from 33,096 in 1990 to 17,867 in 2010—a 46% decrease.
This population loss has been accompanied by an oversupply of housing stock. The number of housing units increased in East Cleveland until 1980, before decreasing from 15,168 in 1990 to 12,542 in 2010.3 However, Figure 1 shows that the population loss far outpaced the decrease in housing supply. The result has been an increase of vacant housing units in the city, which in turn has translated to an increase in vacant structures. There were 4,237 vacant housing units in East Cleveland by 2010, up from 2,268 in 2000. East Cleveland’s vacancy rate in 2010 stood at 34%, far worse than the 17% vacancy rate from ten years prior.4
The number of vacant structures presents challenges for East Cleveland. Vacant structures act as sites for crime,5 create health hazards and distress,6 and generally degrade quality of life.7 Additionally, these issues negatively affect property values.8 As indicated in Figure 2, blight and abandonment from the foreclosure crisis began to impact home sale prices throughout Cuyahoga County after 2006. Median home sales in 2000 were $62,475 and dropped to an all-time low of $2,500 in 2008. Some areas are beginning to show signs of slow recovery, but in 2013, the median home sale price in East Cleveland had only risen to $8,064.9 Such challenges act as “push” factors for ar-ea residents, referred to as the “flight from blight”.10 This out-migration of residents leads to further population loss and yet more vacant structures. Before long, widespread vacancy reduc-es city revenues.11
____________________ 2 Ibid. 3 Source: United States Decennial Census, 2000, 2010. 4 Ibid. 5 See: Spelman, W. 1993. Abandoned Buildings: Magnets For Crime? Journal of Criminal Justice Vol-ume: 21 Issue: 5 Pages: 481-495. 6 See: http://datatrends.fmhi.usf.edu/summary_28.pdf. 7 See: https://www.ptsdforum.org/c/gallery/-pdf/1-48.pdf. 8 See: http://www.clevelandfed.org/research/workpaper/2011/wp1123r.pdf. 9 Frank Ford, Thriving Communities Institute, reporting on data collected by NEO CANDO at Case Western Reserve University, October 2014. 10 See: http://apps.olin.wustl.edu/mba/casecompetition/PDF/2013OSCCCaseFinal.pdf. 11 See: http://communityresearchpartners.org/uploads/publications/FullReport_Nonembargoed.pdf.

8
The more vacant structures a city has to deal with, the less it has in the coffers to fund other city services—be it in public safety,12 parks and recreation, or infrastructure maintenance. For example, the City of East Cleveland has had to rely on other government entities to carry out its duties: the Cuyahoga County Sherriff’s department has been providing police support for the past several years, and the Cleveland Metroparks has been quietly helping to main-tain some East Cleveland parks.
Figure 2: Cuyahoga County Median 1-3 Family Home Sale Prices 2000 - 2013 Arms Length Sales13
Since 2010, East Cleveland, in partnership with the Cuyahoga County Land Reutilization Corporation (CCLRC, and commonly referred to as the Cuyahoga Land Bank), has utilized sources of federal funds14 to reduce the effects of blight on the community. One tool in this effort has been demolition. To date, CCLRC has demolished 282 of the city’s worst vacant properties, the majority of which have been residential apartment buildings and multifamily houses. Often, properties targeted for demolition are brought to the city’s attention by concerned residents. Once the vacant structure is removed, the response is relief. “I’m glad they tore [the houses] down,” said one East Cleveland resident to the Neighborhood Voice. “They were roach and rat infested.”15
There is strong evidence that demolitions have helped decrease the vacancy rate in East Cleveland. Perhaps not coin-cidentally, the city’s population has started to stabilize. Census estimates have shown less than a hundred residents were lost from 2012 to 2013.16 The hope is that this population stabilization continues as the city carries out its hous-ing and land strategy. The following analysis will serve as a guiding document toward the gradual rebirth of East Cleveland.
____________________ 12 A recently publicized tragedy in East Cleveland involved three female victims who were murdered in vacant and abandoned properties. 13 Arms Length Sales exclude Sheriff Sales, Sales to Banks and Federal Agencies, and $0 Dollar Transactions. 14 See: http://www.mortgageorb.com/e107_plugins/content/content.php?content.15118. 15 See: http://www.neighborhood-voice.com/neighborhood-news/east-cleveland/east-cleveland-to-demolish-150-abandoned-and-vacant-properties/. 16 See: http://quickfacts.census.gov/qfd/states/39/3923380.html.

9
How the Property Inventory Was Completed During early 2014, Western Reserve Land Conservancy’s Thriving Communities Institute, along with North-east Ohio Alliance for Hope (NOAH) under the supervision of Trevelle Harp, completed a comprehensive citywide property inventory. In partnership with East Cleveland officials, a team of six trained surveyors (which included East Cleveland residents) inventoried over 7,000 parcels across the city’s three wards. The surveyors photographed each parcel using a mobile device, and assessed whether a structure was present. If a structure was present, the surveyor determined whether it was vacant or occupied. Determining occupan-cy versus vacancy required a visual inspection governed by a number of uniformed guidelines. Additionally, the surveyors assessed and graded the condition of all vacant or occupied residential structures. The grading ranged from “A”, or “Excellent”, to “F”, or “Unsafe/Hazard”. All of the surveying took place from the side-walk. Additional criteria collected included: For Sale/Rent signs, Broken Windows, Boarded Windows/Doors, Dam-aged Roof, Chimney Damage, Missing/Deteriorated Siding, Peeling/Deteriorated Paint, Damaged Masonry/Foundation, Damaged Porch, Damaged/Deteriorated Stairs, Gutter/Downspout Damage, Garage Damage, Graffiti, Junk Cars, High Grass/Weeds, Trash/Debris on Property. This information will help inform City staff of some of the characteristics that contributed to the decision on grading. The following photos are examples of East Cleveland properties that were graded as part of the current re-port.
Image 2: East Cleveland Occupied House, Graded A:

10
Image 3: East Cleveland Occupied House, Graded B Image 4: East Cleveland Occupied House, Graded C
Image 5: East Cleveland Vacant House, Graded D Image 6: East Cleveland Occupied House, Graded F

11
The “What”, “Where” and “Who” of East Cleve-land’s Vacant and Occupied Properties
City-wide, 7,077 parcels were investigated and assessed, and 5,813 (82%) of these parcels contained a structure. There were 4,437 occupied structures counted, mak-ing up 63% of all parcels assessed, and 76% of all structures. There were 1,376 vacant structures counted, making up 19% of all assessed parcels, and 24% of all structures. Among the vacant structures, 954 (69%) of the them were secured, while 422 (31)% of them were open, and thus susceptible to entry.17 Moreover, 1,013 (14%) of all assessed parcels in East Cleveland contain vacant lots, which is evi-dence of demolition activity to date.
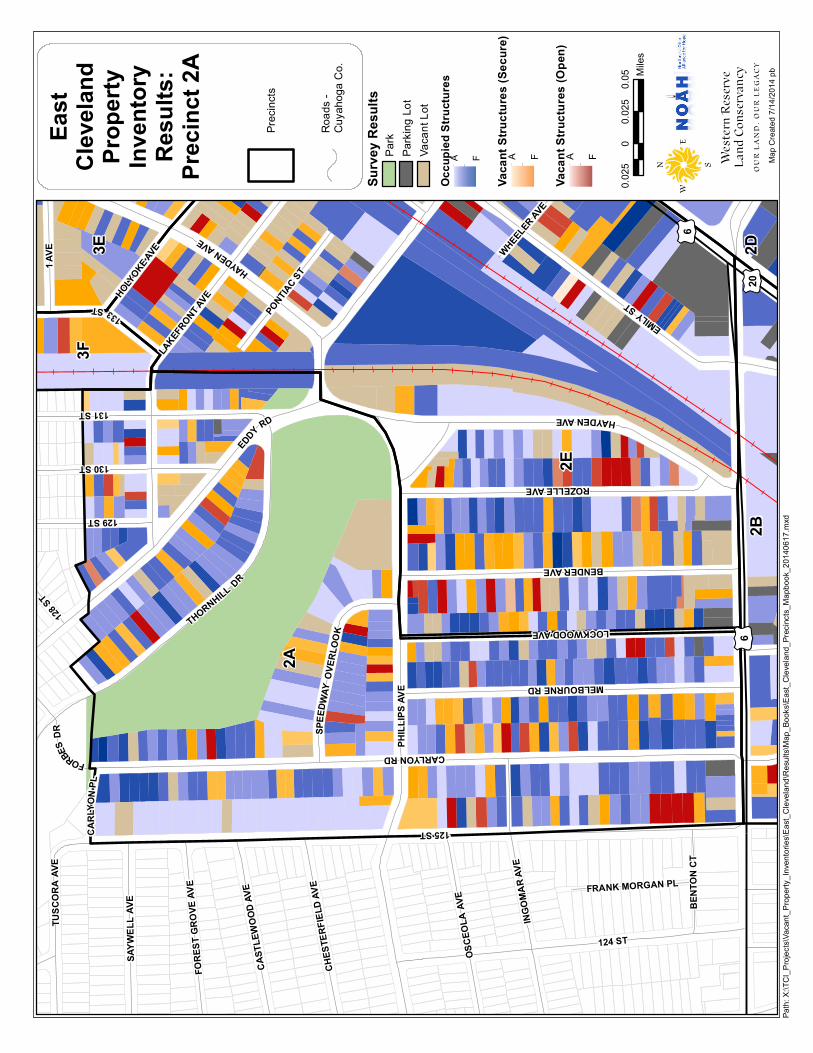
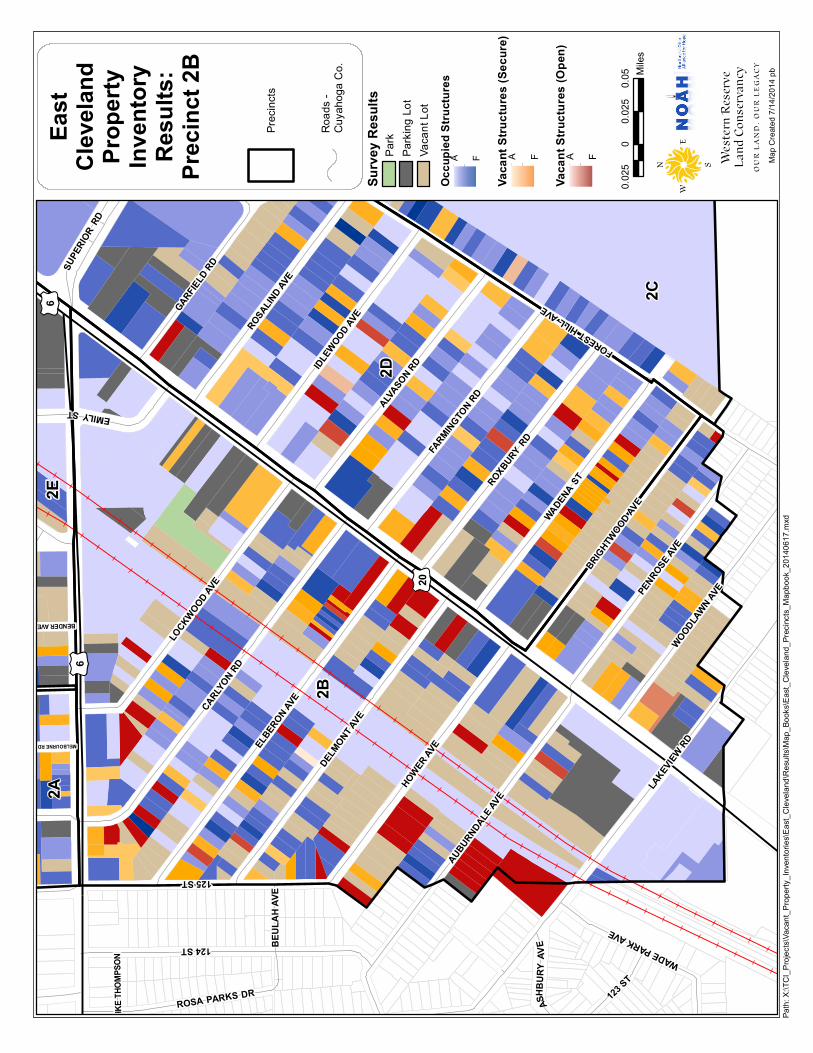
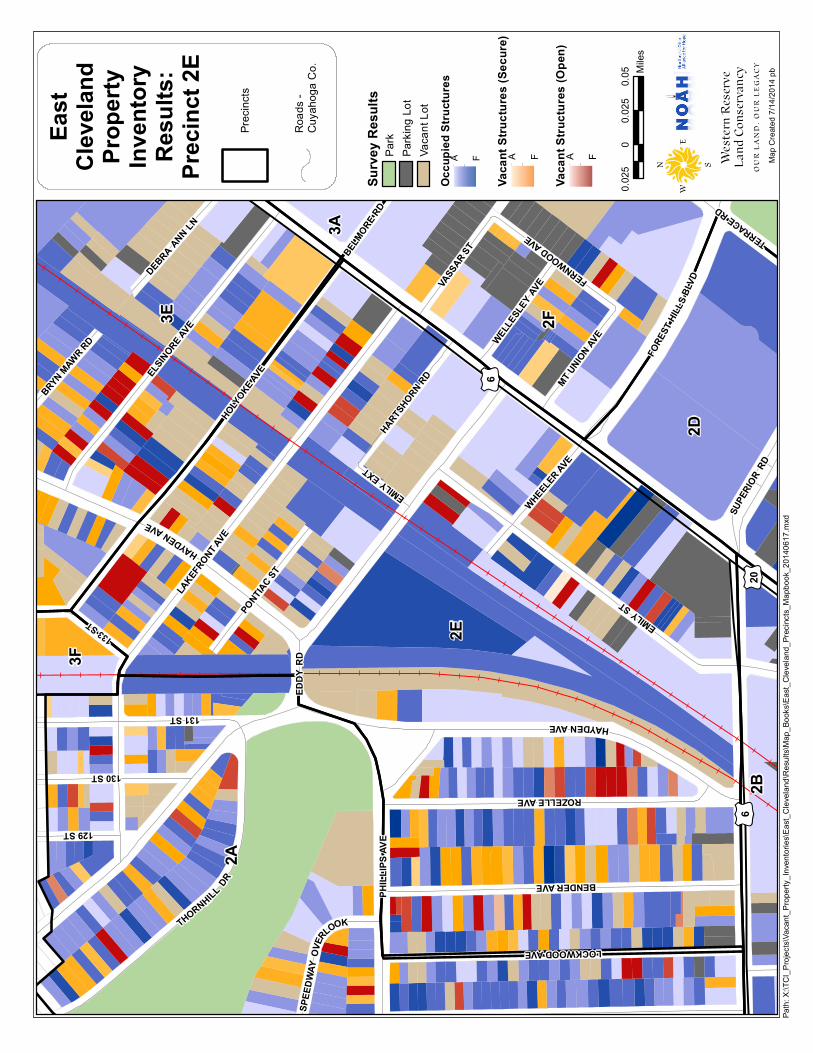
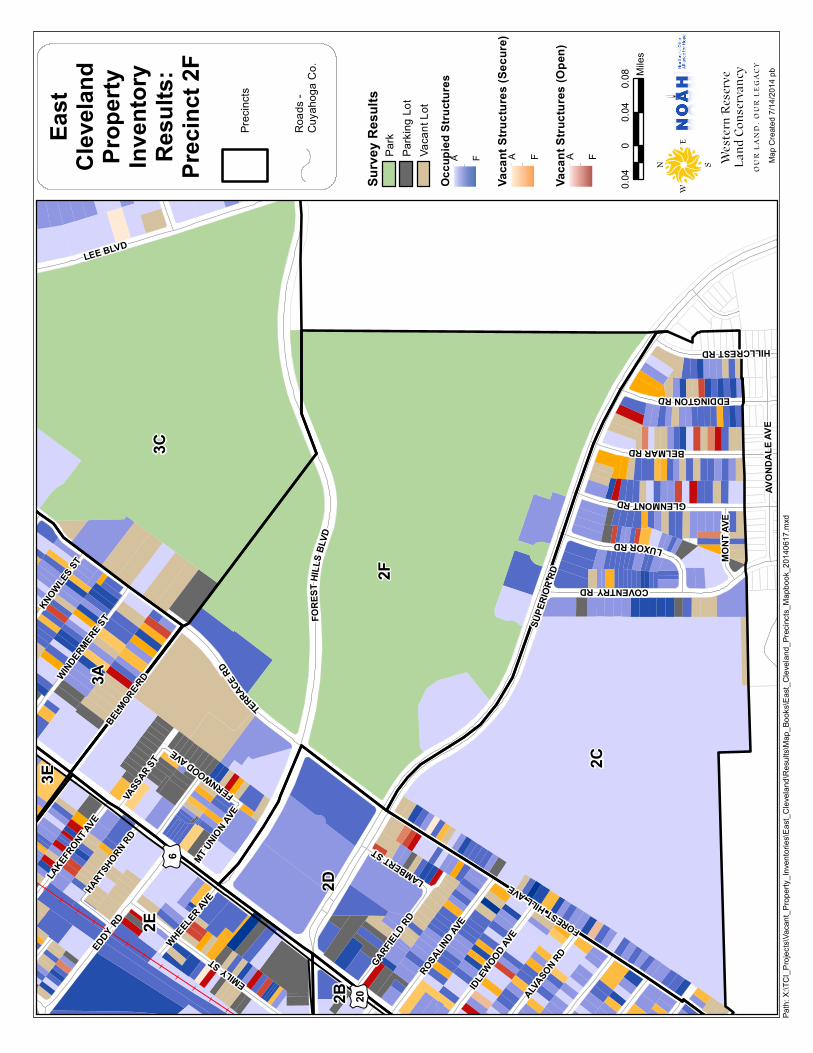
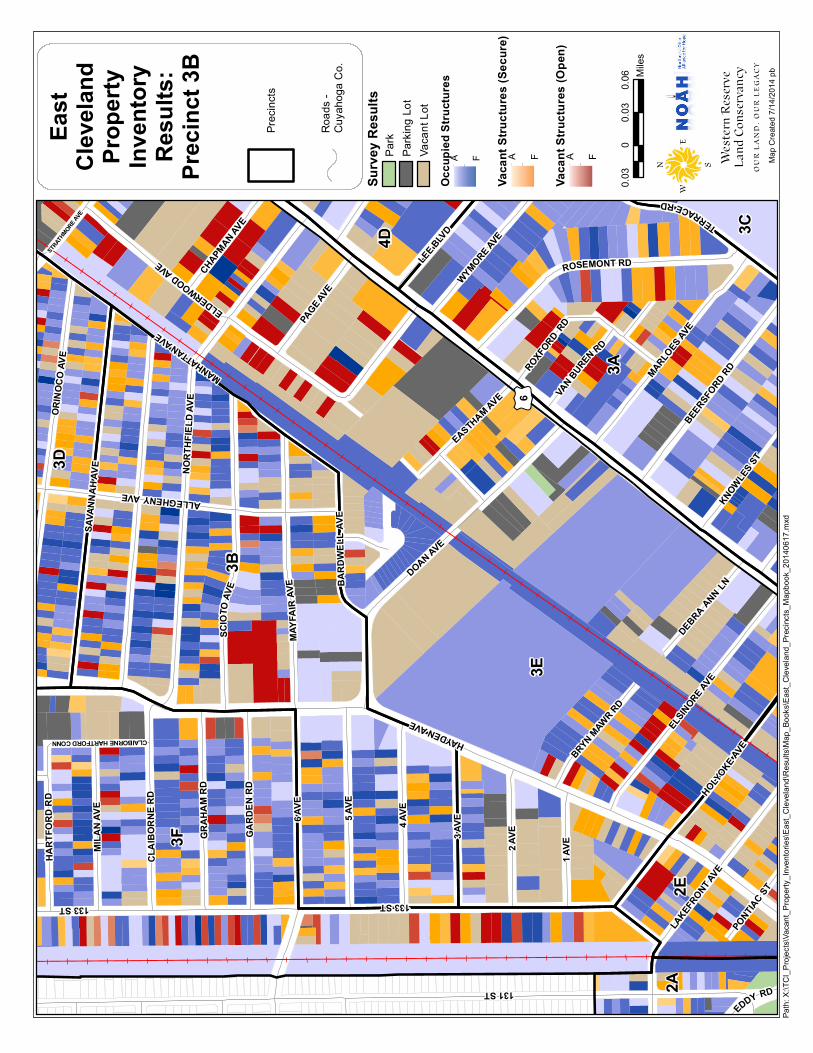
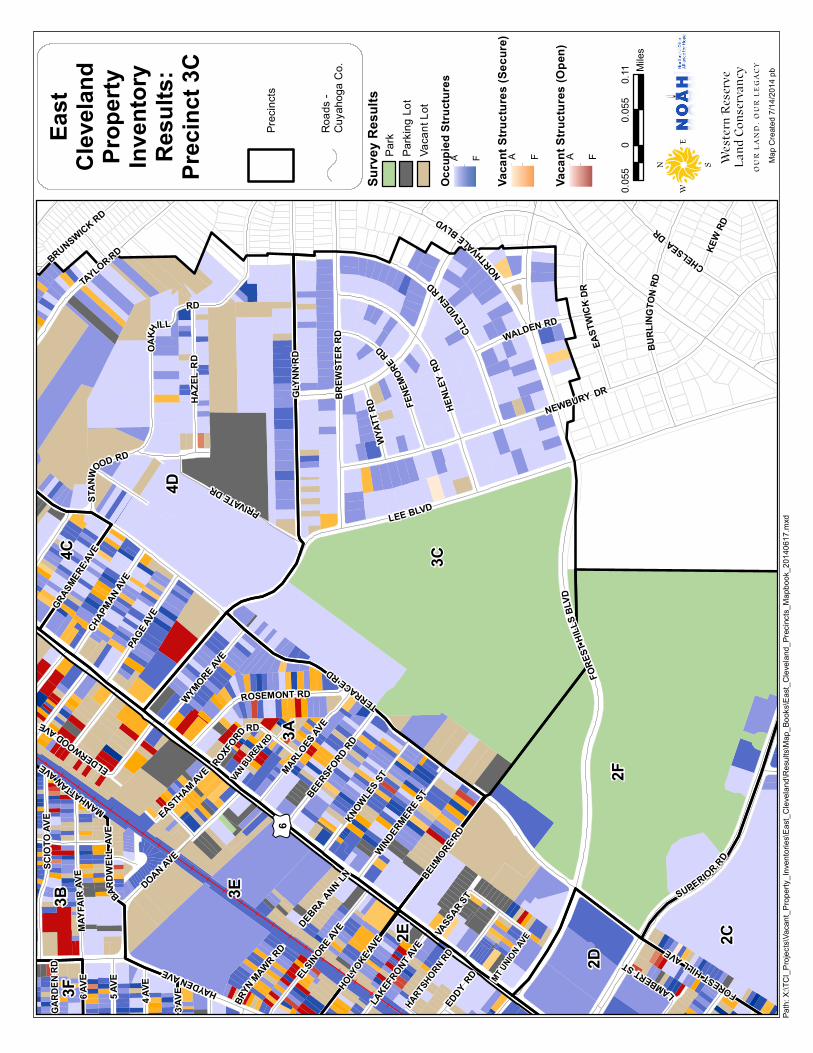
Map 1 in Appendix A details where every occupied and vacant structure is in the city of East Cleveland, as well as every vacant lot. The map depicts data collected during the inventory, which is also summarized in Figure 2.
Table 1 further breaks down these numbers. Of the 5,813 structures in East Cleveland, 76.3% were occupied. Over half of East Cleveland’s occupied structures were in “excellent” or “good” quality. Specifically, there were 1,067 structures graded “A” and 1,391 structures graded “B”. Less than 10% of East Cleveland’s occu-pied stock was in poorer condition (i.e., rated “D” or “F”). In other words, the city has a sound housing stock to work with in creating future strategies.
____________________________ 17 It must be noted that the determination of what was “open” was limited by what could be observed from the sidewalk. Addi-tional structures could have open rear entry doors and ground floor windows.
Table 1. Vacancy and Occupancy Survey for City of East Cleveland
Survey Counts Key Data
Occupied Structure - A 1066 Percent of Stock "A" or "B"
55.3%
Occupied Structure - B 1386
Occupied Structure - C 1568
Occupied Structure - D 374
Occupied Structure - F 40
Total Occupied 4437 Occupancy Rate 76.3%
Vacant Structure - A 29
Vacant Structure - B 57
Vacant Structure - C 259
Vacant Structure - D 526 Demolish-able 1030
Vacant Structure - F 504
Total Vacant 1376 Vacancy Rate 23.7%

12
In terms of vacancy, our survey found that East Cleveland has 1,376 vacant structures. This represents 19% of the 7,368 parcels in the municipality of East Cleveland. By comparison, in 2010, US Postal Data collected by Case Western Reserve University found 1,590 vacant structures, which represented 22% of the 7,368 par-cels in East Cleveland.18 This reduction in vacancy suggests that targeted demolition to date is beginning to have a positive impact on blight. However, issues remain as indicated by the low home sale prices cited above. Specifically, unlike the occupied structures, the quality of East Cleveland’s vacant structures is poor, with 1,030, or 75%, of its vacant structures graded as a “D” or “F”. These structures are prime targets in the city’s strategic demolition going forward.
Where are these blighted structures located? Also, where is the highest-rated housing stock? Answering these questions will further inform East Cleveland’s housing and development strategic framework.
An analysis of conditions was done for each of the eighteen East Cleveland precincts. Before detailing this, it is important to see whether there is a relationship between the concentration of vacant properties in a pre-cinct and the concentration of high-quality, occupied structures. The thinking being that the presence of blight can be “contagious” to the structures around it. A correlation was run between the percent of vacant structures in a precinct with the percent of high-quality structures. The results show a strong negative corre-lation of -.779, which suggests that a high quantity of vacant structures reduces the number of high-quality structures in an area. This can suggest that demolishing the worst vacant structures in each precinct may benefit the conditions of surrounding properties.
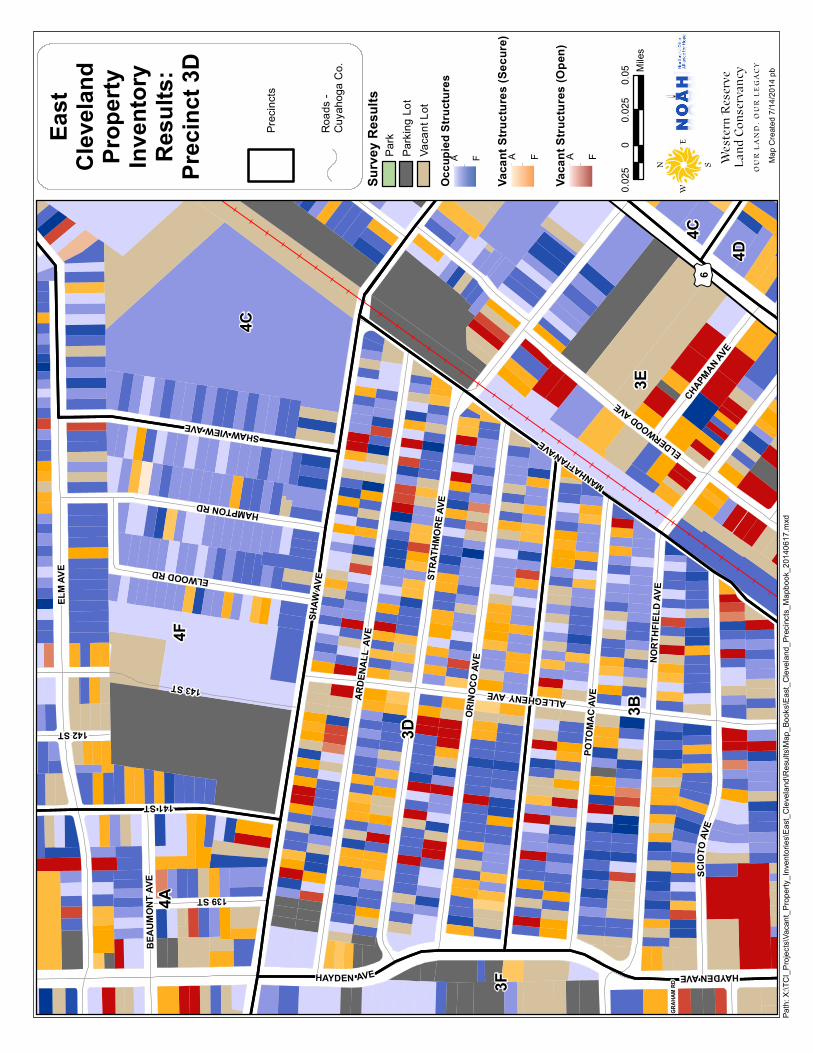
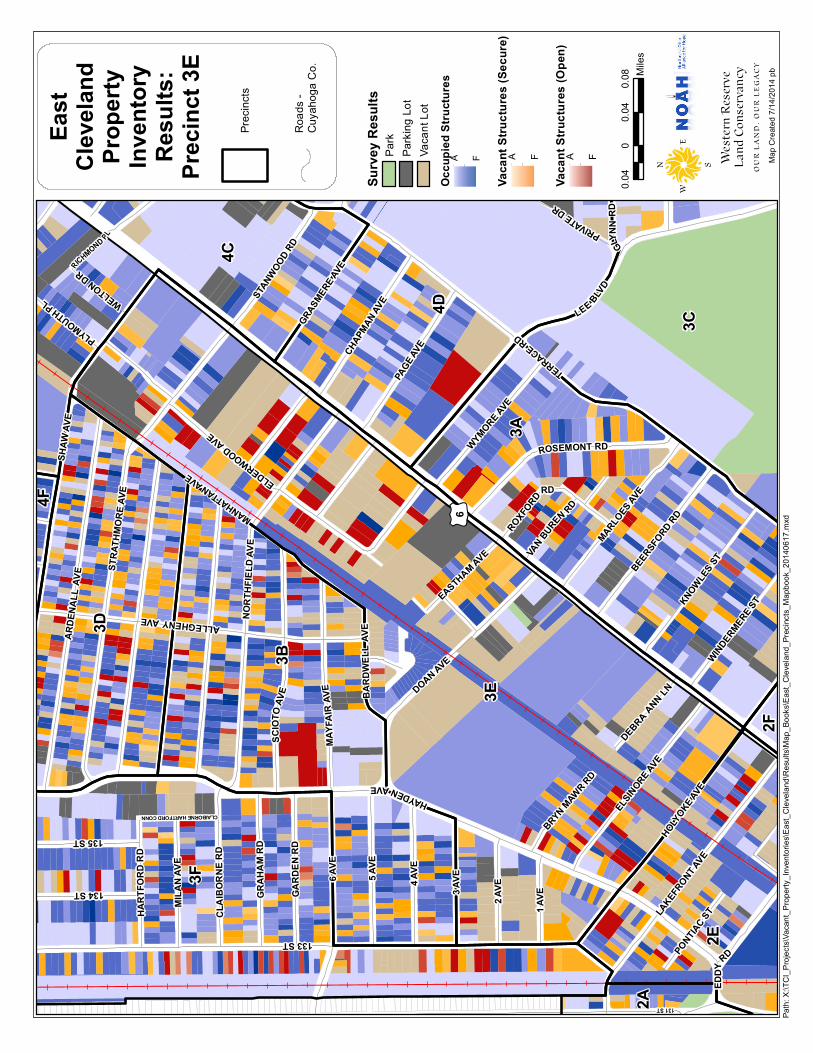
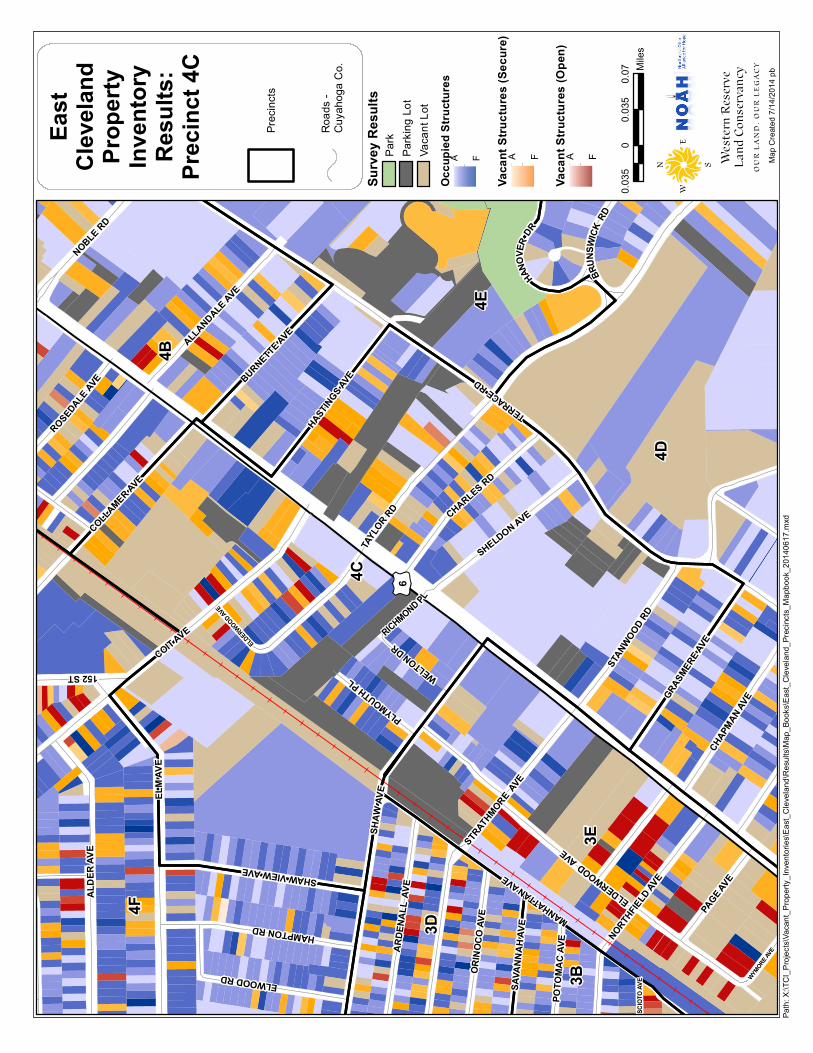
Figure 3 shows where each precinct stands in its frequency of vacant and high-quality structures. The pre-cincts with the highest percentages of vacancies are Precincts 3D (29.5% vacancy rate), 3E (25.8% vacancy rate), and 4A (27% vacancy rate). Each of these precincts has a vacancy rate above the city-wide average of 23.7% and together account for almost 30% of East Cleveland’s vacant properties. Conversely, the concen-tration of high-quality, occupied structures is more diffuse. In precincts 3C, 4D, 4E, 4C, and 2D, and 2A, a ma-jority of the structures are rated “Excellent” or “Very Good”. The implications of these findings will be dis-cussed in the final section below.
____________________ 18 NEO CANDO 2010+ system, Northeast Ohio Data Collaborative (http://neocando.case.edu/neocando/).
13
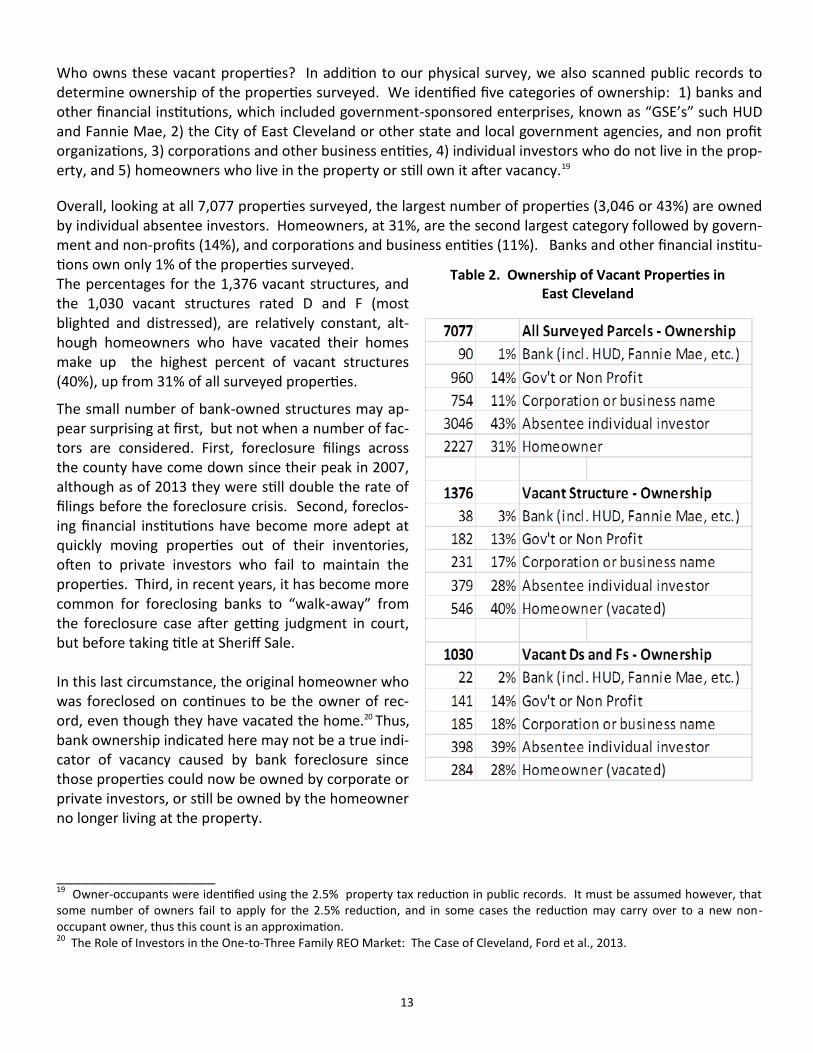
Who owns these vacant properties? In addition to our physical survey, we also scanned public records to determine ownership of the properties surveyed. We identified five categories of ownership: 1) banks and other financial institutions, which included government-sponsored enterprises, known as “GSE’s” such HUD and Fannie Mae, 2) the City of East Cleveland or other state and local government agencies, and non profit organizations, 3) corporations and other business entities, 4) individual investors who do not live in the prop-erty, and 5) homeowners who live in the property or still own it after vacancy.19
Overall, looking at all 7,077 properties surveyed, the largest number of properties (3,046 or 43%) are owned by individual absentee investors. Homeowners, at 31%, are the second largest category followed by govern-ment and non-profits (14%), and corporations and business entities (11%). Banks and other financial institu-tions own only 1% of the properties surveyed. The percentages for the 1,376 vacant structures, and the 1,030 vacant structures rated D and F (most blighted and distressed), are relatively constant, alt-hough homeowners who have vacated their homes make up the highest percent of vacant structures (40%), up from 31% of all surveyed properties.
The small number of bank-owned structures may ap-pear surprising at first, but not when a number of fac-tors are considered. First, foreclosure filings across the county have come down since their peak in 2007, although as of 2013 they were still double the rate of filings before the foreclosure crisis. Second, foreclos-ing financial institutions have become more adept at quickly moving properties out of their inventories, often to private investors who fail to maintain the properties. Third, in recent years, it has become more common for foreclosing banks to “walk-away” from the foreclosure case after getting judgment in court, but before taking title at Sheriff Sale. In this last circumstance, the original homeowner who was foreclosed on continues to be the owner of rec-ord, even though they have vacated the home.20 Thus, bank ownership indicated here may not be a true indi-cator of vacancy caused by bank foreclosure since those properties could now be owned by corporate or private investors, or still be owned by the homeowner no longer living at the property. ____________________ 19 Owner-occupants were identified using the 2.5% property tax reduction in public records. It must be assumed however, that some number of owners fail to apply for the 2.5% reduction, and in some cases the reduction may carry over to a new non-occupant owner, thus this count is an approximation. 20 The Role of Investors in the One-to-Three Family REO Market: The Case of Cleveland, Ford et al., 2013.
Table 2. Ownership of Vacant Properties in East Cleveland

14
What Next? Charting a Land and Housing Plan Going Forward in East Cleveland East Cleveland officials currently have a four-pronged land and housing strategy in place. The current analy-sis provides a detailed road map in helping city leaders implement their vision going forward, which includes the City’s existing strategy and a recommended fifth strategy.
Strategy 1—Eliminating Threat: A primary duty of
any city is to ensure safety and security of its resi-dents, and more generally to ensure residents’ qual-ity of life. When it comes to blight, East Cleveland officials must be able to identify vacant properties that pose an immediate threat to the safety and se-curity of its residents. As stated, open, blighted va-cant structures, such as the one shown in Image 7 on Shaw Avenue, present serious concerns to sur-rounding residents. With the property database and maps created as part of the inventory, East Cleve-land officials have the tools needed to make the city safer, thereby increasing its residents’ mental and physical well-being. In this way, East Cleveland can stem “flight from blight” by tackling the blight head-on. Image 7: Vacant structure on Shaw Avenue
Strategy 2—Maximizing the Return on Investment: A recent study commissioned by Thriving Communities
Institute showed that for every public dollar ($1) spent on demolition of vacant properties in Cuyahoga County, there was a return of $1.40 in home equity of nearby properties.21 This return was greatest when selective demolitions were done in areas where home values were highest. That said, a key component of East Cleveland’s housing and land strategy will be to undertake a street-level, selective demolition process in areas of moderate- to high-housing value. This maintenance approach will allow for a continued high-occupancy rate at the street level, as well as an increase in home equity for residents near the removal of a vacant, blighted structure.
Strategy 3—Beyond “Blight Light”: When a house is demolished, the resulting a vacant lot can be derisively
called blight light. While area residents often prefer a vacant lot to the presence of an unsafe vacant struc-ture, the lot can act as an eyesore, particularly when grass remains uncut or the lot is used as dumping ground. The current analysis allows East Cleveland officials to keep track of their vacant lot inventory to en-sure they are well kept and debris-free.
____________________ 21 See: http://www.thrivingcommunitiesinstitute.org/documents/FinalReportwithExecSummary_modified.pdf.

15
Beyond maintenance, a major goal of East Cleveland’s is to reuse many of the city’s vacant lots as places for green space, particularly as sites for tree planting. The plan would be to replicate the ongoing efforts in the City of Cleveland to re-forest the neighborhoods that have lost their tree canopy due to development.22 In a recent study completed by the Cuyahoga County Planning Commission, East Cleveland ranked 31st out of 59 cities in its existing tree canopy.23 The study showed that 20% of East Cleveland’s land area is not covered in concrete, making it suitable for tree planting. This potential for green space will increase as more vacant, blighted houses continue to be removed. Moving beyond vacant lots that have not been repurposed is an important aspect in East Cleveland’s livability initiatives, as parks and green space add to the city’s urban amenities to make the city more attractive to new and existing residents. Research has also shown that add-ing green space to a street adds to nearby home values.24
Strategy 4—Infill Development: The City of
East Cleveland sits at the edge of Cleveland’s Health Tech Corridor, which runs from Down-town Cleveland to University Circle along Euclid Avenue. The area has experienced $3 billion in investment,25 which means the Health Tech Corridor is quickly becoming the region’s “second downtown”. The Corridor, according to the City of Cleveland’s website, is “home to 75+ biomedical companies, 45 technology com-panies, 7 business incubators, 4 world-class healthcare and research systems including the Cleveland Clinic and University Hospitals, and 3 higher education institutions”.26 Job growth along this corridor increased by 22% according to a recent Cleveland State University report.27 Image 8: Circle East Townhomes
This growth has brought an increase in demand for new housing. In 2012, the Circle East Townhomes were completed in the City of East Cleveland to help meet this demand. In all, 20 units were built. As the region’s “second downtown” gets larger, infill development will continue into East Cleveland’s borders. This demand will play a huge role in the city’s land and housing strategy, particularly in the Precincts of 2B and 2D that border University Circle. To further attract development, city officials will use the survey to continue to put together a land acquisition strategy so that new housing can be developed, boosting not only population and city revenue, but city pride.
"Thousands of people work in University Circle," said nationally renowned urban planning expert Norm Krumholz, who is also an East Cleveland planning consultant.28 "This is something that instills hope. It's a great day."
____________________ 22 See: http://www.cleveland.com/cityhall/index.ssf/2014/03/cleveland_to_plant_1000_trees.html. 23 See: http://planning.co.cuyahoga.oh.us/canopy/communities.html. 24 See: http://www.forestry.gov.uk/pdf/FCRP021.pdf/$FILE/FCRP021.pdf. 25 See: http://planning.city.cleveland.oh.us/ed/index1.html. 26 Ibid. 27 See: http://engagedscholarship.csuohio.edu/cgi/viewcontent.cgi?article=2145&context=urban_facpub. 28 See: http://blog.cleveland.com/metro/2011/09/east_cleveland_razing_63_aband.html.

16
Recommendation: Strategy 5— Enhanced and Targeted Code Enforcement: We recommend the City
of East Cleveland consider utilizing it’s code enforcement “police power” to adopt strategies that are tai-lored to match the type of ownership categories we found in our analysis. Following are four examples for consideration. Each of these strategies is designed to help a municipality recover the cost of demolition and nuisance abatement. Joint and Several Liability Ordinance. The City of Cleveland has enacted an ordinance which allows it to retroactively hold a prior owner accountable for demolition costs, provided the property was inspected and condemned during the prior ownership. This would be useful in cases where a foreclosing bank has taken ownership of a blighted structure but then sold it to an investor before the property is demolished. If the City of East Cleveland inspected and condemned the property during the bank’s ownership, the City would be able to go back to the bank and demand reimbursement. This would enable the City to stretch available demolition funding further. Foreclosure Bond Ordinance. As noted earlier, in some cases banks are filing foreclosure, causing the home to be vacated, then choosing not to take title at Sheriff Sale, thereby avoiding financial responsibility for blighted conditions. The City of Youngstown has enacted an innovative ordinance that requires foreclos-ing banks to post a $10,000 bond with the City. Whether or not the bank takes title at Sheriff Sale, the bond can be used by the City to offset the cost of demolition, boarding, clean-up or other nuisance abate-ment actions taken by the City. Bulk-Holder Enforcement Program. While conducting our analysis of ownership types we observed that there are many cases where a business, bank or private individual investor owned multiple properties in the City of East Cleveland. The City of Cleveland has adopted a bulk-holder enforcement program to address this. Rather than initiate code enforcement actions on one property at a time, enforcement can be pur-sued against multiple properties owned by one owner. This is not only more efficient, but gives the munici-pality greater leverage for enforcement. Code Enforcement Partnership Program. The City of East Cleveland is not alone in confronting the prob-lem of addressing many blighted structures with too few resources. The City of Cleveland has created a “Code Enforcement Partnership Program” which leverages the “on-the ground” resource of the city’s com-munity development corporations. These community-based organizations serve as extra “eyes and ears” helping to efficiently guide limited code enforcement resources where they can have the most impact. Similarly, the City of East Cleveland could consider partnering with organizations such as NOAH (The North-east Ohio Alliance For Hope) to achieve cost effective application of its resources. Thriving Communities Institute is prepared to offer additional research and technical assistance to explore these options.

17
Conclusion East Cleveland’s viability as a “standalone” city has been the subject of considerable discussion and specula-tion. At issue is whether annexation by the City of Cleveland would be in the best interest of East Cleveland and its beleaguered residents.
These discussions have already proven to be complicated and contentious—both in East Cleveland, where proud residents bristle at the suggestion that their city cannot govern itself, and in Cleveland, where munici-pal leaders question the wisdom of annexing a city with such a high level of distress. Regardless of where these discussions lead, it is essential that blight removal must continue in East Cleveland. This is critical to the people who live in its neighborhoods and suffer with those conditions on a daily basis—and to all the residents of Cuyahoga County, who are being forced to pick up a larger share of the countywide tax burden as a result of the collapse of East Cleveland’s property tax base.29
To date, the critical blight removal in East Cleveland has been funded from a variety of sources, including NSP grants, the Moving Ohio Forward program through the Ohio Attorney General’s Office, corporate dollars of the Cuyahoga County Land Reutilization Corporation and, most recently, from monies provided by the Treasury Department through Hardest Hit Funds. As of this writing, Cuyahoga County is preparing to issue $50 million in demolition bonds to remove blighted properties in residential neighborhoods of Cuyahoga County. The bulk of these dollars will be spent in two communities: Cleveland and East Cleveland. The im-pact of this bond on East Cleveland cannot be overstated: It can remove a significant percentage of the re-maining blighted structures in East Cleveland. It will stabilize the city and create opportunities for the repur-posing of land that were unimaginable 10 years ago. East Cleveland will not “turn the corner” overnight. But the removal of the majority of blighted properties will make it much easier – and provide critical relief for the people who still call East Cleveland home. This report will help leaders at the city and county level to prioritize dollars for demolition—and the rebirth of the city that will follow.
Image 9: Survey Team
____________________ 29 “The Cost of Vacancy: Everybody Pays”, Thomas and Gillispie, 2014. See http://s3.documentcloud.org/documents/1096130/the-cost-of-vacancy.pdf.

18
Appendix Overview Map…………………………………………………………………………………….19 Precinct Maps……………………………………………………………………………………..20

£ ¤6
£ ¤6
£ ¤20
£ ¤322
2A 2B
2C
2D
2E
2F3A
3B
3C
3D
3E
3F
4A
4B
4C
4D
4E
4F
0.10
0.10.2
Miles
East
Clev
eland
Prop
erty
Inven
tory
Prec
incts
State
High
ways
Road
s -Cu
yaho
ga C
o.
Activ
e Rail
Lines
Map C
reated
7/14
/2014
pb
Wes
tern
Res
erve
La
nd
Co
nse
rvan
cyO
UR
LA
ND
. O
UR
LE
GA
CY
N S
WE
Path:
X:\TC
I_Proj
ects\
Vaca
nt_Pr
opert
y_Inv
entor
ies\Ea
st_Cle
velan
d\Res
ults\E
ast_C
levela
nd_R
esult
s_20
1406
17.m
xd
Occu
pied S
tructu
res
A F
Vaca
nt S
tructu
res (
Secu
re)
A F
Vaca
nt S
tructu
res (
Open
)A F
Surve
y Res
ults
Park
Parki
ng Lo
tVa
cant
Lot
£ ¤20
£ ¤6
£ ¤6
PHILL
IPS AV
E
133ST
EDDY RD
LAKEF
RONT AVE
THORNHILL DR125 ST
HOLYOKE AVE WHEELE
R AVE
EMILY ST
128 ST
124 ST
BENT
ON C
T
HAYDENAVE
HAYDENAVE
TUSC
ORA
AVE
OSCE
OLA
AVE
PONTIA
C ST
INGO
MAR A
VE
CARL
YON
P L
1 AVE
FRANK MORGAN PL
SAYW
ELL
AVE
FORE
STGR
OVEA
VE
CAST
LEWO
OD AV
E
CHES
TERF
IELD A
VE
LOCKWOOD AVE
ROZELLE AVE
CARLYON RD
131 ST
130 ST
129 ST
FORBES
DR SPEE
DWAY
OVER
LOOK
BENDER AVE
MELBOURNE RD
2A
2B2D
2E
3E3F
0.025
00.0
250.0
5 Miles
East
Clev
eland
Prop
erty
Inven
tory
Resu
lts:
Prec
inct 2
A
Prec
incts
Road
s -Cu
yaho
ga C
o.
Map C
reated
7/14
/2014
pb
Wes
tern
Res
erve
La
nd
Co
nse
rvan
cyO
UR
LA
ND
. O
UR
LE
GA
CY
N S
WE
Path:
X:\TC
I_Proj
ects\
Vaca
nt_Pr
opert
y_Inv
entor
ies\Ea
st_Cle
velan
d\Res
ults\M
ap_B
ooks
\East_
Cleve
land_
Prec
incts_
Mapb
ook_
2014
0617
.mxd
Occu
pied S
tructu
res
A F
Vaca
nt S
tructu
res (
Secu
re)
A F
Vaca
nt S
tructu
res (
Open
)A F
Surve
y Res
ults
Park
Parki
ng Lo
tVa
cant
Lot
£ ¤6
£ ¤20
£ ¤6
IKE TH
OMPS
ON
FORESTHILLAVE
SUPE
RIOR
RD
EMILYST
ROSA PARKS DR
125 ST
BENDER AVE
LAKEV
IEW RDMELBOURNE RD
PENROSE
AVE
AUBURNDALE AV
E
BEUL
AH AV
E
123 ST
ASHB
URY
AVE
WOODLAWN AV
E
WADEPARKAVE
GARFIELD
RD
ROSALIN
D AVE
IDLEWOOD AV
E
ALVASO
N RDFA
RMINGTON RD
ROXBURY RD
WADENA ST
BRIGHTWOOD AV
E
HOWER AV
E
LOCKWOOD AV
E
DELMONT A
VE
ELBER
ON AVE
124 ST
CARLYON RD
2A
2B
2C
2D
2E
0.025
00.0
250.0
5 Miles
East
Clev
eland
Prop
erty
Inven
tory
Resu
lts:
Prec
inct 2
B
Prec
incts
Road
s -Cu
yaho
ga C
o.
Map C
reated
7/14
/2014
pb
Wes
tern
Res
erve
La
nd
Co
nse
rvan
cyO
UR
LA
ND
. O
UR
LE
GA
CY
N S
WE
Path:
X:\TC
I_Proj
ects\
Vaca
nt_Pr
opert
y_Inv
entor
ies\Ea
st_Cle
velan
d\Res
ults\M
ap_B
ooks
\East_
Cleve
land_
Prec
incts_
Mapb
ook_
2014
0617
.mxd
Occu
pied S
tructu
res
A F
Vaca
nt S
tructu
res (
Secu
re)
A F
Vaca
nt S
tructu
res (
Open
)A F
Surve
y Res
ults
Park
Parki
ng Lo
tVa
cant
Lot

£ ¤6
£ ¤20
£ ¤322
EDDINGTON RD
GLENMONTRD
LUXORRD
FORESTHILLAVE
LAMBERT ST
SUPE
RIOR
RDFORE
STHI
LLSB
LVD
UNNA
MED
ST
AVON
DALE
AVE
MIDDLEHURST RD
MONT
AVE
WADENA ST
TERRACE RD
ROXBURY RD
GARFIELD
RD
FARMINGTO
N RD
ALVASON RD
ROSALIN
D AVE
IDLEWOOD AV
E
COVENTRY RD
HILLCREST RD
EMILYST
UNNAMED ST
2B
2B
2C
2D
2E
2F
3C
0.04
00.0
40.0
8 Miles
East
Clev
eland
Prop
erty
Inven
tory
Resu
lts:
Prec
inct 2
C
Prec
incts
Road
s -Cu
yaho
ga C
o.
Map C
reated
7/14
/2014
pb
Wes
tern
Res
erve
La
nd
Co
nse
rvan
cyO
UR
LA
ND
. O
UR
LE
GA
CY
N S
WE
Path:
X:\TC
I_Proj
ects\
Vaca
nt_Pr
opert
y_Inv
entor
ies\Ea
st_Cle
velan
d\Res
ults\M
ap_B
ooks
\East_
Cleve
land_
Prec
incts_
Mapb
ook_
2014
0617
.mxd
Occu
pied S
tructu
res
A F
Vaca
nt S
tructu
res (
Secu
re)
A F
Vaca
nt S
tructu
res (
Open
)A F
Surve
y Res
ults
Park
Parki
ng Lo
tVa
cant
Lot

£ ¤20
£ ¤6
£ ¤6
FORESTHILLAVE
LAMBERT ST
SUPE
RIOR RD
LAKEV
IEW RD
WOODLAWN AV
EPENROSE
AVE
MT UNION AV
E
AUBUR
NDALE
AVE
TERRACE RD
HOWER AV
E
GARFIELD
RD
BENDER AVE
DELMONT A
VE
ROSALIN
D AVE
IDLEWOOD AV
EALVA
SON RD
FARMINGTO
N RD
ELBER
ON AVE
ROXBURY RD
WADENA ST
BRIGHTWOOD AV
E
LOCKWOOD AV
ECARLYO
N RD
ROZELLE AVE
EMILY ST
HAYDENAVE
MELBOURNE RD 2A
2B
2C
2D
2E
2F
0.03
00.0
30.0
6 Miles
East
Clev
eland
Prop
erty
Inven
tory
Resu
lts:
Prec
inct 2
D
Prec
incts
Road
s -Cu
yaho
ga C
o.
Map C
reated
7/14
/2014
pb
Wes
tern
Res
erve
La
nd
Co
nse
rvan
cyO
UR
LA
ND
. O
UR
LE
GA
CY
N S
WE
Path:
X:\TC
I_Proj
ects\
Vaca
nt_Pr
opert
y_Inv
entor
ies\Ea
st_Cle
velan
d\Res
ults\M
ap_B
ooks
\East_
Cleve
land_
Prec
incts_
Mapb
ook_
2014
0617
.mxd
Occu
pied S
tructu
res
A F
Vaca
nt S
tructu
res (
Secu
re)
A F
Vaca
nt S
tructu
res (
Open
)A F
Surve
y Res
ults
Park
Parki
ng Lo
tVa
cant
Lot
£ ¤20
£ ¤6
£ ¤6
EDDY
RD
129 ST
FORE
STHIL
LSBL
VD
PHILL
IPS AV
E
TERRACE RD
LAKEF
RONT AVE
HAYDENAVEWHEELE
R AVE
EMILY ST
HAYDENAVE
EMILY EXT
PONTIA
C ST
BELMORE R
D
BRYN MAWR RD
HOLYOKE A
VE
DEBRA ANN LN
VASS
AR ST
WELLE
SLEY
AVE
MT UNION AV
E
HARTSHORN RDEL
SINORE AV
E
LOCKWOOD AVE
THORNHILL DR
131 ST
130 ST
SUPE
RIOR
RD
133 ST
ROZELLE AVE
FERNWOOD AVE
SPEE
DWAY
OVER
LOOK
BENDER AVE
2A
2B
2D
2E
2F
3A
3E
3F
0.025
00.0
250.0
5 Miles
East
Clev
eland
Prop
erty
Inven
tory
Resu
lts:
Prec
inct 2
EPr
ecinc
ts
Road
s -Cu
yaho
ga C
o.
Map C
reated
7/14
/2014
pb
Wes
tern
Res
erve
La
nd
Co
nse
rvan
cyO
UR
LA
ND
. O
UR
LE
GA
CY
N S
WE
Path:
X:\TC
I_Proj
ects\
Vaca
nt_Pr
opert
y_Inv
entor
ies\Ea
st_Cle
velan
d\Res
ults\M
ap_B
ooks
\East_
Cleve
land_
Prec
incts_
Mapb
ook_
2014
0617
.mxd
Occu
pied S
tructu
res
A F
Vaca
nt S
tructu
res (
Secu
re)
A F
Vaca
nt S
tructu
res (
Open
)A F
Surve
y Res
ults
Park
Parki
ng Lo
tVa
cant
Lot
£ ¤20
£ ¤6
SUPE
RIOR R
D
TERRACERD
GLENMONTRD
LUXORRD
FORESTHILLAVELAMBERT ST
EDDY R
D
WHEELER AVE
AVON
DALE
AVE
EMILY ST
MONT
AVE
VASS
AR ST
KNOWLES S
T
MT UNION AV
E
LEE BLVD
HARTSHORN RD
ALVASO
N RD
FORE
STHI
LLS B
LVD
LAKEF
RONT AVE
GARFIELD
RD
IDLEWOOD AV
E
WINDERMER
E ST
ROSALIN
D AVE
BELMORE RD
BELMARRD
EDDINGTONRD
COVENTRY RD
HILLCREST RD
FERNWOOD AVE
2B
2C
2D
2E
2F
3A
3C
3E
0.04
00.0
40.0
8 Miles
East
Clev
eland
Prop
erty
Inven
tory
Resu
lts:
Prec
inct 2
FPr
ecinc
ts
Road
s -Cu
yaho
ga C
o.
Map C
reated
7/14
/2014
pb
Wes
tern
Res
erve
La
nd
Co
nse
rvan
cyO
UR
LA
ND
. O
UR
LE
GA
CY
N S
WE
Path:
X:\TC
I_Proj
ects\
Vaca
nt_Pr
opert
y_Inv
entor
ies\Ea
st_Cle
velan
d\Res
ults\M
ap_B
ooks
\East_
Cleve
land_
Prec
incts_
Mapb
ook_
2014
0617
.mxd
Occu
pied S
tructu
res
A F
Vaca
nt S
tructu
res (
Secu
re)
A F
Vaca
nt S
tructu
res (
Open
)A F
Surve
y Res
ults
Park
Parki
ng Lo
tVa
cant
Lot

£ ¤6
TERRACERD
EASTHAM AVE
ELDERWOOD AVE
LAKEF
RONT AVE
VASS
AR STWEL
LESL
EY AV
E
VAN BUREN
RD
MARLOES
AVE
DOAN AVE
HOLYOKE A
VE
DEBRA ANN LN
PAGE A
VE
LEE BLVD
ELSIN
ORE AVE
WYMORE AVE
KNOWLES S
T
WINDERMERE S
T
BELMORE R
D
BEERSF
ORD RD
ROSEMONT RD
ROXFORD RD
2E
2F
3A
3B
3C
3E
4D
0.025
00.0
250.0
5 Miles
East
Clev
eland
Prop
erty
Inven
tory
Resu
lts:
Prec
inct 3
A
Prec
incts
Road
s -Cu
yaho
ga C
o.
Map C
reated
7/14
/2014
pb
Wes
tern
Res
erve
La
nd
Co
nse
rvan
cyO
UR
LA
ND
. O
UR
LE
GA
CY
N S
WE
Path:
X:\TC
I_Proj
ects\
Vaca
nt_Pr
opert
y_Inv
entor
ies\Ea
st_Cle
velan
d\Res
ults\M
ap_B
ooks
\East_
Cleve
land_
Prec
incts_
Mapb
ook_
2014
0617
.mxd
Occu
pied S
tructu
res
A F
Vaca
nt S
tructu
res (
Secu
re)
A F
Vaca
nt S
tructu
res (
Open
)A F
Surve
y Res
ults
Park
Parki
ng Lo
tVa
cant
Lot
£ ¤6
MANHATTAN AVE
STRATHMOREAVE
TERRACERD
LAKEF
RONT AVE
EDDY RD
BARD
WELL
AVE
6 AVE
EASTHAM AVE
PONTIA
C ST
HART
FORD
RD
CLAI
BORN
E RD
CLAIBORNE HARTFORD CONN
ELDERWOODAVE
ORIN
OCO
AVE
MAYF
AIR
AVE
HOLYOKE AV
E
DOAN AVEVA
N BURENRD
MARLOES
AVE
CHAPMAN AV
E
1 AVE
LEE BLVD
SCIO
TOAV
E
DEBRA ANN LNKNOWLE
S ST
PAGE A
VE
BRYN MAWR RD
2 AVE
WYMORE AVE
3 AVE
MILA
N AVE
4 AVE
SAVA
NNAH
AVE
GRAH
AM R
D
GARD
EN R
D
5 AVE
BEERSF
ORD RD
ELSIN
ORE AVE
ROSEMONT RD
ALLEGHENY AVE
ROXFORD RD
133 ST 133 ST
HAYDEN AVE
131 ST
NORT
HFIE
LD AV
E
2A2E
3A
3B
3C
3D
3E
3F
4D
0.03
00.0
30.0
6 Miles
East
Clev
eland
Prop
erty
Inven
tory
Resu
lts:
Prec
inct 3
B
Prec
incts
Road
s -Cu
yaho
ga C
o.
Map C
reated
7/14
/2014
pb
Wes
tern
Res
erve
La
nd
Co
nse
rvan
cyO
UR
LA
ND
. O
UR
LE
GA
CY
N S
WE
Path:
X:\TC
I_Proj
ects\
Vaca
nt_Pr
opert
y_Inv
entor
ies\Ea
st_Cle
velan
d\Res
ults\M
ap_B
ooks
\East_
Cleve
land_
Prec
incts_
Mapb
ook_
2014
0617
.mxd
Occu
pied S
tructu
res
A F
Vaca
nt S
tructu
res (
Secu
re)
A F
Vaca
nt S
tructu
res (
Open
)A F
Surve
y Res
ults
Park
Parki
ng Lo
tVa
cant
Lot
£ ¤6GL
YNN
RD
FORESTHILLAVE
LAMBERTST
TAYLOR RD
ELDERWOODAVE
EDDY R
D
TERRACE RD
BRUNSWICK RD
SUPERIOR RD
MANHATTANAVE
CHELSEADR
BARDW
ELL
AVE
WALDEN RD
EASTHAM AVE
NEWBURY DR
NORTH
VALEBLVD
3 AVE
BREW
STER
RD
LEE BLVD
BURL
INGT
ONRD
MAYF
AIR
AVE
4 AVE
GARD
EN RD
DOAN AVE
6 AVE
5 AVE
HENL
EYRD
OAKH
ILLRD
VASS
AR ST
MT UNION AVE
VANBUREN
RDMARLO
ES AV
E
FENE
MORE
RD
SCIO
TO AV
E
EAST
WICK
DR
DEBRA ANN LN
HARTSHORN RD
KEW
RD
BRYN
MAWR RD
WYAT
T RD
LAKEF
RONT AVE
GRASM
ERE A
VE
WYMORE AVE
PAGE A
VE
CHAP
MAN AV
E
HOLYOKE A
VE
KNOWLES S
TWINDER
MERE S
TBEL
MORE RD
BEERSF
ORD RD
HAZE
L RD
PRIVATEDR
ELSIN
ORE AVE
ROSEMONT RD
FORE
STHIL
LSBL
VD
HAYDEN AVE
ROXFORDRD
STAN
WOOD RD
CLEV
IDENRD
2C
2D
2E
2F
3A
3B
3C
3E
3F4C
4D
0.055
00.0
550.1
1 Miles
East
Clev
eland
Prop
erty
Inven
tory
Resu
lts:
Prec
inct 3
C
Prec
incts
Road
s -Cu
yaho
ga C
o.
Map C
reated
7/14
/2014
pb
Wes
tern
Res
erve
La
nd
Co
nse
rvan
cyO
UR
LA
ND
. O
UR
LE
GA
CY
N S
WE
Path:
X:\TC
I_Proj
ects\
Vaca
nt_Pr
opert
y_Inv
entor
ies\Ea
st_Cle
velan
d\Res
ults\M
ap_B
ooks
\East_
Cleve
land_
Prec
incts_
Mapb
ook_
2014
0617
.mxd
Occu
pied S
tructu
res
A F
Vaca
nt S
tructu
res (
Secu
re)
A F
Vaca
nt S
tructu
res (
Open
)A F
Surve
y Res
ults
Park
Parki
ng Lo
tVa
cant
Lot
£ ¤6
ELDERWOODAVE
STRA
THMO
RE AV
E
SHAW
AVE
142 ST
GRAH
AM RD
BEAU
MONT
AVE
141 ST
MANHATTAN AVE
ELM
AVE
SCIO
TOAV
ECHAPM
AN AVE
POTO
MAC
AVE
ORIN
OCO
AVE
ELWOOD RD
ARDE
NALL
AVE
143 ST
HAYDEN AVEHAYDEN AVE
HAMPTON RD
ALLEGHENY AVE
NORT
HFIE
LD AV
E
139 ST
SHAWVIEWAVE3B
3D
3E
3F
4A
4C
4C
4D
4F
0.025
00.0
250.0
5 Miles
East
Clev
eland
Prop
erty
Inven
tory
Resu
lts:
Prec
inct 3
D
Prec
incts
Road
s -Cu
yaho
ga C
o.
Map C
reated
7/14
/2014
pb
Wes
tern
Res
erve
La
nd
Co
nse
rvan
cyO
UR
LA
ND
. O
UR
LE
GA
CY
N S
WE
Path:
X:\TC
I_Proj
ects\
Vaca
nt_Pr
opert
y_Inv
entor
ies\Ea
st_Cle
velan
d\Res
ults\M
ap_B
ooks
\East_
Cleve
land_
Prec
incts_
Mapb
ook_
2014
0617
.mxd
Occu
pied S
tructu
res
A F
Vaca
nt S
tructu
res (
Secu
re)
A F
Vaca
nt S
tructu
res (
Open
)A F
Surve
y Res
ults
Park
Parki
ng Lo
tVa
cant
Lot
£ ¤6
SHAW
AVE
LAKEF
RONT AVE
GLYNN
RD
STRA
THMO
RE AV
E
HAYDENAVE
TERRACE RD
6 AVE
BARD
WELL
AVE
EASTHAM AVE
HART
FORD
RD
MANHATTAN AVE
CLAI
BORN
E RD
CLAIBORNE HARTFORD CONN
EDDY
RD
ELDERWOODAVE
PONTIA
C ST
RICHMOND PL
LEE BLVD
MAYF
AIR
AVE
HOLYOKE A
VE
WELTONDR
DOAN AVE
PLYMOUTH PL
VAN BUREN
RD
MARLOES
AVE
1 AVE
SCIO
TOAV
E
PRIVATEDR
DEBRA ANN LN
BRYN MAWR RD
135 ST
134 ST
2 AVE3 A
VE
MILA
N AVE
WINDERMERE ST
4 AVE
STAN
WOOD RD
GRAH
AM R
D
GARD
EN R
D
5 AVE
GRASM
ERE A
VE
WYMORE AVE
PAGE A
VECHAP
MAN AV
E
ARDE
NALL
AVE
KNOWLES STBEE
RSFORD RD
ELSIN
ORE AVE
ROSEMONT RD
ROXFORDRD
ALLEGHENY AVE
133 ST
NORT
HFIE
LD AV
E
131ST2A
2E
2F
3A
3B
3C
3D
3E
3F4C
4D
4F
0.04
00.0
40.0
8 Miles
East
Clev
eland
Prop
erty
Inven
tory
Resu
lts:
Prec
inct 3
EPr
ecinc
ts
Road
s -Cu
yaho
ga C
o.
Map C
reated
7/14
/2014
pb
Wes
tern
Res
erve
La
nd
Co
nse
rvan
cyO
UR
LA
ND
. O
UR
LE
GA
CY
N S
WE
Path:
X:\TC
I_Proj
ects\
Vaca
nt_Pr
opert
y_Inv
entor
ies\Ea
st_Cle
velan
d\Res
ults\M
ap_B
ooks
\East_
Cleve
land_
Prec
incts_
Mapb
ook_
2014
0617
.mxd
Occu
pied S
tructu
res
A F
Vaca
nt S
tructu
res (
Secu
re)
A F
Vaca
nt S
tructu
res (
Open
)A F
Surve
y Res
ults
Park
Parki
ng Lo
tVa
cant
Lot
£ ¤6141ST
SHAW
AVE
BRAC
KLAN
D AV
E
EDMO
NTON
AVE
EDDY RD
ARLIN
GTON
AVE
LAKE
FRON
T AVE
BARD
WELL
AVE
6 AVE
EASTHAM AVE
TH
ORNHILL DR
HART
FORD
RD
MARLOES
AVE
CLAI
BORN
E RD
MANHATTAN AVE
CAR L
YON P
L
CLAIBORNE HARTFORD CONN
HOLYOKE AV
E
BARR
INGT
ONAV
E
133 ST
129 STAU
STIN
AVE
MAYF
AIR
AVE DOAN AVE
CARLYON RD
1 AVE
SCIO
TOAV
E
143 ST
IRVIN
GTON
AVE
ELWOOD RD
BRYN MAWR RD
2 AVE
127 ST
HAMPTON RD
ARDE
NALL
AVE
STRA
THMO
RE AV
E
126 ST
ORIN
OCO
AVE
ELSIN
ORE AVE
IROQ
UOIS
AVE
3 AVE
MILA
N AVE
4 AVE
GRAH
AM R
D
GARD
EN R
D
5 AVE
HAYDEN AVE
128 ST
128 ST
NORT
HFIE
LD AV
E
ALLEGHENY AVE
133 ST133 ST
130 ST
PAXTON RD
131 ST
125 ST
139 ST
135 ST
130 ST
134 ST
2A2E
3A
3B
3D
3E
3F
4A4F
0.04
00.0
40.0
8 Miles
East
Clev
eland
Prop
erty
Inven
tory
Resu
lts:
Prec
inct 3
FPr
ecinc
ts
Road
s -Cu
yaho
ga C
o.
Map C
reated
7/14
/2014
pb
Wes
tern
Res
erve
La
nd
Co
nse
rvan
cyO
UR
LA
ND
. O
UR
LE
GA
CY
N S
WE
Path:
X:\TC
I_Proj
ects\
Vaca
nt_Pr
opert
y_Inv
entor
ies\Ea
st_Cle
velan
d\Res
ults\M
ap_B
ooks
\East_
Cleve
land_
Prec
incts_
Mapb
ook_
2014
0617
.mxd
Occu
pied S
tructu
res
A F
Vaca
nt S
tructu
res (
Secu
re)
A F
Vaca
nt S
tructu
res (
Open
)A F
Surve
y Res
ults
Park
Parki
ng Lo
tVa
cant
Lot

WOOD
WORT
H RD
SHAW
AVE
ELM
AVE
ALDE
R AVE
MANN
AVE
143 ST
STCL
AIRAV
E
142 ST
133 ST
BEAU
MONT
AVE
BALD
WIN
AVE
GAIN
SBOR
O AV
E
137 ST
HAYDEN AVE
134 ST
141 ST
135 ST
133 ST
139 ST
134 ST
135 ST
3D3F
4A
4F
0.02
00.0
20.0
4 Miles
East
Clev
eland
Prop
erty
Inven
tory
Resu
lts:
Prec
inct 4
A
Prec
incts
Road
s -Cu
yaho
ga C
o.
Map C
reated
7/14
/2014
pb
Wes
tern
Res
erve
La
nd
Co
nse
rvan
cyO
UR
LA
ND
. O
UR
LE
GA
CY
N S
WE
Path:
X:\TC
I_Proj
ects\
Vaca
nt_Pr
opert
y_Inv
entor
ies\Ea
st_Cle
velan
d\Res
ults\M
ap_B
ooks
\East_
Cleve
land_
Prec
incts_
Mapb
ook_
2014
0617
.mxd
Occu
pied S
tructu
res
A F
Vaca
nt S
tructu
res (
Secu
re)
A F
Vaca
nt S
tructu
res (
Open
)A F
Surve
y Res
ults
Park
Parki
ng Lo
tVa
cant
Lot

£ ¤6
HILLSB
ORORD
NOBL
E RD
CALEDONIAAVE
TERRACERD
COLONNADE RD
NELAVIEWRD
ENDORARD
ALCOY RD
COIT AVE
IVANHOE RD
BELV
OIR B
LVD
LAMPSON RD
MANNERING RD
HILLSID
E AVE
NOB L
ERD
HELMSDALERD
ELDERWOOD AVE
NELA
CT
N ELA
WOO
DRD
NELA A
VE
RICHMOND PL
WESTBURN AVE
SE
LWYN RD
NELADALERD
NELAMERERD
GRANTHAM RD
URBANA RD
ROSEDALEAV
E
COLLAMER AVE
VICTORIA RD
HALDANE RD
ALTO
N RD
ALLANDALE AVE
HASTINGS A
VE
SHELDON AVE
BURNETTE AVE
CHARLES RD
OCTAVIA RD
WOODVIEW RD
ELOISE DR
GREYTONRD
REYBURN RD
RAVINE DR
HANO
VER
DR
UNNAM
EDST
HILTON RD
TAYL
ORRD
NELACRESTRD
3E
4B
4C
4D4D
4E
4F
0.045
00.0
450.0
9 Miles
East
Clev
eland
Prop
erty
Inven
tory
Resu
lts:
Prec
inct 4
B
Prec
incts
Road
s -Cu
yaho
ga C
o.
Map C
reated
7/14
/2014
pb
Wes
tern
Res
erve
La
nd
Co
nse
rvan
cyO
UR
LA
ND
. O
UR
LE
GA
CY
N S
WE
Path:
X:\TC
I_Proj
ects\
Vaca
nt_Pr
opert
y_Inv
entor
ies\Ea
st_Cle
velan
d\Res
ults\M
ap_B
ooks
\East_
Cleve
land_
Prec
incts_
Mapb
ook_
2014
0617
.mxd
Occu
pied S
tructu
res
A F
Vaca
nt S
tructu
res (
Secu
re)
A F
Vaca
nt S
tructu
res (
Open
)A F
Surve
y Res
ults
Park
Parki
ng Lo
tVa
cant
Lot
£ ¤6
STRAT
HMORE AVE
SHAW
AVEELM
AVE
COIT AVE
BRUN
SWICK
RD
152 ST
NOBLE RD
TERRACE RD
SCIOT
O AVE
MANHATTAN AVE
ELDERWOODAVE
NORTHFIE
LD AV
E
ELDERWOOD AVE
RICHMOND PL
COLLAMER AVE
WELTON DR
POTO
MAC
AVE
PLYMOUTH PL
ROSEDALE
AVE
PAGE A
VE
SAVA
NNAH
AVE
ALDE
R AVE
ORIN
OCO
AVE
CHAP
MAN AV
E
STAN
WOOD RD
ALLANDALE AVE
HASTINGS A
VE
SHELDON AVE
BURNETTE AVE
CHARLES RD
ARDE
NALL
AVE
ELWOOD RD
GRASM
ERE A
VE
TAYL
OR RD
HAMPTON RD
WYMORE A
VE
HANOV
ERDR
SHAWVIEWAVE
3B
3D
3E
4B
4C
4D
4E
4F
0.035
00.0
350.0
7 Miles
East
Clev
eland
Prop
erty
Inven
tory
Resu
lts:
Prec
inct 4
C
Prec
incts
Road
s -Cu
yaho
ga C
o.
Map C
reated
7/14
/2014
pb
Wes
tern
Res
erve
La
nd
Co
nse
rvan
cyO
UR
LA
ND
. O
UR
LE
GA
CY
N S
WE
Path:
X:\TC
I_Proj
ects\
Vaca
nt_Pr
opert
y_Inv
entor
ies\Ea
st_Cle
velan
d\Res
ults\M
ap_B
ooks
\East_
Cleve
land_
Prec
incts_
Mapb
ook_
2014
0617
.mxd
Occu
pied S
tructu
res
A F
Vaca
nt S
tructu
res (
Secu
re)
A F
Vaca
nt S
tructu
res (
Open
)A F
Surve
y Res
ults
Park
Parki
ng Lo
tVa
cant
Lot

£ ¤6
GLYN
N RD
STRAT
HMORE AVE
TERRACERD
NORTHFIE
LD AV
E
MT VERNON BLVD
TAYLOR RDBR
UNSWICK RD
ELDERWOOD AVE
MANHATTAN AVE
LEE BLVD
HENLEYRDBR
EWST
ER R
D
BAYREUTH RD
WELTON DR
OAK HI LL
RD
DRES
DEN RD
MARLOES AV
E
ARDE
NALL
AVE
GRANDVIEW TER
STAN
WOOD RD
SHELDON AVECHARLES RD
GRASM
ERE A
VE
WYMORE AVE
PAGE A
VECHAP
MAN AV
E
HAZE
L RD
PRIVATEDR
ROSEMONT RD
HANO
VER
DR
3A
3B
3C
3D
3E
4C
4D
4E
0.035
00.0
350.0
7 Miles
East
Clev
eland
Prop
erty
Inven
tory
Resu
lts:
Prec
inct 4
D
Prec
incts
Road
s -Cu
yaho
ga C
o.
Map C
reated
7/14
/2014
pb
Wes
tern
Res
erve
La
nd
Co
nse
rvan
cyO
UR
LA
ND
. O
UR
LE
GA
CY
N S
WE
Path:
X:\TC
I_Proj
ects\
Vaca
nt_Pr
opert
y_Inv
entor
ies\Ea
st_Cle
velan
d\Res
ults\M
ap_B
ooks
\East_
Cleve
land_
Prec
incts_
Mapb
ook_
2014
0617
.mxd
Occu
pied S
tructu
res
A F
Vaca
nt S
tructu
res (
Secu
re)
A F
Vaca
nt S
tructu
res (
Open
)A F
Surve
y Res
ults
Park
Parki
ng Lo
tVa
cant
Lot

£ ¤6
NOBL
E RD
HELMSDALERD
NELAVIEWRD
TERRACERD
GREYTONRD
CALEDONIA AVE
TAYLOR RD
NELA
CT
BRUNSWICK RD
NOBL
E RD
WINS
FORD
RD
NELA
WOO
D RD
NELA A
VE
BAYREUTH RD
DEAN
WOOD S
T
NELADALE RD
CHARLES RD
COLLAMER AVE
NELAMERERD
ROSEDALEAV
E
WHITBYRD
ALLANDALE AVE
HASTINGS A
VEBURNETTE AVE
DRESDEN RD
BELV
OIR
BLVD
HANO
VER
DRELOISE DRRAVINE DR
NELACRESTRD
4B
4C
4D
4E
0.035
00.0
350.0
7 Miles
East
Clev
eland
Prop
erty
Inven
tory
Resu
lts:
Prec
inct 4
EPr
ecinc
ts
Road
s -Cu
yaho
ga C
o.
Map C
reated
7/14
/2014
pb
Wes
tern
Res
erve
La
nd
Co
nse
rvan
cyO
UR
LA
ND
. O
UR
LE
GA
CY
N S
WE
Path:
X:\TC
I_Proj
ects\
Vaca
nt_Pr
opert
y_Inv
entor
ies\Ea
st_Cle
velan
d\Res
ults\M
ap_B
ooks
\East_
Cleve
land_
Prec
incts_
Mapb
ook_
2014
0617
.mxd
Occu
pied S
tructu
res
A F
Vaca
nt S
tructu
res (
Secu
re)
A F
Vaca
nt S
tructu
res (
Open
)A F
Surve
y Res
ults
Park
Parki
ng Lo
tVa
cant
Lot

£ ¤6
VELO
URAV
E
STRA
THMO
RE AV
E
WOOD
WORT
H RD
SHAW
AVE
MANHATTAN AVE
NOBL
ERD
ELM
AVE
152 ST
COIT AVE
DOVE
RAV
E
142 ST
ALLEGHENY AVE
BALD
WIN
AVE
ALDE
R AVE
BEAU
MONT
AVE
ELDERWOOD AVE
143 ST
DOVER CT
RICHMOND PL
HASTINGS A
VE
ROSEDALE AVE
WELTON DR
SHELDON AVE
PLYMOUTH PL
144 ST
ELDER
WOODAVE
GLEN
SIDE
RD
ALLANDALE
AVE
ORIN
OCO
AVE
ARDE
NALL
AVE
CHARL
ES
RDCOLLAMER AVE
WEMPLE RD
CAST
ALIA
AVE
ELWOOD RD
COIT RD
HAMPTON RD
145 ST
141 ST
146 ST
TAYL
OR RD
SHAWVIEWAVE
3B
3D3E
4A4B
4C
4E
4F
0.03
00.0
30.0
6 Miles
East
Clev
eland
Prop
erty
Inven
tory
Resu
lts:
Prec
inct 4
FPr
ecinc
ts
Road
s -Cu
yaho
ga C
o.
Map C
reated
7/14
/2014
pb
Wes
tern
Res
erve
La
nd
Co
nse
rvan
cyO
UR
LA
ND
. O
UR
LE
GA
CY
N S
WE
Path:
X:\TC
I_Proj
ects\
Vaca
nt_Pr
opert
y_Inv
entor
ies\Ea
st_Cle
velan
d\Res
ults\M
ap_B
ooks
\East_
Cleve
land_
Prec
incts_
Mapb
ook_
2014
0617
.mxd
Occu
pied S
tructu
res
A F
Vaca
nt S
tructu
res (
Secu
re)
A F
Vaca
nt S
tructu
res (
Open
)A F
Surve
y Res
ults
Park
Parki
ng Lo
tVa
cant
Lot