East Asian Economies and Financial Globalization In the ... · East Asian Economies and Financial...
35
NBER WORKING PAPER SERIES EAST ASIAN ECONOMIES AND FINANCIAL GLOBALIZATION IN THE POST-CRISIS WORLD Joshua Aizenman Hiro Ito Working Paper 22268 http://www.nber.org/papers/w22268 NATIONAL BUREAU OF ECONOMIC RESEARCH 1050 Massachusetts Avenue Cambridge, MA 02138 May 2016 The authors gratefully acknowledge the support provided by ADBI. The views expressed herein are those of the authors and do not necessarily reflect the views of the National Bureau of Economic Research. NBER working papers are circulated for discussion and comment purposes. They have not been peer-reviewed or been subject to the review by the NBER Board of Directors that accompanies official NBER publications. © 2016 by Joshua Aizenman and Hiro Ito. All rights reserved. Short sections of text, not to exceed two paragraphs, may be quoted without explicit permission provided that full credit, including © notice, is given to the source.
Transcript of East Asian Economies and Financial Globalization In the ... · East Asian Economies and Financial...
NBER WORKING PAPER SERIES
EAST ASIAN ECONOMIES AND FINANCIAL GLOBALIZATION IN THE POST-CRISIS WORLD
Joshua AizenmanHiro Ito
Working Paper 22268http://www.nber.org/papers/w22268
NATIONAL BUREAU OF ECONOMIC RESEARCH1050 Massachusetts Avenue
Cambridge, MA 02138May 2016
The authors gratefully acknowledge the support provided by ADBI. The views expressed herein are those of the authors and do not necessarily reflect the views of the National Bureau of Economic Research.
NBER working papers are circulated for discussion and comment purposes. They have not been peer-reviewed or been subject to the review by the NBER Board of Directors that accompanies official NBER publications.
© 2016 by Joshua Aizenman and Hiro Ito. All rights reserved. Short sections of text, not to exceed two paragraphs, may be quoted without explicit permission provided that full credit, including © notice, is given to the source.

East Asian Economies and Financial Globalization In the Post-Crisis World Joshua Aizenman and Hiro ItoNBER Working Paper No. 22268May 2016, Revised September 2016JEL No. F31,F36,F41,O24
ABSTRACT
This paper assesses the East Asian Economies’ openness to cross-border capital flows and exchange rate arrangements in the past decades, with the main focus on emerging market economies. Using Mundell’s trilemma indexes, we note that the convergence of the three policy goals in East Asia toward a “middle ground” pre-dates the convergence of these indices in other regions. Another more recent development involves the high level of international reserve (IR) holdings–a feature that is known as the most distinct characteristic of Asian EMEs. Financial globalization seems to have made asset prices and interest rates in Asian EMEs more vulnerable to global movements of capital, that is, essentially to the monetary policy of the center country, the United-States. We document changing goods trade structure but rather stable reliance on the Dollar in East Asian Economies. That is, the U.S. presence in trade ties with Asian economies has been declining over the last two decades, whereas China’s has been on a rising trend, yet the share of trade among Asian economies with the dollar zone economies has been quite stable. That means that the dominant position of the dollar has been influential in the Asian region. One big dollar-zone economy that has been increasing its presence in Asia is China. However, China has been recently making efforts to “internationalize” its currency, the yuan (RMB). Hence, if China succeeds in its internationalization efforts and creates the RMB zone, the dynamics between the U.S. and Asia will most likely change; it is, however, uncertain to what extent the RMB will become an international currency. Recently, Chinese authorities have become more interventionist because of the slowdown of the economy and financial markets. For now, the Asian region’s international finance continues to be dollar-centric.
Joshua AizenmanEconomics and SIRUSCUniversity ParkLos Angeles, CA 90089-0043and [email protected]
Hiro ItoPortland State University1721 SW Broadway, Suite 241Portland, Oregon [email protected]

2
1. Introduction
The Asian economies are facing their greatest challenge since the East-Asian financial
crisis of 1997–1998. Advanced economies reacted to the 2008 global financial crisis (GFC) by
implementing both conventional and nonconventional monetary measures that led many small
open emerging market economies (EMEs) to experience a rise in capital inflows and thereby
currency appreciation pressure. After the U.S. started scaling down the nonconventional
monetary measures in 2014, some EMEs experienced capital flight. Although most of the Asian
EMEs faced this situation with higher levels of exchange rate flexibility and a much thicker
buffer of international reserves (IR) than they did at the time of the Asian crisis, the fear was also
shared by policy leaders in Asia, who saw flashbacks of the 1990s in which the influx of capital
was followed by the crisis breakout.
Since the time of the Asian crisis, one of the biggest changes in Asian economies’ open
macro policy configurations is that they have become large IR holders, joining Japan, which has
been a long-time major IR holder. In the mid-2000s, China became the largest IR holder and by
of the end of 2015, the country held $3.8 trillion dollars, about 30% of the world’s total (Figure 1
(a)). Among the top 10 largest IR holders, five are East Asian economies whose amount accounts
for 49% of the worlds’ total IR (Figure 1 (b)).1
While many motives have been identified to explain EMEs’ IR hoarding, precautionary
motive and exchange rate stability are often pointed to as major factors for Asian EMEs (e.g.,
Aizenman and Lee, 2007). By observing the severity of the currency crisis as well as the
stringency of the International Monetary Fund’s conditionality for rescue loans, many economies
in the region have found it better to accumulate IR on their own while maintaining intermediate
levels of exchange rate stability. However, ironically, it has also been argued that massive IR
holdings by EMEs have contributed to financing profligate—such as the U.S. economy—with
accessibility to liquidity that eventually led to the bubble and its bust. Furthermore, increased
dollar liquidity made EMEs more vulnerable to U.S. policy changes, thus making it appear as
though economies are subject to “global financial cycles” (Rey, 2013). Thus, in the post-GFC
period, Asian EMEs are facing a difficult challenge in international macroeconomics, which can
1 They are China, Japan, Korea, Hong Kong, and Singapore. Additionally, India is ranked as the ninth largest IR
holder.
3
be observed by examining the patterns of capital flows and exchange rate arrangements
pertaining to Asian EMEs.
This paper looks into the policy configuration of Asian economies, especially Asian
EMEs, from the perspective of open macro policies. In particular, we focus on both the
arrangements of exchange rate regimes and cross-border capital flows. In Section 2, we first
review the open macro policy arrangements in the context of the famous “trilemma” hypothesis.
In Section 3, we examine whether and to what extent Asian economies are vulnerable to shocks
arising from advanced economies, namely the U.S. In Section 4, we show the risks to which
Asian economies are exposed that involve the dollar as a key currency, and trade with the U.S.
We make concluding remarks in Section 5.
2. Review of the Open Macro Policies Among Asian EMEs in the Context of the Trilemma
In the process of managing open macroeconomic policies, policy makers cannot avoid
confronting the “impossible trinity,” or the “trilemma”—Mundell’s hypothesis that states that a
country may simultaneously choose any two, but not all, of the three goals of monetary
independence, exchange rate stability, and financial integration. Hence, we evaluate the
macroeconomic conditions and policies in the Asian region through the lens of this hypothesis.
The trilemma hypothesis can be explained using Figure 2, in which each of the three
sides of the triangle—representing monetary independence, exchange rate stability, and financial
integration—depicts a potentially desirable goal. Although policy makers can implement a mix
of the three either within the triangle, or on one of the three vertexes or sides, it is impossible to
be on all three sides of the triangle simultaneously. The left vertex depicts a policy combination
of full monetary policy autonomy and full exchange rate stability, for example, but not financial
integration. This combination was taken by China before it started a series of liberalization
policies in the 1980s or by Bretton Woods member countries before the system’s collapse in the
early 1970s. The right vertex represents a policy taken by members of a monetary union (e.g., the
European Exchange Rate Mechanism), economies that adopts a currency board (e.g., Hong Kong,
Argentina before 2002), and any countries that peg their currencies to hard currencies. The
economies at this vertex enjoy free access to international financial markets and full exchange
rate stability, but they would have to give up monetary policy autonomy. The top vertex

4
illustrates a floating exchange rate regime, associated with full monetary independence and full
financial openness, as is the case with Canada, Japan, and other flexible exchange rate countries.2
Each of the three policy goals has singular merits and shortcomings. With greater
monetary autonomy, policy makers could stabilize the economy independently from other
economies’ macroeconomic management. However, full monetary independence could allow
policy makers to manipulate output movement (at least in the short run), thus potentially causing
output or inflation instability.3
Exchange rate stability could reduce the volatility of domestic prices and therefore foster
investment and international trade by mitigating uncertainty. However, it could also rid policy
makers of the option of using exchange rate as a tool to absorb external shocks. Thus, pursuing
exchange rate stability could potentially leave an economy more prone to boom-and-bust cycles
and misallocation of resources.
Financial liberalization may enhance economic growth by allocating resources more
efficiently, mitigating information asymmetry, enhancing and/or supplementing domestic
savings, and helping to transfer technological or managerial know-how. Also, economies with
greater access to international capital markets should be better able to stabilize through risk
sharing and portfolio diversification. However, financial openness could expose economies to
volatile cross-border capital flows that often results in sudden stops or reversal of capital flows,
thereby making economies vulnerable to boom-and-bust cycles (Kaminsky and Schmukler,
2008).
Thus, theory and empirical evidence tell us that each one of the three trilemma policy
choices can be a double-edged sword.4 To make matters more complicated, the effect of each
policy choice can differ depending on how it is paired with other policies. For example, although
exchange rate stability can be more destabilizing if paired with financial openness, it can be
stabilizing if paired with greater monetary autonomy. In reality, however, it is more of a rare
2 See Aizenman, et al. (2010, 2011, 2013, 2015), Aizenman and Ito (2013), Klein and Shambaugh (2015), Obstfeld
(2014), Obstfeld, et al. (2005), and Shambaugh (2004) for further discussion and references dealing with the
trilemma. 3 Monetary authorities could also abuse their autonomy to monetize fiscal debt, and therefore end up destabilizing
the economy through high and volatile inflation. 4 For monetary independence, refer to Obstfeld, et al. (2005), Shambaugh (2004), and Frankel et al. (2004). On the
impact of the exchange rate regime, refer to Ghosh et al. (1997), Levy-Yeyati and Sturzenegger (2003), and
Eichengreen and Leblang (2003). The empirical literature on the effect of financial liberalization is surveyed by
Henry (2007), Kose et al. (2009), and Prasad et al. (2003).

5
case when a country faces the stark polarized binary choices often envisioned by the trilemma
triangle. As we see in emerging Asia, countries often mix all three policy choices at intermediate
levels—i.e., choosing a policy mix that can be depicted as somewhere inside the triangle.5
Now, where do Asian economies stand in the context of the trilemma?
To answer this question, we use a set of the “trilemma indexes” developed by Aizenman
et al. (2008) that measure the degree to which each of the three policy choices is implemented by
economies for more than 180 economies from 1970 through 2014. The monetary independence
index (MI) is based on the correlation of a country’s interest rates with the base country’s interest
rate. The index for exchange rate stability (ERS) is an invert of exchange rate volatility, that is,
standard deviations of the monthly rate of depreciation for the exchange rate between the home
and base economies. The degree of financial integration is measured with the Chinn-Ito (2006,
2008) capital controls index (KAOPEN).6
Figure 3 shows the trajectories of the trilemma indexes for different income-country
groups. For the industrialized economies, financial openness accelerated in the 1990s while, at
the same time, the extent of monetary independence started to decline and exchange rate stability
began to rise significantly. All of these trends reflect the introduction of the euro in 1999.
Developing economies do not present such a distinct divergence of the indexes, though their
experiences differ depending on whether they are emerging or non-emerging market economies.7
For EMEs, exchange rate stability declined rapidly from the 1970s through the mid-1980s. After
some retrenchment around the early 1980s, financial openness started rising from 1990 onwards,
though it started to decline again at the end of the 2000s. These trends are not discernable among
the non-EME developing economies.
Interestingly, for the EMEs, the indexes suggest a convergence toward the middle ground.
In other words, these economies may have been maintaining moderate levels for all of the three
indices. This policy trend coincides with the period of time in which some of these economies
began accumulating sizable IR to potentially buffer the trade-off arising from the trilemma.
5 The bottom line is, as Mundell (1963) argued, that the extent of achievement of the three policy choices must be
linearly related to each other. In other words, if there are measures representing the levels of attainment in the three
policy choices, such measures must add up to a constant. This has been empirically proved by Aizenman et al. (2012)
and Ito and Kawai (2012). 6 More details on the construction of the indexes can be found in Aizenman et al. (2008, 2010, 2011), and the
indexes are available at http://web.pdx.edu/~ito/trilemma_indexes.htm . 7 The emerging market economies are defined as the economies classified as either emerging or frontier during
1980–1997 by the International Financial Corporation.

6
While this is not observed among non-EME developing countries (Figure 2 (c)), Asian
emerging markets stand out from other geographical groups of economies in that these
economies have had this sort of convergence for almost the entire sample period (Figure 4 (a)). 8
However, with the exception of the Asian crisis years of 1997–1998, exchange rate stability
seems to have been the most pervasive policy choice for most of the time. Although the indexes
diverged in the 2000s post-crisis years, they have converged again in recent years. This
characterization does not apply to non-EME economies (Panel (b)) or Latin America (Panel (c)).
For non-EME economies in Asia, convergence in the trilemma configurations occurs in the later
part of the sample period. Among non-Asian developing economies, exchange rate stability is
distinctly the first priority throughout the sample period and middle-ground convergence has not
occurred at all.
We now add the role of IR holding to the three-trilemma dimensions to shed further light
on the open macro configuration, especially for the Asian region. As we have seen, since the
Asian crisis of 1997–1998, EMEs, especially those in East Asia and the Middle East, have been
rapidly increasing their amounts of IR holding. Researchers have tried to identify the causes for
rapid IR accumulation among EMEs, especially those in Asia. Aizenman and Lee (2007) provide
evidence that countries hold IR for both precautionary and exchange rate stability motives.
Many researchers have argued the benefits of self-insurance against the volatility associated with
financial globalization (Aizenman and Marion, 2003; Cheung and Ito, 2008, 2009). As a series of
crises experienced in emerging markets in the late 1990s and early 2000s led to reserve hoarding
by China and other EMEs in the 2000s, new factors have been added to the list of determinants
of IR hoarding, including mercantilist motives (Aizenman and Lee, 2007), regional competitive
incentives (“keeping up with the Joneses,” Cheung and Qian, 2009), and self-insurance against
local residents’ flight from domestic assets in the trilemma context (Obstfeld, et al., 2010;
Aizenman, et al., 2011, Aizenman, et al., 2015).
One might argue that economies accumulate massive IR to achieve a certain combination
of exchange rate stability, monetary policy autonomy, and financial openness. For example, a
country pursuing a stable exchange rate and monetary autonomy may try to liberalize cross-
border financial transactions while simultaneously deciding not to give up current levels of
8 The sample of “Asian Emerging Market Economies” include China, Hong Kong, Indonesia, Rep. of Korea,
Malaysia, Philippines, Singapore, Thailand, and Vietnam.

7
exchange rate stability and monetary autonomy. This sort of policy combination, however, could
lead the monetary authorities to hold a sizeable amount of IR so that they can stabilize the
exchange rate movement while retaining monetary autonomy.9
The “diamond charts” in Figure 5 trace the changing patterns of the trilemma
configurations while incorporating IR holding. In each “diamond,” four vertices measure
monetary independence, exchange rate stability, IR/GDP ratio, and financial integration with the
origin normalized so as to represent zero monetary independence, pure float, zero international
reserves, and financial autarky. We present the diamond charts for the original 12 euro countries,
emerging Asian economies, China, and Latin American economies.
In Figure 5, we see that again Asian emerging economies have not experienced the
divergence of the trilemma configurations over the years as has happened for industrial
economies, especially for the euro member countries—that is, a move toward deeper financial
integration, greater exchange-rate stability, and weaker monetary independence (Figure 5 (a)).
Asian EMEs are distinct from the other groups of economies in having a middle-ground
convergence of trilemma policy convergence; the three indexes have been clustered around the
middle range. Interestingly, however, in recent years, both the extent of monetary independence
and the level of IR holding has risen while financial openness and exchange rate stability have
been inching down. Also, while the extent of monetary independence has been cyclically
changing over years, the levels of IR holding has been steadily increasing, making one suspect
the potential implications of such holdings on trilemma policy choices and macroeconomic
performances. These characterizations are not applicable to Latin American economies (and
other country groups though not reported).
3 Vulnerability to the Center
3.1 Connectivity with the Center Economies
Recently, a number of researchers have argued that financial globalization has made
domestic asset prices and interest rates more vulnerable to developments in capital markets
abroad. The most representative work of this view is the paper by Rey (2013), who argues that
financial globalization has made countries’ macroeconomic conditions more sensitive to the
9 Aizenman, et al. (2010, 2011) show the macroeconomic impact of trilemma policy configurations can depend upon
the level of IR holding.
8
“global financial cycle” in capital flows, asset prices, and credit growth. In the markets where
capital is freely mobile, Rey continues, the center country’s monetary policy influences other
countries’ national monetary policies through capital flows, credit growth, and bank leverages,
thus determining the global financial cycle.
Let us see if global shocks or monetary shocks of the center country—i.e., the U.S.—
affect the ebb and flow of cross-border capital movements, especially in small open economies.
Figure 7 displays the development of the VIX index that measures the implied volatility of S&P
500 Index options as well as the development of net capital flows to EMEs. The VIX index is a
measure of uncertainty or risk aversion of the markets, thus its scale (on the right-hand side) is
reversed so to be seen as a measure of investor risk appetite. From the figure, we can see that the
volumes of capital flows to EMEs tend to rise when the risk appetite is higher. We can also see
that prior to the 2008 GFC, a large volume of capital flowed into emerging markets, though this
was followed by massive capital outflows once the crisis broke out. However, the capital flow
became reversed with massive capital flowing back to EMEs again once advanced economies
implemented zero, or extremely low, interest policies to fight recessionary situations.
This generalization applies well to the group of Asian EMEs in terms of ebb-and-flow
volumes and patterns. Although Latin American EMEs also experienced an influx of capital in
the post-GFC period, not as much capital flowed to these economies before the crisis. In contrast,
Eastern or Central European EMEs experienced massive capital inflows before the crisis, but
capital inflows did not resume to the pre-crisis level in the post-crisis period. Furthermore, both
the full EME sample and the subsample of Asian EMEs show massive capital outflows once the
U.S. started downsizing its unconventional monetary policy in 2014.
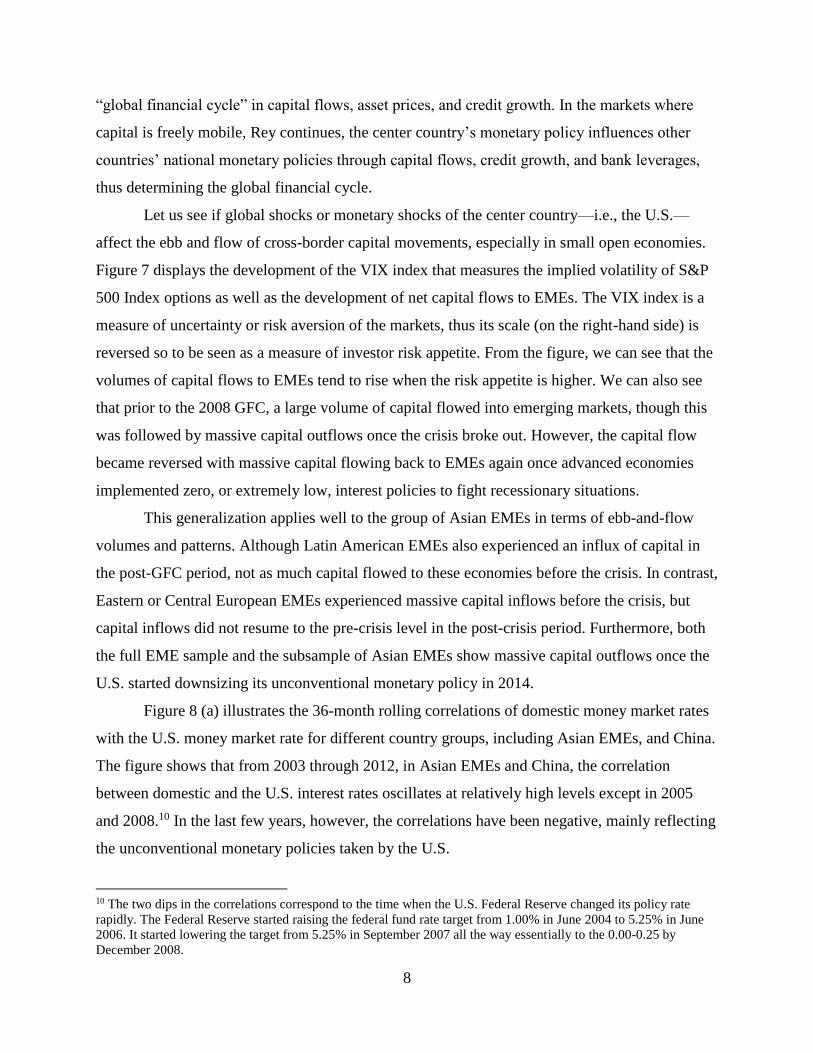
Figure 8 (a) illustrates the 36-month rolling correlations of domestic money market rates
with the U.S. money market rate for different country groups, including Asian EMEs, and China.
The figure shows that from 2003 through 2012, in Asian EMEs and China, the correlation
between domestic and the U.S. interest rates oscillates at relatively high levels except in 2005
and 2008.10 In the last few years, however, the correlations have been negative, mainly reflecting
the unconventional monetary policies taken by the U.S.
10 The two dips in the correlations correspond to the time when the U.S. Federal Reserve changed its policy rate
rapidly. The Federal Reserve started raising the federal fund rate target from 1.00% in June 2004 to 5.25% in June
2006. It started lowering the target from 5.25% in September 2007 all the way essentially to the 0.00-0.25 by
December 2008.

9
Figure 8 (b) recreates the long-term interest rates. The long-term interest rates of the
Asian EMEs are highly correlated with that of the U.S. for much of the last decade and a half.
Since 2005, the correlation has been on a rising trend despite the GFC and the rapid decline in
the correlations of the short-term interest rates we saw in Panel (a). In the late few years of the
sample period, short- and long-term interest rates have been decoupled, which may suggest that
policy makers find it difficult to control macroeconomic and financial conditions through
maneuvering short-term interest rates.
Figure 8 (c) illustrates the correlations of stock market price indexes with the U.S. index
for the same subsamples and China. Since the early 2000s up until 2012 or so, all of the country
groups had maintained high levels of correlations of stock market price indexes with the U.S.
stock market. Since the GFC, the correlation has been declining for all of the groups, but only to
a lesser extent for emerging Asian economies.
3.2 Does Asia Continue to be Vulnerable as It Was in the 1990s?
In the aftermath of the EME crises in the late 1990s and the early 2000s, many of the
EMEs, whether they experienced the crisis or not, started rapidly increasing their IR holdings.
However, ironically, this active IR accumulation, in retrospect, sowed the seeds for the world
economy to provide ample liquidity for advanced and profligate economies that eventually led to
those economies’ bubbles and bust in the late 2000s. In other words, it was a self-fulfilling
prophecy that EMEs’ efforts to hold IR to ensure self-insurance or protection ended up creating
an environment for which these economies needed insurance or protection.
Asian EMEs are expected to continue to face challenges from increasing connectivity
because, although they are already exposed to risks from the center economies, they are still on
their way to further financial opening. The panels of Figure 9 compare the developments of
financial openness in terms of both de jure (Panel (a)) and de facto (Panel (b)) measures among
the groups of (ex-China) emerging market economies in East Asia, Latin America, and Eastern
and Central Europe along with Japan and China.11 The figure shows that by international
comparison, financial openness has progressed only moderately over the years for Asian EMEs,
11 The de jure measure is the Chinn-Ito index (2006, 2008). The de facto measure is created by normalizing the sum
of external assets and liabilities, from the database compiled by Lane and Milesi-Ferretti (2006, 2007, and updates),
by GDP. For comparison of different types of indexes that measure the extent of financial market openness or
capital controls, refer to Quinn et al. (2011).

10
which is somewhat surprising given their high degree of trade openness and susceptibility to U.S.
shocks. Clearly, there is still much room for further financial openings for Asian EMEs,
including China.
Chinn and Ito (2006) and Aizenman and Noy (2009) show that trade openness is a
prerequisite for capital account liberalization. As in the European region where most of the
economies are highly open to international trade, Asian economies can be expected to become
even more open toward financial asset trade.
Additionally, many of the economies in the region, namely Japan, China, and Korea,
have been experiencing, or are expected to experience, a rapidly aging population and a
shrinkage of labor population. These types of demographic changes will probably make these
economies become capital importers and therefore necessitate the further development of
domestic financial markets. Considering that domestic financial development happens hand-in-
hand with financial liberalization, the Asian economies can become more open to cross-border
financial transactions.
Borensztein and Loungani (2011) show that Asian economies are considerably integrated
with major economies outside rather than inside their regions. Hence, intra-Asia trade of
financial assets is also expected to expand, which is another potential for further financial
openings by the economies in the region.
With this undeniable trend for further financial openings, the trilemma hypothesis
suggests that economies in the region will have to decide whether to retain monetary autonomy
but give up pursuing exchange rate stability, or to pursue exchange rate stability but subject their
monetary policies to those of the center economies. Either way, these economies will become
more exposed to external shocks.
Now, the question is, are the economies in the Asian region facing a situation that is
vulnerable to external shocks as they were before the Asian financial crisis of 1997–1998?
Figure 10 can help us answer this question as it presents the development of the key economic
variables that illustrate different aspects of vulnerability, namely, (a) the index for exchange rate
stability; (b) IR holding as a share of GDP; (c) international debt securities as a ratio to gross
national income (GNI); (d) short-term liability to foreign banks as a ratio to GNI; (e) “credit gap”

11
as a measure of credit excesses or “credit booms”; and (f) the exchange market pressure (EMP)
index.12
We note several interesting observations. First, all of the economies in the region, with
the exception of China, are now pursuing higher levels of exchange rate flexibility unlike the
time right before the breakout of the Asian crisis. In particular, Korea, Indonesia, and Thailand,
all of which experienced currency crises in 1997–1998, aborted pegged exchange rate policies.
Thus, major Asian EMEs, except for China, are not constrained by exchange rate rigidities at this
moment. Second, mainly because of the harsh experience of the crisis economies in the 1990s,
all of the economies shown in Figure 10 (b), with the exception of Indonesia, increased their
levels of IR holdings. Apparently, these economies believe that holding IR will provide a buffer
to external financial shocks.
Third, many major Asian economies experienced a rapid increase in external debt around
the end of the 1990s, but the debt level of these economies is lower at present. The only
exception is Korea. Panel (c) illustrates that the size of outstanding international debt securities
for the Philippines and Malaysia was almost as high as 25% of their GNI in the late 1990s, but it
is now around 13–14%. The size of short-term liability to foreign banks (as a share of GNI) was
almost 30% of GNI for Thailand and Indonesia at that time, but it is now as low as 7–8% (Panel
(d)). The only concern is Korea. Both outstanding international debt securities and short-term
liability to foreign banks declined in most of the 2000s. However, they went up at the end of the
2000s, hovering around the same level as during the Asian crisis period.
Last, Asian economies are not facing both internal and external pressure in the financial
sector. Panel (e) of Figure 10 illustrates the development of “credit gap” or “credit excesses,”
which is the deviation of private credit creation from its long-term trend. When the gap is in
positive territory, we can think of that as a sign of overheating in the financial sector. Although
we observed an influx of capital once advanced economies implemented zero, or extremely low,
12 For exchange rate stability, we use the index from the trilemma indexes (Aizenman, et al. 2008, 2010, and
updates). The index ranges between zero and one, with its higher value indicating more exchange rate stability. The
data for international debt securities are extracted from the Bank for International Settlements (BIS) website. The
data for short-term liability to banks are from the Joint External Debt Hub (JEDH). We define “credit gap” as the
gap between private credit creation (as a share of GDP) and its long-term trend measured by HP-filtered series. The
EMP index is constructed following the oft-used methodology introduced by Eichengreen et al. (1995, 1996), that is
as a weighted average of monthly changes in the nominal exchange rate (i.e., the rate of depreciation), the
international reserve loss in percentage, and the change in the nominal interest rate with all in respect to the base
country in the sense Aizenman, et al. (2013) do to construct the trilemma indexes. The weights are inversely related
to each country’s variances of each of the changes in the three components.

12
interest rate policies in the aftermath of the GFC, we do not observe large-scale positive credit
gaps in the 2010s. Around the same time period, the EMP index, a proxy for stress levels in the
foreign exchange market, does not appear high, except in Malaysia. Exchange rate flexibility
seems to be absorbing stress in the foreign exchange market. Hence, major Asian economies are
not exposed to high levels of internal or external financial pressure.
4 Exposure to the Dollar
Although we have shown that major Asian economies are not vulnerable to financial
shocks internally or externally, it does not mean these economies are not exposed to financial
risks outside their economies. We have observed that while the level of financial openness of
Asian economies is not the fullest, capital flows into and out of the region have been
significantly affected by the global economic climate. As the wind-down of unconventional
monetary policy by the U.S. has changed the direction and volumes of capital flows for many
EMEs, especially those in Asia. Furthermore, until China replaced its role, the U.S. had been the
largest trading partner for many of the economies in the region. Thus, the U.S. influence has
been dominant, which is also true for bigger economies such as Japan, China, and Korea.
More strictly speaking, however, it is not (just) the U.S. that has so much significant
influence on the economies in the region, it is the dollar that has been overwhelmingly important
for these economies. Since the beginning of the new millennium, there have been webs of
extensive and intensive supply chain networks in the Asian region. Most of these networks are
aimed at the U.S. as the final export destination. That is reflected as high levels of reliance on the
dollar as a trade invoicing or settlement currency. In Korea, Thailand, and Indonesia, for which
longer time series are available, 80% or more of the countries’ exports are invoiced or settled in
the dollar. Even in Korea, the largest economy after China and Japan in the region, the dollar
share is about 85%. Japan has half of its exports invoiced in the dollar despite its long-time
efforts to make its currency, the yen, one of the major international currencies.13
13 India, another economic giant in the greater Asian region, has more than 88% of its exports invoiced in the dollar.
China discloses information only on the share of RMB settlement in total trade (which is around 20% in 2014).
However, it has been speculated that more than 95% of China-U.S. trade is denominated in the dollar. This casts a
stark contrast with intra-regional trade in Europe where the presence of the dollar is smaller and the euro, the
domestic currency for the euro member countries, plays a much bigger role. For comparison, refer to Ito and Kawai
(2016).

13
The high reliance on the dollar for trade invoicing or settlement is also reflected in the
weight of the currencies included in the implicit currency basket on which policy makers base
their exchange rate or monetary policy decisions. Using the methodology popularized by Frankel
and Wei (1996), we estimate the weights of the dollar, the euro (or the German deutsche mark
and the French franc before the introduction of the euro in 1999), the yen, and the British sterling
with a rolling window of 36 months.14 Figure 11(b) illustrates the development of the estimated
dollar weights for the major EMEs in Asia. In the figure, we can see that, with the exception of
Korea and Malaysia in recent years, Asian EMEs have had high weights in their implicit
currency baskets. In other words, these economies can be categorized as economies in the “dollar
zone” to which the monetary and financial conditions of the dollar matter the most. For such
economies, higher dollar weights facilitate dollar invoicing, though causality can go the other
way around.
Another dimension that can be added is that these economies are also reliant on the dollar
to issue international debt securities. According to Figure 11(c), which shows the shares of
dollar-denominated international debt securities for Asian EMEs, in all of the major Asian EMEs,
with the exception of China, the dollar share as the currency for debt denomination is high,
greater than 75%.15 In other words, the “original sin” phenomenon—developing countries often
cannot issue debt in international markets unless they issue debt in a major hard currency such as
the dollar—is applicable to Asian emerging markets. Interestingly, although currency mismatch
was one of the biggest problems faced by the economies that experienced the currency crisis in
1997–1998, the extent of the reliance on the dollar for debt issuance has not changed much since
the late 1990s.16
Despite this constant reliance, Figure 12 (a) shows that the share of the U.S. as an export
destination has been in a declining trend for most of the major Asian emerging market
economies (with the notable except of Vietnam whose trade with the U.S. dramatically increased
14 The basic assumption of this exercise is that monetary authorities use an implicit basket of currencies as the
portfolio of official foreign exchange reserves, but that the extent of response to the change in the value of the entire
basket should vary over time and across countries. If the authorities want to maintain a certain level of exchange rate
stability, whether against a single currency or a basket of several currencies, they should allow the currency value to
adjust only in accordance with the change in the entire value of the basket of major currencies. 15 The volume of international debt securities China issues is small, however. 16 “Currency mismatch” means that borrowing in a hard currency (e.g., the dollar) and investing domestically with
the domestic currency can create liquidity shortage, making it harder to repay the debt when the domestic currency
depreciate sharply against the hard currency.

14
after a trade relationship with the U.S. was normalized in 2001). In contrast, and not surprisingly,
the share of China as an export destination has been a rising trend. Again, this does not mean that
the U.S. is becoming less influential on Asian economies; it is the dollar that continues to have
great influence on the economies in the Asian region.
We can interpret the estimated weights of the four major currencies in the currency
basket that we estimated previously as the extent of belonging to each of the four currency
zones.17 Using the four currency weights as well as the data on the volume of trade with each of
the four currency issuers, we can estimate the share of trade (i.e., exports plus imports) for each
of the four currency zones.18
Figure 12 (c) illustrates the shares of trade with the economies that belong to the dollar
zone for Japan and Asian EMEs. Interestingly, for most of the economies, the share of trade with
the dollar-zone economies has been quite stable over time, ranging from 50% to 70% across
countries. The share of dollar-zone trade for Japan has been quite high, ranging from 62% to
almost 80%, though the country is an issuer of one of the four major currencies. Although we
have seen that Asian EMEs have managed to achieve intermediate levels of exchange rate
stability, we can now see that they have maintained stable ties with the dollar. While many Asian
economies are experiencing a declining share of trade with the U.S., the figure shows that the
dollar continues to be influential for the economies in the region. This is probably the reason
why Asian EMEs are susceptible to shocks arising in the U.S. financial markets even though
their levels of financial openness are still intermediate.
The continuing importance of the dollar is partly driven by the fact that China is quite a
dollar-oriented economy. We saw in Figures 12 (a) and (b) that China’s increasing presence as a
trading partner for Asian economies has replaced some of the U.S. presence. Thus, if China
succeeded in “internationalizing” its currency yuan (RMB) and forming its own currency zone,
the picture in Figure 12 (c) would change significantly.
Now that China has replaced the U.S. as the largest trading partner in the Asian region,
will it also succeed the U.S. as the issuer of the most dominant currency in the region?
17 Before the introduction of the euro in 1999, we combine the estimated weights for the German deutsche mark and
the French franc and treat it as the euro weight. Hence, we have four currency zones: the dollar, euro, yen, and
pound zones. 18 To calculate the share of trade with the ‘euro’ currency zone before 1999, we use the volume of trade with the 12
original euro countries.

15
The rising Chinese income level and the country’s role as a major global trading country
will help the RMB to become more widely used as an international currency.19 However, two
uncertainties warrant attention regarding the future of the RMB as a dominant, key international
currency.
First, it is uncertain whether China will proceed with a smooth financial liberalization and
deregulation, although economists agree that financial development and liberalization are
necessary conditions for a currency to become a major international currency (Ito and Chinn,
2015; Ito and Kawai, 2016). The fact that the Chinese economy started slowing down in 2014
has made policy makers in Beijing more cautious about further liberalization. Further, the slump
of China’s financial markets, following the economic slowdown, has led Chinese financial
authorities to become more active to intervene in financial markets. The future of the
liberalization efforts is not yet known.
Second, as we have seen, countries that belong to the dollar block surround China. Ito
and Kawai (2016) find that the extent to which a country belongs to one of the major currency
zones affects its decision to use that currency for trade invoicing. This explains why the Japanese
yen has not been used as a trade invoicing currency not just by Japan but also by neighboring
economies: almost all of Japan’s neighboring countries belong to the dollar zone.20 China will
face the same challenge. The number of China’s neighboring Asian countries that will break
away from the dollar block and start using the RMB for international trade and financial activity
is an important key to the RMB’s further internationalization.
Ito and McCauley (2016) show that capital flows to the dollar zone would change if
China becomes less of a dollar-zone country. Hence, the map of capital flows and exchange rate
arrangements in Asia could very much depend on how much RMB internationalization proceeds.
For now, the Asian region’s international finance continues to be dollar-centric.
5 Concluding Remarks
The economies in Asia are facing the greatest challenge since the Asian financial crisis of
1997–1998. In this paper, we reviewed and assessed the economies’ openness to cross-border
19 For more details on the issue of RMB internationalization, refer to Eichengreen and Kawai (2015), Frankel (2011),
Ito (2011), and Ito and Kawai (2016). 20 As of 2014, the share of Japan’s exports invoiced in the yen is less than 40%, while that of exports in U.S. dollars
is more than 50%. In imports, these shares are 20% and 75%, respectively. See Ito and Kawai (2016).

16
capital flows and exchange rate arrangements in the region, with the main focus on emerging
market economies.
We first evaluated the situation of openness to capital flow and exchange rate regimes
from the perspective of the famous “trilemma” hypothesis. Using the “trilemma indexes”
developed by Aizenman et al. (2008, 2010, 2011), we trace changing patterns of the trilemma
configurations among economies and observe distinct differences between advanced economies,
developing countries, and emerging markets. We find convergence of the three policy goals
toward a “middle ground”—many emerging markets manage exchange rate flexibility while
maintaining medium levels of monetary independence and financial integration. Interestingly, for
Asian EMEs, not only does this characterization apply to them, but also convergence is not a
recent phenomenon in these economies. As early as the 1980s, the three indexes have been
clustered around the middle range, though exchange rate stability has been the most pervasive
policy choice. Another more recent development involves the high level of international reserve
(IR) holdings–a feature that is known as the most distinct characteristic of Asian EMEs.
Furthermore, financial globalization seems to have made asset prices and interest rates in
Asian EMEs more vulnerable to global movements of capital, that is, essentially to the monetary
policy of the center country, the United-States. The level of risk appetite and U.S. monetary
policy influences the capital flowing into and out of Asian EMEs.
The U.S. presence in trade ties with Asian economies has been declining over the last two
decades, whereas China’s has been on a rising trend. However, we found that the share of trade
among Asian economies with the dollar zone economies has been quite stable. That means that it
the dominant position of the dollar that has been influential in the Asian region. One big dollar-
zone economy that has been increasing its presence in Asia is China. However, China has been
making efforts to “internationalize” its currency, the yuan. Hence, if China succeeds in its
internationalization efforts and creates the RMB zone, the dynamics between the U.S. and Asia
will most likely change; it is, however, uncertain to what extent the RMB will become an
international currency. Recently, Chinese authorities have become more interventionist because
of the slowdown of the economy and financial markets. For now, the Asian region’s international
finance continues to be dollar-centric.

17

18
References:
Aizenman, Joshua. 2013. “The impossible Trinity – from the Policy Trilemma to the Policy
Quadrilemma,” Global Journal of Economics, 2013, 02:01.
Aizenman, Joshua, Yin-Wong Cheung, and Hiro Ito. 2015. “International Reserves Before and
After the Global Crisis: Is There No End to Hoarding?” Journal of International Money
and Finance Volume 52 (April 2015), Pages 102–126.
Aizenman, Joshua, Menzie D. Chinn, and Hiro Ito. 2015. “Monetary Policy Spillovers and the
Trilemma in the New Normal: Periphery Country Sensitivity to Core Country Conditions,”
NBER Working Paper #21128 (May 2015).
Aizenman, Joshua, Menzie D. Chinn, and Hiro Ito. 2013. Review of International Economics,
21(3), 447–458 (August).
Aizenman, Joshua, Menzie D. Chinn, and Hiro Ito. 2011. “Surfing the Waves of Globalization:
Asia and Financial Globalization in the Context of the Trilemma,” Journal of the
Japanese and International Economies, vol. 25(3), p. 290 – 320 (September).
Aizenman, Joshua, Menzie D. Chinn, and Hiro Ito. 2010. “The Emerging Global Financial
Architecture: Tracing and Evaluating New Patterns of the Trilemma Configuration,”
Journal of International Money and Finance 29 (2010) 615–641.
Aizenman, J., M.D. Chinn, and H. Ito. 2008. “Assessing the Emerging Global Financial
Architecture: Measuring the Trilemma's Configurations over Time.” National Bureau of
Economic Research (NBER) Working Paper Series #14533.
Aizenman, J. and Lee, J. 2007. “International Reserves: Precautionary versus Mercantilist Views,
Theory and Evidence,” Open Economies Review, 2007, 18 (2), pp. 191-214.
Aizenman, J. and N. Marion. 2003. “The High demand for International Reserves in the Far East:
What’s Going On?” Journal of the Japanese and International Economies, 17, 370-400.
Aizenman, J. and I. Noy. 2009. “Endogenous financial openness: efficiency and political
economy considerations,” Review of Development Economics, vol. 13(2), pp. 175-189, 05.
Aizenman, Joshua and Hiro Ito. 2013. Forthcoming in the Journal of International Money and
Finance. Also available as NBER Working Paper #19448 (September 2013).
Borensztein, E. and P. Loungani. 2011. “Asian Financial Integration: Trends and Interruptions,
IMF Working Paper WP/11/4. Washington, D.C.: International Monetary Fund.

19
Cheung, Yin-Wong and Hiro Ito. 2009. “Cross-sectional analysis on the determinants of
international reserves accumulation.” International Economic Journal, Vol. 23, No. 4, p.
447-481. December 2009).
Cheung, Yin-Wong and Hiro Ito. 2008. “Hoarding of International Reserves: A Comparison of
the Asian and Latin American Experiences,” In Ramkishen S. Rajan, Shandre
Thangavelu, and Rasyad A Parinduri (eds), Exchange Rate, Monetary and Financial
Issues and Policies in Asia, World Scientific Press, p. 77-115.
Cheung, Yin-Wong and Xingwang Qian. 2009. “Hoarding of International Reserves: Mrs
Machlup’s Wardrobe and the Joneses. Review of International Economics, 17(4), 824–
843.
Chinn, Menzie D. and Hiro Ito. 2007. “Current Account Balances, Financial Development and
Institutions: Assaying the World 'Savings Glut',” Journal of International Money and
Finance, Volume 26, Issue 4, p. 546-569 (June).
Chinn, M. D. and H. Ito. 2008. A New Measure of Financial Openness. Journal of Comparative
Policy Analysis, Volume 10, Issue 3 (September), p. 309 - 322.
Chinn, M. D. and H. Ito, 2006. What Matters for Financial Development? Capital Controls,
Institutions, and Interactions, Journal of Development Economics, Volume 81, Issue 1,
Pages 163-192 (October).
Chuhan, P., S. Claessens, and N. Mamingi. 1993. “Equity and Bond Flows to Latin America and
Asia: The Role of Global and Country Factors,” World Bank Policy Research Working
Paper 1160 (Washington DC: World Bank).
Eichengreen, B. and M. Kawai. 2015. Renminbi Internationalization: Achievements, Prospects,
and Challenges, Washington, DC: Brookings Institution Press.
Eichengreen, B. and D. Leblang. 2003. Exchange Rates and Cohesion: Historical Perspectives
and Political-Economy Considerations. Journal of Common Market Studies, 41(5): 797–
822.
Frankel, J. 2011. “Historical Precedents for Internationalization of the RMB.” A CGS/IIGG
Working Paper. Washington, D.C.: Council on Foreign Relations.
Frankel, J.A., S.L. Schmukler, and L. Serven. 2004. “Global Transmission of Interest Rates:
Monetary Independence and Currency Regime,” Journal of International Money and
Finance, v23(5,Sep), 701-733.

20
Frankel, J. and S. J. Wei. 1996. “Yen Bloc or Dollar Bloc? Exchange Rate Policies in East Asian
Economies.” In T. Ito and A Krueger, eds., Macroeconomic Linkage: Savings, Exchange
Rates, and Capital Flows, Chicago: University of Chicago Press, pp 295–329.
Fratzscher, M. 2011. “Capital Flows, Push Versus Pull Factors and the Global Financial Crisis,”
NBER Working Paper 17357 (Cambridge: NBER).
Ghosh, A. R., J. Kim, M. Qureshi, and J. Zalduendo, 2012. Surges. IMF Working Paper
WP/12/22.
Ghosh, A., A. Gulde and J. Ostry. 1997. “Does the Nominal Exchange Rate Regime Matter?”
NBER Working Paper No 5874.
Griffin, J., F. Nardari, and R. Stulz. 2004. “Are Daily Cross-Border Equity Flows Pushed or
Pulled?” Review of Economics and Statistics, Vol. 86, No. 3, pp. 642-657.
Henry, P. B. 2007. “Capital Account Liberalization: Theory, Evidence, and Speculation,”
Journal of Economic Literature, American Economic Association, vol. 45(4), pages 887-
935, December.
Ito, H. and M. Chinn. 2015. “The Rise of the 'Redback' and China's Capital Account
Liberalization: An Empirical Analysis on the Determinants of Invoicing Currencies.” In
Eichengreen, B. and M. Kawai, eds., Renminbi Internationalization: Achievements,
Prospects, and Challenges (January 2015).
Ito, H. and M. Kawai. 2016. “Trade Invoicing in Major Currencies in the 1970s-1990s: Lessons
for Renminbi Internationalization,” Prepared for 25th NBER-TCER-CEPR “TRIO”
Conference on International Finance in the Global Markets (revised in March 2016).
Ito, H. and M. Kawai. 2012. “New Measures of the Trilemma Hypothesis and Their Implications
for Asia.” ADBI Working Paper 381. (February 2012).
Ito, H. and C. Rodriguez. 2015. “Clamoring for Greenbacks: Explaining the Resurgence of the
US Dollar in International Debt.” RIETI Working Paper 15-E-119 (October).
Ito, H., and R. McCauley. 2016. “ Re-dimensionalising global imbalances: current accounts of
currency zones and renminbi management.” BIS Working Paper.
Ito, Takatoshi. 2011. “The Internationalization of the RMB: Opportunities and Pitfalls.”
CGS/IIGG Working Paper. Washington, D.C.: Council on Foreign Relations.
Kaminsky, G. L. and S. L. Schmukler. 2008. “Short-Run Pain, Long-Run Gain: Financial
Liberalization and Stock Market Cycles,” Review of Finance, Oxford University Press for
European Finance Association, vol. 12(2), pages 253-292.

21
Klein, M. and J. Shambaugh. 2015. “Rounding the Corners of the Policy Trilemma: Sources of
Monetary Policy Autonomy,” American Economic Journal: Macroeconomics, American
Economic Association, vol. 7(4), pages 33-66, October.
Kose, M. A., E. Prasad, K. Rogoff, and S. J. Wei, 2009. “Financial Globalization: A Reappraisal.”
IMF Staff Papers, Vol. 56, No. 1. Washington, D.C.: International Monetary Fund.
Lane, P., Milesi-Ferretti, G. M. 2006. The External Wealth of Nations Mark II: Revised and
Extended Estimates of Foreign Assets and Liabilities, 1970 - 2004. IMF Working Paper,
WP/06/69.
Lane, P. and G. M. Milesi-Ferretti. 2007. The External Wealth of Nations Mark II: Revised and
Extended Estimates of Foreign Assets and Liabilities, 1970–2004. Journal of
International Economics. 73 (2). pp. 223−250.
Levy-Yeyati, E. and F. Sturzenegger. 2003. “To float or to fix: Evidence on the impact of
exchange rate regimes on growth.” The American Economic Review 93(4): 1173–1193.
Mundell, R.A. 1963. Capital Mobility and Stabilization Policy under Fixed and Flexible
Exchange Rates. Canadian Journal of Economic and Political Science. 29(4): 475–85.
Obstfeld, M. 2014. “Trilemmas and Tradeoffs: Living with Financial Globalization”, mimeo,
University of California, Berkeley.
Obstfeld, M., J.C. Shambaugh, and A.M. Taylor. 2009. “Financial Instability, Reserves, and
Central Bank Swap Lines in the Panic of 2008.” NBER Working Papers 14826.
Cambridge, MA : National Bureau of Economic Research (March).
Obstfeld, M., J. C. Shambaugh, and A. M. Taylor. 2008. “Financial Stability, The Trilemma, and
International Reserves.” NBER Working Paper 14217. (August).
Obstfeld, M., J. C. Shambaugh, and A. M. Taylor. 2005. “The Trilemma in History: Tradeoffs
among Exchange Rates, Monetary Policies, and Capital Mobility." Review of Economics
and Statistics 87 (August): 423–438.
Prasad, E.S., K. Rogoff, S. J. Wei, and M. A. Kose. 2003. “Effects of Financial Globalization on
Developing Countries: Some Empirical Evidence.” Occasional Paper 220. Washington,
D.C.: International Monetary Fund.
Quinn, D., M. Schindler, and A.M. Toyoda. 2011. “Assessing Measures of Financial Openness
and Integration,” IMF Economic Review. 08/2011; 59(3):488-522.

22
Rey, H. 2013. “Dilemma not Trilemma: The Global Financial Cycle and Monetary Policy
Independence,” prepared for the 2013 Jackson Hole Meeting.
Shambaugh, J. C., 2004. The Effects of Fixed Exchange Rates on Monetary Policy. Quarterly
Journal of Economics 119 (1), 301-52.
Taylor, M., and L. Sarno. 1997. “Capital Flows to Developing Countries: Long- and Short-Term
Determinants,” World Bank Economic Review, Vo. 11(3), pp. 451-470.

23
Figure 1: International Reserve Holdings
(a) As a ratio to GDP
Note: For the country groups, the group’s aggregate IR is divided by the group’s
aggregated GDP
(b) As a ratio to the world total (b)
Note: For the country groups, the group’s aggregate IR is divided the world’s total IR
0.1
.2.3
.4.5
IR h
old
ng a
s %
of G
DP
1960 1970 1980 1990 2000 2010year
Japan China
ex-China Emerging Asia ex-JPN IDC
0.2
.4.6
IR h
old
ng a
s %
of W
orl
d T
ota
l
1960 1970 1980 1990 2000 2010year
Japan China
ex-China Emerging Asia ex-JPN IDC

24
Figure 2: The “Trilemma” Triangle
Exchange Rate Stability Fixed exchange rate with a
fully open financial market
(e.g. Gold Standard, Currency Board
such as Hong Kong, China or small
eurozone members such as Greece)
Fixed exchange rate with a
closed financial market
(e.g., Bretton Woods, Pre-1980
People’s Republic of China)
Freely flexible exchange rate with a
fully open financial market
(e.g. Canada, Japan, United Kingdom)

Figure 3: Development of the Trilemma Configurations Over Time
(a) Industrialized Countries
(b) Emerging market economies (EMEs) (c) Non-EME Developing Countries
0.1
.2.3
.4.5
.6.7
.8.9
11970 1980 1990 2000 2010
Year
Mon. Indep., IDC Exchr. Stab., IDC
KAOPEN, IDC
0.1
.2.3
.4.5
.6.7
.8.9
1
1970 1980 1990 2000 2010Year
Mon. Indep., EMG Exchr. Stab., EMG
KAOPEN, EMG
0.1
.2.3
.4.5
.6.7
.8.9
1
1970 1980 1990 2000 2010Year
Mon. Indep., non-EMG LDC Exchr. Stab., non-EMG LDC
KAOPEN, non-EMG LDC

26
Figure 4: Regional Comparison of the Development of the Trilemma Configurations
(a) Emerging Market Economies (EMG) in Asia (c) Latin American Countries
(b) Non-EMG, Developing Asia (d) Less Developed Countries (LDC) excluding Asia
0.1
.2.3
.4.5
.6.7
.8.9
1
1970 1980 1990 2000 2010Year
MI ERS
KAOPEN
0.1
.2.3
.4.5
.6.7
.8.9
1
1970 1980 1990 2000 2010Year
Mon. Indep., Latin America Exchr. Stab., Latin America
KAOPEN, Latin America
0.1
.2.3
.4.5
.6.7
.8.9
1
1970 1980 1990 2000 2010Year
MI ERS
KAOPEN
0.1
.2.3
.4.5
.6.7
.8.9
1
1970 1980 1990 2000 2010Year
Mon. Indep., EMG excl. Asia Exchr. Stab., EMG excl. Asia
KAOPEN, EMG excl. Asia

27
Figure 5: The “Diamond Charts”:
Variation of the Trilemma and IR Configurations Across Different Country Groups
(a) Euro 12 Countries (b) Emerging Asia
(c) China (d) Latin America

28
Figure 7: VIX and Net Capital Flows to EMEs
(a) EME Total (b) Asian EMEs
(c) Latin American EMEs (d) Eastern/Central European EMEs
Note: VIX is a measure of the implied volatility of S&P 500 index options. Both VIX and net capital flows are shown as four-months moving
averages. The scale for the VIX index (on the right-hand side) is reversed to express the degree of risk appetite.
010
20
30
40
50
60
VIX
- r
evers
ed
-25
0-1
50
-50
50
15
025
0
Pri
vate
K-in
flow
, $
billion
s
1990q1 1995q1 2000q1 2005q1 2010q1 2015q1
K-inflow VIX
010
20
30
40
50
60
VIX
- r
evers
ed
-25
0-1
50
-50
50
15
025
0
Pri
vate
K-in
flow
, $
billion
s
1990q1 1995q1 2000q1 2005q1 2010q1 2015q1
K-inflow VIX
010
20
30
40
50
60
VIX
- r
evers
ed
-25
0-1
50
-50
50
15
025
0
Pri
vate
K-in
flow
, $
billion
s
1990q1 1995q1 2000q1 2005q1 2010q1 2015q1
K-inflow VIX
010
20
30
40
50
60
VIX
- r
evers
ed
-25
0-1
50
-50
50
15
025
0
Pri
vate
K-in
flow
, $
billion
s
1990q1 1995q1 2000q1 2005q1 2010q1 2015q1
K-inflow VIX

29
Figure 8: Connectivity with the U.S.
(a) Short-term interest rate
(b) Long-term interest rate (c) Stock market price
-1-.
50
.51
Corr
. of S
T-in
t. r
ate
s w
/ U
S
1990m1 1995m1 2000m1 2005m1 2010m1 2015m1
IDC China
ex-China Emerging Asia EMEs
-1-.
50
.51
Corr
. of S
T-in
t. r
ate
s w
/ U
S
1990m1 1995m1 2000m1 2005m1 2010m1 2015m1
IDC China
ex-China Emerging Asia EMEs
-1-.
50
.51
Corr
. of S
T-in
t. r
ate
s w
/ U
S
1990m1 1995m1 2000m1 2005m1 2010m1 2015m1
IDC China
ex-China Emerging Asia EMEs

30
Figure 9: Financial Openness
(a) De jure measure (Chinn-Ito index)
(b) De factor measure (sum of external assets and liabilities divided by GDP)
0.2
.4.6
.81
1985 1990 1995 2000 2005 2010 2015Year
ex-China E.Asia E.&C. Europe
L.America China
01
23
1985 1990 1995 2000 2005 2010 2015Year
ex-China E.Asia E.&C. Europe
L.America China
Japan India

31
Figure 10: Vulnerability of Asian Economies
(a) Exchange Rate Stability (b) International Reserve Holdings
(c) International Debt Securities (% of GNI) (d) Short-term Liability to Banks (% of GNI)
0.2
.4.6
.81
Exch
. R
ate
Sta
b.
1990 1995 2000 2005 2010 2015year
Korea Thailand
Philippines Malaysia
Indonesia China
0.1
.2.3
.4.5
Int'l R
eserv
es / G
DP
1990 1995 2000 2005 2010 2015year
Korea Thailand
Philippines Malaysia
Indonesia China
0.1
.2
Int'l de
bt / G
NI
1990 1995 2000 2005 2010 2015year
Korea Thailand
Philippines Malaysia
Indonesia China
Vietnam
0.1
.2
ST
lia
b to
ban
ks
1990 1995 2000 2005 2010 2015year
Korea Thailand
Philippines Malaysia
Indonesia China
Vietnam

32
Figure 10 continued:
(e) “Credit Gap” (f) Exchange Market Pressure
-.3
-.2
-.1
0.1
.2.3
.4
Cre
dit g
ap
1990 1995 2000 2005 2010 2015year
Korea Thailand
Philippines Malaysia
Indonesia China
-2-1
01
2
Exch. M
kt. P
ressu
re
1990 1995 2000 2005 2010 2015year
Korea Thailand
Philippines Malaysia
Indonesia China
Vietnam

33
Figure 11: Heavy Reliance on the Dollar
(a) Dollar Share in Export Invoicing
(b) Dollar Weight in Currency Baskets (c) Dollar Share in International Debt Denomination
0.2
.4.6
.81
US
D e
xp
ort
invo
icin
g
1990 1995 2000 2005 2010 2015year
Korea Thailand
Malaysia Indonesia
Japan
0.2
.4.6
.81
US
D W
eig
ht
1990 1995 2000 2005 2010 2015year
Korea Thailand
Philippines Malaysia
Indonesia China
Vietnam
0.2
.4.6
.81
US
D S
ha
re in
int'l de
bt
1990 1995 2000 2005 2010 2015year
Korea Thailand
Philippines Malaysia
Indonesia China
Vietnam

34
Figure 12: Changing Trade Structure and Stable Reliance on the Dollar
(a) Share of the U.S. as an Export Destination (b) Share of China as an Export Destination
(c) Share of Trade with Dollar-zone Economies
0.1
.2.3
.4
Exp
ort
to U
S %
wo
rld
tota
l
1990 1995 2000 2005 2010 2015year
Korea Thailand
Philippines Malaysia
Indonesia China
Vietnam Japan
Singapore
0.1
.2.3
.4
Exp
ort
to C
hin
a %
wo
rld
tota
l
1990 1995 2000 2005 2010 2015year
Korea Thailand
Philippines Malaysia
Indonesia China
Vietnam Japan
Singapore
0.2
.4.6
.81
Tra
de s
ha
re w
/ U
SD
zon
e
1990 1995 2000 2005 2010 2015year
Korea Thailand
Philippines Malaysia
Indonesia China
Vietnam Japan
Singapore