Easley Combined Utilities · combined utility system of easley easley, south carolina comprehensive...
76
COMBINED UTILITY SYSTEM OF EASLEY Easley, South Carolina COMPREHENSIVE ANNUAL FINANCIAL REPORT FOR THE FISCAL YEARS ENDED MARCH 31, 2015 AND 2014 Prepared by the Finance Department
-
Upload
nguyenquynh -
Category
Documents
-
view
218 -
download
0
Transcript of Easley Combined Utilities · combined utility system of easley easley, south carolina comprehensive...
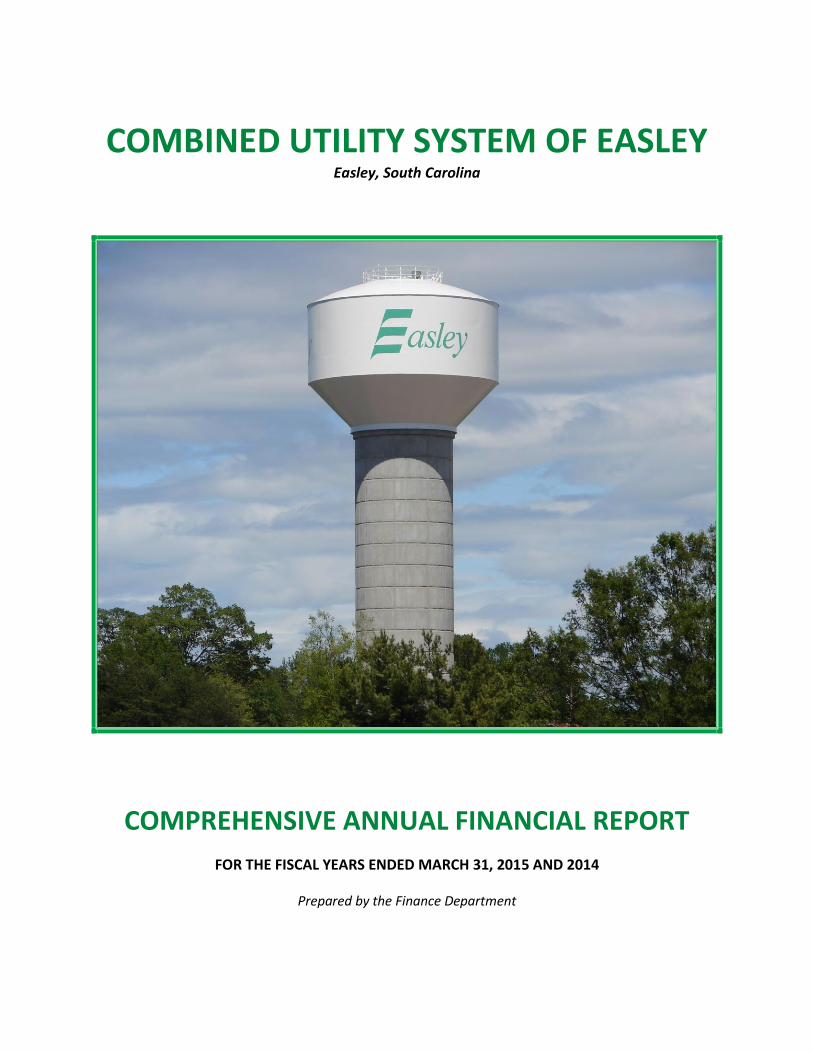
COMBINED UTILITY SYSTEM OF EASLEY
Easley, South Carolina
COMPREHENSIVE ANNUAL FINANCIAL REPORT
FOR THE FISCAL YEARS ENDED MARCH 31, 2015 AND 2014
Prepared by the Finance Department

INTRODUCTORY SECTION
i
COMBINED UTILITY SYSTEM OF EASLEY
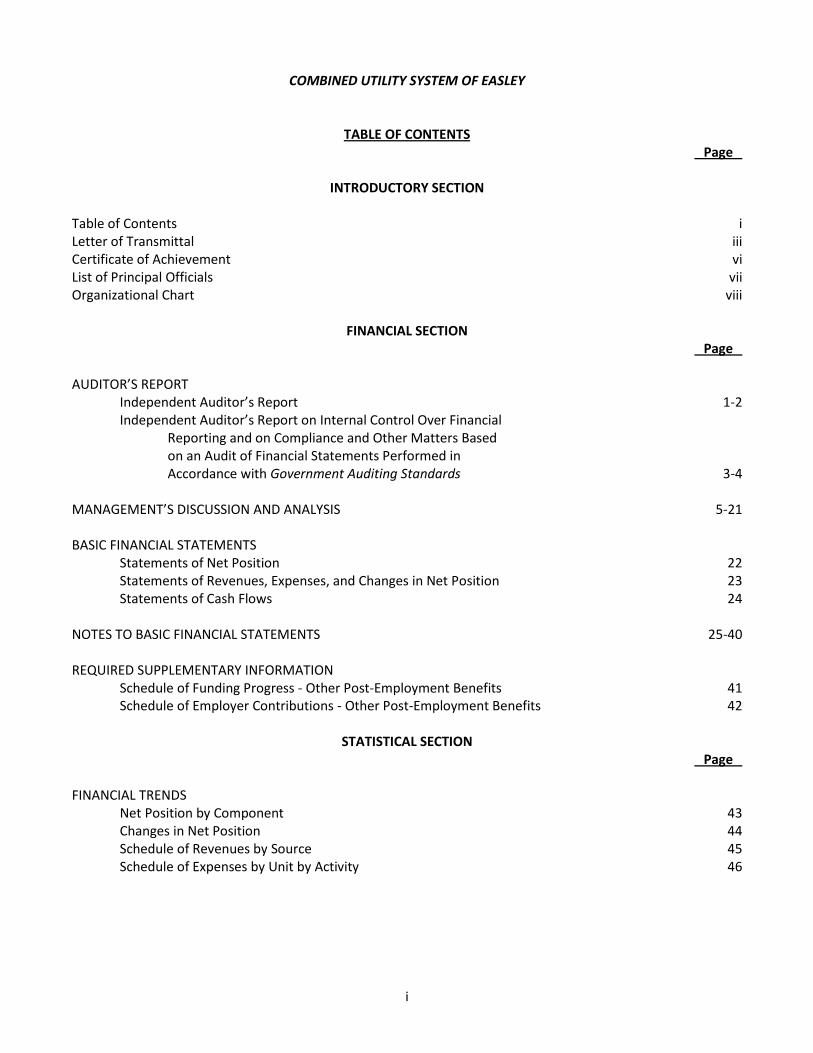
TABLE OF CONTENTS Page
INTRODUCTORY SECTION Table of Contents i Letter of Transmittal iii Certificate of Achievement vi List of Principal Officials vii Organizational Chart viii
FINANCIAL SECTION Page AUDITOR’S REPORT
Independent Auditor’s Report 1-2 Independent Auditor’s Report on Internal Control Over Financial
Reporting and on Compliance and Other Matters Based on an Audit of Financial Statements Performed in Accordance with Government Auditing Standards 3-4
MANAGEMENT’S DISCUSSION AND ANALYSIS 5-21 BASIC FINANCIAL STATEMENTS
Statements of Net Position 22 Statements of Revenues, Expenses, and Changes in Net Position 23 Statements of Cash Flows 24
NOTES TO BASIC FINANCIAL STATEMENTS 25-40 REQUIRED SUPPLEMENTARY INFORMATION
Schedule of Funding Progress - Other Post-Employment Benefits 41 Schedule of Employer Contributions - Other Post-Employment Benefits 42
STATISTICAL SECTION
Page FINANCIAL TRENDS
Net Position by Component 43 Changes in Net Position 44 Schedule of Revenues by Source 45 Schedule of Expenses by Unit by Activity 46
ii
COMBINED UTILITY SYSTEM OF EASLEY
TABLE OF CONTENTS - Continued Page REVENUE ANALYSIS
Electric System (Current Rate Structure, Historical Connections and Demand, Ten Largest Customers, and Purchased Power History) 47-50
Water System (Current Rate Structure, Historical Connection and Consumption, and Ten Largest Customers) 51-54
Sewer System (Current Rate Structure, Historical Connection, and Ten Largest Customers) 55-57
DEBT ANALYSIS
Ratios of Bonded Debt Outstanding 58 Historical Statements of Revenues, Expenses, Debt Service and
Debt Service Coverage 59 DEMOGRAPHIC AND ECONOMIC INFORMATION
Pickens County Demographic Data 60 Principal Employers of Pickens County 61
OPERATING INFORMATION
Number of Employees by Identifiable Activity 62 Operating and Capital Indicators 63
iii
P.O. Box 619 Easley, South Carolina 29641-0619 Phone (864) 859-4013 Fax (864) 644-8156
www.easleyutilities.com
EASLEY COMBINED UTILITIES
A Community Tradition
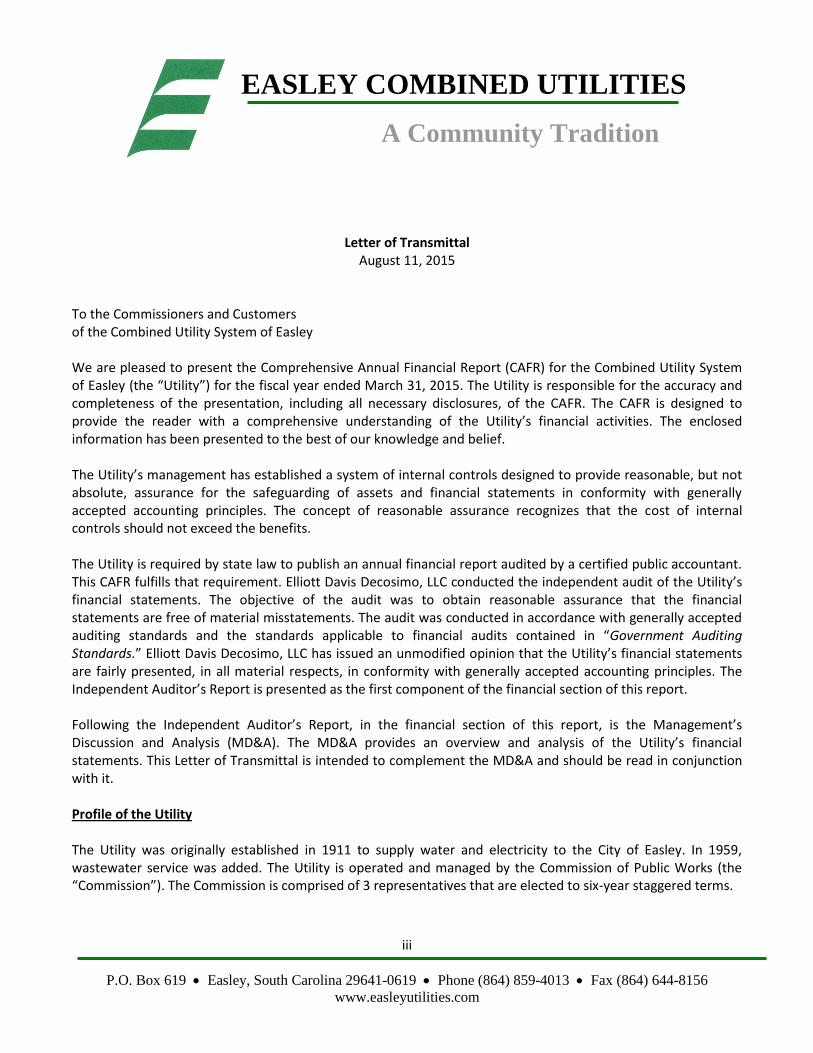
Letter of Transmittal August 11, 2015
To the Commissioners and Customers of the Combined Utility System of Easley We are pleased to present the Comprehensive Annual Financial Report (CAFR) for the Combined Utility System of Easley (the “Utility”) for the fiscal year ended March 31, 2015. The Utility is responsible for the accuracy and completeness of the presentation, including all necessary disclosures, of the CAFR. The CAFR is designed to provide the reader with a comprehensive understanding of the Utility’s financial activities. The enclosed information has been presented to the best of our knowledge and belief. The Utility’s management has established a system of internal controls designed to provide reasonable, but not absolute, assurance for the safeguarding of assets and financial statements in conformity with generally accepted accounting principles. The concept of reasonable assurance recognizes that the cost of internal controls should not exceed the benefits. The Utility is required by state law to publish an annual financial report audited by a certified public accountant. This CAFR fulfills that requirement. Elliott Davis Decosimo, LLC conducted the independent audit of the Utility’s financial statements. The objective of the audit was to obtain reasonable assurance that the financial statements are free of material misstatements. The audit was conducted in accordance with generally accepted auditing standards and the standards applicable to financial audits contained in “Government Auditing Standards.” Elliott Davis Decosimo, LLC has issued an unmodified opinion that the Utility’s financial statements are fairly presented, in all material respects, in conformity with generally accepted accounting principles. The Independent Auditor’s Report is presented as the first component of the financial section of this report. Following the Independent Auditor’s Report, in the financial section of this report, is the Management’s Discussion and Analysis (MD&A). The MD&A provides an overview and analysis of the Utility’s financial statements. This Letter of Transmittal is intended to complement the MD&A and should be read in conjunction with it. Profile of the Utility The Utility was originally established in 1911 to supply water and electricity to the City of Easley. In 1959, wastewater service was added. The Utility is operated and managed by the Commission of Public Works (the “Commission”). The Commission is comprised of 3 representatives that are elected to six-year staggered terms.
iv
The electric system maintained by the Utility services approximately 51 square miles in, and around, the City of Easley. The power is supplied by Piedmont Municipal Power Agency (PMPA), a joint action agency, of which Easley and nine other upstate cities are members, and its allocation of hydro-power from the Southeastern Power Administration (SEPA). PMPA owns 25% of Unit Two at the Catawba Nuclear Plant in York, South Carolina. PMPA secures for the Utility supplemental power and energy, above its allocation from Catawba, from Santee Cooper. As of March 31, 2015, the Utility had 13,902 electric accounts. The Utility has 1 water treatment plant (Don L. Moore Water Treatment Plan), located on the Saluda Lake. The Utility provides water on a wholesale basis to water districts including: Powdersville Water District, Southside Water District, Easley Central Water District, and Dacusville-Cedar Rock Water District. These water districts accounted for over half of the total water sales (by volume) in 2015. The water system services approximately 40 square miles in Pickens County. As of March 31, 2015, the Utility had 13,416 water accounts. The Utility maintains 3 wastewater treatment plants (Middle Branch, Georges Creek, and Golden Creek). The wastewater system serves approximately 40 square miles in and around Pickens County (Middle Branch is located in, and services some customers in, Anderson County). As of March 31, 2015, the Utility had 10,482 wastewater accounts. Financial Profile of the Utility The Utility adopts an annual operating budget for management and financial planning purposes. During adoption of the budget, the Commission reviews and assesses future financial plans (minimum of 5 years) including: capital improvement plans, rate-setting projections, and debt service needs. The Commission adopts the annual operating budget before the fiscal year begins (April 1) and sets the rates to meet operating and financial objectives. In long-range planning, the Commission utilizes numerous benchmarking tools to determine necessary steps in maintaining a reliable, efficient and affordable utility system. One financial benchmark that the Commission strives to maintain is a favorable debt service ratio. For the fiscal year 2015, the debt coverage ratio, based on revenue bond covenant definition, was a strong 196%. Also, the Utility reviews other local comparable rates, in the region, to determine if rates are reasonably set. Customer rates for the year compare favorably with those in the region. For the year ending March 31, 2015, the Utility’s net position was $63,909,609, a 1.04% increase from the 2014 fiscal year. The service area has seen only a slight customer base increase, however the increase in net position can be primarily attributable to interest income from our investments, efficient spending in operations, and an increase in sales to wholesale water customers. The Utility incurred a great deal of capital expenditures in the fiscal year (discussed in more detail in our attached MD&A), as we have taken aggressive measures in assuring reliability in all three systems. We have positioned the Utility in a strong financial position to continue operating the Utility in an efficient manner, without sacrificing reliability. Long-Term Financial Planning The Utility prepares a ten year facility plan for each utility department. The long range plans make recommendations on improvements in each department over the ten year period for growth and reliability. The recommendation of the facility plans are incorporated into the Utility’s capital plan, which is updated on an annual basis. The capital plan includes the projected cost of projects, the timing of the projects, and a projected source of funds. The Utility also prepares a five year pro-forma financial forecast that incorporates information from the capital plan. These tools allow the Utility to formulate and maintain the Utility’s financial stability.
v
Acknowledgements We appreciate the dedication and hard work displayed by the commissioners and employees of the Utility in continuing our mission in “providing a reliable supply of water, wastewater, and electrical service at the best possible value to the customers of Easley, South Carolina and surrounding areas.” Respectfully submitted, Joel D. Ledbetter General Manager
vi

vii
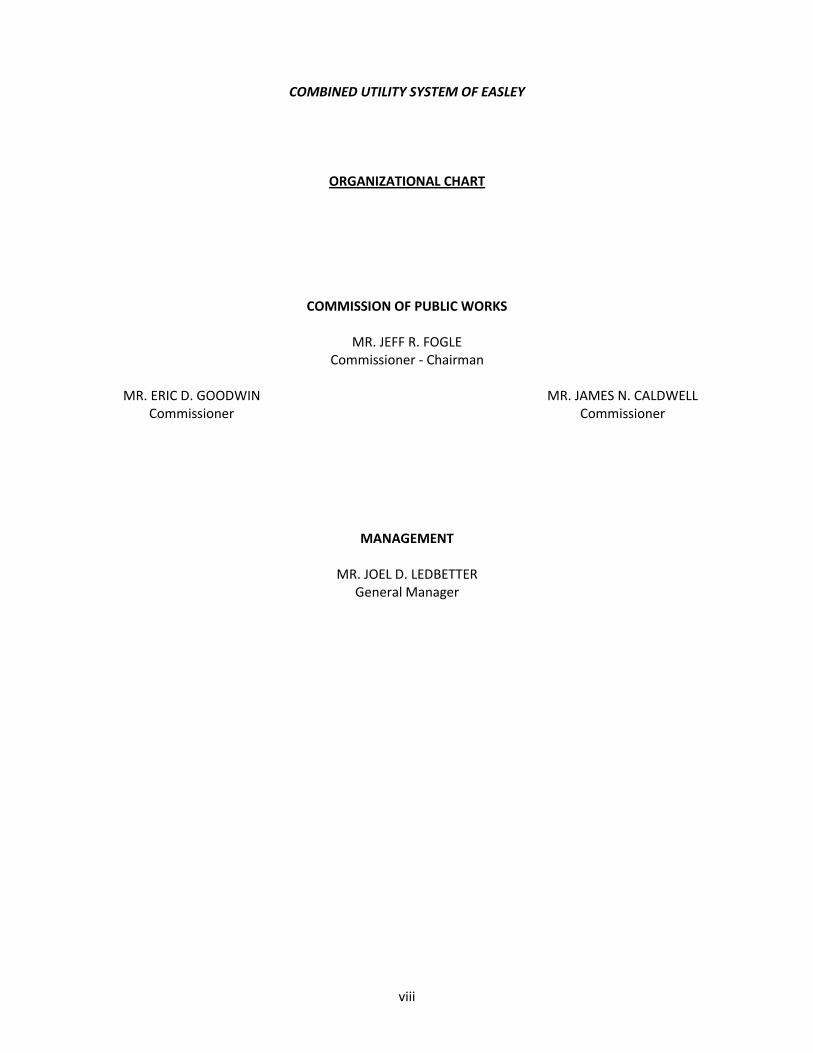
COMBINED UTILITY SYSTEM OF EASLEY
LIST OF PRINCIPAL OFFICIALS
Commission of Public Works- Manager Form of Government
COMMISSION OF PUBLIC WORKS
MR. ERIC D. GOODWIN MR. JEFF R. FOGLE MR. JAMES N. CALDWELL Commissioner Commissioner - Chairman Commissioner
UTILITY ADMINISTRATION
MR. JOEL D. LEDBETTER General Manager
viii
COMBINED UTILITY SYSTEM OF EASLEY
ORGANIZATIONAL CHART
COMMISSION OF PUBLIC WORKS
MR. JEFF R. FOGLE Commissioner - Chairman
MR. ERIC D. GOODWIN MR. JAMES N. CALDWELL Commissioner Commissioner
MANAGEMENT
MR. JOEL D. LEDBETTER General Manager

FINANCIAL SECTION
www.elliottdavis.com
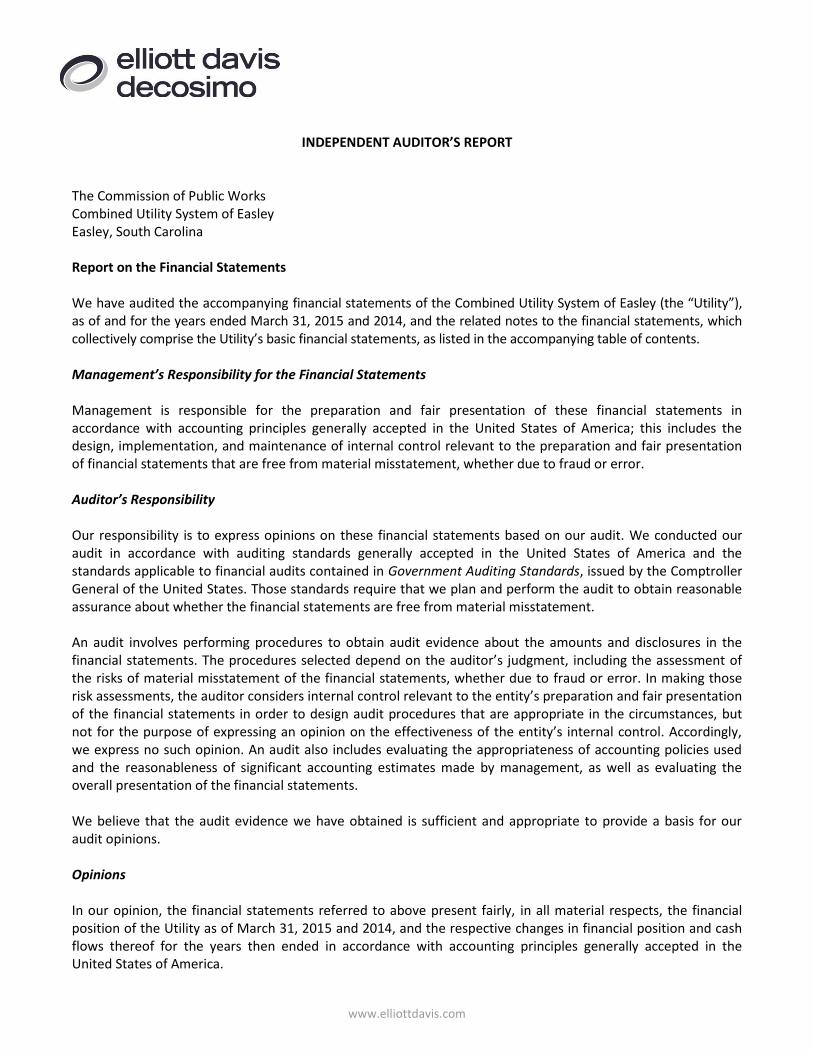
INDEPENDENT AUDITOR’S REPORT The Commission of Public Works Combined Utility System of Easley Easley, South Carolina Report on the Financial Statements We have audited the accompanying financial statements of the Combined Utility System of Easley (the “Utility”), as of and for the years ended March 31, 2015 and 2014, and the related notes to the financial statements, which collectively comprise the Utility’s basic financial statements, as listed in the accompanying table of contents. Management’s Responsibility for the Financial Statements Management is responsible for the preparation and fair presentation of these financial statements in accordance with accounting principles generally accepted in the United States of America; this includes the design, implementation, and maintenance of internal control relevant to the preparation and fair presentation of financial statements that are free from material misstatement, whether due to fraud or error. Auditor’s Responsibility Our responsibility is to express opinions on these financial statements based on our audit. We conducted our audit in accordance with auditing standards generally accepted in the United States of America and the standards applicable to financial audits contained in Government Auditing Standards, issued by the Comptroller General of the United States. Those standards require that we plan and perform the audit to obtain reasonable assurance about whether the financial statements are free from material misstatement. An audit involves performing procedures to obtain audit evidence about the amounts and disclosures in the financial statements. The procedures selected depend on the auditor’s judgment, including the assessment of the risks of material misstatement of the financial statements, whether due to fraud or error. In making those risk assessments, the auditor considers internal control relevant to the entity’s preparation and fair presentation of the financial statements in order to design audit procedures that are appropriate in the circumstances, but not for the purpose of expressing an opinion on the effectiveness of the entity’s internal control. Accordingly, we express no such opinion. An audit also includes evaluating the appropriateness of accounting policies used and the reasonableness of significant accounting estimates made by management, as well as evaluating the overall presentation of the financial statements. We believe that the audit evidence we have obtained is sufficient and appropriate to provide a basis for our audit opinions. Opinions In our opinion, the financial statements referred to above present fairly, in all material respects, the financial position of the Utility as of March 31, 2015 and 2014, and the respective changes in financial position and cash flows thereof for the years then ended in accordance with accounting principles generally accepted in the United States of America.
- 2 -
Required Supplementary Information Accounting principles generally accepted in the United States of America require that the management’s discussion and analysis, schedule of funding progress – other post-employment benefits, and the schedule of employer contributions as noted on the preceding table of contents be presented to supplement the basic financial statements. Such information, although not a part of the basic financial statements, is required by the Governmental Accounting Standards Board, who considers it to be an essential part of financial reporting for placing the basic financial statements in an appropriate operational, economic, or historical context. We have applied certain limited procedures to the required supplementary information in accordance with auditing standards generally accepted in the United States of America, which consisted of inquiries of management about the methods of preparing the information and comparing the information for consistency with management’s responses to our inquiries, the basic financial statements, and other knowledge we obtained during our audit of the basic financial statements. We do not express an opinion or provide any assurance on the information because the limited procedures do not provide us with sufficient evidence to express an opinion or provide any assurance. Other Information Our audit was conducted for the purpose of forming opinions on the financial statements that collectively comprise the Utility’s basic financial statements. The introductory section and the statistical section are presented for purposes of additional analysis and are not a required part of the basic financial statements. Such information has not been subjected to the auditing procedures applied in the audit of the basic financial statements, and accordingly, we do not express an opinion or provide any assurance on them. Other Reporting Required by Government Auditing Standards In accordance with Government Auditing Standards, we have also issued our report dated August 11, 2015 on our consideration of the Utility’s internal control over financial reporting and our tests of its compliance with certain provisions of laws, regulations, contracts, grant agreements and other matters. The purpose of that report is to describe the scope of our testing of internal control over financial reporting and compliance and the results of that testing, and not to provide an opinion on the internal control over financial reporting or on compliance. That report is an integral part of an audit performed in accordance with Government Auditing Standards in considering the Utility’s internal control over financial reporting and compliance. Greenville, South Carolina August 11, 2015
www.elliottdavis.com
INDEPENDENT AUDITOR’S REPORT ON INTERNAL CONTROL OVER FINANCIAL REPORTING AND ON COMPLIANCE AND OTHER MATTERS BASED ON AN AUDIT OF FINANCIAL STATEMENTS PERFORMED IN ACCORDANCE WITH
GOVERNMENT AUDITING STANDARDS The Commission of Public Works Combined Utility System of Easley Easley, South Carolina
We have audited, in accordance with the auditing standards generally accepted in the United States of America and the standards applicable to financial audits contained in Government Auditing Standards issued by the Comptroller General of the United States, the financial statements of the Combined Utility System of Easley (the “Utility”), as of and for the year ended March 31, 2015, and the related notes to the financial statements, which collectively comprise the Utility’s basic financial statements, and have issued our report thereon dated August 11, 2015.
Internal Control over Financial Reporting
In planning and performing our audit of the financial statements, we considered the Utility's internal control over financial reporting (internal control) to determine the audit procedures that are appropriate in the circumstances for the purpose of expressing our opinion on the financial statements, but not for the purpose of expressing an opinion on the effectiveness of the Utility's internal control. Accordingly, we do not express an opinion on the effectiveness of the Utility's internal control.
A deficiency in internal control exists when the design or operation of a control does not allow management or employees, in the normal course of performing their assigned functions, to prevent, or detect and correct, misstatements on a timely basis. A material weakness is a deficiency, or a combination of deficiencies, in internal control, such that there is a reasonable possibility that a material misstatement of the entity's financial statements will not be prevented, or detected and corrected on a timely basis. A significant deficiency is a deficiency, or a combination of deficiencies, in internal control that is less severe than a material weakness, yet important enough to merit attention by those charged with governance.
Our consideration of internal control was for the limited purpose described in the first paragraph of this section and was not designed to identify all deficiencies in internal control that might be material weaknesses or significant deficiencies. Given these limitations, during our audit we did not identify any deficiencies in internal control that we consider to be material weaknesses. However, material weaknesses may exist that have not been identified.
Compliance and Other Matters
As part of obtaining reasonable assurance about whether the Utility's financial statements are free from material misstatement, we performed tests of its compliance with certain provisions of laws, regulations, contracts, and grant agreements, noncompliance with which could have a direct and material effect on the determination of financial statement amounts. However, providing an opinion on compliance with those provisions was not an objective of our audit, and accordingly, we do not express such an opinion. The results of our tests disclosed no instances of noncompliance or other matters that are required to be reported under Government Auditing Standards.
- 4 -
Purpose of this Report The purpose of this report is solely to describe the scope of our testing of internal control and compliance and the results of that testing, and not to provide an opinion on the effectiveness of the entity's internal control or on compliance. This report is an integral part of an audit performed in accordance with Government Auditing Standards in considering the entity's internal control and compliance. Accordingly, this communication is not suitable for any other purpose. Greenville, South Carolina August 11, 2015
- 5 -
COMBINED UTILITY SYSTEM OF EASLEY EASLEY, SOUTH CAROLINA
MANAGEMENT’S DISCUSSION AND ANALYSIS
The management of the Combined Utility System of Easley (the “Utility”, “Easley Combined Utilities”, or “ECU”) offers the users of the Utility’s financial statements this overview and analysis of the Utility’s financial performance for the fiscal years ending March 31, 2015, 2014, and 2013. Please read this overview in conjunction with the Utility’s audited financial statements, which follow this section. FINANCIAL HIGHLIGHTS
Net position increased $660,128 or 1.0%.
Operating revenues of $48.6 million for FY 2015 increased $2,470,000 or 5.3% over FY 2014.
Operating expenses before depreciation and amortization for FY 2014 increased $2,595,000 or 6.7% over FY 2014.
Operating income before depreciation and amortization of $7.5 million for FY 2015 was $125,000 less than that of FY 2014, or a decrease of 1.6%.
Total operating revenues were over budget by $527,000 or 1.1% for the current fiscal year, and total operating expenses were under budget by $814,000 or 1.9%.
OVERVIEW OF THE FINANCIAL STATEMENTS
Our annual report includes this management’s discussion and analysis, our independent certified public accountant’s report, and the basic financial statements and notes of Easley Combined Utilities.
Management’s discussion and analysis (MD&A) serves as management’s discussion of the Utility’s financial condition and performance. It is intended to supplement the financial statements.
The statements of net position represent the Utility’s financial position on an accrual historical cost basis and provide information about the Utility’s assets and liabilities, with the difference being net position.
The statements of revenues, expenses, and changes in net position report the results from business activities during the respective fiscal year and present the Utility’s ability to recover its costs from operations and provide for reinvestment into the Utility.
The statements of cash flows report the increase or decrease in cash and cash equivalents through operating, investing, and financing activities and present cash disbursements and receipts information resulting in the net change in cash position.
The notes to basic financial statements provide additional information required for understanding the basic financial statements. Disclosures about material risks, accounting policies, debt obligations, and significant balances are presented here.

- 6 -
SUMMARY OF THE ORGANIZATION AND BUSINESS
The Commission of Public Works (the "Commission") operates and manages the Utility which provides water, wastewater and electrical services in the City of Easley and surrounding areas. The Commission is the policy-making body of the Utility and approves all major operating procedures, expenditures, capital improvements and rates and charges. All charges imposed upon customers for services rendered are set by the Commission and require no approval by any state or local agency. The Commission makes recommendations to the City Council for the issuance of bonds to finance improvements to the Utility, but is otherwise authorized under State law to have full control and management of the Utility. The Commission appoints the General Manager, the Utility’s chief executive officer. As a matter of policy, the Commission periodically reviews management’s recommendations relating to capital improvements, service obligations and projections along with revenue requirements to meet these needs.
The Commission consists of three members elected by the electorate of the City to six-year staggered terms, with one seat up for election every two years. The members of the Commission, as of March 31, 2015, and the number of years of continuous service as Commission members are as follows:
Name
Number of Years Served
Jeff R. Fogle (Chairman) 4 James N. Caldwell 3 Eric D. Goodwin 1
The Utility is a combined utility system which provides water, wastewater and electrical service within
the City and its surrounding areas. The Utility was established in 1911 as the Easley Water and Light Plant and placed under the control of the Commission. In 1953, the water and electric systems were combined and the existing wastewater system of the City was added in 1959. The combined utility is governed by the Commission. FINANCIAL ANALYSIS
The Utility’s financial condition remained strong at year-end. Reliable utility plant and equipment, adequate liquidity, and appropriate rate structures are in place to continue to provide reliable, quality utility services to the citizens of Easley and the surrounding community. The following financial statements and other information serve as key indicators and data for planning and managing the Utility.
Overall revenue from operations increased in 2015 by $2,470,000 over 2014, or 5.3%. Operating expenses increased this year by $2,595,000, or 6.7%, from 2014 expenses. Operating expenses for the electric department increased by $2.5 million, or 8.6%, over 2014 expenses, which was primarily due to an increase in wholesale power costs. Operating expenses for the water department were $114,000 more in FY 2015 than FY 2014, or a 4.5% increase. Wastewater expenses in FY 2015 were $124,000 more than FY 2014, or a 5.7% increase. Customer service and administration expenses were $152,000 lower in FY 2015 than in FY 2014 or a 3.2% decrease.
- 7 -
FINANCIAL CONDITION
Total assets decreased $846,000 in FY 2015. This net decrease is primarily attributable to the following changes: capital assets (net of depreciation) decreased by $1,711,000, while total investments increased by $1,172,000 in FY 2015.
Current liabilities increased by $105,000 in the current year primarily due to the following factors: the decreases in accrued expenses ($45,000 decrease), customer deposits ($40,000), and accrued interest ($22,000) were offset by the increases of accounts payable ($147,000 increase) and retainage payable ($6,000 increase). Long-term liabilities decreased by approximately $1.9 million from FY 2014 levels due primarily to the scheduled payment of bonds (see Note 7 of the notes to basic financial statements).
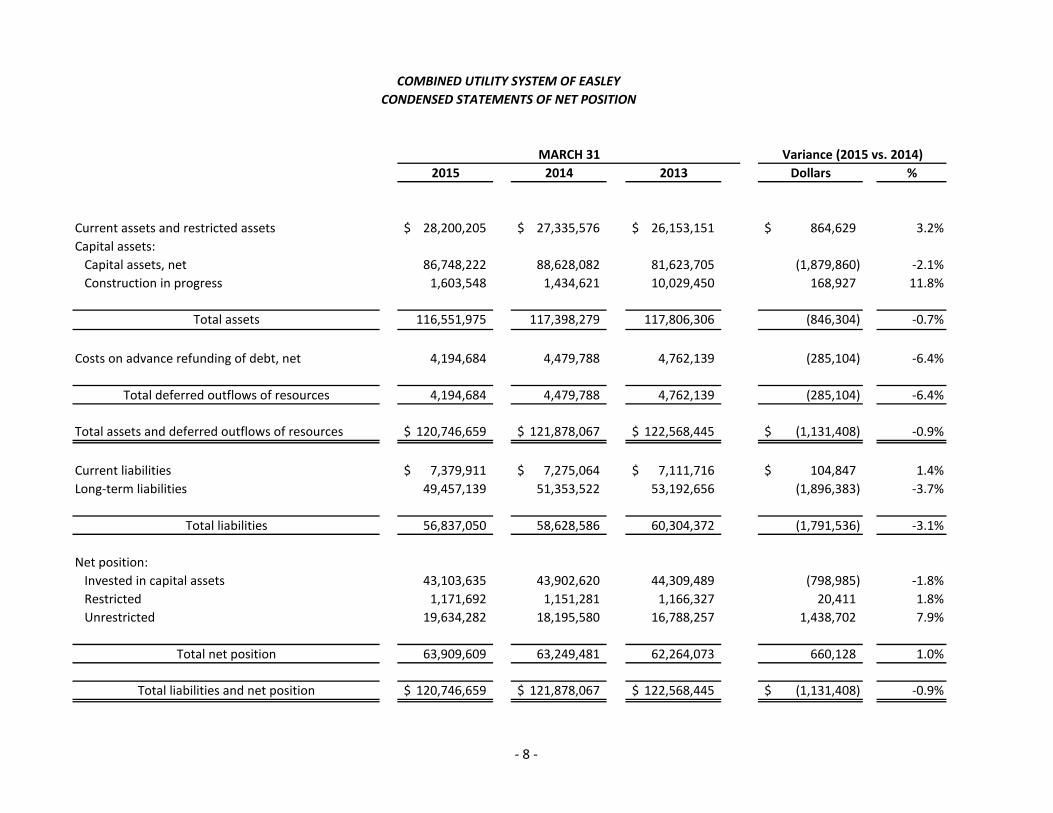
2015 2014 2013 Dollars %
Current assets and restricted assets 28,200,205$ 27,335,576$ 26,153,151$ 864,629$ 3.2%
Capital assets:
Capital assets, net 86,748,222 88,628,082 81,623,705 (1,879,860) -2.1%
Construction in progress 1,603,548 1,434,621 10,029,450 168,927 11.8%
Total assets 116,551,975 117,398,279 117,806,306 (846,304) -0.7%
Costs on advance refunding of debt, net 4,194,684 4,479,788 4,762,139 (285,104) -6.4%
Total deferred outflows of resources 4,194,684 4,479,788 4,762,139 (285,104) -6.4%
Total assets and deferred outflows of resources 120,746,659$ 121,878,067$ 122,568,445$ (1,131,408)$ -0.9%
Current liabilities 7,379,911$ 7,275,064$ 7,111,716$ 104,847$ 1.4%
Long-term liabilities 49,457,139 51,353,522 53,192,656 (1,896,383) -3.7%
Total liabilities 56,837,050 58,628,586 60,304,372 (1,791,536) -3.1%
Net position:
Invested in capital assets 43,103,635 43,902,620 44,309,489 (798,985) -1.8%
Restricted 1,171,692 1,151,281 1,166,327 20,411 1.8%
Unrestricted 19,634,282 18,195,580 16,788,257 1,438,702 7.9%
Total net position 63,909,609 63,249,481 62,264,073 660,128 1.0%
Total liabilities and net position 120,746,659$ 121,878,067$ 122,568,445$ (1,131,408)$ -0.9%
Variance (2015 vs. 2014)
COMBINED UTILITY SYSTEM OF EASLEY
CONDENSED STATEMENTS OF NET POSITION
MARCH 31
- 8 -
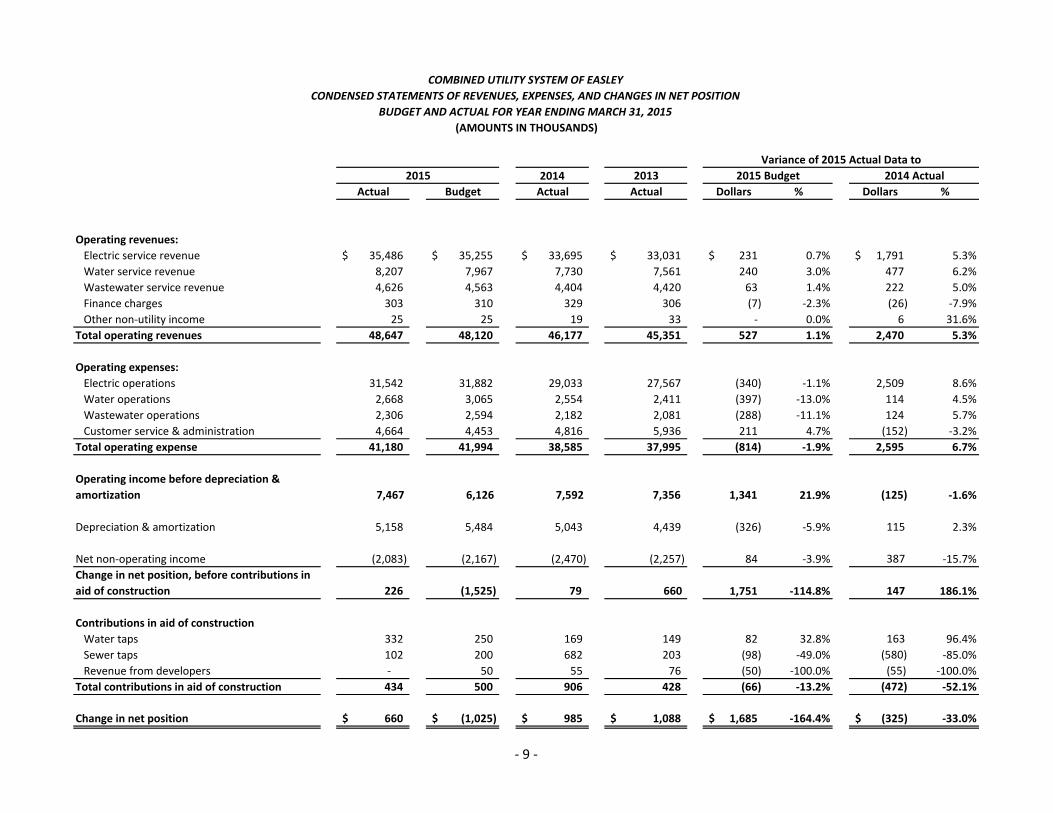
2014 2013
Actual Budget Actual Actual Dollars % Dollars %
Operating revenues:
Electric service revenue 35,486$ 35,255$ 33,695$ 33,031$ 231$ 0.7% 1,791$ 5.3%
Water service revenue 8,207 7,967 7,730 7,561 240 3.0% 477 6.2%
Wastewater service revenue 4,626 4,563 4,404 4,420 63 1.4% 222 5.0%
Finance charges 303 310 329 306 (7) -2.3% (26) -7.9%
Other non-utility income 25 25 19 33 - 0.0% 6 31.6%
Total operating revenues 48,647 48,120 46,177 45,351 527 1.1% 2,470 5.3%
Operating expenses:
Electric operations 31,542 31,882 29,033 27,567 (340) -1.1% 2,509 8.6%
Water operations 2,668 3,065 2,554 2,411 (397) -13.0% 114 4.5%
Wastewater operations 2,306 2,594 2,182 2,081 (288) -11.1% 124 5.7%
Customer service & administration 4,664 4,453 4,816 5,936 211 4.7% (152) -3.2%
Total operating expense 41,180 41,994 38,585 37,995 (814) -1.9% 2,595 6.7%
Operating income before depreciation &
amortization 7,467 6,126 7,592 7,356 1,341 21.9% (125) -1.6%
Depreciation & amortization 5,158 5,484 5,043 4,439 (326) -5.9% 115 2.3%
Net non-operating income (2,083) (2,167) (2,470) (2,257) 84 -3.9% 387 -15.7%
Change in net position, before contributions in
aid of construction 226 (1,525) 79 660 1,751 -114.8% 147 186.1%
Contributions in aid of construction
Water taps 332 250 169 149 82 32.8% 163 96.4%
Sewer taps 102 200 682 203 (98) -49.0% (580) -85.0%
Revenue from developers - 50 55 76 (50) -100.0% (55) -100.0%
Total contributions in aid of construction 434 500 906 428 (66) -13.2% (472) -52.1%
Change in net position 660$ (1,025)$ 985$ 1,088$ 1,685$ -164.4% (325)$ -33.0%
2015 Budget 2014 Actual
COMBINED UTILITY SYSTEM OF EASLEY
CONDENSED STATEMENTS OF REVENUES, EXPENSES, AND CHANGES IN NET POSITION
BUDGET AND ACTUAL FOR YEAR ENDING MARCH 31, 2015
(AMOUNTS IN THOUSANDS)
Variance of 2015 Actual Data to
2015
- 9 -

- 10 -
RESULTS FROM OPERATIONS
Electric System
The Commission has operated the electric system since 1911. The electric system consists of five delivery points which serve 21 distribution feeder circuits of 7,200/12,470 volts. The System services over 51 square miles. The electric system operates primarily within the City limits, but also serves the community of Dacusville located approximately eight miles north of the City limits. Extension of the electrical system outside the City limits and into newly annexed areas of the City is regulated by the South Carolina Public Service Commission which must approve any reassignment of power suppliers. The City is a member of the American Public Power Association and the South Carolina Association of Municipal Power Systems, a mutual aid agreement with 20 other members which provides for mutual assistance in case of extreme emergencies such as ice storms, tornadoes and hurricanes.
The Commission signed an all requirements power supply contract with the Piedmont Municipal Power Agency (“PMPA”) in 1980 for PMPA to be the System’s sole power supply provider. This contract is in effect until the outstanding debt owed by PMPA is retired, currently in the year 2034, but neither termination nor expiration of the Power Sales Agreement shall affect any accrued liability or obligation thereunder, including, without limitation, the cost of decommissioning the Catawba Project. During the fiscal year ending March 31, 2015, Easley Combined Utilities paid $28,433,257 to PMPA. Through December 31, 2013, PMPA had a contract with Southern Power Company and Southern Company Services, Inc. (together, "Southern Power"), subsidiaries of The Southern Company, to provide power and energy above what was supplied by Catawba. Beginning January 1, 2014, PMPA began receiving its supplemental power and energy requirements from Santee Cooper. Should PMPA’s peak resource demand be greater than the Catawba output of 277 Megawatts ("MW"), Santee Cooper must supply all supplemental demand requirements. The original contract is twelve years, with provisions for extensions beyond the original term. Termination of the supplemental contract with Santee Cooper requires a ten year notice. Also beginning on January 1, 2014 is a contract between PMPA and Duke Energy whereby Duke Energy provides all backstand requirements for PMPA’s share of Catawba. The Commission also purchases power from the Southeastern Power Administration ("SEPA"), an agency of the U.S. Department of Energy and paid $757,389 to SEPA during FY 2015 for power and energy.
In 1993, the Commission constructed a peak shaving generation facility that allows the System to provide for a portion of its load during times of its peak. The capacity of the peak shaving facility is 6,400 kilowatts ("kW"). In 2008, the Utility added a 4.5 MW generator for emergency back-up and peak shaving. Beginning in January 2014, with the start of the Santee Cooper supplemental power contract with PMPA, the peak shaving generation is dispatched and operated based on the requirements of Santee Cooper. In return for this generation being available for dispatch, the Utility receives a monthly capacity credit. During FY 2015 the Utility received a reduction of $462,748 in power supply costs for having this generation available.
For fiscal year ending March 31, 2015 electric system revenues increased $1,791,000 over FY 2014
revenues, an increase of 5.3%. Purchased power increased in 2015 by $2,080,000 or 7.7%, over 2014 power costs. PMPA implemented a 4.0% rate increase in May 2015. PMPA has stated that it plans minimal annual increases for the foreseeable future, with rate increases to be based on the economic and market environment at that time.

- 11 -
The 5.3% increase in revenues in FY 2015 is attributable to a 4.0% increase in electric rates in April 2014. Operating revenues for the electrical system were greater than budget for the year by $523,000 while operating expenses were $237,000, or 0.7% greater than budget. Operating revenues in excess of operating expenses were sufficient to support the electrical portion of debt service and capital reinvestment. Electric revenues account for approximately 73% of total system operating revenues. Over 92% of the electric system operating expenses, excluding depreciation and interest, is wholesale power costs, which reflects the May 2014 rate increase from PMPA. Power production expense, including peak generation expense, was 0.9% below budget.
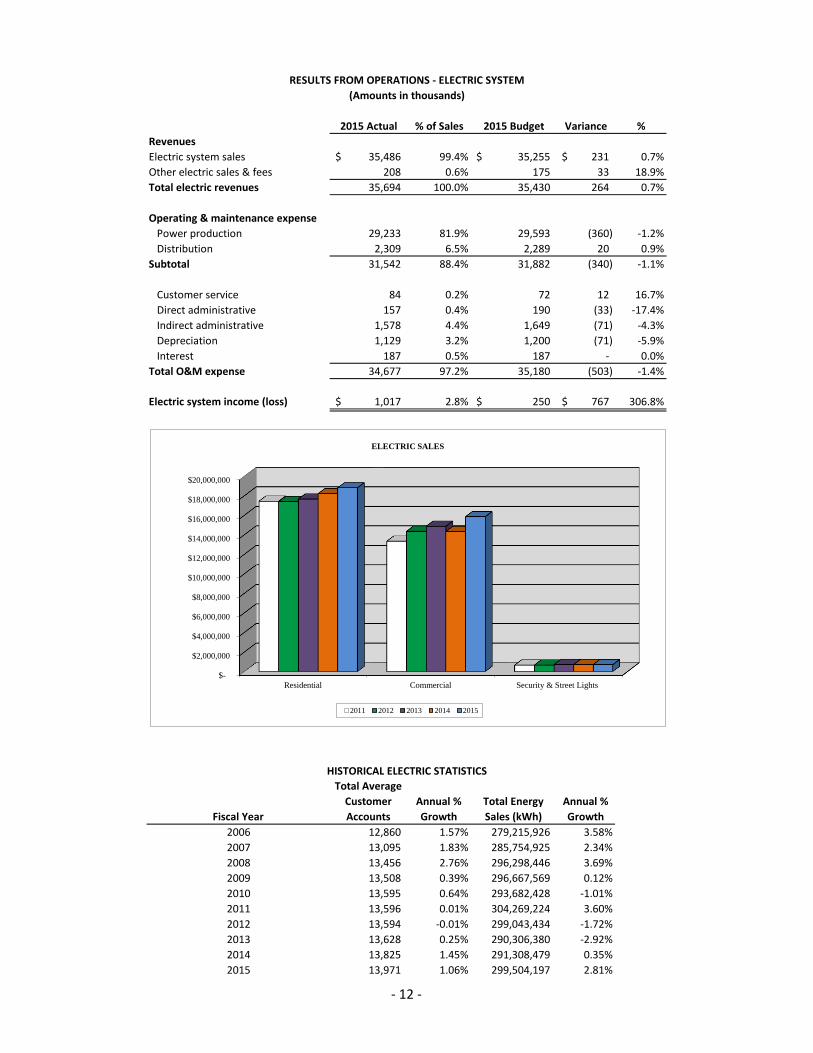
2015 Actual % of Sales 2015 Budget Variance %
Revenues
Electric system sales 35,486$ 99.4% 35,255$ 231$ 0.7%
Other electric sales & fees 208 0.6% 175 33 18.9%
Total electric revenues 35,694 100.0% 35,430 264 0.7%
Operating & maintenance expense
Power production 29,233 81.9% 29,593 (360) -1.2%
Distribution 2,309 6.5% 2,289 20 0.9%
Subtotal 31,542 88.4% 31,882 (340) -1.1%
Customer service 84 0.2% 72 12 16.7%
Direct administrative 157 0.4% 190 (33) -17.4%
Indirect administrative 1,578 4.4% 1,649 (71) -4.3%
Depreciation 1,129 3.2% 1,200 (71) -5.9%
Interest 187 0.5% 187 - 0.0%
Total O&M expense 34,677 97.2% 35,180 (503) -1.4%
Electric system income (loss) 1,017$ 2.8% 250$ 767$ 306.8%
Fiscal Year
Total Average
Customer
Accounts
Annual %
Growth
Total Energy
Sales (kWh)
Annual %
Growth
2006 12,860 1.57% 279,215,926 3.58%
2007 13,095 1.83% 285,754,925 2.34%
2008 13,456 2.76% 296,298,446 3.69%
2009 13,508 0.39% 296,667,569 0.12%
2010 13,595 0.64% 293,682,428 -1.01%
2011 13,596 0.01% 304,269,224 3.60%
2012 13,594 -0.01% 299,043,434 -1.72%
2013 13,628 0.25% 290,306,380 -2.92%
2014 13,825 1.45% 291,308,479 0.35%
2015 13,971 1.06% 299,504,197 2.81%
RESULTS FROM OPERATIONS - ELECTRIC SYSTEM
(Amounts in thousands)
HISTORICAL ELECTRIC STATISTICS
$-
$2,000,000
$4,000,000
$6,000,000
$8,000,000
$10,000,000
$12,000,000
$14,000,000
$16,000,000
$18,000,000
$20,000,000
Residential Commercial Security & Street Lights
ELECTRIC SALES
2011 2012 2013 2014 2015
- 12 -
- 13 -
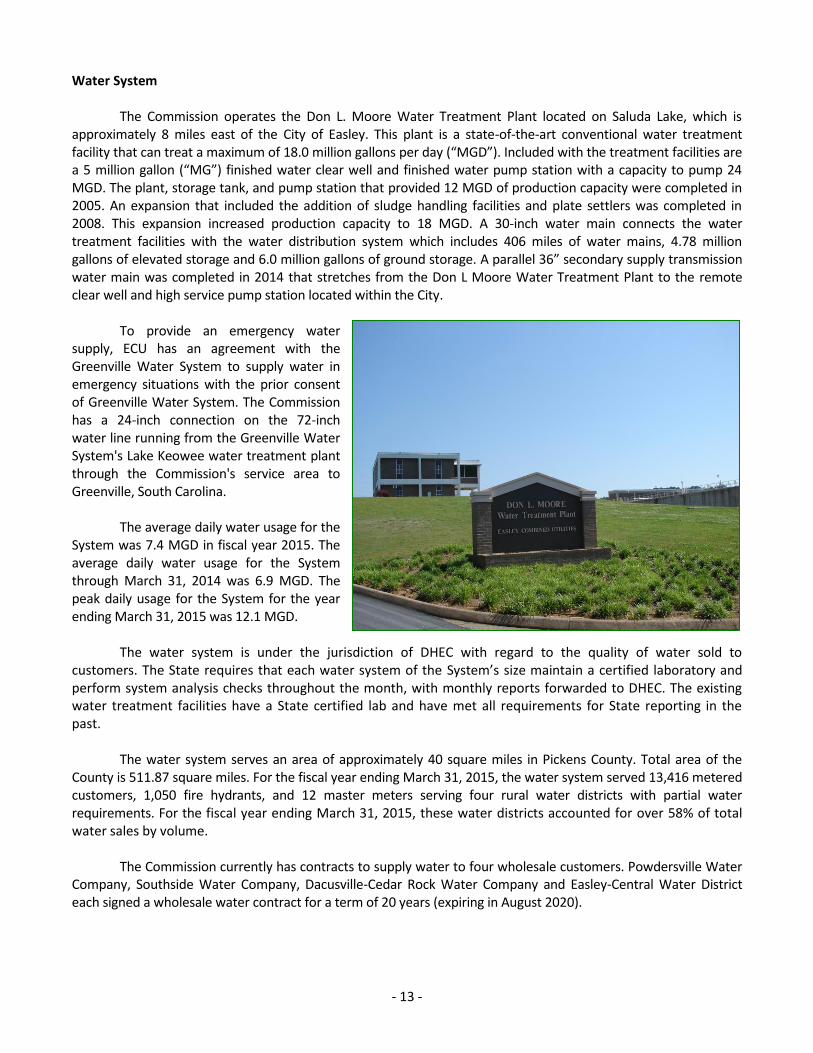
Water System
The Commission operates the Don L. Moore Water Treatment Plant located on Saluda Lake, which is approximately 8 miles east of the City of Easley. This plant is a state-of-the-art conventional water treatment facility that can treat a maximum of 18.0 million gallons per day (“MGD”). Included with the treatment facilities are a 5 million gallon (“MG”) finished water clear well and finished water pump station with a capacity to pump 24 MGD. The plant, storage tank, and pump station that provided 12 MGD of production capacity were completed in 2005. An expansion that included the addition of sludge handling facilities and plate settlers was completed in 2008. This expansion increased production capacity to 18 MGD. A 30-inch water main connects the water treatment facilities with the water distribution system which includes 406 miles of water mains, 4.78 million gallons of elevated storage and 6.0 million gallons of ground storage. A parallel 36” secondary supply transmission water main was completed in 2014 that stretches from the Don L Moore Water Treatment Plant to the remote clear well and high service pump station located within the City.
To provide an emergency water supply, ECU has an agreement with the Greenville Water System to supply water in emergency situations with the prior consent of Greenville Water System. The Commission has a 24-inch connection on the 72-inch water line running from the Greenville Water System's Lake Keowee water treatment plant through the Commission's service area to Greenville, South Carolina.
The average daily water usage for the System was 7.4 MGD in fiscal year 2015. The average daily water usage for the System through March 31, 2014 was 6.9 MGD. The peak daily usage for the System for the year ending March 31, 2015 was 12.1 MGD.
The water system is under the jurisdiction of DHEC with regard to the quality of water sold to customers. The State requires that each water system of the System’s size maintain a certified laboratory and perform system analysis checks throughout the month, with monthly reports forwarded to DHEC. The existing water treatment facilities have a State certified lab and have met all requirements for State reporting in the past.
The water system serves an area of approximately 40 square miles in Pickens County. Total area of the County is 511.87 square miles. For the fiscal year ending March 31, 2015, the water system served 13,416 metered customers, 1,050 fire hydrants, and 12 master meters serving four rural water districts with partial water requirements. For the fiscal year ending March 31, 2015, these water districts accounted for over 58% of total water sales by volume.
The Commission currently has contracts to supply water to four wholesale customers. Powdersville Water Company, Southside Water Company, Dacusville-Cedar Rock Water Company and Easley-Central Water District each signed a wholesale water contract for a term of 20 years (expiring in August 2020).

- 14 -
For the year ending March 31, 2015, water system revenues increased 6.2% or $477,000 from fiscal year 2014. For the year ending March 31, 2015 water system expenses were $114,000 higher than FY 2014. Operating revenues were $354,000 above budget and exceeded operating expenses by $5.5 million, and were sufficient to support its portion of debt service and capital reinvestment. Water rates were increased by 4.0% in April 2014 for residential and commercial customers. In FY 2014 the water treatment plant produced 2,521,809,000 gallons and in FY 2015 the water treatment plant produced 2,720,381,000 gallons.
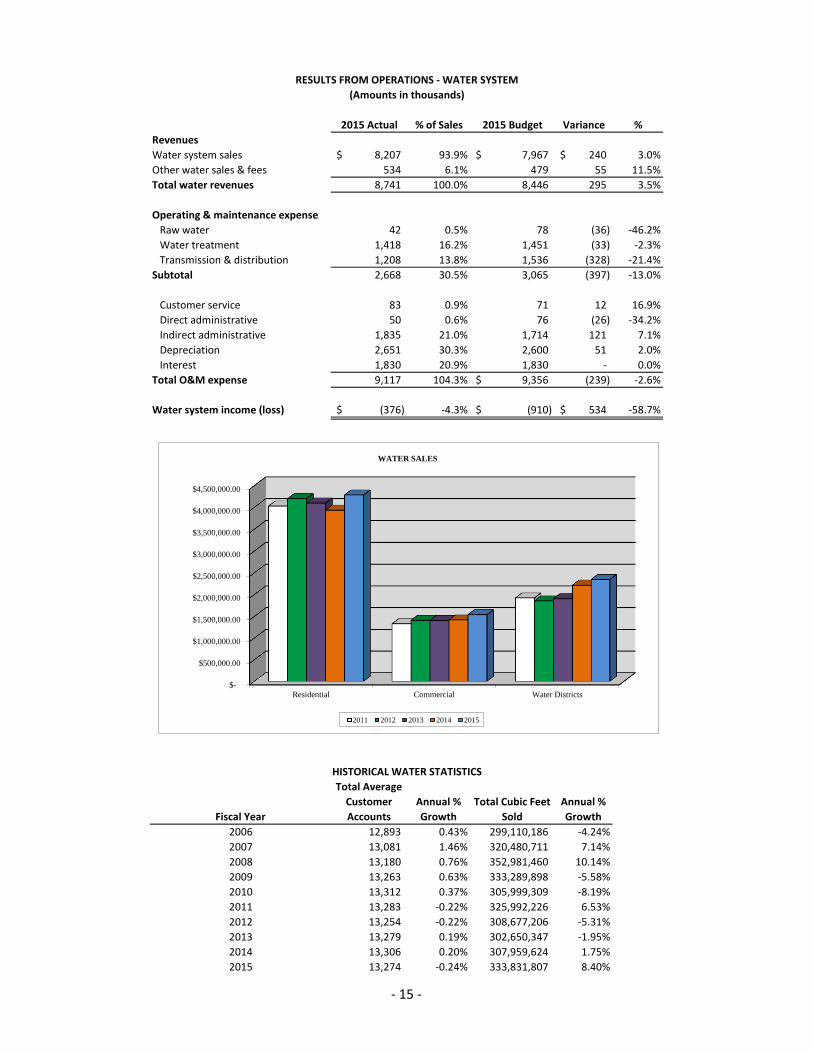
2015 Actual % of Sales 2015 Budget Variance %
Revenues
Water system sales 8,207$ 93.9% 7,967$ 240$ 3.0%
Other water sales & fees 534 6.1% 479 55 11.5%
Total water revenues 8,741 100.0% 8,446 295 3.5%
Operating & maintenance expense
Raw water 42 0.5% 78 (36) -46.2%
Water treatment 1,418 16.2% 1,451 (33) -2.3%
Transmission & distribution 1,208 13.8% 1,536 (328) -21.4%
Subtotal 2,668 30.5% 3,065 (397) -13.0%
Customer service 83 0.9% 71 12 16.9%
Direct administrative 50 0.6% 76 (26) -34.2%
Indirect administrative 1,835 21.0% 1,714 121 7.1%
Depreciation 2,651 30.3% 2,600 51 2.0%
Interest 1,830 20.9% 1,830 - 0.0%
Total O&M expense 9,117 104.3% 9,356$ (239) -2.6%
Water system income (loss) (376)$ -4.3% (910)$ 534$ -58.7%
Fiscal Year
Total Average
Customer
Accounts
Annual %
Growth
Total Cubic Feet
Sold
Annual %
Growth
2006 12,893 0.43% 299,110,186 -4.24%
2007 13,081 1.46% 320,480,711 7.14%
2008 13,180 0.76% 352,981,460 10.14%
2009 13,263 0.63% 333,289,898 -5.58%
2010 13,312 0.37% 305,999,309 -8.19%
2011 13,283 -0.22% 325,992,226 6.53%
2012 13,254 -0.22% 308,677,206 -5.31%
2013 13,279 0.19% 302,650,347 -1.95%
2014 13,306 0.20% 307,959,624 1.75%
2015 13,274 -0.24% 333,831,807 8.40%
RESULTS FROM OPERATIONS - WATER SYSTEM
(Amounts in thousands)
HISTORICAL WATER STATISTICS
$-
$500,000.00
$1,000,000.00
$1,500,000.00
$2,000,000.00
$2,500,000.00
$3,000,000.00
$3,500,000.00
$4,000,000.00
$4,500,000.00
Residential Commercial Water Districts
WATER SALES
2011 2012 2013 2014 2015
- 15 -
- 16 -
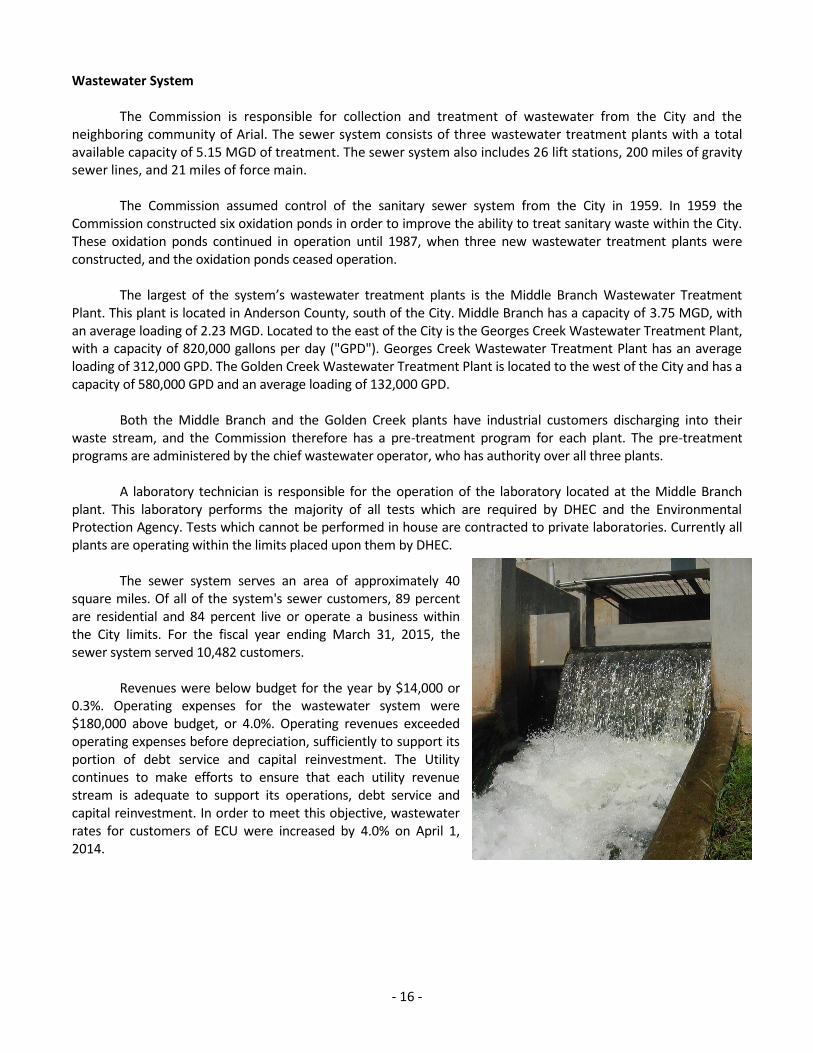
Wastewater System
The Commission is responsible for collection and treatment of wastewater from the City and the neighboring community of Arial. The sewer system consists of three wastewater treatment plants with a total available capacity of 5.15 MGD of treatment. The sewer system also includes 26 lift stations, 200 miles of gravity sewer lines, and 21 miles of force main.
The Commission assumed control of the sanitary sewer system from the City in 1959. In 1959 the Commission constructed six oxidation ponds in order to improve the ability to treat sanitary waste within the City. These oxidation ponds continued in operation until 1987, when three new wastewater treatment plants were constructed, and the oxidation ponds ceased operation.
The largest of the system’s wastewater treatment plants is the Middle Branch Wastewater Treatment Plant. This plant is located in Anderson County, south of the City. Middle Branch has a capacity of 3.75 MGD, with an average loading of 2.23 MGD. Located to the east of the City is the Georges Creek Wastewater Treatment Plant, with a capacity of 820,000 gallons per day ("GPD"). Georges Creek Wastewater Treatment Plant has an average loading of 312,000 GPD. The Golden Creek Wastewater Treatment Plant is located to the west of the City and has a capacity of 580,000 GPD and an average loading of 132,000 GPD.
Both the Middle Branch and the Golden Creek plants have industrial customers discharging into their waste stream, and the Commission therefore has a pre-treatment program for each plant. The pre-treatment programs are administered by the chief wastewater operator, who has authority over all three plants.
A laboratory technician is responsible for the operation of the laboratory located at the Middle Branch plant. This laboratory performs the majority of all tests which are required by DHEC and the Environmental Protection Agency. Tests which cannot be performed in house are contracted to private laboratories. Currently all plants are operating within the limits placed upon them by DHEC.
The sewer system serves an area of approximately 40 square miles. Of all of the system's sewer customers, 89 percent are residential and 84 percent live or operate a business within the City limits. For the fiscal year ending March 31, 2015, the sewer system served 10,482 customers.
Revenues were below budget for the year by $14,000 or
0.3%. Operating expenses for the wastewater system were $180,000 above budget, or 4.0%. Operating revenues exceeded operating expenses before depreciation, sufficiently to support its portion of debt service and capital reinvestment. The Utility continues to make efforts to ensure that each utility revenue stream is adequate to support its operations, debt service and capital reinvestment. In order to meet this objective, wastewater rates for customers of ECU were increased by 4.0% on April 1, 2014.
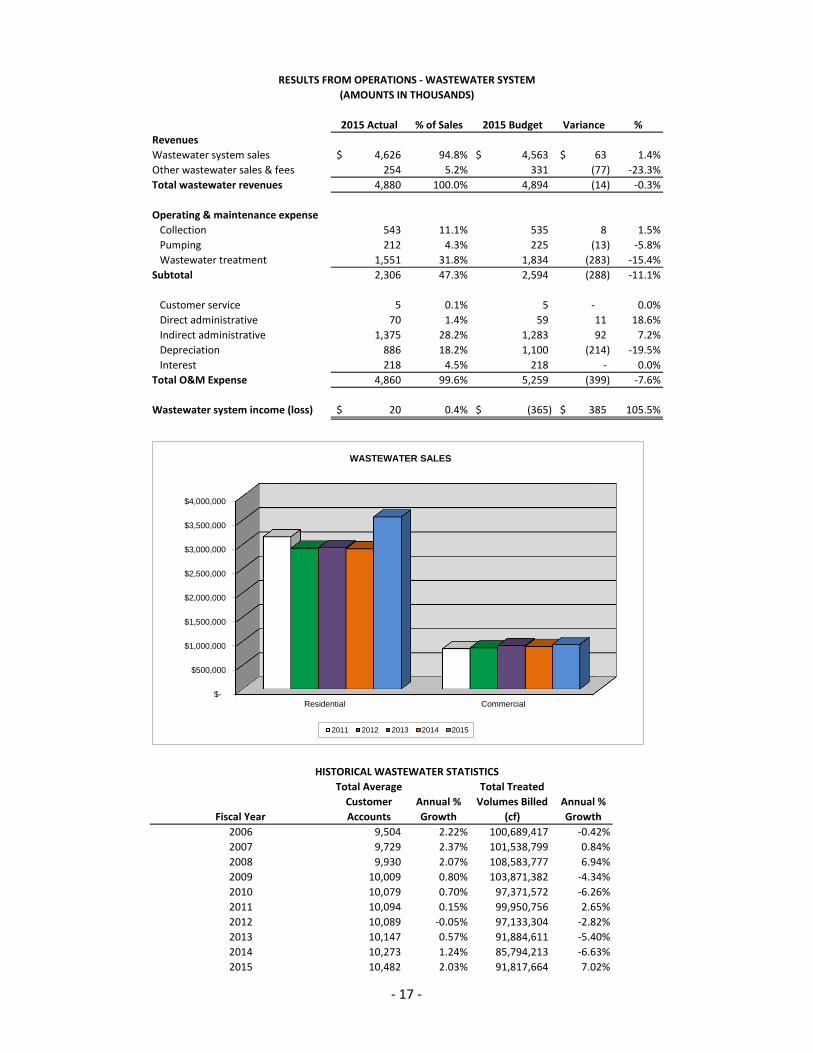
2015 Actual % of Sales 2015 Budget Variance %
Revenues
Wastewater system sales 4,626$ 94.8% 4,563$ 63$ 1.4%
Other wastewater sales & fees 254 5.2% 331 (77) -23.3%
Total wastewater revenues 4,880 100.0% 4,894 (14) -0.3%
Operating & maintenance expense
Collection 543 11.1% 535 8 1.5%
Pumping 212 4.3% 225 (13) -5.8%
Wastewater treatment 1,551 31.8% 1,834 (283) -15.4%
Subtotal 2,306 47.3% 2,594 (288) -11.1%
Customer service 5 0.1% 5 - 0.0%
Direct administrative 70 1.4% 59 11 18.6%
Indirect administrative 1,375 28.2% 1,283 92 7.2%
Depreciation 886 18.2% 1,100 (214) -19.5%
Interest 218 4.5% 218 - 0.0%
Total O&M Expense 4,860 99.6% 5,259 (399) -7.6%
Wastewater system income (loss) 20$ 0.4% (365)$ 385$ 105.5%
Fiscal Year
Total Average
Customer
Accounts
Annual %
Growth
Total Treated
Volumes Billed
(cf)
Annual %
Growth
2006 9,504 2.22% 100,689,417 -0.42%
2007 9,729 2.37% 101,538,799 0.84%
2008 9,930 2.07% 108,583,777 6.94%
2009 10,009 0.80% 103,871,382 -4.34%
2010 10,079 0.70% 97,371,572 -6.26%
2011 10,094 0.15% 99,950,756 2.65%
2012 10,089 -0.05% 97,133,304 -2.82%
2013 10,147 0.57% 91,884,611 -5.40%
2014 10,273 1.24% 85,794,213 -6.63%
2015 10,482 2.03% 91,817,664 7.02%
RESULTS FROM OPERATIONS - WASTEWATER SYSTEM
(AMOUNTS IN THOUSANDS)
HISTORICAL WASTEWATER STATISTICS
$-
$500,000
$1,000,000
$1,500,000
$2,000,000
$2,500,000
$3,000,000
$3,500,000
$4,000,000
Residential Commercial
WASTEWATER SALES
2011 2012 2013 2014 2015
- 17 -
- 18 -
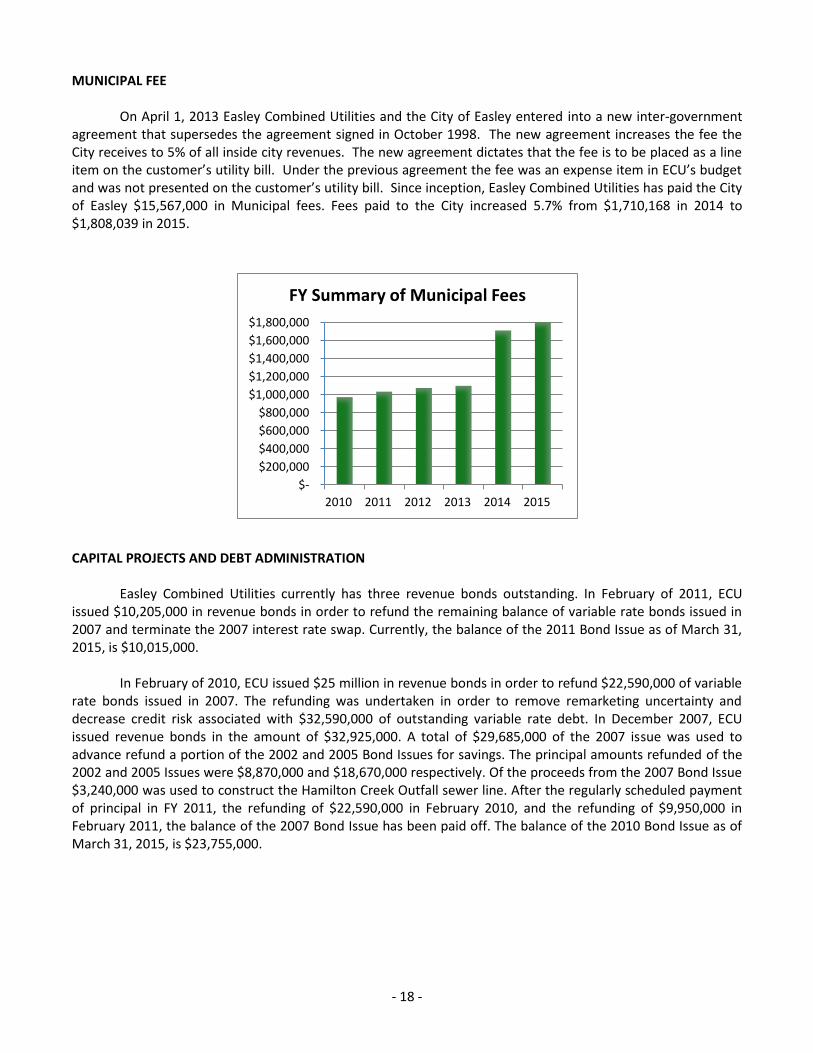
MUNICIPAL FEE
On April 1, 2013 Easley Combined Utilities and the City of Easley entered into a new inter-government agreement that supersedes the agreement signed in October 1998. The new agreement increases the fee the City receives to 5% of all inside city revenues. The new agreement dictates that the fee is to be placed as a line item on the customer’s utility bill. Under the previous agreement the fee was an expense item in ECU’s budget and was not presented on the customer’s utility bill. Since inception, Easley Combined Utilities has paid the City of Easley $15,567,000 in Municipal fees. Fees paid to the City increased 5.7% from $1,710,168 in 2014 to $1,808,039 in 2015.
$-
$200,000
$400,000
$600,000
$800,000
$1,000,000
$1,200,000
$1,400,000
$1,600,000
$1,800,000
2010 2011 2012 2013 2014 2015
FY Summary of Municipal Fees
CAPITAL PROJECTS AND DEBT ADMINISTRATION
Easley Combined Utilities currently has three revenue bonds outstanding. In February of 2011, ECU issued $10,205,000 in revenue bonds in order to refund the remaining balance of variable rate bonds issued in 2007 and terminate the 2007 interest rate swap. Currently, the balance of the 2011 Bond Issue as of March 31, 2015, is $10,015,000.
In February of 2010, ECU issued $25 million in revenue bonds in order to refund $22,590,000 of variable rate bonds issued in 2007. The refunding was undertaken in order to remove remarketing uncertainty and decrease credit risk associated with $32,590,000 of outstanding variable rate debt. In December 2007, ECU issued revenue bonds in the amount of $32,925,000. A total of $29,685,000 of the 2007 issue was used to advance refund a portion of the 2002 and 2005 Bond Issues for savings. The principal amounts refunded of the 2002 and 2005 Issues were $8,870,000 and $18,670,000 respectively. Of the proceeds from the 2007 Bond Issue $3,240,000 was used to construct the Hamilton Creek Outfall sewer line. After the regularly scheduled payment of principal in FY 2011, the refunding of $22,590,000 in February 2010, and the refunding of $9,950,000 in February 2011, the balance of the 2007 Bond Issue has been paid off. The balance of the 2010 Bond Issue as of March 31, 2015, is $23,755,000.
- 19 -
The 2005 Bond Issue provided $18.5 million to invest in capital infrastructure, with the balance of the proceeds, $18.76 million, being used to advance refund portions of the 1999 and 2002 Bond Issue. The 1999 Revenue Bond Issue was an $8 million revenue bond issued in June 1999. After the advance refunding of $5,655,000 of outstanding principal in April 2005 and the payment of regularly scheduled principal on December 1, 2009, the 1999 Bond Issue has been paid off.
The proceeds of the 2005 Bond Issue, $18.5 million, were used for the expansion of the Don L. Moore facility to 18 MGD, the construction of a 1 MG elevated water storage tank, the construction of a 5 MG ground level water storage tank, and the dredging of Saluda Lake. In addition, several water distribution lines are planned for construction using proceeds from this issue. After the regularly scheduled payment of principal and the advanced refunding of $18,670,000 in December 2007, the balance of the 2005 Bond Issue as of March 31, 2015, is $15,375,000.
In July of 2002, Easley Combined Utilities issued Revenue Bond Series 2002 for approximately $27.8 million. The proceeds from these issues were used primarily for the construction of the 12 MGD Don L. Moore Water Treatment Plant, high service pump station, finished water clear well, and finished water pump station. After advanced refunding $12,320,000 of the outstanding principal in April 2005 and $8,870,000 in December 2007, and the payment of regularly scheduled principal during 2013, the 2002 Bond Issue was paid in full as of March 31, 2013.
In March of 2011, Easley Combined Utilities entered into a loan agreement with the State Revolving Fund for an amount not to exceed $2,519,014. The proceeds of the loan were used for the planning, design and construction of a portion of the secondary supply transmission main beginning at the water treatment plant. The balance of the loan as of March 31, 2015, is $2,002,115.
The Commission utilizes independent engineering firms from time to time to develop capital improvement master plans for each component of the System. The most recently prepared studies (the "System Studies") each evaluated the applicable system condition and capacity and anticipated demand growth over a 20-year planning period and set forth recommendations of capital proceeds to address system needs and growth. The Commission utilizes the System Studies in its long-term planning and budgetary efforts.
See Note 7 in the accompanying notes to basic financial statements for additional discussion of long-term debt activity.
- 20 -
Recent Capital Improvements
The Commission upgrades and expands the System on an ongoing basis. The following table indicates the use of proceeds from long-term debt incurred to leverage the cost of these improvements and the amounts of moneys from operations of the System which were used for capital improvement purposes over the past five fiscal years. Generally consistent with its past practice, the Commission expects to use System earnings to pay for approximately $2,200,000 of the total capital expenditures to be undertaken in each future fiscal year.
Fiscal year ended
March 31,
Financed by long-term
debt
Provided from operations
and reserves Total construction
expenses
2011 1,645,848 2,971,759 4,617,607
2012 4,363,067 3,576,688 7,939,755
2013 4,469,126 4,339,209 8,808,335
2014 267,849 2,990,128 3,257,977
2015 649,382 2,573,163 3,177,972
The following are some of the items included in the capital expenditures for Fiscal Year 2015:
Land acquisition, site preparation, and design work on construction of an electric substation.
Completed installation of underground electric service on Rock Springs Rd.
Completed construction of a water transmission line on Crestview Rd.
Design and initial construction of replacement sewer lines in the West End and George’s Creek.
Installation and implementation of enterprise-wide software solution.
See Note 5 in the accompanying notes to basic financial statements for additional discussion of capital asset activity. BUDGETARY PROCESS – RATE SETTING
A budget for each fiscal year, April to March, is prepared during the last quarter of each calendar year by the General Manager, the Finance Manager and staff. The proposed budget is presented to the Commission at a workshop each February. The budgeting process begins with revenue projections. Usage by customer class is estimated in order to arrive at a monthly revenue budget. Estimated consumption is based on normal temperatures and precipitation. The Utility periodically monitors whether revenue levels in each of the units of the System are adequate to cover necessary operating expenses, debt service, franchise equivalent fees and capital replacements. If estimated revenue levels are insufficient, the General Manager will determine, with concurrence by the Commission, whether a rate increase or a budget adjustment is warranted, and commission a rate evaluation by either staff or outside consultants. Purchased power and water, salaries, materials, chemicals and other operating expenses are then budgeted. Capital expenditures and debt service are then budgeted with the remaining funds. The General Manager, Finance Manager and superintendents all provide input to determine the total budget. After the evaluation is completed, it is presented to the Commission for consideration and possible action. The length of time from the determination of a need for a rate increase to implementation can be from three to six months. Along with the budget preparation, a five year pro-forma projection is prepared annually for planning purposes.
- 21 -
CONTACTING THE UTILITY’S GENERAL MANAGER
These financial statements are designed to provide our customers, creditors and bondholders with a general overview of the financial status of Easley Combined Utilities. If you have any further questions about this report, or need further information, please contact the General Manager, Easley Combined Utilities, PO Box 619, Easley, SC 29641 or by e-mail at [email protected]. FINAL COMMENTS
Easley Combined Utilities remains committed to providing the best possible water, wastewater and electric service to the residents of Easley, South Carolina and surrounding areas. The Utility continues to strive to conserve costs without sacrificing service, reliability, or quality. Strategic efforts are being made to ensure future electric and water supplies are available for coming generations. Continued capital investments are being made to meet and exceed customer expectations. Growth will continue to challenge us to meet the wastewater treatment needs of the area. As is evident by strong bond ratings, Easley Combined Utilities continues to remain financially sound and is committed to meeting the challenges and needs of the coming years.
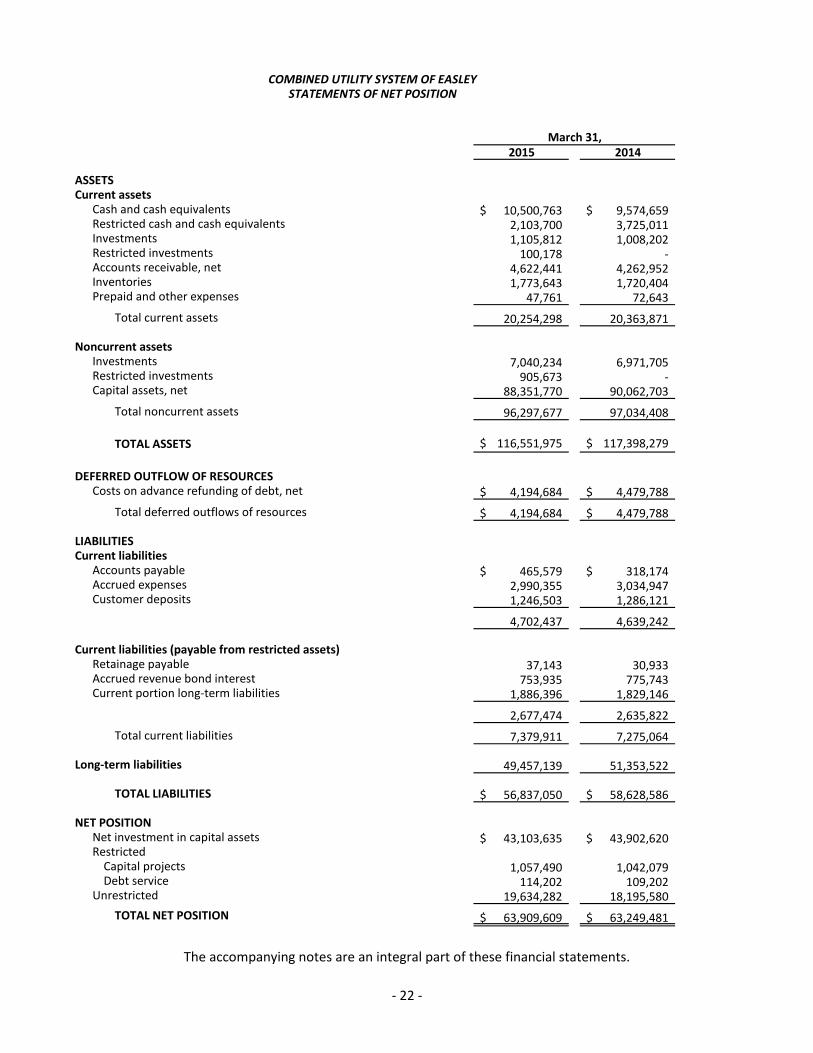
2015 2014
Current assetsCash and cash equivalents 10,500,763$ 9,574,659$ Restricted cash and cash equivalents 2,103,700 3,725,011 Investments 1,105,812 1,008,202 Restricted investments 100,178 - Accounts receivable, net 4,622,441 4,262,952 Inventories 1,773,643 1,720,404 Prepaid and other expenses 47,761 72,643
Total current assets 20,254,298 20,363,871
Noncurrent assetsInvestments 7,040,234 6,971,705 Restricted investments 905,673 - Capital assets, net 88,351,770 90,062,703
Total noncurrent assets 96,297,677 97,034,408
TOTAL ASSETS 116,551,975$ 117,398,279$
DEFERRED OUTFLOW OF RESOURCESCosts on advance refunding of debt, net 4,194,684$ 4,479,788$
Total deferred outflows of resources 4,194,684$ 4,479,788$
Current liabilitiesAccounts payable 465,579$ 318,174$ Accrued expenses 2,990,355 3,034,947 Customer deposits 1,246,503 1,286,121
4,702,437 4,639,242
Current liabilities (payable from restricted assets)Retainage payable 37,143 30,933 Accrued revenue bond interest 753,935 775,743 Current portion long-term liabilities 1,886,396 1,829,146
2,677,474 2,635,822
Total current liabilities 7,379,911 7,275,064
Long-term liabilities 49,457,139 51,353,522
TOTAL LIABILITIES 56,837,050$ 58,628,586$
NET POSITIONNet investment in capital assets 43,103,635$ 43,902,620$ Restricted
Capital projects 1,057,490 1,042,079 Debt service 114,202 109,202
Unrestricted 19,634,282 18,195,580
TOTAL NET POSITION 63,909,609$ 63,249,481$
March 31,
LIABILITIES
ASSETS
COMBINED UTILITY SYSTEM OF EASLEYSTATEMENTS OF NET POSITION
The accompanying notes are an integral part of these financial statements.
- 22 -
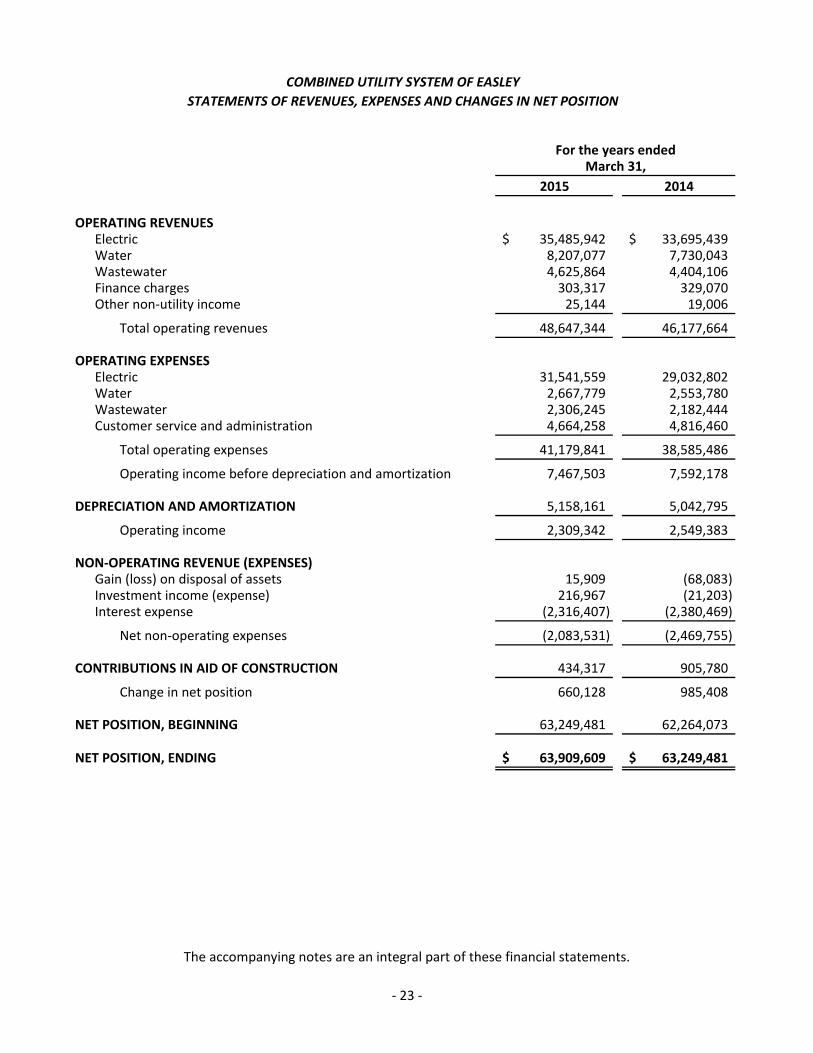
2015 2014
OPERATING REVENUESElectric 35,485,942$ 33,695,439$ Water 8,207,077 7,730,043 Wastewater 4,625,864 4,404,106 Finance charges 303,317 329,070 Other non-utility income 25,144 19,006
Total operating revenues 48,647,344 46,177,664
OPERATING EXPENSESElectric 31,541,559 29,032,802 Water 2,667,779 2,553,780 Wastewater 2,306,245 2,182,444 Customer service and administration 4,664,258 4,816,460
Total operating expenses 41,179,841 38,585,486
Operating income before depreciation and amortization 7,467,503 7,592,178
DEPRECIATION AND AMORTIZATION 5,158,161 5,042,795
Operating income 2,309,342 2,549,383
NON-OPERATING REVENUE (EXPENSES)Gain (loss) on disposal of assets 15,909 (68,083) Investment income (expense) 216,967 (21,203) Interest expense (2,316,407) (2,380,469)
Net non-operating expenses (2,083,531) (2,469,755)
CONTRIBUTIONS IN AID OF CONSTRUCTION 434,317 905,780
Change in net position 660,128 985,408
NET POSITION, BEGINNING 63,249,481 62,264,073
NET POSITION, ENDING 63,909,609$ 63,249,481$
COMBINED UTILITY SYSTEM OF EASLEY
STATEMENTS OF REVENUES, EXPENSES AND CHANGES IN NET POSITION
For the years endedMarch 31,
The accompanying notes are an integral part of these financial statements.
- 23 -
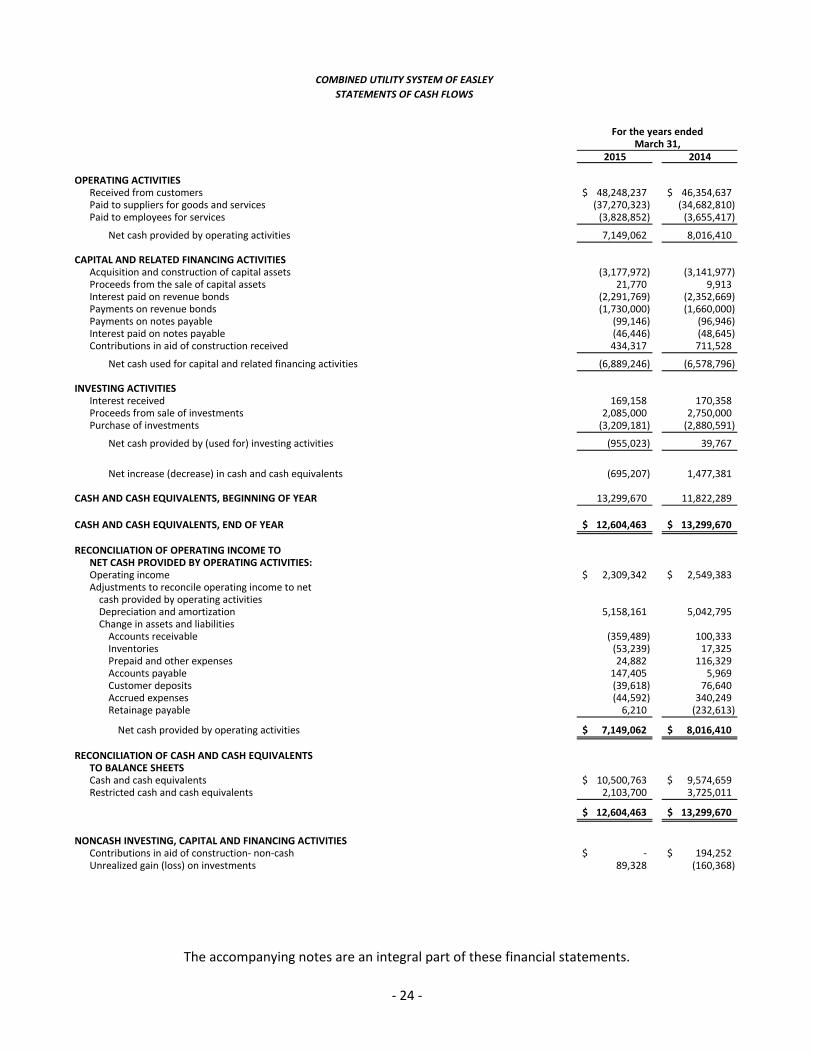
2015 2014
OPERATING ACTIVITIESReceived from customers 48,248,237$ 46,354,637$ Paid to suppliers for goods and services (37,270,323) (34,682,810) Paid to employees for services (3,828,852) (3,655,417)
Net cash provided by operating activities 7,149,062 8,016,410
CAPITAL AND RELATED FINANCING ACTIVITIESAcquisition and construction of capital assets (3,177,972) (3,141,977) Proceeds from the sale of capital assets 21,770 9,913 Interest paid on revenue bonds (2,291,769) (2,352,669) Payments on revenue bonds (1,730,000) (1,660,000) Payments on notes payable (99,146) (96,946) Interest paid on notes payable (46,446) (48,645) Contributions in aid of construction received 434,317 711,528
Net cash used for capital and related financing activities (6,889,246) (6,578,796)
INVESTING ACTIVITIESInterest received 169,158 170,358 Proceeds from sale of investments 2,085,000 2,750,000 Purchase of investments (3,209,181) (2,880,591)
Net cash provided by (used for) investing activities (955,023) 39,767
Net increase (decrease) in cash and cash equivalents (695,207) 1,477,381
CASH AND CASH EQUIVALENTS, BEGINNING OF YEAR 13,299,670 11,822,289
CASH AND CASH EQUIVALENTS, END OF YEAR 12,604,463$ 13,299,670$
RECONCILIATION OF OPERATING INCOME TONET CASH PROVIDED BY OPERATING ACTIVITIES:Operating income 2,309,342$ 2,549,383$ Adjustments to reconcile operating income to net
cash provided by operating activitiesDepreciation and amortization 5,158,161 5,042,795 Change in assets and liabilities
Accounts receivable (359,489) 100,333 Inventories (53,239) 17,325 Prepaid and other expenses 24,882 116,329 Accounts payable 147,405 5,969 Customer deposits (39,618) 76,640 Accrued expenses (44,592) 340,249 Retainage payable 6,210 (232,613)
Net cash provided by operating activities 7,149,062$ 8,016,410$
RECONCILIATION OF CASH AND CASH EQUIVALENTS TO BALANCE SHEETSCash and cash equivalents 10,500,763$ 9,574,659$ Restricted cash and cash equivalents 2,103,700 3,725,011
12,604,463$ 13,299,670$
NONCASH INVESTING, CAPITAL AND FINANCING ACTIVITIESContributions in aid of construction- non-cash -$ 194,252$ Unrealized gain (loss) on investments 89,328 (160,368)
For the years endedMarch 31,
COMBINED UTILITY SYSTEM OF EASLEY
STATEMENTS OF CASH FLOWS
The accompanying notes are an integral part of these financial statements.
- 24 -
- 25 -
COMBINED UTILITY SYSTEM OF EASLEY NOTES TO BASIC FINANCIAL STATEMENTS
NOTE 1 - SUMMARY OF SIGNIFICANT ACCOUNTING POLICIES AND ACTIVITIES
Business activity The Combined Utility System of Easley (the “Utility”) is a municipally-owned and operated utility established in 1911 to supply the City of Easley with water and electricity. Wastewater service was added in 1959.
Reporting entity
The accompanying financial statements present the activities of the Utility including its electricity, water, and wastewater operations. The Utility is governed by a Commission consisting of three members who are elected by the public and have decision-making abilities such as the ability to increase rates, the power to designate management, the ability to significantly influence operations, and primary accountability for fiscal matters. All operations for which the Utility’s Board of Commissioners is financially accountable have been included in the accompanying financial statements.
Basis of presentation
The Utility accounts for its activities in an enterprise fund. An enterprise fund is a proprietary type fund used to account for operations (a) that are financed and operated in a manner similar to private business enterprises – where the intent of the governing body is that the costs (expenses, including depreciation) of providing goods or services to the general public on a continuing basis be financed or recovered primarily through user charges; or (b) where the governing body has decided that periodic determination of revenues earned, expenses incurred, and/or net income is appropriate for capital maintenance.
Measurement focus and basis of accounting
Measurement focus is a term used to describe which transactions are recorded within the various financial statements. Basis of accounting refers to when transactions are recorded regardless of the measurement focus applied.
The financial statements of the Utility have been prepared in conformity with generally accepted accounting principles as adapted to governmental agencies. The Governmental Accounting Standards Board (“GASB”) is the accepted standard setting body for establishing governmental accounting and financial reporting principles.
The accompanying financial statements are reported using the economic resources measurement focus and the accrual basis of accounting. Revenues are recorded when earned and expenses are recorded when a liability is incurred, regardless of the timing of related cash flows. Proprietary funds distinguish operating revenues and expenses from nonoperating items. Operating revenues and expenses generally result from providing services and producing and delivering goods in connection with a proprietary fund’s principal ongoing operations. The principal operating revenues of the Utility are charges to customers for services. Operating expenses for proprietary funds include the cost to provide services, administrative expenses, and depreciation expense on capital assets. All revenues and expenses not meeting this definition are reported as nonoperating revenues and expenses.
- 26 -
NOTE 1 - SUMMARY OF SIGNIFICANT ACCOUNTING POLICIES AND ACTIVITIES, Continued
Based upon the accounting and reporting standards set forth by GASB, the Utility has opted to apply only those accounting and reporting pronouncements issued by the Financial Accounting Standards Board (“FASB”) subsequent to November 30, 1989 that do not conflict with or contradict GASB pronouncements.
Equity is classified as net position and displayed in three components:
Net investment in capital assets - This component consists of capital assets, net of accumulated depreciation and reduced by the outstanding balances of any bonds, mortgages, notes, or other borrowings that are attributable to the acquisition, construction, or improvement of those assets. If there are significant unspent related debt proceeds at year-end, the portion of the debt attributable to the unspent proceeds is not included in the calculation of net investment in capital assets. Instead, that portion of the debt is included in the same component as the unspent proceeds.
Restricted - This component consists of net positions with constraints placed on their use through external groups imposed by creditors (such as through debt covenants), grantors, contributors, or laws or regulations of other governments or constraints imposed by law through constitutional provisions or enabling legislation.
Unrestricted - This component consists of all other net positions.
Revenues and expenses Operating revenues and expenses are revenues and expenses that result from the ongoing principal operations of the Utility. Operating revenues consist primarily of charges for services. Non-operating revenues and expenses consist of those revenues and expenses that are related to financing and investing types of activities and results from non-exchange transactions or ancillary activities.
Cash and cash equivalents
For the purposes of the statements of cash flows, the Utility considers all highly liquid investments (including restricted assets) with a maturity of three months or less when purchased to be cash equivalents.
Investments
Investments are reported at fair value. The Utility is authorized by state law to invest in:
(1) Obligations of the United States of America and agencies thereof; (2) General obligations of State of South Carolina or any of its political units; (3) Savings and Loan Associations to the extent that the same are insured by an agency of the
federal government; (4) Certificates of deposit where the certificates are collaterally secured by securities of the type
described in (1) and (2) above held by a third party as escrow agent or custodian, of a market value not less than the amount of the certificates of deposit so secured, including interest; provided, however, such collateral shall not be required to the extent the same are insured by an agency of the federal government.
(5) Repurchase agreements when collateralized by securities as set forth in this section.

- 27 -
NOTE 1 - SUMMARY OF SIGNIFICANT ACCOUNTING POLICIES AND ACTIVITIES, Continued
Accounts receivable Accounts receivable consist of amounts owed from customers for services provided including amounts owed for which billings have not been prepared. The allowance for doubtful accounts is based upon prior years’ experience and management’s analysis of the outstanding accounts receivable balances.
Amounts due from federal grants represent reimbursable costs, which have been incurred by the Utility but have not been reimbursed by the grantor agency. Costs under grant programs are recognized as capital expenditures in the period in which they are incurred by the Utility.
Inventories
Inventory consisting of materials and supplies is recorded at average invoice cost and stated at lower of cost or market value.
Restricted assets
Certain cash and cash equivalents are classified as restricted assets on the statements of net position because its use is limited by revenue bond covenants.
When both restricted and unrestricted resources are available for use, it is the Utility’s policy to use restricted resources first, and then unrestricted resources as needed. Restricted assets and liabilities payable from restricted assets current in nature are reported with current assets and current liabilities in the financial statements.
Capital assets
Equipment purchased is capitalized at invoice cost. Extensions and improvements to the Utility system are capitalized at invoice or contract cost if such extensions are not undertaken by the Utility’s personnel. Costs of extensions and improvements undertaken by the Utility’s personnel including materials and labor are capitalized.
Depreciation of buildings, equipment and utility systems has been provided over the assets’ estimated useful lives using the straight-line method. The cost of normal maintenance and repairs that do not add to the value of the asset or extend the asset’s life are expensed as incurred. Major outlays for capital assets and improvements of $1,000 or more are capitalized as projects are constructed.
The estimated useful lives of each class of capital assets are:
Buildings 40 - 50 Equipment 5 - 20
Utility System Wastewater system 3 - 40 Water system 3 - 60 Electric system 5 - 35
- 28 -
NOTE 1 - SUMMARY OF SIGNIFICANT ACCOUNTING POLICIES AND ACTIVITIES, Continued
Long-lived asset impairment The Utility assesses the impairment of intangible and other long-lived assets whenever events or changes in circumstances indicate that the carrying value may not be recoverable. The Utility recognizes an impairment loss on long-lived assets used in operations when events and circumstances indicate that the assets might be impaired and the undiscounted cash flows estimated to be generated by those assets are less than the carrying amounts of these assets. Management determined that there were no impaired assets for the years ending March 31, 2015 or 2014.
Customer deposits
The Utility requires the majority of its residential and commercial customers to provide a deposit against future default on the customer’s account balance. Such deposits are recorded as a liability upon receipt. Residential deposits are refunded to customers after two years of good credit history. Commercial deposits are held until the customer's account is closed.
Bond discount and premium
Bond discounts and premiums are amortized over the life of the respective bonds as increases and decreases, respectively, to interest expense using methods which approximate the effective interest method.
Contributions in aid of construction
Contributions in aid of construction of capital assets consists primarily of cash received from consumers and developers in the form of water and wastewater tap fees, as well as partial reimbursements for the cost of electric, water and wastewater lines in new subdivisions.
Estimates
The preparation of financial statements in conformity with accounting principles generally accepted in the United States of America requires management to make estimates and assumptions that affect the Utility’s financial position and results of operations and disclosure of contingent assets and liabilities. Actual results could differ from these estimates.
Implementation of Governmental Accounting Standards Board Pronouncements
In June 2012, GASB issued Statement No. 68, Accounting and Financial Reporting for Pensions. GASB 68 establishes accounting and financial reporting requirements related to pensions for governments whose employees are provided with pensions through pension plans that are covered by the scope of Statement No. 67, as well as for nonemployer governments that have a legal obligation to contribute to those plans. Statement 67 is effective for financial statements for fiscal years beginning after June 15, 2013. Statement 68 is effective for financial statements for fiscal years beginning after June 15, 2014. Management has not determined the impact on the financial statements when the requirements of these statements are implemented. In February 2015, GASB issued Statement No. 72, Fair Value Measurement and Application. Statement 72 addresses accounting and financial reporting issues related to fair value measurements. The definition of fair value is the price that would be received to sell an asset or paid to transfer a liability in an orderly transaction between market participants at the measurement date. Statement 72 provides guidance for determining a fair value measurement for financial reporting purposes and also provides guidance for applying fair value to certain investments and disclosures related to all fair value measurements. Statement 72 is effective for financial statements for periods beginning after June 15, 2015.

- 29 -
NOTE 1 - SUMMARY OF SIGNIFICANT ACCOUNTING POLICIES AND ACTIVITIES, Continued
Other accounting standards that have been issued or proposed by the GASB or other standards-setting bodies that do not require adoption until a future date are not expected to have a material impact on the financial statements upon adoption.
Reclassifications
Certain items in the prior year have been reclassified to conform with current year presentation. NOTE 2 - CASH AND CASH EQUIVALENTS
As of March 31, 2015 and 2014, the Utility had the following cash and cash equivalents: March 31, 2015 2014
Checking and other cash $ 12,339,966 $ 13,105,251 Money markets - governmental obligations 264,497 194,419
Total cash and cash equivalents 12,604,463 13,299,670 Less restricted amounts 2,103,700 3,725,011
$ 10,500,763 $ 9,574,659
As of March 31, 2015, the Utility had the following investments (all are listed at fair value): Investment maturities (in years) Investment type Fair value less than 1 1 - 5 5 - 10
US Treasury obligations $ 1,912,208 $ - $ 1,912,208 $ - US Government agency obligations 7,239,689 1,205,990 5,834,619 199,080
$ 9,151,897 $ 1,205,990 $ 7,746,827 $ 199,080
As of March 31, 2014, the Utility had the following investments (all are listed at fair value): Investment maturities (in years) Investment type Fair value less than 1 1 - 5 5 - 10
US Treasury obligations $ 2,170,385 $ 706,864 $ 1,463,521 $ - US Government agency obligations 5,809,522 301,338 3,206,650 2,301,534
$ 7,979,907 $ 1,008,202 $ 4,670,171 $ 2,301,534
Interest rate risk The Utility does not have a formal investment policy that limits investment maturities as a means of managing its exposure to fair value losses arising from increasing interest rates.
- 30 -
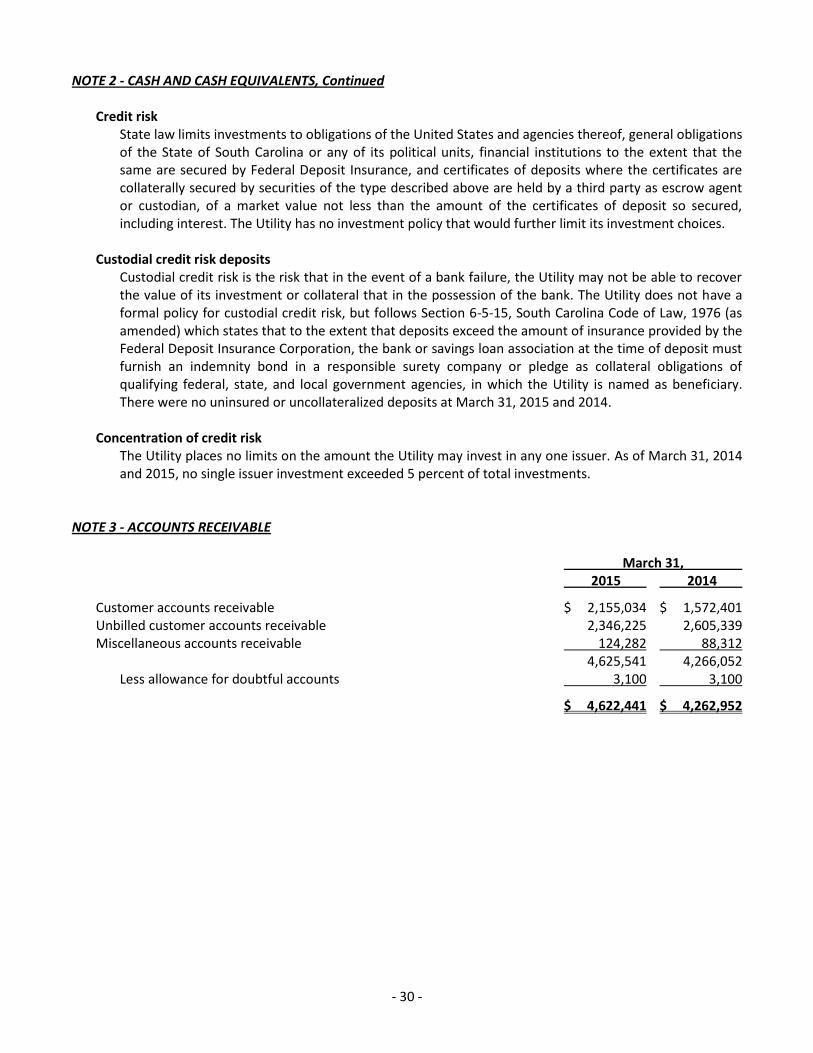
NOTE 2 - CASH AND CASH EQUIVALENTS, Continued
Credit risk State law limits investments to obligations of the United States and agencies thereof, general obligations of the State of South Carolina or any of its political units, financial institutions to the extent that the same are secured by Federal Deposit Insurance, and certificates of deposits where the certificates are collaterally secured by securities of the type described above are held by a third party as escrow agent or custodian, of a market value not less than the amount of the certificates of deposit so secured, including interest. The Utility has no investment policy that would further limit its investment choices.
Custodial credit risk deposits
Custodial credit risk is the risk that in the event of a bank failure, the Utility may not be able to recover the value of its investment or collateral that in the possession of the bank. The Utility does not have a formal policy for custodial credit risk, but follows Section 6-5-15, South Carolina Code of Law, 1976 (as amended) which states that to the extent that deposits exceed the amount of insurance provided by the Federal Deposit Insurance Corporation, the bank or savings loan association at the time of deposit must furnish an indemnity bond in a responsible surety company or pledge as collateral obligations of qualifying federal, state, and local government agencies, in which the Utility is named as beneficiary. There were no uninsured or uncollateralized deposits at March 31, 2015 and 2014.
Concentration of credit risk
The Utility places no limits on the amount the Utility may invest in any one issuer. As of March 31, 2014 and 2015, no single issuer investment exceeded 5 percent of total investments.
NOTE 3 - ACCOUNTS RECEIVABLE March 31, 2015 2014
Customer accounts receivable $ 2,155,034 $ 1,572,401 Unbilled customer accounts receivable 2,346,225 2,605,339 Miscellaneous accounts receivable 124,282 88,312
4,625,541 4,266,052 Less allowance for doubtful accounts 3,100 3,100
$ 4,622,441 $ 4,262,952
- 31 -
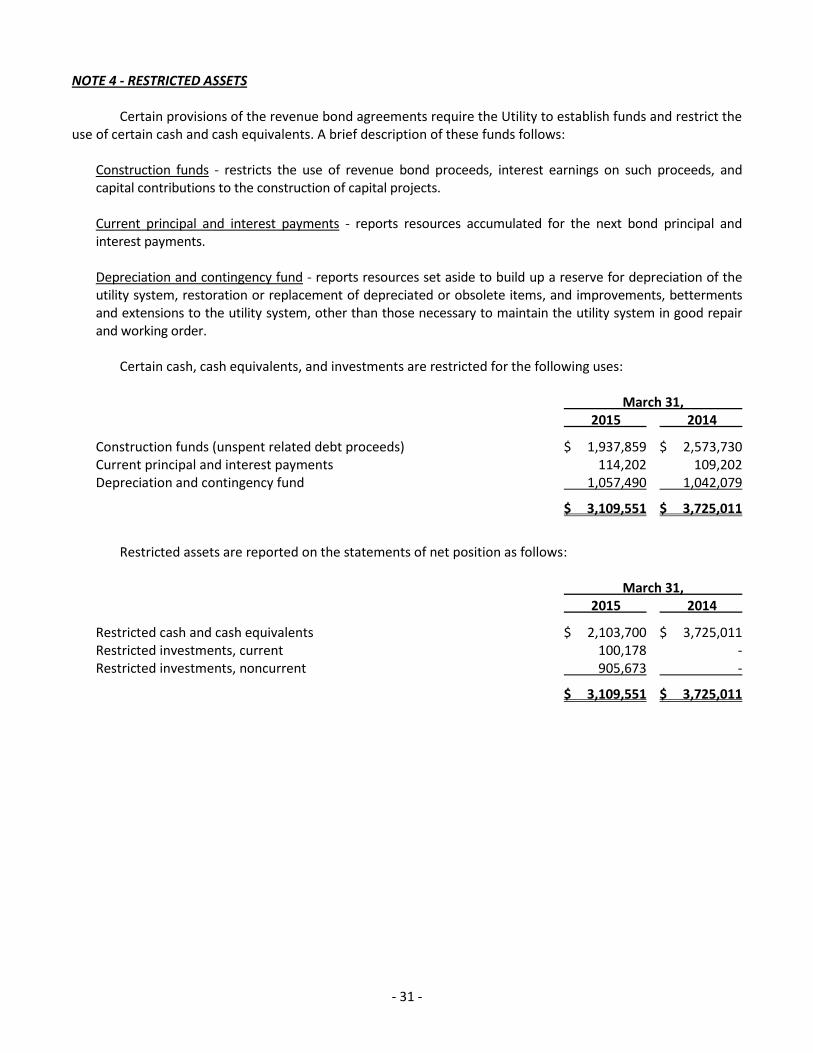
NOTE 4 - RESTRICTED ASSETS
Certain provisions of the revenue bond agreements require the Utility to establish funds and restrict the use of certain cash and cash equivalents. A brief description of these funds follows:
Construction funds - restricts the use of revenue bond proceeds, interest earnings on such proceeds, and capital contributions to the construction of capital projects.
Current principal and interest payments - reports resources accumulated for the next bond principal and interest payments.
Depreciation and contingency fund - reports resources set aside to build up a reserve for depreciation of the utility system, restoration or replacement of depreciated or obsolete items, and improvements, betterments and extensions to the utility system, other than those necessary to maintain the utility system in good repair and working order.
Certain cash, cash equivalents, and investments are restricted for the following uses:
March 31, 2015 2014
Construction funds (unspent related debt proceeds) $ 1,937,859 $ 2,573,730 Current principal and interest payments 114,202 109,202 Depreciation and contingency fund 1,057,490 1,042,079
$ 3,109,551 $ 3,725,011
Restricted assets are reported on the statements of net position as follows:
March 31, 2015 2014
Restricted cash and cash equivalents $ 2,103,700 $ 3,725,011 Restricted investments, current 100,178 - Restricted investments, noncurrent 905,673 -
$ 3,109,551 $ 3,725,011

- 32 -
NOTE 5 - CAPITAL ASSETS
March 31, March 31,2014 Additions Disposals Reclassifications 2015
Capital assets not being depreciated:Land 1,907,242$ -$ -$ -$ 1,907,242$ Right of way 1,276,286 792 - - 1,277,078 Construction work in progress 1,434,621 2,366,248 - (2,197,321) 1,603,548
Total capital assets not being depreciated 4,618,149 2,367,040 - (2,197,321) 4,787,868
Capital assets being depreciated:Buildings 2,827,228 67,097 - 60,000 2,954,325
Equipment 2,560,900 65,481 388,591 319,194 2,556,984
Utility systemWastewater system 35,932,267 187,228 59,552 114,432 36,174,375 Water system 72,233,802 95,995 144,910 564,525 72,749,412 Electric system 39,516,962 395,131 715,110 1,139,170 40,336,153
Total capital assets
being depreciated 153,071,159 810,932 1,308,163 2,197,321 154,771,249
Less accumulated depreciation:Buildings 1,209,260 79,700 - - 1,288,960 Equipment 2,275,313 137,569 388,591 - 2,024,291 Wastewater system 19,097,657 885,658 59,552 - 19,923,763 Water system 23,211,138 2,651,182 139,049 - 25,723,271 Electric system 21,833,237 1,128,935 715,110 - 22,247,062
67,626,605 4,883,044 1,302,302 - 71,207,347
Total capital assets beingdepreciated, net 85,444,554 (4,072,112) 5,861 2,197,321 83,563,902
Total capital assets, net 90,062,703$ (1,705,072)$ 5,861$ -$ 88,351,770$
March 31, March 31,2013 Additions Disposals Reclassifications 2014
Capital assets not being depreciated:Land 1,978,953$ -$ 71,711$ -$ 1,907,242$ Right of way 1,262,775 13,511 - - 1,276,286 Construction work in progress 10,029,450 1,974,210 - (10,569,039) 1,434,621
Total capital assets not being depreciated 13,271,178 1,987,721 71,711 (10,569,039) 4,618,149
Capital assets being depreciated:Buildings 2,795,507 78,508 46,787 - 2,827,228
Equipment 4,436,903 66,625 1,120,007 (822,621) 2,560,900
Utility systemWastewater system 34,978,069 268,775 63,044 748,467 35,932,267 Water system 62,086,195 108,980 - 10,038,627 72,233,802 Electric system 38,297,551 747,368 132,523 604,566 39,516,962
Total capital assetsbeing depreciated 142,594,225 1,270,256 1,362,361 10,569,039 153,071,159
Less accumulated depreciation:Buildings 1,173,088 82,959 46,787 - 1,209,260 Equipment 3,996,375 215,340 1,113,781 (822,621) 2,275,313 Wastewater system 17,917,686 907,146 63,044 335,869 19,097,657 Water system 20,628,987 2,406,183 - 175,968 23,211,138 Electric system 20,496,112 1,158,805 132,464 310,784 21,833,237
64,212,248 4,770,433 1,356,076 - 67,626,605
Total capital assets beingdepreciated, net 78,381,977 (3,500,177) 6,285 10,569,039 85,444,554
Total capital assets, net 91,653,155$ (1,512,456)$ 77,996$ -$ 90,062,703$

- 33 -
NOTE 5 - CAPITAL ASSETS, Continued
Depreciation expense for the years ended March 31, 2015 and 2014 totaled $4,883,044 and $4,770,433, respectively.
Construction work in progress as of March 31, 2015 and 2014 consists of expansion and upgrades to the electric, water, and sewer systems. The balance as of March 31, 2015 primarily consisted of projects related to rehabilitation of sewer lines and the construction of an electric substation. The sewer projects were substantially completed as of March 31, 2015 with remaining commitments totaling approximately $200,000. The electric substation is scheduled to have approximately $1,000,000 of additional construction costs during FY 2016. The assets associated with these projects are scheduled to be placed into service during FY 2016. NOTE 6 - ACCRUED EXPENSES
March 31, 2015 2014
Power purchased $ 2,267,326 $ 2,225,655 Compensated absences 279,484 251,647 Payroll and related taxes 124,055 102,809 Accrued IBNR claims 89,396 102,291 Municipal fee 163,175 168,618 Sales tax and other 66,919 183,927
$ 2,990,355 $ 3,034,947

- 34 -
NOTE 7 - LONG TERM LIABILITIES March 31, March 31, 2014 2015 Amounts beginning ending due within Revenue bonds payable balance Additions Reductions balance one year
Combined Utility System Revenue Bonds, Series 2005, with annual principal payments ranging from $25,000 to $3,070,000 plus coupon interest at 2.5 percent to 5.0 percent and effective interest at 2.5 percent to 5.125 percent payable semi-annually. Bonds mature December 2027. $ 16,820,000 $ - $ (1,445,000) $ 15,375,000 $ 1,495,000
Combined Utility System Revenue Bonds, Series 2010, with annual principal payments ranging from $215,000 to $2,325,000 plus coupon interest at 2.0 percent to 5.0 percent and effective interest at 4.125 percent to 4.180 percent payable semi-annually. Bonds mature December 2034. 23,990,000 - (235,000) 23,755,000 235,000
Combined Utility System Revenue Bonds, Series 2011, with annual principal payments ranging from $45,000 to $1,050,000 plus coupon interest at 2.0 percent to 5.375 percent and effective interest at 1.40 percent to 5.52 percent payable semi-annually. Bonds mature December 2034. 10,065,000 - (50,000) 10,015,000 55,000
50,875,000 - (1,730,000) 49,145,000 1,785,000 Premium/discount on bonds:
Series 2005 bonds 286,653 - (13,870) 272,783 Series 2010 bonds 75,705 - (3,663) 72,042 Series 2011 bonds (155,951) - 7,546 (148,405)
Total revenue bonds payable 51,081,407 - (1,739,987) 49,341,420 State revolving loans payable
Secondary Supply Transmission Main Phase 1 loan dated March 10, 2011. Payable in quarterly installments of $36,398, including interest at 2.25 percent for 19.5 years. Note matures July 1, 2031. 2,101,261 - (99,146) 2,002,115 101,396
$ 53,182,668 $ - $ (1,839,133) $ 51,343,535 $ 1,886,396
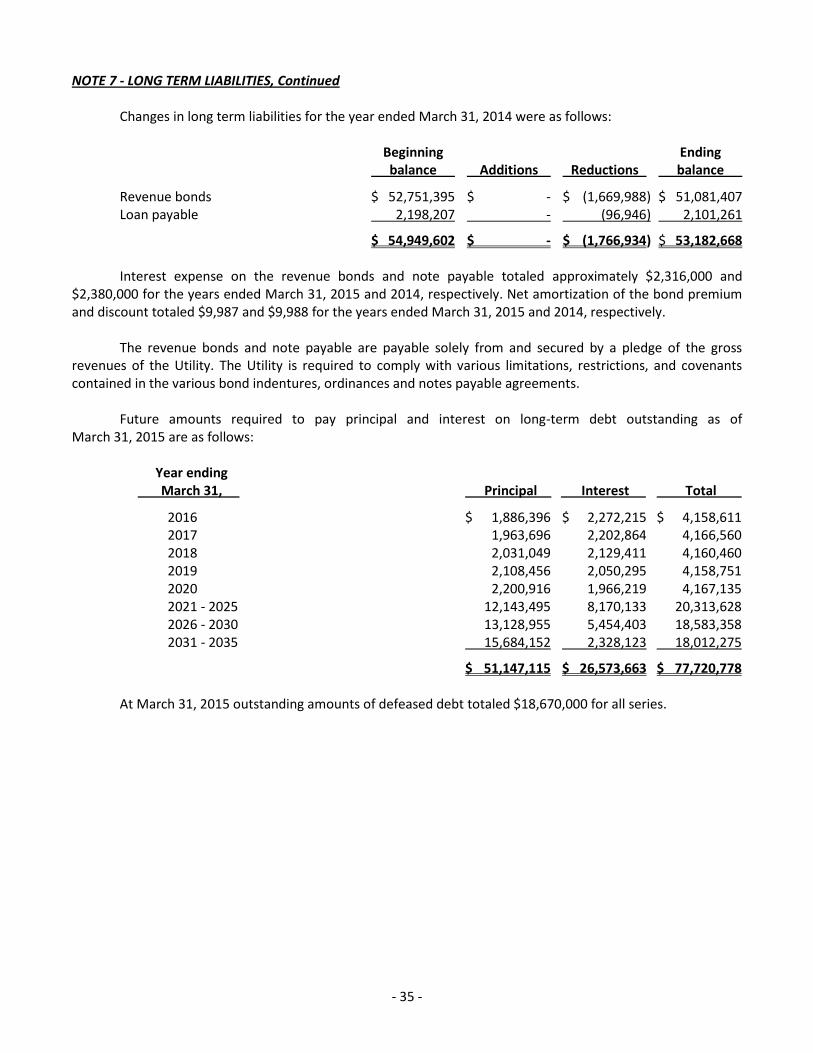
- 35 -
NOTE 7 - LONG TERM LIABILITIES, Continued
Changes in long term liabilities for the year ended March 31, 2014 were as follows: Beginning Ending balance Additions Reductions balance
Revenue bonds $ 52,751,395 $ - $ (1,669,988) $ 51,081,407 Loan payable 2,198,207 - (96,946) 2,101,261
$ 54,949,602 $ - $ (1,766,934) $ 53,182,668
Interest expense on the revenue bonds and note payable totaled approximately $2,316,000 and $2,380,000 for the years ended March 31, 2015 and 2014, respectively. Net amortization of the bond premium and discount totaled $9,987 and $9,988 for the years ended March 31, 2015 and 2014, respectively.
The revenue bonds and note payable are payable solely from and secured by a pledge of the gross revenues of the Utility. The Utility is required to comply with various limitations, restrictions, and covenants contained in the various bond indentures, ordinances and notes payable agreements.
Future amounts required to pay principal and interest on long-term debt outstanding as of March 31, 2015 are as follows: Year ending March 31, Principal Interest Total
2016 $ 1,886,396 $ 2,272,215 $ 4,158,611 2017 1,963,696 2,202,864 4,166,560 2018 2,031,049 2,129,411 4,160,460 2019 2,108,456 2,050,295 4,158,751 2020 2,200,916 1,966,219 4,167,135 2021 - 2025 12,143,495 8,170,133 20,313,628 2026 - 2030 13,128,955 5,454,403 18,583,358 2031 - 2035 15,684,152 2,328,123 18,012,275
$ 51,147,115 $ 26,573,663 $ 77,720,778
At March 31, 2015 outstanding amounts of defeased debt totaled $18,670,000 for all series.
- 36 -
NOTE 8 - COMMITMENTS
The Combined Utility System of Easley, along with nine other cities, has entered into a contract with the Piedmont Municipal Power Agency (PMPA) to purchase significantly all electrical power needs from the Agency. PMPA sold bonds of $1,359,242,000 in order to purchase 25 percent of Duke Energy’s Catawba Unit #2 nuclear reactor located on Lake Wylie in York County, South Carolina. The purpose of the contract is (1) to purchase a reliable source of future energy, (2) to give PMPA an opportunity to expand its electrical generating capacity and (3) to purchase power from PMPA at rates lower than Duke Power would charge if such an agreement was not in effect. The actual cost or savings from this commitment cannot be estimated as of March 31, 2015.
The Commission signed an all requirements power supply contract with the PMPA in 1980 for PMPA to be the System’s sole power supply provider. This contract is in effect until the outstanding debt owed by PMPA is retired, currently in the year 2034, but neither termination nor expiration of the Power Sales Agreement shall affect any accrued liability or obligation thereunder, including, without limitation, the cost of decommissioning the Catawba Project. During the fiscal year ending March 31, 2015 and 2014, Easley Combined Utilities paid PMPA $28,433,257 and $26,339,799, respectively. Through December 31, 2013, PMPA had a contract with Southern Power Company and Southern Company Services, Inc. (together, "Southern Power"), subsidiaries of The Southern Company, to provide power and energy above what is supplied by Catawba. Beginning January 1, 2014, Easley Combined Utilities entered into an agreement with the South Carolina Public Service Authority (“Santee Cooper”) to provide power and energy above what is supplied by Catawba. Should PMPA’s peak resource demand be greater than the Catawba output of 277 Megawatts ("MW"), Santee Cooper must supply all supplemental demand requirements. The Commission also purchases power from the Southeastern Power Administration ("SEPA"), an agency of the U.S. Department of Energy and paid $757,389 and $770,801 to SEPA during 2015 and 2014, respectively, for power and energy.
The Utility has also entered into an inter-governmental agreement with the City of Easley such that all utility services provided to the City will be billed monthly at the prevailing commercial rates. The agreement also states that the Utility will pay the City a municipal fee equal to 5 percent of all inside-city revenues billed. The agreement expires on March 31, 2018. The Utility paid approximately $1,808,039 and $1,710,168 to the City of Easley for municipal fees during the years ended March 31, 2015 and 2014, respectively. NOTE 9 - EMPLOYEE BENEFITS
The Utility participates in the South Carolina Retirement System (the "Plan"), a cost-sharing, multiple-employer, defined benefit pension plan, for the benefit of its employees. The Plan is administered by the Retirement Division of the South Carolina Public Employee Benefit Authority (“PEBA”), a public employee retirement system.
The South Carolina Retirement System offers retirement and disability benefits, group life insurance benefits and survivor benefits. Cost of living adjustments are granted on an ad hoc basis, subject to approval by the Budget and Control Board. The Plan’s provisions are established under Title 9 of the SC Code of Laws. Any amendments would necessitate an amendment to the law.
A Comprehensive Annual Financial Report containing financial statements and required supplementary information for the South Carolina Retirement System is publicly available on the internet at www.retirement.sc.gov or a copy may be obtained by writing the South Carolina Public Employee Benefit Authority, PO Box 11960, Columbia, SC 29211-1960.
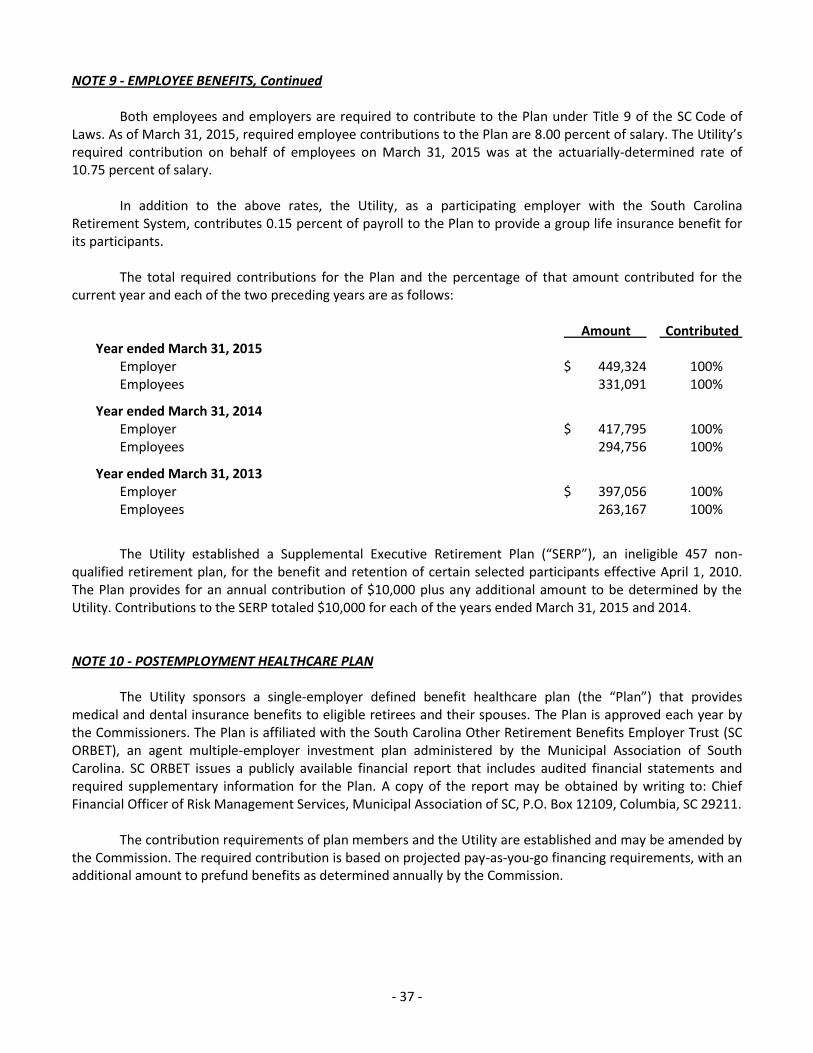
- 37 -
NOTE 9 - EMPLOYEE BENEFITS, Continued
Both employees and employers are required to contribute to the Plan under Title 9 of the SC Code of Laws. As of March 31, 2015, required employee contributions to the Plan are 8.00 percent of salary. The Utility’s required contribution on behalf of employees on March 31, 2015 was at the actuarially-determined rate of 10.75 percent of salary.
In addition to the above rates, the Utility, as a participating employer with the South Carolina Retirement System, contributes 0.15 percent of payroll to the Plan to provide a group life insurance benefit for its participants.
The total required contributions for the Plan and the percentage of that amount contributed for the current year and each of the two preceding years are as follows:
Amount Contributed Year ended March 31, 2015
Employer $ 449,324 100% Employees 331,091 100%
Year ended March 31, 2014 Employer $ 417,795 100% Employees 294,756 100%
Year ended March 31, 2013 Employer $ 397,056 100% Employees 263,167 100%
The Utility established a Supplemental Executive Retirement Plan (“SERP”), an ineligible 457 non-
qualified retirement plan, for the benefit and retention of certain selected participants effective April 1, 2010. The Plan provides for an annual contribution of $10,000 plus any additional amount to be determined by the Utility. Contributions to the SERP totaled $10,000 for each of the years ended March 31, 2015 and 2014. NOTE 10 - POSTEMPLOYMENT HEALTHCARE PLAN
The Utility sponsors a single-employer defined benefit healthcare plan (the “Plan”) that provides medical and dental insurance benefits to eligible retirees and their spouses. The Plan is approved each year by the Commissioners. The Plan is affiliated with the South Carolina Other Retirement Benefits Employer Trust (SC ORBET), an agent multiple-employer investment plan administered by the Municipal Association of South Carolina. SC ORBET issues a publicly available financial report that includes audited financial statements and required supplementary information for the Plan. A copy of the report may be obtained by writing to: Chief Financial Officer of Risk Management Services, Municipal Association of SC, P.O. Box 12109, Columbia, SC 29211.
The contribution requirements of plan members and the Utility are established and may be amended by the Commission. The required contribution is based on projected pay-as-you-go financing requirements, with an additional amount to prefund benefits as determined annually by the Commission.
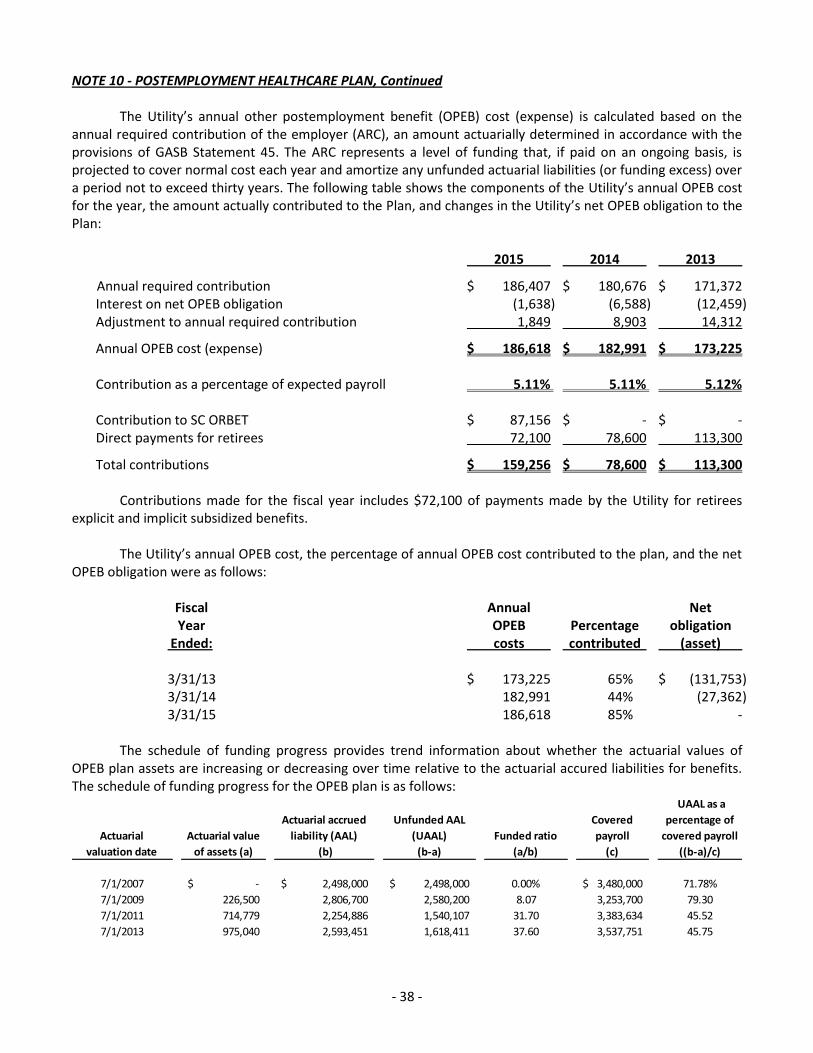
- 38 -
NOTE 10 - POSTEMPLOYMENT HEALTHCARE PLAN, Continued
The Utility’s annual other postemployment benefit (OPEB) cost (expense) is calculated based on the annual required contribution of the employer (ARC), an amount actuarially determined in accordance with the provisions of GASB Statement 45. The ARC represents a level of funding that, if paid on an ongoing basis, is projected to cover normal cost each year and amortize any unfunded actuarial liabilities (or funding excess) over a period not to exceed thirty years. The following table shows the components of the Utility’s annual OPEB cost for the year, the amount actually contributed to the Plan, and changes in the Utility’s net OPEB obligation to the Plan: 2015 2014 2013
Annual required contribution $ 186,407 $ 180,676 $ 171,372 Interest on net OPEB obligation (1,638) (6,588) (12,459) Adjustment to annual required contribution 1,849 8,903 14,312
Annual OPEB cost (expense) $ 186,618 $ 182,991 $ 173,225
Contribution as a percentage of expected payroll 5.11% 5.11% 5.12%
Contribution to SC ORBET $ 87,156 $ - $ - Direct payments for retirees 72,100 78,600 113,300
Total contributions $ 159,256 $ 78,600 $ 113,300
Contributions made for the fiscal year includes $72,100 of payments made by the Utility for retirees explicit and implicit subsidized benefits.
The Utility’s annual OPEB cost, the percentage of annual OPEB cost contributed to the plan, and the net OPEB obligation were as follows:
Fiscal Annual Net Year OPEB Percentage obligation Ended: costs contributed (asset)
3/31/13 $ 173,225 65% $ (131,753) 3/31/14 182,991 44% (27,362) 3/31/15 186,618 85% -
The schedule of funding progress provides trend information about whether the actuarial values of
OPEB plan assets are increasing or decreasing over time relative to the actuarial accured liabilities for benefits. The schedule of funding progress for the OPEB plan is as follows:
Actuarial
valuation date
Actuarial value
of assets (a)
Actuarial accrued
liability (AAL)
(b)
Unfunded AAL
(UAAL)
(b-a)
Funded ratio
(a/b)
Covered
payroll
(c)
UAAL as a
percentage of
covered payroll
((b-a)/c)
7/1/2007 -$ 2,498,000$ 2,498,000$ 0.00% 3,480,000$ 71.78%
7/1/2009 226,500 2,806,700 2,580,200 8.07 3,253,700 79.30
7/1/2011 714,779 2,254,886 1,540,107 31.70 3,383,634 45.52
7/1/2013 975,040 2,593,451 1,618,411 37.60 3,537,751 45.75
- 39 -
NOTE 10 - POSTEMPLOYMENT HEALTHCARE PLAN, Continued
As of March 31, 2015, there were fourteen retirees and one spouse that were receiving coverage benefits. The Utility pays a portion of the monthly premiums for health and dental care coverage for these retirees in amounts ranging from $137 to $233, depending on age and coverage, with the retirees paying the remainder of the premiums. The Utility’s regular health and dental care benefit providers underwrite the retiree’s policy. Retirees may not convert the benefit into an in-lieu payment to secure coverage under independent plans. For the years ended March 31, 2015 and 2014, the Utility paid $64,811 and $60,234, respectively, for these benefits. These payments are used in calculation of the Utility’s net OPEB obligation.
As of July 1, 2013, the actuarial accrued liability for benefits was $2.593 million, and the value of assets was $975,040, resulting in an unfunded actuarial accrued liability (UAAL) of $1.618 million. The covered payroll (annual payroll of active employees covered by the plan) was $3.538 million, and the ratio of the UAAL to the covered payroll was 46 percent.
Actuarial valuations of an ongoing plan involve estimates of the value of reported amounts and assumptions about the probability of occurrence of events far into the future. Examples include assumptions about future employment, mortality, and the healthcare cost trend. Amounts determined regarding the funded status of the plan and the annual required contributions of the employer are subject to continual revision as actual results are compared with past expectations and new estimates are made about the future. The schedule of funding progress, presented as required supplementary information following the notes to basic financial statements, presents multiyear trend information about whether the actuarial value of plan assets is increasing or decreasing over time relative to the actuarial accrued liabilities for benefits.
Projections of benefits for financial reporting purposes are based on the substantive plan (the plan as understood by the employer and the plan members) and include the types of benefits provided at the time of each valuation and the historical pattern of sharing of benefit costs between the employer and plan members to that point. The actuarial methods and assumptions used include techniques that are designed to reduce the effects of short-term volatility in actuarial accrued liabilities and the actuarial value of assets, consistent with the long-term perspective of the calculations.
In the July 1, 2011, actuarial valuation, the projected unit credit actuarial cost method was used. The actuarial assumptions included a 6.5 percent investment rate of return (net of administrative expenses and investment related expenses), which is a blended rate of the expected long-term investment returns on plan assets and on the employer’s own investments calculated based on the funded level of the plan at the valuation date, and an annual healthcare cost trend rate of 8.5 percent initially, reduced by decrements to an ultimate rate of 5.0 percent over eighty years. Both rates included a 3.0 percent inflation assumption. The actuarial value of assets was determined using techniques that spread the effects of short-term volatility in the market value of investments over a five-year period. The UAAL is being amortized as a level dollar amount of projected payroll on a closed basis. The remaining amortization period at March 31, 2014, was approximately 25 years.
In the July 1, 2013, actuarial valuation, the projected unit credit actuarial cost method was used. The actuarial assumptions included a 5.0 percent investment rate of return (net of administrative expenses and investment related expenses), which is a blended rate of the expected long-term investment returns on plan assets and on the employer’s own investments calculated based on the funded level of the plan at the valuation date, and an annual healthcare cost trend rate of 6.5 percent initially, reduced by decrements to an ultimate rate of 5.0 percent over eighty years. Both rates included a 2.75 percent inflation assumption. The actuarial value of assets was determined using techniques that spread the effects of short-term volatility in the market value of investments over a five-year period. The UAAL is being amortized as a level dollar amount of projected payroll on a closed basis. The remaining amortization period at March 31, 2015, was approximately 24 years.

- 40 -
NOTE 11 - LITIGATION
The Utility is from time-to-time subject to various claims, legal actions and other matters arising out of the normal operations conducted by the Utility. In the opinion of management, based on prior experience and available information, the disposition of any lawsuits will not materially affect the Utility’s financial position. NOTE 12 - RISK MANAGEMENT
The Utility is exposed to various risks of losses related to torts; theft of, damage to, and destruction of assets; errors and omissions; injuries to employees; and natural disasters. The Utility maintains insurance coverage through the State of South Carolina Insurance Reserve Fund and has effectively managed risk through various employee education and prevention programs. No significant reductions in insurance coverage have occurred from the prior year to the current year. The amount of settlements has not exceeded insurance coverage for the years ending March 31, 2015, 2014 and 2013. The Utility believes that the amount of actual or potential claims as of March 31, 2015 will not materially affect the financial condition of the Utility.
The Utility is self-insured for medical and prescription coverage up to $35,000 per employee and covered retiree and an aggregate limit of $1,030,472 per plan year. Health claims are handled by an administrator and any recoveries under the stop-loss provision are determined as of March 31, 2015. The liability for claims incurred but not reported (IBNR) is determined by the Utility’s independent insurance administrator and is included in accrued expenses on the accompanying statements of net position. The table below shows the reconciliation of unpaid claims for fiscal years ending March 31: Unpaid claims Incurred claims Claims Unpaid claims beginning of year (including IBNR) payments end of year
2013 $ 101,610 $ 1,102,760 $ 1,111,717 $ 92,653 2014 92,653 1,236,990 1,227,352 102,291 2015 102,291 1,059,733 1,072,628 89,396
NOTE 13 - SUBSEQUENT EVENTS
The financial statements were available to be issued August 11, 2015. Management has evaluated subsequent events through that date and determined that nothing occurred that required disclosure.

Actuarial
valuation date
Actuarial value
of assets (a)
Actuarial accrued
liability (AAL)
(b)
Unfunded AAL
(UAAL)
(b-a)
Funded ratio
(a/b)
Covered
payroll
(c)
UAAL as a
percentage of
covered payroll
((b-a)/c)
7/1/2007 -$ 2,498,000$ 2,498,000$ 0.00% 3,480,000$ 72.00%
7/1/2009 226,500 2,806,700 2,580,200 8.07% 3,253,700 79.00%
7/1/2011 714,779 2,254,886 1,540,107 31.70% 3,383,634 46.00%
7/1/2013 975,040 2,593,451 1,618,411 37.60% 3,537,751 46.00%
COMBINED UTILITY STYSTEM OF EASLEY
REQUIRED SUPPLEMENTARY INFORMATION
SCHEDULE OF FUNDING PROGRESS - OTHER POST EMPLOYMENT BENEFITS
- 41 -
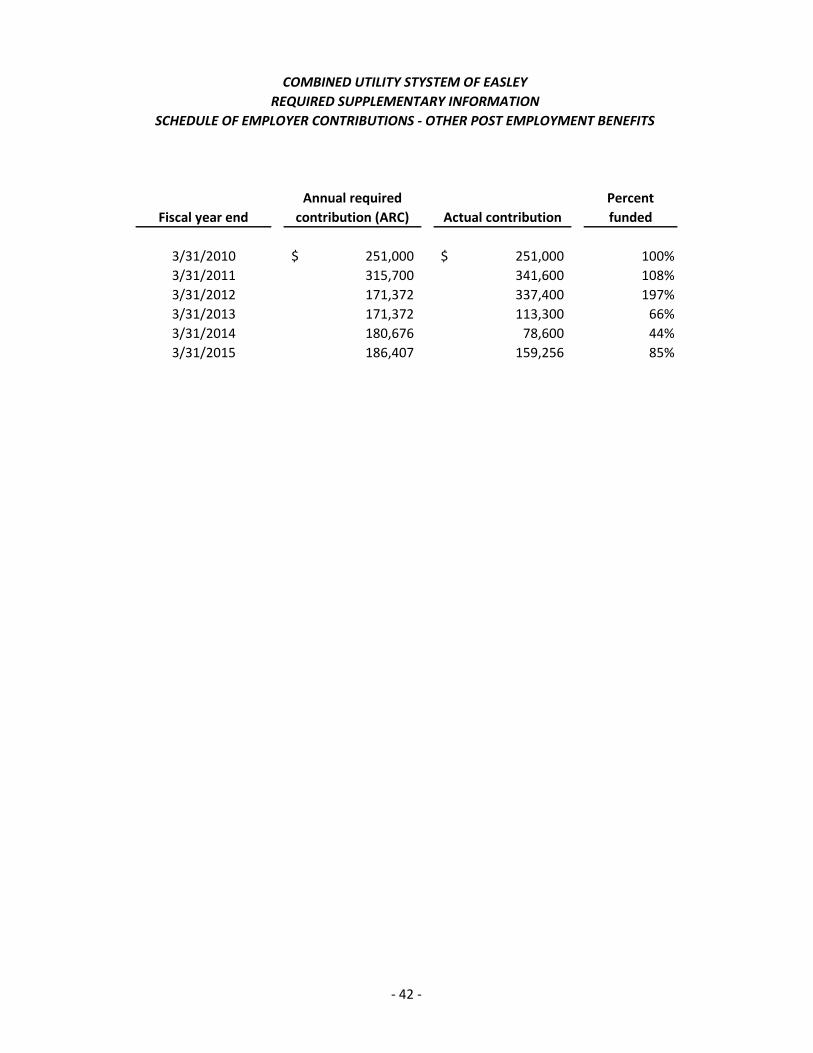
Fiscal year end
Annual required
contribution (ARC) Actual contribution
Percent
funded
3/31/2010 251,000$ 251,000$ 100%
3/31/2011 315,700 341,600 108%
3/31/2012 171,372 337,400 197%
3/31/2013 171,372 113,300 66%
3/31/2014 180,676 78,600 44%
3/31/2015 186,407 159,256 85%
COMBINED UTILITY STYSTEM OF EASLEY
REQUIRED SUPPLEMENTARY INFORMATION
SCHEDULE OF EMPLOYER CONTRIBUTIONS - OTHER POST EMPLOYMENT BENEFITS
- 42 -
STATISTICAL SECTION (UNAUDITED)
Statistical Section
This section of the Comprehensive Annual Financial Report serves to provide the reader with additional information concerning the Utility’s financial statements and note disclosures. The provided information in this section will improve the reader’s understanding of the Utility’s financial condition as well as the overall financial and economic state of Pickens County. Contents Page Financial Trends 43 These schedules provide trend information that will help the reader better understand the Utility’s financial performance and operations over time. Revenue Analysis 47 These schedules give the reader more information concerning financial performance of the Utility’s contributing departments, and thus, create a better understanding of operations. Debt Analysis 58 These schedules provide information regarding the historical debt and the current outstanding debt of the Utility. This provides the reader with a better understanding of the affordability of the Utility’s current debt and its ability to issue additional debt in the future. Demographic and Economic Information 60 These schedules provide the reader with information concerning the demographic and economic conditions of the area in which the Utility operates. Operating Information 62 These schedules give the reader details of both the service and capital asset information which provide a better understanding of how the Utility’s financial report correlates with services provided by and activities performed by the Utility.
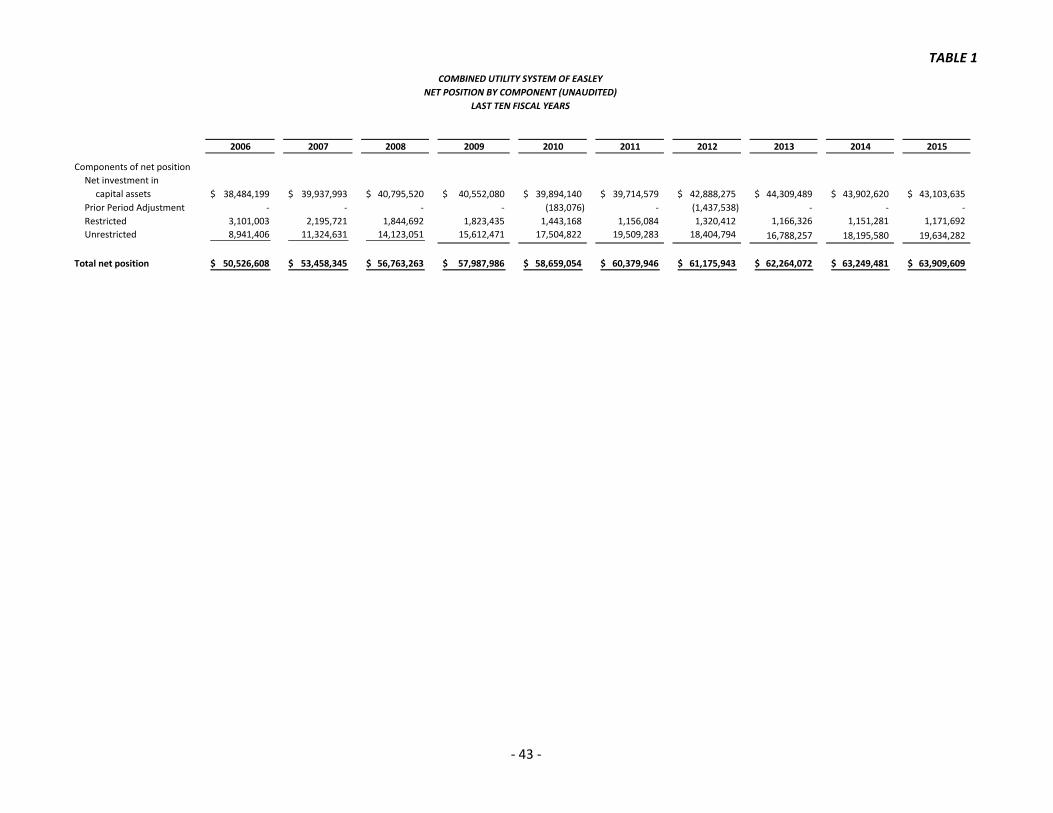
TABLE 1
2006 2007 2008 2009 2010 2011 2012 2013 2014 2015
Components of net position
Net investment in
capital assets 38,484,199$ 39,937,993$ 40,795,520$ 40,552,080$ 39,894,140$ 39,714,579$ 42,888,275$ 44,309,489$ 43,902,620$ 43,103,635$
Prior Period Adjustment - - - - (183,076) - (1,437,538) - - -
Restricted 3,101,003 2,195,721 1,844,692 1,823,435 1,443,168 1,156,084 1,320,412 1,166,326 1,151,281 1,171,692
Unrestricted 8,941,406 11,324,631 14,123,051 15,612,471 17,504,822 19,509,283 18,404,794 16,788,257 18,195,580 19,634,282
Total net position 50,526,608$ 53,458,345$ 56,763,263$ 57,987,986$ 58,659,054$ 60,379,946$ 61,175,943$ 62,264,072$ 63,249,481$ 63,909,609$
COMBINED UTILITY SYSTEM OF EASLEY
NET POSITION BY COMPONENT (UNAUDITED)
LAST TEN FISCAL YEARS
- 43 -
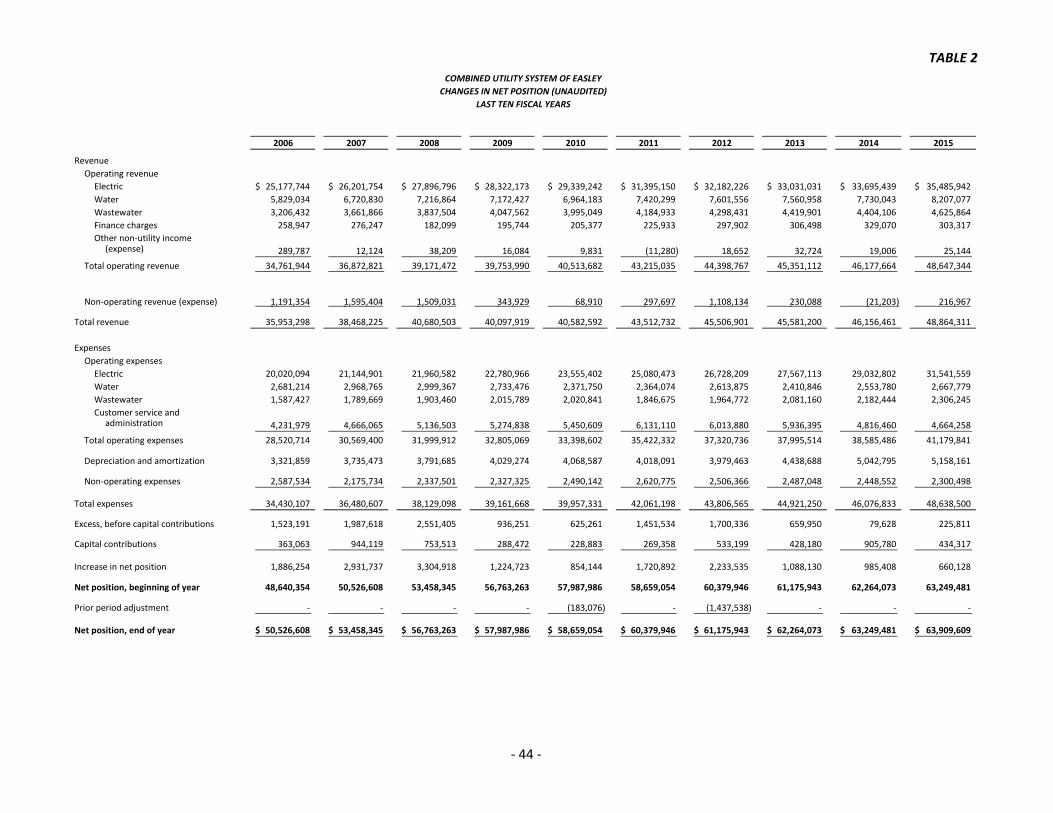
TABLE 2
2006 2007 2008 2009 2010 2011 2012 2013 2014 2015
Revenue
Operating revenue
Electric 25,177,744$ 26,201,754$ 27,896,796$ 28,322,173$ 29,339,242$ 31,395,150$ 32,182,226$ 33,031,031$ 33,695,439$ 35,485,942$
Water 5,829,034 6,720,830 7,216,864 7,172,427 6,964,183 7,420,299 7,601,556 7,560,958 7,730,043 8,207,077
Wastewater 3,206,432 3,661,866 3,837,504 4,047,562 3,995,049 4,184,933 4,298,431 4,419,901 4,404,106 4,625,864
Finance charges 258,947 276,247 182,099 195,744 205,377 225,933 297,902 306,498 329,070 303,317
Other non-utility income(expense) 289,787 12,124 38,209 16,084 9,831 (11,280) 18,652 32,724 19,006 25,144
Total operating revenue 34,761,944 36,872,821 39,171,472 39,753,990 40,513,682 43,215,035 44,398,767 45,351,112 46,177,664 48,647,344
1,191,354 1,595,404 1,509,031 343,929 68,910 297,697 1,108,134 230,088 (21,203) 216,967
Total revenue 35,953,298 38,468,225 40,680,503 40,097,919 40,582,592 43,512,732 45,506,901 45,581,200 46,156,461 48,864,311
Expenses
Operating expenses
Electric 20,020,094 21,144,901 21,960,582 22,780,966 23,555,402 25,080,473 26,728,209 27,567,113 29,032,802 31,541,559
Water 2,681,214 2,968,765 2,999,367 2,733,476 2,371,750 2,364,074 2,613,875 2,410,846 2,553,780 2,667,779
Wastewater 1,587,427 1,789,669 1,903,460 2,015,789 2,020,841 1,846,675 1,964,772 2,081,160 2,182,444 2,306,245
Customer service andadministration 4,231,979 4,666,065 5,136,503 5,274,838 5,450,609 6,131,110 6,013,880 5,936,395 4,816,460 4,664,258
Total operating expenses 28,520,714 30,569,400 31,999,912 32,805,069 33,398,602 35,422,332 37,320,736 37,995,514 38,585,486 41,179,841
Depreciation and amortization 3,321,859 3,735,473 3,791,685 4,029,274 4,068,587 4,018,091 3,979,463 4,438,688 5,042,795 5,158,161
Non-operating expenses 2,587,534 2,175,734 2,337,501 2,327,325 2,490,142 2,620,775 2,506,366 2,487,048 2,448,552 2,300,498
Total expenses 34,430,107 36,480,607 38,129,098 39,161,668 39,957,331 42,061,198 43,806,565 44,921,250 46,076,833 48,638,500
Excess, before capital contributions 1,523,191 1,987,618 2,551,405 936,251 625,261 1,451,534 1,700,336 659,950 79,628 225,811
Capital contributions 363,063 944,119 753,513 288,472 228,883 269,358 533,199 428,180 905,780 434,317
Increase in net position 1,886,254 2,931,737 3,304,918 1,224,723 854,144 1,720,892 2,233,535 1,088,130 985,408 660,128
Net position, beginning of year 48,640,354 50,526,608 53,458,345 56,763,263 57,987,986 58,659,054 60,379,946 61,175,943 62,264,073 63,249,481
Prior period adjustment - - - - (183,076) - (1,437,538) - - -
Net position, end of year 50,526,608$ 53,458,345$ 56,763,263$ 57,987,986$ 58,659,054$ 60,379,946$ 61,175,943$ 62,264,073$ 63,249,481$ 63,909,609$
Non-operating revenue (expense)
COMBINED UTILITY SYSTEM OF EASLEY
CHANGES IN NET POSITION (UNAUDITED)
LAST TEN FISCAL YEARS
- 44 -
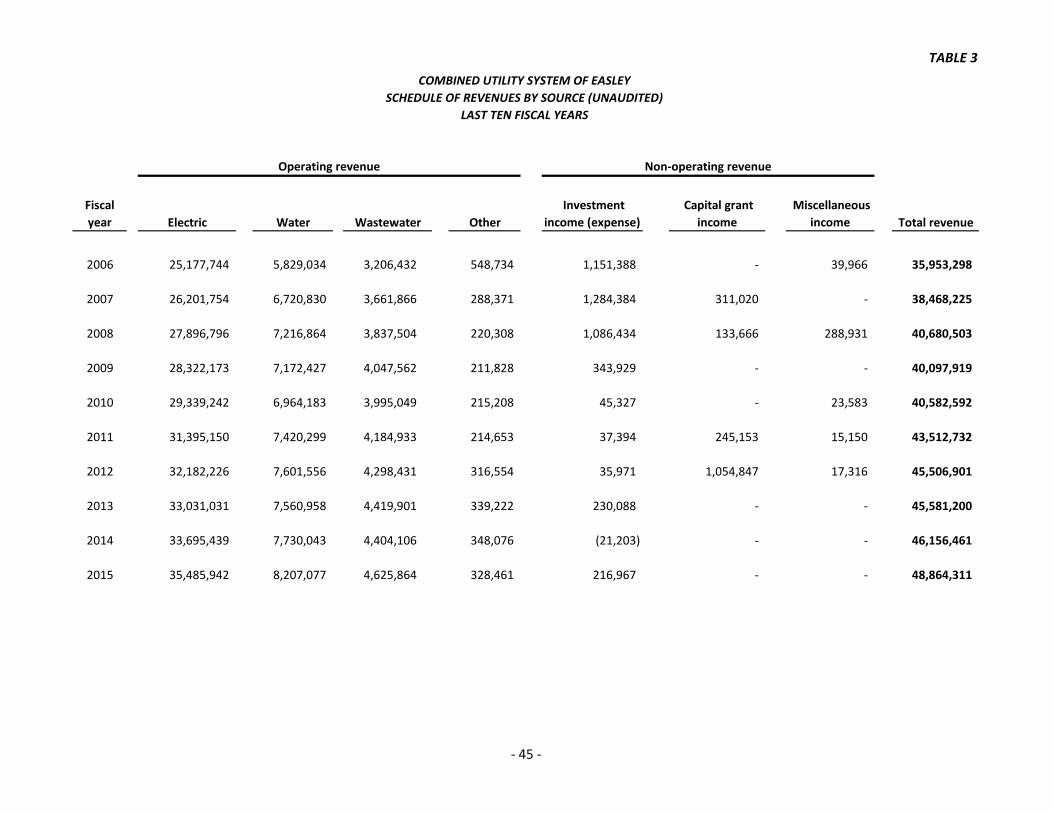
TABLE 3
Fiscal
year Water Other
Investment
income (expense)
Capital grant
income
Miscellaneous
income Total revenue
2006 25,177,744 5,829,034 3,206,432 548,734 1,151,388 - 39,966 35,953,298
2007 26,201,754 6,720,830 3,661,866 288,371 1,284,384 311,020 - 38,468,225
2008 27,896,796 7,216,864 3,837,504 220,308 1,086,434 133,666 288,931 40,680,503
2009 28,322,173 7,172,427 4,047,562 211,828 343,929 - - 40,097,919
2010 29,339,242 6,964,183 3,995,049 215,208 45,327 - 23,583 40,582,592
2011 31,395,150 7,420,299 4,184,933 214,653 37,394 245,153 15,150 43,512,732
2012 32,182,226 7,601,556 4,298,431 316,554 35,971 1,054,847 17,316 45,506,901
2013 33,031,031 7,560,958 4,419,901 339,222 230,088 - - 45,581,200
2014 33,695,439 7,730,043 4,404,106 348,076 (21,203) - - 46,156,461
2015 35,485,942 8,207,077 4,625,864 328,461 216,967 - - 48,864,311
Operating revenue Non-operating revenue
Electric Wastewater
COMBINED UTILITY SYSTEM OF EASLEY
SCHEDULE OF REVENUES BY SOURCE (UNAUDITED)
LAST TEN FISCAL YEARS
- 45 -
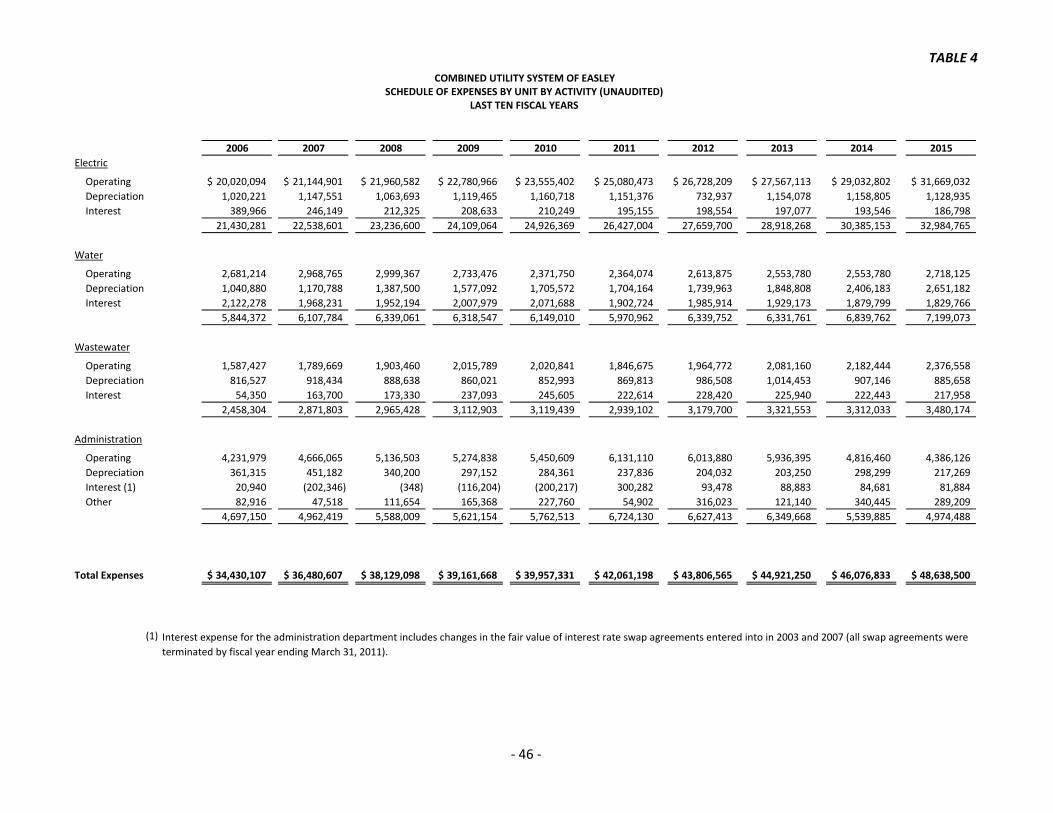
TABLE 4
2006 2007 2008 2009 2010 2011 2012 2013 2014 2015
Electric
Operating 20,020,094$ 21,144,901$ 21,960,582$ 22,780,966$ 23,555,402$ 25,080,473$ 26,728,209$ 27,567,113$ 29,032,802$ 31,669,032$
Depreciation 1,020,221 1,147,551 1,063,693 1,119,465 1,160,718 1,151,376 732,937 1,154,078 1,158,805 1,128,935
Interest 389,966 246,149 212,325 208,633 210,249 195,155 198,554 197,077 193,546 186,798
21,430,281 22,538,601 23,236,600 24,109,064 24,926,369 26,427,004 27,659,700 28,918,268 30,385,153 32,984,765
Water
Operating 2,681,214 2,968,765 2,999,367 2,733,476 2,371,750 2,364,074 2,613,875 2,553,780 2,553,780 2,718,125
Depreciation 1,040,880 1,170,788 1,387,500 1,577,092 1,705,572 1,704,164 1,739,963 1,848,808 2,406,183 2,651,182
Interest 2,122,278 1,968,231 1,952,194 2,007,979 2,071,688 1,902,724 1,985,914 1,929,173 1,879,799 1,829,766
5,844,372 6,107,784 6,339,061 6,318,547 6,149,010 5,970,962 6,339,752 6,331,761 6,839,762 7,199,073
Wastewater
Operating 1,587,427 1,789,669 1,903,460 2,015,789 2,020,841 1,846,675 1,964,772 2,081,160 2,182,444 2,376,558
Depreciation 816,527 918,434 888,638 860,021 852,993 869,813 986,508 1,014,453 907,146 885,658
Interest 54,350 163,700 173,330 237,093 245,605 222,614 228,420 225,940 222,443 217,958
2,458,304 2,871,803 2,965,428 3,112,903 3,119,439 2,939,102 3,179,700 3,321,553 3,312,033 3,480,174
Administration
Operating 4,231,979 4,666,065 5,136,503 5,274,838 5,450,609 6,131,110 6,013,880 5,936,395 4,816,460 4,386,126
Depreciation 361,315 451,182 340,200 297,152 284,361 237,836 204,032 203,250 298,299 217,269
Interest (1) 20,940 (202,346) (348) (116,204) (200,217) 300,282 93,478 88,883 84,681 81,884
Other 82,916 47,518 111,654 165,368 227,760 54,902 316,023 121,140 340,445 289,209
4,697,150 4,962,419 5,588,009 5,621,154 5,762,513 6,724,130 6,627,413 6,349,668 5,539,885 4,974,488
Total Expenses 34,430,107$ 36,480,607$ 38,129,098$ 39,161,668$ 39,957,331$ 42,061,198$ 43,806,565$ 44,921,250$ 46,076,833$ 48,638,500$
(1)
COMBINED UTILITY SYSTEM OF EASLEYSCHEDULE OF EXPENSES BY UNIT BY ACTIVITY (UNAUDITED)
LAST TEN FISCAL YEARS
Interest expense for the administration department includes changes in the fair value of interest rate swap agreements entered into in 2003 and 2007 (all swap agreements were
terminated by fiscal year ending March 31, 2011).
- 46 -

- 47 -
TABLE 5 COMBINED UTILITY SYSTEM OF EASLEY
ELECTRIC SYSTEM (UNAUDITED)
Electric Service Rates
The Utility provides electrical power to two types of customers, residential and general service. Residential electrical service is available to all single-family dwelling units and individual dwelling units in apartment structures or other multi-family residential structures. All other customers pay the general service rate. The following sets forth the Commission’s electric rates for residential and general service, which became effective April 1, 2014:
Residential Service Basic Facilities Charge $9.24 All Energy (kWh) $.1137/kWh General Service Small General Service Fixed Charge $12.17 Energy Charge First 3,000 kWh $0.1532/kWh Next 6,000 kWh $0.1115/kWh Next 21,000 kWh $0.0842/kWh Next 30,000 kWh $0.0805/kWh Over 60,000 kWh $0.0724/kWh
Large General Service Fixed Charge $12.17
Demand Charge First 30 kW $0.00 All over 30 kW $8.30/kWh Energy Charge First 3,000 kWh $0.1479/kWh Next 6,000 kWh $0.1100/kWh Next 21,000 kWh $0.0736/kWh All over 30,000 kWh $0.0676/kWh Over 400 kWh/kW $0.0523/kWh
(Continued)
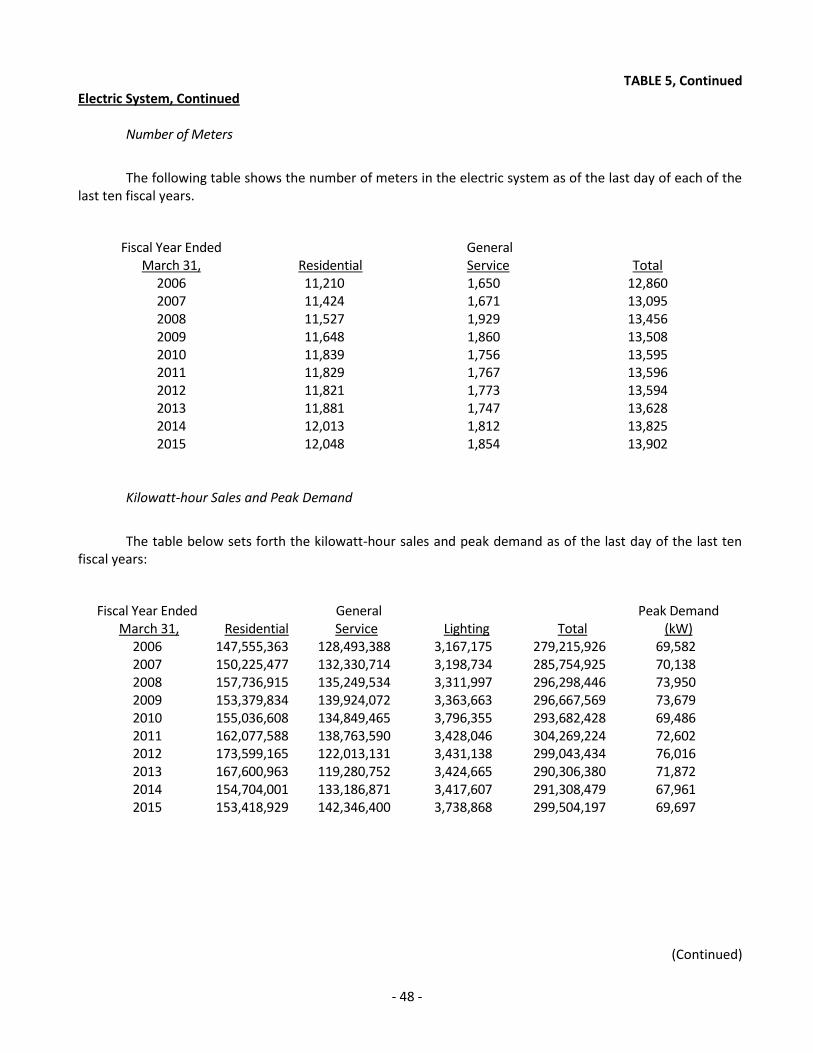
- 48 -
TABLE 5, Continued Electric System, Continued
Number of Meters
The following table shows the number of meters in the electric system as of the last day of each of the last ten fiscal years.
Fiscal Year Ended March 31,
Residential
General Service
Total
2006 11,210 1,650 12,860 2007 11,424 1,671 13,095 2008 11,527 1,929 13,456 2009 11,648 1,860 13,508 2010 11,839 1,756 13,595 2011 11,829 1,767 13,596 2012 11,821 1,773 13,594 2013 11,881 1,747 13,628 2014 12,013 1,812 13,825 2015 12,048 1,854 13,902
Kilowatt-hour Sales and Peak Demand
The table below sets forth the kilowatt-hour sales and peak demand as of the last day of the last ten fiscal years:
Fiscal Year Ended March 31,
Residential
General Service
Lighting
Total
Peak Demand (kW)
2006 147,555,363 128,493,388 3,167,175 279,215,926 69,582 2007 150,225,477 132,330,714 3,198,734 285,754,925 70,138 2008 157,736,915 135,249,534 3,311,997 296,298,446 73,950 2009 153,379,834 139,924,072 3,363,663 296,667,569 73,679 2010 155,036,608 134,849,465 3,796,355 293,682,428 69,486 2011 162,077,588 138,763,590 3,428,046 304,269,224 72,602 2012 173,599,165 122,013,131 3,431,138 299,043,434 76,016 2013 167,600,963 119,280,752 3,424,665 290,306,380 71,872 2014 154,704,001 133,186,871 3,417,607 291,308,479 67,961 2015 153,418,929 142,346,400 3,738,868 299,504,197 69,697
(Continued)
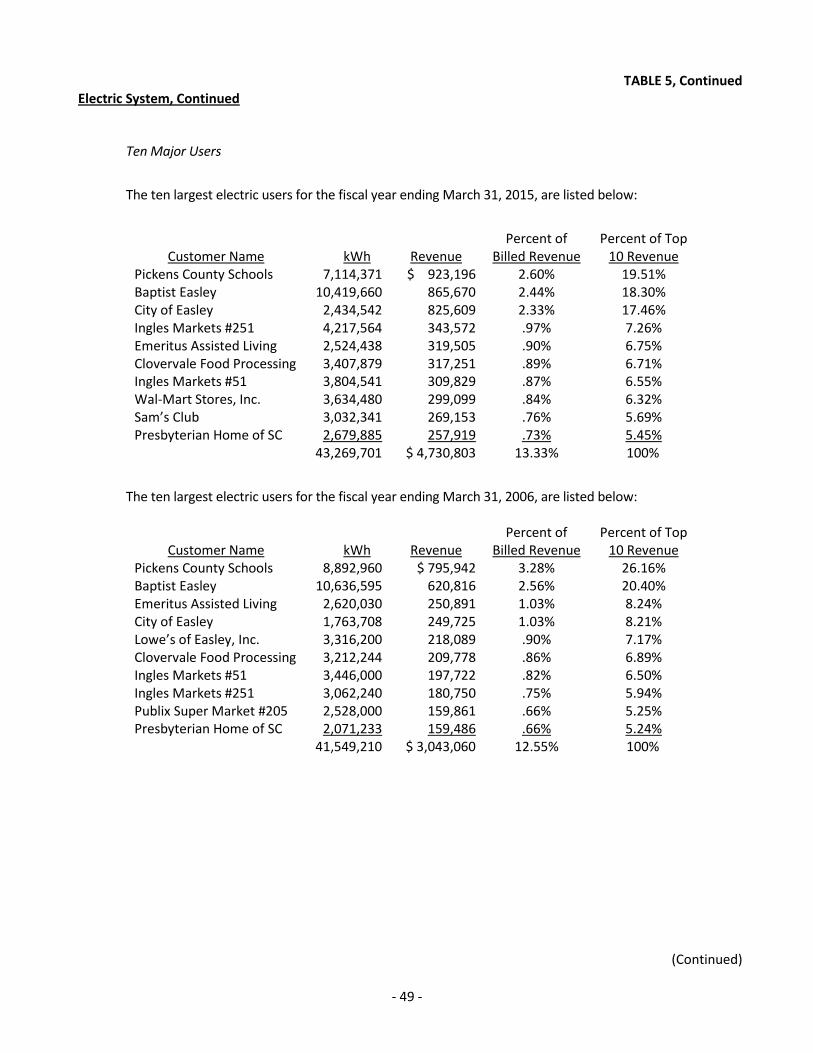
- 49 -
TABLE 5, Continued Electric System, Continued
Ten Major Users
The ten largest electric users for the fiscal year ending March 31, 2015, are listed below:
Customer Name kWh
Revenue Percent of
Billed Revenue Percent of Top
10 Revenue Pickens County Schools 7,114,371 $ 923,196 2.60% 19.51% Baptist Easley 10,419,660 865,670 2.44% 18.30% City of Easley 2,434,542 825,609 2.33% 17.46% Ingles Markets #251 4,217,564 343,572 .97% 7.26% Emeritus Assisted Living 2,524,438 319,505 .90% 6.75% Clovervale Food Processing 3,407,879 317,251 .89% 6.71% Ingles Markets #51 3,804,541 309,829 .87% 6.55% Wal-Mart Stores, Inc. 3,634,480 299,099 .84% 6.32% Sam’s Club 3,032,341 269,153 .76% 5.69% Presbyterian Home of SC 2,679,885 257,919 .73% 5.45%
43,269,701 $ 4,730,803 13.33% 100%
The ten largest electric users for the fiscal year ending March 31, 2006, are listed below:
Customer Name kWh
Revenue Percent of
Billed Revenue Percent of Top
10 Revenue Pickens County Schools 8,892,960 $ 795,942 3.28% 26.16% Baptist Easley 10,636,595 620,816 2.56% 20.40% Emeritus Assisted Living 2,620,030 250,891 1.03% 8.24% City of Easley 1,763,708 249,725 1.03% 8.21% Lowe’s of Easley, Inc. 3,316,200 218,089 .90% 7.17% Clovervale Food Processing 3,212,244 209,778 .86% 6.89% Ingles Markets #51 3,446,000 197,722 .82% 6.50% Ingles Markets #251 3,062,240 180,750 .75% 5.94% Publix Super Market #205 2,528,000 159,861 .66% 5.25% Presbyterian Home of SC 2,071,233 159,486 .66% 5.24%
41,549,210 $ 3,043,060 12.55% 100%
(Continued)

- 50 -
TABLE 5, Continued Electric System, Continued
PMPA
The City's share of PMPA's share of the Catawba Project output is 13.2426%. PMPA bills each participant monthly for its power costs, including its share of the debt service on bonds issued by PMPA. The City's obligations under the Power Sales Agreement are payable as an operating expense of its electric system (including all properties and assets used or pertaining to the generation, transmission, transformation, distribution, and sale of electric power and energy) solely from the revenues of such electric system. The City has paid the following amounts for the purchase of capacity and energy from PMPA during the past ten calendar years:
Year Purchase Amount 2006 18,678,782 2007 19,667,059 2008 2009
20,139,371 20,810,363
2010 2011 2012
21,056,849 22,647,182 23,914,782
2013 25,082,414 2014 26,339,799 2015 28,433,257
The City has also entered into a Supplemental Power Sales Agreement with PMPA under which the City has agreed, in exchange for its electric power and energy requirements (exclusive of any purchased from SEPA) in excess of those supplied under the Power Sales Agreement and from any future PMPA projects not financed with bonds issued under the current PMPA bond resolution, to pay for its share of supplemental power costs to the extent delivered and supplied. Payments are made by the City solely from the revenues of its electric system (including all properties and assets used or pertaining to the generation, transmission, transformation, distribution, and sale of electric power and energy) and are treated as an operating expense thereof.
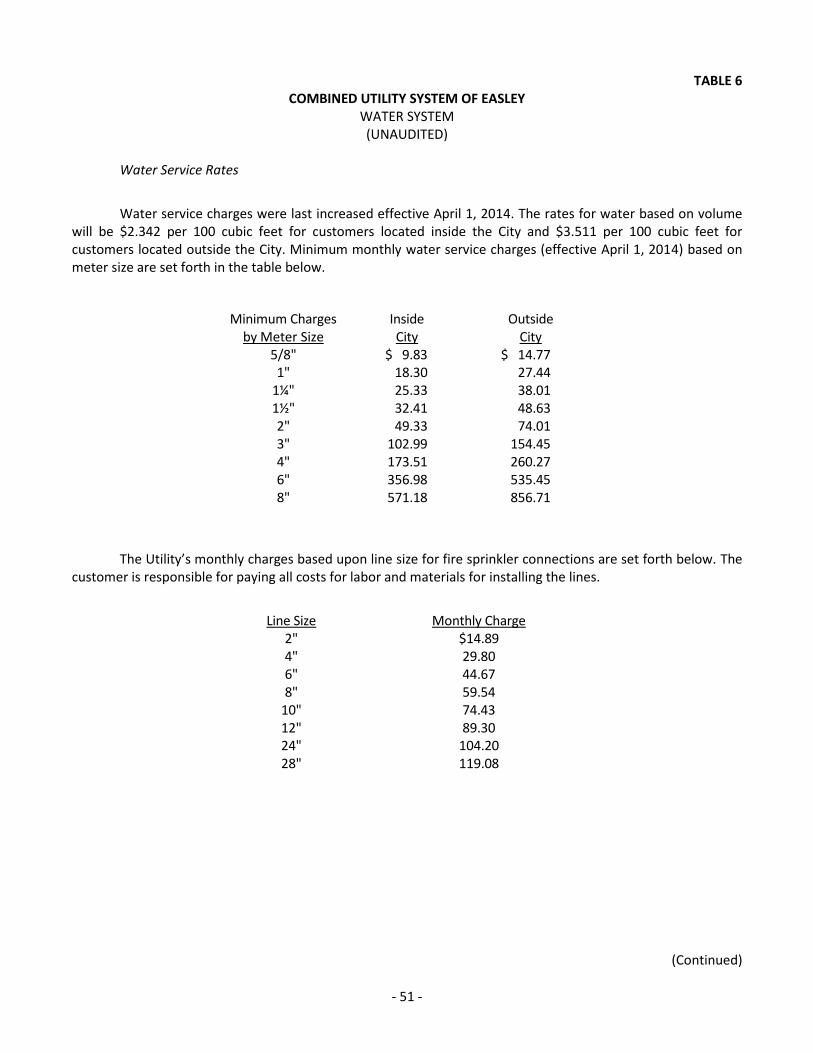
- 51 -
TABLE 6 COMBINED UTILITY SYSTEM OF EASLEY
WATER SYSTEM (UNAUDITED)
Water Service Rates
Water service charges were last increased effective April 1, 2014. The rates for water based on volume will be $2.342 per 100 cubic feet for customers located inside the City and $3.511 per 100 cubic feet for customers located outside the City. Minimum monthly water service charges (effective April 1, 2014) based on meter size are set forth in the table below.
Minimum Charges by Meter Size
Inside City
Outside City
5/8" $ 9.83 $ 14.77 1" 18.30 27.44
1¼" 25.33 38.01 1½" 32.41 48.63 2" 49.33 74.01 3" 102.99 154.45 4" 173.51 260.27 6" 8"
356.98 571.18
535.45 856.71
The Utility’s monthly charges based upon line size for fire sprinkler connections are set forth below. The customer is responsible for paying all costs for labor and materials for installing the lines.
Line Size Monthly Charge 2" $14.89 4" 29.80 6" 44.67 8" 59.54
10" 74.43 12" 89.30 24" 104.20 28" 119.08
(Continued)
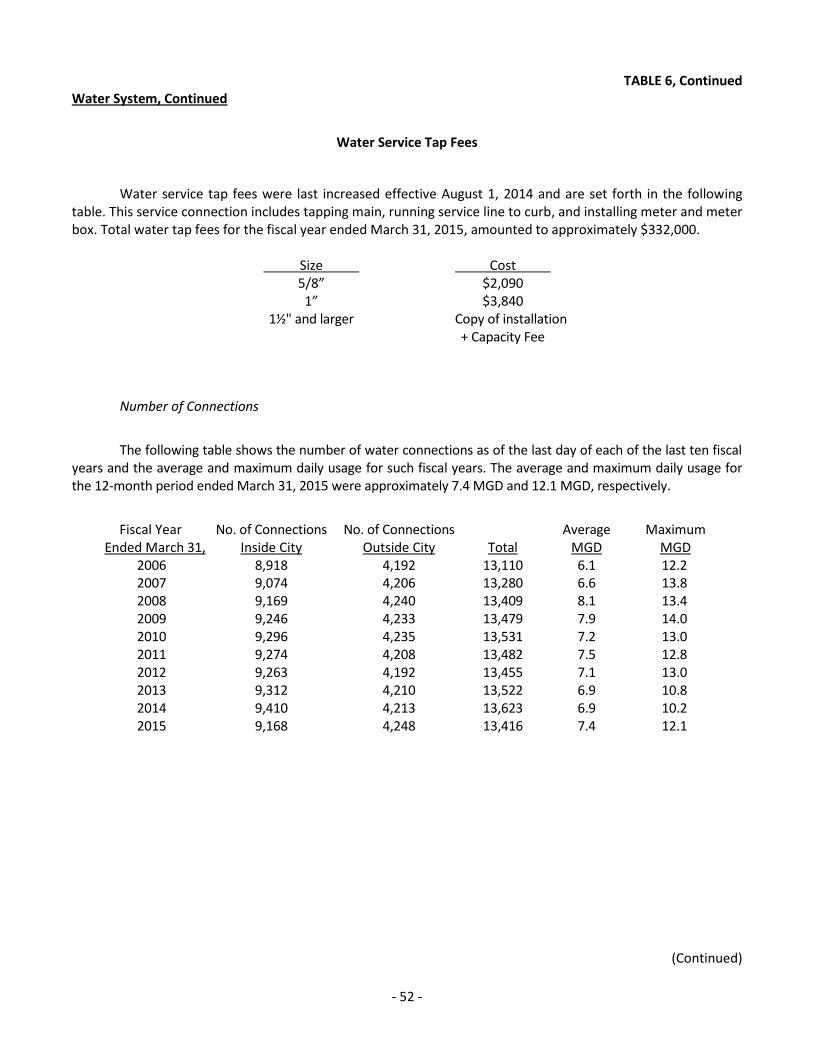
- 52 -
TABLE 6, Continued Water System, Continued
Water Service Tap Fees
Water service tap fees were last increased effective August 1, 2014 and are set forth in the following table. This service connection includes tapping main, running service line to curb, and installing meter and meter box. Total water tap fees for the fiscal year ended March 31, 2015, amounted to approximately $332,000.
Size Cost 5/8” $2,090 1” $3,840 1½" and larger Copy of installation + Capacity Fee
Number of Connections
The following table shows the number of water connections as of the last day of each of the last ten fiscal years and the average and maximum daily usage for such fiscal years. The average and maximum daily usage for the 12-month period ended March 31, 2015 were approximately 7.4 MGD and 12.1 MGD, respectively.
Fiscal Year Ended March 31,
No. of Connections Inside City
No. of Connections Outside City
Total
Average MGD
Maximum MGD
2006 8,918 4,192 13,110 6.1 12.2 2007 9,074 4,206 13,280 6.6 13.8 2008 9,169 4,240 13,409 8.1 13.4 2009 9,246 4,233 13,479 7.9 14.0 2010 9,296 4,235 13,531 7.2 13.0 2011 9,274 4,208 13,482 7.5 12.8 2012 9,263 4,192 13,455 7.1 13.0 2013 9,312 4,210 13,522 6.9 10.8 2014 9,410 4,213 13,623 6.9 10.2 2015 9,168 4,248 13,416 7.4 12.1
(Continued)
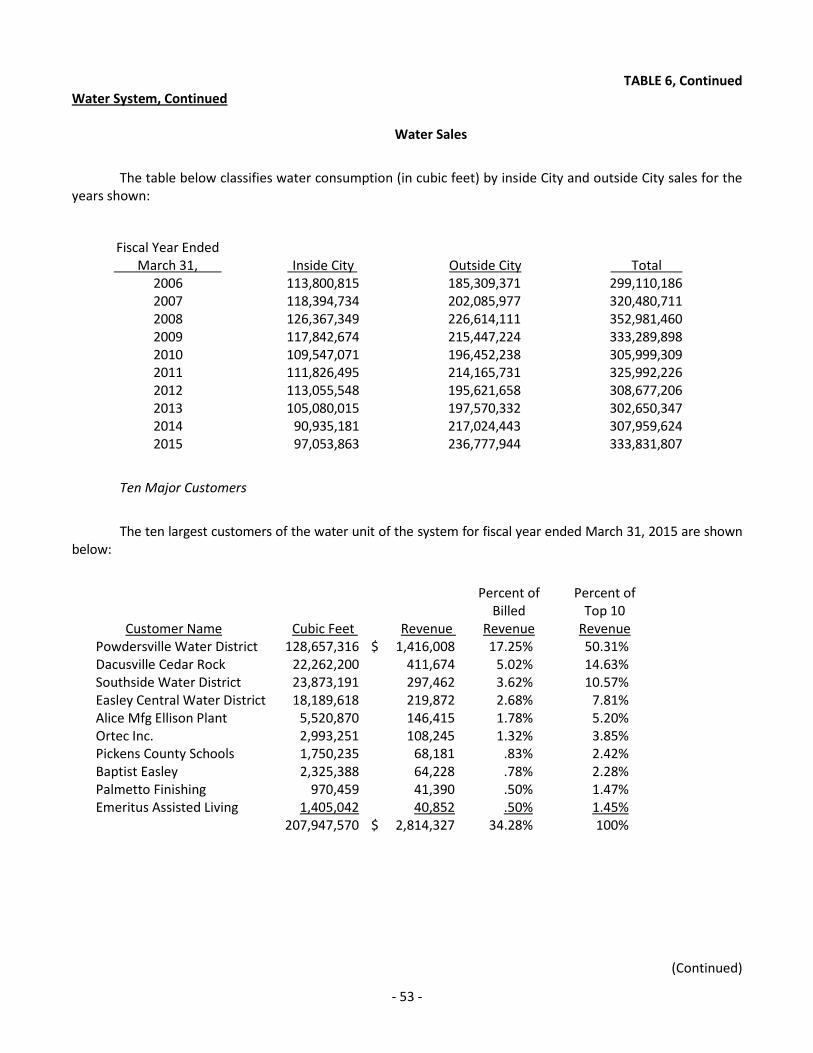
- 53 -
TABLE 6, Continued Water System, Continued
Water Sales
The table below classifies water consumption (in cubic feet) by inside City and outside City sales for the years shown:
Fiscal Year Ended March 31, Inside City Outside City Total
2006 113,800,815 185,309,371 299,110,186 2007 118,394,734 202,085,977 320,480,711 2008 126,367,349 226,614,111 352,981,460 2009 117,842,674 215,447,224 333,289,898 2010 109,547,071 196,452,238 305,999,309 2011 111,826,495 214,165,731 325,992,226 2012 113,055,548 195,621,658 308,677,206 2013 105,080,015 197,570,332 302,650,347 2014 90,935,181 217,024,443 307,959,624 2015 97,053,863 236,777,944 333,831,807
Ten Major Customers
The ten largest customers of the water unit of the system for fiscal year ended March 31, 2015 are shown below:
Percent of Percent of Billed Top 10
Customer Name Cubic Feet Revenue Revenue Revenue Powdersville Water District 128,657,316 $ 1,416,008 17.25% 50.31% Dacusville Cedar Rock 22,262,200 411,674 5.02% 14.63% Southside Water District 23,873,191 297,462 3.62% 10.57% Easley Central Water District 18,189,618 219,872 2.68% 7.81% Alice Mfg Ellison Plant 5,520,870 146,415 1.78% 5.20% Ortec Inc. 2,993,251 108,245 1.32% 3.85% Pickens County Schools 1,750,235 68,181 .83% 2.42% Baptist Easley 2,325,388 64,228 .78% 2.28% Palmetto Finishing 970,459 41,390 .50% 1.47% Emeritus Assisted Living 1,405,042 40,852 .50% 1.45%
207,947,570 $ 2,814,327 34.28% 100%
(Continued)
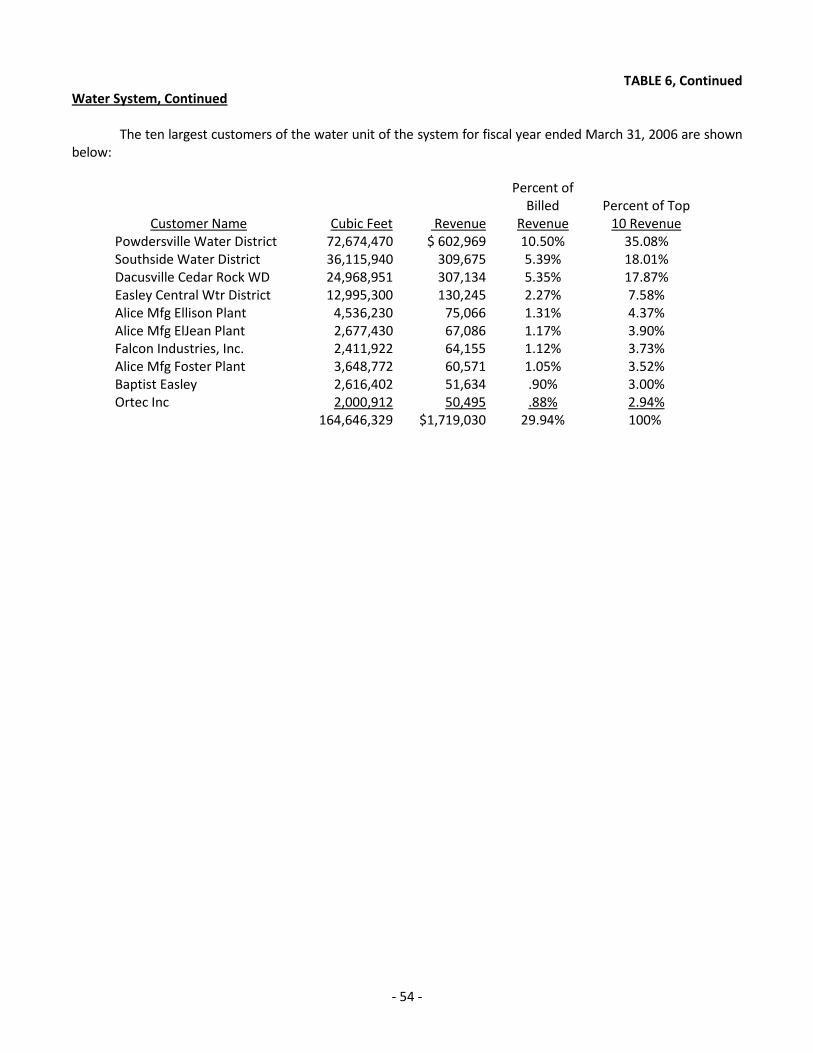
- 54 -
TABLE 6, Continued Water System, Continued
The ten largest customers of the water unit of the system for fiscal year ended March 31, 2006 are shown below:
Customer Name Cubic Feet Revenue
Percent of Billed
Revenue Percent of Top
10 Revenue Powdersville Water District 72,674,470 $ 602,969 10.50% 35.08% Southside Water District 36,115,940 309,675 5.39% 18.01% Dacusville Cedar Rock WD 24,968,951 307,134 5.35% 17.87% Easley Central Wtr District 12,995,300 130,245 2.27% 7.58% Alice Mfg Ellison Plant 4,536,230 75,066 1.31% 4.37% Alice Mfg ElJean Plant 2,677,430 67,086 1.17% 3.90% Falcon Industries, Inc. 2,411,922 64,155 1.12% 3.73% Alice Mfg Foster Plant 3,648,772 60,571 1.05% 3.52% Baptist Easley 2,616,402 51,634 .90% 3.00% Ortec Inc 2,000,912 50,495 .88% 2.94%
164,646,329 $1,719,030 29.94% 100%
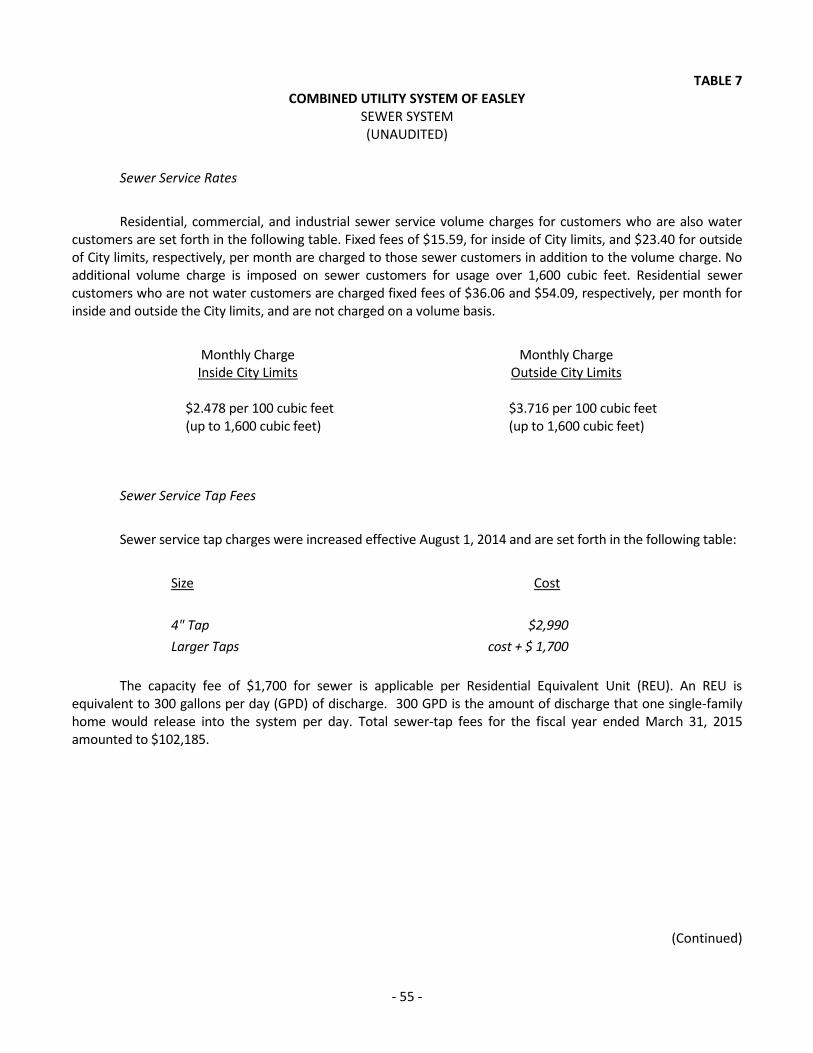
- 55 -
TABLE 7 COMBINED UTILITY SYSTEM OF EASLEY
SEWER SYSTEM (UNAUDITED)
Sewer Service Rates
Residential, commercial, and industrial sewer service volume charges for customers who are also water customers are set forth in the following table. Fixed fees of $15.59, for inside of City limits, and $23.40 for outside of City limits, respectively, per month are charged to those sewer customers in addition to the volume charge. No additional volume charge is imposed on sewer customers for usage over 1,600 cubic feet. Residential sewer customers who are not water customers are charged fixed fees of $36.06 and $54.09, respectively, per month for inside and outside the City limits, and are not charged on a volume basis.
Monthly Charge Inside City Limits
Monthly Charge Outside City Limits
$2.478 per 100 cubic feet (up to 1,600 cubic feet)
$3.716 per 100 cubic feet (up to 1,600 cubic feet)
Sewer Service Tap Fees
Sewer service tap charges were increased effective August 1, 2014 and are set forth in the following table:
Size Cost
4" Tap $2,990
Larger Taps cost + $ 1,700
The capacity fee of $1,700 for sewer is applicable per Residential Equivalent Unit (REU). An REU is
equivalent to 300 gallons per day (GPD) of discharge. 300 GPD is the amount of discharge that one single-family home would release into the system per day. Total sewer-tap fees for the fiscal year ended March 31, 2015 amounted to $102,185.
(Continued)
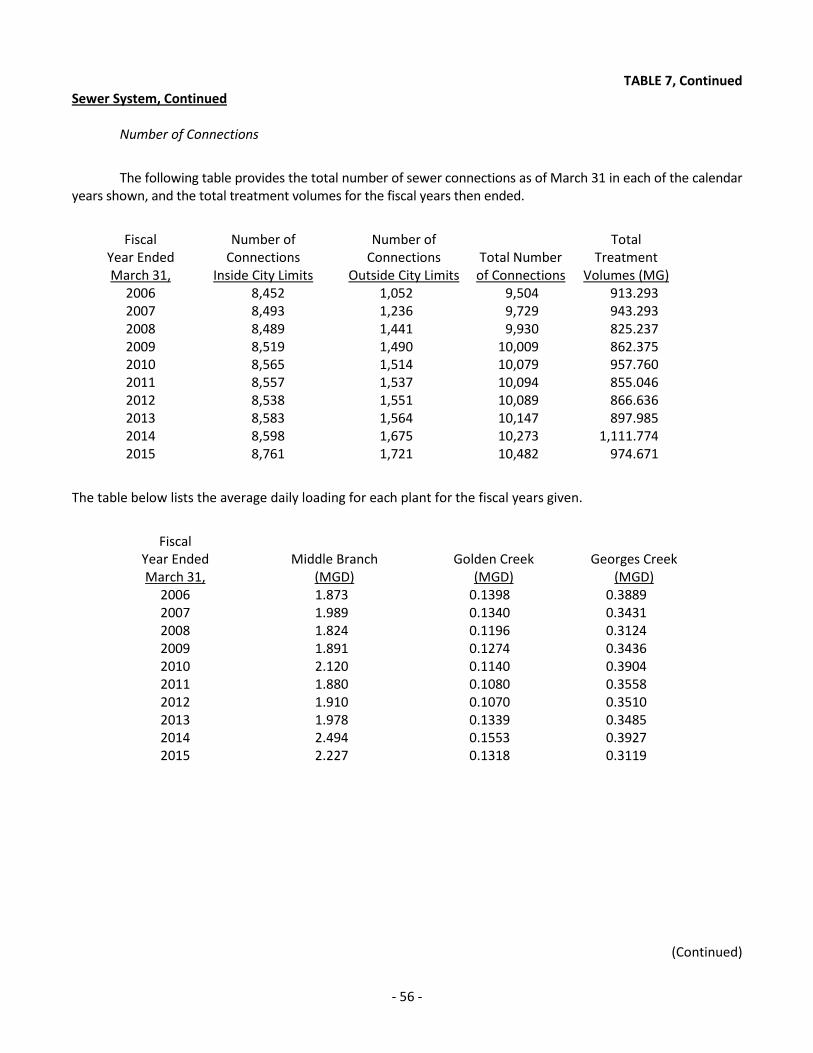
- 56 -
TABLE 7, Continued Sewer System, Continued
Number of Connections
The following table provides the total number of sewer connections as of March 31 in each of the calendar years shown, and the total treatment volumes for the fiscal years then ended.
Fiscal Year Ended March 31,
Number of Connections
Inside City Limits
Number of Connections
Outside City Limits
Total Number
of Connections
Total Treatment
Volumes (MG) 2006 8,452 1,052 9,504 913.293 2007 8,493 1,236 9,729 943.293 2008 8,489 1,441 9,930 825.237 2009 8,519 1,490 10,009 862.375 2010 8,565 1,514 10,079 957.760 2011 8,557 1,537 10,094 855.046 2012 8,538 1,551 10,089 866.636 2013 8,583 1,564 10,147 897.985 2014 8,598 1,675 10,273 1,111.774 2015 8,761 1,721 10,482 974.671
The table below lists the average daily loading for each plant for the fiscal years given.
Fiscal Year Ended March 31,
Middle Branch
(MGD)
Golden Creek
(MGD)
Georges Creek
(MGD) 2006 1.873 0.1398 0.3889 2007 1.989 0.1340 0.3431 2008 1.824 0.1196 0.3124 2009 1.891 0.1274 0.3436 2010 2.120 0.1140 0.3904 2011 1.880 0.1080 0.3558 2012 2013
1.910 1.978
0.1070 0.1339
0.3510 0.3485
2014 2.494 0.1553 0.3927 2015 2.227 0.1318 0.3119
(Continued)

- 57 -
TABLE 7, Continued Sewer System, Continued
Ten Major Users
Largest users of the sewer unit of the system for the fiscal year ended March 31, 2015 are shown below:
Customer Name Cubic Feet Revenue Percent of Billed
Revenue Percent of Top
10 Revenue Emeritus Assisted Living 1,405,042 $ 40,059 .91% 14.71% Baptist Easley 2,223,871 36,754 .83% 13.50% Pickens County Schools 942,120 35,764 .81% 13.14% Easley Housing Authority 1,083,828 33,408 .76% 12.27% Powers Properties 1,037,140 26,452 .60% 9.72% Creekside Apartments 826,966 23,484 .53% 8.63% Auston Woods 783,302 21,471 .49% 7.89% Palmetto Plating 841,349 21,412 .48% 7.86% City of Easley 547,754 18,936 .43% 6.95% Crestview Village 502,928 14,522 .33% 5.33%
10,194,300 $272,262 6.17% 100%
Largest users of the sewer unit of the system for the fiscal year ended March 31, 2006 are shown below:
Customer Name Cubic Feet Revenue Percent of Billed
Revenue Percent of Top
10 Revenue Ortec, Inc. 2,000,900 $ 52,397 1.66% 21.29% Baptist Easley 2,614,641 34,377 1.09% 13.97% Pickens County Schools 1,513,687 28,555 .90% 11.60% Emeritus Assisted Living 1,307,991 26,422 .84% 10.74% Easley Housing Authority 1,043,986 22,750 .72% 9.24% Southeastern Properties 1,047,867 18,353 .58% 7.46% Palmetto Plating 950,934 16,931 .54% 6.88% Creekside Apartments 834,333 16,872 .53% 6.86% Crestview Village Apartments 787,948 15,146 .48% 6.15% Hillandale Investments 529,078 14,309 .45% 5.81%
12,631,365 $246,112 7.79% 100%
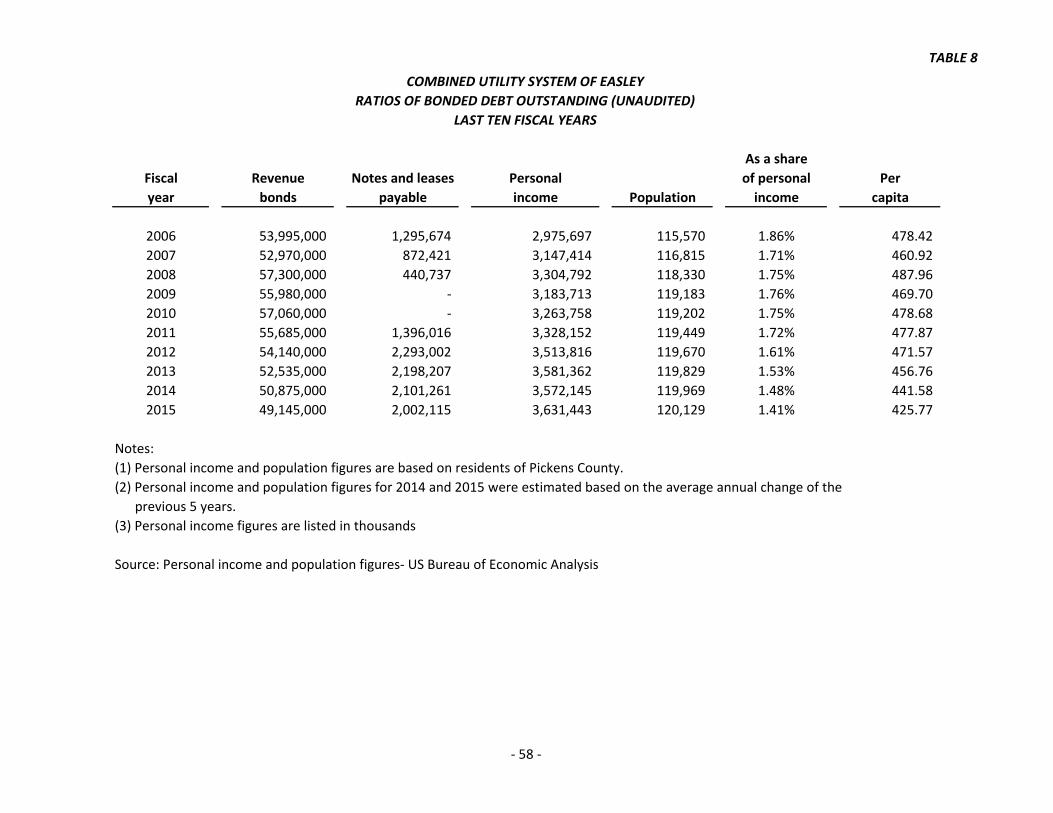
TABLE 8
As a share
Fiscal Revenue Notes and leases Personal of personal Per
year bonds payable income Population income capita
2006 53,995,000 1,295,674 2,975,697 115,570 1.86% 478.42
2007 52,970,000 872,421 3,147,414 116,815 1.71% 460.92
2008 57,300,000 440,737 3,304,792 118,330 1.75% 487.96
2009 55,980,000 - 3,183,713 119,183 1.76% 469.70
2010 57,060,000 - 3,263,758 119,202 1.75% 478.68
2011 55,685,000 1,396,016 3,328,152 119,449 1.72% 477.87
2012 54,140,000 2,293,002 3,513,816 119,670 1.61% 471.57
2013 52,535,000 2,198,207 3,581,362 119,829 1.53% 456.76
2014 50,875,000 2,101,261 3,572,145 119,969 1.48% 441.58
2015 49,145,000 2,002,115 3,631,443 120,129 1.41% 425.77
Notes:
(1) Personal income and population figures are based on residents of Pickens County.
(2) Personal income and population figures for 2014 and 2015 were estimated based on the average annual change of the
previous 5 years.
(3) Personal income figures are listed in thousands
Source: Personal income and population figures- US Bureau of Economic Analysis
COMBINED UTILITY SYSTEM OF EASLEY
RATIOS OF BONDED DEBT OUTSTANDING (UNAUDITED)
LAST TEN FISCAL YEARS
- 58 -

TABLE 9
2006 2007 2008 2009 2010 2011 2012 2013 2014 2015
Gross Revenues
Electric unit 25,177,744$ 26,201,754$ 27,896,796$ 28,322,173$ 29,339,242$ 31,395,150$ 32,182,226$ 33,031,031$ 33,695,439$ 35,485,942$
Water unit 5,829,034 6,720,830 7,216,864 7,172,427 6,964,183 7,420,299 7,601,556 7,560,958 7,730,043 8,207,077
Wastewater unit 3,206,432 3,661,866 3,837,504 4,047,562 3,995,049 4,184,933 4,298,431 4,419,901 4,404,106 4,625,864
Tap fees/developer fees 363,063 944,119 753,513 288,472 228,883 269,358 533,199 428,180 905,780 434,317
Other income 1,740,088 1,883,775 1,729,339 555,757 284,118 512,350 1,424,688 523,335 258,790 561,337
Gross revenues 36,316,361 39,412,344 41,434,016 40,386,391 40,811,475 43,782,090 46,040,100 45,963,405 46,994,158 49,314,537
Expenses
Electric operations 20,020,094 21,144,901 21,960,582 22,780,966 23,555,402 25,080,473 26,728,209 27,567,113 29,032,802 31,541,559
Water operations 2,681,214 2,968,765 2,999,367 2,733,476 2,371,750 2,364,074 2,613,875 2,410,846 2,553,780 2,667,779
Wastewater operations 1,587,427 1,789,669 1,903,460 2,015,789 2,020,841 1,846,675 1,964,772 2,081,160 2,182,444 2,306,245
Customer service and
administration (1) 3,421,280 3,788,666 4,209,164 4,318,871 4,478,903 5,098,198 4,939,654 4,838,125 4,816,460 4,664,258
Total expense 27,710,015 29,692,001 31,072,573 31,849,102 32,426,896 34,389,420 36,246,510 36,897,244 38,585,486 41,179,841
Net revenues available
for debt service 8,606,346$ 9,720,343$ 10,361,443$ 8,537,289$ 8,384,579$ 9,392,670$ 9,793,590$ 9,066,161$ 8,408,672$ 8,134,696$
Debt service 2,353,055$ 3,056,093$ 3,539,038$ 3,879,405$ 3,962,912$ 3,924,534$ 4,160,480$ 4,158,260$ 4,167,360$ 4,158,611$
Debt service coverage 3.66 3.18 2.93 2.20 2.12 2.39 2.35 2.18 2.02 1.96
(1) Municipal fees paid to the city of Easley have been eliminated for debt service calculation.
COMBINED UTILITY SYSTEM OF EASLEY
HISTORICAL STATEMENTS OF REVENUES, EXPENSES, DEBT SERVICE AND DEBT SERVICE COVERAGE
(UNAUDITED)
LAST TEN FISCAL YEARS
- 59 -
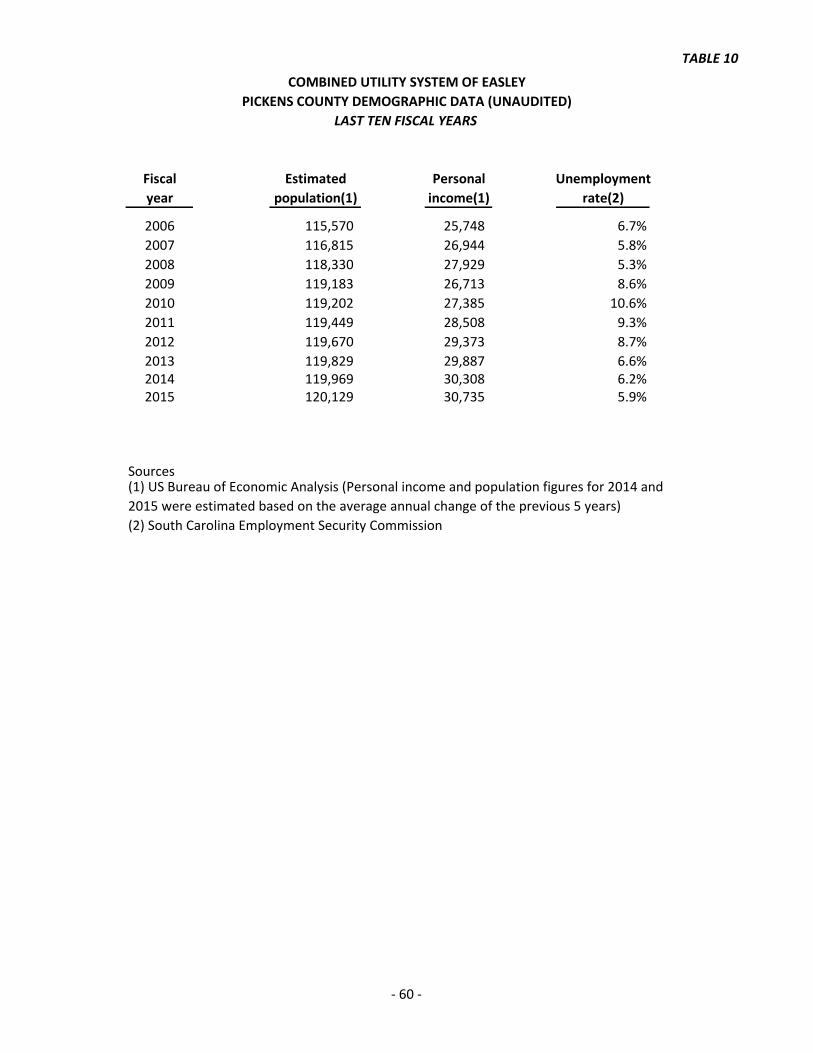
TABLE 10
Fiscal Estimated Personal Unemployment
year population(1) income(1) rate(2)
2006 115,570 25,748 6.7%
2007 116,815 26,944 5.8%
2008 118,330 27,929 5.3%
2009 119,183 26,713 8.6%
2010 119,202 27,385 10.6%
2011 119,449 28,508 9.3%
2012 119,670 29,373 8.7%
2013 119,829 29,887 6.6%2014 119,969 30,308 6.2%2015 120,129 30,735 5.9%
Sources
(2) South Carolina Employment Security Commission
COMBINED UTILITY SYSTEM OF EASLEY
PICKENS COUNTY DEMOGRAPHIC DATA (UNAUDITED)
LAST TEN FISCAL YEARS
(1) US Bureau of Economic Analysis (Personal income and population figures for 2014 and
2015 were estimated based on the average annual change of the previous 5 years)
- 60 -
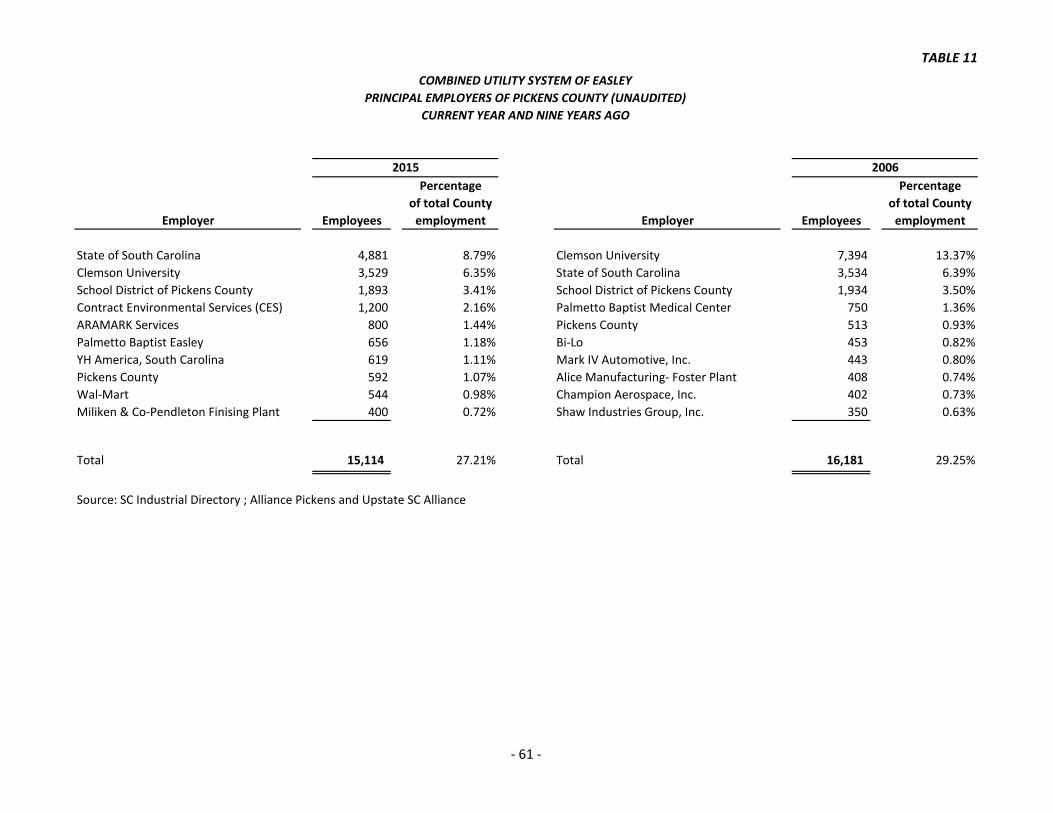
TABLE 11
Percentage Percentage
of total County of total County
Employer Employees employment Employer Employees employment
State of South Carolina 4,881 8.79% Clemson University 7,394 13.37%
Clemson University 3,529 6.35% State of South Carolina 3,534 6.39%
School District of Pickens County 1,893 3.41% School District of Pickens County 1,934 3.50%
Contract Environmental Services (CES) 1,200 2.16% Palmetto Baptist Medical Center 750 1.36%
ARAMARK Services 800 1.44% Pickens County 513 0.93%
Palmetto Baptist Easley 656 1.18% Bi-Lo 453 0.82%
YH America, South Carolina 619 1.11% Mark IV Automotive, Inc. 443 0.80%
Pickens County 592 1.07% Alice Manufacturing- Foster Plant 408 0.74%
Wal-Mart 544 0.98% Champion Aerospace, Inc. 402 0.73%
Miliken & Co-Pendleton Finising Plant 400 0.72% Shaw Industries Group, Inc. 350 0.63%
Total 15,114 27.21% Total 16,181 29.25%
Source: SC Industrial Directory ; Alliance Pickens and Upstate SC Alliance
COMBINED UTILITY SYSTEM OF EASLEY
PRINCIPAL EMPLOYERS OF PICKENS COUNTY (UNAUDITED)
2015 2006
CURRENT YEAR AND NINE YEARS AGO
- 61 -
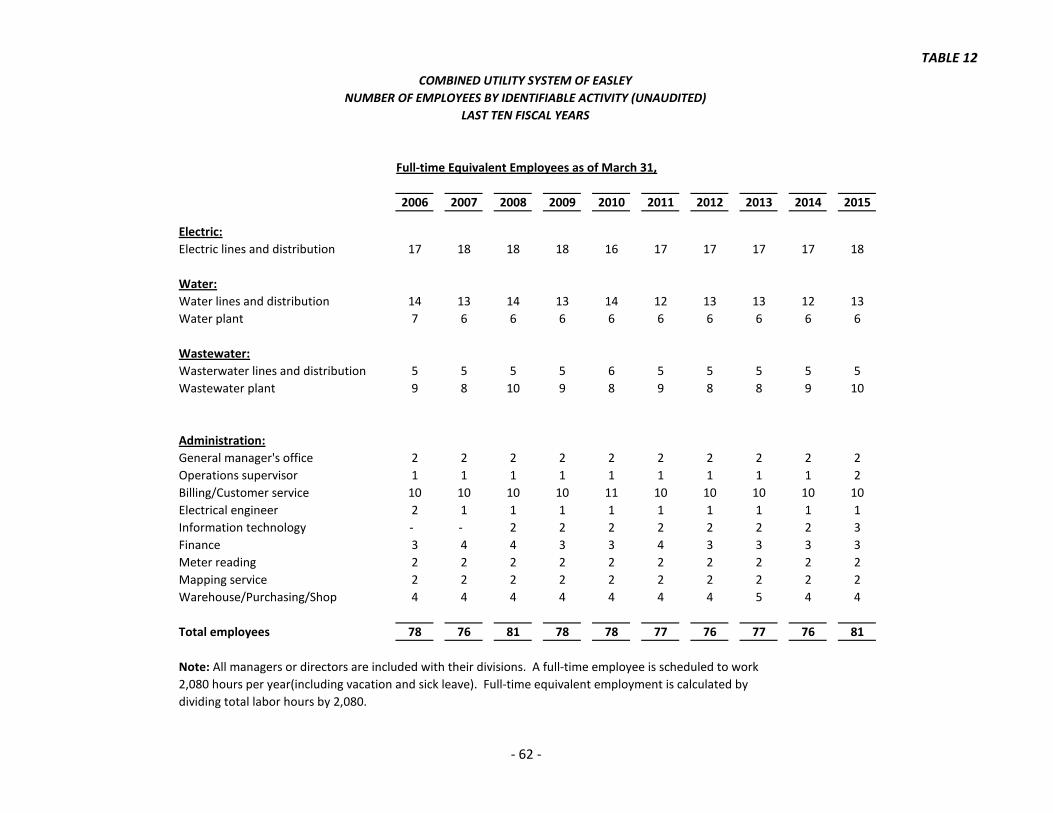
TABLE 12
2006 2007 2008 2009 2010 2011 2012 2013 2014 2015
Electric:
Electric lines and distribution 17 18 18 18 16 17 17 17 17 18
Water:
Water lines and distribution 14 13 14 13 14 12 13 13 12 13
Water plant 7 6 6 6 6 6 6 6 6 6
Wastewater:
Wasterwater lines and distribution 5 5 5 5 6 5 5 5 5 5
Wastewater plant 9 8 10 9 8 9 8 8 9 10
Administration:
General manager's office 2 2 2 2 2 2 2 2 2 2
Operations supervisor 1 1 1 1 1 1 1 1 1 2
Billing/Customer service 10 10 10 10 11 10 10 10 10 10
Electrical engineer 2 1 1 1 1 1 1 1 1 1
Information technology - - 2 2 2 2 2 2 2 3
Finance 3 4 4 3 3 4 3 3 3 3
Meter reading 2 2 2 2 2 2 2 2 2 2
Mapping service 2 2 2 2 2 2 2 2 2 2
Warehouse/Purchasing/Shop 4 4 4 4 4 4 4 5 4 4
Total employees 78 76 81 78 78 77 76 77 76 81
Note: All managers or directors are included with their divisions. A full-time employee is scheduled to work
2,080 hours per year(including vacation and sick leave). Full-time equivalent employment is calculated by
dividing total labor hours by 2,080.
Full-time Equivalent Employees as of March 31,
COMBINED UTILITY SYSTEM OF EASLEY
NUMBER OF EMPLOYEES BY IDENTIFIABLE ACTIVITY (UNAUDITED)
LAST TEN FISCAL YEARS
- 62 -
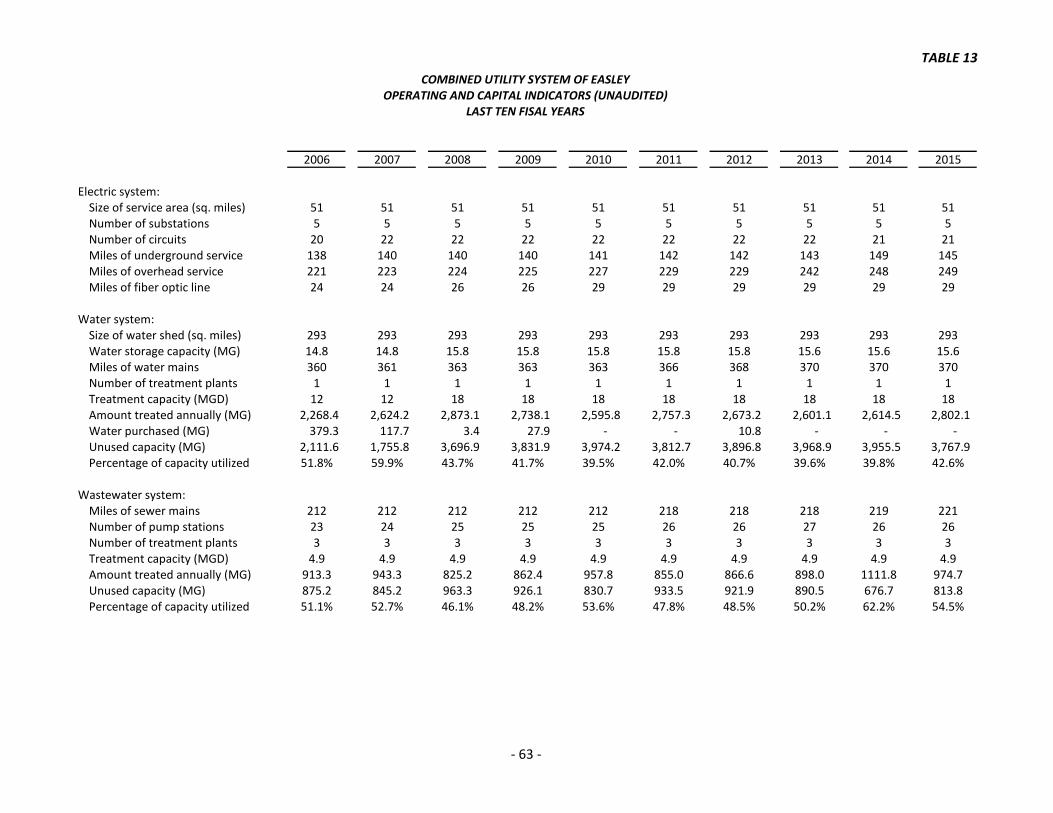
TABLE 13
2006 2007 2008 2009 2010 2011 2012 2013 2014 2015
Electric system:Size of service area (sq. miles) 51 51 51 51 51 51 51 51 51 51Number of substations 5 5 5 5 5 5 5 5 5 5Number of circuits 20 22 22 22 22 22 22 22 21 21Miles of underground service 138 140 140 140 141 142 142 143 149 145Miles of overhead service 221 223 224 225 227 229 229 242 248 249Miles of fiber optic line 24 24 26 26 29 29 29 29 29 29
Water system:Size of water shed (sq. miles) 293 293 293 293 293 293 293 293 293 293Water storage capacity (MG) 14.8 14.8 15.8 15.8 15.8 15.8 15.8 15.6 15.6 15.6Miles of water mains 360 361 363 363 363 366 368 370 370 370Number of treatment plants 1 1 1 1 1 1 1 1 1 1Treatment capacity (MGD) 12 12 18 18 18 18 18 18 18 18Amount treated annually (MG) 2,268.4 2,624.2 2,873.1 2,738.1 2,595.8 2,757.3 2,673.2 2,601.1 2,614.5 2,802.1 Water purchased (MG) 379.3 117.7 3.4 27.9 - - 10.8 - - - Unused capacity (MG) 2,111.6 1,755.8 3,696.9 3,831.9 3,974.2 3,812.7 3,896.8 3,968.9 3,955.5 3,767.9 Percentage of capacity utilized 51.8% 59.9% 43.7% 41.7% 39.5% 42.0% 40.7% 39.6% 39.8% 42.6%
Wastewater system:Miles of sewer mains 212 212 212 212 212 218 218 218 219 221Number of pump stations 23 24 25 25 25 26 26 27 26 26Number of treatment plants 3 3 3 3 3 3 3 3 3 3Treatment capacity (MGD) 4.9 4.9 4.9 4.9 4.9 4.9 4.9 4.9 4.9 4.9Amount treated annually (MG) 913.3 943.3 825.2 862.4 957.8 855.0 866.6 898.0 1111.8 974.7Unused capacity (MG) 875.2 845.2 963.3 926.1 830.7 933.5 921.9 890.5 676.7 813.8Percentage of capacity utilized 51.1% 52.7% 46.1% 48.2% 53.6% 47.8% 48.5% 50.2% 62.2% 54.5%
COMBINED UTILITY SYSTEM OF EASLEYOPERATING AND CAPITAL INDICATORS (UNAUDITED)
LAST TEN FISAL YEARS
- 63 -