Carte localisation séisme + aftershocks. Anne Replumaz Thèse.

Journal of Volcanology and Geothermal Research 188 (2009) 260–276
Contents lists available at ScienceDirect
Journal of Volcanology and Geothermal Research
j ourna l homepage: www.e lsev ie r.com/ locate / jvo lgeores
Earthquake swarm and b-value characterization of the Yellowstonevolcano-tectonic system
Jamie Farrell a,⁎, Stephan Husen b, Robert B. Smith a
a University of Utah Dept. of Geology and Geophysics, Salt Lake City, UT, 84112, USAb Swiss Seismological Service, ETH Zurich, CH8092 Zurich, Switzerland
⁎ Corresponding author.E-mail address: [email protected] (J. Farrell).
0377-0273/$ – see front matter © 2009 Elsevier B.V. Adoi:10.1016/j.jvolgeores.2009.08.008
a b s t r a c t
a r t i c l e i n f oArticle history:Received 30 October 2008Accepted 15 August 2009Available online 25 August 2009
Keywords:Yellowstoneb-valueearthquake swarmseismicityvolcano
The Yellowstone volcanic field, Yellowstone National Park, is one of the most seismically active areas of thewestern U.S., experiencing the deadly 1959 M7.5 Hebgen Lake, MT, earthquake adjacent to the 0.64-Macaldera, as well as more than 30,000 earthquakes from 1973 to 2007. This well-recorded seismic activityoffers the opportunity to study the temporal and spatial occurrence of earthquakes and extensive earthquakeswarms and how they relate to active volcanic and tectonic processes. We characterize the distribution ofearthquakes by analyzing the rate of occurrence characterized by the b-value. To accurately determine b-values, the earthquake catalog was filtered to identify statistically time- and spatially-dependent relatedevents, defined as swarms, from independent single main and aftershocks. An algorithm was employed thatidentified 69 swarms for 1984–2006 based on inter-event times and spatial clustering. The swarms varied induration from 1 to 46 days with the number of events varying from 30 to 722 with magnitudes of −1.2 to4.8. All of the swarm events as well as the 597 events triggered by the 2002 Denali fault, AK, earthquake wereremoved from the catalog for analysis. The catalog data were then filtered for a magnitude of completeness(MCOMP) of 1.5 and the b-value distribution for the Yellowstone region was determined with the de-swarmed data. b-values ranged from 0.6±0.1 to 1.5±0.05 with the highest values associated with theyouthful 150,000-year old Mallard Lake resurgent dome. These variations are interpreted to be related tovariations in stresses accompanying the migration of magmatic and hydrothermal fluids. An area of high b-values (up to 1.3±0.1) associated with the Hebgen Lake fault zone west of the Yellowstone caldera could berelated to the transport of magmatic fluids out of the Yellowstone volcanic system or could be indicative of arelative low stress regime resulting from the stress release by the Hebgen Lake earthquake. An area of low b-values (0.6±0.1) south of the Yellowstone caldera is interpreted as evidence of a relatively higher stressregime associated with an area of dominantly extensional stress. This seismicity was associated with a nearly90° change in the principal stress axes direction to northeast-southwest, compared to east-west within theYellowstone caldera, and may be influenced by buoyancy loading by the Yellowstone hotspot.
© 2009 Elsevier B.V. All rights reserved.
1. Introduction
The Yellowstone Plateau, centered on Yellowstone National Park,WY, ID, and MT, reflects an area of widespread hydrothermal featuresand Quaternary silicic volcanism characterized by three giant caldera-forming eruptions (Christiansen, 1984, 2001), extensive post-calderarhyolitic eruptions as young as 70,000 years ago (Christiansen, 1984,2001), in addition extraordinarily high heat flow (>2000 mW/m2)(Morgan et al., 1977; DeNosaquo et al., 2009-this volume), unprec-edented high rates of modern crustal deformation, and a wellseismically defined crustal magma chamber and extensive seismicity(Smith et al., 2009-this volume) characterize the system. Thirty-threeyears of seismic recording by the Yellowstone seismic network has
ll rights reserved.
allowed the assessment of the frequency of earthquake occurrence,characterized by b-values, that were then correlated with activevolcanic and tectonic features.
The b-value is a measure of the relative number of small to largeearthquakes that occur in a given area in a given timeperiod. In particular,theb-value is the slopeof the frequency-magnitudedistribution (Ishimotoand Iida, 1939; Gutenberg and Richter, 1944) for a given population ofearthquakes. Studies have shown that the b-value changes with materialheterogeneity (Mogi, 1962), thermal gradient (Warren and Latham,1970), and applied stress (Scholz, 1968;Wyss, 1973;Urbancic et al., 1992;Schorlemmer et al., 2004; Schorlemmer andWiemer, 2005; Schorlemmeret al., 2005). In tectonic areas, the b-value is generally around 1.0 (Frolichand Davis, 1993). In contrast, volcanic areas are characterized by b-valuesgreater or less than 1.0 with values as high as 3.0 (McNutt, 2005).
Over 30,000 earthquakes, −0.5<MC≤6, have been recorded inthe Yellowstone area since 1973 (Fig. 1). This earthquake data setoffers the opportunity to study the temporal and spatial occurrence of
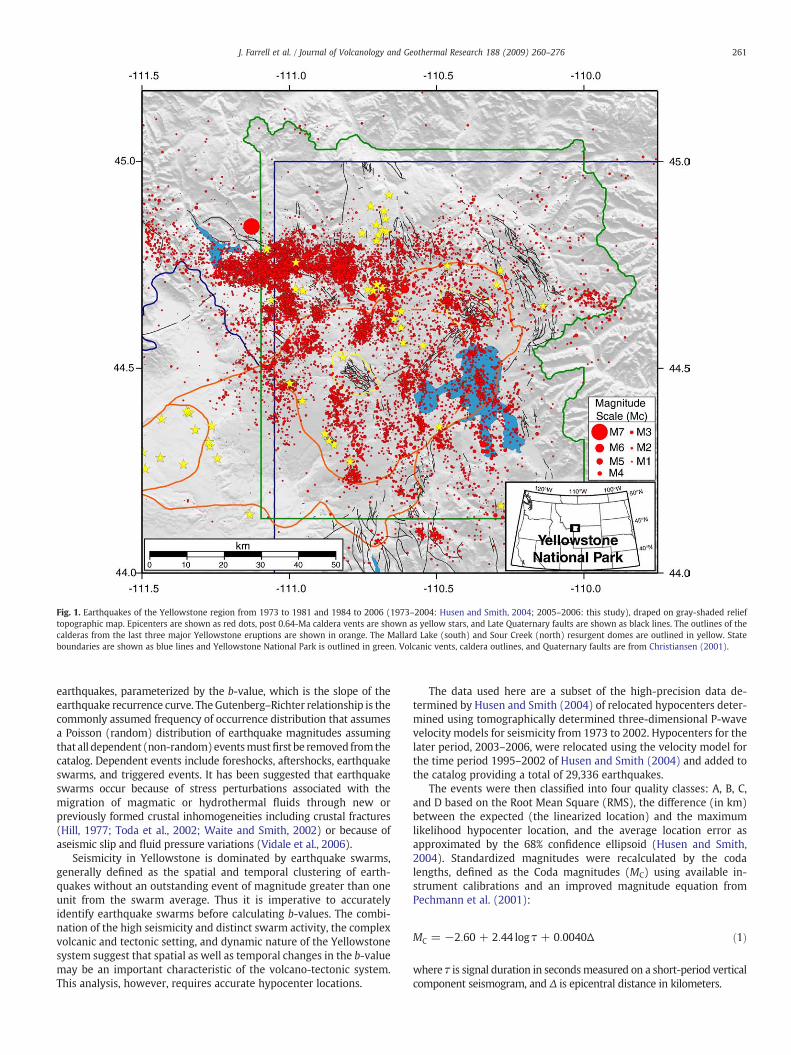
Fig. 1. Earthquakes of the Yellowstone region from 1973 to 1981 and 1984 to 2006 (1973–2004: Husen and Smith, 2004; 2005–2006: this study), draped on gray-shaded relieftopographic map. Epicenters are shown as red dots, post 0.64-Ma caldera vents are shown as yellow stars, and Late Quaternary faults are shown as black lines. The outlines of thecalderas from the last three major Yellowstone eruptions are shown in orange. The Mallard Lake (south) and Sour Creek (north) resurgent domes are outlined in yellow. Stateboundaries are shown as blue lines and Yellowstone National Park is outlined in green. Volcanic vents, caldera outlines, and Quaternary faults are from Christiansen (2001).
261J. Farrell et al. / Journal of Volcanology and Geothermal Research 188 (2009) 260–276
earthquakes, parameterized by the b-value, which is the slope of theearthquake recurrence curve. TheGutenberg–Richter relationship is thecommonly assumed frequency of occurrence distribution that assumesa Poisson (random) distribution of earthquake magnitudes assumingthat all dependent (non-random)eventsmustfirst be removed fromthecatalog. Dependent events include foreshocks, aftershocks, earthquakeswarms, and triggered events. It has been suggested that earthquakeswarms occur because of stress perturbations associated with themigration of magmatic or hydrothermal fluids through new orpreviously formed crustal inhomogeneities including crustal fractures(Hill, 1977; Toda et al., 2002; Waite and Smith, 2002) or because ofaseismic slip and fluid pressure variations (Vidale et al., 2006).
Seismicity in Yellowstone is dominated by earthquake swarms,generally defined as the spatial and temporal clustering of earth-quakes without an outstanding event of magnitude greater than oneunit from the swarm average. Thus it is imperative to accuratelyidentify earthquake swarms before calculating b-values. The combi-nation of the high seismicity and distinct swarm activity, the complexvolcanic and tectonic setting, and dynamic nature of the Yellowstonesystem suggest that spatial as well as temporal changes in the b-valuemay be an important characteristic of the volcano-tectonic system.This analysis, however, requires accurate hypocenter locations.
The data used here are a subset of the high-precision data de-termined by Husen and Smith (2004) of relocated hypocenters deter-mined using tomographically determined three-dimensional P-wavevelocity models for seismicity from 1973 to 2002. Hypocenters for thelater period, 2003–2006, were relocated using the velocity model forthe time period 1995–2002 of Husen and Smith (2004) and added tothe catalog providing a total of 29,336 earthquakes.
The events were then classified into four quality classes: A, B, C,and D based on the Root Mean Square (RMS), the difference (in km)between the expected (the linearized location) and the maximumlikelihood hypocenter location, and the average location error asapproximated by the 68% confidence ellipsoid (Husen and Smith,2004). Standardized magnitudes were recalculated by the codalengths, defined as the Coda magnitudes (MC) using available in-strument calibrations and an improved magnitude equation fromPechmann et al. (2001):
MC = −2:60 + 2:44 logτ + 0:0040Δ ð1Þ
where τ is signal duration in secondsmeasured on a short-period verticalcomponent seismogram, and Δ is epicentral distance in kilometers.
262 J. Farrell et al. / Journal of Volcanology and Geothermal Research 188 (2009) 260–276
Because of the elimination of previous systematic time-dependentmagnitude shifts, the recomputed MC values are considered moreconsistent and reliable than previous MC estimations. Essentially allthe earthquakes in the catalog have magnitudes less than or equal toMC=4.0; 99.1% have MC≤3.0; 91.2% have MC≤2.0; and 53.6% haveMC≤1.0. Because of the importance of high quality locations andwell-constrained magnitudes in calculating b-values, only A, B, or C qualityevents were used because they have RMS values less than 0.5 s. A totalof 123 quality D events were rejected from the analysis ranging inmagnitude from less than 0 to 3.5. Also, only earthquakes from 1984to 2006 were used in this study because of the more consistent andreliable nature of the magnitudes due to improved digital monitoringand geographic network coverage with more instruments. This left23,054 events in the data set hereafter referred to as the catalog ofearthquakes. The average MC for the time period of 1984 to 2006 is1.0, and only 10% of the earthquakes have MC>2.0.
Earthquake swarms were then identified and were removed fromthe dataset using the algorithm from Waite (1999) in which swarmsare identified based on an inter-event time and a distance betweentwo related events. Earthquakes triggered by the M7.9 2002 Denalifault earthquake (Husen et al., 2004b; Husen et al., 2004c) were alsoidentified and removed from the data. The magnitude of complete-ness was then calculated for different spatial and temporal subsetsand the catalog was cut at the highest magnitude of completenessvalue. The remaining events were used to calculate the b-valuedistribution for the Yellowstone volcanic–tectonic system.
A total of 69 distinct earthquake swarms were identified compris-ing 8924 earthquakes, or 39% of the total number of earthquakes from1984–2006. These eventswere also removed from the catalog thatwaslimited to the threshold of completeness of MC=1.5. The remaining2747 earthquakes were used to calculate b-values. Results show thatthe b-value varies laterally in Yellowstone from 1.5±0.05 near theMallard Lake resurgent dome to 0.6±0.1 south of the Yellowstonecaldera near the Mt. Sheridan fault and the northern segment of theTeton fault.
2. Geological setting and seismicity in Yellowstone
The Yellowstone volcanic system is one of the largest active silicicvolcanic systems in the world (Christiansen, 2001). It forms atopographically high plateau of ∼500m excess elevation relative tothe Basin-Range/Rocky Mountains as the result of mantle hotspotbouyancy (see summary by Smith et al., 2009-this volume). Theyouthful volcanic history of Yellowstone is dominated by threecataclysmic caldera-forming eruptions in the past twomillion years at2.05, 1.3 and 0.64 Ma (Christiansen, 2001). The latest eruption(0.64 Ma) createdwhat is subsequently referred to as the Yellowstonecaldera, which extends 40×60 km (Fig. 2). Two structural resurgentdomes formed after the caldera eruptions: the Mallard Lake resurgentdome in the southwestern portion of the Yellowstone caldera and theSour Creek resurgent dome in the northeast part of the Yellowstonecaldera (Fig. 2). In the last 640,000 years, at least 30 much smallerrhyolitic and basaltic flows as young as 70,000 years old have coveredmuch of the Yellowstone Plateau.
With over 10,000 geysers, hot springs, and fumaroles, Yellowstonehas the world's highest concentration of hydrothermal featuresreflecting its extraordinarily high convective groundwater circulation(Fournier, 1989). The large hydrothermal systems are considered tobe the result of hot water circulating along fractures in the crustheated by crystallizing magma (Fournier, 1989).
Four local earthquake tomography studies of Yellowstone (Benzand Smith, 1984; Lynch, 1999; Miller and Smith, 1999; Husen et al.,2004a) have imaged at various resolutions, with progressions in dataaccess and expansion of the seismic network, a well defined low(−6%) VP body in the upper crust beneath the Yellowstone calderathat has been interpreted as a body of 8–15% partial melt (Miller and
Smith, 1999; Husen et al., 2004a). By the addition of several three-component seismographs in the Yellowstone region, Husen et al.(2004a) was able to extend the earlier work by selecting 3374 localearthquakes between 1995 and 2001 and using 34,538 P-wave arrivaltimes and 5875 S–P times to image the 3-D VP and VP/VS structure ofthe upper crust beneath Yellowstone. Husen et al. (2004a) imaged alow (−10%) VP body at ∼2 km depth on the northwest boundary ofthe Yellowstone caldera as well as a low (−5%) VP/VS body in thesame area. This low VP and VP/VS body has been interpreted as a CO2
gas-filled body (Husen et al., 2004a).Crustal deformation monitoring of Yellowstone by precise spirit
leveling and more recent Global Positioning System (GPS) andInterferometric Synthetic Aperture Radar (InSAR) measurements haveshown unprecedented caldera uplift and subsidence during the last80 years. This caldera-wide deformation includes uplift of up to 1 mfrom 1923 to 1984 measured by leveling (Pelton and Smith, 1982;Dzurisin et al., 1990). Beginning in 1987 the University of Utah begancampaign GPS studies in the Yellowstone region and in 1996 data fromcontinuous GPS stations were used to measure ground deformation.From 1987 to the present, ground deformation was measured fromcampaign and continuous GPS measurements. The results show thatfrom1987 to 1995 theYellowstone caldera subsided at amaximum rateof −14±3mm/yr centered near the Sour Creek dome for a total of112 mm. From 1995 to 2000 the Yellowstone caldera returned to upliftwith a maximum rate of 15±4 mm/yr for a total of 75 mm (Puskaset al., 2007). However the center of uplift during this time period wascentered northwest of the Yellowstone caldera in the Norris–Mammothcorridor (Fig. 2). From 2000 to 2003 the uplift continued northwest ofthe Yellowstone caldera at a maximum rate of 12±4 mm/yr for anadditional 36 mm of displacement but the central caldera axis returnedto subsidence at a maximum rate of −9±6 mm/yr for an additional27 mm subsidence (Puskas et al., 2007).
Remarkably, since late 2004, Yellowstone has been experiencingaccelerated uplift of the 0.64-Ma calderawith rates up to 70 mm/yr, threetimes greater than previously observed deformation episodes (Changet al., 2007). Source modeling of the deformation suggests a near-horizontal expanding magma body over an area 40×60 km2, at 9 kmbeneath the Yellowstone caldera, notably located near the top of theseismically imaged crustalmagma chamber. In addition, tens to hundredsof small earthquakes (M<3) occurred during the deformation period andwere concentrated within the modeled dilatation zone while the rest ofthe Yellowstone caldera experienced low seismicity (Chang et al., 2007).
Perhaps one of the most striking features of the YellowstonePlateau is its extraordinarily high heatflow. The presence of crys-tallizing magma at shallow depths (∼8 km) fuels the regional heatflow at Yellowstone by combined conduction and convection, esti-mated at more than 2000 mW/m2 (Blackwell, 1969; Fournier, 1989;DeNosaquo et al., 2009-this volume), this is more than 30 times thecontinental average (Fournier, 1989). Given a conductive heat flow of∼200 mW/m2, the Nusselt number (which is the ratio of convectiveheat flow and conductive heat flow) for the Yellowstone caldera is∼10. This compares to values of ∼6 to 8 for the Long Valley caldera ineastern California (Hill, 1992).
The Yellowstone Plateau is one of the most seismically active areasof the western U.S. and is part of the distinct N–S band of intraplateseismicity known as the Intermountain seismic belt (Smith and Sbar,1974; Smith and Arabasz, 1991) (Fig. 1). Moreover, the Yellowstonearea has experienced the largest historic earthquake of the ISB: theAugust, MS7.5 1959 Hebgen Lake, Montana event located ∼25 kmnorthwest of the Yellowstone caldera (Doser, 1985). The Yellowstonecaldera has also experienced a ML6.1 earthquake in 1975 southeast ofNorris Junction (Pitt et al., 1979, Smith and Arabasz, 1991).
Overall, seismic activity in Yellowstone is characterized by swarmsof small, shallow earthquakes. Focal depths within the Yellowstonecaldera are limited by high temperatures to the shallow depth of thebrittle–ductile transition at 4–6 km and deepen to up to 18 km in the

Fig. 2. Gray-shaded topographic relief map of the Yellowstone volcanic field showing calderas and Cenozoic faults after Christiansen (2001). Major faults are shown as thick blacklines. MF=Madison fault, HLF=Hebgen Lake fault, CF= Centennial fault, EGF= East Gallatin fault, TF= Teton fault, MSF=Mt. Sheridan fault, YLF=Yellowstone Lake fault, BFF=Buffalo Fork fault, and UYF = Upper Yellowstone Valley fault. The Norris Geyser Basin location is shown as NGB. Madison Junction is shown as MJ. Calderas are shown by age: I —2.05 Ma, II — 1.3 Ma, and III — 0.64 Ma. The bold gray dashed line outlines a region of highly fractured crust and high seismicity that may mark the extent of caldera I. The northernboundary of caldera I is highlighted by a topographic contrast that may have resulted from the 2.05 Ma catastrophic eruption. ML and SC represent the Mallard Lake and Sour Creekresurgent domes respectively, which are outlined with a dashed line (modified from Waite (1999)).
263J. Farrell et al. / Journal of Volcanology and Geothermal Research 188 (2009) 260–276
much cooler tectonic regime in the Hebgen Lake, MT area west of theYellowstone caldera (Smith et al., 2009-this volume). The mostintense seismicity extends from the Hebgen Lake area east to thenorthern Yellowstone caldera boundary near Norris Junction (Fig. 1).Although this area only constitutes 16% of the Yellowstone area, itcontains 75% of the earthquakes from 1973 to 2006. Linear bands ofepicenters within and adjacent to the Yellowstone caldera are alignedgenerally north–northwest parallel to alignments of post-calderavolcanic vents and large regional faults (Fig. 1). These normal faultsare assumed to be buried at depth beneath young post-calderarhyolite flows and are inferred to have once been continuous normalfaults bounding mountain blocks of Basin-Range origin (Christiansen,1984; Smith and Braile, 1994) (Fig. 2).
The largest earthquake swarm recorded in Yellowstone occurredin October of 1985 and consisted of over 3000 earthquakes (MC<5)that spanned more than 3 months (Waite and Smith, 2002). Thetemporal pattern of epicenters in the 1985 swarm was characterizedby northwest migration away from the 0.64-Ma caldera at an averagerate of 150 m/day. The swarm also coincided with a pronouncedchange of Yellowstone caldera uplift to subsidence. Waite and Smith(2002) suggested that the subsidence was partially accommodated bythe migration of magma-derived fluids out of the Yellowstone caldera
toward the northwest. The most likely scenario explaining thisprocess involves the rupture of a self-sealed hydrothermal layer andsubsequent migration of hydrothermal fluids through a preexistingfracture zone out of the Yellowstone caldera, causing the earthquakesof the 1985 swarm (Waite and Smith, 2002).
The second largest swarm recorded in Yellowstone occurredDecember 27, 2008 to January 7, 2009 beneath northern YellowstoneLake, Wyoming (Farrell et al., 2009). This sequence consisted of over1000 earthquakes, 21 of which had magnitudes greater than 3.0. Thearea of activity migrated progressively north at about ∼1000 m/day.Also earthquakes nucleated from as deep as ∼10 km and shallowedsignificantly to 4 km at the north end of the sequence. The largestevent had a magnitude of 4.0 and a moment tensor solution thatrevealed ∼50% of the radiated energy as an explosion source witheast–west expansion. We particularly note that this unusual earth-quake source mechanism is strikingly similar to that of a M 3.3,November 2007, event near the southern caldera boundary that Tairaet al. (in press)modeled as a dominantly explosive source earthquake.GPS vectors from nearby stations also suggest east–west expansion ofthe surface motions. Shortly after the swarm ended on January 7th, asmall swarm occurred ∼12 km to the north and may have beentriggered by the Yellowstone Lake swarm.

264 J. Farrell et al. / Journal of Volcanology and Geothermal Research 188 (2009) 260–276
Earthquakes in Yellowstone have been routinely monitored since1973 by permanent and temporary deployments of seismic stationsoperated by the U.S. Geological Survey (USGS), and the University ofUtah Seismic Stations (UUSS) (Smith et al., 1977; Doser and Smith,1983). This deployment has provided the complete earthquake dataset that was used for this study. The seismograph station character-istics and locations of the Yellowstone seismic network are summa-rized by Husen and Smith (2004).
3. Implications of b-value distributions from previous studies
The frequency–magnitude distribution (Ishimoto and Iida, 1939;Gutenberg and Richter, 1944) derives from the power-law relation-ship between the frequency of occurrence and the magnitude ofearthquakes:
logN = a−bM; ð2Þ
where N is the cumulative number of earthquakes having magnitudeslarger than M, and a and b are constants. It has been shown inlaboratory studies, mines, and numerical simulations that the slope ofthe frequency–magnitude distribution curve, or b-value, depends onstress conditions.
Statistically significant variations of b-values have been measuredin laboratory experiments, mines and various tectonic and volcanicregimes such as subducting slabs, near magma chambers, along faultzones, and in aftershock zones (see for example Wiemer and Wyss,2002). Seismologists consider that various factors influence b-values:(1) increased material heterogeneity, such as a large number ofrandomly oriented cracks may increase b-values (Mogi, 1962);(2) spatial and temporal changes in applied shear stress (Scholz,1968; Urbancic et al., 1992; Schorlemmer et al., 2004; Schorlemmerand Wiemer, 2005; Schorlemmer et al., 2005) or effective stress(Wyss, 1973) can decrease b-values; and (3) an increase in thethermal gradient may increase b-values (Warren and Latham, 1970).
In tectonic areas, the b-value averages about 1.0 (Frolich andDavis, 1993). In contrast, volcanic areas are characterized by b-valuesgreater or less than 1.0 with values as high as 3.0 (McNutt, 2005).Wiemer and Benoit (1996) used a dense spatial grid to study b-valuesat subduction zones. These studies were later extended to volcanicareas. All the aforementioned criteria that favor high b-values arefound in volcanic areas, such as high heterogeneity due to layering oflava flows and ash, the presence of cooling cracks, dikes and sills, andhigh thermal gradients. Moreover, because of the dynamic nature ofvolcanic areas, b-values tend to change with changing stress con-ditions through both time and space.
Seismicity associated with volcanic settings have been studiedusing b-values at several volcanoes including Mt St. Helens and Mt.Spurr, Alaska (Wiemer and McNutt, 1997), Off-Ito volcano, Japan(Wyss et al., 1997), Long Valley Caldera and Mammoth Mountain,California (Wiemer et al., 1998), Soufriere Hills, Montserrat (Poweret al., 1998), Mt. Etna, Italy (Murru et al., 1999), Katmai, Alaska (Jollyand McNutt, 1999), Mt. Redoubt, Alaska (Wiemer and Wyss, 2000),Kilauea, Hawaii (Wyss et al., 2001), and Mt. Pinatubo, Philippines(Sanchez et al., 2004). These volcanoes have shown high spatialvariability of b, with regions of normal b (1.0) adjacent to regionswith anomalously high b (up to 3.0). Most studies have found that ingeneral, b is high at depths of 7–10 km where the earthquakes areadjacent to inferred magma bodies. However, some studies also showsignificant high b anomalies at depths of 3–4 km. This is theapproximate depth at which magma with 4 wt.% gas starts to exsolvegas, and further, is near the depth at which open cracks may exist inthe host rock (McNutt, 2005).
b-values have also been used to infer the state of stress on activefaults (Scholz, 1968; Wyss, 1973; Urbancic et al., 1992; Schorlemmer etal., 2004; Schorlemmer and Wiemer, 2005; Schorlemmer et al., 2005).
Schorlemmer et al. (2005) show that there is a general inverserelationship between differential stress and the b-value and laterconclude that the b-value can therefore be interpreted as a ‘stressmeter’in the Earth's crust. This idea is supported by the magnitude 6.0Parkfield, California, event in 2004, which almost exclusively rupturedareas of the San Andreas Fault previously mapped as regions of low b-values (Wiemer and Wyss, 1997; Schorlemmer and Wiemer, 2005).
4. Swarm identification
4.1. Method
There are three different types of earthquake sequences (Mogi, 1963):(I) a mainshock followed by a number of aftershocks of decreasingmagnitude and frequency (Fig. 3A); (II) a slow build up of seismicity(foreshocks) leading to a type I sequence (Fig. 3B); and (III) a gradualincrease and decay of seismicity in time without a distinct mainshock(Fig. 3C) (also see Sykes, 1970). Type III sequences are also known asearthquake swarms and are common in volcanic areas or otherremarkably fractured regions or areas where there is a concentratedapplication of stress such as from intruding magma (Mogi, 1963).
Earthquake sequence I typically occurs in homogeneous materialwith a uniform external stress. Sequence II tends to occur in materialthat is heterogeneous to some degree, or a moderate fracture density,with a non-uniform external stress. Sequence III or swarms, occur inmaterial that is extremely heterogeneous, or have high fracturedensity, with a very concentrated external stress (Mogi, 1963) (Fig. 3).
Various algorithms are available to detect foreshock,mainshock, andaftershock sequences (Reasenberg, 1985; Youngs et al., 1987), but thereare few algorithmswritten to detect earthquake swarms (Waite, 1999).In this study, Reasenberg's (1985) code was first used to identifyswarms in the Yellowstone region. However this approach identifiedevents that were clearly not related temporally into a swarm. Forexample, events up to 5 years apart were classified as members of thesame swarm simply because of their spatial relationship.
To identify swarms in the Yellowstone catalog, an algorithm designedbyWaite (1999) was used. This algorithm specifies swarms based on theinter-event times and distances based on the swarm definition of Mogi(1963). A swarm is defined if the following criteria are met: (i) themaximum of the daily number of events in the sequence (Nd) is greaterthan twice the square root of the swarm duration in days (T):
Nd > 2ffiffiffiT
pð3Þ
and (ii) the total number of earthquakes in a sequence ET is at least 10.Swarms were identified using an ET value of 10, 30, and 50 to seewhich criteria best identified both large and small swarms.
4.2. Results
Employing algorithms used to identify foreshock–mainshock–aftershock sequences (Reasenberg, 1985) showed that most earth-quake sequences do not follow this pattern because the seismicity inYellowstone is dominated by swarms during the time period of 1984–2006. Numerous combinations of inter-event times (from 0.5 to5 days) and distance values (from 2 to 15 km) were included in theswarm identification algorithm of Waite (1999). In addition, variousdefinitions of minimum number of earthquakes that constituted aswarm, from 5 to 50 were examined. The combination of an inter-event time of 2 days and a distance of 5 km most reliably identifiedboth large and small swarms in the Yellowstone region and the resultsare summarized in Table 1 (Results from the 10 and 50-minimumdefinition of a swarm can be seen in Fig. S1A and S1B respectively).
Sixty-nine individual swarms were identified (Fig. 4, Table S1)using the criteria in which a swarm must have at least 30 events (30-minimum). These swarms varied in duration from 1 to 46 days, total

Fig. 3. Generalized plots of number of earthquakes vs. time for the three types of earthquake sequences after Mogi (1963).
265J. Farrell et al. / Journal of Volcanology and Geothermal Research 188 (2009) 260–276
number of events from 30 to 722, andmaximumnumber of events perday from 9 to 295. The average number of events per swarm for all 69swarms is 129.3. The total number of events for all 69 swarms is 8924,which is 39.0% of the original 23,054 events. Magnitudes of swarmevents range from−1.19≤MC≤4.82 with 99.9% of the swarm eventshaving magnitudes less than or equal to MC=4.0; 99.7% havingMC≤3.0; 96.2% having MC≤2.0; and 68.0% having MC≤1.0. Fifty-four(78.3%) of the 69 swarms are located in the region just north andnorthwest of the Yellowstone caldera. Fourteen (20.3%) are locatedwithin or on the boundary of the 0.64 Ma caldera. One (1.4%) islocated outside the 0.64 Ma caldera to the east or south.
Waite (1999) identified 72 swarms in the Yellowstone region for theperiod 1973 to 1997. Although we have identified many of the sameswarms in this study, comparisons cannot bemade in some cases becauseWaite (1999) used the original, non-relocated, earthquake catalog toidentify swarms. Here, only the quality A, B, and C earthquakes of therelocated catalog of Husen and Smith (2004) were used and manyadditional earthquakes were eliminated in the relocation process. Therelocated catalog was used in this study because in order to calculate b-values, high quality earthquake locations are important both foridentifying swarms and for accurately mapping the spatial changes ofb-values.
Waite (1999) identified 3156 earthquakes in the autumn 1985swarm. However, using the relocated catalog, the swarmwas found toconsist of only 462 earthquakes. From 1995 to 2006 the swarmsidentified in this study become more similar to the swarms identifiedby Waite (1999) in both the number of swarms and the total numberof earthquakes in each swarm. This is because the seismic networkupgrades improved the quality of the earthquake locations so thatmore earthquakes made it through the relocation process.
For example, Waite (1999) identified a swarm on the northwestYellowstone caldera boundary, near Madison Junction starting in Juneof 1995 that consists of 581 earthquakes. That same swarm calculatedhere was actually composed of four smaller swarms. The total numberof earthquakes in these four swarms is 567. The reason that the swarmsequence was divided into four different swarms here is because amore refined search radius of 5 kmwas used in this study whileWaite(1999) used a search radius of 15 km.
Although direct comparisons to results from Waite (1999) cannotbe made with individual swarms, the patterns of swarms can becompared. The high percentage of swarms located in the area northand northwest of the Yellowstone caldera (69%, 78.3%, and 79.2% forthe 10-minimum, 30-minimum, and 50-minimum definitions, re-spectively) is comparable to the results of Waite (1999). This suggests

Table 1Summary of de-swarming results using various definitions of a swarm.
Swarmdefinition
# of swarms Duration # of events Max # of events/day
Avg. # of events/swarm
Total # of events % of original catalog(days)
10-min 239 1 to 46 10 to 722 2 to 295 49.1 11,740 50.930-min 69 1 to 46 30 to 722 9 to 295 129.3 8924 39.050-min 48 2 to 46 50 to 722 11 to 295 168.9 8109 35.2
Swarmdefinition
Magnitude (MC)range
% of events withMC≤4.0
% of events withMC≤3.0
% of events withMC≤2.0
% of events withMC≤1.0
% of swarms located north ofthe caldera
% of swarms located in thecaldera
10-min −1.19 to 4.82 99.98 99.70 95.49 65.03 69.0 29.330-min −1.19 to 4.82 99.90 99.70 96.20 68.00 78.3 20.350-min −1.19 to 4.19 99.99 99.77 96.20 67.30 79.2 18.8
266 J. Farrell et al. / Journal of Volcanology and Geothermal Research 188 (2009) 260–276
that the crust in that area is highly fractured and heterogeneous. Theabrupt change in topography may suggest that the boundary of the2.05-Ma caldera (caldera I) is located in this area (dashed line inFig. 2). Swarm epicenters in this area also tend to align in a more east–west trend, which is what would be expected from the orientation ofthe edge of caldera I. Another explanation for the high rate ofseismicity in this region is the increased stress resulting from the 1959M7.5 Hebgen Lake, MT earthquake (Chang and Smith, 2002).
Swarm earthquake epicenters within and adjacent to the 0.64-Macaldera are generally aligned in a north–northwest direction. Thisalignment is sub-parallel to alignments of post-caldera volcanic ventsand Quaternary faults (Fig. 1) and implies that these events couldhave occurred on preexisting zones of weakness such as buried butstill active Quaternary faults (Christiansen, 1984).
5. Calculating b-values
5.1. Method
Wiemer and Wyss (2000) suggest that a careful estimate of thespatial and temporal homogeneity of the magnitude of completeness(MCOMP) is required before deviations from a power law behavior forsmall magnitudes can be made. Therefore, MCOMP, which is theminimummagnitude in which the catalog is complete, was calculatedfor the Yellowstone earthquake catalog. It is well known that MCOMP
can decrease with time in most earthquake datasets because thenumber of seismographs increases and the methods of analysisimprove (Wiemer and Wyss, 2000). MCOMP was calculated using theEMR method described by Woessner and Wiemer (2005).
Theb-values determined in this studywere calculated using the ZMAPalgorithm (Wiemer, 2001). Maximum-likelihood b-values were comput-ed using the following equation (Utsu, 1965; Aki, 1965; Bender, 1983):
b =1
M−Mminlog e; ð4Þ
where M―
is the mean magnitude and Mmin the minimum magnitudeof the given sample. The sample is considered complete down to theminimum magnitude Mmin. The magnitude of completeness (Mcomp)has to be corrected by ΔM/2 to compensate the bias of roundedmagnitudes to the nearest ΔM bin, thus Mmin=Mcomp−ΔM/2 (Utsu,1965; Guo and Ogata, 1997). The confidence limit of this b-valueestimation is given by (Shi and Bolt, 1982):
σðbÞ = 2:30b2ffiffiffiffiffiffiffiffiffiffiffiffiffiffiffiffiffiffiffiffiffiffiffiffiffiffiffiffiffiffiffiffiffiffiffiffiffiffiffiffiffiffiffiffiffiffiffiffiffiffi∑n
i=1ðMi−MÞ2 = nðn−1Þ
sð5Þ
where n is the total number of events of the given sample.For volumetric sampling of earthquakes, we employed cylindrical
volumes centered at nodes spaced at 0.01° (latitude)×0.01° (longi-
tude) (∼1.1 km×∼0.8 km) with varying radii for the cylinders. Forcross-sections, sampling is done on a 0.5 km×0.5 km grid withvarying radii. For each node a minimum number of events, Nmin, withM≥Mcomp is required in order to determine a reliable b-value. Forsamples that contain less than Nmin events, a b-value is not calculated.Nmin is set to 50 in this study because below this value the uncertaintyin the b-value increases rapidly (Schorlemmer et al., 2004). Radiiwere varied from 3 to 10 km and results were compared. The radiusthat produced robust results with the greatest spatial extent waschosen.
The b-value distribution for each different criterion for removingswarms and with the full catalog was mapped and compared toidentify the influence of removing swarms. To compare b-values fordifferent criteria for removing swarms and with the full catalog, b-valuesare spatiallymapped for both types of data. If in both instances, the samplesize is greater or equal to Nmin and thus a b-value can be computed, theprobability Pb of the hypothesis that the b-values of the two catalogs arecoming from the same population is computed. This probability value isderived from the Akaike Information Criterion (AIC) (Akaike, 1974).Comparing the AIC0 for both catalogs having the same b-value b0 and theAIC12 for both catalogs having twodifferentb-valuesb1 andb2 leads to thedifference ΔAIC of these two AIC scores as given by Utsu (1992):
ΔAIC = −2ðN1 + N2Þ lnðN1 + N2Þ + 2N1 ln N1 +N2b1b2
� �
+ 2N2 lnN1b2b1
+ N2
� �−2
ð6Þ
Where N1 and N2 are the number of earthquakes in each groupand b1 and b2 are the b-value of each group. The probability Pb thatthe b-values are not different is given by:
Pb = e½ð−ΔAIC =2Þ−2� ð7Þ
Using the criteria from Utsu (1999), the difference in b-values isconsidered not significant if ΔAIC<2. If ΔAIC>2, the difference issignificant. ΔAIC=2 corresponds to Pb≈0.05. The difference is con-sidered highly significant ifΔAIC>5, with a corresponding probabilityof Pb≈0.01. Applying the logarithm leads to log-probabilities of logPb≤−1.3 for significantly different b-values and log Pb≤−1.9 forhighly significant differences in b-values (Schorlemmer et al., 2004;Schorlemmer et al., 2005).
5.2. Threshold of magnitude completeness
The seismicity rate for quality A, B, and C earthquakes in theYellowstone region increased from ∼200 earthquakes per year before1995 to ∼1500 earthquakes per year after 1995 (Fig. 5). However, thischange in seismicity rate is due to upgrades and expansion of the

Fig. 4. Swarm locations identified while using the 30-minimum definition of a swarm used in this study. Mean locations for the 69 swarms are shown by black dots. Post-calderavolcanic vents are shown as gray stars (Christiansen, 2001). The 0.64-Ma caldera is outlined as a thick gray line and the 1.3-Ma and 2.05-Ma caldera boundaries are outlined as thingray lines, with the possible northern extent of the 2.05-Ma caldera shown with a dashed gray line. Quaternary faults after Christiansen (2001) are shown as thin black lines. MajorQuaternary faults are shown as thick black lines.
267J. Farrell et al. / Journal of Volcanology and Geothermal Research 188 (2009) 260–276
seismic network. Beginning in 1995, three-component short-periodand broadband seismometers were added to the network. Thereforethe catalog data were divided into two time periods, 1984–1994 and1995–2006. Also, due to the higher density of both seismometers andearthquakes, events in the area that extends from Hebgen Lake east tothe northern caldera boundary near Norris Junction was separatedfrom the rest of the catalog (Fig. 6). Fig. 6 shows the magnitude ofcompleteness values calculated for the various spatial and temporalareas. The highest value ofMCOMP was selected (MCOMP=1.5 based onthe time period 1984–1994 for the remaining region), and the catalogwas cut there and the remaining events were then used to calculate b-values to ensure that MCOMP is consistent throughout the time periodof the catalog as well as throughout the entire area. Fig. 7 shows thenumber of earthquakes remaining to calculate b-values after a) de-swarming, b) removing triggered events from the 2002 M7.9 Denalifault earthquake, and c) cutting the catalog at Mcomp=1.5.
5.3. b-value results
Epicenter locations used to calculate b-values for the various swarmdefinitions are plotted in Fig. 7. As expected, as the minimum number ofevents that constitute a swarm is increased, more events are left in the
catalog to calculateb-values. To investigate the influenceof usingdifferentswarm definitions on the stability of the b-value results we computed b-values using the different data sets, including the complete, non-de-swarmed catalog. The resulting spatial distribution of b-values inYellowstone shows areas of high and low b-values and areas of normalcrustal values (b≈1.0) (Fig. 8). A constant 10 km radius was chosen tocalculate theb-values because this radius allowed themaximumcoveragewhile still showing details of the areas with both high and low b-values.
The probability Pb of the possibility that the b-values of the twocatalogs are from the same population is computed in order toquantitatively identify the differences between the b-value maps forthe three different de-swarmed catalogs as well as the non-de-swarmed catalog (Eq. (7)). In Fig. 9, b-values are significantly differentwhen log Pb≤−1.3 and the b-values show highly significantdifferences for log Pb≤−1.9 (Schorlemmer et al., 2004; Schorlemmeret al., 2005).
Statistically, there is little difference between the b-values using thede-swarmed catalogs from the 10-minimum events and 30-minimumevents definition of a swarm (Fig. 9A). The 30-minimum catalog ispreferred over the catalog from the 10-minimum definition of a swarmdue to the fact that using the catalog from the 30-minimumdefinitionof a swarm provides greater spatial coverage for mapping b-values.

Fig. 5. Cumulative number of earthquakes vs. time for the various Yellowstone earthquake catalogs used to calculate b-values. Blue dashed line shows the original catalog consistingof A, B, and C quality events from 1984 to 2006. Dashed lines represent the de-swarmed catalogs using the various definitions of a swarm. Solid blue line represents the quality A, B,and C events from 1984 to 2006 cut at MCOMP=1.5. Remaining solid lines represent the de-swarmed catalogs cut at MCOMP=1.5.
268 J. Farrell et al. / Journal of Volcanology and Geothermal Research 188 (2009) 260–276
When comparing the b-values from the 30-minimumdataset and the50-minimum dataset, there are slight differences in the center of theYellowstone caldera. Overall only 0.24% of the nodes are differentbetween the two datasets (Fig. 9B). The reason for the differences is aswarm that occurred in August of 1999 (Swarm 30 in Table S1). Thisswarm consisted of 35 earthquakes so it is only identified andsubsequently removed by the algorithmwith the 30-minimumdefinitionof a swarm. This swarm contained an earthquake of MC=4.82,which introduced a significant difference between the 30-minimum and50-minimummodels bybiasing theb-value calculations (Fig. 10). Becausethis swarmcouldbe considered anoutlier,weprefer to remove it fromthecatalog by using the dataset from the 30-minimum swarm definition.
Only data at 0.18% of the sampling interval are significantly different(Fig. 9C) when comparing the b-values from the 30-minimum datasetwith the b-values from the original, unsorted dataset. Some of thesedifferences are due to the same swarm event that was just discussed.Just to the north of the Yellowstone caldera another area shows signif-icantly different b-values. The differences here are attributed to fiveevents ranging from 3.0≤MC≤3.8. These five earthquakes were iden-tified in two swarms and were removed in the 30-minimumdataset. Because they all occurred in the same area, they all influencedthe b-value calculation for the original catalog. The unfiltered catalogwas discarded and the 30-minimum dataset was chosen as themost stable and best catalog to use when interpreting b-values becausethe b-value is influenced heavily by just these five events.
There are three areas of relatively high b-values for the 30-minimumevent catalog (Fig. 11). The area with the highest b-values is asso-ciatedwithearthquakesof theMallardLake resurgentdome(MLD)whereb-values are as high as 1.5±0.05. This area of highb-values extends northfrom theMLD toMadison Junction. A secondary areawith highb-values islocated near Norris Geyser Basin (NGB) and extends north along theNorris–Mammoth Corridor and east to the northern boundary ofthe Yellowstone caldera. The Gallatin fault bounds this area of elevatedb-values to the west. Here we see values of b up to 1.3±0.05. The third
area where we see elevated b-values is in the Hebgen Lake area just westof the Yellowstone National Park border. This area is also the site of theM7.5 Hebgen Lake earthquake in 1959. The highest b-value in the HebgenLake area was 1.3±0.1 just to the northeast of the Red Canyon fault.
Two areas had relatively low b-values. The first is east of the SourCreek Resurgent Dome (SCD) on the park border, with b-values as lowas 0.5±0.1. This is an area that has experienced persistent seismicactivity throughout the entire time span of Yellowstone earthquakerecording. The second area of low b-values is located at the southernportion of the Yellowstone caldera near the Mt. Sheridan fault (MSF)and near the northern extent of the Teton fault. In this area b-valuesare as low as 0.6±0.1.
We have determined the errors in our calculations to assess thevalidity of our calculations (Fig. 12). Themajority of the errors in b-valuesare less than 0.1. The largest errors in b (∼0.15) are located on the easternsideof the0.64-Macaldera. These larger errors aredue to the inclusionof aMC=4.8 earthquake that occurred in 1999. The difference in thefrequency–magnitude distribution due to this single event can also beseen in Fig. 10. The lowest errors (<0.05) occur in the area north of the0.64-Ma caldera where the highest concentration of epicenters is located.
The depth distribution of b-values as well as the temporal changes inb-valueswas also examined, but because of our limited range in epicenterdepths, our sampling radius of 5 kmwas too large to image differences inthe b-value with depth. In addition, after filtering, there were too fewearthquakes to adequately detect changes in b-values over time.
6. Discussion
6.1. Swarm identification
Using the definition that a swarm had to contain at least 30 events,∼39% of the recorded earthquakes in the Yellowstone region areassociated with swarms. Of the 69 swarms identified, 54 (78.3%) arelocated in the region north and northwest of the Yellowstone caldera

Fig. 6. Threshold of earthquake completeness (MCOMP) calculations for the 30-minimum de-swarmed catalog. (A) shows MCOMP values for the years 1984–1994 and (B) showsMCOMP values for the years 1995–2006. Blue color represents the north region and red color represents the remaining region.
269J. Farrell et al. / Journal of Volcanology and Geothermal Research 188 (2009) 260–276
while 14 (20.3%) are located within or at the Yellowstone calderaboundary (Fig. 4).
Because a high number of swarmswere identified in the east–westband of seismicity extending from the Hebgen Lake fault to the NorrisGeyser Basin, we interpret the seismogenic upper crust here to behighly fractured, with a large number of small magnitude earthquakesoccurring on numerous small fractures. This interpretation is based onthe concentration of earthquake swarms that are often associatedwith volcanic features or other fractured regions where there is aconcentrated application of stress such as intruding magma (Mogi,1963). There is also an abrupt change in the topography in this regionand the east–west alignment of swarm epicenters here indicates thatthis is the location of the northern rim of the 2.05-Ma caldera (calderaI, dotted line in Fig. 1), which is about 15 km north of the mappedYellowstone caldera rim of Christiansen (2001).
Moreover it is considered that the Gallatin Range was oncecontinuous to the south but is now covered beneath young volcanicrocks of the Yellowstone giant silicic eruptions (Christiansen, 2001).During the first catastrophic eruption 2.05 million years ago, themountain range was destroyed by the explosive caldera-formingeruption and by caldera collapse (Smith and Siegel, 2000). The east–west alignment of swarm epicenters in this area is significant in thatthe swarms may be occurring on preexisting zones of weakness fromthe 2.05-Ma caldera eruption.
It also has been shown that Yellowstone swarms can be attributedto the migration of magmatic or hydrothermal fluids (Waite andSmith, 2002). Although these swarms are much smaller in both thenumber of earthquakes as well as the spatial extent of earthquakesthan the 1985 swarm that was examined by Waite and Smith (2002),it is plausible to hypothesize that the associated earthquakes are the

Fig. 7. Earthquakes of the Yellowstone region used to calculate b-values for the various de-swarmed andnon-de-swarmed catalogs. A) shows the 2240 epicenters for the 10-minimumde-swarmed catalog, B) shows the 2747 epicenters for the 30-minimumde-swarmed catalog, (C) shows the 2820 epicenters for the 50-minimumde-swarmed catalog, and (D) showsthe 3989 epicenters for the non-de-swarmed catalog.
270 J. Farrell et al. / Journal of Volcanology and Geothermal Research 188 (2009) 260–276
result of a migration of fluids (magmatic and/or hydrothermal) alongeither pre-existing cracks or propagating dikes.
Hill (1977), for example, suggested a process to explain earth-quake swarms: In a series of dikes oriented with their long dimensionparallel to the regional greatest principal stress, shear failures occuralong oblique fault planes connecting adjacent tips of en echelon orparallel dikes when a critical combination of fluid pressure in thedikes and the difference between σ1 and σ3 is reached.
Summarizing other swam studies, Toda et al. (2002) also suggestedthat the 2000 Izu Islands, Japan earthquake swarm was caused by alaterally propagating dike intrusion. Waite and Smith (2002) proposethat the 1985 swarm in Yellowstone was due to the migration ofmagmatic or hydrothermalfluids. In particular they state that themostlikely scenario for the swarm involves the rupture of a self-sealedhydrothermal layer and subsequent migration of hydrothermal fluidthrough a preexisting fracture zone out of the Yellowstone caldera.More recently, Vidale et al. (2006) suggested that swarms may be dueto non-magmatic sources such as a variable component of backgroundseismicity driven by aseismic slip and fluid pressure variations.
6.2. b-value distribution
We interpret the area of high b-values (up to 1.5±0.05) in thearea located near the Mallard Lake resurgent dome (MLD) (Fig. 11) tobe influenced by high crustal heterogeneity of the local stress regime,a high thermal gradient and magmatic fluids. This high heterogeneity
of stress causes numerous small cracks in the crust to be oriented in alldirections. Under these conditions, the likelihood of large earthquakesoccurring is decreased because a rupture terminates when itencounters an existing crack orientated unfavorably for failure. Insuch a highly fractured crust, many small ruptures would be observedbut fewer larger ones, which is what is observed in the frequency–magnitude distribution (Wiemer et al., 1998). The average magnitudeof events in this area is ∼1.5 and corresponds to an average rupturelength of about 70 m (Wiemer and McNutt, 1997; Kanamori andAnderson, 1975). Small cracks produce only small earthquakesbecause of their short source length. This is comparable with resultsfrom the Long Valley Caldera in eastern California, which is a similarlarge silicic volcanic center where Wiemer et al. (1998) found high b-values (b>1.5) in the area near the resurgent dome and interpretedthese to be the result of a highly fractured crust (Hill, 1992).
The high thermal gradient in the Yellowstone caldera is consideredto be attributed to the presence of magmatic fluids below the surface(Eaton et al., 1975; Fournier, 1989; Husen et al., 2004a). Theshallowest earthquakes in the area occur beneath the MLD (Fig. 1)where the depth of 80% of the hypocenters is ∼5 km (Smith et al.,2009-this volume). This depth is interpreted as the brittle–ductiletransition zone with a temperature of ∼400 °C (Sibson, 1982; Smithand Bruhn, 1984; Fournier, 1999) and gives a thermal gradient of∼80 °C/km for the area beneath the Mallard Lake resurgent dome. Ifthe average 80th percentile depth of 8 km inside the 0.64-Ma calderais used, an average thermal gradient of ∼50 °C/km is determined.

Fig. 8. b-value maps for all the earthquake listings shown in Fig. 7. (A) b-values calculated for the 10-minimum de-swarmed catalog, (B) b-values calculated for the 30-minimum de-swarmed catalog, (C) b-values calculated for the 50-minimumde-swarmed catalog, and (D) b-values calculated for the non-de-swarmed catalog. Red-orange colors indicate highb-valuesand blue-green colors represent low b-values.
Fig. 9. Utsu Test results (Utsu, 1992) comparing the various b-value maps. (A) 10-minimum vs. 30-minimum, (B) 30-minimum vs. 50-minimum, and (C) 30-minimum vs. non-de-swarmed. Red colors show values that are not significantly different and blue to green colors show values that are statistically different.
271J. Farrell et al. / Journal of Volcanology and Geothermal Research 188 (2009) 260–276

Fig. 10. Frequency–magnitude distribution (FMD) comparison for the 30-minimum b-value map vs. the 50-minimum b-value map. (A) Shows the FMDs for the two samples shownin C and D. Colors match the colors of the sampling radii shown in the circles in C and D. (B) Shows the Utsu test results with significantly different b-values in the central Yellowstonecaldera. (C) Shows the b-value distribution with the sampling radius (red) for the 30-minimum de-swarmed catalog. (D) Shows the b-value distribution with the sampling radius(blue) for the 50-minimum de-swarmed catalog.
272 J. Farrell et al. / Journal of Volcanology and Geothermal Research 188 (2009) 260–276
Smith and Braile (1994) estimated an average thermal gradient forthe Yellowstone region of ∼45 °C/km. This supports the results ofWarren and Latham (1970), in which they show that an increase inthe thermal gradient causes an increase in b.
The emplacement of magma and the accompanying crustalexpansion as suggested by Wicks et al. (2006) and Chang et al.(2007) for the high crustal deformation rates would give rise tofactors responsible for high b-value measurements. Mainly high het-erogeneity of the crust due to numerous cracks from the increasedstress and a high thermal gradient, which is also supported by focaldepth distribution. Given that the period of uplift and the period ofhigh b-values overlap in time, these could be the underlying reasonsfor the high b-values measured in this study.
The area of high b-values of up to 1.3±0.05 north of the Yellow-stone caldera rim extending from Norris Geyser Basin may also be aresult of magmatic fluids migrating from the Yellowstone caldera
north into the Norris–Mammoth Corridor (Wicks et al., 2006)(Fig. 11). Again, the presence of magma gives rise to the main factorscausing higher b-values, mainly high heterogeneity, and high thermalgradient. The presence of partial melt causes higher temperatures. Inturn, a zone of relatively lower stress around the area of partial melt iscreated because the high temperatures reduce the strength of thematerial which would not allow significant stress buildup. Numeroussmall cracks would form as the area of partial melt pushed up throughthe crust as well.
The area of high b-values located near Hebgen Lake exhibitingvalues up to 1.3±0.1 could also be the result of magma migratinglaterally from the Yellowstone caldera (Fig. 11). More likely, high b-values in this area are a reflection of a relatively low stress regime as aresult of the 1959 Hebgen Lake earthquake. Chang and Smith (2002)show that the 1959 M7.5 Hebgen Lake earthquake caused a decreasein the Coulomb failure stress of about 0.4 MPa (compared to a static-

Fig. 11. Spatial b-value distribution for the 30-minimum Yellowstone de-swarmed catalog. Red to orange colors represent high b-values and cool colors represent low b-values.Areas of hydrothermal activity are plotted in purple. Light blue lines represent the outline of lakes. Arrows show interpreted magmamigration paths fromWicks et al., 2006. Red andblue polygons show the location of the expanding sill and the deflating sill respectively from Chang et al. (2007). MSF =Mt. Sheridan fault, HLF = Hebgen Lake fault, GF = Gallatinfault, and TF = Teton fault.
273J. Farrell et al. / Journal of Volcanology and Geothermal Research 188 (2009) 260–276
stress drop of 12 MPa observed for the Hebgen Lake mainshock(Doser, 1985)) in the areas immediately north and south of the faultwhere we see higher b-values.
Another explanation for higher b-values within the Yellowstonecaldera and in the Norris–Mammoth Corridor (Fig. 2) could bebecause of the high concentration of hydrothermal features in thearea. Hydrothermal waters of Yellowstone circulate through the crustin an intricate system of cracks and are heated from below by a bodyof crystallizing magma (Fournier, 1989). The presence of extensivehydrothermal activity shows that the crust is very heterogeneous dueto the numerous fractures that facilitate the flow of hydrothermalwaters through the crust. There is a correlation between higher b-values and the location of hydrothermal features in thewestern half ofYellowstone (Fig. 11). This would indicate that the high b-values maybe due to both the highly fractured (heterogeneous) crust and thehigh temperatures as well as high pore pressures that allowhydrothermal fluid flow. Therefore, the high b-values could be an
indication of the highly fractured crust that facilitates the movementof hot, hydrothermal fluids. Wall (2005) showed that northeast–southwest and northwest–southeast trending fractures in the 0.64-Ma Lava Creek Tuff provide major flow pathways for hydrothermalfluids at Norris Geyser Basin.
The area of low b-values in the southern part of the park whereb-values are as low as 0.6±0.1 (Fig. 11) can be attributed to highstress accumulation from large Basin-Range faults south of the Yel-lowstone caldera and outside the dominant influence of the magmasystem. Stress accumulation would take place mainly on the Mt.Sheridan fault and the Teton fault. The northern segment of theTeton fault appears to extend northward under the 70,000-yr-oldPitchstone Plateau Rhyolite, and the eastern segment of the faultmerges into the remains of the ring–fracture system from the 2.05 Macaldera in Yellowstone National Park (Christiansen and Blank, 1972;Christiansen, 2001). North–south bands of seismicity extend from thenorthern extent of the Teton fault into the Yellowstone caldera (Fig. 1)

Fig. 12. Errors in the b-value calculations. Calderas I, II, and III are outlined in black. Major Quaternary faults are shown as thick red lines. Symbols are as shown above.
274 J. Farrell et al. / Journal of Volcanology and Geothermal Research 188 (2009) 260–276
suggesting that these earthquakes occur on existing zones ofweaknessthat may be a buried remnant of the Teton fault.
White et al. (2009-this volume) suggested that the transition fromnortheast–southwest extension in the northern Teton region to east–west extension in the central and southern Teton region indicates thatthe stress field along the northern Teton fault may be affected by thestress field of the Yellowstone volcanic system. Given the rapidchange in stress orientation around the northern Teton fault segment,the fault may be locked due to westward compression, which wouldalso be loading the fault segment at the same time (White et al., 2009-this volume). Similar results were argued by Hampel and Hetzel(2008) who used finite elementmodeling to investigate the high ratesof Yellowstone caldera uplift and subsidence and its effects on thearea south of the Yellowstone caldera and the Teton fault. They showthat caldera uplift can induce variations of the stresses of the Tetonfault including horizontal compression. Puskas et al. (2007) alsorecorded reverse motion on the Teton fault using GPS.
It is plausible that the Mt. Sheridan fault could be experiencinghigher loading rates as well. The Mt. Sheridan fault is a large north–south striking normal fault bounding the east side of Mt. Sheridan(Fig. 1) and is about 41 km long (Wong et al., 2000). It is believed thatprior to the cataclysmic caldera-forming eruptions at Yellowstone, theMt. Sheridan fault was continuous across the Yellowstone Plateauwith the faults to the north of the Yellowstone caldera (Smith andSiegel, 2000).
Scholz (1968), Wyss (1973), Urbancic et al. (1992), Schorlemmer etal. (2004), Schorlemmer and Wiemer (2005), and Schorlemmer et al.(2005) showed that an increase in applied shear stress or an increase ineffective stress decreases the b-value. It is proposed here that the low b-values in the southern portion of Yellowstone National Park are due tostress buildup from the East Mt. Sheridan fault and the Teton fault (e.g.Hampel and Hetzel, 2008; White et al., 2009-this volume). The highstress in the area could be due to crustal deformation from the volcanicsystem in Yellowstone loading the faults. It is not well known how the

275J. Farrell et al. / Journal of Volcanology and Geothermal Research 188 (2009) 260–276
large normal faults to the north and south interactwith the Yellowstonecaldera system, more specifically, whether or not the volcanic system isloading the faults or whether it is absorbing stress.
7. Conclusions
Significant spatial variations in the frequency–magnitude distri-bution are well-defined in the Yellowstone region and are related tovariations in tectonic and volcanic processes. Thirty-nine percent ofYellowstone earthquakes occur in swarms. This corresponds to about38% of the total seismic moment which equates to an equivalentmagnitude of 4.9. Sixty-nine distinct swarms (Fig. 4, Table S1) wereidentified during the study period, 1984–2006, comprising 8924earthquakes. Fifty-four of the 69 swarms occur in the east–west bandof seismicity that extends from the Hebgen Lake fault to the NorrisGeyser Basin (Fig. 4). Swarms vary in duration from 1 to 46 days andhave a range of 30 to 722 total events.
The area of high b-values just to the north of the Mallard Lake dome,where b-values up to 1.5±0.05 are present, is attributed to the presenceof a high thermal gradient due to the emplacement of magmatic fluids.Using InSAR data,Wicks et al. (2006) interpreted this area of uplift as dueto the emplacement of basaltic magma at ∼15 km below the surface.Magma intrusion as well as crustal deformation are processes that wouldalter the frequency–magnitude distribution of earthquakes towards highb-values. As magmatic fluids are injected into the system, temperaturesare expected to rise around the intrusion and the crustwouldweakendueto its inability to accumulate high amounts of stress. The hightemperature, weakened crust and the expanding sill could cause theformation of numerous small fractures as magma escaped the Yellow-stone caldera system.A relatively largenumberof smaller earthquakes areexpected to accompany the formation of small fractures and wouldalter the frequency–magnitude distribution of earthquakes towardshigher b-values. This supports the hypothesis that the higher b-values inthis region are due to the presence of magmatic fluids.
Chang et al. (2007) suggest that the 2004–2006 episode of accelerateduplift of up to 7 cm/yr, occurred in response to a caldera-wide magmarecharge of the Yellowstone volcanic system. The unprecedented crustaluplift as well as the increase in thermal gradient due to magma rechargewould tend to alter the frequency–magnitude distribution of earthquakestowards a higher b-value by not allowing sufficient stress build up on thefractures.
The area of low b-values up to 14 km south of the 0.64-Ma calderarim where b-values are as low as 0.6±0.1 is interpreted to be due tohigh stress in the crust from the loading of both the Mt. Sheridan faultand the Teton fault. This could also be an indication of a relativelystrong crust and a thicker seismogenic layer that is resistant to frac-ture. It is not clear if the high stress in the crust is due to the lack oflarge earthquakes on the Mt. Sheridan and Teton faults in the recentpast or if those faults are being loaded by the crustal deformation fromthe Yellowstone volcanic system.
With additional data and better broadband seismograph coverage,not only will more information be obtained for Yellowstone earth-quakes, but the data will continue to be of higher quality as thenetwork continues to be upgraded to broader frequency recordingand location techniques improve. This will allow better determina-tions of the b-value distribution both laterally and with depth as wellas over time. This data can be used to better understand what pro-cesses are occurring in the crust at Yellowstone and their implicationsfor local earthquake and volcanic hazards.
Acknowledgements
Wewould like to thank Christine Puskas, Wu-Lung Chang, MichaelJordan, Bonnie Pickering-White, Aaron DeNosaquo, and KatrinaDeNosaquo for in-depth discussions. Greg Waite provided theswarm identification algorithm used in this study. We also thank
Jochan Woessner and Danijel Schorlemmer for providing help withthe b-value analysis program, ZMAP. We would also like to thankMike Stickney and an anonymous reviewer for their comments andsuggestions.
Funding for the project was provided by the National ScienceFoundation Continental Dynamics Program grants #EAR 9725431,0314298, and 9316289 and the NSF GEOsciences Network (GEON)project, EAR-0724265. Data support was partially provided by theYellowstone Volcano Observatory. The University of Utah providedcomputational and technical assistance as well.
Appendix A. Supplementary data
Supplementary data associated with this article can be found, inthe online version, at doi:10.1016/j.jvolgeores.2009.08.008
References
Akaike, H., 1974. A new look at the statistical model identification. IEEE Trans. Automat.Contr. 19, 716–723.
Aki, K., 1965. Maximum likelihood estimate of b in the formula log N=a−bM and itsconfidence limits. Bull. Earthq. Res. Inst. Univ. Tokyo 43, 237–239.
Bender, B., 1983. Maximum likelihood estimation of b values for magnitude groupeddata. Bull. Seismol. Soc. Am. 73, 831–851.
Benz, H.M., Smith, R.B., 1984. Simultaneous inversion for lateral velocity variations andhypocenters in the Yellowstone region using earthquake and refraction data. J. Geophys.Res. 89, 1208–1220.
Blackwell, D.D., 1969. Heat-flow determinations in the northwestern United States.J. Geophys. Res. 74, 992–1007.
Chang, W.-L., Smith, R.B., 2002. Integrated seismic-hazard analysis of the WasatchFront, Utah. Bull. Seismol. Soc. Am. 92, 1904–1922.
Chang, W.-L., Smith, R.B., Wicks, C., Puskas, C.M., Farrell, J., 2007. Accelerated uplift andsource models of the Yellowstone caldera, 2004–2006, from GPS and InSARobservations. Science 318 (5852), 952–956. doi:10.1126/science.1146842.
Christiansen, R.L., 1984. Yellowstone magmatic evolution: its bearing on understandinglarge-volume explosive volcanism. Explosive Volcanism: Inception, Evolution andHazards. National Academy Press, Washington D.C, pp. 84–95.
Christiansen, R.L., 2001. The Quaternary and Pliocene Yellowstone plateau volcanicfield of Wyoming, Idaho, and Montana. U.S. Geol. Surv. Profess. Pap. 729-G, 145.
Christiansen, R.L., Blank Jr., H.R., 1972. Volcanic stratigraphy of the Quaternary rhyoliteplateau in Yellowstone National Park. U.S. Geol. Surv. Profess. Pap. 516-E, 6.
DeNosaquo, K., Smith, R.B., Lowry, A.R., 2009. Density and lithospheric strength modelsof the Yellowstone–Snake River Plain volcanic system from gravity and heat flowdata. J. Volcanol. Geotherm. Res. 188, 108–127.
Doser, D.I., 1985. Source parameters and faulting processes of the 1959 Hebgen Lake,Montana, earthquake sequence. J. Geophys. Res. 90, 4537–4555.
Doser, D.I., Smith, R.B., 1983. Seismicity of the Teton–Southern Yellowstone Region,Wyoming. Bull. Seismol. Soc. Am. 73, 1369–1394.
Dzurisin, D., Savage, J.C., Fournier, R.O., 1990. Recent crustal subsidence at Yellowstonecaldera, Wyoming. Bull. Volcanol. 52, 247–270.
Eaton, G.P., Christiansen, R.L., Iyer, H.M., Pitt, A.D.,Mabey, D.R., Bland Jr., H.R., Zietz, I., Gettings,M.E., 1975. Magma beneath Yellowstone National Park. Science 188, 787–796.
Farrell, J., Smith, R.B., Taira, T., Puskas, C.M., Burlacu, R., Pechmann, J., Heasler, H.,Lowenstern, J., 2009. Source properties and deformation analysis of the 2008–2009Yellowstone Lake earthquake swarm. Seismol. Res. Lett. 80 (2), 339.
Fournier, R.O., 1989. Geochemistry and dynamics of the Yellowstone National Parkhydro-thermal system. Ann. Rev. Earth Planet. Sci. 17, 13–53.
Fournier, R.O., 1999. Hydrothermal processes related to movement of fluid from plastic intobrittle rock in the magmatic-epithermal environment. Econ. Geol. 94 (8), 1193–1212.
Frolich, C., Davis, S., 1993. Teleseismic b-values: or much ado about 1.0. J. Geophys. Res.98, 631–644.
Guo, Z., Ogata, Y., 1997. Statistical relations between the parameters of aftershocks intime, space, and magnitude. J. Geophys. Res. 102, 2857–2873.
Gutenberg, B., Richter, C.F., 1944. Frequency of earthquakes in California. Bull. Seismol.Soc. Am. 34, 185–188.
Hampel, A., Hetzel, R., 2008. Slip reversals on active normal faults related to the inflation anddeflationofmagmachambers: numericalmodelingwith application to theYellowstone–Teton region. Geophys. Res. Lett. 35, L07301. doi:10.1029/2008GL033226.
Hill, D.P., 1977. A model for earthquake swarms. J. Geophys. Res. 82, 1347–1352.Hill, D.P., 1992. Temperatures at the base of the seismogenic crust beneath Long Valley
Caldera, California, and the Phlegrean Fields Caldera, Italy. In: Gasparini, P., Scarpa,R., Aki, K. (Eds.), Volcanic Seismology. Springer-Verlag, Berlin, pp. 432–461.
Husen, S., Smith, R.B., 2004. Probabilistic earthquake relocation in three-dimensionalvelocity models for the Yellowstone National Park region, Wyoming. Bull. Seismol.Soc. Am. 94, 880–896.
Husen, S., Smith, R.B.,Waite, G.P., 2004a. Evidence for gas andmagmatic sources beneath theYellowstonevolcanicfield fromseismic tomographic imaging. J. Volcanol.Geotherm.Res.131, 397–410.
Husen, S., Wiemer, S., Smith, R.B., 2004b. Remotely Triggered Seismicity in theYellowstone National Park region by the 2002 Mw 7.9 Denali fault earthquake,Alaska. Bull. Seismol. Soc. Am. 94 (6B), S317–S331.

276 J. Farrell et al. / Journal of Volcanology and Geothermal Research 188 (2009) 260–276
Husen, S., Taylor, R., Smith, R.B., Heasler, H., 2004c. Changes in geyser eruption behaviorand remotely triggered seismicity in Yellowstone National Park produced by the2002 M 7.9 Denali fault earthquake, Alaska. Geology 32, 537–540.
Ishimoto, M., Iida, K., 1939. Observations of earthquakes registered with the micro-seismograph constructed recently. Bull. Earthq. Res. Inst. Univ. Tokyo 17, 443–478.
Jolly, A.D., McNutt, S.R., 1999. Relationship between b-values and maximum depths ofseismicity at Martin and Mageik volcanoes, Katmai National Park, Alaska; July1995–December 1997. J. Volcanol. Geotherm. Res. 93, 173–190.
Kanamori, H., Anderson, D.L., 1975. Theoretical basis of some empirical relations inseismology. Bull. Seismol. Soc. Am. 65, 1073–1095.
Lynch, D. P., 1999, Three-dimensional finite difference tomography of the Basin andRange-Colorado Plateau–Rocky Mountain transition using earthquake and con-trolled source data: M.S. thesis, University of Utah, Salt Lake City.
McNutt, S.R., 2005. Volcanic seismology. Annu. Rev. Earth Planet. Sci. 33, 461–491.Miller, D.S., Smith, R.B., 1999. P and S velocity structure of the Yellowstone volcanic
field from local earthquake and controlled source tomography. J. Geophys. Res. 104,15105–15121.
Mogi, K., 1962. Magnitude–frequency relation for elastic shocks accompanyingfractures of various materials and some related problems in earthquakes. Bull.Earthq. Res. Inst. Univ. Tokyo 40, 831–853.
Mogi, K., 1963. Some discussions on aftershocks, foreshocks and earthquake swarms —the fracture of a semi-infinite body caused by an inner stress origin and its relationto the earthquake phenomena, 3. Bull. Earthq. Res. Inst. Univ. Tokyo 41, 615–658.
Morgan, P., Blackwell, D.D., Spafford, R.E., Smith, R.B., 1977. Heat flowmeasurements inYellowstone Lake and the thermal structure of the Yellowstone caldera. J. Geophys.Res. 82, 3719–3732.
Murru, M., Montuori, C., Wyss, M., Privitera, E., 1999. The locations of magma chambersat Mt. Etna, Italy, mapped by b-values. Geophys. Res. Lett. 26, 2553–2556.
Pechmann, J. C., Bernier, S. J. Nava, F. M. Terra, and W. J. Arabasz, 2001, Correction ofsystematic time-dependent coda magnitude errors in the Utah and YellowstoneNational Park region earthquake catalogs, 1981–2001, EOS Trans. AGU 82(47), FallMeet. Suppl., Abstract S11B-0572.
Pelton, J.R., Smith, R.B., 1982. Contemporary vertical surface displacements inYellowstone National Park. J. Geophys. Res. 87, 2745–2761.
Pitt, A.M., Weaver, C.S., Spence, W., 1979. The Yellowstone Park earthquake of June 30,1975. Bull. Seismol. Soc. Am. 69, 187–205.
Power, J.A., Wyss, M., Latchman, J.L., 1998. Spatial variations in the frequency–magnitude distribution of earthquakes at Soufriere Hills volcano, Montserrat, WestIndies. Geophys. Res. Lett. 25, 3653–3656.
Puskas, C.M., Smith, R.B., Meertens, C.M., Chang, W.L., 2007. Crustal deformation of theYellowstone–Snake River Plain volcanic system: campaign and continuous GPSobservations, 1987–2004. J. Geophys. Res. 112, B03401. doi:10.1029/2006JB004325.
Reasenberg, P., 1985. Second-order moment of central California seismicity, 1969–1982. J. Geophys. Res. 90, 5479–5495.
Sanchez, J.J., McNutt, S.R., Power, J.A., Wyss, M., 2004. Spatial variations in thefrequency–magnitude distribution of earthquakes at Mount Pinatubo volcano. Bull.Seismol. Soc. Am. 94, 430–438.
Scholz, C.H., 1968. The frequency–magnitude relation of microfracturing in rock and itsrelation to earthquakes. Bull. Seismol. Soc. Am. 58, 399–415.
Schorlemmer, D., Weimer, S., Wyss, M., 2004. Earthquake statistics at Parkfield: 1.Stationarity of b values. J. Geophys. Res. 109, B12307. doi:10.1029/2004JB003234.
Schorlemmer, D., Wiemer, S., 2005. Microseismicity data forecast rupture area. Nature434, 1086.
Schorlemmer, D., Wiemer, S., Wyss, M., 2005. Variations in earthquake-size distributionacross different stress regimes. Nature 437, 539–542.
Shi, Y., Bolt, B.A., 1982. The standard error of the magnitude–frequency b-value. Bull.Seismol. Soc. Am. 72, 1677–1687.
Sibson, R.H., 1982. Fault zonemodels, heat flow, and the depth distribution of earthquakesin the continental crust of the United States. Bull. Seismol. Soc. Am. 72 (1), 151–163.
Smith, R.B., Arabasz, W.J., 1991. Seismicity of the intermountain seismic belt. In:Slemmons, D.B., Engdahl, E.R., Zoback, M.D., Blackwell, D.D. (Eds.), Neo-tectonics ofNorth America. Geological Society of America, Boulder, Colorado, pp. 185–228.
Smith, R.B., Braile, L.W., 1994. The Yellowstone hotspot. J. Volcanol. Geotherm. Res. 61,121–187.
Smith, R.B., Bruhn, R.L., 1984. Intraplate extensional tectonics of the eastern basin-range:inferences on structural style from seismic reflection data, regional tectonics, andthermal-mechanical models of brittle–ductile deformation. J. Geophys. Res. 89,5733–5762.
Smith, R.B., Sbar, M., 1974. Contemporary tectonics and seismicity of the WesternUnited States with emphasis on the Intermountain Seismic Belt. Bull. Geol. Soc. Am.85, 1205–1218.
Smith, R.B., Siegel, L., 2000. Windows into the Earth: The Geology of Yellowstone andGrand Teton Parks. Oxford University Press, London. 247.
Smith, R.B., Shuey, R.T., Pelton, J.R., Bailey, J.P., 1977. Yellowstone Hot Spot, crustalproperties from new earthquake and magnetic data. J. Geophys. Res. 82, 3665–3676.
Smith, R.B., Jordan, M., Steinberger, R., Puskas, C.M., Farrell, J., Waite, G.P., Husen, S., Chang,W., O'Connell, R., Klingele, E., 2009, Geodynamics of the Yellowstone hotspot andmantle plume: seismic and GPS imaging, kinematics, and mantle flow. J. Volcanol.Geotherm. Res. 188, 26–56.
Sykes, L.R., 1970. Earthquake swarms and sea-floor spreading. J. Geophys. Res. 75,6598–6611.
Taira, T., Smith, R.B., Chang, W.-L., 2009. Seismic evidence for dilatational sourcedeformations accompanying the 2004–2008 Yellowstone accelerated upliftepisode, J. Geophys. Res. (in press).
Toda, Shinji, Stein, R.S., Sagiya, T., 2002. Evidence from the AD 2000 Izu islandsearthquake swarm that stressing rate governs seismicity. Nature 419, 58–61.
Urbancic, T.I., Trifu, C.I., Long, J.M., Toung, R.P., 1992. Space–time correlations of b valueswith stress release. Pure Appl. Geophys. 139, 449–462.
Utsu, T., 1965. A method for determining the value of b in a formula log N=a−bMshowing the magnitude frequency for earthquakes. Geophys. Bull. Hokkaido Univ.13, 99–103.
Utsu, T., 1992. On seismicity. Report of the Joint Research Institute for StatisticalMathematics: Inst. For Stat. Math., Tokyo, vol. 34, pp. 139–157.
Utsu, T., 1999. Representation and analysis of the earthquake size distribution: ahistorical review and some approaches. Pure Appl. Geophys. 155, 509–535.
Vidale, J.E., Boyle, K.L., Shearer, P.M., 2006. Crustal earthquake bursts in California andJapan: their patterns and relation to volcanoes. Geophys. Res. Lett. 33, L20313.doi:10.1029/2006GL027723.
Waite, G. P., 1999. Seismicity of the Yellowstone Plateau: space–time patterns and stressesfrom focal mechanism inversion: M. S. thesis, University of Utah, Salt Lake City.
Waite, G.P., Smith, R.B., 2002. Seismic evidence for fluid migration accompanyingsubsidence of the Yellowstone caldera. J. Geophys. Res. 107 (B9), 2177.doi:10.1029/2001JB000586.
Wall, B.R., 2005. Surface and subsurface hydrothermal flow pathways at Norris GeyserBasin, Yellowstone National Park, Eos Trans. AGU, 86(52), Fall Meet. Suppl. AbstractT23B-0544.
Warren, N.W., Latham, G.V., 1970. An experimental study of thermally inducedmicrofracturing and its relation to volcanic seismicity. J. Geophys. Res. 75, 4455–4464.
White, B.J.P., Smith, R.B., Husen, S., Farrell, J., Wong, I., 2009. Seismicity and earthquakehazard analysis of the Teton–Yellowstone region, Wyoming. J. Volcanol. Geotherm.Res. 188, 277–296.
Wicks, C., Thatcher, W., Dzurisin, D., Svarc, J., 2006. Uplift, thermal unrest and magmaintrusion at Yellowstone caldera. Nature 440, 72–75.
Wiemer, S., 2001. A software package to analyze seismicity: ZMAP. Seismol. Res. Lett.72, 373–382.
Wiemer, S., Benoit, J.P., 1996. Mapping the b-value anomaly at 100 km depth in Alaskaand New Zealand subduction zones. Geophys. Res. Lett. 24, 189–192.
Wiemer, S., McNutt, S.R., 1997. Variations in the frequency–magnitude distributionwith depth in two volcanic areas: Mount St. Helens, Washington, and Mt. Spurr,Alaska. Geophys. Res. Lett. 24, 189–192.
Wiemer, S., Wyss, M., 1997. Mapping the frequency–magnitude distribution inasperities: an improved technique to calculate recurrence times? J. Geophys. Res.102, 15115–15128.
Wiemer, S., Wyss, M., 2000. Minimum magnitude of completeness in earthquakecatalogs: examples from Alaska, the western United States, and Japan. Bull. Seismol.Soc. Am. 90 (4), 859–869.
Wiemer, S., Wyss, M., 2002. Mapping spatial variability of the frequency–magnitudedistribution of earthquakes. Adv. Geophys. 45, 259–302.
Wiemer, S., McNutt, S.R.,Wyss,M., 1998. Temporal and three-dimensional spatial analyses ofthe frequency–magnitude distribution near Long Valley Caldera, California. Geophys. J.Int. 134, 409–421.
Woessner, J., Wiemer, S., 2005. Assessing the quality of earthquake catalogues:estimating the magnitude of completeness and its uncertainty. Bull. Seismol. Soc.Am. 95 (2), 684–698. doi:10.1785/0120040007.
Wong, I., S. Olig, andM. Dober, 2000, Preliminary Probabilistic Seismic Hazard Analysis;Island Park, Grassy Lake, Jackson Lake, Palisades, and Ririe Dams, U.R.S. GrienerWoodward Clyde, Final report prepared for the Bureau of Reclamation, 40 pages.
Wyss, M., 1973. Towards a physical understanding of the earthquake frequencydistribution. Geophys. J. R. Astron. Soc. 31, 341–359.
Wyss, M., Shimazaki, S., Wiemer, S., 1997. Mapping active magma chambers beneaththe off-Ito volcano, Japan. J. Geophys. Res. 102, 413–420.
Wyss, M., Klein, F., Nagamine, K., Wiemer, S., 2001. Anomalously high b-values in theSouth Flank of Kilauea volcano, Hawaii: evidence for the distribution of magmabelow Kilauea's East rift zone. J. Volcanol. Geotherm. Res. 106, 23–37.
Youngs, R.R., Swan, F.H., Power, M.S., Schwartz, D.P., Green, R.K., 1987. Probabilisticanalysis of earthquake ground shaking hazard along the Wasatch Front, Utah. In:Gori, P.L., Hays, W.W. (Eds.), Assessment of Regional Earthquake Hazards and Riskalong the Wasatch Front, Utah. USGS, Reston, VA, pp. M1–M110.

44.0
44.5
45.0
-111
.5
-111
.5
-111
.0
-111
.0
-110
.5
-110
.5
-110
.0
-110
.0
44.0
44.5
45.0
050
km
A
050
km
B
-111
.5
-111
.5
-111
.0
-111
.0
-110
.5
-110
.5
-110
.0
-110
.0

2/26/2001 3/2/2001 5 -111.0165 44.7188 29 1.94 544/30/2001 5/4/2001 5 -110.9420 44.7386 17 1.91 376/19/2001 6/28/2001 10 -110.9075 44.7529 10 2.48 359/6/2001 9/10/2001 5 -111.0180 44.7623 16 0.99 34
11/20/2001 11/22/2001 3 -110.8690 44.7473 18 1.29 3111/30/2001 1/9/2002 41 -111.0530 44.7815 49 3.13 480
5/11/1999 5/19/1999 9 -111.0720 44.7461 15 2.34 315/17/1999 5/31/1999 15 -110.9870 44.6702 19 2.40 706/13/1999 7/16/1999 34 -111.0000 44.7517 112 4.19 722 6/13/1999 6/25/1999 13 -111.1105 44.7536 42 2.31 143 6/27/1999 7/7/1999 11 -111.1195 44.7486 9 2.07 387/31/1999 8/28/1999 29 -110.9715 44.7604 119 3.14 586 8/7/1999 8/14/1999 8 -111.1225 44.7424 136 2.17 162
8/27/1999 8/27/1999 1 -110.6025 44.4692 35 4.82 3510/3/1999 10/21/1999 19 -110.9200 44.7617 37 3.03 101
10/28/1999 10/28/1999 1 -111.0165 44.6808 48 1.55 4812/21/1999 12/26/1999 6 -110.9465 44.7666 19 2.76 381/25/2000 1/30/2000 6 -111.0745 44.7231 49 2.27 593/21/2000 4/13/2000 24 -111.0185 44.7698 40 2.16 278 7/25/2000 8/18/2000 25 -110.7975 44.7971 54 2.72 211
10/24/2000 10/27/2000 4 -111.1305 44.7368 29 2.18 5111/23/2000 11/26/2000 4 -110.6975 44.7343 82 3.76 9312/24/2000 12/28/2000 5 -110.8500 44.7349 34 2.51 541/16/2001 1/25/2001 10 -111.0520 44.6347 130 2.40 320
10/11/1996 11/8/1996 29 -110.7820 44.7331 68 2.83 281 4/27/1997 5/12/1997 16 -110.7910 44.7455 17 2.18 446/6/1997 6/27/1997 22 -110.8195 44.7324 140 3.76 363 7/7/1997 7/21/1997 15 -110.7935 44.7175 27 2.61 52
8/12/1997 8/13/1997 2 -111.0810 44.7075 76 1.90 9112/25/1997 12/30/1997 6 -111.0395 44.7082 45 2.59 645/26/1998 5/28/1998 3 -110.7955 44.7673 34 2.21 359/27/1998 9/30/1998 4 -111.0550 44.7050 44 2.27 499/27/1998 10/4/1998 8 -110.3400 44.4711 52 3.80 159
11/10/1998 12/1/1998 22 -111.0915 44.6229 50 2.55 189 1/1/1999 1/13/1999 13 -110.8225 44.7747 16 2.69 61
Table S1 - Table of Yellowstone earthquake swarms # Start Day End Day Dur Lon Lat EQ/Daymax Magmax No. EQ
3/1/1985 3/11/1985 11 -110.7495 44.7884 71 2.77 148 10/3/1985 11/17/1985 46 -110.9995 44.6422 85 3.72 462
11/24/1985 12/10/1985 17 -111.0050 44.6503 11 3.08 529/29/1989 10/3/1989 5 -111.0635 44.7243 37 2.16 67
10/24/1989 11/1/1989 8 -111.0770 44.7411 50 2.28 682/26/1990 3/9/1990 12 -111.0765 44.6385 84 2.11 233 5/2/1994 5/4/1994 3 -111.0815 44.7436 38 2.26 549/9/1994 9/17/1994 9 -111.0295 44.7356 33 2.11 52
6/25/1995 7/9/1995 15 -110.9080 44.6329 170 2.84 439 7/11/1995 7/21/1995 11 -110.9060 44.6303 41 2.35 90
11/27/1995 12/8/1995 12 -110.8985 44.7461 43 3.05 192
41 42 43 44 45 46
23242526 27 28 29 30 31 32 33 34 35 36 37 38 39 40
1213141516171819202122
1234567891011

1/3/2003 1/13/2003 11 -111.0075 44.5208 43 2.48 851/29/2003 2/13/2003 16 -110.9895 44.5196 31 2.92 792/5/2003
4/12/2004 4/20/2004 9 -110.9519 44.7449 295 2.60 4297/16/2004 7/18/2004 3 -111.1771 44.7611 20 2.22 356/1/2005 6/8/2005 8 -111.1199 44.7542 16 2.08 51
8/14/2005 8/24/2005 11 -110.9968 44.6304 13 1.76 532/22/2006 2/22/2006 1 -110.9700 44.5408 42 1.95 424/5/2006 4/6/2006 2 -110.6176 44.1998 37 2.43 74
5/18/2006 5/26/2006 9 -110.9892 44.7642 14 2.50 456/11/2006 6/21/2006 11 -111.0576 44.7468 28 2.12 816/12/2006 6/15/2006 4 -110.9100 44.5669 37 2.26 557/10/2006 7/11/2006 2 -110.7897 44.5632 25 2.83 31
10/14/2006 10/15/2006 2 -110.9231 44.5489 54 2.61 7411/4/2006 11/7/2006 4 -111.0474 44.4792 36 2.57 47
2/7/2003 3 -111.0020 44.7380 22 1.17 35
1/15/2002 1/17/2002 3 -110.7320 44.5961 56 2.78 601/29/2002 2/2/2002 5 -111.0090 44.7685 22 0.82 498/9/2002 8/15/2002 7 -110.9925 44.7392 10 1.46 30
10/8/2002 10/12/2002 5 -110.5610 44.3746 64 3.14 11011/3/2002 11/7/2002 5 -110.9590 44.6092 18 2.47 4511/3/2002 11/10/2002 8 -110.7970 44.7330 31 1.54 5911/3/2002 11/10/2002 8 -111.1080 44.7449 48 2.89 67
555657
4748495051525354
6566676869
58596061626364
12/5/2002 12/10/2002 6 -110.8750 44.7449 283 3.32 331
Table S1 - Table of Yellowstone earthquake swarms continued # Start Day End Day Dur Lon Lat EQ/Daymax Magmax No. EQ