
Earthquake-Induced Collapse Simulation of a Super-Tall ...
38
Earthquake-induced collapse simulation of a super-tall mega-braced frame-core tube building Author Lu, Xinzheng, Lu, Xiao, Guan, Hong, Zhang, Wankai, Ye, Lieping Published 2013 Journal Title Journal of Constructional Steel Research DOI https://doi.org/10.1016/j.jcsr.2012.12.004 Copyright Statement © 2013 Elsevier B.V. This is the author-manuscript version of this paper. Reproduced in accordance with the copyright policy of the publisher. Please refer to the journal's website for access to the definitive, published version. Downloaded from http://hdl.handle.net/10072/53590 Griffith Research Online https://research-repository.griffith.edu.au
Transcript of Earthquake-Induced Collapse Simulation of a Super-Tall ...

Earthquake-induced collapse simulation of a super-tallmega-braced frame-core tube building
Author
Lu, Xinzheng, Lu, Xiao, Guan, Hong, Zhang, Wankai, Ye, Lieping
Published
2013
Journal Title
Journal of Constructional Steel Research
DOI
https://doi.org/10.1016/j.jcsr.2012.12.004
Copyright Statement
© 2013 Elsevier B.V. This is the author-manuscript version of this paper. Reproduced inaccordance with the copyright policy of the publisher. Please refer to the journal's website foraccess to the definitive, published version.
Downloaded from
http://hdl.handle.net/10072/53590
Griffith Research Online
https://research-repository.griffith.edu.au

1
Earthquake-Induced Collapse Simulation of a Super-Tall
Mega-Braced Frame-Core Tube Building
Xinzheng Lua1
, Xiao Lua, Hong Guan
b, Wankai Zhang
a and Lieping Ye
a
aDepartment of Civil Engineering, Tsinghua University, Beijing 100084, China;
bGriffith School of Engineering, Griffith University Gold Coast Campus, Queensland 4222,
Australia
Abstract: Research on earthquake-induced collapse simulation has a great practical
significance for super-tall buildings. Although mega-braced frame-core tube buildings are one
of the common high-rise structural systems in high seismic intensity regions, the failure mode
and collapse mechanism of such a building under earthquake events are rarely studied. This
paper thus aims to investigate the collapse behavior of a super-tall mega-braced frame-core
tube building (H = 550 m) to be built in China in the high risk seismic zone with the
maximum spectral acceleration of 0.9 g (g represents the gravity acceleration). A finite
element (FE) model of this building is constructed based on the fiber-beam and multi-layer
shell models. The dynamic characteristics of the building are analyzed and the
earthquake-induced collapse simulation is performed. Finally, the failure mode and
mechanism of earthquake-induced collapse are discussed in some detail. This study will serve
as a reference for the collapse-resistance design of super-tall buildings of similar type.
Keywords: super-tall building; collapse simulation; finite element model; fiber-beam model;
1 Corresponding author. Tel: +86-10-62795364; fax: +86-10-62795364
E-mail address: [email protected]

2
multi-layer shell model.
1. Introduction
Tall buildings, in particular super-tall buildings, have become important symbols of a
country's economic prosperity. The Council on Tall Buildings and Urban Habitat (CTBUH)
defines “super-tall” as a building over 300 m in height [1]. Super-tall buildings have become
increasingly popular and have large impact on the economy and society. Such buildings have
a complicated structural system consisting of hundreds of different components, including
those with complex features and large dimensions. To ensure safe and economic design,
construction and operation of super-tall buildings under various loading conditions in
particular earthquake events, detailed studies are required to examine the seismic performance
of super-tall buildings.
The scaled shaking table tests have been widely adopted as a traditional research tool to
understand the seismic performance of super-tall buildings. In 2001, Xu et al. [2] conducted a
1:25 scaled shaking table test of a reinforced concrete (RC) frame core-tube building of 218
m in height. The dynamic properties and seismic responses of the building under different
seismic intensities were evaluated. In 2006, Li et al. [3] performed a 1:20 scaled shaking table
test of a thirty-four-story RC structure with a 2.7 m height transfer story, by which the seismic
responses under small to extreme earthquakes in medium-intensity areas were investigated. In
2006 and 2010, respectively, Lu and his colleagues [4, 5] conducted 1:50 scaled shaking table
tests of Shanghai World Financial Center (492 m) and Shanghai Tower (632 m) models. The
dynamic properties and seismic responses of these two super-tall buildings under different
seismic intensities, according to their located seismic zone, were also evaluated. A similar test
3
with a 1:20 scale was conducted by Zhao et al. [6] in 2008 on the Beijing New Poly Plaza
(105.2 m) model. In all the above reported scaled shaking table tests, no collapses were
observed in the structural models. Therefore, these tests cannot facilitate further investigation
of the collapse mechanisms of super-tall buildings.
On the other hand, the shaking table test is also gradually adopted to study the collapse
behavior of structures in recent years. In 2006, Wu et al. [7] carried out a 1:3 scaled shaking
table collapse test of a one-story, single-bay and three-span RC frame structure. In 2007, a
full-scale collapse test of a three-story RC structure with a flexible foundation was performed
by Toshikazu et al. [8] on the E-Defense shake table. In the following year, a similar test of a
four-story steel frame structure was conducted by Yamada and his colleagues [9, 10] and a
progressive collapse test of a four-span three-story RC plane frame was conducted by Yi et al.
[11]. Despite these experimental efforts, all the existing collapse tests were focused on single-
or multi-story building models, primarily due to limited capacity of the testing facilities, such
as the shaking table scales. Note that the size effect has a significant influence on the collapse
test results. This requires a much larger scale (ranging from full scale to 1:4 scale) for
conducting collapse tests on a shaking table than that of a regular shaking table tests (ranging
from 1:20 to 1:50 scale, e.g., the work done by Li et al., Lu et al. and Zhao et al. [3-6]). As a
consequence, for super-tall buildings of several hundred meters high, studying seismic
collapse resistance by means of shaking table tests is both difficult and impractical.
To investigate the seismic performance and collapse mechanisms of buildings, numerical
simulation has been shown to be an important alternative research tool. Using LS-DYNA, Lu
and Jiang [12] proposed in 2002 a finite element (FE) model of the World Trade Center to

4
simulate the collapse process induced by aircraft impact and explored the main reasons of
progressive collapse. Similarly, in 2002, Quan and Birnbaum [13] simulated the collapse
process of the South Tower of the World Trade Center with AUTODYN-3D. In 2004,
Luccioni et al. [14] simulated the entire collapse process of a seven-story RC structure under
blast loads, and the analysis results showed a good agreement with the actual collapse process.
In 2007, Huang et al. [15] simulated the earthquake-induced collapse of a 115 m high
reinforced concrete chimney by using 3-D pushover analysis. In 2009, Fan et al. [16]
constructed a refined FE model of Taipei 101 with ANSYS by which the seismic performance
of the building under different seismic intensities was evaluated. This work illustrated that
super-tall buildings with mega-frames have sufficient safety margins and satisfy the design
requirements for the Maximum Considered Earthquake (MCE) ground motion specified in the
design code.
However, only limited research has been reported on the earthquake-induced collapse
simulation of actual super-tall buildings. With the development of structural materials and
construction technology, super-tall building construction has entered into a period of vigorous
development. Such buildings are rapidly increasing in number and structural height.
Therefore, fundamental understanding of the seismic performance and collapse resistance of
super-tall buildings will become an important research frontier in earthquake engineering.
This paper presents an earthquake-induced collapse simulation of a super-tall building to
be built in China in a high risk seismic region with a maximum spectral acceleration of 0.9 g.
A FE model of this building is constructed based on the fiber-beam and multi-layer shell
models. The dynamic characteristics of the building are analyzed and the earthquake-induced

5
collapse simulation is performed. Finally, the failure mode and mechanism of
earthquake-induced collapse are discussed in some detail. This study will serve as a reference
for the collapse-resistance design of super-tall buildings of similar type.
2. Overview of the super-tall building
The research object is a multi-functional super-tall office building to be built in a region
of an 8 degree seismic intensity. The corresponding PGA (peak ground acceleration) value of
the design earthquake (i.e., exceedance probability of 10% in 50 years) is 200 cm/s2. The
building has 119 stories above the ground with a total height of 550 m. A hybrid
lateral-load-resisting system known as the “mega-braced/frame-core tube/outrigger” (Figure 1)
is adopted. Details of this system are described as follows:
(1) According to the architectural and fire-safety requirements, eight strengthened stories
(refuge stories) are constructed every 13 to 15 stories, which divide the entire structure into
eight zones from the bottom to the top. The planar dimension of the building is a square, with
its bottom size of 68 m × 68 m. The size of the square decreases linearly with the building
height until reaching a minimum of 50 m × 50 m in Zone 7, and then increases to 60 m × 60
m at the top of the building.
(2) The RC core tube is of 30 m × 30 m in square. For the core tube, the compressive
strength of concrete is 38.5 MPa and it remains constant along the height of the core tube. The
yield strength of the steel plate embedded in the shear wall is 390 MPa; and the yield strength
of the reinforcement in the wall is 335 MPa. The thickness of the flange wall of the core tube

6
is 1.1 m at the bottom. It decreases gradually with the height of the building down to 0.5 m at
the top of the tube. The thickness of the web wall of the core tube, on the other hand, changes
little with the height, being 0.4 m in the lower four zones and 0.3 m in the upper four zones.
(3) The mega-braced frame system consists of mega-columns at the four corners. The
mega-braces are located in Zones 1 to 4. The closely spaced perimeter columns are located in
Zones 5 to 8. The concrete-filled square steel tube (CFST) columns function as the
mega-columns, and their maximum cross-sectional dimension is 6500 mm 6500 mm at the
bottom. The compressive strengths of concrete in the CFST are 44.5 MPa and 38.5 MPa,
respectively, in the lower four zones, and in Zones 5 and 6. For Zones 7 and 8, the
compressive strength reduces to 32.4 MPa. The corresponding thickness of the steel tube is 80
mm with a yield strength of 390 MPa. All the mega-columns extend from the bottom to the
top of the building. The cross-sectional size decreases gradually to 2000 mm 2000 mm, and
the thickness of the tube decreases to 40 mm. The mega-braces are constructed from welded
steel box beams, with a maximum dimension of 1800 mm (height) × 900 mm (width) × 110
mm (thickness of the web) × 110 mm (thickness of the flange). The closely spaced perimeter
columns in Zones 5 to 8 are also in form of steel box with a sectional dimension of 700 mm
(height) × 700 mm (width) × 30 mm (thickness of the web) × 30 mm (thickness of the flange).
The yield strength of steel in the mega brace is 390 MPa.
(4) There are a total of eight perimeter outriggers from the bottom to the top of the
building. Radial outriggers are installed in Zones 5 to 8 to connect the outside frame system
and the inner core tube system. The height of the outrigger is 9 m, and all the components of
the perimeter and radial outriggers are made of H-shaped or box-shaped steel beams with a

7
yield strength of 390 MPa.
(5) According to the Loading Code for the Design of Building Structures (GB5009-2001)
[17], the wind pressure is about 0.45 kN/m2 with a 50-year return period and 0.5 kN/m
2 with a
100-year return period. Given the objectives for a higher design performance, the 100-year
return period wind pressure is adopted herein to design the strength of the structural
components; while the 50-year return period wind pressure is used to assess the horizontal
displacement under the wind load. Note that this super high-rise building is located in the
high risk seismic zone, therefore the maximum story drift ratio subjected to the serviceability
seismic load (i.e., a 25-year return period) is about 1/570, which is much lager than the
maximum story drift ratio subjected to the wind load (i.e., 1/940). It is evident that these two
story drift ratios satisfy the acceptable criteria of the maximum story drift ratio of 1/500
specified in the Chinese design code, i.e., Code for Seismic Design of Buildings [18]. Thus,
the design of this super high-rise building is governed by the seismic load instead of the wind
load.
3. Finite element model
Collapse simulation of a super-tall building is a challenging task, which consists of
modeling complex structural components, solving highly nonlinear differential equations and
performing large-scale computations. Based on the general-purpose finite element code
MSC.Marc [19], which has proven performance record in nonlinear computation, a 3D FE
model of the super-tall mega-braced frame-core tube structure is constructed with the
proposed material constitutive laws, element models and elemental failure criteria. The details

8
of the FE modeling are described as follows.
3.1 Constitutive material models
Adopted in the FE model are the fiber-beam elements in conjunction with the multi-layer
shell elements. These two models have been successfully used in the collapse simulation of a
number of high-rise buildings; and detailed mechanisms and validation of these models are
given in Lu et al. [20]. In the fiber beam element, the cross section of the beam or column is
divided into a number of fibers and each fiber exhibits different constitutive material models.
In the multi-layer shell element, each element is divided into a number of layers along the
thickness direction. The horizontal and the vertical reinforcement of the wall or the embedded
steel plate are treated as the equivalent steel layers. When using these elements, the
macro-scale elemental behavior (e.g., axial force, bending moment, displacement, rotation
etc.) are directly linked to the micro-scale material constitutive laws (e.g., stress, strain etc.).
This facilitates accurate representation of the nonlinear behavior and failure process of the
structural components under complex stress states (i.e., coupled axial forces, bending
moments and shear forces). The building materials used in this super-tall building are
concrete and steel. Therefore, three types of constitutive material models are adopted in this
analysis, including elasto-plastic-fracture concrete constitutive models for the shear walls and
coupling beams, a confined concrete constitutive model for the CFST columns, and the
elasto-plastic steel constitutive law for the steel reinforcement, steel tubes and steel frames.
The shear walls and coupling beams are modeled with multi-layer shell elements (with
details presented in the next section). The elasto-plastic-fracture concrete constitutive model
provided by MSC.Marc [19, 21] is adopted. The rationality of this material model is validated
9
by Miao et al. [21] where the numerical results are in a good agreement with the experimental
data in simulating the mechanical behavior of reinforced concrete members under complex
stress states.
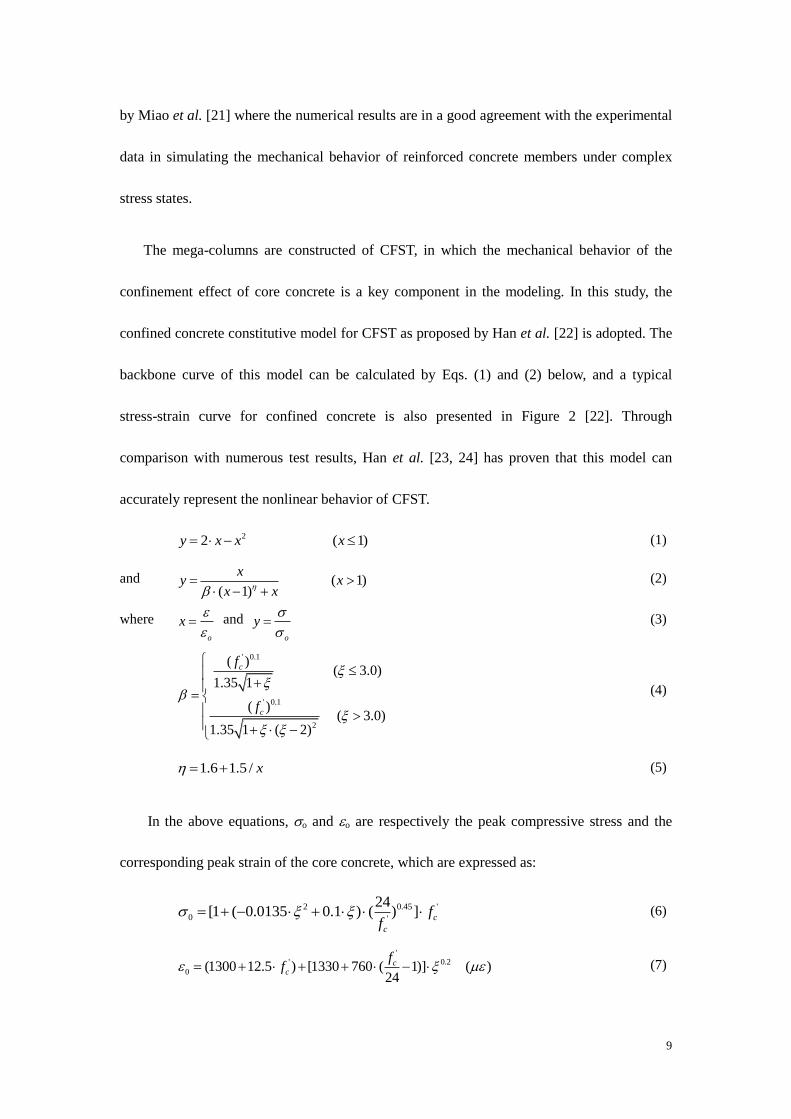
The mega-columns are constructed of CFST, in which the mechanical behavior of the
confinement effect of core concrete is a key component in the modeling. In this study, the
confined concrete constitutive model for CFST as proposed by Han et al. [22] is adopted. The
backbone curve of this model can be calculated by Eqs. (1) and (2) below, and a typical
stress-strain curve for confined concrete is also presented in Figure 2 [22]. Through
comparison with numerous test results, Han et al. [23, 24] has proven that this model can
accurately represent the nonlinear behavior of CFST.
22 ( 1)y x x x (1)
and ( 1)( 1)
xy x
x x
(2)
where
o
x
and
o
y
(3)
' 0.1
' 0.1
2
( )( 3.0)
1.35 1
( )( 3.0)
1.35 1 ( 2)
c
c
f
f
(4)
1.6 1.5 / x (5)
In the above equations, o and o are respectively the peak compressive stress and the
corresponding peak strain of the core concrete, which are expressed as:
2 0.45 '
0 '
24[1 ( 0.0135 0.1 ) ( ) ] c
c
ff
(6)
'
' 0.2
0 (1300 12.5 ) [1330 760 ( 1)] ( )24
cc
ff (7)

10
where is the confinement factor )/()/( ckycs ffAA , which reflects the confinement
effect of the steel tube, the larger the is, the stronger the confinement effect is; '
cf is the
cylinder axial compressive strength of concrete; As is the sectional area of the steel tube; Ac is
the area of the concrete in the tube; fy is the yield stress of steel and fck is the prismoidal
compressive strength of concrete, which equals 0.96'
cf . The strain corresponding to the
10%0 is adopted as the ultimate strain u for the confined concrete in the tube.
The von Mises yield criterion-based plastic constitutive model [21] is used for steel. The
stress-strain backbone curve exhibits four stages, including elastic, yield, hardening and
post-necking. The key points of the steel backbone curve and their corresponding values are
shown in Figure 3.
3.2 FE model for the core tube
The shear walls and coupling beams in the core tube are simulated by the multi-layer
shell elements proposed by Miao et al. [21]. A schematic diagram of the element is shown in
Figure 4. This type of element is based on the principles of composite material mechanics.
The shell is divided into several layers over its thickness and each layer has either concrete or
steel constitutive model. The multi-layer shell model performs well in simulating the complex
nonlinear behavior of shear walls by considering the coupling effect of bending and both
in-plane and out-plane shear. Lu et al. [20] and Miao et al. [21] have verified the accuracy
and efficiency of the multi-layer shell element model for shear walls and coupling beams.
According to the actual reinforcement arrangement in the shear wall, a total of 21 layers are
adopted in every multi-layer shell element. The FE models of the typical core tubes along the
11
height of the building are shown in Figure 5. Note that the colors in the figure represent
different wall thicknesses, t, in different zones.
3.3 FE model for the outrigger and mega-brace
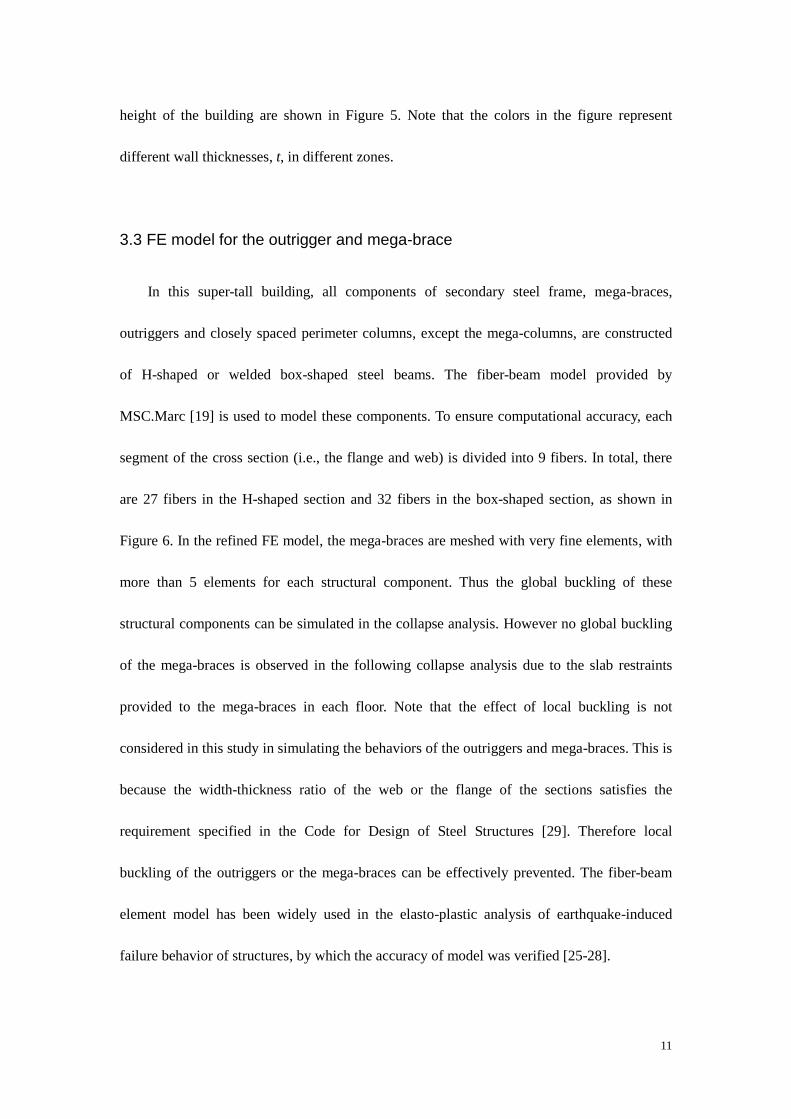
In this super-tall building, all components of secondary steel frame, mega-braces,
outriggers and closely spaced perimeter columns, except the mega-columns, are constructed
of H-shaped or welded box-shaped steel beams. The fiber-beam model provided by
MSC.Marc [19] is used to model these components. To ensure computational accuracy, each
segment of the cross section (i.e., the flange and web) is divided into 9 fibers. In total, there
are 27 fibers in the H-shaped section and 32 fibers in the box-shaped section, as shown in
Figure 6. In the refined FE model, the mega-braces are meshed with very fine elements, with
more than 5 elements for each structural component. Thus the global buckling of these
structural components can be simulated in the collapse analysis. However no global buckling
of the mega-braces is observed in the following collapse analysis due to the slab restraints
provided to the mega-braces in each floor. Note that the effect of local buckling is not
considered in this study in simulating the behaviors of the outriggers and mega-braces. This is
because the width-thickness ratio of the web or the flange of the sections satisfies the
requirement specified in the Code for Design of Steel Structures [29]. Therefore local
buckling of the outriggers or the mega-braces can be effectively prevented. The fiber-beam
element model has been widely used in the elasto-plastic analysis of earthquake-induced
failure behavior of structures, by which the accuracy of model was verified [25-28].

12
3.4 FE model for the mega-columns
A special component in this super-tall building is the mega-columns located at the four
corners. In Zone 1, the mega-column system consists of four CFST columns. From Zone 2,
each CFST column is subdivided into two sub-columns. The maximum cross section of the
CFST columns is shown in Figure 7, which is approximately 40 m2 with a steel ratio of
4.86%.
Note that the external steel tube provides a strong confinement for the core concrete. To
replicate the confinement effect, the mega-column is modeled with a fiber-beam element, in
which the section of the CFST column is divided into 100 fibers, including 64 concrete fibers
for the core concrete and 36 steel fibers for the external steel tube. The distribution of the
fibers in a typical cross-section is shown in Figure 8. The concrete and steel constitutive
models for CFST, as described in Section 3.1, are adopted for concrete and steel fibers,
respectively. Note that the fiber-beam model has been widely used to study the mechanical
behavior of the CFST columns [30-34] and has been demonstrated to perform well in
replicating the actual behavior of CFST.
The local buckling behavior and the biaxial stress states of the steel tubes are two
important issues in CFST research which has lead to various analytical methods [35-37]. It
should be noted that this study places more focus on the global structural seismic behaviors.
Note also that for the concerned super-tall building, the cross-section of the CFST columns is
considerably large in dimension which requires sufficient shear keys and diaphragms to be
welded in the inner steel tube. This offers the ability for concrete to restrain the inward and

13
outward displacements of the tube thereby preventing the occurrence of local buckling. Hence,
for global analysis of the structure, the effect of local buckling of the steel tubes can be
neglected in the current fiber-beam element model. In addition, the biaxial stress effect can
also be neglected in the finite element model due to its insignificance in global analysis.
Similar studies [38, 39] have also demonstrated the applicability and reliability of the
fiber-beam element model in predicting the global seismic responses of the CFST structure
without considering the effects of local buckling and biaxial stress states.
3.5 Elemental failure criteria
During the process of collapse, the structural components either crush or break into
fragments. This phenomenon is simulated with element-deactivation technology. When a
specified element-failure criterion is reached, the element is “deactivated” and a small value
is set for the stiffness matrix and mass matrix of the corresponding element. In this study,
each multi-layer shell element is divided into 21 layers and each section of the fiber-beam
element is divided into 27~100 concrete or steel fibers (Figures 6 and 8). If the principal
compressive strain in a concrete layer/fiber exceeds the crushing strain of concrete (i.e., the
softening branch of the concrete approaches zero) or the principal tensile strain in a steel
layer/fiber exceeds the fracture strain of steel, the stress and the stiffness of this layer/fiber are
deactivated, meaning that this layer/fiber no longer contributes to the computation of the
entire structure. If all the layers of a shell element or all the fibers in a fiber-beam element are
deactivated, the element is considered fully deactivated from the model [20, 40].

14
Generally, confined concrete (e.g., concrete-filled square steel tube columns) exhibits
much higher ductility than its unconfined counterpart (e.g., concrete in the cover layer),
therefore, different failure criteria for concrete crushing are adopted, as well as different
failure criteria for different steel. Details of the failure criteria for concrete and steel are
summarized in Table 3.
4. Structural collapse process and failure mechanisms
In general, a super-tall building possesses a sufficient safety margin to resist the MCE
ground motion specified in the design code. In the present study, to fully understand the
collapse process and failure mechanisms of super-tall buildings, the ground-motion intensity
is scaled up until the structure collapses. Although an earthquake of the scaled magnitude is
unlikely to occur, the ability to understand the mechanical properties of super-tall buildings
based on the predicted collapse modes and mechanisms will be helpful.
4.1 Basic dynamic characteristics
To obtain the basic dynamic properties of this super-tall building, a dynamic modal
analysis is performed before the collapse simulation. The total gravity load of the building is
7.534 × 10⁵ tons. The first nine vibration periods and the corresponding modal properties are
shown in Table 1 and Figure 9. The translational modal shapes of the building in the
Y-direction are similar to those in the X-direction because the planar dimension of the
building is a square and the building has a symmetrical layout. These translational modal
shapes are common for tall buildings. The fundamental period of this building is

15
approximately 7.69 s in the Y-direction and 7.44 s in the X-direction, which are beyond the
maximum vibration period specified in the design response spectrum in the Chinese Code for
the Seismic Design of Buildings (i.e., 6.0 s) [18].
4.2 Elasto-plastic analysis of model subjected to the MCE ground motion
The widely used ground motion recorded at the El-Centro station in the USA in 1940
(referred to as “El-Centro” hereafter) [42] is selected as a typical example of ground motion
input. The normalized acceleration time history of the east-west component of the El-Centro
ground motion and its elastic response acceleration spectrum with a 5% damping ratio are
shown in Figure 10. The PGA is scaled to 400 cm/s2 and 510 cm/s
2, which correspond to the
MCE ground motion in seismic design intensity 8 and 8.5 regions, respectively [18]. The
ground motion input is applied to the Y-direction of the building. The distribution of plastic
zones for this super-tall building under the abovementioned two seismic intensities is shown
in Figure 11.
Figure 11 indicates that when PGA = 400 cm/s2, most of the plastic zones occur in
columns and beams in the secondary steel frame in Zones 2 and 3. When PGA = 510 cm/s2,
the plastic zones expand in the secondary steel frame in Zones 2, 3 and 8. These plastic zones
are developed as a result of the complicated interaction between the much stiffer mega-braces
and the adjoining weaker secondary steel frame. Note that both the inner core tube and the
external mega-columns and mega-braces constitute the main lateral-load-resisting system of
the super-tall building. Such an arrangement causes excessive axial loads in the mega-braces
under seismic loading, which in turn leads to yielding of the secondary steel frame at the

16
adjoining location to the mega-braces. Despite the existence of the plastic zones, most of the
building components remain elastic. It can be concluded that this super-tall building has
sufficient seismic resistance to the MCE specified in the design code. The maximal story drift
ratio of the building subject to PGA = 510 cm/s2 seismic load is 1/110, which is smaller than
the plastic story drift ratio limitation specified in the Technical Specification for Concrete
Structures for Tall Building (i.e., 1/100) [43].
4.3 Seismic collapse simulation and analysis
4.3.1 Seismic collapse simulation subjected to El-Centro ground motion
The El-Centro ground motion is also selected as a typical input in the Y-direction to
perform the collapse simulation. The intensity of the ground motion is scaled up step by step,
and the structure starts to collapse when PGA = 2940 cm/s2, which is 9.6 times larger than the
actual ground-motion intensity (the actual PGA of the El-Centro ground motion was
approximately 307 cm/s2). Due to the lack of damping ratio data for super-tall buildings
subjected to strong earthquakes, a 5% damping ratio suggested in Section 5.3.4 of the
Specification for the Design of Steel-Concrete Hybrid Structures in Tall Buildings (CECS
230 : 2008) [44] is adopted in this analysis. The damping effect is simulated with Rayleigh
damping model. A typical collapse mode of this building under the El-Centro ground motion
is shown in Figure 12. Distribution of the failed elements (i.e., deactivated elements) during
the structural seismic collapse is displayed in Figure 13.
The overall and detailed collapse processes are shown in Figures 14 and 15, respectively.

17
At the initial stage when t = 1.461 s (Figure 15a), the shear wall at the bottom of the building
begins to fail due to concrete crushing as a result of large compressive forces. The failed shear
walls are mainly located at the edge of the core tube. When t = 1.585 s (Figure 15b), many
shear wall elements at the bottom of Zone 1 are destroyed, and the coupling beams located in
Zones 6 and 7 begin to fail due to shear. Subsequently when t = 2.433 s (Figure 15c), more
than 50% of the shear walls at the bottom of Zone 1 collapsed, and the internal forces are
redistributed to other structural components. The vertical and horizontal loads in the
mega-columns increase gradually and reach their load-carrying capacities. Then, the
mega-columns in Zones 1 and 2 begin to fail under combined over-turning moment and
compression. When t = 3.5 s (Figure 15d), the shear walls at the junction of Zones 6 and 7 are
severely damaged and most of the coupling beams in these two zones fail due to shear.
Finally, when t = 4.5 s (Figure 15e), the mega-columns at the bottom of Zone 1 and half of
the mega-columns in Zone 2 are destroyed, and the core tube at the bottom of Zone 1 is
severely damaged. All these failures contribute to the local collapse at the junction of Zones 1
and 2 which in turn have a significant impact on the entire building. From the collapse
process described above, the general structural failure sequence proceeds as follows: from the
core tube at the bottom, to the shear walls and coupling beams in the higher zones, and finally
to the mega-columns in Zones 1 and 2.
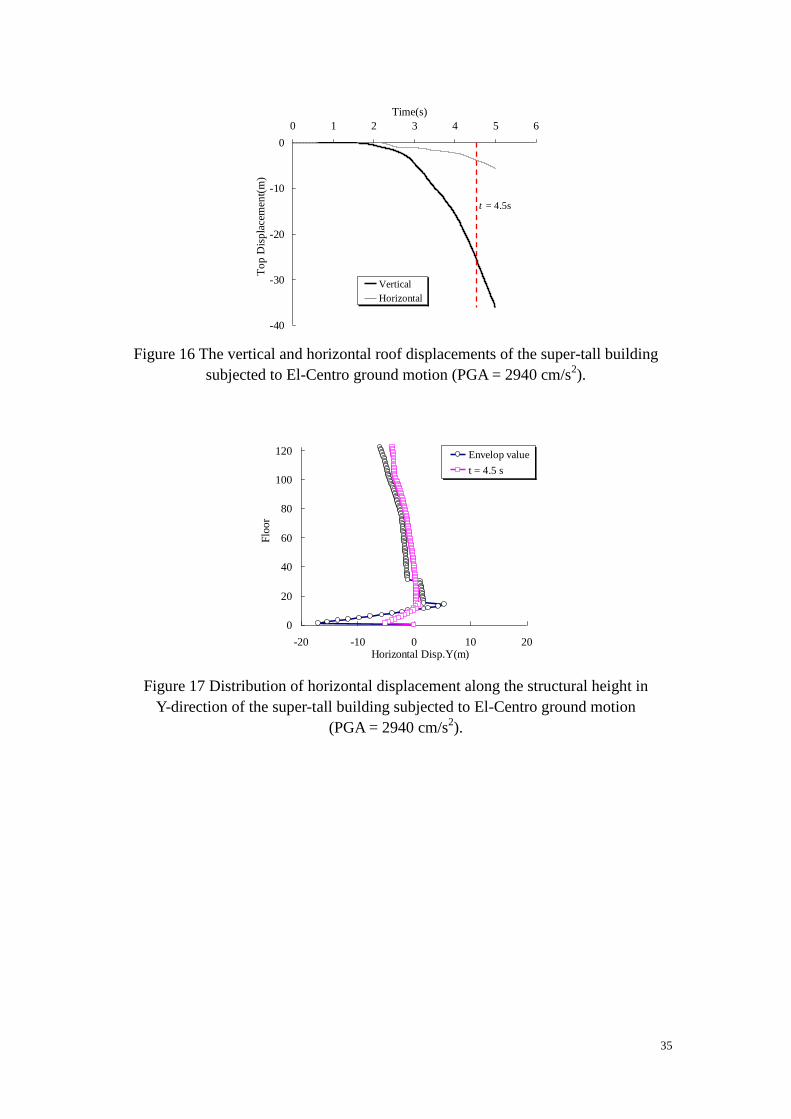
The roof displacement time history in the Y- and vertical directions when the building is
subjected to El-Centro ground motion is shown in Figure 16. The distribution of horizontal
displacement along the structural height in the Y-direction of the super-tall building is shown
in Figure 17. In the figure, the envelop values refer to as the maximum absolute values

18
obtained through time-history analysis. It can be concluded from Figure 10 that, due to the
long translational periods (first- and second-order) and small magnitude of the corresponding
seismic loads, failure of this super-tall building is dominated by higher-order vibration modes,
particularly the third translational vibration mode (shown in Figure 9g). Therefore, as the
building approaches collapse, the deformation mode resembles a higher-order vibration mode.
Figure 16 indicates that the vertical displacement is much larger than the horizontal
counterpart at the stage of collapse. Figure 17 shows that the mass center of the structure
above the failure region does not undergo significant displacement. Therefore, the main
collapse mode of this super-tall mega-braced frame-core tube structure is a vertical
“pancake”-type collapse, rather than lateral overturning.
The above analysis illustrates that when this building is subjected to the El-Centro
ground motion, severe damage occurs mainly in the lower zones of the building, particularly
in Zones 1 and 2. Finally, local collapse occurs at the junction of Zones 1 and 2 and spreads to
the entire building. In addition, severe damage occurs at the junction of Zones 6 and 7. These
areas are particularly weak zones to structural collapse and more attention should be paid to
these areas during health monitoring or field inspection to detect earthquake-induced damage.
Figures 11 and 15 indicate that the initial plastic zones revealed by traditional nonlinear
dynamic analysis may not coincide with the actual collapse regions. In the conventional
elasto-plastic analysis under the MCE ground motion, plastic deformation is mainly
concentrated in Zones 2, 3 and 8. However, collapse occurs at the bottom of the building.
Therefore, to discover the actual critical area of the structure, collapse analysis is highly
important.

19
4.3.2 Seismic collapse simulation subjected to Kobe ground motion
A similar failure mode and collapse process of the same super-tall building can be
observed under other ground-motion inputs. For example, the KOBE-SHI000 (referred to as
“KOBE” hereafter) [42] is selected as the input in the Y-direction of the building for a
collapse simulation. The ground motion is also scaled up step by step to PGA = 1764 cm/s2
until the structure collapses. The normalized acceleration time history of the east-west
component of KOBE ground motion and its elastic response acceleration spectrum with a 5%
damping ratio are shown in Figure 18.
The overall collapse process is shown in Figure 19. At the initial stage of t = 12.310 s,
the shear wall at the bottom of the building begins to fail due to concrete crushing, and the
failure region expands rapidly. When t = 12.410 s, the coupling beams located in higher zones
begin to fail due to shear. Next, when t = 12.810 s, more than 50% of the shear walls at the
bottom of Zone 1 are destroyed and the internal forces are redistributed to other components.
The mega-columns in Zones 1 and 2 begin to fail under combined over-turning moment and
compression. When t = 13.500 s, most of the mega-columns and shell walls at the bottom of
Zone 1 are destroyed and the mega-columns in Zone 2 are severely damaged. All these
failures lead to the collapse of the entire building.
The roof displacement time history in the Y- and vertical directions when the building is
subjected to KOBE ground motion is shown in Figure 20, which indicates that the vertical
displacement is much larger than the horizontal one at the stage of collapse. Figure 20 shows

20
that the mass center of the structure above the failure region does not have significant
displacement. Therefore, it can be further confirmed that the main collapse mode of this
super-tall mega-braced frame-core tube structure is in the form of vertical “pancake” rather
than lateral overturning.
5. Conclusions
Worldwide competitions have rapidly increased in the design and construction of
super-tall buildings. The collapse resistance study of these buildings has become a research
frontier in earthquake engineering. By using the fiber-beam elements, multi-layer shell
elements and element-deactivation technology, the earthquake-induced collapse simulation of
an actual super-tall mega-braced frame-core tube building (H = 550 m) to be built in China is
successfully conducted in this work. Both the El-Centro and KOBE ground motions are
selected and scaled up as input to induce collapse of the building. The overall and detailed
collapse processes, the critical collapse regions and the corresponding structural responses are
reported in some detail. The simulation reveals that the main collapse mode of this super-tall
building is of vertical “pancake” type. Furthermore, the actual collapse regions do not
necessarily coincide with the initial plastic zones predicted by the traditional nonlinear
time-history analysis. Therefore, the collapse simulation and analysis are highly important to
help identify the actual critical areas of the structures. This study has provided a feasible
methodology for the collapse simulation of super-tall buildings of similar type. It can also
serve as a reference for the collapse-resistance design of this type of buildings.

21
Acknowledgment
The authors are grateful for the financial support received from the National Nature
Science Foundation of China (No. 51222804, 51261120377), the Tsinghua University
Initiative Scientific Research Program (No. 2010THZ02-1, 2011THZ03) and the Fok Ying
Dong Education Foundation (No. 131071).
References
[1] "CTBUH Height Criteria". Council on Tall Buildings and Urban Habitat.
http://www.ctbuh.org/HighRiseInfo/TallestDatabase/Criteria/tabid/446/language/en-US/Default.aspx. Retrieved 7
December 2011.
[2] L. Xu, W.X. Shi, J. Zhang, Simulated earthquake experiment study of a high-rise building structure model, J. Build. Struct.
22/5 (2001) 15-19. (in Chinese)
[3] C.S. Li, S.S.E. Lam, M.Z. Zhang, Y.L. Wong, Shaking table test of a 1:20 scale high-rise building with a transfer plate
system, ASCE J. Struct. Eng. 132/11 (2006) 1732-1744.
[4] X.L. Lu, Y. Zou, W.S. Lu, B. Zhao, Shaking table model test on Shanghai world financial center tower, Earthq. Eng. Struct.
Dyn. 36/4 (2007) 439-457.
[5] Y.J. Mao, X.L. Lu, W.S. Lu, L.P. Kang, Shaking table model test on Shanghai tower, J. Civ., Archit. Environ. Eng.
32/Sup.2 (2010) 534-536+549. (in Chinese)
[6] Z.Z. Zhao, H.J. Dong, J.R. Qian, Shaking table test and numerical analysis on structural model of Beijing new poly plaza,
In: Proceedings of 14th World Conference on Earthquake Engineering, Beijing, China, 2008, CDROM.
[7] C.L. Wu, W.W. Kuo, Y.S. Yang, S.J. Hwang, C.H. Loh, Dynamic collapse simulation of 3-bay RC frame under extreme
earthquake loadings, In: ASCE Conference Proceedings, Long Beach, California, USA 249/13 (2007) 1-14.
doi:http://dx.doi.org/10.1061/40944(249)13.
[8] K. Toshikazu, K. Toshimi, M. Taizo, K. Toshinori, K. Yousok, 3-D collapse tests and analyses of the three-story reinforced
concrete buildings with flexible foundation, In: ASCE Conference Proceedings, Long Beach, California, USA 249/15
(2007) 1-14. doi:http://dx.doi.org/10.1061/40944(249)15.
[9] S. Yamada, K. Suita, M. Tada, K. Kasai, Y. Matsuoka, E. Sato, Collapse experiment on 4-story steel moment frame: Part 1,
In: Proceedings of 14th World Conference on Earthquake Engineering, Beijing, China, 2008, CDROM.
[10] K. Suita, S. Yamada, M. Tada, K. Kasai, Y. Matsuoka, E. Sato, Collapse experiment on 4-story steel moment frame: Part 2,
In: Proceedings of 14th World Conference on Earthquake Engineering, Beijing, China, 2008, CDROM.
[11] W.J. Yi, Q.F. He, Y. Xiao, Sashi K. Kunnath. Experimental study on progressive collapse-resistant behavior of reinforced
concrete frame structures, ACI Struct. J. 105/4 (2008) 433-439.
[12] X.Z. Lu, J.J. Jiang, Simulation for the collapse of WTC after aeroplane impact, In: Proceedings of International
22
Conference on Protection of Structures Against Hazard, Singapore, 2002, pp. 57-60.
[13] X. Quan, N.K. Birnbaum, Computer simulation of impact and collapse of New York world trade center north tower on
September 11, In: Proceedings of 20th International Symposium on Ballistics, Orlando, Florida, USA, 2002, pp. 721-728.
[14] B.M. Luccioni, R.D. Ambrosini, R.F. Danesi, Analysis of building collapse under blast loads, Eng. Struct. 26 (2004)
63-71.
[15] W. Huang, P. L. Gould, 3-D pushover analysis of a collapsed reinforced concrete chimney, Finite. Elem. Anal. Des. 43
(2007) 879-887
[16] H. Fan, Q.S. Li, Y.T. Alex, L. Xu, Seismic analysis of the world’s tallest building, J. Constr. Steel Res. 65/5 (2009)
1206-1215.
[17] GB 5009-2001, Load code for the design of building structures, Beijing: Ministry of Construction of the People's Republic
of China, 2006. (in Chinese)
[18] GB50011-2010, Code for seismic design of buildings, Beijing: Ministry of Housing and Urban-Rural Development of the
People's Republic of China, 2010. (in Chinese)
[19] MSC.Software Corp. MSC.Marc Volume A: Theory and User Information, 2007.
[20] X. Lu, X.Z. Lu, H. Guan, L.P. Ye, Collapse simulation of reinforced concrete high-rise building induced by extreme
earthquakes, Earthquake Eng Struct Dyn. (2012) DOI: 10.1002/eqe.2240.
[21] Z.W. Miao, L.P. Ye, H. Guan, X.Z. Lu, Evaluation of modal and traditional pushover analyses in frame-shear-wall
structures, Adv. Struct. Eng. 14/5 (2011) 815-836.
[22] L.H. Han, X.L. Zhao, Z. Tao, Tests and mechanics model of concrete-filled SHS stub columns, columns and
beam-columns, Steel Compos. Struct. 1/1 (2001) 51–74.
[23] L.H. Han, G.H. Yao, X.L. Zhao, Tests and calculations for hollow structural steel (HSS) stub columns filled with
self-consolidating concrete (SCC), J. Constr. Steel Res. 61/9 (2005) 1241-1269.
[24] L.H. Han, Concrete-filled steel tubular structures: theory and practice, second ed., Science Press, Beijing, 2007. [in
Chinese]
[25] E. Spacone, F. Filippou, F. Taucer, Fiber beam-column modeling for non-linear analysis of R/C frames, Earthq. Eng. Struct.
Dyn. 25/7 (1996) 711-725.
[26] B.X. Tang, X.Z. Lu, L.P. Ye, W. Shi, Evaluation of collapse resistance of RC frame structures for Chinese schools in
seismic design categories B and C, Earthq. Eng. Eng. Vib. 10/3 (2011) 369-377.
[27] Y. Li, X.Z. Lu, H. Guan, L.P. Ye, An improved tie force method for progressive collapse resistance design of reinforced
concrete frame structures, Eng. Struct. 33/10 (2011) 2931-2942.
[28] X.Z. Lu, L.P. Ye, Y.H. Ma, D.Y. Tang, Lessons from the collapse of typical RC frames in Xuankou School during the great
Wenchuan Earthquake, Adv. Struct. Eng. 15/1 (2012) 167-181.
[29] GB 50017, Code for design of steel structures, Beijing: Ministry of Construction of the People's Republic of China, 2006.
(in Chinese)
[30] J.F. Hajjar, B.C. Gourley, Representation of concrete-filled steel tube cross-section strength, ASCE J. Struct. Eng. 122/11
(1996) 1327-1336.
[31] W.Z. Zhang, M.S. Bahram, Comparison between ACI and AISC for concrete-filled tubular columns, ASCE J. Struct. Eng.
125/11 (1999) 1213-23.

23
[32] A.H. Varma, J.M. Ricles, R. Sause, Seismic behavior and modeling of high-strength composite concrete-filled steel tube
(CFT) beam-columns, J. Constr. Steel Res. 58/5-8 (2002) 725-758.
[33] S.B.B. Aval, M.A. Saadeghvaziri, A.A. Golafshani, Comprehensive Composite inelastic fiber element for cyclic analysis
of concrete-filled steel tube columns, ASCE J. Eng. Mech. 128/4 (2002) 428-437.
[34] P. Tiziano, L. Roberto, Behavior of composite CFT beam-columns based on nonlinear fiber element analysis, In:
Proceedings of 2008 Composite Construction in Steel and Concrete Conference VI, Devil's Thumb Ranch, Tabernash,
Colorado, USA, 2008, pp. 237-251.
[35] A. Elremaily, A. Azizinamini, Behaviour and strength of circular concrete-filled tube columns, J. Constr. Steel Res., 58/
(2002)1567-1591.
[36] F. Iannone, L. Mastrandrea, R. Montuori, V. Piluso, G. Rizzano, Prediction of the ultimate behaviour of SHS-CFT
members: experimental validation of a numerical model, EUROSTEEL 2011, 6th European Conference on Steel and
Composite Structures, Budapest, September 2011, Vol. C, ISBN: 9789291471034, (2011) 2463- 2468.
[37] B. Uy, Local and post-local buckling of concrete filled steel welded box columns, J. Constr. Steel Res., 47/1-2, (1998)
47-72.
[38] K.C. Tsai, P.C. Hsiao, K.J. Wang, Y.T. Weng, M.L. Lin, K.C. Lin, C.H. Chen, J.W. Lai, S.L. Lin, Pseudo-dynamic tests of
a full-scale CFT/BRB frame—Part I:Specimen design, experiment and analysis, Earthquake Eng. Struct. Dyn., 37/7, (2008)
1081-1098.
[39] J. Wang, W.D. Wang, P.P. Zhang, Dynamic time history analyses of concrete-filled steel tubular frames based on nonlinear
fiber beam-column element, Earthquake Resistant Engineering and Retrofitting, 33/2, (2011) 9-15. (in Chinese)
[40] X.Z. Lu, X.C. Lin, Y.H. Ma, Y. Li, L.P. Ye, Numerical simulation for the progressive collapse of concrete building due to
earthquake, In: Proceedings of 14th World Conference on Earthquake Engineering, Beijing, China, 2008, CDROM.
[41] GB50010-2010, Code for design of concrete structures, Beijing: Ministry of Housing and Urban-Rural Development of
the People's Republic of China, 2010. (in Chinese)
[42] Pacific Earthquake Engineering Research Center, PEER strong motion database, California, Berkley, From URL:
http://peer.berkeley.edu/smcat/index.html.
[43] JGJ 3-2010, Technical specification for concrete structures for tall building, Beijing: Ministry of Housing and Urban-Rural
Development of the People's Republic of China, 2010. (in Chinese)
[44] CECS 230:2008, Specification for design of steel-concrete mixed structure of tall buildings, Beijing: China Institute of
Building Standard Design & Research, 2008. (in Chinese)

24
List of Tables
Table 1. The first nine vibration modes of the super-tall building.
Table 2. The relevant parameters for the concrete modeling of the
mega-columns
Table 3. The failure criteria for concrete and steel
List of Figures
Figure 1. The FE model of the super-tall building..
Figure 2. Typical stress-strain curves for confined concrete.
Figure 3. The stress-strain backbone curve of the steel.
Figure 4. The schematic diagram of the multi-layer shell element.
Figure 5. The FE models of typical core-tubes.
Figure 6. The fiber-beam element model for H-shaped or welded box-shaped
steel beams.
Figure 7. Typical cross section of the CFST columns (unit: mm).
Figure 8. Fiber distributions in a section of CFST column.
Figure 9. The first nine vibration modes of the super-tall building.
Figure 10. Dynamic characteristics of El-Centro ground motion.
Figure 11. Distribution of plastic zones under two different seismic intensities.
Figure 12. Typical collapse mode of the super-tall building subjected to
El-Centro ground motion (PGA = 2940 cm/s2).
Figure 13. Distributions of the failure elements.
Figure 14. Overall collapse process of the super-tall building subjected to
El-Centro ground motion in the Y-direction (PGA = 2940 cm/s2).
Figure 15. Collapse details of the super-tall building subjected to El-Centro

25
ground motion in the Y-direction (PGA = 2940 cm/s2).
Figure 16. The vertical and horizontal roof displacements of the super-tall
building subjected to El-Centro ground motion (PGA = 2940 cm/s2).
Figure 17. Distribution of horizontal displacement along the structural height in
Y-direction of the super-tall building subjected to El-Centro ground
motion (PGA = 2940 cm/s2).
Figure 18. Dynamic characteristics of KOBE ground motion.
Figure 19. Overall collapse process of the super-tall building subjected to
KOBE ground motion in the Y-direction (PGA = 1764 cm/s2).
Figure 20. The vertical and horizontal roof displacement of the super-tall
building subjected to KOBE ground motion (PGA = 1764 cm/s2).

26
Radial outriggers
yx
z
yx
z
Perimeter outriggers
Mega-columns Mega-braces
Core-tubes
Zone 1 Zone 2
Zone 3 Zone 4
Zone 5 Zone 6
Zone 7 Zone 8
Figure 1 The FE model of the super-tall building. (a) Three dimensional view; (b)
planar layout of different zones.

27
0
10
20
30
40
50
60
0 0.01 0.02 0.03 0.04Strain (m/m)
Str
ess (M
Pa)
= 5
= 3
= 1
= 0Plain concrete
Confined concrete
Figure 2 Typical stress-strain curves for confined concrete.
0
100
200
300
400
500
0 0.05 0.1 0.15 0.2
Strain (m/m)
Str
ess
( M
Pa
)
elastic
yield
hardening
post-necking
Figure 3 The stress-strain backbone curve of the steel.

28
Z (w)
X (u)
Y (v)
z
Smeared rebar layer
Mid-layer of shell
Concrete layer
Figure 4 The schematic diagram of the multi-layer shell element.
t = 1.1 m
t = 1.0 m
t = 0.4 m
t = 1.0 m
t = 0.4 m
t = 0.6 m
t = 0.9 m
t = 0.3 m
t = 0.5 m
(a) (b) (c)
Figure 5 The FE models of typical core-tubes. (a) Zone 1; (b) Zones 3-4 junction; (c)
Zone 8.

29
v
u
v
u
(a) (b)
Figure 6 The fiber-beam element model for H-shaped or welded box-shaped steel
beams. (a) H-shaped; (b) welded box-shaped.
6500
80
80
6500
y
xConcrete fiber Steel fiber
Figure 7 Typical cross section of the
CFST columns (unit: mm).
Figure 8 Fiber distributions in a section
of CFST column.

30
yx
z
yx
z
yx
z
yx
z
yx
z
yx
z
yx
z
yx
z
yx
z
yx
z
(a) (b) (c) (d) (e)
yx
z
yx
z
yx
z
yx
z
yx
z
yx
z
yx
z
yx
z
(f) (g) (h) (i)
Figure 9 The first nine vibration modes of the super-tall building.
(a) first-order translation in Y-direction; (b) first-order translation in X-direction; (c)
first-order torsion; (d) second-order translation in Y-direction; (e) second-order
translation in X-direction; (f) second-order torsion; (g) third-order translation in
Y-direction; (h) third-order translation in X-direction; (i) third-order torsion.

31
-1.0
-0.5
0.0
0.5
1.0
0 10 20 30 40
Time (s)
No
rmali
zed
accele
rati
on
.
(a)
0.0
0.5
1.0
1.5
2.0
2.5
3.0
0 2 4 6 8 10 12
Period (s)
Sa
(g)
1st-order translation in
the Y-direction
3rd
-order translation in
the Y-direction
2nd
-order translation in
the Y-direction
(b)
Figure 10 Dynamic characteristics of El-Centro ground motion. (a) Normalized
acceleration time history of east-west component; (b) elastic response spectrum with
5% damping ratio.
yx
z
yx
z
Zone 3
Zone 2
(a)
yx
z
yx
z
Zone 8
Zone 3
Zone 2
(b)
Figure 11 Distribution of plastic zones under two different seismic intensities. (a)
PGA = 400 cm/s2; (b) PGA = 510 cm/s
2.

32
Original shape Detail of the collapse region in Zones 1 and 2
Detail of the damage of perimeter outriggers, mega - columns and mega - braces at the junction of Zones 1 and 2
Deformation shape
Detail of the collapse region at the junction of Zones 6 and 7
y
z
y
z
y
z
y
z
Mega - column
Perimeter outrigger
Mega - column
Mega - brace
Figure12 Typical collapse mode of the super-tall building
subjected to El-Centro ground motion (PGA = 2940 cm/s2).

33
yx
z
yx
z
yx
z
yx
z
the failed elements of core tubeThe failed elements of
the mega-braced frame system
Failed couple beams
Failed shell walls
Failed couple beams
Failed shell walls
Failed frame elements
Figure 13 Distributions of the failed elements.
t =0.000s t =1.461s t =1.585s t =2.433s t =3.500s t =4.500s Ground line
Figure 14 Overall collapse process of the super-tall building subjected to El-Centro
ground motion in the Y-direction (PGA = 2940 cm/s2).

34
(a) t = 1.461 s, initiation of failure of shear walls at bottom of Zone 1
(b) t = 1.585 s, failure of most shear walls at bottom of Zone 1
(c) t = 2.433s, initiation of failure of mega-columns of Zones 1 and 2
Zone 1 Zone 2
(d) t = 3.500 s, failure of shear walls in Zone 7
(e) t = 4.500 s, failure of mega-columns in Zones 1 & 2 and shear walls in the Zones 1-2 junction
Zone 2
Zone 1
Zone 1
Figure 15 Collapse details of the super-tall building subjected to El-Centro ground
motion in the Y-direction (PGA = 2940 cm/s2).
35
-40
-30
-20
-10
0
0 1 2 3 4 5 6
Time(s)
To
p D
isp
lace
men
t(m
)
Vertical
Horizontal
t = 4.5s
Figure 16 The vertical and horizontal roof displacements of the super-tall building
subjected to El-Centro ground motion (PGA = 2940 cm/s2).
0
20
40
60
80
100
120
-20 -10 0 10 20Horizontal Disp.Y(m)
Flo
or
Envelop value
t = 4.5 s
Figure 17 Distribution of horizontal displacement along the structural height in
Y-direction of the super-tall building subjected to El-Centro ground motion
(PGA = 2940 cm/s2).

36
-1.0
-0.5
0.0
0.5
1.0
0 10 20 30 40 50 60
Time(s)
No
rmal
ized
acc
elar
atio
n
1
(a)
0.0
0.5
1.0
1.5
2.0
2.5
3.0
0 2 4 6 8 10 12
Period (s)
Sa
(g)
3rd
-order translation in
the Y-direction
2nd
-order translation in
the Y-direction
1st
-order translation in
the Y-direction
(b)
Figure 18 Dynamic characteristics of KOBE ground motion. (a) Normalized
acceleration time history of the east-west component; (b) elastic response spectrum
with 5% damping ratio.

37
t=0.000s t=12.310s t=12.410s t=13.500st=12.610s t=12.810s t=13.000s
Ground line
Figure 19 Overall collapse process of the super-tall building subjected to KOBE
ground motion in the Y-direction (PGA = 1764 cm/s2).
-6
-5
-4
-3
-2
-1
0
1
2
12 12.5 13 13.5 14
Time(s)
To
p D
isp
lacem
en
t(m
)
Vertical
Horizontal
Figure 20 The vertical and horizontal roof displacement of the super-tall building
subjected to KOBE ground motion
(PGA=1764 cm/s2).


![Seismic collapse performance of special moment steel ...166.104.43.67/journal/2017/[2017]Han et al-Seismic collapse...rotation during an earthquake, they sustain greater member forces](https://static.fdocuments.net/doc/165x107/5a70ba6e7f8b9ab6538c2ef0/seismic-collapse-performance-of-special-moment-steel-1661044367journal20172017han.jpg)


