Earth Observation for Health International trends & developments Earth observation applications...
92
Earth Observation for Health International trends & developments Earth observation applications Business development Capacity building
-
Upload
marybeth-gardner -
Category
Documents
-
view
221 -
download
0
Transcript of Earth Observation for Health International trends & developments Earth observation applications...

Earth Observation for Health
International trends & developmentsEarth observation applications
Business developmentCapacity building
2
Mark Noort, consultant, project manager
HCP international: consulting, marketing of earth observation
Project director EOPOWER: project for promotion & capacity building of earth observation applications
0. Introduction

3
Sequence:• General assessment of the state-of-the-art of earth
observation• Major trends and developments in the application
field• Description of earth observation solutions• Assessment of market potential for earth observation
solutions and marketing instruments• Capacity building for successful application of earth
observation solutions

4
Earth Observation helps you:save moneysave livessave the environment

5
Earth observation applications
• On the verge of reaching new user communities
• These new user communities need to be involved
• Weakest link / last mile aspects are important
• Marketing needed: promotion & capacity building

6
Life cycle of products & services
InitializationSystem analysis & designRapid prototypingSystem developmentImplementationPost-implementation

7
Health: Health is a state of complete physical, mental and social well-being and not merely the absence of disease or infirmity.Air quality: The state of the air around us. Good air quality refers to clean, clear, unpolluted air.Disease: Any condition that causes pain, dysfunction, distress, social problems, or death to the person afflicted, or similar problems for those in contact with the person.
Environmental aspects are dealt with more in detail in the environmental toolkit, industrial accidents and other disaster-related aspects in the disaster management toolkit.
Scope

8
Assessment of business & funding opportunities
• Categories of environmental management products & services
• Life cycle phase of product or service• Regional context, level of technological & economic
development• Optimum marketing mix

9
1. International trends & developments in health

10
Issues & trends in health
• Importance of monitoring and improving air quality (pollution, aeroallergens, dust storms);
• Improved options for early warning for possible health hazards, such as sand and dust storms
• Increased opportunities and possibilities for fighting diseases (malaria, meningitis, dengue, rift fever, West-Nile virus, cholera, etc.);
• Increased attention for the relation between climate change and health.

11
Drivers (1)Negative:• Increasing population;• Economic growth;• Increasing urbanisation; • Increasing (energy) consumption; • Increasing mobilisation -> motor vehicles;
Lead to increased pollution of air, water and soil.

12
Drivers (2)Positive:• New, cleaner technologies available• Increased attention for environmental issues• Increased attention for sustainable economic
development• Improved living standards and increased life expectancy• Improved monitoring, forecasting and early warning• Improved understanding of processes affecting human
health

13
Air quality
• Healthcare costs associated with poor air quality: € 189 billion/year (Europe) + reduced life expectancy;
• The WHO estimates that by reducing illness caused by airborne PM the EU could save up to € 29 billion/year
• Particulate matter (PM) and ozone (O3) are most harmful for human health;
• Emission reduction does not always cause a drop in atmospheric concentrations, especially for PM and O3;
• Pollutants of interest: PM, ground-level O3, nitrogen oxides, sulfur dioxide, carbon monoxide, heavy metals, benzene and benzo(a)pyrene.

14
Type and sources of air pollutants
Optical remote sensing for measurement and monitoring of emission flux (source: EPA Handbook; 2011)

15
Particulate matter, relative size
(source: EPA; 2010)

16
Air Quality Index map of the US
AIRnow website: http://airnow.gov/

17
Air quality in Europe – 2012 report (EEA; 2012)AirBase database: http://www.eea.europa.eu/themes/air/air-quality/map/airbase Air Quality Index – a guide to air quality and your health (EPA; 2009) Brochure that explains air quality index, causes of air quality variation (ozone, particle pollution, sulfur dioxide, carbon monoxide), health effects and possible action (avoidance)
The EveryAware sensor box: a tool for community-based air quality monitoring (Elen et al.; 2012) Description of sensor box that users can apply to measure / monitor air traffic pollution
More information:

18
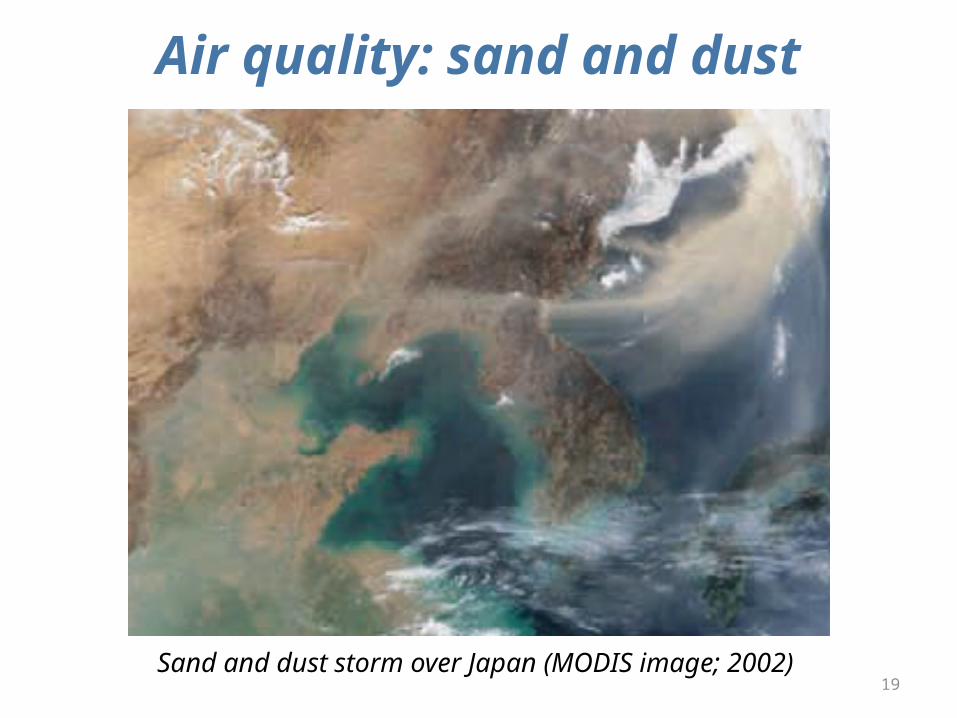
Sand & dust storms
• Sand and dust storms affect air quality (sand and dust particles, transport of pollutants);
• Sand and dust storms are responsible for worsening of asthma and other respiratory diseases, meningitis and other negative health effects;
• Sand and dust storms cause general damage (dust cover, reduced plant growth decreased visibility) ;
• Early warning can reduce impact: better forecasts enable better preparation (lives saved, reduced exposure, reduced damage).
19
Air quality: sand and dust
Sand and dust storm over Japan (MODIS image; 2002)

20
Dust storm life cycle
Dust storm early warning (source: UNEP)

21
Information flow SDS-WAS
Sand and dust storm warning, advisory and assessment system (source: WMO)

22
Forecasting and early warning of dust storms - UNEP global environmental alert service (UNEP; 2013) Presents general process and role of forecasting and early warning
Dust and sand storms (Ministry of the Environment Japan; 2008) Description of how the sand and dust storm mechanism works and the usefulness of improved forecasts and early warning
WMO sand and dust storm warning, advisory and assessment system (SDS-WAS) – science and implementation plan 2011 – 2015 (WMO; 2011) Research to improve forecasts, modelling and information to user communities, including meningitis risk in the Sahel region
More information:

23
Fighting diseases
• Infectious disease and disease vectors: environmental factors (land and water surface temperatures, rainfall, water depth, marine organisms) contribute to disease outbreaks, changes in weather and climatic conditions (example: cholera).
• Initiatives are undertaken for the prevention and control of malaria in Africa;
• A comprehensive approach is needed, including a suitability analysis of transmission and vulnerability risk indicators.

24
Epidemics forecasting & environmental factors
User cycle framework (Source: EO priorities infectious diseases; 2010)

25
WHO/UNICEF HealthMapper http://healthmapper.software.informer.com/
Malaria Early Warning Systems − Concepts, indicators and partners − A framework for field research in Africa (WHO; 2001). Description of approach for Roll Back Malaria initiative
Use of Google Earth™ to strengthen public health capacity and facilitate management of vector-borne diseases in resource-poor environments (Lozano-Fuentes et al.; 2008) Search for novel, inexpensive solutions in Mexico
Environmental health risks (EO2HEAVEN; 2013) Description of relationships between environmental changes and their impact on human health
More information:

26
Climate changeand health
Areas of concern:• Infections: malaria, diarrhea, meningitis, dengue fever
are the most important ones;• Emergencies: floods and cyclones, drought, airborne
dispersion of hazardous materials;• Emerging environmental challenges: heat stress, UV
radiation, pollen, air pollution.
Need for:• Indicators to monitor climate-change-related health
outcomes within surveillance systems;• Development of early warning systems;• Improved decision support for vulnerability and
adaptation assessment, operational predictions and understanding of the decision making process.

27
Global climate change impacts in the United States (US global change research program; 2009) Predicts: increase in risk of illness and death related to extreme heat and heat waves, reduced extreme cold, challenge to meet air quality standards, more extreme weather events (storms, floods, wild fires), increase of some diseases transmitted by food, water or insects (west nile, lyme, salmonella, etc.), increased pollen health risk
Human health, climate change 2007: impacts, adaptation and vulnerability (IPCC; 2007)Covers: heat and cold effects on health, wind, storms and floods, drought, nutrition and food security, food safety, water and disease, air quality and disease, aeroallergens and disease, vector-borne, rodent-borne and other infectious diseases, occupational health and UV radiation
Atlas of health and climate change (WHO / WMO; 2012)
More information:

28
2. Earth observation applications

29
Earth observation for health
Malaria Parasitic Rate map, derived from field data and a Bayesian regression model with rain and temperature inputs (source: ECWMF; 2012)

30
Earth observation contribution
• Air quality forecasting / early warning / monitoring• Epidemics forecasting• Relationships between diseases and environmental
factors
All these categories, particularly the 2nd & 3rd, are of course linked, the time/response factor providing the main distinction.

31
Example air quality forecasting / early warning / monitoring
Mean density of nitrogen oxide for the period January 2003 – June 2004 (Source: Copernicus; 2013)

32
Air quality forecasting / early warning / monitoring
• Earth observation measures air masses (monitoring of extent and source of emissions);
• Earth observation tracks impact from fires;• Earth observation tracks dust and sand storms
(meningitis, other diseases);• Earth observation supports monitoring of trace species in
the air (carbon monoxide, ozone)• Cost estimate: obtaining emission datasets for new
regions and cities is expensive, implementation cost 100 k€ / continent / year, daily forecast at local level 100 k€ / year for set-up and 30 k€ / year for operation
• Main challenges: cost, complexity, capacity.

33
Monitoring the air we breathe (Copernicus; 2013) Brochure on air quality monitoring and forecasts to protect human health in Europe
Air quality monitoring and analysis in Central America and the Caribbean (SERVIR-Air; 2009) Description of the use of EO for an air quality monitoring system and public information, including a ‘SmogBlog’ (as in the US), agricultural fires, volcanic eruptions, Saharan dust + capacity building http://www.servir.net/ Particulate matter in the atmosphere of Dakar, Senegal (Leon et al.; 2012) Pilot on monitoring of particulate matter, measurement of aerosol optical depth, specifically aimed at Sahara desert dust; combination of in-situ and EO; satellite observations can detect gradient & therefore hotspots of emission
Air pollution using remote sensing and GIS, Cyprus (CUT: 2011) Case study on the use of satellite observations for air pollution monitoring and modelling
Examples:

34
Example epidemics forecasting
Integrated Malaria Early Warning System gathering cumulative evidence for early and focused epidemic preparedness and response (Source: WHO; 2004)
Case surveillance alone = late warning

35
Epidemics forecasting
• Earth observation provides input for models and indicators for health impact;
• Earth observation contributes to development of early warning systems land decision support;
• Earth observation is instrumental in compliance monitoring of agreements and regulations;
• Cost estimate: on case-by-case basis• Main challenges: cost, complexity, capacity.

36
How satellites track a mass killer (Copernicus; 2013) Brochure on how satellite data help model the prevalence and spread of malaria and the dynamics of disease outbreaks
CNES strategy, satellite data and modeling for public health (CNES; 2011) Presentation of the CNES programmes on e-health: telemedicine and tele-epidemiology
A prototype Malaria Early Warning System (ECMWF; 2012) Presentation on the set-up of a malaria early warning system, based on the relation between malaria and weather and climate
Examples:

37
Useful sites for early warning• IRI, Columbia University http
://iridl.ldeo.columbia.edu/maproom/.Health/ (malaria, meningitis)
• CNES RedGems http://www.redgems.org/ (malaria, rift valley fever, dengue, vibrio diseases and cholera)
• NASA SERVIR http://www.nasa.gov/mission_pages/servir/index.html (general)
• ISID Pro-MED http://www.promedmail.org/pls/otn/f?p=2400:1000 (diseases general)
• USAID FEWSNET http://earlywarning.usgs.gov/adds/ (famine)

38
Example diseases andenvironmental factors
Distribution of city blocks with dengue cases, derived from Google Earth, Chetumal, Quintana Roo, Mexico, 2006 ( Source: Lozano-Fuentes et al.; 2008)

39
Diseases andenvironmental factors
• Earth observation supports analysis and modelling of the occurrence and spreading of infectious diseases and disease vectors by measuring environmental factors (land and water surface temperatures, rainfall, water depth, marine organisms) and changes in weather and climatic conditions;
• Earth observation facilitates improved decision support for vulnerability and adaptation assessment, operational predictions and understanding of the decision making process
• Cost estimate: on case-by-case basis• Main challenges: complexity (from data to information,
modelling), elegance, capacity.

40
Use of Google Earth™ to strengthen public health capacity and facilitate management of vector-borne diseases in resource-poor environments (Lozano-Fuentes et al.; 2008) Case study from Mexico; Google Earth images used to extract urban infrastructure patterns; positive aspects: easy to use and easy to learn; negative: spatial analysis and modelling capacity is limited
Environmental health risks (EO2HEAVEN; 2013) Description of relationships between environmental changes and their impact on human health, with earth observation applications as central element
Connecting ecosystems, biodiversity, and human health: using earth observations to reduce and prevent infectious diseases (EPA; 2010) Presentation on establishing links between human health and environmental factors with a call for integrated tools and approaches that link ecology to human health
Examples:
41
Growth potential for earth observation
• Scientists, public health organizations, NGOs and the general public are the main players;
• Mainly G2G or B2G market, governments or international organizations are in virtually in all cases the paying client;
• Opportunities for businesses in developing countries: refinement of existing models for local circumstances and processing of actual data flows;
• Air quality is particularly relevant in the large, densely populated urban areas.

42
3. Business development

43
Why is marketing / promotion of earth observation needed?• Public sector information (PSI)• Externalities (environmental accounting & payment
for ecosystem services) • Global datasets, open access, data sharing,
compatibility (GEO)

44
If public sector information is made available free-of-charge, demand will increase and, in the end, government revenue also, as companies will derive income from value-added products and services, and consequently pay more taxes (see figures in following slides).

45
Supply & Demand Public Sector Information
Source: About GMES and data: geese and golden eggs (Sawyer, de Vries 2012)
http://vimeo.com/63079712

46
Cost-benefit Public Sector Information
Source: About GMES and data: geese and golden eggs (Sawyer, de Vries 2012)

47
Re-use of Public Sector Information
Source: About GMES and data: geese and golden eggs (Sawyer, de Vries 2012)

48
Most earth observation applications deal with so-called externalities, such as impact on the environment. It is difficult to capture these in terms of conventional cost-benefit models.
To tackle this, the following framework for analysis of earth observation applications is developed:
49
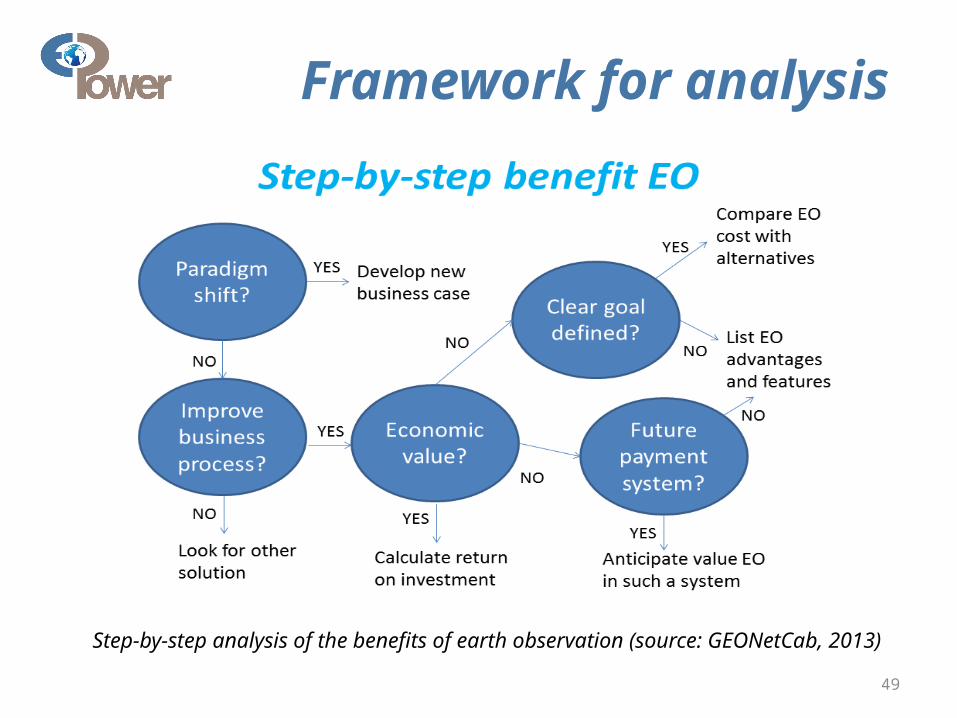
Framework for analysis
Step-by-step analysis of the benefits of earth observation (source: GEONetCab, 2013)

50
• Does the new application cause a paradigm shift?• Is the current business or organization process
improved?• Does the application provide economic value that can be
quantified?• Is a clear measurable goal defined to which the earth
observation application contributes?• Is a future payment scheme or other economic
mechanism foreseen in which the earth observation application fits?
Key questions

51
Assessment of geospatial solutions
Rating of characteristics of geospatial solutions: • fit-for-purpose • comparative advantage • complexity to user / ease- of-use • elegance • cost-benefit, • sustainability• resilience • reproduction capacity / flexibility • acceptance • level of knowledge transfer required• ethics, transparency, public accountability, objectivity & impartiality
Rating of business environment:• Willingness to pay (by clients)• Embedding (in organizational processes)• Openness (transparency and ease of doing business, access to markets)• Institutions (is the institutional environment conducive to doing business,
acceptance of new solutions?)

52
Fit-for-purposeAn important, but often forgotten requirement: Does the product or service do what it is supposed to do to solve a certain problem?
In other words: is it really a solution or just an attempt towards a solution?
• Quantitative: not applicable• Qualitative (on scale of 1 to 5): based on description of
what the EO solution actually does

53
Comparative advantage
What it does significantly better than other solutions to the same problem. For earth observation usually the comparative advantages of greater accuracy, better resolution in time and space, comprehensive overview of large areas and near real-time information provision are mentioned as comparative advantages.
• Quantitative: calculation of degree in which the EO solution is better than alternatives
• Qualitative (on scale of 1 to 5): based on listing of comparative advantages

54
Complexity (to user) / ease-of-use
At all levels in the value chain the users (professionals and end-users) are able to work with the product or service.
• Quantitative: not applicable• Qualitative (on scale of 1 to 5): based on user
testimonials and user surveys

55
EleganceOnce you get the idea behind this product or service, you want to be part of the community that uses it.
This sense of belonging facilitates the formation of user groups that provide valuable feedback.
• Quantitative: none, or it should be the size of the user community
• Qualitative (on scale of 1 to 5): based on user testimonials and user surveys

56
Cost-benefitThe cost-benefit of the product or service is quantified and sufficiently attractive, also in the long-term.
• Quantitative: cost-benefit calculation• Qualitative (on scale of 1 to 5): based on quantitative
assessment

57
SustainabilityThe product or service can be delivered when it is needed. There is a long-term perspective that guarantees delivery.Sustainability concerns the following aspects: Long-term data availability Availability of finance/funds to provide the solution continuously for
present and future use Long-term institutional / governmental interest and support Long-term user interest for a solution that addresses real needs
• Quantitative: not applicable• Qualitative (on scale of 1 to 5): based on sensitivity
analysis of the EO solution

58
ResilienceIn case of extremes or breakdown in the value chain, the product or service can still be delivered at an acceptable level. Alternatives (plan B) are available (and developed).
• Quantitative: cost-benefit calculation of plan B • Qualitative (on scale of 1 to 5): based on risk analysis of
the EO solution
59
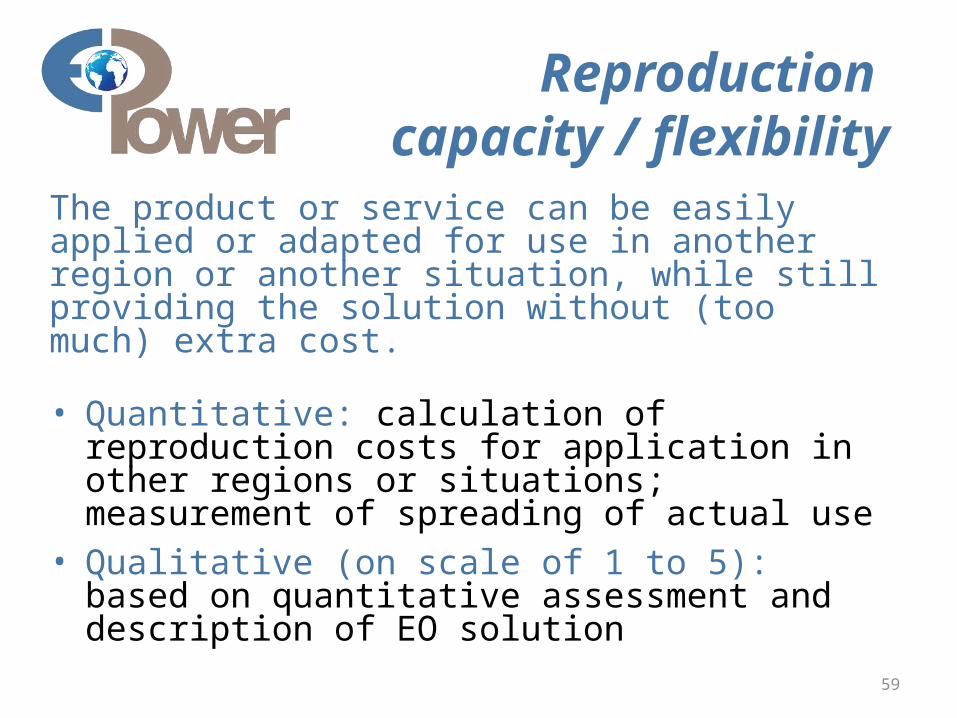
Reproduction capacity / flexibility
The product or service can be easily applied or adapted for use in another region or another situation, while still providing the solution without (too much) extra cost.
• Quantitative: calculation of reproduction costs for application in other regions or situations; measurement of spreading of actual use
• Qualitative (on scale of 1 to 5): based on quantitative assessment and description of EO solution

60
AcceptanceThe users intuitively get what the product or service is about and are interested. They accept it as a solution to their problem.
• Quantitative: none, or survey results about acceptance. After introduction of the solution: number of clients and/or users
• Qualitative (on scale of 1 to 5): based on user testimonials and user surveys

61
Level of knowledge transfer required
The training requirements for professionals and other users along the value chain are clear and associated costs and efforts are acceptable.
• Quantitative: cost and time required to get the users at the desired knowledge and skill level
• Qualitative (on scale of 1 to 5): based on knowledge transfer plans and evaluation of training activities
62
Ethics, transparency, public accountability,
objectivity & impartialityApplication of Earth observation increases the level of objectivity and impartiality in decision-making processes, including conflict resolution. The application improves transparency and public accountability. It raises no ethical issues or if it does, as in the case of privacy concerns, these are resolved in a satisfactory way for all parties concerned.
• Quantitative: not applicable• Qualitative (on scale of 1 to 5): based on user
testimonials and user surveys

63
Several attempts have been made to introduce environmental accounting and to enlarge the sphere of the conventional economy to include and quantify impact on ecosystems.
The following slides give some examples:

64
Environmental accounting & payment for ecosystem services• SEEA:
System of Environmental-Economic Accounts (EC, FAO, IMF, OECD, UN, WB )
• WAVES: Wealth Accounting and the Valuation of Ecosystem Services (global partnership, led by World Bank)
• TEEB: The Economics of Ecosystems and Biodiversity (group led by UNEP)

65
SEEA Conceptual Framework
Source: SEEA conceptual framework report (EC, FAO, IMF, OECD, UN, WB 2012)

66
For earth observation the work of the Group on Earth Observations (GEO) is essential to achieve the goal of a Global Earth Observations System of Systems (GEOSS), resulting in the shared GEO common infrastructure (GCI):

67
Group on Earth Observations

68
Marketing elements• Customer value propositions• Crossing the technology chasm• Creating shared value• Promotion tools

69
Customer value propositions capture the unique value of a product or services as perceived and appreciated by the customer.
Interestingly, they can differ completely from the features that the provider considers most important:

70
Customer Value Propositions
Source: Customer value propositions in business markets (HBR 2006)
VALUE PROPOSITION
ALL BENEFITS FAVOURABLE POINTS OF DIFFERENCE
RESONATING FOCUS
Consists of: All benefits customers receive from a market offering
All favourable points of difference a market offering has relative to the next best alternative
The one or two points of difference whose improvement will deliver the greatest value to the customer
Answers the customer question:
“Why should our firm purchase your offering?”
“Why should our firm purchase your offering instead of your competitor’s?”
“What is most worthwhile for our firm to keep in mind about your offering?”
Requires: Knowledge of own market offering
Knowledge of own market offering and next best alternative
Knowledge of how own marketing offering delivers value to customers, compared with next best alternative
Has the potential pitfall:
Benefit assertion
Value presumption Requires customer value research

71
Buyer behaviour & motivation
Source: Rethinking the sales force (Rackham, de Vincentis 1999)
Type Buyer behaviour MotivationTransactional sales
Intrinsic value buyers: “keep it cheap and easy to do business”
Understands the productPerceives it as substitutableCost focusResents time ‘wasted’ with sales people
Consultative sales
Extrinsic value buyers: “I don’t know the answer: help me analyse and solve the issue
Focus on how the product is usedInterested in solutions and applicationsValues advice and helpNeeds the sales person

72
Even when customer value propositions are well captured and formulated, introduction of solutions that involve new technology will have to overcome some hurdles.
This is called “crossing the technology chasm”:

73
Crossing the technology chasm
Source: Crossing the chasm (Moore 1991)

74
Crossing the technology chasm
• Most clients of EO products and services belong to the early and late majority,
• They are pragmatists and are not prepared or willing to take substantial risk: the solution should work and be reliable.
• Once convinced, the pragmatists will be long-term clients.
Source: Crossing the chasm (Moore 1991)

75
More information:Creating & delivering your value proposition – managing customer experience for profit (Barnes, Blake, Pinder; 2009)
Customer value propositions in business markets (Anderson, Narus, van Rossum [Harvard Business Review]; 2006)
Rethinking the sales force: refining selling to create and capture customer value (Rackham, de Vicentis; 1999)
Crossing the chasm – marketing and selling high-tech products to mainstream customers (Moore; 1991)

76
Creating shared value is a key element of successful implementation of earth observation solutions.
To achieve this, in most cases earth observation applications have to be integrated into more general (business or organizational) processes:

77
Create shared valueInvolves cooperation between:• Public sector• Private sector• Social sector
Opportunity for earth observation (integrated) solutions:• Integrate EO in general business / organizational process• Integrate different EO (and GIS and navigation)
functionalities

78
Based on all considerations dealt with in the previous slides, there are some practical approaches that can be applied in combination to promote earth observation applications:

79
Tools for earth observation marketing:
Source: Marketing earth observation products and services (Noort 2013)
• Success stories (in non-technical language, feasible, replication capacity, sustainable)
• Marketing toolkits (international trends, earth observation examples, references)
• Pilot projects, innovation funds, quick-wins (demonstration that EO actually works)
• Promotion outside EO community (fairs, seminars, lunch-bag meetings, magazines)
• Resource facilities for reference and capacity building (distributed, but connected, in different languages)

80
Business elementsBusiness elements:• Proposal writing• Business procedures

81
Proposal writing is an art in itself.
During the GEONetCab and EOPOWER projects templates have been developed for writing successful proposals:

82
Proposal outline
(more detailed version in separate document, see www.eopower.eu or www.hcpinternational.com)
1. Introduction / relevance2. Objective(s)3. Activities4. Output5. Management & evaluation
6. Risk assessment7. Time schedule8. Budget
Annexes

83
Other guides that may be useful:
• Civicus: writing a funding proposal• Michigan State University: guide for writing a funding
proposal• ESRI: writing a competitive GRANT application• REC: project proposal writing

84
If you run a company, compete for assignments and manage projects, a structured approach towards responsibilities, tasks, implementation and documentation is needed.
The following business procedures may be helpful:

85
Business procedures
(more detailed version in separate document, see www.eopower.eu or www.hcpinternational.com)
1. On acquisition2. On offers3. On negotiation4. On contracts5. On project management
6. On travel & deployment7. On deficiencies & complaints8. On internal organization9. On finance

86
Again:
• SHARED PROBLEM• SHARED LANGUAGE• SHARED SOLUTION

87
4. Capacity Building

88
GeneralMarketing is promotion + capacity building.
Especially for the introduction of new technologies capacity building is important at all levels.
Capacity building is the instrument to increase self-sufficiency and make solutions work.

89
General references for capacity building, open data and success stories
GEO Portal: www.earthobservations.org
Capacity building resource facility www.eopower.eucompilation of tutorials, references, open-source software, etc.
Satellites going local: share good practice (Eurisy handbooks) www.eurisy.org
Earth observation for green growth (ESA, 2013)

90
General references for capacity building, open data (2)
Bringing GEOSS services into practice: how to use data from the GEO portal and how to provide inputwww.envirogrids.net
Science education through earth observation for high schools: basic tutorials on all kind of subjectswww.seos-project.eu
Copernicus briefs: information on satellite applications for different topicswww.copernicus.eu/pages-secondaires/publications/copernicus-briefs/
91
Capacity building resources for health:Environmental health risks (EO2HEAVEN; 2013) Description of relationships between environmental changes and their impact on human health, with earth observation applications as central element and attention for stakeholder involvement and capacity building
Approaches to GIS programs in health education (ESRI; 2011) Short examples from different universities (no EO as such, but related)
Optical remote sensing for measurement and monitoring of emission flux (EPA; 2011) Again, not strictly EO, but the handbook explains remote sensing techniques with similar underlying processes, including optical, LIDAR and thermal infrared
SERVIR and public health (SERVIR; 2012) Examples of projects and capacity building activities that use EO to support public health initiatives in developing countries
IMPACTMIN project Information on health aspects related to mining http://www.impactmin.eu