Earth Imaging From the Surface of the Moon With a DSCOVR ...
11
Earth Imaging From the Surface of the Moon With a DSCOVR/EPIC-Type Camera Nick Gorkavyi 1 *, Simon Carn 2 , Matt DeLand 1 , Yuri Knyazikhin 3 , Nick Krotkov 4 , Alexander Marshak 4 , Ranga Myneni 3 and Alexander Vasilkov 1 1 Science Systems and Applications, Lanham, MD, United States, 2 Department of Geological and Mining Engineering and Sciences, Michigan Technological University, Houghton, MI, United States, 3 Earth and Environment Department, Boston University, Boston, MA, United States, 4 NASA Goddard Space Flight Center, Greenbelt, MD, United States The Earth Polychromatic Imaging Camera (EPIC) on the Deep Space Climate Observatory (DSCOVR) satellite observes the entire Sun-illuminated Earth from sunrise to sunset from the L1 Sun-Earth Lagrange point. The L1 location, however, confines the observed phase angles to ∼2 ° –12 ° , a nearly backscattering direction, precluding any information on the bidirectional surface reflectance factor (BRF) or cloud/aerosol phase function. Deploying an analog of EPIC on the Moon’s surface would offer a unique opportunity to image the full range of Earth phases, including observing ocean/cloud glint reflection for different phase angles; monitoring of transient volcanic clouds; detection of circum-polar mesospheric and stratospheric clouds; estimating the surface BRF and full phase-angle integrated albedo; and monitoring of vegetation characteristics for different phase angles. Keywords: DISCOVR EPIC, Moon, phase function, clouds, vegetation INTRODUCTION Numerous Low Earth Orbit (LEO) and Geosynchronous Equatorial Orbit (GEO) Earth-observing satellites provide a broad spectral range of viable data; however, it is obtained at the expense of limited geographical (GEO) or temporal (LEO) coverage. Satellites from near-polar Sun- synchronous LEOs have limited observation capabilities at polar latitudes greater than 80 ° North and South. These polar regions are not observable from geostationary satellites located above the equator. Although current Earth-observing satellites can produce high-resolution views, LEO sensors can only scan a small portion of the surface at a given time, while GEO sensors can provide temporally continuous, though lower-resolution observations of a significant, though incomplete and fixed portion of the Earth’s disk. The Earth Polychromatic Imaging Camera (EPIC) on the Deep Space Climate Observatory (DSCOVR) clearly stands apart, observing the entire Sun-illuminated Earth from the L1 Sun-Earth Lagrange point (Marshak et al., 2018). EPIC has an aperture diameter of 30.5 cm, a focal ratio of 9.38, a field of view of 0.61 ° , and a spatial resolution of ∼10 km/pixel. The camera produces 2048 × 2048 pixel images in 10 narrowband channels (317.5, 325, 340, 388, 443, 551, 680, 688, 764, and 779.5 nm). The L1 location, however, restricts phase angles to ∼2 ° –12 ° (a nearly backscattering direction), depriving the observer of any information on bidirectional surface reflectance factors (BRFs) or on cloud/aerosol phase functions. A compact, lightweight, autonomous EPIC-type camera on the Moon’s surface offers a unique opportunity to overcome these limitations and advance Earth science in novel and potentially unanticipated ways (Marshak et al., 2020). An EPIC-Moon camera would work in synergy with the DSCOVR/EPIC instrument, increasing the efficiency of both sensors. Earth science goals of EPIC-Moon are to extend and improve the current Edited by: Hartmut Boesch, University of Leicester, United Kingdom Reviewed by: Hartwig Deneke, Leibniz Institute for Tropospheric Research (LG), Germany Zhenzhu Wang, Aiofm (CAS), China *Correspondence: Nick Gorkavyi [email protected] Specialty section: This article was submitted to Satellite Missions, a section of the journal Frontiers in Remote Sensing Received: 11 June 2021 Accepted: 12 August 2021 Published: 25 August 2021 Citation: Gorkavyi N, Carn S, DeLand M, Knyazikhin Y, Krotkov N, Marshak A, Myneni R and Vasilkov A (2021) Earth Imaging From the Surface of the Moon With a DSCOVR/EPIC-Type Camera. Front. Remote Sens. 2:724074. doi: 10.3389/frsen.2021.724074 Frontiers in Remote Sensing | www.frontiersin.org August 2021 | Volume 2 | Article 724074 1 ORIGINAL RESEARCH published: 25 August 2021 doi: 10.3389/frsen.2021.724074
Transcript of Earth Imaging From the Surface of the Moon With a DSCOVR ...

Earth Imaging From the Surface of theMoon With a DSCOVR/EPIC-TypeCameraNick Gorkavyi 1*, Simon Carn2, Matt DeLand1, Yuri Knyazikhin3, Nick Krotkov4,Alexander Marshak4, Ranga Myneni3 and Alexander Vasilkov1
1Science Systems and Applications, Lanham, MD, United States, 2Department of Geological and Mining Engineering andSciences, Michigan Technological University, Houghton, MI, United States, 3Earth and Environment Department, BostonUniversity, Boston, MA, United States, 4NASA Goddard Space Flight Center, Greenbelt, MD, United States
The Earth Polychromatic Imaging Camera (EPIC) on the Deep Space Climate Observatory(DSCOVR) satellite observes the entire Sun-illuminated Earth from sunrise to sunset fromthe L1 Sun-Earth Lagrange point. The L1 location, however, confines the observed phaseangles to ∼2°–12°, a nearly backscattering direction, precluding any information on thebidirectional surface reflectance factor (BRF) or cloud/aerosol phase function. Deployingan analog of EPIC on the Moon’s surface would offer a unique opportunity to image the fullrange of Earth phases, including observing ocean/cloud glint reflection for different phaseangles; monitoring of transient volcanic clouds; detection of circum-polar mesosphericand stratospheric clouds; estimating the surface BRF and full phase-angle integratedalbedo; and monitoring of vegetation characteristics for different phase angles.
Keywords: DISCOVR EPIC, Moon, phase function, clouds, vegetation
INTRODUCTION
Numerous Low Earth Orbit (LEO) and Geosynchronous Equatorial Orbit (GEO) Earth-observingsatellites provide a broad spectral range of viable data; however, it is obtained at the expense oflimited geographical (GEO) or temporal (LEO) coverage. Satellites from near-polar Sun-synchronous LEOs have limited observation capabilities at polar latitudes greater than 80° Northand South. These polar regions are not observable from geostationary satellites located above theequator. Although current Earth-observing satellites can produce high-resolution views, LEO sensorscan only scan a small portion of the surface at a given time, while GEO sensors can providetemporally continuous, though lower-resolution observations of a significant, though incompleteand fixed portion of the Earth’s disk. The Earth Polychromatic Imaging Camera (EPIC) on the DeepSpace Climate Observatory (DSCOVR) clearly stands apart, observing the entire Sun-illuminatedEarth from the L1 Sun-Earth Lagrange point (Marshak et al., 2018). EPIC has an aperture diameter of30.5 cm, a focal ratio of 9.38, a field of view of 0.61°, and a spatial resolution of ∼10 km/pixel. Thecamera produces 2048 × 2048 pixel images in 10 narrowband channels (317.5, 325, 340, 388, 443,551, 680, 688, 764, and 779.5 nm). The L1 location, however, restricts phase angles to ∼2°–12° (anearly backscattering direction), depriving the observer of any information on bidirectional surfacereflectance factors (BRFs) or on cloud/aerosol phase functions. A compact, lightweight, autonomousEPIC-type camera on the Moon’s surface offers a unique opportunity to overcome these limitationsand advance Earth science in novel and potentially unanticipated ways (Marshak et al., 2020). AnEPIC-Moon camera would work in synergy with the DSCOVR/EPIC instrument, increasing theefficiency of both sensors. Earth science goals of EPIC-Moon are to extend and improve the current
Edited by:Hartmut Boesch,
University of Leicester,United Kingdom
Reviewed by:Hartwig Deneke,
Leibniz Institute for TroposphericResearch (LG), Germany
Zhenzhu Wang,Aiofm (CAS), China
*Correspondence:Nick Gorkavyi
Specialty section:This article was submitted to
Satellite Missions,a section of the journal
Frontiers in Remote Sensing
Received: 11 June 2021Accepted: 12 August 2021Published: 25 August 2021
Citation:Gorkavyi N, Carn S, DeLand M,
Knyazikhin Y, Krotkov N, Marshak A,Myneni R and Vasilkov A (2021) EarthImaging From the Surface of the MoonWith a DSCOVR/EPIC-Type Camera.
Front. Remote Sens. 2:724074.doi: 10.3389/frsen.2021.724074
Frontiers in Remote Sensing | www.frontiersin.org August 2021 | Volume 2 | Article 7240741
ORIGINAL RESEARCHpublished: 25 August 2021
doi: 10.3389/frsen.2021.724074

DSCOVR/EPIC Earth imaging by extending spectral coverage,increasing spatial resolution and image cadence, and expandingcoverage of circumpolar regions. Assuming the EPIC-Mooncamera produces 2048 × 2048 pixel images, the spatialresolution would be ∼7 km/pixel for full Earth disk images or∼2 km/pixel for a DSCOVR/EPIC-like field of view of ∼0.6°.DSCOVR/EPIC obtains images of the entire sunlit Earth diskevery ∼60–100 min. Increasing the EPIC-Moon frame rate toobtain images every ∼10–15 min will allow much better tracking,for example, of drifting volcanic ash and SO2 clouds, which canmove at speeds of ∼100 km/h or more (see Volcanic SO2 and AshClouds).
The acquired data will enable retrievals of aerosol scatteringphase functions and Earth surface properties. The recent EarthScience Decadal Survey prioritized aerosols, clouds,convection, precipitation, terrestrial vegetation and surfacealbedo studies in connection with climate change (NationalAcademies of Sciences, 2018). As stated in IPCC AR5 Chapter7: “Clouds and aerosols continue to contribute the largestuncertainty to estimates and interpretations of the Earth’schanging energy budget” (IPCC, 2014). In this paper weanalyze the features and potential benefits of an EPIC-likecamera located on the Moon (or in lunar orbit).
Note that in the coming years, lunar bases are planned fordeployment on the Moon and in lunar orbit, which will beequipped with small telescopes for astronomical observations,for observing the Moon and for laser communication with theEarth. The concept presented here will be useful for assessing theprincipal possibilities of observing the Earth using telescopeslocated on the Moon.We do not consider sensors on the Moon asan alternative to sensors located in LEO, GEO, and L1 orbit, butobservations from the Moon have a few useful and novel featuresthat are important to discuss and consider in future projects.
PHASE ANGLES OF OBSERVATION FROML1 AND FROM THE MOON
Here, we compare the phase angles of observation of DSCOVR/EPIC with a sensor placed on the lunar surface. Figure 1A showsthe Sun-Earth-Vehicle (SEV) angle, which is close to the phaseobservation angle, for the first 3 months (or 90 days) of 2021.
The SEV angle for DSCOVR/EPIC varies from 11.91° (01/27/2021) to 2.09° (03/07/2021); this allows us to estimate theapproximate period of SEV change as ∼80 days. During thistime, DSCOVR/EPIC’s distance from Earth varied from
FIGURE 1 | (A) Sun-Earth-Vehicle (SEV) angle for any sunlit Earth object observed from the Moon during the first 3 months of 2021 (red line, data from Espenak,2021), compared to DSCOVR/EPIC’s SEV (blue line, see https://epic.gsfc.nasa.gov/); (B) Distance between the Moon and Earth during the same period (Espenak,2021).
Frontiers in Remote Sensing | www.frontiersin.org August 2021 | Volume 2 | Article 7240742
Gorkavyi et al. Earth Imaging From the Moon

1.54 million km (01/01/2021) to 1.39 million km (02/03/2021).Figure 1A shows the SEV angle for the Sun-Earth-Moon (orlunar sensor), which varies from about 0° to 180° during the lunarmonth. Figure 1B shows the distance between the Moon’s andthe Earth’s centers, which changes in 90 days from 360 × 103 to405 × 103 km. Therefore, on average, the camera on the Moon is4 times closer to the Earth than a sensor at the L1 point. Thelocation of Earth and Moon for phase angles of about 0°, 90°, and180° is shown in Figure 2, along with an assumed view of theEarth from the surface of the Moon. The view of the Earth will beapproximately the same from any point in the visible hemisphereof the Moon (from where the Earth is visible). The location of thesensor on the lunar surface is an essential observation factor interms of solar illumination. A sensor located in the equatorial ormid-latitudes of the Moon will be illuminated by the Sun for onlyhalf of the lunar month, remaining in shadow for the second halfof the month. This imposes certain constraints on the energysources for the sensor, as well as on its temperature parametersand calibration.
Scientific equipment could be located at high latitudes on theMoon, for example, in the region of the South Pole, which is anattractive location for a lunar base. There are areas on the rim ofShackleton crater where the Sun illuminates the lunar surfacemore than 90% of the time. The view of the Earth from the SouthPole of the Moon is shown in Figure 3A. Note that the Earth isinverted with the North Pole towards the Moon’s horizon. The
elevation of the Sun above the Moon’s horizon will change. For∼10% of the time, the Sun will be located below the horizon(possible positions of the Sun are shown by dashed circles).Interestingly, lunar eclipses that occur on Earth between 2 and5 times a year are solar eclipses from the point of view of anobserver on the Moon. Unlike an ordinary short-term solareclipse on Earth, a solar eclipse on the Moon can last up to108 min. This provides a unique opportunity to makeobservations without the influence of the atmosphere, forexample, to observe phenomena such as the solar corona andits dynamics for an hour and a half, the red ring glow of theEarth’s atmosphere, as well as relativistic displacements of theposition of stars near the Sun. Figure 3B shows the assumed viewof a solar eclipse from the South Pole of the Moon.
The proximity to the Earth and wide variations in phase angleaccessible by a Moon-based camera offer significant advantagesfor Earth observation, which we will discuss in the followingsections.
SOLAR GLINTS
At least 10% of DSCOVR/EPIC images of Earth contain intenselybright flashes of light over land, not seen by other satellites. Thephysical origin of these flashes is specular reflection fromhorizontally floating ice crystals in clouds. The cloud ice
FIGURE 2 | View of the Earth from the Moon at three points of the lunar orbit with phase angles of (A) 0°, (B) 90°, and (C) 180°. The image of the Earth shown hereand in Figure 3 was obtained by J. Walker based on MODIS/TERRA and Suomi/NPP images (Walker, 2021).
Frontiers in Remote Sensing | www.frontiersin.org August 2021 | Volume 2 | Article 7240743
Gorkavyi et al. Earth Imaging From the Moon

crystal glints are also observed over oceans together with glintsfrom the ocean surface. Figure 4 provides three examples of suchflashes.
In order to test the hypothesis that the detected bright flashesover land (see A panel) are caused by specular reflection fromhorizontally oriented crystals in ice clouds, the measured latitudes
of the detected bright colorful flashes were compared with thetheoretical ones that permit specular reflection for a given time ofyear and color (Marshak et al., 2017). The almost completecoincidence of the measured latitudes for all three colors withthe theoretical curve constituted compelling evidence for thespecular reflection hypothesis. As a result, it was shown that
FIGURE 3 | The expected view of the Earth and the Sun from the Moon’s South Pole. The picture uses a photo of the lunar surface obtained during the Apolloexpedition. Images of the Earth were taken from the Earth and Moon viewer (Walker, 2021). (A) The position of the Sun above (or below) the horizon can vary (shown bydashed circles). If the Sun sets behind the disk of the Earth, then a solar eclipse occurs on the Moon–see (B). During a solar eclipse the Earth’s atmosphere will glow withred light, and the Sun’s corona will glowwith white light. Stars will be visible near the Sun’s corona. Image (B) uses a photograph of the solar corona during an actualsolar eclipse on August 21, 2017, where the star Regulus (constellation Leo) is visible (photo by N. Gorkavyi).
FIGURE 4 | Three examples of glints captured by DSCOVR/EPIC in 2018. The Sun-Earth-Vehicle (SEV) angle is around 9°. Note that the filter wheel used to selectEPIC wavelengths causes a time lag between the component images in these red-green-blue (RGB) composites: ∼3 min between blue (443 nm) and green (551 nm);∼4 min between blue and red (680 nm). (A) Terrestrial glint over Australia from cloud ice crystals on February 13, 2018 (see https://epic.gsfc.nasa.gov/?date�2018-02-13); (B) Terrestrial glint over the Pacific Ocean from marine cloud ice crystals on June 15, 2018 (see https://epic.gsfc.nasa.gov/?date�2018-06-15); (C) Oceansurface glint on September 17, 2018 (see https://epic.gsfc.nasa.gov/?date�2018-09-17).
Frontiers in Remote Sensing | www.frontiersin.org August 2021 | Volume 2 | Article 7240744
Gorkavyi et al. Earth Imaging From the Moon

tiny hexagonal platelets of ice, floating in the air in nearly perfecthorizontal alignment, are likely responsible for the glintsobserved by EPIC over land. Varnai et al. (2020) alsodemonstrated EPIC’s ability to distinguish ocean surface glints(C panel) from marine ice cloud glints (B panel). Indeed, EPIC’sobservations in oxygen absorption bands (A-band over ocean)help to uniquely distinguish between ocean surface and high iceclouds. In addition to solar glints from ocean surface and cloudice, bright reflections of sunlight were also observed from highmountains in the Andes that are likely caused by calm small lakes(Kostinski et al., 2021).
However, the Sun-Earth-satellite geometry of DSCOVRobservations is not a particularly favorable one for glintdetection. Specular reflection tends to be much stronger foroblique illumination and at grazing angles (Williams andGaidos, 2008; Robinson et al., 2010). Thus, one expects that inobservations at “crescent or half-moon” phases from the Moon,glints will contribute more to the overall planetary radiances-especially when accounting for the decrease in the diffuseradiance when only a portion of the planet’s sunlit side isvisible. As a function of phase angle, Earth imaging from theMoon will provide ocean/cloud glint reflection for different phaseangles than available from GEO, LEO, and L1.
Motivated by EPIC observations of solar glints off theterrestrial atmosphere, it is also important to explore theimpact of starlight glints on the detection and characterizationof exoplanets. This idea goes back to 1993 when Carl Sagan andcolleagues (see p. 715 in Sagan et al., 1993) used the Galileospacecraft’s fly-by observation of Earth as an exoplanet controlexperiment. Based solely on observations of specular reflection,they deduced that Earth was covered in part by liquid oceans.Their conclusions were based entirely on several Galileo imagescollected on Dec. 12, 1990 while Galileo was on its way to Jupiter,crossing a line between Sun and Earth. In Sagan et al. (1993) theywrote “The Galileo mission constitutes an apparently uniquecontrol experiment on the ability of fly-by spacecraft to detectlife . . ..” In addition, on p. 718 it was noted that “. . . closeexamination of the images shows a region of specular reflectionin ocean but not on land.” Note that the fraction of oriented icecrystals might be negligible (Breon and Dubrulle, 2004); hencethe effect of glints on cloud brightness is small. The sun-glint inEPOXI [two missions: Deep Impact Extended Investigation(DIXI) and Extrasolar Planet Observation andCharacterization (EPOCh)] was relatively minor (though theimage was intrinsically blurry; Livengood et al., 2011).However, if some preliminary estimates of the frequency andbrightness of solar glints from EPIC are confirmed, specularreflection observations from the Moon’s surface could have alonger-term consequence for exoplanet science.
VOLCANIC SO2 AND ASH CLOUDS
Volcanic eruptions periodically emit large quantities of sulfurdioxide (SO2) and aerosol into the free troposphere andstratosphere, with potential impacts on climate, theenvironment and aviation. After emission, volcanic SO2
converts to liquid sulfate aerosol particles (on timescales ofdays to months), which can impact climate through the directaerosol effect on solar radiation. Young volcanic eruption clouds(within a few hours of emission) also contain volcanic ashparticles which can be a significant hazard to aviation. Timelymonitoring of volcanic SO2 and ash emissions is therefore criticalfor aviation safety and for assessing the impacts of volcaniceruptions on climate. Volcanic SO2 and ash emissions havebeen measured using UV satellite instruments on LEOplatforms for several decades (Carn et al., 2016), but theseobservations have low (∼daily) temporal resolution. GEOinstruments can measure SO2 and volcanic ash in the IR withhigh cadence, providing critical data for operational detection ofvolcanic eruptions (e.g., Pavolonis et al., 2018), but are unable todetect volcanic clouds at latitudes above ∼70–80° and retrievalsbecome noisy (with lower sensitivity) towards the edge of theGEO field-of-view. LEO satellites provide coverage of the polarregions, but with relatively low cadence and without a synoptic,hemispheric imaging capability.
DSCOVR/EPIC is able to detect volcanic SO2 and ashemissions (Carn et al., 2018) and has now demonstrated thevalue of observations from L1 for observing high-latitudevolcanic eruptions. A major eruption of Raikoke volcano(Kuril Islands, Russia) in June 2019 emitted SO2 and ashclouds that initially drifted north to high latitudes and weremeasured with hourly cadence by EPIC (Figure 5). EPIC wasable to map the extensive Raikoke volcanic SO2 clouds in singleimages with no temporal gaps, in contrast to LEO instruments,elucidating the dynamics of SO2 transport. Such high-latitudeeruptions occur quite frequently in active volcanic regions such asKamchatka, the Kuril Islands, Alaska and the Aleutian Islands,and Iceland. In addition to Raikoke, notable high-latitudevolcanic eruptions include Kasatochi (Aleutian Islands,United States) in 2008, Sarychev Peak (Kuril Islands, Russia)in 2009, Holuhraun (Iceland) in 2014–15 and Alaid (KurilIslands, Russia) in 1981. Each of these eruptions producedextensive SO2 clouds that drifted over the Arctic region. TheSouthern Hemisphere has fewer active volcanoes at high latitudes,but nevertheless, significant eruptions such as Cerro Hudson(Chile) in 1991 and Cordon Caulle (Chile) in 2011 producedvolcanic clouds that drifted south around Antarctica. Hence thereis a need for improved observations of volcanic clouds at highlatitudes, given the importance of the polar regions in the contextof climate change. An EPIC-like instrument on the Moon wouldprovide synoptic imaging of the polar regions with higher spatialresolution and higher cadence than provided by DSCOVR/EPICat L1.
In addition to improved cadence and spatial resolution ofvolcanic SO2 and ash measurements, EPIC-Moon observationswould offer advantages over DSCOVR/EPIC for volcanic aerosoldetection and retrieval. Aerosol particles in volcanic cloudsinclude liquid sulfate aerosol, which are spherical, plusvolcanic ash particles (glass shards and crystal fragments)which can have highly irregular shapes. Ash particle phasefunctions depend on effective particle size but are typicallystrongly forward scattering at UV wavelengths (Krotkov et al.,1997; Krotkov et al., 1999), which is a limitation for observations
Frontiers in Remote Sensing | www.frontiersin.org August 2021 | Volume 2 | Article 7240745
Gorkavyi et al. Earth Imaging From the Moon
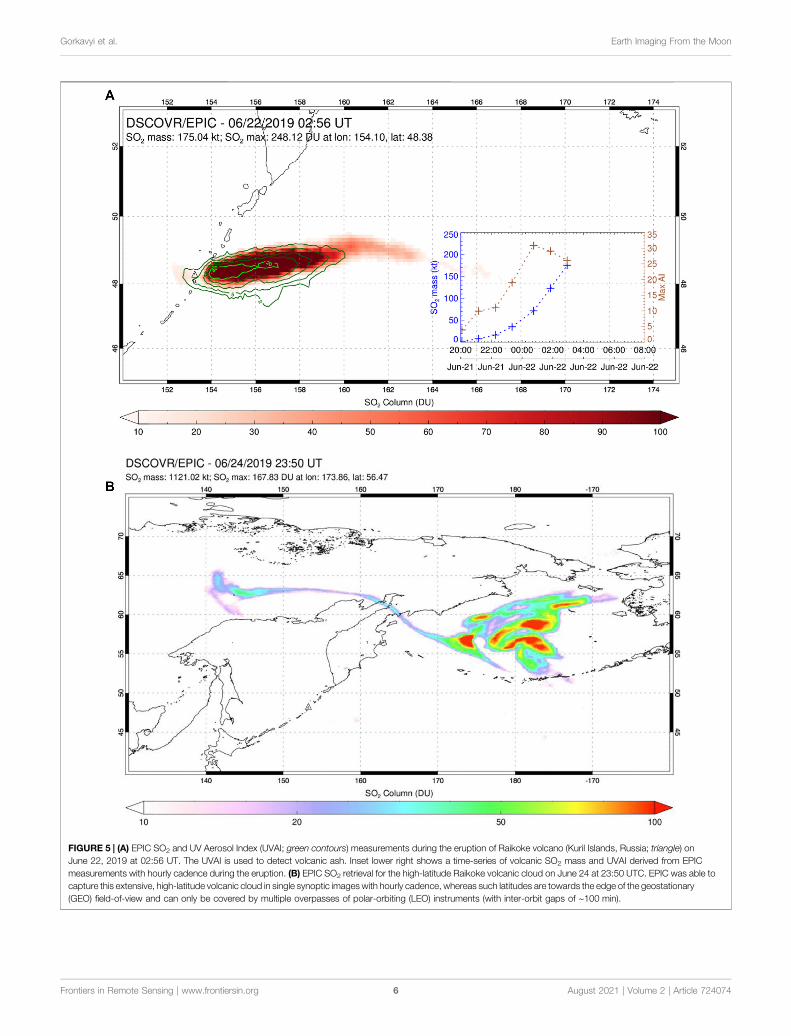
FIGURE 5 | (A) EPIC SO2 and UV Aerosol Index (UVAI; green contours) measurements during the eruption of Raikoke volcano (Kuril Islands, Russia; triangle) onJune 22, 2019 at 02:56 UT. The UVAI is used to detect volcanic ash. Inset lower right shows a time-series of volcanic SO2 mass and UVAI derived from EPICmeasurements with hourly cadence during the eruption. (B) EPIC SO2 retrieval for the high-latitude Raikoke volcanic cloud on June 24 at 23:50 UTC. EPIC was able tocapture this extensive, high-latitude volcanic cloud in single synoptic images with hourly cadence, whereas such latitudes are towards the edge of the geostationary(GEO) field-of-view and can only be covered by multiple overpasses of polar-orbiting (LEO) instruments (with inter-orbit gaps of ∼100 min).
Frontiers in Remote Sensing | www.frontiersin.org August 2021 | Volume 2 | Article 7240746
Gorkavyi et al. Earth Imaging From the Moon

of volcanic ash from L1 (in the backscattering direction). Due tochanges in the phase function with particle size, the ability todiscriminate between ash particle sizes in a volcanic cloudincreases if observations at different scattering angles areavailable.
Studies of particle shape effects on the phase function indicatethat, at UV wavelengths, particle non-sphericity leads toincreased scattering at side-scattering angles (120–140°) anddecreases at backscattering angles (Krotkov et al., 1997;Krotkov et al., 1999). If ash particles are assumed to bespherical, UV retrievals of ash optical depth will beunderestimated at backscattering angles (i.e., EPICobservations from L1) and overestimated at side-scatteringangles. Scattering angles near 150° are optimal for opticaldepth retrievals independent of particle shape. Hence thelarger range of phase angles accessible from EPIC-Moonobservations could potentially improve the accuracy of UVvolcanic ash retrievals.
POLAR MESOSPHERIC CLOUDS ANDPOLAR STRATOSPHERIC CLOUDS
Numerous phenomena in the Earth’s middle and upperatmosphere occur in layers that are typically limited in verticalextent but cover extensive horizontal areas. Examples includepolar stratospheric clouds (PSCs) and polar mesospheric clouds(PMCs). Localized injections into the stratosphere from below,such as ash plumes from volcanic eruptions or smoke frompyrocumulonimbus (pyroCb) wildfire events, can also betransported by strong winds to spread globally and last formonths. Measurements with limb viewing geometry arevaluable in studying these phenomena because the long line-of-sight through the atmosphere can enhance an otherwise faintsignal. Examples of limb observations for each type of event havebeen published recently (Tsuda et al., 2018; Bourassa et al., 2019;DeLand et al., 2020; DeLand and Gorkavyi, 2020; Torres et al.,2020; Gorkavyi et al., 2021). The source material for these cloudsand plumes are primarily composed of relatively small particles(tens of nm to few hundred nm in radius), with varyingcomposition (PMC � water ice, PSC � nitric acid trihydrate,volcano � ash, and sulfate, pyroCb � smoke). The small size ofthese particles means that the intensity of observed reflected light(near-UV, visible, near-IR) will be governed by Mie theory, andthus will vary significantly as a function of scattering angle. Theperiodic variation of observing phase angle shown in Figure 1Afor a lunar sensor would be quite valuable for these atmosphericmeasurements. The resulting variation in phase function (andthus observed signal) can be used to help distinguish betweendifferent assumptions about particle size distribution andcomposition, which also affect the phase function.
MONITORING VEGETATION
Natural terrestrial surfaces scatter shortwave radiation into anangular reflectance pattern or Bidirectional Reflectance Factor
(BRF). In vegetation canopies, the finite size of scatterers (e.g.,leaves, coniferous shoots, etc.) can cast shadows. This causes thecanopy “hot spot” effect, i.e., a sharp increase in canopy reflectedradiation as the scattering direction approaches the direction tothe Sun (Figure 6) (Ross and Marshak, 1988; Knyazikhin andMarshak, 1991; Kuusk, 1991; Myneni et al., 1991; Qin et al., 1996;Gerstl, 1999). The hot spot phenomenon is strongly correlatedwith canopy architectural parameters such as foliage size andshape, crown geometry and within-crown foliage arrangement,foliage grouping, leaf area index and its sunlit fraction (Ross andMarshak, 1991; Qin et al., 1996; Goel et al., 1997; Knyazikhinet al., 1998; Qin et al., 2002; Schull et al., 2011; Yang et al., 2017;Pisek et al., 2021). Angular signatures that include the hot spotregion are critical for monitoring phenological changes in densevegetation such as equatorial forests (Bi et al., 2015).
Sensors onboard Earth-orbiting satellites sample reflectanceover swaths at a specific local solar time, or over a specific area ofthe sunlit Earth. Such intrinsic sampling limits makesobservations of the hot spot rare in occurrence. For example,the cross-track MODIS scanners on the Terra and Aqua near-polar Sun-synchronous orbits can observe about 30–35% ofequatorial Amazonian rainforests along the hotspot directionsaround the Equinoxes. No such observations are available fromMay to July and November to December (Figure 7). TheMultiangle Imaging Spectroradiometer (MISR) on the Terrasatellite views the Earth’s surface with nine camerassimultaneously, as opposed to the two MODIS sensors, whichare capable of only one view each. The MISR observing strategyallows for a better angular variation of surface BRFs in theequatorial zone (Figure 7). However, spatially and temporallyvarying phase angles could be far from zero, making globalobservation of the hot spot phenomenon impossible. Aspectroradiometer on the Moon’s surface offers a uniqueopportunity to provide observations of every region of the
FIGURE 6 | Near-infrared BRF of Amazonian forests confined between0° to 10°S and 60°W to 70°W from Terra MISR, Terra MODIS, and AquaMODIS sensors for the period between June 25 and July 10 accumulated overa 7-years period from 2001 to 2008. The MISR sensor views the Earth’ssurface with nine cameras simultaneously, as opposed to the two MODISsensors, which are capable of only one view each. The MISR observinggeometry allows for measurements of angular signatures over a wider range ofphase angles.
Frontiers in Remote Sensing | www.frontiersin.org August 2021 | Volume 2 | Article 7240747
Gorkavyi et al. Earth Imaging From the Moon

Earth from sunrise to sunset at a full range of phase angles. Here,we discuss an application of surface reflectance data at a full rangeof phase angles to monitor phenological changes in equatorialforests.
Tropical forests account for approximately one-third ofEarth’s terrestrial gross primary productivity and one-half ofEarth’s carbon stored in terrestrial vegetation (Lewis et al., 2009;Pan et al., 2011; Lewis et al., 2015; Hubau et al., 2020). They playan essential role in surface energy partitioning and the Earth’scarbon cycle and consequently impact regional climate (Cooket al., 2020; Forzieri et al., 2020). Because of its large geographicalextent, any perturbations within this system can have significantimpacts on climate and on the carbon and water cycles.Monitoring the spatial patterns, intra-annual seasonality andtheir controls, inter-annual variability and long-term trends inthe structure and functioning of rainforests is crucial to ourunderstanding of how these biodiverse and productiveecosystems will respond to future climate change, disturbancesand human appropriation (Cox et al., 2004; Cox et al., 2013;Guimberteau et al., 2017).
Monitoring of dense vegetation such as equatorial rainforestsis a challenge for optical remote sensing because reflection of solarradiation saturates and becomes weakly sensitive to vegetationchanges. At the same time, satellite data are strongly influencedby changing sun-sensor geometry. This makes it difficult todiscriminate between vegetation changes and sun-sensorgeometry effects. Commonly used approaches forinterpretation of satellite data from single-viewing sensorsconsider the viewing and solar zenith angle (SZA) dependenceof reflected radiation as a source of noise or error, requiring acorrection or normalization to a “standard” sun-sensor geometry.Figure 6 shows the BRF in the NIR spectral band from single-angle Terra and Aqua MODIS sensors acquired over Amazonianrainforests. Their values are almost constant: they vary between0.18 and 0.23 with mean, standard deviation and coefficient ofvariation of 0.2, 0.08 and 4%, respectively. Most surface BRFmodels would interpret such observations as radiation scattered
by Lambertian surfaces. Transformation of such data to a fixed,standard sun-sensor geometry therefore invokes statisticalassumptions that may not apply to specific scenes. The lack ofinformation on the angular variation of forest-reflected radiationintroduces model uncertainties that in turn may have significantimpacts on interpretation of satellite data. For example, studies ofAmazon forest seasonality based on analyses of data from single-viewing sensors disagree on whether there is more greenness inthe dry season than in the wet season: the observed variations inthe forest BRF were explained by an increase in the leaf area, anartifact of sun-sensor geometry and changes in leaf age throughthe leaf flush (Huete et al., 2006; Myneni et al., 2007; Brando et al.,2010; Samanta et al., 2012; Morton et al., 2016; Saleska et al.,2016). Conflicting conclusions among these studies arise fromdifferent interpretations of surface reflectance data acquiredunder saturation conditions (Bi et al., 2015).
FIGURE 7 | Probability density function (pdf) of the phase angle during 25 June to 10 July and 13–28 September periods over Amazonian rainforests (0°–10°S and60°W to 70°W) for Terra MODIS and MISR sun-sensor geometries derived from MODIS and MISR data acquired from June 2000 to May 2008. MISR instrument usesnine cameras to view the Earth’s surface in the forward and backward directions along the spacecraft’s flight track with nominal viewing zenith angles relative to thesurface reference ellipsoid of 0.0° (camera An), 26.1° (Af and Aa), 46.5° (Bf and Ba), 60.0° (Cf and Ca), and 70.5° (Df and Da). The 360 km swath width covers theglobe in 9 days. MODIS is a single view sensor that scans the Earth’s surface across the spacecraft flight track. It has a viewing swath width of 2,330 km and views theentire surface of the Earth every 1–2 days. From Song et al., 2018.
FIGURE 8 | Angular signatures of NIR reflectance of Amazonian forestsin March (5 Mar to 20 Mar), June (25 Jun to 10 Jul), and October (15 Oct to 30Oct) derived from MISR data.
Frontiers in Remote Sensing | www.frontiersin.org August 2021 | Volume 2 | Article 7240748
Gorkavyi et al. Earth Imaging From the Moon

Figure 8 shows seasonal changes in NIR BRF of Amazonianforests. The seasonal cycle consists of a short dry season fromJune to October, and a long wet season thereafter. There areseveral noteworthy features in the variation of angular signatures.First, a distinct decrease in reflected NIR radiation in all viewingdirections from the early (October) to middle (March) part of thewet season with no change in the overall shape of the angularsignatures. The SZA is almost the same. The observed downwardshift under similar illumination conditions can only result from achange in canopy properties (Bi et al., 2015). Second, the shape ofthe BRF changes from the beginning (June) to late (October) dryseason. Illumination conditions are different in these months. Ahigher or equal reflectance at lower SZA relative to that at higherSZA always indicates an increase in leaf area and foliage scatteringproperties (Bi et al., 2015). Moreover, the intersection point ofBRFs acquired in these months deviates significantly from thatpredicted by the reciprocity theorem for identical canopies underdifferent illumination conditions, suggesting that Amazonianforests cannot be similar at the beginning and end of dryseasons (Bi et al., 2015). These examples illustrate that theavailability of BRFs over equatorial forests at a full range ofthe phase angle under different illumination conditions will makemonitoring their changes more reliable.
Improved measurements of albedo of the components ofEarth’s land surface–snow, ice, vegetation, and soil are amongthe priority targeted observables that were ranked in the EarthScience Decadal Survey as most important or very important(National Academies of Sciences, 2018, p. 229). Spectral albedo(or directional hemispherical reflectance in remote sensingnomenclature) is the integral of the cosine weighted BRF overscattering directions. Measurements of radiation scattered by theland surface in all directions are therefore required to perform theintegration. An EPIC-like camera on the Moon’s surface canprovide frequent observations of every region of the Earth in thefull range of scattering directions. The availability of such datawill undoubtedly advance our ability to modelevapotranspiration, snowmelt, and retrospective reconstructionof the snow water equivalent, which are critical for accuratedescription of the surface radiation balance (National Academiesof Sciences, 2018, p. 227).
LUNAR ENVIRONMENT
Forward scattering conditions create advantages for observing thelunar dust cloud. The lunar dust exosphere is an important factorfor the long-term residence of astronauts on the Moon, as well asfor the functioning of scientific equipment on the lunar surfaceand orbiters (Elphic et al., 2014; Richard et al., 2018). Telescopiclimb observations of the scattering of sunlight (or starlight) fromthe lunar dust cloud would help construct a 3Dmodel of the lunardust exosphere (Richard et al., 2018). We believe that preliminaryinformation regarding the effectiveness of observing the Earthfrom the lunar surface can be obtained by analyzing photographsof the Earth obtained using the navigation cameras of the lunarrover VIPER (Colaprete et al., 2021). In addition, analysis ofphotographs from VIPER cameras taken under conditions of
forward scattering of both sunlight and reflected light of theEarth can provide useful information for comparison withmodels of lunar dust (Richard et al., 2018). A similar programwas implemented for the Cosmic Background Explorer(COBE) data and the model of the zodiacal dust cloud(Gorkavyi et al., 2000). Observations from the Moon willhelp improve existing models of the zodiacal cloud, which isimportant for astronomical observations, e.g., by the JamesWebb Space Telescope (JWST) in particular. Even a smallmeteoroid with a mass of 5 kg can excavate a ∼10 m crater,ejecting 75 tons of lunar regolith and rock on ballistic trajectoriesabove the Moon (Dunbar, 2021). However, “The lunar impactrate is very uncertain because observations for objects in thismass range are embarrassingly few” (Speyerer et al., 2016).Accurate assessment of the meteorite hazard is requiredfor the effective and safe implementation of the Artemisprogram (Elphic et al., 2014). Using the Earth’s atmosphere asa detector, EPIC-Moon imaging of the night-side and limb ofthe Earth will detect atmospheric impacts (either by a flash orfrom dispersion of meteoritic dust clouds; see Gorkavyi et al.,2013) from potentially threatening small (<10 m) asteroids in thevicinity of Earth, thus improving the current highly uncertainestimates.
CONCLUSION
Deploying an analog of DSCOVR/EPIC on the Moon’s surfacewould offer a unique opportunity to image the full range of Earthphases, potentially advancing Earth science in many ways:
1) observing ocean/cloud glint reflection for different phaseangles;
2) comprehensive whole-globe monitoring of transient volcanicand aerosol clouds (smoke, dust), including the strategicallyimportant (for climate studies) polar regions not covered byGEO missions;
3) detecting of polar mesospheric and stratospheric clouds viawhole-Earth limb imaging;
4) estimating surface BRF and full phase-angle integrated albedo;5) monitoring and quantifying changes in vegetated land;6) simultaneous imaging of the day and night parts (i.e., the
twilight zone) during crescent phases of the Earth andshadowed parts illuminated by the Moon.
DATA AVAILABILITY STATEMENT
The original contributions presented in the study are included inthe article/supplementary material, further inquiries can bedirected to the corresponding author.
AUTHOR CONTRIBUTIONS
NG, SC, MD, YK, AM, and RM developed computer codes andalgorithms, analyzed the results and wrote the manuscript. NK,
Frontiers in Remote Sensing | www.frontiersin.org August 2021 | Volume 2 | Article 7240749
Gorkavyi et al. Earth Imaging From the Moon

AM, and AV set the task of developing, supported thedevelopment of the algorithm, analyzed the results and wrotethe manuscript.
FUNDING
YK is supported by the NASA DSCOVR project under grant80NSSC19K0762 and Jet Propulsion Laboratory under contract
1625837. SC is supported by the NASA DSCOVR Science Teamunder grant 80NSSC19K0771. NG,MD, and AV are supported byNASA contract NNG17HP01C.
ACKNOWLEDGMENTS
The authors thank the EPIC teams for providing the DSCOVR/EPIC data.
REFERENCES
Bi, J., Knyazikhin, Y., Choi, S., Park, T., Barichivich, J., Ciais, P., et al. (2015).Sunlight mediated seasonality in canopy structure and photosynthetic activityof Amazonian rainforests. Environ. Res. Lett. 10, 064014. doi:10.1088/1748-9326/10/6/064014
Bourassa, A. E., Rieger, L. A., Zawada, D. J., Khaykin, S., Thomason, L. W., andDegenstein, D. A. (2019). Satellite limb observations of unprecedented forestfire aerosol in the stratosphere. J. Geophys. Res. Atmos. 124, 9510–9519.doi:10.1029/2019JD030607
Brando, P. M., Goetz, S. J., Baccini, A., Nepstad, D. C., Beck, P. S. A., andChristman, M. C. (2010). Seasonal and interannual variability of climateand vegetation indices across the Amazon. Proc. Natl. Acad. Sci. 107,14685–14690. doi:10.1073/pnas.0908741107
Bréon, F.-M., and Dubrulle, B. (2004). Horizontally oriented plates in clouds.J. Atm. Sci. 61, 2888–2898. doi:10.1175/JAS-3309.1
Carn, S. A., Clarisse, L., and Prata, A. J. (2016). Multi-decadal satellitemeasurements of global volcanic degassing. J. Volcanology Geothermal Res.311, 99–134. doi:10.1016/j.jvolgeores.2016.01.002
Carn, S. A., Krotkov, N. A., Fisher, B. L., Li, C., and Prata, A. J. (2018). FirstObservations of Volcanic Eruption Clouds from the L1 Earth-Sun LagrangePoint by DSCOVR/EPIC. Geophys. Res. Lett. 45, 11456–11464. doi:10.1029/2018GL079808
Colaprete, A., Elphic, R. C., Shirley, M., Ennico-Smith, K., Lim, D. S. S., Zacny, K.,et al. (2021). The Volatiles Investigating Polar Exploration Rover (VIPER)Mission. 15-19 March, 2021. LPI Contribution No. 2548, id.1523, https://ui.adsabs.harvard.edu/#abs/2021LPI.52.1523C/abstract.52nd Lunar andPlanetary Science Conference.
Cook, K. H., Liu, Y., and Vizy, E. K. (2020). Congo Basin drying associated withpoleward shifts of the African thermal lows. Clim. Dyn. 54, 863–883.doi:10.1007/s00382-019-05033-3
Cox, P. M., Betts, R. A., Collins, M., Harris, P. P., Huntingford, C., and Jones, C. D.(2004). Amazonian forest dieback under climate-carbon cycle projections forthe 21st century. Theor. Appl. Climatol 78, 137–156. doi:10.1007/s00704-004-0049-4
Cox, P. M., Pearson, D., Booth, B. B., Friedlingstein, P., Huntingford, C., Jones, C.D., et al. (2013). Sensitivity of tropical carbon to climate change constrained bycarbon dioxide variability. Nature 494, 341–344. doi:10.1038/nature11882
DeLand, M. T., Bhartia, P. K., Kramarova, N., and Chen, Z. (2020). OMPS LPobservations of PSC variability during the NH 2019-2020 season. Geophys. Res.Lett. 47, e2020GL090216. doi:10.1029/2020gl090216
DeLand, M. T., and Gorkavyi, N. (2021). PMC observations from the OMPSLimb Profiler. J. Atmos. Solar-Terrestrial Phys. 213, 105505. doi:10.1016/j.jastp.2020.105505
Dunbar, B. (2021). About Lunar Impact Monitoring. Huntsville, AL: NASA.https://www.nasa.gov/centers/marshall/news/lunar/overview.html.
Elphic, R. C., Delory, G. T., Delory, G. T., Hine, B. P., Mahaffy, P. R., Horanyi, M.,et al. (2014). The Lunar Atmosphere and Dust Environment Explorer Mission.Space Sci. Rev. 185, 3–25. doi:10.1007/s11214-014-0113-z
Espenak, F. (2021). Geocentric Ephemeris for the Sun, Moon and Planets. http://astropixels.com/ephemeris/moon/moon2021.html.
Forzieri, G., Miralles, D. G., Ciais, P., Alkama, R., Ryu, Y., Duveiller, G., et al.(2020). Increased control of vegetation on global terrestrial energy fluxes. Nat.Clim. Chang. 10, 356–362. doi:10.1038/s41558-020-0717-0
Gerstl, S. A. W. (1999). Building a global hotspot ecology with Triana data. RemoteSensing Earth Sci. Ocean, Sea Ice Appl. 3868, 184–194. doi:10.1117/12.373094
Goel, N. S., Qin, W., andWang, B. (1997). On the estimation of leaf size and crowngeometry for tree canopies from hotspot observations. J. Geophys. Res. 102,29543–29554. doi:10.1029/97JD01110
Gorkavyi, N., Krotkov, N., Li, C., Lait, L., Colarco, P., Carn, S., et al. (2021).Tracking aerosols and SO2 clouds from the Raikoke eruption: 3D view fromsatellite observations. Atmos. Meas. Tech., 58, 2021 . amt-2021. doi:10.5194/amt-2021-58
Gorkavyi, N., Ozernoy, L. M., Mather, J. C., and Taidakova, T. A. (2000). “TheNGST and the zodiacal light in the Solar system,” in NGST Science andTechnology Exposition. Editors E. P. Smith and K. S. Long (San Francisco:ASP Series), 207, 462–467.
Gorkavyi, N., Rault, D. F., Newman, P. A., Da Silva, A. M., and Dudorov, A. E.(2013). New stratospheric dust belt due to the Chelyabinsk bolide.Geophys. Res.Lett. 40, 4728–4733. doi:10.1002/grl.50788
Guimberteau, M., Ciais, P., Ducharne, A., Boisier, J. P., Dutra Aguiar, A. P.,Biemans, H., et al. (2017). Impacts of future deforestation and climate changeon the hydrology of the Amazon Basin: a multi-model analysis with a new set ofland-cover change scenarios. Hydrol. Earth Syst. Sci. 21, 1455–1475.doi:10.5194/hess-21-1455-2017
Hubau, W., Lewis, S. L., Phillips, O. L., Affum-Baffoe, K., Beeckman, H., Cuní-Sanchez,A., et al. (2020). Asynchronous carbon sink saturation in African and Amazoniantropical forests. Nature 579, 80–87. doi:10.1038/s41586-020-2035-0
Huete, A. R., Didan, K., Shimabukuro, Y. E., Ratana, P., Saleska, S. R., Hutyra, L. R.,et al. (2006). Amazon rainforests green-up with sunlight in dry season.Geophys.Res. Lett. 33, L06405. doi:10.1029/2005GL025583
IPCC (2014). Fifth Assessment Report (AR5). https://www.ipcc.ch/assessment-report/ar5/.
Knyazikhin, Y., and Marshak, A. (1991). “Fundamental Equations of RadiativeTransfer in Leaf Canopies, and Iterative Methods for Their Solution,” inPhoton-vegetation interactions: applications in plant physiology and opticalremote sensing. Editors R. B. Myneni and J. Ross (Berlin Heidelberg:Springer-Verlag), 9–43. doi:10.1007/978-3-642-75389-3_2
Knyazikhin, Y., Martonchik, J. V., Myneni, R. B., Diner, D. J., and Running, S. W.(1998). Synergistic algorithm for estimating vegetation canopy leaf area indexand fraction of absorbed photosynthetically active radiation from MODIS andMISR data. J. Geophys. Res. 103, 32257–32275. doi:10.1029/98JD02462
Kostinski, A., Marshak, A., and Várnai, T. (2021). Deep space observations ofterrestrial glitter. Earth Space Sci. 8, e2020EA001521. doi:10.1029/2020EA001521
Krotkov, N. A., Flittner, D. E., Krueger, A. J., Kostinski, A., Riley, C., Rose, W., et al.(1999). Effect of particle non-sphericity on satellite monitoring of driftingvolcanic ash clouds. J. Quantitative Spectrosc. Radiative Transfer 63, 613–630.doi:10.1016/S0022-4073(99)00041-2
Krotkov, N. A., Krueger, A. J., and Bhartia, P. K. (1997). Ultraviolet optical modelof volcanic clouds for remote sensing of ash and sulfur dioxide. J. Geophys. Res.102 (D18), 21891–21904. doi:10.1029/97JD01690
Kuusk, A. (1991). “The Hot Spot Effect in Plant Canopy reflectance,” in Photon-vegetation interactions: applications in plant physiology and optical remote sensing.Editors R. B. Myneni and J. Ross (Berlin Heidelberg: Springer-Verlag), 139–159.doi:10.1007/978-3-642-75389-310.1007/978-3-642-75389-3_5
Lewis, S. L., Edwards, D. P., and Galbraith, D. (2015). Increasing humandominance of tropical forests. Science 349, 827–832. doi:10.1126/science.aaa9932
Frontiers in Remote Sensing | www.frontiersin.org August 2021 | Volume 2 | Article 72407410
Gorkavyi et al. Earth Imaging From the Moon

Lewis, S. L., Lopez-Gonzalez, G., Sonké, B., Affum-Baffoe, K., Baker, T. R., Ojo, L.O., et al. (2009). Increasing carbon storage in intact African tropical forests.Nature 457, 1003–1006. doi:10.1038/nature07771
Livengood, T. A., Deming, L. D., A’Hearn, M. F., Charbonneau, D., Hewagama, T.,Lisse, C. M., et al. (2011). Properties of an Earth-Like Planet Orbiting a Sun-LikeStar: Earth Observed by the EPOXI Mission. Astrobiology 11, 907–930.doi:10.1089/ast.2011.0614
Marshak, A., Herman, J., Adam, S., Karin, B., Carn, S., Cede, A., et al. (2018). EarthObservations from DSCOVR EPIC Instrument. BAMS 99, 1829–1850.doi:10.1175/BAMS-D-17-0223.1
Marshak, A., Krotkov, N., Gorkavyi, N., Marchenko, S., Vasilkov, A., Knyazikhin,Y., et al. (2020). “Whole Earth imaging from the Moon South Pole (EPIC-Moon),” in Whitepaper. https://www.lpi.usra.edu/announcements/artemis/whitepapers/2054.pdf.
Marshak, A., Várnai, T., and Kostinski, A. (2017). Terrestrial glint seen from deepspace: oriented ice crystals detected from the Lagrangian point. Geophys. Res.Lett. 44, 5197–5202. doi:10.1002/2017GL073248
Morton, D. C., Nagol, J., Carabajal, C. C., Rosette, J., Rosette, J., Palace, M., et al.(2016). Morton et al. reply. Nature 531, E6. doi:10.1038/nature16458
Myneni, R. B., Marshak, A. L., and Knyazikhin, Y. V. (1991). Transport theory for aleaf canopy of finite-dimensional scattering centers. J. Quantitative Spectrosc.Radiative Transfer 46, 259–280. doi:10.1016/0022-4073(91)90091-4
Myneni, R. B., Yang, W., Nemani, R. R., Huete, A. R., Dickinson, R. E., Knyazikhin,Y., et al. (2007). Large seasonal swings in leaf area of Amazon rainforests. Proc.Natl. Acad. Sci. 104, 4820–4823. doi:10.1073/pnas.0611338104
National Academies of Sciences (2018). Thriving on Our Changing Planet: ADecadal Strategy for Earth Observation from Space. Washington, DC: TheNational Academies Press. doi:10.17226/24938
Pan, Y., Birdsey, R. A., Fang, J., Houghton, R., Kauppi, P. E., Kurz, W. A., et al.(2011). A Large and Persistent Carbon Sink in the World’s Forests. Science 333,988–993. doi:10.1126/science.1201609
Pavolonis, M. J., Sieglaff, J., and Cintineo, J. (2018). Automated Detection ofExplosive Volcanic Eruptions Using Satellite-Derived Cloud Vertical GrowthRates. Earth Space Sci. 5, 903–928. doi:10.1029/2018EA000410
Pisek, J., Arndt, S. K., Erb, A., Pendall, E., Schaaf, C., Wardlaw, T. J., et al. (2021).Exploring the Potential of DSCOVR EPIC Data to Retrieve Clumping Index inAustralian Terrestrial Ecosystem Research Network Observing Sites. Front.Remote Sens. 2, 652436. doi:10.3389/frsen.2021.652436
Qin, W., Gerstl, S. A. W., Deering, D. W., and Goel, N. S. (2002). Characterizingleaf geometry for grass and crop canopies from hotspot observations: Asimulation study. Remote Sensing Environ. 80, 100–113. doi:10.1016/S0034-4257(01)00291-7
Qin, W., Goel, N. S., and Wang, B. (1996a). The hotspot effect in heterogeneousvegetation canopies and performances of various hotspot models. RemoteSensing Rev. 14, 283–332. doi:10.1080/02757259609532323
Qin,W.H., Goel, N. S., andWang, B. Q. (1996b). Estimation of leaf size from hotspotobservations. Remote Sensing a Sust. Future Vols I - Iv, 1645–1647. Igarss ’96 -1996 International Geoscience and Remote Sensing Symposium.
Richard, D. T., Glenar, D. A., Stubbs, T. J., Davis, S. S., and Colaprete, A. (2011).Light scattering by complex particles in the Moon’s exosphere: Toward ataxonomy of models for the realistic simulation of the scattering behavior oflunar dust. Planet. Space Sci. 59, 1804–1814. doi:10.1016/j.pss.2011.01.003
Robinson, T. D., Meadows, V. S., and Crisp, D. (2010). Detecting Oceans onExtrasolar Planets Using the Glint Effect. ApJ, 721, L67–L71. doi:10.1088/2041-8205/721/1/L67
Ross, J. K., and Marshak, A. L. (1988). Calculation of canopy bidirectionalreflectance using the Monte Carlo method. Remote Sensing Environ. 24,213–225. doi:10.1016/0034-4257(88)90026-0
Ross, J., and Marshak, A. (1991). Influence of the Crop Architecture Parameters onCrop Brdf - a Monte-Carlo Simulation. Phys. Measurements Signatures RemoteSensing 1 and 2, 357–360.
Sagan, C., Thompson, W. R., Carlson, R., Gurnett, D., and Hord, C. (1993). Asearch for life on Earth from the Galileo spacecraft. Nature 365, 715–721.doi:10.1038/365715a0
Saleska, S. R., Wu, J., Guan, K., Araujo, A. C., Huete, A., Nobre, A. D., et al. (2016).Dry-season greening of Amazon forests. Nature 531, E4–E5. doi:10.1038/nature16457
Samanta, A., Knyazikhin, Y., Xu, L., Dickinson, R. E., Fu, R., Costa, M. H., et al.(2012). Seasonal changes in leaf area of Amazon forests from leaf flushing andabscission. J. Geophys. Res. 117, G01015. doi:10.1029/2011JG001818
Schull, M. A., Knyazikhin, Y., Xu, L., Samanta, A., Carmona, P. L., Lepine, L., et al.(2011). Canopy spectral invariants, Part 2: Application to classification of foresttypes from hyperspectral data. J. Quantitative Spectrosc. Radiative Transfer 112,736–750. doi:10.1016/j.jqsrt.2010.06.004
Song, W., Knyazikhin, Y., Wen, G., Marshak, A., Mõttus, M., Yan, K., et al.(2018). Implications of Whole-Disc DSCOVR EPIC Spectral Observationsfor Estimating Earth’s Spectral Reflectivity Based on Low-Earth-Orbitingand Geostationary Observations. Remote Sensing 10, 1594. doi:10.3390/rs10101594
Speyerer, E. J., Povilaitis, R. Z., Robinson, M. S., Thomas, P. C., and Wagner, R. V.(2016). Quantifying crater production and regolith overturn on the Moon withtemporal imaging. Nature 538, 215–218. doi:10.1038/nature19829
Torres, O., Bhartia, P. K., Taha, G., Jethva, H., Das, S., Colarco, P., et al. (2020).Stratospheric Injection of Massive Smoke Plume from Canadian Boreal Fires in2017 as Seen by DSCOVR-EPIC, CALIOP, and OMPS-LP Observations.J. Geophys. Res. Atmos. 125, 2020jd032579. doi:10.1029/2020JD032579
Tsuda, T. T., Hozumi, Y., Kawaura, K., Hosokawa, K., Suzuki, H., and Nakamura,T. (2018). Initial report on polar mesospheric cloud observations by Himawari-8. Atmos. Meas. Tech. 11, 6163–6168. doi:10.5194/amt-11-6163-2018
Varnai, T., Kostinski, A. B., and Marshak, A. (2020). Deep space observations ofsun glints from marine ice clouds. IEEE Geosci. Remote Sensing Lett. 17 (5),735–739. doi:10.1109/LGRS.2019.2930866
Walker, J. (2021). Earth and Moon Viewer. https://www.fourmilab.ch/cgi-bin/Earth.
Williams, D. M., and Gaidos, E. (2008). Detecting the glint of starlight onthe oceans of distant planets. Icarus 195, 927–937. doi:10.1016/j.icarus.2008.01.002
Yang, B., Knyazikhin, Y., Mõttus, M., Rautiainen, M., Stenberg, P., Yan, L., et al.(2017). Estimation of leaf area index and its sunlit portion fromDSCOVR EPICdata: Theoretical basis. Remote Sensing Environ. 198, 69–84. doi:10.1016/j.rse.2017.05.033
Conflict of Interest: Authors NG, MD, and AV are employed by Science Systemsand Applications, Inc.
The remaining authors declare that the research was conducted in the absence ofany commercial or financial relationships that could be construed as a potentialconflict of interest.
Publisher’s Note: All claims expressed in this article are solely those of the authorsand do not necessarily represent those of their affiliated organizations, or those ofthe publisher, the editors and the reviewers. Any product that may be evaluated inthis article, or claim that may be made by its manufacturer, is not guaranteed orendorsed by the publisher.
Copyright © 2021 Gorkavyi, Carn, DeLand, Knyazikhin, Krotkov, Marshak, Myneniand Vasilkov. This is an open-access article distributed under the terms of theCreative Commons Attribution License (CC BY). The use, distribution orreproduction in other forums is permitted, provided the original author(s) andthe copyright owner(s) are credited and that the original publication in this journal iscited, in accordance with accepted academic practice. No use, distribution orreproduction is permitted which does not comply with these terms.
Frontiers in Remote Sensing | www.frontiersin.org August 2021 | Volume 2 | Article 72407411
Gorkavyi et al. Earth Imaging From the Moon