Earnings Summary November 6, 2014s2.q4cdn.com/240635966/files/doc_presentations/3Q/GNW-3Q...Genworth...
37
©2014 Genworth Financial, Inc. All rights reserved. Earnings Summary November 6, 2014 Third Quarter 2014
Transcript of Earnings Summary November 6, 2014s2.q4cdn.com/240635966/files/doc_presentations/3Q/GNW-3Q...Genworth...

©2014 Genworth Financial, Inc. All rights reserved.
Earnings Summary November 6, 2014
Third Quarter 2014

1 Genworth 3Q14 Earnings Call Presentation - November 6, 2014
This presentation contains certain “forward-looking statements” within the meaning of the United States Private Securities Litigation Reform Act of 1995. Forward-looking statements may be identified by words such as “expects,” “anticipates,” “intends,” “plans,” “believes,” “seeks,” “estimates,” “will” or words of similar meaning and include, but are not limited to, statements regarding the outlook for Genworth Financial, Inc.’s (Genworth) and its consolidated subsidiaries’ future business and financial performance. Forward-looking statements are based on management’s current expectations and assumptions, which are subject to inherent uncertainties, risks and changes in circumstances that are difficult to predict. Actual outcomes and results may differ materially due to global political, economic, business, competitive, market, regulatory and other factors and risks, including those discussed at the end of this presentation, as well as in the risk factors section of Genworth’s Annual Report on Form 10-K, filed with the United States Securities and Exchange Commission (SEC) on March 3, 2014 and as updated in Genworth’s Form 10-Q filed with the SEC on July 30, 2014. Genworth undertakes no obligation to publicly update any forward-looking statement, whether as a result of new information, future developments or otherwise.
Non-GAAP And Other Items
All financial data is as of September 30, 2014 unless otherwise noted. For additional information, please see Genworth’s third quarter of 2014 earnings release and financial supplement posted at genworth.com. For important information regarding the use of non-GAAP and selected operating performance measures, see the Appendix. Unless otherwise noted, all references in this presentation to net income (loss) should be read as net income (loss) available to Genworth’s common stockholders.
Cautionary Note Regarding Forward-Looking Statements
Portions of this presentation should be used in conjunction with the accompanying audio or call transcript.

2 Genworth 3Q14 Earnings Call Presentation - November 6, 2014
Strategic Priorities Update Long Term Care Insurance (LTC) Three Part Strategy Continuing To Show Results
Results Continued To Benefit From Higher Incremental Premium & Reduced Benefits 47 State Approvals (As Of 10/31/14) As Part Of 2012 In Force Premium Rate Increases 22 State Approvals (As Of 10/31/14) For Choice 2 Premium Rate Increases Filed In 2013 New Product Launched In July 2014
Targeted Investment In Distribution Combined With Active Engagement In LTC Public Policy/Regulatory Changes
Transitioning Life Insurance Sales To A Broader Set Of Competitive Universal Life, Indexed Universal Life & Linked Benefit Products; Working To Balance Sales Between Term & Permanent Life Insurance
Continued Focus On Executing U.S. Mortgage Insurance (U.S. MI) Strategy Draft GSE1 Eligibility Guidelines Issued In July…Genworth Intends To Meet Additional Capital Requirements By Anticipated Effective Date Of June 30, 2015 Primarily Through Reinsurance
1Government Sponsored Enterprises

3 Genworth 3Q14 Earnings Call Presentation - November 6, 2014
3Q14 Key Points $345MM Unfavorable After-Tax Impact To Net Operating Income (Loss) From Completion Of LTC Claim Reserves Review
$35MM Unfavorable After-Tax Correction Of A LTC Claim Reserve Calculation
$34MM Unfavorable After-Tax Accruals Impacting Net Operating Income (Loss) Principally In Connection With The Settlement Agreement With Bank Of America As Well As Discussions With Another Servicer In An Effort To Resolve Pending Disputes Over Loss Mitigation Activities In U.S. MI
$517MM Unfavorable After-Tax Impact To Net Income (Loss) From Completion Of Goodwill Testing Analysis Impacting Life & LTC Businesses
Life Insurance Results Impacted By High Mortality, Offset In Part By Solid Performance In Fixed Annuities
Loss Ratio Of 21% In Both Canada & Australia; Solid Capital Positions In Canada & Australia
U.S. MI Risk To Capital In GMICO1 Of ~14.8:12
1Genworth Mortgage Insurance Corporation; 2Company Estimate For 3Q14, Due To Timing Of The Filing Of Statutory Statements
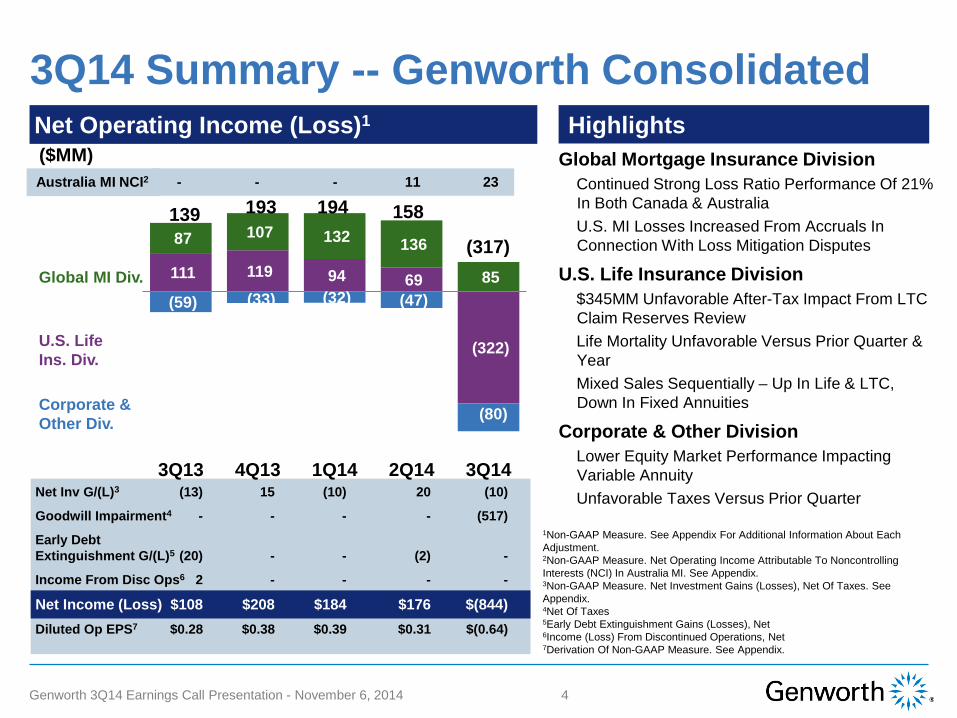
Net Inv G/(L)3 (13) 15 (10) 20 (10)
Goodwill Impairment4 - - - - (517)
Early Debt Extinguishment G/(L)5 (20) - - (2) -
Income From Disc Ops6 2 - - - -
Net Income (Loss) $108 $208 $184 $176 $(844) Diluted Op EPS7 $0.28 $0.38 $0.39 $0.31 $(0.64)
4 Genworth 3Q14 Earnings Call Presentation - November 6, 2014
111 119 94 69
(322)
87 107 132 136
85 (59) (33) (32) (47)
(80)
3Q13 4Q13 1Q14 2Q14 3Q14
193 194 158
(317)
3Q14 Summary -- Genworth Consolidated Net Operating Income (Loss)1 Highlights ($MM)
1Non-GAAP Measure. See Appendix For Additional Information About Each Adjustment. 2Non-GAAP Measure. Net Operating Income Attributable To Noncontrolling Interests (NCI) In Australia MI. See Appendix. 3Non-GAAP Measure. Net Investment Gains (Losses), Net Of Taxes. See Appendix. 4Net Of Taxes 5Early Debt Extinguishment Gains (Losses), Net 6Income (Loss) From Discontinued Operations, Net 7Derivation Of Non-GAAP Measure. See Appendix.
Global Mortgage Insurance Division Continued Strong Loss Ratio Performance Of 21% In Both Canada & Australia U.S. MI Losses Increased From Accruals In Connection With Loss Mitigation Disputes
U.S. Life Insurance Division $345MM Unfavorable After-Tax Impact From LTC Claim Reserves Review Life Mortality Unfavorable Versus Prior Quarter & Year Mixed Sales Sequentially – Up In Life & LTC, Down In Fixed Annuities
Corporate & Other Division Lower Equity Market Performance Impacting Variable Annuity Unfavorable Taxes Versus Prior Quarter
Corporate & Other Div.
Global MI Div.
U.S. Life Ins. Div.
139
Australia MI NCI2 - - - 11 23

(3) 6
33 39
(2)
61 66
62 57
48
41 44
41 47
46
(12) (9) (4) (7) (7)
3Q13 4Q13 1Q14 2Q14 3Q14
87
Net Operating Income (Loss)
5 Genworth 3Q14 Earnings Call Presentation - November 6, 2014
3Q14 Summary -- Global MI Highlights
($MM)
Canada Australia
United States Other Countries
Operating Income Down Versus 2Q14; Impact From Accruals In Connection With Loss Mitigation Disputes In U.S. MI & Full Quarter Impact From Australia Minority IPO
Reported Flow NIW1 Up Sequentially In Canada, Australia & United States
3Q14 Operating Income Reflected: Canada – Higher New Delinquencies Net Of Cures Sequentially; Lower Expenses Australia – Earnings Impacted By Minority IPO ($12MM Versus Prior Quarter & $23MM Versus Prior Year); New Delinquencies Seasonally Lower & Cures Higher; Lower Paid Claims Versus Prior Year United States – $34MM After-Tax Impact From Accruals In Connection With Loss Mitigation Disputes; New Delinquencies Seasonally Higher; Less Favorable Net Cures & Aging Of Existing Delinquencies
107
132 136
1New Insurance Written
Australia MI NCI - - - 11 23
85

6 Genworth 3Q14 Earnings Call Presentation - November 6, 2014
Canada
138 137 130 128 130
3Q13 4Q13 1Q14 2Q14 3Q14
30 30 26 15 28
3Q13 4Q13 1Q14 2Q14 3Q14
Premiums
Benefits & Other Changes In Policy Reserves
($MM)
($MM)
Flow NIW 6,000 5,000 2,900 5,000 6,800
Bulk NIW 3,900 2,400 2,900 7,500 5,600
Loss Ratio 22% 22% 20% 12% 21%
Total Delqs (#) 1,778 1,830 1,860 1,703 1,708
Total Delinquencies Up Slightly Sequentially
Loss Ratio Up Sequentially From Higher New Delinquencies Net Of Cures & Down Versus The Prior Year Reflecting Strong Credit Quality Of Recent Books & Overall Stable Economic Environment
Full Year 2014 Loss Ratio Expected To Be In Range Of 15-25%
Relatively Smaller 2010 & Subsequent Books Of Business
Unfavorable $6MM Impact From Foreign Exchange Versus Prior Year
Flow NIW Increased Sequentially From A Seasonally Larger Originations Market & From The Prior Year From A Larger Originations Market

7 Genworth 3Q14 Earnings Call Presentation - November 6, 2014
Australia
98 98 97 102 105
3Q13 4Q13 1Q14 2Q14 3Q14
29 21 17 24 22
3Q13 4Q13 1Q14 2Q14 3Q14
Premiums
Benefits & Other Changes In Policy Reserves
($MM)
($MM)
Flow NIW 8,000 9,000 7,800 7,900 8,100
Bulk NIW 100 - - - 1,000
Loss Ratio 31% 21% 17% 23% 21%
Total Delqs (#) 5,454 4,980 5,070 5,405 5,300
New Delqs (#) 2,901 2,383 2,689 2,913 2,734
Paid Claims (#) 510 581 462 419 350
Cures (#) 2,757 2,276 2,137 2,159 2,489
Total Delinquencies Down 2% From Prior Quarter & Loss Ratio Down 2 Points From Prior Quarter; Seasonally Lower New Delinquencies & Stronger Cures
Full Year 2014 Loss Ratio Expected To Be In Range Of 20-25%
Full Year 2014 Earnings Expected To Be Modestly Above Prior Year Before The Impact Of NCI
Favorable $2MM Impact From Foreign Exchange Versus Prior Year; Premiums Up From Seasoning Of Newer Books
Stable MI Market Size
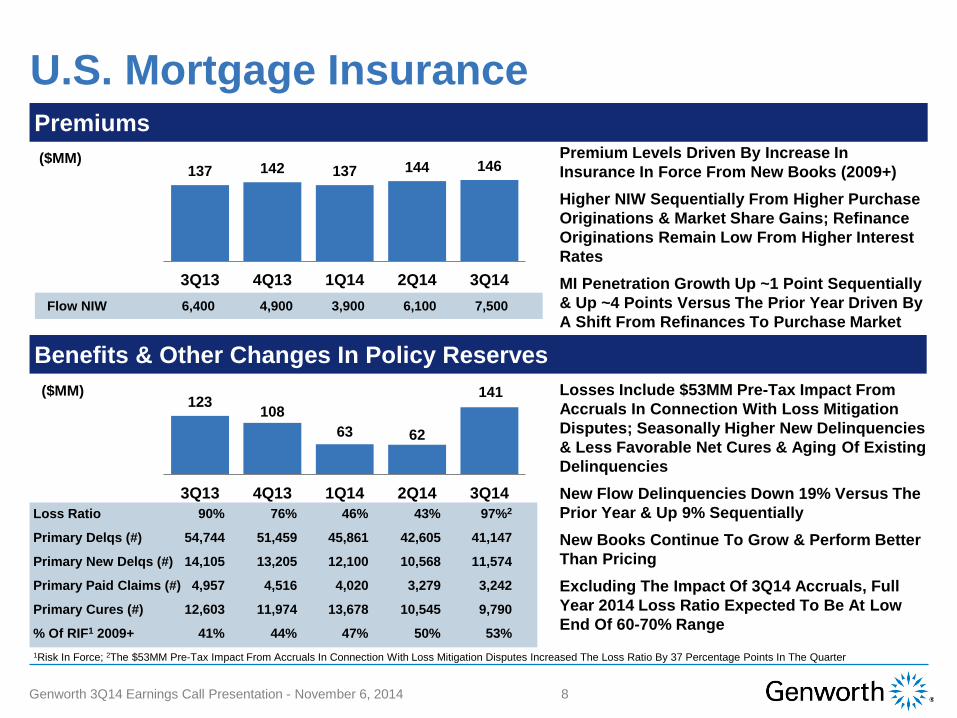
Loss Ratio 90% 76% 46% 43% 97%2
Primary Delqs (#) 54,744 51,459 45,861 42,605 41,147
Primary New Delqs (#) 14,105 13,205 12,100 10,568 11,574
Primary Paid Claims (#) 4,957 4,516 4,020 3,279 3,242
Primary Cures (#) 12,603 11,974 13,678 10,545 9,790
% Of RIF1 2009+ 41% 44% 47% 50% 53%
8 Genworth 3Q14 Earnings Call Presentation - November 6, 2014
U.S. Mortgage Insurance
137 142 137 144 146
3Q13 4Q13 1Q14 2Q14 3Q14
123 108 63 62
141
3Q13 4Q13 1Q14 2Q14 3Q14
Premiums
Benefits & Other Changes In Policy Reserves
($MM)
($MM)
Flow NIW 6,400 4,900 3,900 6,100 7,500
1Risk In Force; 2The $53MM Pre-Tax Impact From Accruals In Connection With Loss Mitigation Disputes Increased The Loss Ratio By 37 Percentage Points In The Quarter
Losses Include $53MM Pre-Tax Impact From Accruals In Connection With Loss Mitigation Disputes; Seasonally Higher New Delinquencies & Less Favorable Net Cures & Aging Of Existing Delinquencies New Flow Delinquencies Down 19% Versus The Prior Year & Up 9% Sequentially New Books Continue To Grow & Perform Better Than Pricing Excluding The Impact Of 3Q14 Accruals, Full Year 2014 Loss Ratio Expected To Be At Low End Of 60-70% Range
Premium Levels Driven By Increase In Insurance In Force From New Books (2009+) Higher NIW Sequentially From Higher Purchase Originations & Market Share Gains; Refinance Originations Remain Low From Higher Interest Rates MI Penetration Growth Up ~1 Point Sequentially & Up ~4 Points Versus The Prior Year Driven By A Shift From Refinances To Purchase Market

9 Genworth 3Q14 Earnings Call Presentation - November 6, 2014
Global MI -- Capital Adequacy Comments
Australia – PCA2
Canada – MCT3
U.S. MI – RTC4
Consolidated GMICO
Regulatory Capital Ratios
1Company Estimate For 3Q14, Due To Timing Of The Filing Of Statutory Statements 2Prescribed Capital Amount 3Minimum Capital Test 4Risk-To-Capital
International MI Segment Dividends Paid To Holding Company Of $42MM Through 3Q14
Australia PCA Ratio Impacted By Positive Statutory Income Target PCA Ratio Of 132% To 144%
Canada Sequential MCT Ratio Decrease From Dividends Paid To Canadian Holding Company Partially Offset By Statutory Income Target MCT Ratio Of 220%
U.S. MI Capital Ratio Increase From Accruals In Connection With Loss Mitigation Disputes, FX Impact On Affiliate Investments & Increased RIF From New Business
3Q13 4Q13 1Q14 2Q14
218%
135%
22.4 23.2
223%
148%
19.5 19.3
229%
147%
18.7 18.4
230%
154%
14.6 14.0
3Q141
224%
156%
15.4 14.8

16 21 27 24 26 41 42 46
6
(361)
54 56 21 39 13
3Q13 4Q13 1Q14 2Q14 3Q14
10 Genworth 3Q14 Earnings Call Presentation - November 6, 2014
3Q14 Summary -- U.S. Life Insurance Net Operating Income (Loss) Highlights ($MM)
Life
Long Term Care
Fixed Annuities
111
3Q14 Operating Loss Reflected: Life Insurance – Mortality Unfavorable Versus The Prior Quarter; Favorable Unlocking Offset By Lower Variable Investment Income; $9MM Unfavorable Charges LTC – $345MM Unfavorable After-Tax Impact From Completion Of Claim Reserves Review; $35MM Unfavorable After-Tax Impact From A Correction Of A Calculation For Benefit Utilization For Policies With A Benefit Inflation Option; $3MM Sequential Decrease From In Force Rate Action Fixed Annuities – Favorable Investment Income From Bond Calls & Limited Partnerships & Higher Spread Income From Higher Level Of Account Values Versus The Prior Year
119 94
69 (322)

138 139 128 137 123 5.48% 5.44% 5.04%
5.38% 4.77%
3Q13 4Q13 1Q14 2Q14 3Q14
11 Genworth 3Q14 Earnings Call Presentation - November 6, 2014
Life Insurance
354 347 351 344 377
3Q13 4Q13 1Q14 2Q14 3Q14
Premiums & Insurance & Investment Product Fees/Other
Net Investment Income & Yield1
($MM)
($MM)
Benefits & Other Changes In Policy Reserves
160 241
281 257 293
3Q13 4Q13 1Q14 2Q14 3Q14
($MM)
1Non-GAAP Measure, See Appendix (Reconciliation Of Reported Yield – U.S. Life Insurance Division). Yields Exclude Captive Reinsurance
Unfavorable Impact In 3Q14 From Prepayment Speed Adjustment; Favorable Impact In 2Q14 Low Rate Environment & Variability In Limited Partnership & Bond Call Income Impact Yield
Recapture Of Reinsurance Treaty Favorably Impacted Premiums In 3Q14
Mortality Unfavorable Versus Prior Quarter & Prior Year
3Q14 Favorable Annual Unlocking Of Interest & Mortality Assumptions Partially Offsets Reserve Increase From Recapture Of Reinsurance Treaty
3Q13 Included A Favorable Correction To Term Universal Life Reserves & A Favorable Annual Unlock Of Interest & Mortality Assumptions

282 291 290 292 293
5.61% 5.70% 5.59% 5.50% 5.36%
3Q13 4Q13 1Q14 2Q14 3Q14
12 Genworth 3Q14 Earnings Call Presentation - November 6, 2014
Long Term Care Insurance
Benefits & Other Changes In Policy Reserves & Loss Ratio (%)
659 701 664 735
1,313
3Q13 4Q13 1Q14 2Q14 3Q14
Net Investment Income & Yield
564 582 565 577 587
3Q13 4Q13 1Q14 2Q14 3Q14
Premiums
($MM)
($MM)
($MM)
1$209MM YTD Pre-Tax Impact From Rate Action Announced In 3Q12 Includes ($8MM) Impact From Commissions, Premium Tax & Other Adjustments.
$91MM YTD Pre-Tax Benefit From In Force Premium Rate Action1
Low Interest Rate Environment & Variability In Limited Partnership & Bond Call Income Impacting Yield
$126MM YTD Pre-Tax Benefit From In Force Premium Rate Action1
$531MM Pre-Tax Increase From Claim Reserves Review $54MM Pre-Tax Increase From Correction Of Reserve Calculation For Policies With A Benefit Inflation Option
63.7% 68.2% 63.3% 73.2% 173.0%

13 Genworth 3Q14 Earnings Call Presentation - November 6, 2014
2012 LTC In Force Premium Rate Increase ($MM)
Earnings Impact From 2012 Announced Rate Action
1Q13 2Q13 3Q13 4Q13 2013 1Q14 2Q14 3Q14 2014E
Earned Premiums 2 7 13 20 42 24 32 35 120-140
Reserve Changes 4 14 23 35 76 46 44 36
Commissions & Premium Taxes2
- (1) (1) (2) (4) (2) (3) (3)
Pre-Tax Income 6 20 35 53 114 68 73 68
Taxes (35% Rate) (2) (7) (12) (19) (40) (24) (26) (24)
Net Operating Income Impact
4 13 23 34 74 44 47 44 150-175
2Related To Incremental Earned Premiums
Premium Expectation From 2012 Announced Rate Action1
1Includes Assumptions For Waiver Of Premium & Policyholder Behavior
~190-200 ~60-100
Approvals CA + Second Round Filings
+ 47 States
31 States
=
Expectation When Fully
Implemented ~250-300

14 Genworth 3Q14 Earnings Call Presentation - November 6, 2014
Fixed Annuities
142 155 154 153 154
3Q13 4Q13 1Q14 2Q14 3Q14
Net Investment Spread1
SPDA2 Spread 1.47% 1.61% 1.70% 1.61% 1.70%
SPIA3 Spread 0.97% 1.36% 1.03% 1.21% 1.17%
($MM)
1Net Investment Income Less Paid Interest Credited 2Single Premium Deferred Annuity; Excludes Fixed Indexed Annuity 3Single Premium Immediate Annuity; Includes Both Paid & Unpaid Interest Credited 4Excludes Incurred But Not Reported; Mortality Gain/Loss Represents The Pre-Tax Income Impact Of The Product Line's Actual Mortality Experience Compared To The Mortality Assumptions Embedded In The Reserves Of The Product
Benefits & Other Changes In Policy Reserves & SPIA Mortality
105 94 85 95 116
3Q13 4Q13 1Q14 2Q14 3Q14
SPIA Mortality G/(L) 4 (8) (8) (1) (8) (6)
($MM)
Fixed Annuity Spreads Impacted By Variability In Limited Partnership & Bond Call Income
Excluding This Variability, Fixed Annuity Spreads In Line With Prior Quarter & Prior Year
Increased Level Of Life Contingent Sales Primary Driver Versus Prior Quarter & Prior Year; Mortality Slightly Improved Versus Prior Quarter & Prior Year

15 Genworth 3Q14 Earnings Call Presentation - November 6, 2014
GAAP Goodwill Impairment Testing
Decrease In New Business Value Resulted In Failing Step 1 (Fair Value < Book Value) Due To Small Margin In Prior Year’s Evaluation
Sales Projections Were Lowered – Focus On Transitioning To Higher Return Permanent Products, Including Universal Life, Indexed Universal Life &
Linked Benefit Products – Sales Of Permanent Products Expected To Increase Over Time – Reduced Sales Projections/Dependence On Lower Margin, Capital Intensive Term Life Insurance Products
Recorded Goodwill > Implied Goodwill, Resulting In $350 Million Impairment
Has Not Passed Step 1 Goodwill Test For Several Years (Fair Value < Book Value); Relied Upon New Business Value To Support Goodwill
New Business Value Decreased To Reflect: – Lower Overall Sales As A Result Of Reduced LTC Industry Market Size & Transition To Higher Return Products – Moderate Growth From 2014 Sales Levels, Growth Does Not Reflect Branding Benefits Or Increase In Market Size – Lower Margins Resulting From Incorporating Higher Morbidity Assumptions From Claims Reserve Review – Higher Expected Use Of Reinsurance On New Products
Recorded Goodwill > Implied Goodwill, Resulting In $200 Million Impairment ($167 Million After-Tax)
Life Insurance
Long Term Care Insurance
Remaining Goodwill Balance Supported By New Business Value

16 Genworth 3Q14 Earnings Call Presentation - November 6, 2014
U.S. Life Company Statutory Results Unassigned Surplus
($MM)
259
440 444
563
~2901
3Q13 4Q13 1Q14 2Q14 3Q14
U.S. Life Co RBC2 Ratio 453% 487% 480% 492% ~445%1
Dividends To Hold Co - 75 - - -
After-Tax Stat Op Inc. (Loss) 3 226 451 47 267 (298)1
After-Tax Stat Net Inc. (Loss)4 137 416 38 274 (290)1
1Company Estimate For 3Q14, Due To Timing Of The Filing Of Statutory Statements 2Risk-Based Capital 3Consolidated Life Companies; Statutory Annual Statement Line 33 4Consolidated Life Companies; Statutory Annual Statement Line 35
Highlights Unassigned Surplus Decreased ~$260MM, RBC Ratio Decreased ~45 Points & Net Income Decreased ~$325MM Due To Impact Of LTC Claims Reserve Review & Calculation Correction
Excluding Impact Of LTC Claims Reserve Review & Calculation Correction, In Force Capital Generation Decreased Due To Higher LTC Incurred Claims, Unfavorable Mortality Experience In Life Insurance & Lower Variable Investment Income
2Q14 Statutory Operating Income Reflected Life Insurance Reinsurance Transaction (~$90MM), Intercompany Dividends (~$100MM)
17 Genworth 3Q14 Earnings Call Presentation - November 6, 2014
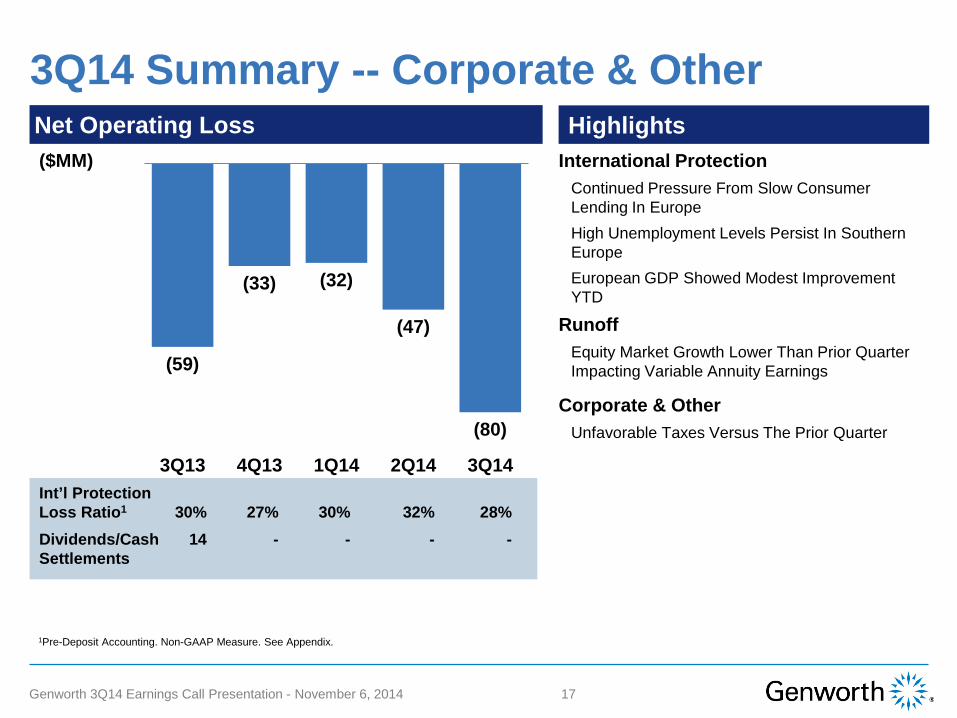
(59)
(33) (32)
(47)
(80)
3Q13 4Q13 1Q14 2Q14 3Q14
3Q14 Summary -- Corporate & Other
($MM)
1Pre-Deposit Accounting. Non-GAAP Measure. See Appendix.
Int’l Protection Loss Ratio1 30% 27% 30% 32% 28% Dividends/Cash 14 - - - - Settlements
International Protection Continued Pressure From Slow Consumer Lending In Europe High Unemployment Levels Persist In Southern Europe European GDP Showed Modest Improvement YTD
Runoff Equity Market Growth Lower Than Prior Quarter Impacting Variable Annuity Earnings
Corporate & Other Unfavorable Taxes Versus The Prior Quarter
Net Operating Loss Highlights
18 Genworth 3Q14 Earnings Call Presentation - November 6, 2014
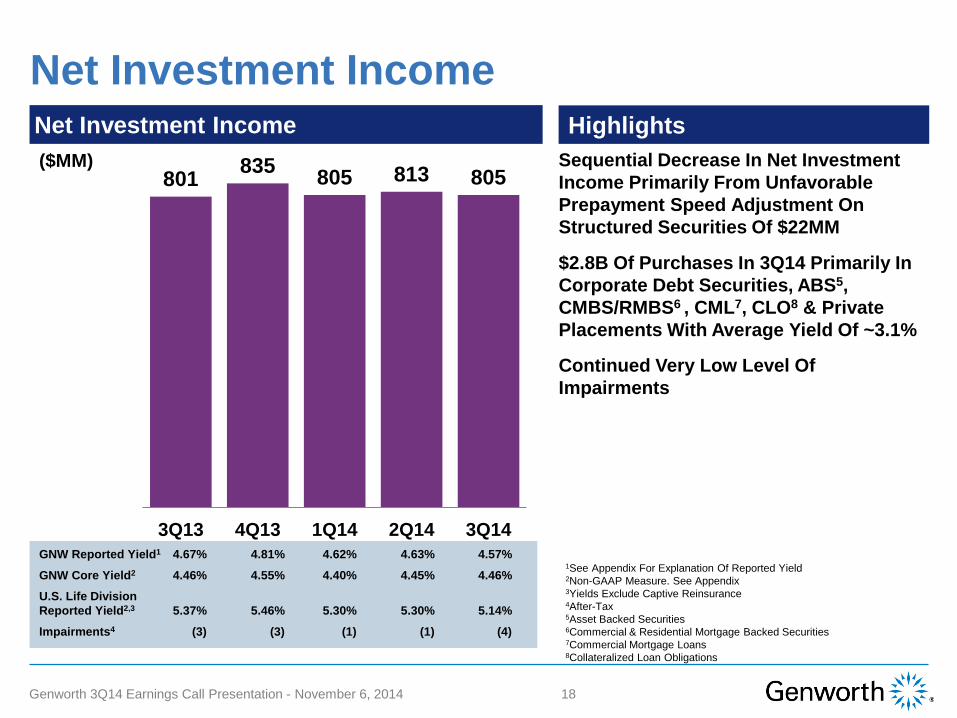
Net Investment Income
801 835 805 813 805
3Q13 4Q13 1Q14 2Q14 3Q14
($MM)
GNW Reported Yield1 4.67% 4.81% 4.62% 4.63% 4.57%
GNW Core Yield2 4.46% 4.55% 4.40% 4.45% 4.46%
U.S. Life Division Reported Yield2,3 5.37% 5.46% 5.30% 5.30% 5.14%
Impairments4 (3) (3) (1) (1) (4)
Highlights
1See Appendix For Explanation Of Reported Yield 2Non-GAAP Measure. See Appendix 3Yields Exclude Captive Reinsurance 4After-Tax 5Asset Backed Securities 6Commercial & Residential Mortgage Backed Securities 7Commercial Mortgage Loans 8Collateralized Loan Obligations
Sequential Decrease In Net Investment Income Primarily From Unfavorable Prepayment Speed Adjustment On Structured Securities Of $22MM
$2.8B Of Purchases In 3Q14 Primarily In Corporate Debt Securities, ABS5, CMBS/RMBS6 , CML7, CLO8 & Private Placements With Average Yield Of ~3.1%
Continued Very Low Level Of Impairments
Net Investment Income

19 Genworth 3Q14 Earnings Call Presentation - November 6, 2014
Holding Company Cash & Liquid Assets1
1,2232 (63) (22) 1,1382
6/30/2014 DebtInterest
Exp.
Hold. Co.Net Other
Items
9/30/2014
Highlights ($MM)
1.5X Debt Interest Expense
Variance (85)
1Holding Company Cash & Liquid Assets Comprises Assets Held In Genworth Holdings, Inc. (The Issuer Of Outstanding Public Debt) Which Is A Wholly-Owned Subsidiary Of Genworth Financial, Inc. 2Comprises Cash & Cash Equivalents Of $1,073MM & U.S. Government Bonds Of $150MM As Of 6/30/14 & Comprises Cash & Cash Equivalents Of $988MM & U.S. Government Bonds Of $150MM As Of 9/30/14 3Non-GAAP Measure. See Appendix.
Target Holding Company Cash & Liquid Assets Of 1.5X Interest Coverage Plus $350MM Buffer Maintained At Quarter Ends
Leverage Ratio Increased To 25.1%3 From 23.9%3 Due To Decrease In Equity Primarily From LTC Claim Reserves Review & Goodwill Impacts
~$720MM Buffer
Cash & Liquid Assets Roll Forward

20 Genworth 3Q14 Earnings Call Presentation - November 6, 2014
2014 Goals Recap: Holding Company & Corporate & Other Division
1Holding Company Cash & Liquid Assets Comprises Assets Held In Genworth Holdings, Inc. (The Issuer Of Outstanding Public Debt) Which Is A Wholly-Owned Subsidiary Of Genworth Financial, Inc.; 2Comprises Cash & Cash Equivalents Of $988MM & U.S. Government Bonds Of $150MM; 3Non-GAAP Measure. See Appendix.
Holding Company Cash & Liquid Assets1: Exceed 1.5X Interest Coverage Plus Risk Buffer Of $350MM
$1,138MM2 ; $720MM In Excess Of 1.5X Interest Coverage
2014 Goals & Milestones 2014 Results
25.1%3; Not Expected To Meet Goal Given Decline In Equity
International Protection Dividends Of $5-$10MM
3Q
Hol
ding
Com
pany
D
ivid
ends
No Dividend Paid In 3Q14; Dividend Plan On Track
24% Leverage Ratio At Year End 20143
3QYTD Observations
21 Genworth 3Q14 Earnings Call Presentation - November 6, 2014
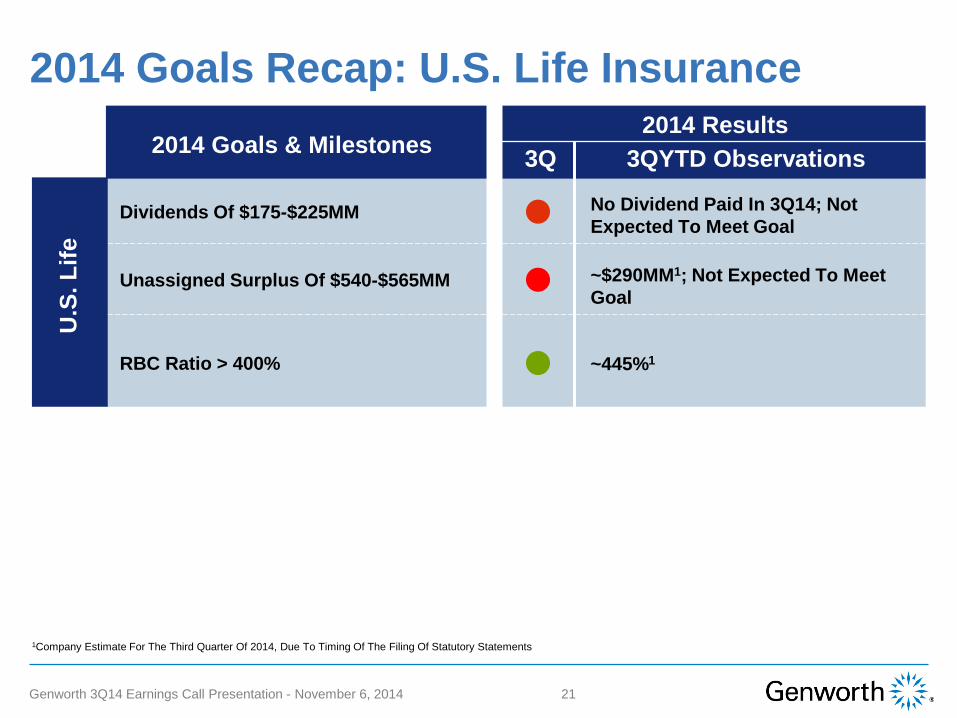
2014 Goals Recap: U.S. Life Insurance
1Company Estimate For The Third Quarter Of 2014, Due To Timing Of The Filing Of Statutory Statements
Dividends Of $175-$225MM No Dividend Paid In 3Q14; Not Expected To Meet Goal
2014 Goals & Milestones 2014 Results
~$290MM1; Not Expected To Meet Goal
Unassigned Surplus Of $540-$565MM
3Q
~445%1 RBC Ratio > 400%
U.S
. Life
3QYTD Observations

22 Genworth 3Q14 Earnings Call Presentation - November 6, 2014
2014 Goals Recap: Global MI
Dividends Of $70-$110MM (Revised From $150-$225MM Due To Australia MI IPO)
$42MM YTD; Revised Dividend Plan On Track
2014 Goals & Milestones 2014 Results
~224%1 Canada MCT Of 220% (Revised From In Excess Of 190% After Consultation With Regulator)
$250-$350MM Loss Mitigation Savings
3Q 3QYTD Observations
~156%1 Australia PCA Range Of 132% To 144%2
Annual New Flow Delinquencies Down ~15-20%
50-55% Of Risk In Force Composed Of 2009+ Books
Combined Risk-To-Capital Ratio Of <20:1 (Subject To Final GSE Capital Requirements)
Inte
rnat
iona
l MI
U.S
. MI
$283MM; Plan On Track
(19)%
~53%; Plan On Track
15.4:1
1Company Estimate For 3Q14, Due To Timing Of The Filing Of Statutory Statements; 2Revised In 1Q14 From In Excess Of 135%
23 Genworth 3Q14 Earnings Call Presentation - November 6, 2014
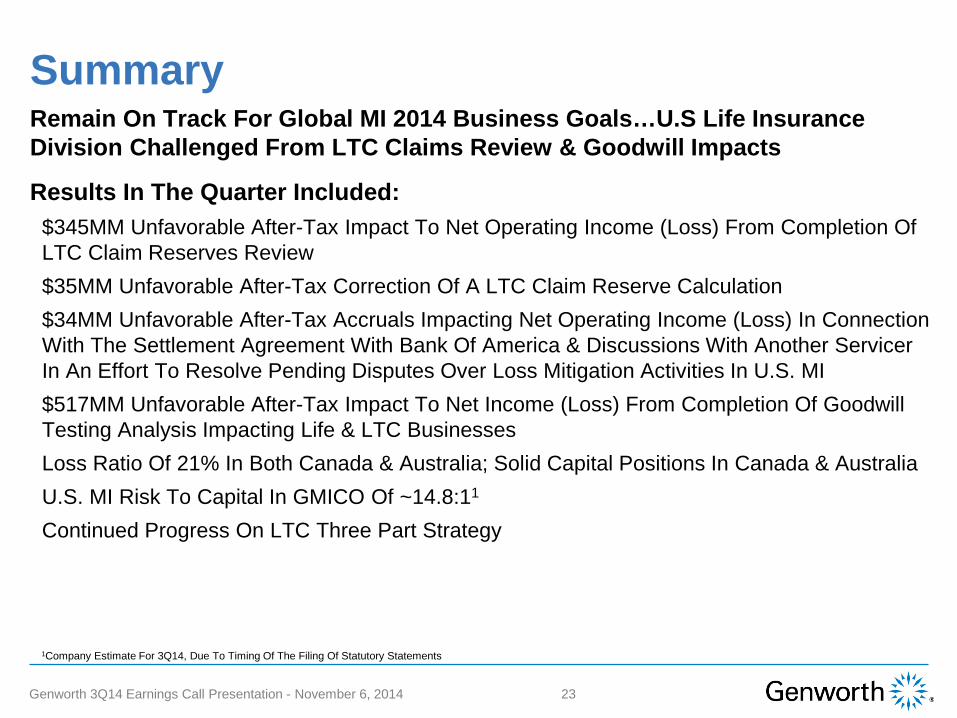
Summary
1Company Estimate For 3Q14, Due To Timing Of The Filing Of Statutory Statements
Remain On Track For Global MI 2014 Business Goals…U.S Life Insurance Division Challenged From LTC Claims Review & Goodwill Impacts
Results In The Quarter Included: $345MM Unfavorable After-Tax Impact To Net Operating Income (Loss) From Completion Of LTC Claim Reserves Review $35MM Unfavorable After-Tax Correction Of A LTC Claim Reserve Calculation $34MM Unfavorable After-Tax Accruals Impacting Net Operating Income (Loss) In Connection With The Settlement Agreement With Bank Of America & Discussions With Another Servicer In An Effort To Resolve Pending Disputes Over Loss Mitigation Activities In U.S. MI $517MM Unfavorable After-Tax Impact To Net Income (Loss) From Completion Of Goodwill Testing Analysis Impacting Life & LTC Businesses Loss Ratio Of 21% In Both Canada & Australia; Solid Capital Positions In Canada & Australia U.S. MI Risk To Capital In GMICO Of ~14.8:11 Continued Progress On LTC Three Part Strategy

24 Genworth 3Q14 Earnings Call Presentation - November 6, 2014
Appendix

25 Genworth 3Q14 Earnings Call Presentation - November 6, 2014
Total Genworth Financial, Inc.’s Stockholders’ Equity ($MM) 3Q14 2Q14 1Q14 4Q13 3Q13
U.S. Life Insurance 11,153 11,118 10,602 9,485 9,604
Int’l Mortgage Insurance 3,331 3,454 3,971 3,864 3,967
Canada 1,699 1,746 1,648 1,661 1,686
Australia 1,392 1,443 2,055 1,935 2,008
Other Countries 240 265 268 268 273
U.S. MI 1,652 1,670 1,616 1,568 1,162
Int’l Protection 958 1,040 1,024 1,005 985
Runoff 667 457 488 626 703
Corporate & Other1 (2,596) (1,508) (2,186) (2,155) (1,817)
Total 15,165 16,231 15,515 14,393 14,604
1Includes Value Of Long-Term Borrowings Of Genworth Holdings, Inc.

26 Genworth 3Q14 Earnings Call Presentation - November 6, 2014
Goodwill Is Not Amortized, Required To Be Tested For Impairment
Life & LTC Are Separately Tested For Impairment
Multiple Step Impairment Test Based On Fair Value Compared To Book Value
Step 1: Fair Value < Book Value (Impairment Indicator)
Step 2: Required To Determine Amount Of Goodwill That Would Be Established In Hypothetical Purchase Of The Business (Implied Goodwill)
If Implied Goodwill > Recorded Goodwill = No Impairment If Recorded Goodwill > Implied Goodwill = Goodwill Impairment Recorded For Amount In Excess Of Implied Goodwill
Fair Value Of New Business Primary Driver In Determining Implied Goodwill Highly Dependent On Value Generated From 10 Years Worth Of New Business
GAAP Goodwill Impairment Testing Background
Recoverability Of Goodwill Primarily Based On New Business Value

27 Genworth 3Q14 Earnings Call Presentation - November 6, 2014
Use Of Non-GAAP Measures This presentation includes the non-GAAP1 financial measures entitled "net operating income (loss)" and “operating earnings per share.” Operating earnings per share is derived from net operating income (loss). The chief operating decision maker evaluates segment performance and allocates resources on the basis of net operating income (loss). The company defines net operating income (loss) as income (loss) from continuing operations excluding the after-tax effects of income attributable to noncontrolling interests, net investment gains (losses), goodwill impairments, gains (losses) on the sale of businesses, gains (losses) on the early extinguishment of debt, gains (losses) on insurance block transactions and infrequent or unusual non-operating items. Gains (losses) on insurance block transactions are defined as gains (losses) on the early extinguishment of non-recourse funding obligations, early termination fees for other financing restructuring and/or resulting gains (losses) on reinsurance restructuring for certain blocks of business. The company excludes net investment gains (losses) and infrequent or unusual non-operating items because the company does not consider them to be related to the operating performance of the company's segments and Corporate and Other activities. A component of the company's net investment gains (losses) is the result of impairments, the size and timing of which can vary significantly depending on market credit cycles. In addition, the size and timing of other investment gains (losses) can be subject to the company's discretion and are influenced by market opportunities, as well as asset-liability matching considerations. Goodwill impairments, gains (losses) on the sale of businesses, gains (losses) on the early extinguishment of debt and gains (losses) on insurance block transactions are also excluded from net operating income (loss) because in the company's opinion, they are not indicative of overall operating trends. Other non-operating items are also excluded from net operating income (loss) if, in the company's opinion, they are not indicative of overall operating trends. In the third quarter of 2014, the company recorded goodwill impairments of $350 million, net of taxes, in the life insurance business and $167 million, net of taxes, in the long-term care insurance business. The following transactions were excluded from net operating income (loss) for the periods presented as they related to the loss on the early extinguishment of debt. In the second quarter of 2014, the company paid an early redemption payment of approximately $2 million, net of taxes and portion attributable to noncontrolling interests, related to the early redemption of Genworth MI Canada Inc.'s notes that were scheduled to mature in 2015. In the third quarter of 2013, the company paid a make-whole expense of approximately $20 million, net of taxes, related to the early redemption of Genworth Holdings’ notes that were scheduled to mature in 2015. There were no infrequent or unusual items excluded from net operating income (loss) during the periods presented. While some of these items may be significant components of net income (loss) available to Genworth’s common stockholders in accordance with GAAP, the company believes that net operating income (loss) and measures that are derived from or incorporate net operating income (loss), including net operating income (loss) per common share on a basic and diluted basis, are appropriate measures that are useful to investors because they identify the income (loss) attributable to the ongoing operations of the business. Management also uses net operating income (loss) as a basis for determining awards and compensation for senior management and to evaluate performance on a basis comparable to that used by analysts. However, the items excluded from net operating income (loss) have occurred in the past and could, and in some cases will, recur in the future. Net operating income (loss) and net operating income (loss) per common share on a basic and diluted basis are not substitutes for net income (loss) available to Genworth’s common stockholders or net income (loss) available to Genworth’s common stockholders per common share on a basic and diluted basis determined in accordance with GAAP. In addition, the company's definition of net operating income (loss) may differ from the definitions used by other companies. The appendix of this presentation reflects net operating income (loss) as determined in accordance with accounting guidance related to segment reporting, and a reconciliation of net operating income (loss) of the company’s segments and Corporate and Other activities to net income (loss) available to Genworth’s common stockholders. Adjustments to reconcile net income (loss) attributable to Genworth’s common stockholders and net operating income (loss) assume a 35% tax rate and are net of the portion attributable to noncontrolling interests. Net investment gains (losses) are also adjusted for deferred acquisition costs and other intangible amortization and certain benefit reserves. This presentation also includes non-GAAP financial measures entitled "net income (loss) before net income attributable to noncontrolling interests in the Australia MI business" and "net operating income (loss) before net operating income attributable to noncontrolling interests in the Australia MI business." The company defines net income (loss) before net income attributable to noncontrolling interests in the Australia MI business and net operating income (loss) before net operating income attributable to noncontrolling interests in the Australia MI business as net income (loss) or net operating income (loss), as applicable, adjusted for net income attributable to noncontrolling interests in the Australia MI business but before noncontrolling interests in the Canada MI business. These measures are presented as they are comparable to net income (loss) and net operating income (loss) for the third quarter of 2013 and the second quarter of 2014. However, net income (loss) before net income attributable to noncontrolling interests in the Australia MI business and net operating income (loss) before net operating income attributable to noncontrolling interests in the Australia MI business are not substitutes for net income (loss) and net operating income (loss) determined in accordance with GAAP. A reconciliation of net income (loss) before net income attributable to noncontrolling interests in the Australia MI business and net operating income (loss) before net operating income attributable to noncontrolling interests in the Australia MI business to net income (loss) and net operating income (loss) is included in this appendix. This presentation includes the non-GAAP financial measure entitled "core yield" as a measure of investment yield. The company defines core yield as the investment yield adjusted for those items that are not recurring in nature. Management believes that analysis of core yield enhances understanding of the investment yield of the company. However, core yield is not a substitute for investment yield determined in accordance with GAAP. In addition, the company’s definition of core yield may differ from the definitions used by other companies. A reconciliation of core yield to reported GAAP yield is included in this appendix. This presentation also references the non-GAAP financial measure entitled “reported yield excluding captive reinsurance” for the U.S. Life Insurance Division and the life insurance business as a measure of investment yield. The company excludes assets held by captive reinsurers from reported yield given the nature of the captives which primarily have floating rate assets associated with the floating rate liabilities of these entities. Management believes this measure is more indicative of the underlying performance of the life insurance business. A reconciliation of reported yield to reported yield excluding captive reinsurance is included in this appendix. This presentation references the non-GAAP financial measure entitled “loss ratio pre-deposit accounting” for the lifestyle protection insurance business. This business has reinsurance agreements that do not qualify for risk transfer under GAAP. The loss ratio pre-deposit accounting shows the income statement activity as if these reinsurance agreements, except for the reciprocal arrangements, were accounted for as reinsurance accounting ("pre-deposit accounting basis") and not as deposit accounting. There is no impact on net income available to Genworth Financial, Inc.'s common stockholders or to segment net operating income. While ''pre-deposit accounting basis" is a non-GAAP measure, management believes that it is more indicative of the underlying economic performance of the business. However, pre-deposit accounting basis as defined by the company should not be viewed as a substitute for GAAP. A reconciliation of the reported loss ratio to the loss ratio pre-deposit accounting presented here-in is included in this appendix. This presentation references the non-GAAP financial measure entitled “leverage ratio” as a measure of financial strength. For a description and reconciliation of this measure, see “Reconciliation Of Leverage Ratio”. 1 U.S. Generally Accepted Accounting Principles

28 Genworth 3Q14 Earnings Call Presentation - November 6, 2014
Reconciliation Of Net Operating Income (Loss) To Net Income (Loss)
(Amounts in millions, except per share amounts) 3Q 2Q 1Q 4Q 3QU.S. Life Insurance DivisionU.S. Life Insurance segment:
Life Insurance 13$ 39$ 21$ 56$ 54$ Long-Term Care Insurance (361) 6 46 42 41 Fixed Annuities 26 24 27 21 16 Total U.S. Life Insurance segment (322) 69 94 119 111
Total U.S. Life Insurance Division (322) 69 94 119 111
Global Mortgage Insurance DivisionInternational Mortgage Insurance segment:
Canada 46 47 41 44 41 Australia 48 57 62 66 61 Other Countries (7) (7) (4) (9) (12) Total International Mortgage Insurance segment 87 97 99 101 90
U.S. Mortgage Insurance segment (2) 39 33 6 (3) Total Global Mortgage Insurance Division 85 136 132 107 87
Corporate and Other DivisionInternational Protection segment 3 2 7 13 4 Runoff segment 5 15 12 19 25 Corporate and Other (88) (64) (51) (65) (88)
Total Corporate and Other Division (80) (47) (32) (33) (59)
NET OPERATING INCOME (LOSS) (317) 158 194 193 139
ADJUSTMENTS TO NET OPERATING INCOME (LOSS):Net investment gains (losses), net (10) 20 (10) 15 (13) Goodwill impairment, net (517) - - - - Gains (losses) on early extinguishment of debt, net - (2) - - (20) Income (loss) from discontinued operations, net of taxes - - - - 2 NET INCOME (LOSS) AVAILABLE TO GENWORTH FINANCIAL, INC.'S COMMON STOCKHOLDERS (844) 176 184 208 108 Add: net income attributable to noncontrolling interests 57 52 35 37 40
NET INCOME (LOSS) (787)$ 228$ 219$ 245$ 148$
Earnings (Loss) Per Share Data:
Net income (loss) available to Genworth Financial, Inc.'s common stockholders per common share Basic (1.70)$ 0.35$ 0.37$ 0.42$ 0.22$ Diluted (1.70)$ 0.35$ 0.37$ 0.41$ 0.22$
Net operating income (loss) per common share Basic (0.64)$ 0.32$ 0.39$ 0.39$ 0.28$ Diluted (0.64)$ 0.31$ 0.39$ 0.38$ 0.28$
Weighted-average shares outstanding Basic 496.6 496.6 495.8 494.7 494.0 Diluted(1) 496.6 503.6 502.7 501.2 499.3
2014 2013
(1)Under applicable accounting guidance, companies in a loss position are required to use basic weighted-average common shares outstanding in the calculation of diluted loss per share. Therefore, as a result of the net loss and net operating loss for the three months ended September 30, 2014, the company was required to use basic weighted-average common shares outstanding in the calculation of diluted loss per share for the three months ended September 30, 2014, as the inclusion of shares for stock options, restricted stock units and stock appreciation rights of 5.4 million would have been antidilutive to the calculation. If the company had not incurred a net loss for the three months ended September 30, 2014, dilutive potential weighted-average common shares outstanding would have been 502.0 million. As a result of the net loss for the nine months ended September 30, 2014, the company was required to use basic weighted-average common shares outstanding in the calculation of diluted loss per share for the nine months ended September 30, 2014, as the inclusion of shares for stock options, restricted stock units and stock appreciation rights of 6.4 million would have been antidilutive to the calculation. If the company had not incurred a net loss for the nine months ended September 30, 2014, dilutive potential weighted-average common shares outstanding would have been 502.8 million. Since the company had net operating income for the nine months ended September 30, 2014, the company used 502.8 million diluted weighted-average common shares outstanding in the calculation of diluted net operating income per common share.
29 Genworth 3Q14 Earnings Call Presentation - November 6, 2014
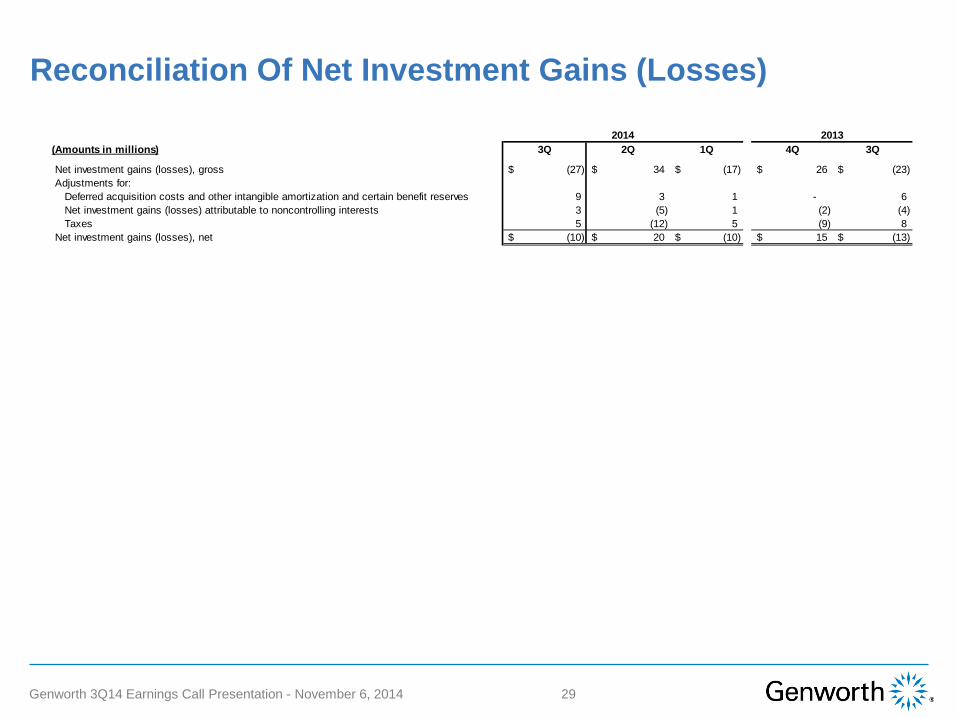
Reconciliation Of Net Investment Gains (Losses)
(Amounts in millions) 3Q 2Q 1Q 4Q 3Q
Net investment gains (losses), gross (27)$ 34$ (17)$ 26$ (23)$ Adjustments for:
Deferred acquisition costs and other intangible amortization and certain benefit reserves 9 3 1 - 6 Net investment gains (losses) attributable to noncontrolling interests 3 (5) 1 (2) (4) Taxes 5 (12) 5 (9) 8
Net investment gains (losses), net (10)$ 20$ (10)$ 15$ (13)$
20132014

30 Genworth 3Q14 Earnings Call Presentation - November 6, 2014
Reconciliation Of Core Yield – Genworth Consolidated (Assets - amounts in billions) 3Q 2Q 1Q 4Q 3Q
Reported - Total Invested Assets and Cash 76.6$ 76.9$ 74.8$ 72.8$ 73.1$ Subtract:
Securities lending 0.3 0.3 0.3 0.2 0.2 Unrealized gains (losses) 5.4 5.6 4.3 2.8 3.3 Derivative counterparty collateral 0.5 0.4 0.4 0.2 0.3
Adjusted end of period invested assets and cash 70.4$ 70.6$ 69.8$ 69.6$ 69.3$
(A) Average Invested Assets And Cash Used in Reported Yield Calculation 70.5$ 70.2$ 69.7$ 69.5$ 68.6$ Subtract: Restricted commercial mortgage loans and other invested assets related to securitization entities(1) 0.2 0.2 0.2 0.3 0.3
(B) Average Invested Assets And Cash Used in Core Yield Calculation 70.3 70.0$ 69.5$ 69.2$ 68.3$
(Income - amounts in millions)(C) Reported - Net Investment Income 805$ 813$ 805$ 835$ 801$
Subtract: Bond calls and commercial mortgage loan prepayments 17 7 10 8 15 Reinsurance(2) 19 13 22 20 17 Other non-core items(3) (18) 12 5 17 4 Restricted commercial mortgage loans and other invested assets related to securitization entities(1) 3 3 3 3 4
(D) Core Net Investment Income 784$ 778$ 765$ 787$ 761$
(C) / (A) Reported Yield 4.57% 4.63% 4.62% 4.81% 4.67%
(D) / (B) Core Yield 4.46% 4.45% 4.40% 4.55% 4.46%
Note: Yields have been annualized.
(3)Includes cost basis adjustments on structured securities, preferred stock income and various other immaterial items.
2013
(2)Represents imputed investment income related to reinsurance agreements in the lifestyle protection insurance business.
(1)Represents the incremental assets and investment income related to restricted commercial mortgage loans and other invested assets.
2014

31 Genworth 3Q14 Earnings Call Presentation - November 6, 2014
Reconciliation Of Reported Yield – U.S. Life Division U.S. Life Insurance Division 3Q 2Q 1Q 4Q 3Q(Assets - amounts in millions)
Reported - Total Invested Assets and Cash 59,339$ 58,341$ 56,710$ 54,506$ 54,316$ Subtract:
Unrealized gains (losses) 4,982 5,160 3,975 2,546 3,047 Adjusted end of period invested assets 54,357 53,181 52,735 51,960 51,269 Subtract:
Assets related to captive reinsurance 3,362 3,409 3,390 3,381 3,505 Adjusted end of period invested assets excluding captive reinsurance 50,995$ 49,772$ 49,345$ 48,579$ 47,764$
(A) Average Invested Assets Used in Reported Yield Calculation 53,581$ 53,036$ 52,333$ 51,956$ 50,807$ Subtract:
Assets related to captive reinsurance 3,367 3,408 3,395 3,439 3,511 (B) Average Invested Assets Excluding Captive Reinsurance 50,214$ 49,628$ 48,938$ 48,517$ 47,296$
(Income - amounts in millions)
(C) Reported - Net Investment Income 658$ 671$ 660$ 675$ 650$ Subtract:
Net investment income related to captive reinsurance 12 12 12 13 14 (D) Net Investment Income Excluding Captive Reinsurance 646$ 659$ 648$ 662$ 636$
(C) / (A) Reported Yield 4.91% 5.06% 5.04% 5.20% 5.12%
(D) / (B) Reported Yield Excluding Captive Reinsurance 5.14% 5.30% 5.30% 5.46% 5.37%
Life Insurance Business(Assets - amounts in millions)
Reported - Total Invested Assets and Cash 13,398$ 13,405$ 13,134$ 12,816$ 12,986$ Subtract:
Unrealized gains (losses) 718 761 587 342 448 Adjusted end of period invested assets 12,680 12,644 12,547 12,474 12,538 Subtract:
Assets related to captive reinsurance 3,362 3,409 3,390 3,381 3,505 Adjusted end of period invested assets excluding captive reinsurance 9,318$ 9,235$ 9,157$ 9,093$ 9,033$
(E) Average Invested Assets Used in Reported Yield Calculation 12,658$ 12,652$ 12,563$ 12,716$ 12,503$ Subtract:
Assets related to captive reinsurers 3,367 3,408 3,395 3,439 3,511 (F) Average Invested Assets Excluding Captive Reinsurance 9,291$ 9,244$ 9,168$ 9,277$ 8,992$
(Income - amounts in millions)
(G) Reported - Net Investment Income 123$ 137$ 128$ 139$ 138$ Subtract:
Net investment income related to captive reinsurance 12 12 12 13 14 (H) Net Investment Income Excluding Captive Reinsurance 111$ 125$ 116$ 126$ 124$
(G) / (E) Reported Yield 3.89% 4.33% 4.08% 4.37% 4.41%
(H) / (F) Reported Yield Excluding Captive Reinsurance 4.77% 5.38% 5.04% 5.44% 5.48%
Notes: Yields calculated using whole dollars. Yields have been annualized.
20132014

32 Genworth 3Q14 Earnings Call Presentation - November 6, 2014
Reconciliation Of Pre-Deposit Accounting Basis For LPI
Reported
Deposit Accounting Adjustments
Pre-Deposit Accounting
Basis Reported
Deposit Accounting Adjustments
Pre-Deposit Accounting
Basis Reported
Deposit Accounting Adjustments
Pre-Deposit Accounting
Basis Reported
Deposit Accounting Adjustments
Pre-Deposit Accounting
Basis Reported
Deposit Accounting Adjustments
Pre-Deposit Accounting
Basis
Premiums 185$ 34$ 219$ 199$ 41$ 240$ 175$ 43$ 218$ 158$ 43$ 201$ 159$ 47$ 206$
Benefits and other changes in policy reserves 52$ 9$ 61$ 56$ 20$ 76$ 46$ 20$ 66$ 39$ 15$ 54$ 40$ 22$ 62$
Loss Ratio 28% 28% 28% 32% 26% 30% 25% 27% 25% 30%
The loss ratio is the ratio of incurred losses and loss adjustment expenses to net earned premiums. The loss ratio included above was calculated using whole dollars and may be different than the ratio calculated using the rounded numbers included herein.
3Q 2013
(Amounts in millions)
3Q 2014 2Q 2014 1Q 2014 4Q 2013

33 Genworth 3Q14 Earnings Call Presentation - November 6, 2014
Reconciliation Of Net Income (Loss) Before Net Income Attributable To Noncontrolling Interests In The Australia MI Business To Net Income (Loss) Available To Genworth's Common Stockholders And Net Operating Income (Loss) Before Net Income Attributable To Noncontrolling Interests In The Australia MI Business To Net Operating Income (Loss)
Three months ended
June 30, 2014 2013 2014
(787)$ 148$ 228$
23 N/A 11 34 40 41
(844)$ 108$ 176$
(258)$ 176$ 208$
23 N/A 11 36 37 39
(317)$ 139$ 158$
Adjustments for:Net operating income attributable to noncontrolling interests in the Australia MI businessNet operating income attributable to noncontrolling interests in the Canada MI business
Net operating income (loss)
Threemonths endedSeptember 30,
(Amounts in millions)
Net income (loss) available to Genworth's common stockholders
Adjustments for:Net income (loss) before net income attributable to noncontrolling interests
Net income attributable to noncontrolling interests in the Australia MI businessNet income attributable to noncontrolling interests in the Canada MI business
Net operating income (loss) before net operating income attributable to noncontrolling interests

34 Genworth 3Q14 Earnings Call Presentation - November 6, 2014
Reconciliation Of Leverage Ratio As of As of
(Amounts in millions) September 30, 2014 June 30, 2014Long-term borrowings 4,662$ 4,691$ Adjust long-term borrowings related to noncontrolling interests:
Canada (noncontrolling interests ownership of 42.7%) (166) (174) Australia (noncontrolling interests ownership of 33.8%) (42) (45)
25% of hybrid debt (Genworth Holdings, Inc.'s 6.15% Junior Notes, due 2066) (150) (150) Operating leases 144 144
A Adjusted long-term borrowings 4,448$ 4,466$
Total Genworth Financial, Inc.'s stockholders' equity 15,165$ 16,231$ Exclude net unrealized investment (gains) losses (2,067) (2,128) 25% of hybrid debt (Genworth Holdings, Inc.'s 6.15% Junior Notes, due 2066) 150 150
B Adjusted total Genworth Financial, Inc.'s stockholders' equity 13,248$ 14,253$
A + B Total capital (adjusted long-term borrowings + adjusted total Genworth Financial, Inc.'s stockholders' equity) 17,696$ 18,719$
A/(A+B) Leverage ratio (adjusted long-term borrowings/total capital) 25.1% 23.9%
GAAP leverage ratio 23.5% 22.4%
The company applies the Moody’s Investors Service, Inc. (Moody's) calculation methodology for adjusted financial leverage to the calculation of its leverage ratio, subject to the adjustments described below. Moody’s calculates adjusted financial leverage as adjusted long-term borrowings (defined as financial debt, including preferred stock, plus pension liabilities plus the non-equity portion of hybrid debt plus operating lease adjustments) divided by adjusted debt plus stockholder’s equity. Consistent with Moody's calculation methodology, the company excludes from long-term borrowings 25% of Genworth Holdings, Inc.'s outstanding principal amount of 6.15% junior notes due in 2066 (the “subordinated notes”), which Moody’s believes is representative of the equity portion of the subordinated notes, and includes operating leases applying a rent factor of 6 times. For the year ended December 31, 2013, the company's rent expense was $24 million and a rent factor of 6 times has been applied to this amount representing the net present value of future operating lease payments to be consistent with the Moody's calculation methodology. Total Genworth Financial, Inc.’s stockholders’ equity is adjusted to include 25% of the outstanding principal amount of the subordinated notes, consistent with the Moody’s calculation methodology. The company adjusts this calculation to exclude from long-term borrowings that portion which is attributable to noncontrolling interests (based on the respective ownership percentages) of its majority-owned Canadian and Australian mortgage insurance subsidiaries to align the presentation of adjusted long-term borrowings with its presentation of adjusted total Genworth Financial, Inc.’s stockholders’ equity, which is presented after excluding noncontrolling interests. The company excludes net unrealized (gains) losses from total Genworth Financial, Inc.’s stockholders equity to exclude fair value adjustments from Total Genworth Financial, Inc.’s stockholders’ equity since long-term borrowings are reported at book value. The company does not add its pension liabilities to adjusted long-term borrowings because it believes they are immaterial. Management believes the leverage ratio, as presented, is an important measurement tool for investors and analysts as it is a measure of financial strength and is based on the Moody's methodology, adjusted to address factors particular to the company.

35 Genworth 3Q14 Earnings Call Presentation - November 6, 2014
Definition Of Selected Operating Performance Measures Management uses selected operating performance measures including ''sales" and "insurance in force" or "risk in force" which are commonly used in the insurance industry as measures of operating performance.
Management regularly monitors and reports sales metrics as a measure of volume of new and renewal business generated in a period. Sales refer to new insurance written for mortgage insurance. Sales do not include renewal premiums on policies or contracts written during prior periods. The company considers new insurance written to be a measure of the company's operating performance because they represent a measure of new sales of insurance policies or contracts during a specified period, rather than a measure of the company's revenues or profitability during that period.
Management regularly monitors and reports insurance in force and risk in force. Insurance in force for the international mortgage and U.S. mortgage insurance businesses is a measure of the aggregate face value of outstanding insurance policies as of the respective reporting date. For risk in force in the international mortgage insurance business, the company has computed an “effective” risk in force amount, which recognizes that the loss on any particular loan will be reduced by the net proceeds received upon sale of the property. Effective risk in force has been calculated by applying to insurance in force a factor of 35% that represents the highest expected average per-claim payment for any one underwriting year over the life of the company’s businesses in Canada and Australia. Risk in-force for the U.S. mortgage insurance business is the obligation that is limited under contractual terms to the amounts less than 100% of the mortgage loan value. The company considers insurance in force and risk in force to be measures of the company’s operating performance because they represent measures of the size of the business at a specific date which will generate revenues and profits in a future period, rather than measures of the company’s revenues or profitability during that period. This presentation also includes information related to loss mitigation activities for the U.S. mortgage insurance business. The company defines loss mitigation activities as rescissions, cancellations, borrower loan modifications, repayment plans, lender- and borrower-titled presales, claims administration and other loan workouts. Estimated savings related to rescissions are the reduction in carried loss reserves, net of premium refunds and reinstatement of prior rescissions. Estimated savings related to loan modifications and other cure related loss mitigation actions represent the reduction in carried loss reserves. Estimated savings related to claims mitigation activities represent amounts deducted or “curtailed” from claims due to acts or omissions by the insured or the servicer with respect to the servicing of an insured loan that is not in compliance with obligations under the company’s master policy. For non-cure related actions, including presales, the estimated savings represent the difference between the full claim obligation and the actual amount paid. Loans subject to the company’s loss mitigation actions, the results of which have been included in the company’s reported estimated loss mitigation savings, are subject to re-default and may result in a potential claim in future periods, as well as potential future loss mitigation savings depending on the resolution of the re-defaulted loan. The company believes that this information helps to enhance the understanding of the operating performance of the U.S. mortgage insurance business as loss mitigation activities specifically impact current and future loss reserves and level of claim payments. Management also regularly monitors and reports a loss ratio for the company’s businesses. For the long-term care insurance business, the loss ratio is the ratio of benefits and other changes in reserves less tabular interest on reserves less loss adjustment expenses to net earned premiums. For the mortgage and lifestyle protection insurance businesses, the loss ratio is the ratio of incurred losses and loss adjustment expenses to net earned premiums. The company considers the loss ratio to be a measure of underwriting performance in these businesses and helps to enhance the understanding of the operating performance of the businesses. An assumed tax rate of 35% is utilized in certain adjustments to net operating income (loss) and in the explanation of specific variances of operating performance and investment results.
These operating performance measures enable the company to compare its operating performance across periods without regard to revenues or profitability related to policies or contracts sold in prior periods or from investments or other sources.

36 Genworth 3Q14 Earnings Call Presentation - November 6, 2014
This presentation contains certain "forward-looking statements" within the meaning of the Private Securities Litigation Reform Act of 1995. Forward-looking statements may be identified by words such as "expects," "intends," "anticipates," "plans," "believes," "seeks," "estimates," "will" or words of similar meaning and include, but are not limited to, statements regarding the outlook for the company’s future business and financial performance. Forward-looking statements are based on management’s current expectations and assumptions, which are subject to inherent uncertainties, risks and changes in circumstances that are difficult to predict. Actual outcomes and results may differ materially due to global political, economic, business, competitive, market, regulatory and other factors and risks, including, but not limited to, the following: Risks relating to the company’s businesses, including downturns and volatility in global economies and equity and credit markets; downgrades or potential downgrades, being placed on negative outlook or being put on review for potential downgrade of the company’s financial strength or credit ratings; interest rate fluctuations and levels; adverse capital and credit market conditions; the valuation of fixed maturity, equity and trading securities; defaults or other events impacting the value of the company’s fixed maturity securities portfolio; defaults on the company’s commercial mortgage loans or the mortgage loans underlying the company’s investments in commercial mortgage-backed securities and volatility in performance; the availability, affordability and adequacy of reinsurance to meet the company’s needs; defaults by counterparties to reinsurance arrangements or derivative instruments; an adverse change in risk-based capital and other regulatory requirements; insufficiency of reserves and required increases to reserve liabilities (including as a result of any changes the company may make to its assumptions, methodologies or otherwise in connection with its active life margin review in the fourth quarter of 2014); legal and regulatory constraints on dividend distributions by the company’s subsidiaries; competition, including from government-owned and government-sponsored enterprises (GSEs) offering mortgage insurance; loss of key distribution partners; regulatory restrictions on the company’s operations and changes in applicable laws and regulations; legal or regulatory investigations or actions; the failure of or any compromise of the security of the company’s computer systems and confidential information contained therein; the occurrence of natural or man-made disasters or a pandemic; the effect of the Dodd-Frank Wall Street Reform and Consumer Protection Act; ineffective or inadequate risk management program; changes in accounting and reporting standards; goodwill impairments; impairments of or valuation allowances against the company’s deferred tax assets; significant deviations from the company’s assumptions in its insurance policies and annuity contracts; accelerated amortization of deferred acquisition costs and present value of future profits (including as a result of any changes the company may make to its assumptions, methodologies or otherwise in connection with its active life margin review in the fourth quarter of 2014); inability (including as a result of the company’s failure to obtain any necessary regulatory approvals) to increase premiums on in force and future long term care insurance products (including any current rate actions and any future rate actions , such as rate actions resulting from any changes the company may make to its assumptions, methodologies or otherwise in connection with its active life margin review in the fourth quarter of 2014) in a timely manner and sufficient amount; the company’s inability to reflect future premium increases and other management actions in its active life margin calculation (including in connection with its active life margin review in the fourth quarter of 2014); the company’s inability to successfully implement the management actions it has and is developing to offset adverse impacts resulting from its claim reserves review completed in the third quarter of 2014, its active life margin review being conducted in the fourth quarter of 2014 or otherwise; the failure of demand for life insurance, long term care insurance and fixed annuity products to increase the capital needs in the U.S. life insurance and U.S. mortgage insurance businesses being higher than it anticipates and its inability to increase its capital on the anticipated timetable and terms or at all, and with the anticipated benefits; medical advances, such as genetic research and diagnostic imaging, and related legislation; ability to continue to implement actions to mitigate the impact of statutory reserve requirements; political and economic instability or changes in government policies; fluctuations in foreign currency exchange rates and international securities markets; the significant portion of the company’s international mortgage insurance risk in force with high loan-to-value ratios; increases in U.S. mortgage insurance default rates; failure to meet, or have waived to the extent needed, the company’s U.S. mortgage insurance subsidiaries’ minimum statutory capital requirements and hazardous financial condition standards; the influence of Federal National Mortgage Association (Fannie Mae), Federal Home Loan Mortgage Corporation (Freddie Mac) and a small number of large mortgage lenders and investors and changes to the role or structure of Fannie Mae and Freddie Mac; inability to meet the proposed private mortgage insurance eligibility requirements (PMIERs) guidelines on the contemplated timetable with the contemplated funding (including (a) if reinsurance or similar transactions are not available due to adverse market conditions, costs and other terms of such transactions, the GSE’s approach to and capital treatment for such transactions and the performance of the company’s U.S. mortgage insurance business, among other factors, and (b) the capital required to meet the PMIERs guidelines and operate the company’s business is higher than anticipated due to, among other things, (i) the PMIERs guidelines adopted differing materially from the current draft; (ii) the way the guidelines are applied and interpreted by the GSEs and the Federal Housing Finance Agency (FHFA); (iii) the future performance of the U.S. housing market; (iv) the company generating and having expected U.S. mortgage insurance business earnings, available assets and risk-based required assets (including as they relate to the value of the shares of the company’s Canadian mortgage insurance subsidiary that are owned by the U.S. mortgage insurance business as a result of share price and foreign exchange movements or otherwise), reducing risk in force and reducing delinquencies as anticipated, and writing anticipated amounts and types of new U.S. mortgage insurance business; and (v) the company’s projected overall financial performance, capital and liquidity levels being as anticipated); inability to realize the benefits of the company’s rescissions and curtailments as anticipated; the extent to which loan modifications and other similar programs may provide benefits to the company; deterioration in economic conditions or a decline in home prices in the United States; problems associated with foreclosure process defects in the United States that may defer claim payments; decreases in the volume of high loan-to-value mortgage originations or increases in mortgage insurance cancellations in the United States; increases in the use of alternatives to private mortgage insurance in the United States and reductions by lenders in the level of coverage they select; the impact of the use of reinsurance with reinsurance companies affiliated with the company’s U.S. mortgage lending customers; and potential liabilities in connection with the company’s U.S. contract underwriting services; Other risks, including the risk that the anticipated benefits of the announced expense reduction are not realized and the company may lose key personnel related to actions like this as well as general uncertainty in the timing of the company’s turnaround; the possibility that in certain circumstances the company will be obligated to make payments to General Electric Company (GE) under the tax matters agreement with GE even if the company’s corresponding tax savings are never realized and payments could be accelerated in the event of certain changes in control; and provisions of the company’s certificate of incorporation and bylaws and the tax matters agreement with GE may discourage takeover attempts and business combinations that stockholders might consider in their best interests; and Risks relating to the company’s common stock, including the suspension of dividends and stock price fluctuations. The company undertakes no obligation to publicly update any forward-looking statement, whether as a result of new information, future developments or otherwise.
Cautionary Note Regarding Forward-Looking Statements