Earnings Presentation - valoremadvisors.com · Earnings Presentation. 2 Strong content offerings in...
18
SHEMAROO ENTERTAINMENT LIMITED H1 / Q2-FY20 Earnings Presentation
Transcript of Earnings Presentation - valoremadvisors.com · Earnings Presentation. 2 Strong content offerings in...

SHEMAROO ENTERTAINMENT LIMITED
H1 / Q2-FY20Earnings Presentation

2
Strong content offerings in multiple countries across the globe
One of the largest content houses with 3700+ content library
Offering content to most Bollywood services across leading platforms
REVENUEFY19
INR 5,678 Mn
5 Year CAGR 16.50%
PATFY19
INR 830 Mn
5 Year CAGR 25.00%
EBITDAFY19
INR 1,578 Mn
5 Year CAGR 19.67%
NETWORTHFY19
INR 5,717 Mn
5 Year CAGR 26.79%
Strong understanding of Consumer's Entertainment Needs
Over 55 years experience as a Household Media Brand
Offering content across Bollywood, Devotional, Regional, Comedy, Kids, Health & Lifestyle, etc.
At a Glance

3
FY19 Revenue Distribution (INR Mn)Operational Revenue (INR Mn) and EBITDA Margin (%)
• Founded in 1962 as a book circulating library, today Shemaroo Entertainment Limited (Shemaroo) is a leading Indian content power house with a globalreach, headquartered out of Mumbai and employs over 750 people.
• Shemaroo is a pioneer in content aggregation and distribution in India and globally with offerings spread across Television, Mobile, Internet, OTT, etc.
• Identifying that movies have the longest shelf life for television and other media content, Shemaroo pioneered the movie library syndication business byacquiring movie titles from producers and distributing it to broadcasters and other media platforms.
• Shemaroo has grown multifold over the years, developing excellent relationships across the media industry value chain, to become one of the largestorganised players in a fragmented industry.
• The company’s digital business contribution has grown from less than 10% in FY14 to over 30% in FY19.
1,976 2,387 2,861 3,113 3,332 3,586 3,960
1,896
175246
373635
923 1,305 1,718
1,038
26.69%24.30%
26.86%28.71% 29.96% 29.16% 27.79%
20.59%
FY13 FY14 FY15 FY16 FY17 FY18 FY19 H1-FY20
Traditional (INR) Digital (INR) EBITDA Margin (%)
Traditional Media
70%
Digital media30%
Overview

4
4
H1 / Q2-FY20HIGHLIGHTS

5
Divisional Breakup (Consolidated):
INR Mn Q2-FY20 Q2-FY19 YOY Growth H1-FY20 H1-FY19 YOY Growth
Digital Media 551 456 20.8% 1,038 845 22.8%
Traditional Media 952 1,177 (19.1)% 1,896 2,022 (6.2)%
Income from Operations 1,503 1,633 (8.0)% 2,934 2,867 2.3%
H1 / Q2-FY20 Key Financial Highlights
5
Q2-FY20 performance (Consolidated):
• Revenue from Operations: INR 1,503 Mn
• EBITDA: INR 285 Mn
• EBITDA Margin: 18.96%
• Net Profit: INR 195 Mn
• Net Profit Margin: 12.97%
• EPS: INR 7.17
H1-FY20 performance (Consolidated):
• Revenue from Operations: INR 2,934 Mn
• EBITDA: INR 604 Mn
• EBITDA Margin: 20.59%
• Net Profit: INR 356 Mn
• Net Profit Margin: 12.13%
• EPS: INR 13.11

6 Key Operational Highlights
6
• ShemarooMe:1) Launched 52 weeks 52 premiere service2) Made available on MiTV and Cloudwalker TV3) Partnered with Ixigo and Dainik Bhaskar
• Launched 2 new pre-loaded audio speakers - Ganesha Bhajan Vaani and Shri Krishna Bhajan Vaani
• Launched 2 new services on DTH:1) Telugu service on Airtel, Dish and d2h in August 20192) Punjabi service on Dish and D2h in August 2019
• Crossed 28 Mn subscribers on our YouTube channel ‘FilmiGaane’; the channel became the 5th mostsubscribed channel in India and 36th in the world
• The economic situation continued to be sluggish resulting in weak business sentiment and slowdown inadvertising spends. This, along with ongoing investments by Shemaroo in new products, services,geographies and people, has affected the margins

7 Key Operational Highlights
7
YouTube Monthly Views Graph till September 2019:

8
Particulars (INR Mn) Q2-FY20 Q1-FY20 Q-o-Q Q2-FY19 Y-o-Y
Revenue from Operations 1,503 1,430 5.1% 1,633 (8.0)%
Total Expenses 1,218 1,111 9.6% 1,207 0.9%
EBITDA 285 319 (10.7)% 426 (33.1)%
EBITDA Margin (%) 18.96% 22.31% (335) Bps 26.09% (713) Bps
Other Income 6 9 (33.3)% - NA
Depreciation 20 14 42.9% 13 53.8%
Finance Cost 56 58 (3.4)% 56 NA
PBT 215 256 (16.0)% 357 (39.8)%
Tax 21 92 (77.2)% 127 (83.5)%
PAT 194 164 18.3% 230 (15.7)%
Minority Interest & Share of profit/ (loss) in associate company 1 (2) NA - NA
PAT after adjustments 195 162 20.4% 230 (15.2)%
PAT Margin (%) 12.97% 11.33% 164 Bps 14.08% (111) Bps
Comprehensive Income - - NA - NA
Total Profit including Comprehensive Income( Net of tax) 195 162 20.4% 230 (15.2)%
EPS (INR)(not annualised) 7.17 5.94 20.7% 8.45 (15.1)%
Q2-FY20 Consolidated Income Statement (Ind-AS)
8
9
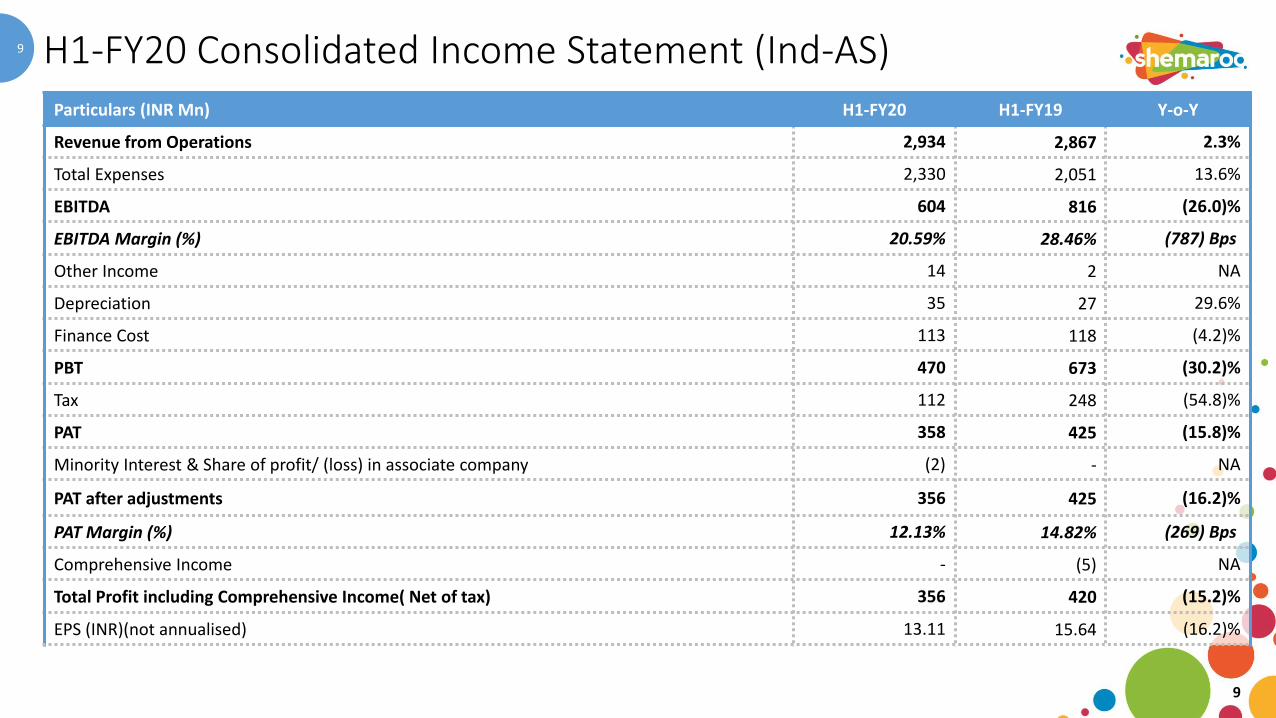
Particulars (INR Mn) H1-FY20 H1-FY19 Y-o-Y
Revenue from Operations 2,934 2,867 2.3%
Total Expenses 2,330 2,051 13.6%
EBITDA 604 816 (26.0)%
EBITDA Margin (%) 20.59% 28.46% (787) Bps
Other Income 14 2 NA
Depreciation 35 27 29.6%
Finance Cost 113 118 (4.2)%
PBT 470 673 (30.2)%
Tax 112 248 (54.8)%
PAT 358 425 (15.8)%
Minority Interest & Share of profit/ (loss) in associate company (2) - NA
PAT after adjustments 356 425 (16.2)%
PAT Margin (%) 12.13% 14.82% (269) Bps
Comprehensive Income - (5) NA
Total Profit including Comprehensive Income( Net of tax) 356 420 (15.2)%
EPS (INR)(not annualised) 13.11 15.64 (16.2)%
H1-FY20 Consolidated Income Statement (Ind-AS)
9
10 H1-FY20 Consolidated Balance Sheet (Ind-As)
10
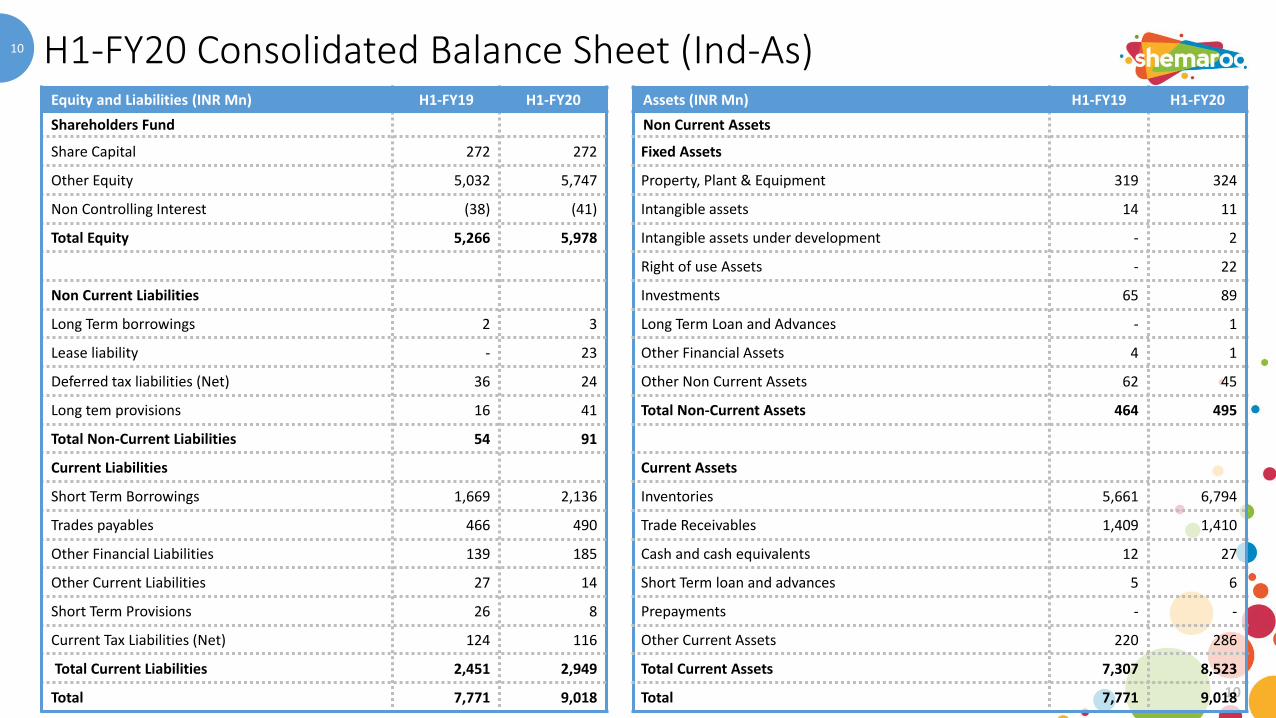
Equity and Liabilities (INR Mn) H1-FY19 H1-FY20 Assets (INR Mn) H1-FY19 H1-FY20
Shareholders Fund Non Current Assets
Share Capital 272 272 Fixed Assets
Other Equity 5,032 5,747 Property, Plant & Equipment 319 324
Non Controlling Interest (38) (41) Intangible assets 14 11
Total Equity 5,266 5,978 Intangible assets under development - 2
Right of use Assets - 22
Non Current Liabilities Investments 65 89
Long Term borrowings 2 3 Long Term Loan and Advances - 1
Lease liability - 23 Other Financial Assets 4 1
Deferred tax liabilities (Net) 36 24 Other Non Current Assets 62 45
Long tem provisions 16 41 Total Non-Current Assets 464 495
Total Non-Current Liabilities 54 91
Current Liabilities Current Assets
Short Term Borrowings 1,669 2,136 Inventories 5,661 6,794
Trades payables 466 490 Trade Receivables 1,409 1,410
Other Financial Liabilities 139 185 Cash and cash equivalents 12 27
Other Current Liabilities 27 14 Short Term loan and advances 5 6
Short Term Provisions 26 8 Prepayments - -
Current Tax Liabilities (Net) 124 116 Other Current Assets 220 286
Total Current Liabilities 2,451 2,949 Total Current Assets 7,307 8,523
Total 7,771 9,018 Total 7,771 9,018

11
845
1,038
H1-FY19 H1-FY20
456
551
Q2-FY19 Q2-FY20
Shemaroo In Digital Media
11
Q2-FY20 Digital Media Performance (INR Mn)
H1-FY20 Digital Media Performance (INR Mn)
• The company caters to all types of revenue models like subscription, pay per transaction,advertisement supported (free to consumer) etc.
• Due to its large library ownership Shemaroo has the ability to slice and dice content and package it indifferent ways that are more suited for the digital media platforms
Shemaroo was one of the early Indian media companies to syndicate its library in the high growth digital media platforms, thereby gaining early mover advantage
Digital Media Presence
Internet and OTTMobile Value Added services (MVAS) / Mobile
Internet
• Shemaroo has agreements with variousinternet video platforms like YouTube,Hotstar, Reliance Jio, Apple iTunes, GooglePlay, YuppTV, etc.
• The company has agreements with major telecom operators, namely Airtel, Vodafone, Idea, etc.
• Shemaroo distributes imagery, videos, full songs, live streaming etc. under MVAS through both operator branded portals as well as its own branded portals
12 Shemaroo in Traditional Media
12
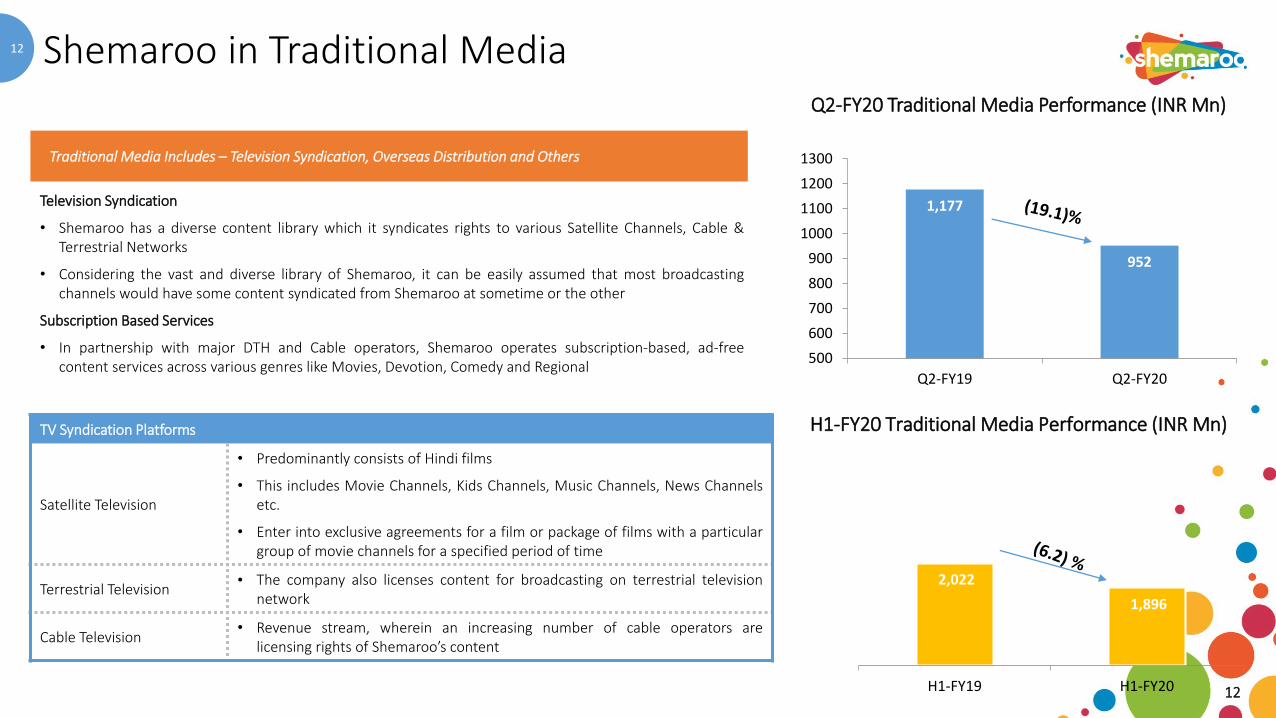
Q2-FY20 Traditional Media Performance (INR Mn)
H1-FY20 Traditional Media Performance (INR Mn)
1,177
952
500
600
700
800
900
1000
1100
1200
1300
Q2-FY19 Q2-FY20
2,022
1,896
H1-FY19 H1-FY20
Traditional Media Includes – Television Syndication, Overseas Distribution and Others
Television Syndication
• Shemaroo has a diverse content library which it syndicates rights to various Satellite Channels, Cable &Terrestrial Networks
• Considering the vast and diverse library of Shemaroo, it can be easily assumed that most broadcastingchannels would have some content syndicated from Shemaroo at sometime or the other
Subscription Based Services
• In partnership with major DTH and Cable operators, Shemaroo operates subscription-based, ad-freecontent services across various genres like Movies, Devotion, Comedy and Regional
TV Syndication Platforms
Satellite Television
• Predominantly consists of Hindi films
• This includes Movie Channels, Kids Channels, Music Channels, News Channelsetc.
• Enter into exclusive agreements for a film or package of films with a particulargroup of movie channels for a specified period of time
Terrestrial Television• The company also licenses content for broadcasting on terrestrial television
network
Cable Television• Revenue stream, wherein an increasing number of cable operators are
licensing rights of Shemaroo’s content

13 Consolidated Income Statement (Ind-As)
13
Particulars (INR Mn) FY17 FY18 FY19
Revenue from Operations 4,255 4,891 5,678
Total Expenses 2,980 3,465 4,100
EBITDA 1,275 1,426 1,578
EBITDA Margin (%) 29.96% 29.16% 27.79%
Other Income 30 12 18
Depreciation 43 51 56
Finance Cost 324 307 256
PBT 938 1,080 1,284
Tax 342 367 457
PAT 596 713 827
Minority Interest & Share of profit/ (loss) in associate company 18 (1) 3
PAT after adjustments 614 712 830
PAT Margin (%) 14.43% 14.56% 14.62%
Comprehensive Income - 3 3
Total Profit including Comprehensive Income( Net of tax) 614 715 833
EPS (INR)(not annualised) 22.60 26.18 30.52

14 Consolidated Balance Sheet (Ind-As)
14
Equity and Liabilities (INR Mn) FY18 FY19 Assets (INR Mn) FY18 FY19
Shareholders Fund Non Current Assets
Share Capital 272 272 Fixed Assets
Other Equity 4,662 5,445 Property, Plant & Equipment 323 306
Total Equity 4,934 5,717 Intangible assets 10 10
Non controlling interest (36) (42) Investments 67 65
Non Current Liabilities Long Term Loan and Advances - 1
Long Term borrowings 21 4 Other Financial Assets 3 3
Deferred tax liabilities (Net) 36 34 Other Non Current Assets 31 58
Long tem provisions 16 32 Total Non-Current Assets 434 443
Total Non-Current Liabilities 73 70
Current Liabilities Current Assets
Short Term Borrowings 1,858 1,969 Inventories 5,297 6,027
Trades payables 181 298 Trade Receivables 1,406 1,590
Other Financial Liabilities 135 63 Cash and cash equivalents 13 16
Other Current Liabilities 28 68 Short Term loan and advances 4 6
Short Term Provisions 15 8 Other Financial Assets - 8
Current Tax Liabilities (Net) 125 151 Other Current Assets 159 212
Total Current Liabilities 2,342 2,557 Total Current Assets 6,879 7,859
Total 7,313 8,302 Total 7,313 8,302

15
Operational Revenue* (INR Mn)
2,646
3,2343,751
4,255
4,891
5,678
FY14 FY15 FY16 FY17 FY18 FY19
5 Year CAGR 16.50%
Net Worth (INR Mn) and ROCE (%)
1,745
3,174 3,649 4,232
4,932 5,717
18.60%19.60% 19.20% 18.10%
20.31% 19.96%
5.00%
8.00%
11.00%
14.00%
17.00%
20.00%
23.00%
-
1,750
3,500
5,250
7,000
FY14 FY15 FY16 FY17 FY18 FY19
5 Year CAGR 26.79%
EBITDA (INR Mn) and EBITDA Margin (%)
643
868
1,076 1,275
1,426 1,578
24.30%26.84%
28.69% 29.96% 29.16% 27.79%
0.00%
5.00%
10.00%
15.00%
20.00%
25.00%
30.00%
35.00%
-
400
800
1,200
1,600
2,000
FY14 FY15 FY16 FY17 FY18 FY19
5 Year CAGR 19.67%
272
409
521
614
712
830
13.68
17.3519.18
22.60
26.18
30.52
0
5
10
15
20
25
30
35
-
300
600
900
FY14 FY15 FY16 FY17 FY18 FY19
5 Year CAGR 25.00%
PAT (INR Mn) and EPS (INR)
Historical Consolidated Financial Charts
15* Note: FY17 to FY19 numbers are as per IND-As

16
-50%
-40%
-30%
-20%
-10%
0%
10%
20%
30%
40%
Oct-18 Nov-18 Dec-18 Jan-19 Feb-19 Mar-19 Apr-19 May-19 Jun-19 Jul-19 Aug-19 Sep-19
SHEMAROO SENSEX
Capital Market
Price Data (As of 30th September, 2019) INR
Face Value 10.0
Market Price 243.1
52 Week H/L 527.9/233.0
Market Cap (INR Mn) 6,608.0
Equity Shares Outstanding (Mn) 27.2
1 Year Avg. Trading Volume ('000) 13.2
Public13.77%
FII20.12%
DII0.29%
Promoters65.82%
Share Holding Pattern as on 30th September, 2019

DISCLAIMERShemaroo Entertainment Limited
No representation or warranty, express or implied, is made as to, and no reliance should be placed on, the fairness, accuracy, completeness or correctness of the information or opinions contained in this presentation. Suchinformation and opinions are in all events not current after the date of this presentation. Certain statements made in this presentation may not be based on historical information or facts and may be "forward lookingstatements" based on the currently held beliefs and assumptions of the management of Shemaroo Entertainment Limited (“Company” or “Shemaroo”), which are expressed in good faith and in their opinion reasonable,including those relating to the Company’s general business plans and strategy, its future financial condition and growth prospects and future developments in its industry and its competitive and regulatory environment.
Forward-looking statements involve known and unknown risks, uncertainties and other factors, which may cause the actual results, financial condition, performance or achievements of the Company or industry results todiffer materially from the results, financial condition, performance or achievements expressed or implied by such forward-looking statements, including future changes or developments in the Company’s business, itscompetitive environment and political, economic, legal and social conditions. Further, past performance is not necessarily indicative of future results. Given these risks, uncertainties and other factors, viewers of thispresentation are cautioned not to place undue reliance on these forward-looking statements. The Company disclaims any obligation to update these forward-looking statements to reflect future events or developments.
This presentation is for general information purposes only, without regard to any specific objectives, financial situations or informational needs of any particular person. This presentation does not constitute an offer orinvitation to purchase or subscribe for any securities in any jurisdiction, including the United States. No part of it should form the basis of or be relied upon in connection with any investment decision or any contract orcommitment to purchase or subscribe for any securities. None of our securities may be offered or sold in the United States, without registration under the U.S. Securities Act of 1933, as amended, or pursuant to an exemptionfrom registration there from.
This presentation is confidential and may not be copied or disseminated, in whole or in part, and in any manner.
Valorem Advisors Disclaimer:
Valorem Advisors is an Independent Investor Relations Management Service company. This Presentation has been prepared by Valorem Advisors based on information and data which the Company considers reliable, butValorem Advisors and the Company makes no representation or warranty, express or implied, whatsoever, and no reliance shall be placed on, the truth, accuracy, completeness, fairness and reasonableness of the contents ofthis Presentation. This Presentation may not be all inclusive and may not contain all of the information that you may consider material. Any liability in respect of the contents of, or any omission from, this Presentation isexpressly excluded. Valorem Advisors also hereby certifies that the directors or employees of Valorem Advisors do not own any stock in personal or company capacity of the Company under review.
For further information please contact our Investor Relations Representative:
Mr. Anuj SonpalValorem AdvisorsTel: +91-22-4903-9500Email: [email protected]
17

THANK YOU