Early Learning and Childcare Expansion Delivery Progress ... · 5 | Early Learning and Childcare...
15
1 | Early Learning and Childcare Expansion Delivery Progress Early Learning and Childcare Expansion Delivery Progress Report June 2019
Transcript of Early Learning and Childcare Expansion Delivery Progress ... · 5 | Early Learning and Childcare...

1 | Early Learning and Childcare Expansion Delivery Progress
Early Learning and Childcare Expansion Delivery Progress ReportJune 2019

2 | Early Learning and Childcare Expansion Delivery Progress
Key Messages 3
Background and context 4
Objectives, approach and methodology 5
Responses 6
Analysis 7
Conclusions and Next Steps 12
Appendix 1 - The Indicators 13
Contents

3 | Early Learning and Childcare Expansion Delivery Progress
Key Messages• This is the second in a series of data releases which track the progress towards
achieving the expansion of funded early learning and childcare hours to 1140 a year from August 2020.
• The data for the second period shows that uptake at April 2019 was broadly in line with forecast figures, while capacity and workforce were slightly behind forecasted figures
• The One Year To Go returns indicate a large increase in both capacity and workforce is expected between April and August, coinciding with the start of the academic year
• While the national picture shows that results are broadly in line with forecast, within that there remains variability at local level.
• It should be noted that the majority of changes across all indicators are planned to take place between August 2019 and August 2020, with a significant increase forecast in period 5 (summer 2020).
• Many local authorities have indicated that their implementation plans have changed and will welcome the opportunity to update their forecasts in September 2019

4 | Early Learning and Childcare Expansion Delivery Progress
The Scottish Government and Local Government are committed to increasing funded Early Learning and Childcare entitlement to 1140 hours per year from August 2020 for all 3 and 4-year-olds and for eligible 2-year-olds. The expansion is a cornerstone in helping every child to fulfil their potential and to close the poverty-related attainment gap.
To provide information on the implementation of this commitment, the Improvement Service (IS) and Scottish Futures Trust (SFT) collect and analyse data on the progress of the delivery of the expansion programmes across local authorities.
The Joint Delivery Board, co-chaired by the Minister for Children and Young People and the COSLA Spokesperson for Children and Young People, is responsible for reviewing progress towards implementation of the 1140 hours offer across all 32 local authorities and for agreeing actions to mitigate risk, respond to emerging issues or put support in place where that may be required.
Background and context

5 | Early Learning and Childcare Expansion Delivery Progress
Objectives, approach and methodologyThe purpose of this report is to provide data and analysis for the period 1st October 2018 to 30th April 2019, and for predicted positions at One Year to Go (in August 2019). Based on the data collected by the IS and SFT, this joint report records progress made during the reporting period on key readiness indicators. More information on each indicator can be found below in Annex 1.
Although the IS and SFT have liaised with individual local authorities in seeking to ensure consistency of data returns, they have not undertaken an audit of the data, systems and processes used to capture the data within the 32 local authorities. The data submitted by local authorities is, therefore, presented in good faith without having been audited by the IS or SFT.
In terms of the data collected by the IS, all 32 Scottish local authorities were issued with Period 2 and One Year To Go templates and guidance documents containing instructions for completing the templates and detailed definitions for each indicator.
SFT collects ELC infrastructure data on a quarterly basis from local authorities.

6 | Early Learning and Childcare Expansion Delivery Progress
All 32 local authorities provided data for the period, though not all local authorities provided all data. In respect of the data collected by the IS, one local authority was unable to provide data for reporting period 2. Data from this local authority is therefore excluded from this report.
The forecast data is the figure that has been forecast for the period for each indicator, which reflects the authorities’ ELC expansion programme plans. The actual data relates to the local authorities’ actual position for the period in respect of each indicator.
In isolation, the data does not offer insight into why forecasts have or have not been met in each authority and it does not necessarily follow that those who have not met the forecast are behind in their project delivery. As such, local authorities were able provide a free text narrative along with the data. This allows us to better understand the data, including areas of good practice as well as challenges.
Many local authorities have indicated that their implementation plans have changed and will welcome the opportunity to update their forecasts in September 2019.
In addition to Period 2 reporting, local authorities were asked to predict their delivery progress in August 2019, to provide a national picture of progress made with one year to go to deliver the ELC Expansion to communities from August 2020.
The ELC infrastructure data is based on information collected by SFT up to June 2019.
Responses

7 | Early Learning and Childcare Expansion Delivery Progress
Number of 2-year-olds receiving more than 600 hours funded ELC
The number of 2-year-olds receiving more than 600 hours funded ELC is in line with the figure forecasted for the period. The forecast uptake for 2-year-olds for more than 600 hours funded ELC for the period was 2,263 children. The actual figure was 1.3% lower than forecast at 2,233 children. In some instances, expanded hours had been rolled out in settings earlier than originally forecast due to evolving plans, compensating for instances when other councils have delayed roll out.
Number of 3 to 5-year-olds receiving more than 600 hours funded ELC
The number of 3 to 5-year-olds receiving more than 600 hours funded ELC is in line with the
Analysis

8 | Early Learning and Childcare Expansion Delivery Progress
figure forecasted for the period. The forecast uptake for 3 to 5-year-olds for more than 600 hours funded ELC was 18,282 children for the period. The actual figure was 3.8% lower than forecast at 17,595 children. It should be noted however that there is significant variation in progress with early phasing of ELC Expansion in some local authorities, and with 52% of local authorities behind their original forecast. A number of local authorities provided narrative indicating that their implementation plans have changed and will welcome the opportunity to update their forecasts in September 2019.
The data showed that by the end of August, the uptake for 3 to 5-year-olds receiving more than 600 hours funded ELC is predicted to be more than double the figure reported for the end of Period 2. This coincides with the start of a new academic year during which more settings will become involved in phasing in of the expanded entitlement and the pace of implementation will increase.
Provision in local authority, private partner and childminder settingsThe graphs below show the proportion of uptake that is reported for the various provider types at different reporting periods.
The pie chart on the left shows that for period 2, nationally it was forecast that 12% of provision would be supplied in private settings, compared to 87% in local authority settings, with the remainder being taken by childminders. The pie chart on the right shows that the actual provision in private settings was higher than forecast (20%). This is in line with narrative collected in the returns, which indicates that for phasing of the expansion, local authorities are tending to involve private and third sector providers in phasing in the expanded entitlement.
9 | Early Learning and Childcare Expansion Delivery Progress
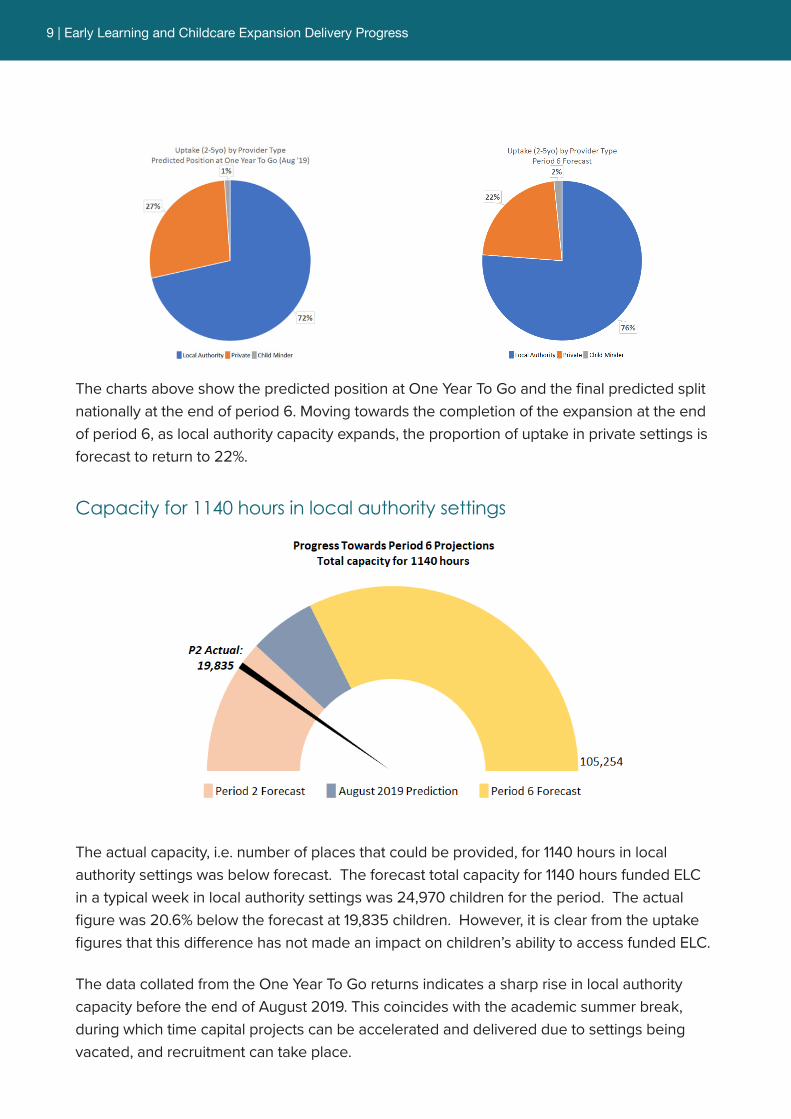
The charts above show the predicted position at One Year To Go and the final predicted split nationally at the end of period 6. Moving towards the completion of the expansion at the end of period 6, as local authority capacity expands, the proportion of uptake in private settings is forecast to return to 22%.
Capacity for 1140 hours in local authority settings
The actual capacity, i.e. number of places that could be provided, for 1140 hours in local authority settings was below forecast. The forecast total capacity for 1140 hours funded ELC in a typical week in local authority settings was 24,970 children for the period. The actual figure was 20.6% below the forecast at 19,835 children. However, it is clear from the uptake figures that this difference has not made an impact on children’s ability to access funded ELC.
The data collated from the One Year To Go returns indicates a sharp rise in local authority capacity before the end of August 2019. This coincides with the academic summer break, during which time capital projects can be accelerated and delivered due to settings being vacated, and recruitment can take place.

10 | Early Learning and Childcare Expansion Delivery Progress
Additional local authority staff in place
Recruitment was lower than forecast for the period. The forecast number of additional full-time equivalent (FTE) staff in place for the period was 2,589. The actual figure for the period was 16.1% less than forecast at 2,173 FTE
Narrative provided by some authorities tells us that there have been local challenges in recruiting to some roles. However, it is also the case for some authorities that the number of staff recruited has been below forecast because of a change in recruitment plans. As mentioned above, a number of local authorities provided narrative indicating that their implementation plans have changed and will welcome the opportunity to update their forecasts in September 2019.
InfrastructureThe table below gives a breakdown of the number of Refurbishment, Extension and New Build projects reported to SFT as being either ‘Complete’, ‘In Construction’ or ‘In Development’.
Project Status January 2019 June 2019
Complete 70 119
In Construction 28 44
In Development 679 738
Total 777 901
The increased number of projects relates, in part, to a change in the reporting approach of some local authorities and the reclassification of some project from outdoor to refurbishment

11 | Early Learning and Childcare Expansion Delivery Progress
projects creating indoor/outdoor facilities. There has been an increase in the number of refurbishment projects. This is in line with SG’s planning guidance of 2017 which encouraged making full use of existing assets.
The planned infrastructure capacity being developed is in line with the estimate of March 2018. Approximately 10% of the planned additional capacity is now complete. While the forecast trajectory of additional infrastructure capacity shows a significant increase in August 2019, there remains a major step change in capacity becoming available in August 2019 and August 2020.
12 | Early Learning and Childcare Expansion Delivery Progress
Data on the progress of the delivery of the ELC expansion will continue to be collected bi-annually by the IS, with reports published tracking the progress towards the delivery of 1140 hours funded ELC. There will also be an additional data collection in September 2019 to review actual progress by August 2019. At this point, local authorities will also have the opportunity to amend their forecasts to reflect any changes in implementation plans.
This will be complemented by SFT’s quarterly tracking of progress on ELC infrastructure delivery.
The data collection will be subject to ongoing refinement with an understanding that a balance needs to be maintained between improvement and continuity and the ability to conduct an analysis across periods to show how the expansion is progressing.
The data collected now and going forward will inform discussions at the Joint Delivery Board for the Expansion of Early Learning and Childcare Programme and influence actions taken at a Programme level.
Conclusions and Next Steps
13 | Early Learning and Childcare Expansion Delivery Progress
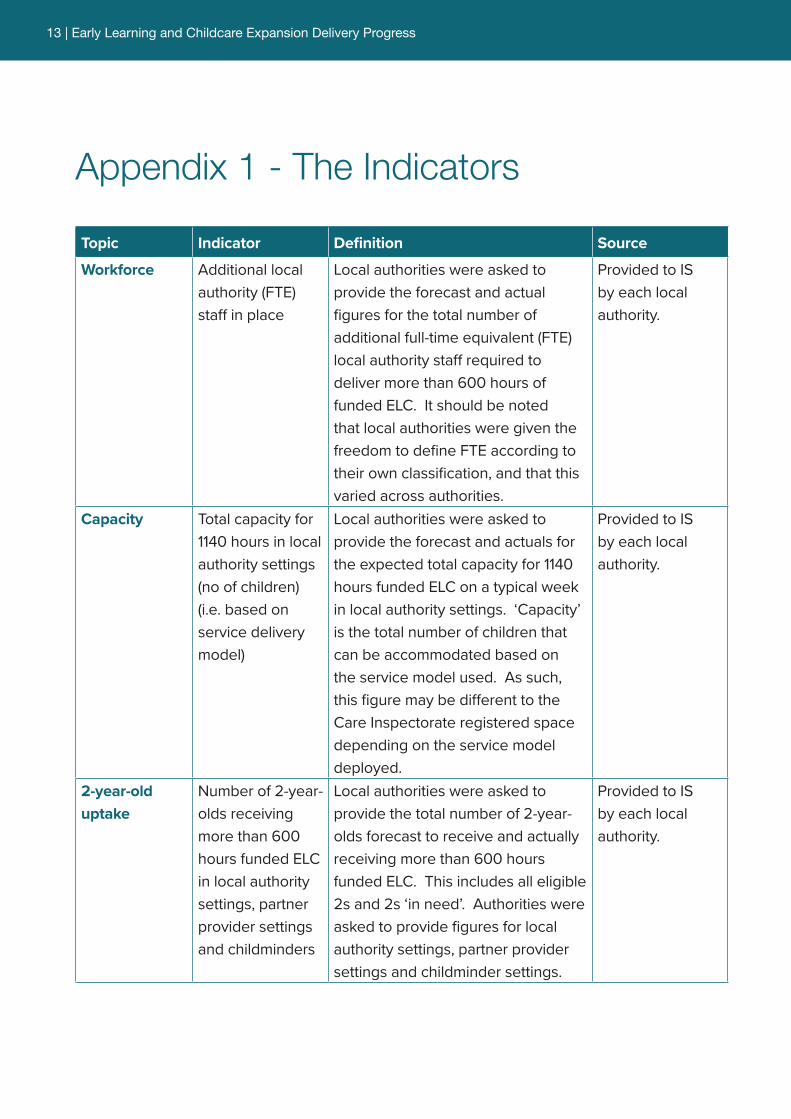
Topic Indicator Definition Source
Workforce Additional local authority (FTE) staff in place
Local authorities were asked to provide the forecast and actual figures for the total number of additional full-time equivalent (FTE) local authority staff required to deliver more than 600 hours of funded ELC. It should be noted that local authorities were given the freedom to define FTE according to their own classification, and that this varied across authorities.
Provided to IS by each local authority.
Capacity Total capacity for 1140 hours in local authority settings (no of children) (i.e. based on service delivery model)
Local authorities were asked to provide the forecast and actuals for the expected total capacity for 1140 hours funded ELC on a typical week in local authority settings. ‘Capacity’ is the total number of children that can be accommodated based on the service model used. As such, this figure may be different to the Care Inspectorate registered space depending on the service model deployed.
Provided to IS by each local authority.
2-year-old uptake
Number of 2-year-olds receiving more than 600 hours funded ELC in local authority settings, partner provider settings and childminders
Local authorities were asked to provide the total number of 2-year-olds forecast to receive and actually receiving more than 600 hours funded ELC. This includes all eligible 2s and 2s ‘in need’. Authorities were asked to provide figures for local authority settings, partner provider settings and childminder settings.
Provided to IS by each local authority.
Appendix 1 - The Indicators

14 | Early Learning and Childcare Expansion Delivery Progress
Topic Indicator Definition Source
3 to 5-year-old uptake
Number of 3, 4 and 5-year-olds receiving more than 600 hours funded ELC in local authority settings, partner provider settings and childminders
Local authorities were asked to provide the total number of 3 to 5-year-olds forecast to receive and actually receiving more than 600 hours funded ELC. Authorities were asked to provide figures for local authority settings, partner provider settings and childminder settings.
Provided to IS by each local authority.
Infrastructure Number of capital projects completed, in construction and being developed by local authorities.
Local authorities were asked to provide the total number of capital projects completed, in construction and in development within their local authority.
Provided to SFT by each local authority.

Improvement ServiceiHubQuarrywood CourtLivingston EH54 6AX
T. 01506 282012E. [email protected]. www.improvementservice.org.uk
July
201
9