Identification of therapeutic targets applicable to clinical strategies in ...

403
Dr. Bruce Bracken is Professor in school psychology and counselor education and the Center for Gifted Education at The College of William and Mary. Dr. Elissa Brown is State Consultant for gifted educa-tion at the North Carolina Department of Public Instruction.
Journal for the Education of the Gifted. Vol. 31, No. 4, 2008, pp. 403–426. Copyright ©2008 Prufrock Press Inc., http://www.prufrock.com
Early Identification of High-Ability Students: Clinical Assessment of Behavior
Bruce A. Bracken and Elissa F. Brown The College of William & Mary
this study investigated the ability of teachers to accurately rate the cognitive and aca-demic functioning of 1,375 students in kindergarten through the third grade on the Clinical assessment of Behavior (CaB), as compared to two objective cognitive abil-ity tests. CaB teacher ratings were compared for high-ability students who were cur-rently functioning with ability test scores ≥ 120; comparisons also were made across the students’ full ability range and according to their race/ethnicity. the Bracken Basic Concept Scale–revised and the Naglieri Nonverbal ability test were contrasted with the CaB in terms of the proportions of culturally diverse students identified as high ability. a discernable CaB scale and cluster profile was evident for high-ability students, showing significantly better adjustment among the high-ability students as compared to the typical student from the general population. High-ability students evidenced adaptive strengths on the CaB Social Skills and Competence scales and on the Executive function and Gifted and talented clusters.
The purpose of this study was to further validate the Clinical Assessment of Behavior (CAB; Bracken & Keith, 2004), a compre-hensive teacher-completed rating scale, against two well-known, objective cognitive ability tests in the identification of high-ability young students. This study employed objective verbal and nonverbal measures to first determine students’ level of cognitive functioning and then compared students’ behaviors on the teacher-completed behavior rating scale. Use of a behavior rating scale and two objec-tive ability measures provided a broader conceptualization of student functioning than usual, allowing for a multidimensional identifica-tion process (i.e., verbal, nonverbal, and behavioral components of students’ ability).

Journal for the Education of the Gifted404
Gifted education literature contains more citations related to identification than any other topic. Despite attention devoted to the topic, identification continues as one of the most pervasive problems cited by school district personnel and state department coordinators who administer programs and services to gifted children ( Jarosewich, Pfeiffer, & Morris, 2002; VanTassel-Baska & Feng, 2004). Moreover, societal concerns about fair and equitable identification of high-abil-ity students from diverse sociocultural backgrounds (e.g., economi-cally disadvantaged, diverse backgrounds, limited English language proficiency, twice-exceptional gifted learners) have created additional challenges for educators (Bracken & McCallum, 1998; Ford, 1996) and the U.S. Office of Civil Rights.
Historically, school districts have employed standardized achievement and/or intelligence tests to identify gifted students for their intellectual and academic precocities, leaving “nonintellectual” domains neither seriously considered nor systematically assessed (Benbow & Lubinski, 1995; Coleman & Gallagher, 1995; Jarosewich et al., 2002). The continued search for effective nontraditional iden-tification procedures demonstrates how dissatisfied the field of gifted education has become over the singular use of traditional tools that historically have yielded an underrepresentation of students of color, students of poverty, students from culturally or linguistically differ-ent backgrounds, and students with uneven academic profiles. In an effort to promote equitable identification of gifted minority stu-dents, Frasier (1987) documented a list of best practices, based on Torrance’s (1982) compilation of observable strengths of culturally diverse high-ability students; these compiled strengths and best prac-tices have stood the test of time and continue to guide the field. Conceptions and definitions of giftedness vary within the broader field of education according to disparate theories of intelligence and talent development, student demographic characteristics (e.g., lan-guage and cultural backgrounds), nonintellective factors considered important in the definition of exceptionality (Benbow & Stanley, 1996; Bracken & McCallum, 1998; Carroll, 1993; Csikszentmihalyi, 2000; Gardner, 1983, 1999; Jensen, 1998), and official local or state identification procedures. These various definitional conceptions of gifted and talented affect the ways in which educators and policy mak-ers apply and weight criteria for purposes of gifted identification and

Early Identification 405
educational programming, resulting in more confusion in the identi-fication process than possibly any other student exceptionality. Compounding the identification process is the concern for equity in identification and the proportionately smaller number of students who are identified as gifted from diverse backgrounds, as compared to White, middle-class students (Ford & Harmon, 2001). Many educators in gifted education promote broader conceptual-izations of giftedness in an effort to increase the number and rep-resentation of low-socioeconomic and culturally diverse students in gifted programs (Ford, 1996; VanTassel-Baska, Patton, & Prillaman, 1991). Moreover, to enhance equity in assessments and fairness in placement, several researchers have proposed supplementing or replacing standardized verbally oriented tests with nonverbal tests of intelligence or cognitive ability, especially for students for whom lan-guage-loaded tests produce construct-irrelevant variance (Bracken & McCallum, 1998, 2007; Lewis, 2001; Naglieri & Kaufman, 2001; Naglieri & Ford, 2005). Bracken (2008); Bracken, VanTassel-Baska, Brown, and Feng (2007); Mills and Tissot (1995); and Naglieri and Ford (2005) collectively provided evidence that nonverbal ability measures contribute to the identification of more representative pro-portions of minority students for gifted programs than do traditional language-loaded identification methods alone. However, the use of nonverbal measures to identify more linguistically diverse students who might benefit from the advantages of gifted programs is not a universal goal. For example, Lohman (2006) suggested, “Rather the goal would be to determine if the student displays sufficient readiness to learn in a classroom in which English is the language of instruc-tion” (p. 39). Proponents of alternative identification paradigms acknowledge that students can display giftedness in many ways. They call for more varied, authentic assessments and identification procedures, suggest-ing that programs might best be suited to the student rather than the student to the program. Rather than relying solely on verbally loaded cognitive ability or academic achievement test scores for identifica-tion, multiple criteria can broaden the identification process, includ-ing observing students’ behaviors in learning situations (Passow & Frasier, 1996), using dynamic assessment procedures (Feuerstein, 1986; Kirschenbaum, 1998), and using teacher-completed scales
Journal for the Education of the Gifted406
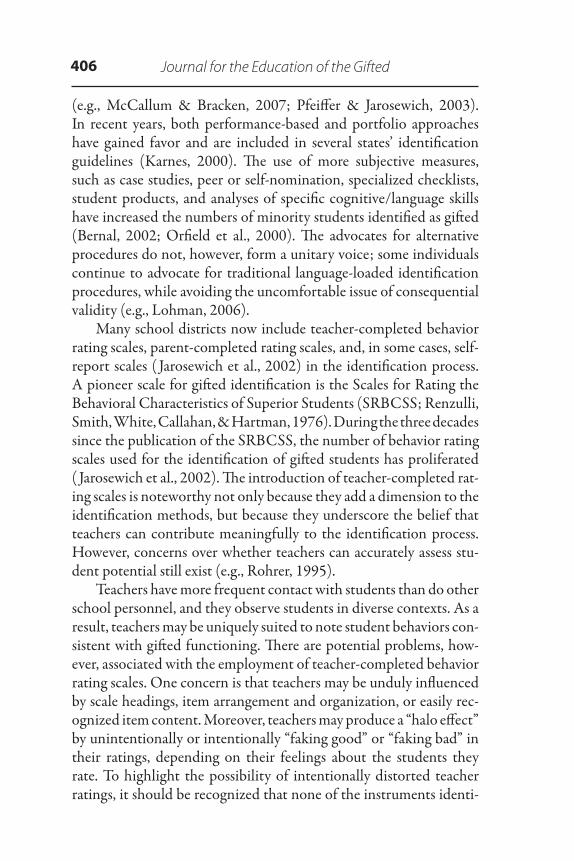
(e.g., McCallum & Bracken, 2007; Pfeiffer & Jarosewich, 2003). In recent years, both performance-based and portfolio approaches have gained favor and are included in several states’ identification guidelines (Karnes, 2000). The use of more subjective measures, such as case studies, peer or self-nomination, specialized checklists, student products, and analyses of specific cognitive/language skills have increased the numbers of minority students identified as gifted (Bernal, 2002; Orfield et al., 2000). The advocates for alternative procedures do not, however, form a unitary voice; some individuals continue to advocate for traditional language-loaded identification procedures, while avoiding the uncomfortable issue of consequential validity (e.g., Lohman, 2006). Many school districts now include teacher-completed behavior rating scales, parent-completed rating scales, and, in some cases, self-report scales ( Jarosewich et al., 2002) in the identification process. A pioneer scale for gifted identification is the Scales for Rating the Behavioral Characteristics of Superior Students (SRBCSS; Renzulli, Smith, White, Callahan, & Hartman, 1976). During the three decades since the publication of the SRBCSS, the number of behavior rating scales used for the identification of gifted students has proliferated ( Jarosewich et al., 2002). The introduction of teacher-completed rat-ing scales is noteworthy not only because they add a dimension to the identification methods, but because they underscore the belief that teachers can contribute meaningfully to the identification process. However, concerns over whether teachers can accurately assess stu-dent potential still exist (e.g., Rohrer, 1995). Teachers have more frequent contact with students than do other school personnel, and they observe students in diverse contexts. As a result, teachers may be uniquely suited to note student behaviors con-sistent with gifted functioning. There are potential problems, how-ever, associated with the employment of teacher-completed behavior rating scales. One concern is that teachers may be unduly influenced by scale headings, item arrangement and organization, or easily rec-ognized item content. Moreover, teachers may produce a “halo effect” by unintentionally or intentionally “faking good” or “faking bad” in their ratings, depending on their feelings about the students they rate. To highlight the possibility of intentionally distorted teacher ratings, it should be recognized that none of the instruments identi-
Early Identification 407
fied in the Jarosewich et al. (2002) review include veracity scales to identify inconsistent or questionable ratings or behavioral profiles. A relatively new instrument contributing to the assessment of gifted and talented students addresses the aforementioned problems associ-ated with rating scales. The CAB (Bracken & Keith, 2004) is a com-prehensive teacher- and parent-completed rating scale for children and adolescents (ages 2 years through 18 years). The test authors distributed CAB items consistent with gifted and talented behaviors across the entire 70-item scale. Whereas the authors worded some items on the CAB Gifted and Talented cluster positively, other items were worded negatively and are reverse scored. Variable wording and item weighting helps conceal item assignment. Significantly, the CAB includes no scale headings to identify item-to-scale relationships. Adaptive and maladaptive behavior items are commingled through-out the instrument, and, importantly, the CAB includes an embed-ded veracity scale designed to identify possible rater distortion. Bracken and Brown (2006) asked 22 teachers and administra-tors, representing the full K–12 grade range, to rate 45 previously identified gifted students and 45 nonexceptional regular education students on the Teacher form of the CAB in a contrasted-groups vali-dation effort. Gifted and regular education students in the Bracken and Brown study ranged in age from 5 to 18 years and included White, Black, and Hispanic youth. The CAB differentiated gifted and regular education students, with gifted students achieving sig-nificantly higher ratings than regular education students on CAB adaptive scales and clusters (i.e., Competence, Executive Function, Gifted and Talented) and significantly lower scores on all measures of maladaptive behavior, and produced a clearly discernable gifted scale and cluster profile. Notably, neither the teachers nor the admin-istrators in the Bracken and Brown study produced atypical profiles, suggesting veracity in their responses.
The current study expands previous CAB validation efforts by employing a nonverbal test of cognitive ability and a language-based measure of basic concepts as objective measures for identifying high-functioning students, against which the researchers independently compared CAB teacher ratings. Additionally, this study extended the use of the CAB downward to lower primary grades (i.e., kindergar-ten through third grade), and employed a larger, more diverse sample

Journal for the Education of the Gifted408
of students from several Title I schools than the original Bracken and Brown (2006) study.
Method
Participants
The sample for this study comprised students from a large urban school district in Northern Virginia and a midsized rural district in Coastal Virginia. All participants were enrolled in kindergar-ten through third grade and were participants in Project Clarion, a federally funded curriculum scale-up intervention project with sci-ence as its curricular focus. Project Clarion personnel administered several instruments to students to gather baseline data during the project; this current investigation includes all students who were administered one or both of two ability tests, the Bracken Basic Concept Scale–Revised (BBCS-R; Bracken, 1998) and the Naglieri Nonverbal Ability Test (NNAT; Naglieri, 1991). The second condi-tion for inclusion in this investigation required that students be rated by their respective teachers on the Clinical Assessment of Behavior–Teacher (CAB-T; Bracken & Keith, 2004). In total, 1,375 students were included in the project database. From this total, 465 students had scores for all three instruments contributing to the BBCS-R/NNAT/CAB-T analyses, leaving 910 students that had only com-binations of two test scores, including the BBCS-R/CAB-T (n = 330) and NNAT/CAB-T (n = 287). When the BBCS-R/NNAT/CAB-T analyses were conducted, all students who had BBCS-R/CAB-T scores (i.e., 465 + 330 = 795 students’ scores) and NNAT/CAB-T scores (i.e., 465 + 287 = 752 students’ scores) were analyzed. So, additively, the sample summed to 1,082 (i.e., 465 + 330 + 287 = 1,082 students). Students with either BBCS-R or NNAT scores with-out corresponding CAB-T scores (n = 292) were not included in the study. Table 1 presents the participants’ demographic characteristics by race/ethnicity, grade level, and gender for the three respective subsamples included in the analyses (i.e., BBCS-R/CAB-T; NNAT/CAB-T; BBCS-R and NNAT/CAB-T).

Early Identification 409
Table 1
Number of Students by Race/Ethnicity, Grade, and Gender for BBCS-R Sample (n = 795)
and NNAT Sample (n = 752)
BBCS-R Sample NNAT SampleRace/Ethnicity Male Female Male FemaleAfrican American 39 47 24 41
Kindergarten 13 19 5 4First 9 13 7 8Second 17 15 1 19Pre-K/Third* 0 0 11 10
Asian American 60 65 44 45Kindergarten 26 27 2 0First 18 26 8 13Second 13 10 25 16Pre-K/Third* 3 2 9 16
Caucasian 179 180 236 220Kindergarten 70 76 53 53First 70 57 60 54Second 39 45 68 58Pre-K/Third* 0 2 55 55
Hispanic 99 104 44 59Kindergarten 45 41 0 1First 32 46 8 17Second 17 14 26 28Pre-K/Third* 5 3 10 13
Native American 1 3 2 4Kindergarten 0 2 0 1First 1 0 1 0Second 0 1 0 1Pre-K/Third* 0 0 1 2
Other 6 14 6 10Kindergarten 4 6 1 0First 2 5 2 3Second 0 3 0 4Pre-K/Third* 0 0 3 3
Note. *BBCS-R sample included prekindergarten but no third-grade students, with 8 cases missing demographics; NNAT sample included third-grade students but no prekindergarten students, with 7 cases missing demographics.

Journal for the Education of the Gifted410
Instruments
The researchers supervised student/staff administration of the three tests to gather baseline data on all students prior to implementation of the science scale-up curriculum. The three instruments adminis-tered to the young students were the BBCS-R as a measure of verbal comprehension and concept development, the NNAT as a measure of nonverbal spatial reasoning, and the CAB-T as a teacher rating of students’ adaptive and maladaptive behaviors.
Bracken Basic Concept Scale-revised (BBCS-r). The BBCS-R assesses students’ understanding of 308 basic language concepts distributed across 11 conceptual categories, including Colors, Letters, Numbers/Counting, Sizes, Comparisons, Shapes, Direction/Position, Self/Social Awareness, Texture/Material, Quantity, and Time/Sequence. Basic concepts are foundational for students’ understanding of class-room directions and instruction, as well as discussions about all curricular content areas (Boehm, Kaplan, & Reddy, 1980). Basic con-cepts also are replete in the directions to early childhood intelligence and achievement tests (Bracken, 1986; Cummings & Nelson, 1980; Flanagan, Alfonso, Kiminer, & Rader, 1995; Kaufman, 1978).
The BBCS-R employs a score metric with a mean of 100 and standard deviation set at 15 and has excellent psychometric charac-teristics, with overall total scale internal consistency (i.e., coefficient alpha) ranging from .96 to .99 across the instruments’ 2- to 7-year age levels.
As a revised instrument, the BBCS-R has a deep history of vali-dation since its original publication in 1984; interested readers may review the Examiner’s Manual for a summary of this validation his-tory (Bracken, 1998). More recently, as a form of construct validation, Bracken and Crawford (2006) conducted a comparative analysis of early childhood educational standards in each of the 50 United States and examined the extent to which each state expects students to have mastered BBCS-R concepts at various grade levels (i.e., prekinder-garten through grade 2). Bracken and Crawford found that all states expect children to acquire concepts from each of the 11 BBCS-R conceptual categories to lesser or greater degrees, although no state includes all 308 Bracken concepts in its state standards or addresses
Early Identification 411
concept acquisition from a comprehensive, systematic theoretical model.
Clinical assessment of Behavior (CaB). The CAB is a brief, yet com-prehensive teacher- and parent-completed behavior rating scale that assesses both adaptive and maladaptive behaviors in children and ado-lescents between 2 and 18 years. The CAB employs a T-score metric, with a mean of 50 and standard deviation of 10. In this study, stu-dents were rated by their classroom teachers with the CAB-Teacher form (i.e., CAB-T).
The CAB-T comprises a hierarchical arrangement of clinical and adaptive scales and briefer more targeted clusters. The CAB-T pro-vides two clinical scales (i.e., Internalizing, Externalizing) and two adaptive scales (i.e., Social Skills, Competence). The CAB-T also assesses students’ behaviors in specific areas of functioning within the following clinical and adaptive behavioral clusters: Anxiety, Depression, Anger, Aggression, Bullying, Conduct Problems, Attention Deficit Disorder, Autistic Spectrum, Learning Disability, Mental Retardation, Executive Function, and Gifted and Talented.
The CAB Examiner’s Manual reports an extensive summary of the instrument’s reliability and validity data (Bracken & Keith, 2004). CAB-T reliability is very strong, with the CAB total scale alpha coef-ficient equal to .99; total sample alpha coefficients are greater than .90 for all scales and clusters. CAB stability quotients are similarly strong; see Table 2 for the normative sample’s internal consistency and stability coefficients for each of the CAB-T scales and clusters. The CAB Examiner’s Manual reports reliabilities of comparable mag-nitudes for males, females, Whites, Blacks, Hispanics, and a clinical sample. CAB parent-teacher interrater reliability is also presented in Table 2, evidencing moderate levels of ratings by different raters and different contexts. Of particular interest in this study was the investigation of the extent to which the CAB-T ability-related scales and clusters are sensitive to a full range of students’ ability, as independently assessed on the BBCS-R and NNAT. Also, the researchers investigated the extent to which the CAB-T was sensitive to the identification of high-ability students (i.e., those with BBCS-R or NNAT total scale scores at or above 120).

Journal for the Education of the Gifted412
Naglieri Nonverbal ability test (NNat). The NNAT is a 38-item matrix analogy test with nonverbal content (i.e., spatial reasoning analogies), with minimal verbal directions. The NNAT has accept-able levels of reliability for screening and research purposes, and the instrument is widely used for the identification of gifted students (e.g., Naglieri & Ford, 2005). The NNAT is available in multiple grade-based forms, has a brief administration time (i.e., 30 minutes), produces standard scores with a mean of 100 (Sd = 15), is adminis-
Table 2
CAB-T Total Sample Scale and Cluster Internal Consistency and Stability Coefficients
Scales and ClustersNumber of
ItemsCoefficient
AlphaStability
CoefficientParent-
Teacher rScales*
Internalizing 16 .92 .93 .40Externalizing 18 .98 .93 .54Competence 18 .96 .92 .44Social Skills 18 .96 .93 .58
ClustersAnxiety 11 .92 .93 .47Depression 16 .93 .95 .47Anger 9 .94 .93 .47Aggression 13 .97 .90 .51Bullying 13 .97 .93 .44Conduct Problems 8 .96 .89 .53Attention Deficit/Hyperactivity 20 .97 .92 .53Autistic Spectrum Behaviors 13 .93 .94 .55Learning Disability 15 .95 .93 .54Mental Retardation 12 .95 .95 .56Executive Function 13 .95 .92 .54Gifted and Talented 17 .96 .93 .56
Note. *Each item is assigned to only one scale, but may be assigned to more than one cluster due to shared symptoms across related disorders or conditions. CAB-T total scale internal con-sistency = .99; Stability coefficient = .94; Interrater reliability = .55.

Early Identification 413
tered in either a group or individual format, and may be hand scored or computer scored.
Procedures
Participants enrolled in kindergarten through the third grade in two Virginia Title I schools participated with their teachers in a large-scale science-based curriculum scale-up intervention study called Project Clarion. The project employed a randomized quasi-experi-mental design in which teachers and their respective students were randomly assigned to either experimental or comparison conditions. Experimental classes received project-developed science curriculum units and lessons as part of Project Clarion’s 3-year, federally funded intervention.
With school, teacher, and parent informed consent, participat-ing students were administered the BBCS-R and NNAT as prein-tervention measures, and teachers rated each student’s behavior on the CAB-T. BBCS-R and NNAT examiners were graduate students in gifted education, classroom teachers, and administrators in gifted education in the two school districts. The researchers trained exam-iners in test administration procedures, and all record forms were scored or rescored by the researchers to ensure accuracy of both test administration and scoring. All individual students’ scores were maintained confidentially.
Results
This study sought to answer several questions about the relationship between the three instruments employed in the study, as well as stu-dents’ performance on each of these instruments. First and foremost, the researchers sought to assess Title I students’ verbal and nonverbal abilities using the BBCS-R and NNAT and thereby compare a diverse sample of students’ verbal and nonverbal assessed abilities with teach-ers’ ratings of the students’ adaptive and maladaptive behaviors.
The following research questions were posed:1. What are the BBCS-R, NNAT, and CAB-T performance
characteristics of student participants by race/ethnicity?

Journal for the Education of the Gifted414
2. To what extent do the three CAB-T ability scales/clusters differentiate students’ levels of verbal and nonverbal ability as assessed by the BBCS-R and NNAT?
3. How well do the BBCS-R and NNAT represent high-functioning students (i.e., total scale scores > 120) racially/ethnically as compared to actual student race/ethnicity pro-portions in the general population from which the students were drawn?
4. How do high-functioning students with standard scores at or above 120 on the BBCS-R or NNAT compare behavior-ally to students in the general population?
To address the first research question, BBCS-R, NNAT, and CAB-T total scale means and standard deviations were calculated and are presented by students’ race/ethnicity in Table 3. Because two separate subsets of students were administered the BBCS-R and CAB-T and the NNAT and CAB-T, with a third subset overlapping all three instruments, the resulting subsamples are smaller than the entire CAB-T sample that included all students who took either the BBCS-R or NNAT or those who took both the BBCS-R and NNAT. As can be seen from the BBCS-R, NNAT, and CAB-T means, students in each of the six racial/ethnic groups were functioning in the normal range (i.e., with means +/- 1 SD from the general popula-tion mean). Although the standard deviations show fairly consistent estimates of variance across race/ethnic groups for each instrument, there is considerable variability across instruments. Both the BBCS-R and CAB-T produced standard deviations approximating the gen-eral population parameters for all race/ethnic groups (i.e., standard deviations of 15 and 10, respectively) except for Native Americans, likely due to their small sample size. Inexplicably, the NNAT pro-duced inflated variability for all race/ethnic groups as compared to the general population.
The second research question asked about the extent to which the CAB-T, as a teacher-completed behavior rating scale, would effectively differentiate students’ level of cognitive functioning (i.e., verbal and nonverbal) across the sample’s entire ability range. The CAB-T Competence scale and Executive Function and Gifted and

Early Identification 415
Talented clusters were designed to be sensitive to students’ behaviors that are consistent with their ability to learn and meet their personal needs (Competence); make futuristic plans, execute planful actions, effectively evaluate the quality of those plans (Executive Function); and demonstrate the cognitive, learning, and behavioral dispositions consistent with high-functioning students (Gifted and Talented).
To assess the extent to which the CAB-T effectively differenti-ated different levels of student cognitive functioning, the BBCS-R and NNAT distributions were divided into five ability levels to bet-ter capture group data with samples of sufficient size for reasonable comparisons (i.e., total test scores < 80; 80–89; 90–110; 111–120; > 120). As can be seen in Table 4 and Figures 1 and 2, the CAB-T ability scales/clusters each create similar linear relationships between students’ assessed verbal and nonverbal ability groupings and CAB-T mean scores, with CAB-T means for students with IQs below the population mean (i.e., 100) slightly overpredicting students’ cogni-tive abilities and slightly underpredicting the cognitive abilities of students with above-average IQs. This pattern demonstrates that teachers who completed the group of CAB-T rated students’ abil-ity-related behaviors in a manner fairly consistent with the objective measures; however, individual children’s ratings surely differed con-siderably in some cases. Using multiple measures of ability, objec-
Table 3
Means and Standard Deviations for All Students Administered the BBCS-R (n = 795), NNAT (n = 752),
CAB-T (n = 1,082)
BBCS-R NNAT CAB-TRace/Ethnicity Mean Sd Mean Sd Mean Sd
African American 98.11 12.23 97.04 20.01 46.09 9.98Asian American 91.96 14.66 108.62 21.31 43.64 8.19Caucasian 106.12 12.99 101.70 19.18 42.07 9.44Hispanic 88.60 13.43 96.85 20.31 44.95 8.71Native American 100.25 6.08 101.67 22.56 41.29 8.16Other 103.00 13.41 101.46 22.18 45.96 6.74
Total Sample 98.57 15.31 101.35 19.91 43.50 9.20

Journal for the Education of the Gifted416
tive and subjective, the data are likely to produce different results in many instances due to the difference in objective and subjective renderings and different constructs assessed (i.e., verbal, nonverbal, and behavior). Additionally, there may be instances in which raters see behaviors in students that are consistent with gifted and talented functioning when the child may not be gifted. There is nothing that restricts nongifted students from behaving in ways that are consistent with known gifted behaviors. These findings suggest that the CAB-T teacher ratings may be useful for contributing to the differentiation of students’ behaviors consistent with their level of intellectual func-tioning when evaluating students for possible exceptionality (e.g., mental retardation, giftedness).
Correlations were calculated to investigate the relationship between the three tests using data from students with scores on the CAB-T, BBCS-R, and NNAT (n = 465). The correlations between the BBCS-R and NNAT and the three CAB-T ability scales were of similar magnitudes, although the BBCS-R evidenced a slight advan-
Table 4
CAB-T T-Score Means and Standard Deviations for Different Levels of BBCS-R (n = 795)
and NNAT (n = 752) Total Test Scores
Standard Competence Executive Function Gifted and TalentedScores Mean Sd Mean Sd Mean SdBBCS-R
< 80 50.17 8.30 50.63 8.61 48.89 8.3380–89 52.01 9.07 51.75 8.33 50.47 8.7990–110 56.56 9.82 55.55 8.91 54.82 9.17111–120 57.66 8.62 56.47 8.00 56.11 8.01> 120 62.26 10.72 59.90 9.53 59.87 9.72
NNAT< 80 50.38 8.72 50.83 8.49 49.10 8.5080–89 54.61 10.04 54.82 8.83 52.93 9.5990–110 56.15 9.65 55.30 8.95 54.43 9.15111–120 57.65 9.11 56.36 8.29 56.16 8.21> 120 59.19 10.54 58.11 9.60 57.54 9.77

Early Identification 417
tage over the NNAT in terms of the magnitude of its correlations with the CAB-T. BBCS-R and NNAT correlations with the CAB-T Competence scale were .28 and .22, respectively. Correlations between the BBCS-R and NNAT and the CAB-T Executive Function cluster were .23 and .19, respectively; correlations with the BBCS-R and NNAT and the CAB-T Gifted and Talented cluster were .28 and .23, respectively. Finally, the correlation between the BBCS-R and NNAT as measures of verbal and nonverbal abilities,
45
50
55
60
65
BB
CS-
R<
80
BB
CSR
80–8
9
BB
CS-
R90
–110
BB
CS-
R11
1–12
0
BB
CS-
R>
120
CompetenceExecutive FunctionGifted and Talented
45
50
55
60
65
NN
AT<8
0
NN
AT
80–8
9
NN
AT
90–1
10
NN
AT11
1–12
0
NN
AT
>120
CompetenceExecutive FunctionGifted and Talented
figure 1. Graphical display of teacher ratings on CAB-T Competence scale and Executive Function and Gifted and Talented clusters for students assessed on the BBCS-R.
figure 2. Graphical display of teacher ratings on CAB-T Competence Scale and Executive Function and Gifted and Talented clusters for students assessed on the NNAT.

Journal for the Education of the Gifted418
respectively, produced a moderate coefficient of .34. Correlations between the three instruments were highly significant (p < .001) but accounted for a modest amount of shared variance (i.e., 4% to 12%). The maximum amount of shared variance between the BBCS-R and CAB-T suggests that teacher-rated behaviors of students’ abilities and students’ directly assessed verbal and nonverbal abilities share only modest overlap and that both instruments contribute uniquely to the assessment and identification process.
The heart of the third question was the extent to which the BBCS-R and the NNAT identified students by their race/ethnic backgrounds as compared to their proportion in the population sam-pled. Table 5 reveals that the nonverbal measure (NNAT), more so than the verbal measure (BBCS-R), represented larger proportions of ethnic minority students in the high-ability range. Given that a standard score of 120 is ranked at the 90th percentile, one would anticipate 10% of any group being identified as gifted. If 40% (i.e., 4 times the expected amount) of a group is identified as gifted on an instrument, there is a 400% representation of the group. In this study, the verbally oriented BBCS-R underrepresented all minority race/ethnic groups by as much as 40% to 75%, as compared to their pro-
Table 5
Ethnic/Racial Distribution of Students With Total Test Standard Scores > 120 on the BBCS-R (n = 65)
or NNAT (n = 143) Compared to Representation in the Total Sample
BBCS-R Total Sample NNAT Total SampleRace/Ethnicity n % n % n % n %
African American 2 3.1 76 9.6 10 7.0 75 10.0Asian American 4 6.2 125 15.7 30 21.0 89 11.8Caucasian 52 80.0 359 45.2 87 60.8 456 60.6Hispanic 4 6.2 203 25.5 12 8.4 103 13.7Native American 0 0.0 4 0.5 1 0.7 6 0.8Other 3 4.6 28 3.0 3 2.1 23 3.1
Total 65 100.0 795 100.0 143 100.0 752 100.0Overall % Identified 8.18 19.02

Early Identification 419
portion in the total sample; the NNAT overrepresented all minority groups except Asian Americans students according to the anticipated 10% base rate; Asian American students were overrepresented by nearly 100% on the NNAT.
The meaning of this outcome must be considered in light of the overall identification rate for the two instruments. The NNAT inflated the overall representation of high-ability students by a fairly significant degree. That is, given a standard score of 120 (90th per-centile), one would anticipate that approximately 10% of the stu-dents would score that high or higher and thereby be identified as high functioning. The BBCS-R identified 8.12% of the students as high functioning, which is a proportion very close to the anticipated 10% base rate found in the general population. The NNAT, on the other hand, nearly doubled the anticipated percent of all students identified (i.e., 19.02%). Overall, nearly twice as many students were identified as being high functioning on the NNAT than as identified by the BBCS-R or as one would expect in the general population, a proportion that on the surface appears to serve minority students well but doubles the overall number of students to be served.
Once students had been identified as high functioning on either the BBCS-R (n = 65) or NNAT (n = 143), teachers’ ratings of stu-dents’ adaptive and maladaptive behaviors were culled and compared to students in the general population (i.e., Question 4). Table 6 pres-ents means, standard deviations, and one-sample t-test results for each of the CAB-T scales and clusters for two groups. The samples were categorized according to the ability test used to define high function-ing (i.e., BBCS-R, NNAT). As can be seen in Table 6, students iden-tified as high functioning on both the BBCS-R and NNAT differed significantly from the general population on all CAB-T scales and clusters, even after the one-sample t-test significance was corrected to maintain an overall experiment-wise alpha level of p < .05, using the Bonferroni correction (i.e., .05 divided by the number of contrasts conducted). Although the overall experiment-wise alpha remained at p < .05, the corrected alpha for each t test became a very conserva-tive p < .003, and still all contrasts were significant.
Figure 3 graphically displays the nature of the differences between the high-functioning students’ behavior as compared to the norma-tive sample (i.e., mean T-score of 50). As can be seen in Figure 3, the

Journal for the Education of the Gifted420
high-functioning students had significantly better adaptive behav-iors (i.e., Social Skills, Competence, Executive Function, Gifted and Talented) and significantly fewer identified problem behaviors in all areas assessed. Teachers rated students who were identified as high functioning on the BBCS-R generally higher on the CAB-T ability scales (i.e., Competence, Executive Function, Gifted and Talented)
Table 6
CAB-T T-Score Means, Standard Deviations, and One-Sample T-Test Results for Students with
Total Test Standard Scores > 120 on the BBCS-R (n = 65) or NNAT (n = 143) as Compared to the General
Population
BBCS-R Identified NNAT IdentifiedCAB-T SCALES Mean Sd t Mean Sd t
Internalizing 37.18 10.32 -10.01* 39.48 10.52 -11.96*Externalizing 40.02 12.35 -6.52* 40.99 10.23 -10.54*Social Skills 58.78 10.81 6.55* 57.51 9.28 9.68*Competence 62.65 10.53 9.68 59.27 10.62 10.44*CBI 39.18 10.06 -8.66 40.51 9.87 -11.50*
CAB-T CLUSTERS Mean Sd t Mean Sd tAnxiety 38.32 8.01 -11.76* 40.43 9.98 -12.74*Depression 37.88 9.29 -10.52* 40.34 9.93 -11.64*Anger 40.37 9.73 -7.98* 39.96 9.35 -12.85*Aggression 42.00 10.23 -6.30* 41.36 9.03 -11.43*Bullying 43.05 10.42 -5.38* 42.59 9.04 -9.79*Conduct Problems 42.94 9.64 -5.91* 42.78 9.48 -10.13*ADD/ADHD 40.25 10.49 -7.50* 41.78 9.77 -10.06*Autistic Spectrum 38.46 10.76 -8.65* 41.53 9.36 -10.82*Learning Disability 39.37 8.25 -10.39* 41.90 9.55 -10.13*Mental Retardation 37.95 9.03 -10.75 40.42 9.39 -12.21*Executive Function 60.22 9.21 8.88* 58.17 9.64 10.13*Gifted and Talented 60.08 9.38 8.66* 57.62 9.85 9.26*
Note. t-tests for each instrument were corrected for alpha slippage to p < .003 (i.e., .05/17= .003). * denotes significance at the new p-value.

Early Identification 421
than when the student was identified as high functioning on the NNAT, which suggests that teachers may be more attuned to stu-dents’ verbal skills than nonverbal skills when considering behaviors associated with overall cognitive and academic abilities.
Discussion
The results of this study provide an interesting array of outcomes. The nonverbal NNAT identified nearly twice as many students as being high functioning (i.e., full scale score > 120) than would be antici-pated in a normal distribution (i.e., 19.2% as compared to 10%) and the verbally oriented BBCS-R underidentified the anticipated num-ber of high-functioning students slightly (i.e., 8.12% as compared to 10%). The 10% general population base rate applied to the schools in which the study was conducted may not be accurate; that is, for all the researchers know, the true local base rate might be closer to the 19% produced by the NNAT than the 8% produced by the BBCS-R. Despite this possibility, which is likely a low probability given the
35
40
45
50
55
60
65In
tern
aliz
ing
Exte
rnal
izin
g
Soci
al S
kills
Com
pete
nce
CB
I
Anx
iety
Dep
ress
ion
Ang
er
Agg
ress
ion
Bul
lyin
g
Con
duct
Pro
blem
s
AD
D/A
DH
D
Aut
istic
Spe
ctru
m LD MR
Exec
utiv
e Fu
nctio
n
Gift
ed a
nd T
alen
ted
BBCS-RNNAT
figure 3. CAB-T profiles for students with total test standard scores > 120 on the BBCS-R (n = 65) and NNAT (n = 143). The hyphenated line represents the general population mean T-score of 50.

Journal for the Education of the Gifted422
Title I status of the participating schools, these findings suggest that the NNAT may identify larger numbers of students as high function-ing, which may facilitate the inclusion of more students from diverse backgrounds into programs for high-ability students, as compared to the BBCS-R. On the other hand, using the criterion of SS > 120, the NNAT nearly doubled the number of students to be served.
When the NNAT and BBCS-R total test scores were correlated with teachers’ ratings of students on the CAB-T, the BBCS-R gen-erally produced higher overall correlations than did the NNAT on the three ability domains (i.e., Competence, Executive Function, Gifted and Talented). This finding suggests that teachers’ ratings of students’ behaviors associated with high ability corresponded more closely with students’ assessed verbal abilities than with their nonver-bal abilities. Moreover, the CAB-T ratings, across each of the three ability domains, evidenced a linear relationship between the grouped levels of students’ verbal and nonverbal functioning as determined by the BBCS-R and NNAT, respectively. Thus, the CAB-T ratings appear to be valid and highly reliable estimates of students’ academic and cognitive functioning and may be useful for the identification of students of high ability (e.g., gifted, promising learner, advanced academic students).
High-ability students demonstrated a behavioral pattern on the CAB-T ratings that is consistent with the literature, suggesting that overall high-functioning students are better adjusted psychosocially than less able students. The students in this study, whether identi-fied as high ability on the BBCS-R or NNAT, were significantly bet-ter adjusted than the typical student in both healthy adaptation and lesser pathology or sociopathy. These findings provide additional validation of the sensitivity of the CAB in the assessment of high-ability students.
The CAB-T may serve a promising dual purpose when high-ability students are being assessed during identification screening. The scale is a brief (i.e., 5-minute completion), easily administered teacher-completed behavior rating scale that correlates well with objective ability measures and appears useful for identifying high-ability students. Additionally, the CAB-T may be helpful for iden-tifying students who are twice-exceptional. That is, the CAB-T is designed to identify areas of student psychopathology and sociopathy

Early Identification 423
(e.g., anxiety, depression, conduct disorder), as well as behaviors asso-ciated with educational disorders (e.g., learning disabilities, attention deficit). As such, this brief instrument provides a multidimensional assessment of students’ behavioral functioning (e.g., cognitive abil-ity, problem behaviors, adaptation) in a brief, objective, and reliable manner, which may render it useful for screening a diverse popula-tion of students for gifted programs.
References
Benbow, C., & Lubinski, D. (1995). Optimal development of talent: Respond educationally to individual differences in personality. Educational forum, 59, 381–392.
Benbow, C. P., & Stanley, J. C. (1996). Inequity in equity: How “equity” can lead to inequity for high-potential students. Psychology, Public Policy, and law, 2, 249–292.
Bernal, E. M. (2002). Three ways to achieve a more equitable repre-sentation of culturally and linguistically different students in GT programs. roeper review, 24, 82–88.
Boehm, A. E., Kaplan, C., & Reddy, D. (1980). How important are basic concepts to instruction: Validation of the Boehm test of Basic Concepts. Unpublished manuscript, Columbia University.
Bracken, B. A. (1986). Incidence of basic concepts in the directions of five commonly used American tests of intelligence. School Psychology international, 7, 1–10.
Bracken, B. A. (1998). Bracken Basic Concept Scale–revised. San Antonio, TX: Harcourt Assessments.
Bracken, B. A. (2008). Nontraditional strategies for identifying non-traditional gifted and talented students. In J. VanTassel-Baska (Ed.), alternative assessment with gifted and talented learners (pp. 17–40). Waco, TX: Prufrock Press.
Bracken, B. A., & Brown, E. F. (2006). Behavioral identifica-tion and assessment of gifted and talented students. Journal of Psychoeducational assessment, 24, 112–122.
Bracken, B. A., & Crawford, E. (2006, June). Project Clarion: a concept-based science curriculum. Paper presented at the National Association for the Education of Young People 15th National

Journal for the Education of the Gifted424
Institute for Early Childhood Professional Development, San Antonio, TX.
Bracken, B. A., & Keith, L. K. (2004). Professional manual for the Clinical assessment of Behavior. Lutz, FL: Psychological Assessment Resources.
Bracken, B. A., & McCallum, R. S. (1998). Examiner’s manual for the Universal Nonverbal intelligence test. Itasca, IL: Riverside.
Bracken, B. A., & McCallum, R. S. (2007). UNit Group ability test. Itasca, IL: Riverside. Test in development.
Bracken, B. A., VanTassel-Baska, J., Brown, E. F., & Feng, A. (2007). Project Athena: A tale of two studies. In J. VanTassel-Baska & T. Stambaugh (Eds.), overlooked gems: a national perspective on low-income promising learners (pp. 63–67). Washington, DC: National Association of Gifted Children.
Carroll, J. B. (1993). Human cognitive abilities: a survey of factor-ana-lytic studies. New York: Cambridge University Press.
Coleman, M. R., & Gallagher, J. J. (1995). State identification poli-cies: Gifted students from special populations. roeper review, 17, 268–275.
Csikszentmihalyi, M. (2000). Becoming adult: How teenagers prepare for the world of work. New York: Basic Books.
Cummings, J. A., & Nelson, B. R. (1980). Basic concepts in oral directions of group achievement tests. Journal of Educational research, 73, 159–261.
Feuerstein, R. (1986). Learning potential assessment. Special Services on the Schools, 2, 85–106.
Flanagan, D. P., Alfonso, V. C., Kiminer, T., & Rader, D. E. (1995). Incidence of basic concepts in the directions of new and recently revised American intelligence tests for preschool children. School Psychology international, 16, 345–364.
Ford, D. Y. (1996). Multicultural gifted education: A wake up call to the profession. roeper review, 19, 72–78.
Ford, D., & Harmon, D. (2001). Providing access to gifted educa-tion for culturally diverse students. Journal of Secondary Gifted Education, 3, 141–143.
Frasier, M. M. (1987). The identification of gifted Black students: Developing new perspectives. Journal for the Education of the Gifted, 10, 155–180.

Early Identification 425
Gardner, H. (1983). frames of mind: the theory of multiple intelli-gences. London: Paladin.
Gardner, H. (1999). intelligence reframed. New York: Basic Books.Jarosewich, T., Pfeiffer, S. I., & Morris, J. (2002). Identifying gifted
students using teacher rating scales: A review of existing instru-ments. Journal of Psychoeducational assessment, 20, 322–336.
Jensen, A. R. (1998). the g factor: the science of mental ability. Westport, CT: Greenwood.
Karnes, F. A. (2000). State definitions for the gifted and talented revisited. Exceptional Children, 66, 219–238.
Kaufman, A. S. (1978). The importance of basic concepts in the individual assessment of preschool children. Journal of School Psychology, 16, 208–211.
Kirschenbaum, R. (1998). Dynamic assessment and its use with underserved gifted and talented populations. Gifted Child Quarterly, 42, 140–147.
Lewis, J. D. (2001). language isn’t needed: Nonverbal assessments and gifted learners. East Lansing, Mi: National Center for Research on Teacher Learning. (ERIC Document Reproduction Service No. ED453026)
Lohman, D. F. (2006). Exploring perceptions and awareness of high-ability. Beliefs about differences between ability and accomplish-ment: From folk theories to cognitive science. roeper review, 29, 32–40.
McCallum, R. S., & Bracken, B. A. (2007). Gifted Screening Scales. Itasca, IL: Riverside. Instrument in development.
Mills, C., & Tissot, S. (1995). Identifying academic potential in stu-dents from under-represented populations: Is using the Ravens Progressive Matrices a good idea? Gifted Child Quarterly, 39, 209–217.
Naglieri, J. A. (1991). Naglieri Nonverbal ability test. San Antonio, TX: Harcourt Assessments.
Naglieri, J. A., & Ford, D. Y. (2003). Addressing underrepresentation of gifted minority children using the Naglieri Nonverbal Ability Test (NNAT). Gifted Child Quarterly, 47, 155–160.
Naglieri, J. A., & Ford, D. (2005). Increasing minority children’s par-ticipation in gifted classes using the NNAT: A response to Lohman. Gifted Child Quarterly, 49, 29–36.

Journal for the Education of the Gifted426
Naglieri, J. A., & Kaufman, J. C. (2001). Understanding intelligence, giftedness and creativity using the PASS theory. roeper review, 23, 151–156.
Orfield, G., Kahlenberg, R., Gordon, E., Genesee, F., Slocumb, P., & Payne, R. (2000). The new diversity. Principal, 79, 6–32.
Passow, A. H., & Frasier, M. M. (1996). Toward improving identi-fication of talent potential among minority and disadvantaged students. roeper review, 18, 198–202.
Pfeiffer, S. I., & Jarosewich, T. (2003). Gifted rating Scales. San Antonio, TX: The Psychological Corporation.
Renzulli, J. S., Smith, L. H., White, A. J., Callahan, C. M., & Hartman, R. K. (1976). Scales for rating the behavioral characteristics of supe-rior students. Mansfield Center, CT: Creative Learning Press.
Rohrer, J. C. (1995). Primary teacher conceptions of giftedness: Image, evidence, and nonevidence. Journal for the Education of the Gifted, 18, 269–283.
Torrance, E. P. (1982). Future problem solving and quality circles in schools. NJEa review, 56(1), 20–23
VanTassel-Baska, J., & Feng, A. (2004). designing and utilizing evaluation for gifted program improvement. Waco, TX: Prufrock Press.
VanTassel-Baska, J., Patton, J. M., & Prillaman, D. (1991). Gifted youth at risk: a report of a national study. Arlington, VA: The Council for Exceptional Children.
Author Note
Correspondence should be directed to Bruce A. Bracken, Ph.D., Center for Gifted Education, The College of William & Mary, 427 Scotland Street, Williamsburg, VA 23185.