Eagle Mountain Lake Facility Planning Region - Texas Water
311
.- TARRANT COUNTY WATER CONTROL AND IMPROVEMENT DISTRICT NUMBER ONE TEXAS WATER DEVELOPMENT BOARD Upper West Fork and Clear Fork Trinity River Basin Water Quality and Regional Facility Planning study FINAL REPORT APPENDIX B EAGLE MOUNTAIN LAKE FACILITY PLANNING REGION August 1988 Alan Plummer and Associates, Inc. CIVn./ENVIRONlofENTAL ENGINEERS· ARLINGTON- FORT WORTH. TEXAS f
Transcript of Eagle Mountain Lake Facility Planning Region - Texas Water

.-TARRANT COUNTY WATER CONTROL AND
IMPROVEMENT DISTRICT NUMBER ONE
TEXAS WATER DEVELOPMENT BOARD
Upper West Fork and Clear Fork Trinity River Basin
Water Quality and Regional Facility Planning study
FINAL REPORT
APPENDIX B EAGLE MOUNTAIN LAKE
FACILITY PLANNING REGION
August 1988
Alan Plummer and Associates, Inc. ~ CIVn./ENVIRONlofENTAL ENGINEERS· ARLINGTON-FORT WORTH. TEXAS f

TARRANT COUNTY WATER CONTROL AND IMPROVEMENT DISTRICT NUMBER ONE
TEXAS WATER DEVELOPMENT BOARD
Upper West Fork and Clear Fork Trinity River Basin
Water Quality and Regional Facility Planning Study
FINAL REPORT
APPENDIX B EAGLE MOUNTAIN LAKE
FACIUTY PLANNING REGION
August 1988
Alan Plummer and Associates, Inc. ~ CIVlLjENVIRONWENT.AL ENGINEERS· ARLINGTON-FORT 1I'ORTH.TEXAS ~
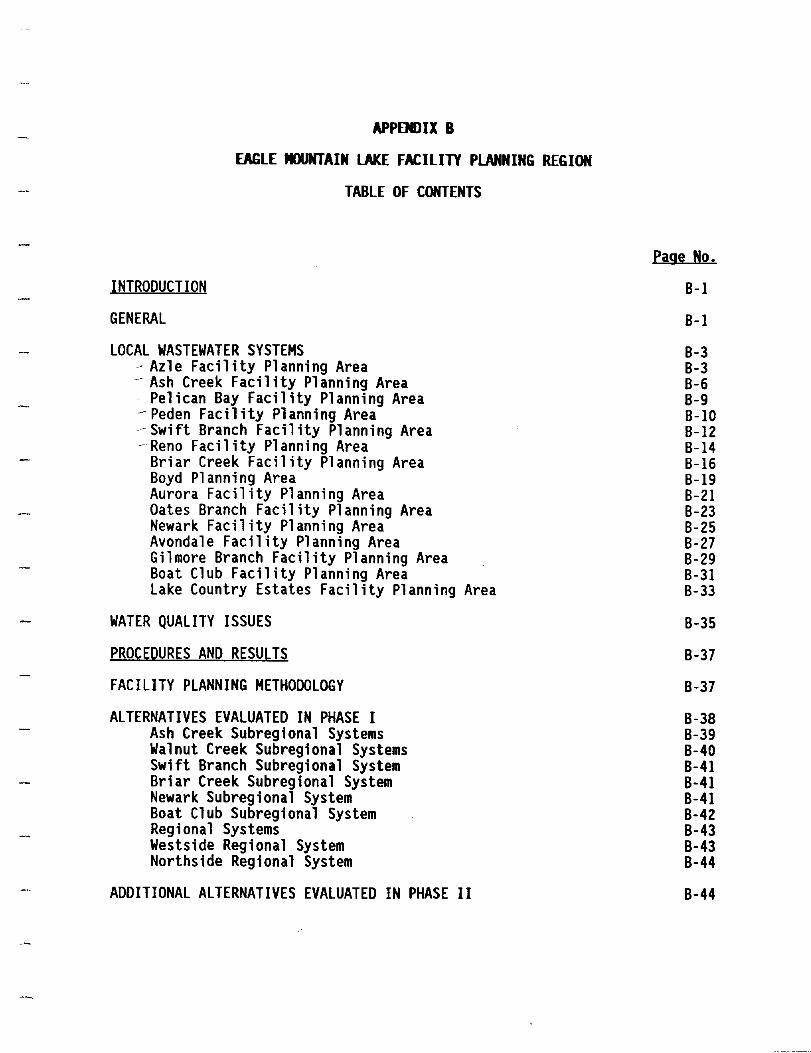
APPENDIX B
EAGLE MOUNTAIN LAKE FACILITY PlANNING REGION
TABLE OF CONTENTS
INTRODUCTION
GENERAL
LOCAL WASTEWATER SYSTEMS - Azl e Facil ity Planni ng Area
- Ash Creek Facility Planning Area . Pelican Bay Facility Planning Area - Peden Facil ity Planning Area --Swift Branch Facility Planning Area -Reno Facility Planning Area
Briar Creek Facility Planning Area Boyd Planning Area Aurora Facility Planning Area Oates Branch Facility Planning Area Newark Facility Planning Area Avondale Facility Planning Area Gilmore Branch Facility Planning Area Boat Club Facility Planning Area Lake Country Estates Facility Planning Area
WATER QUALITY ISSUES
PROCEDURES AND RESULTS
FACILITY PLANNING METHODOLOGY
ALTERNATIVES EVALUATED IN PHASE I Ash Creek Subregional Systems Walnut Creek Subregional Systems Swift Branch Subregional System Briar Creek Subregional System Newark Subregional System Boat Club Subregional System Regional Systems Westside Regional System Northside Regional System
ADDITIONAL ALTERNATIVES EVALUATED IN PHASE II
Page No.
B-1
B-1
B-3 B-3 B-6 B-9 B-I0 B-12 B-14 B-16 B-19 B-21 B-23 B-25 B-27 B-29 B-31 B-33
B-35
B-37
B-37
B-38 B-39 B-40 B-41 B-41 B-41 B-42 8-43 B-43 B-44
8-44
APPOOIX B
EAGLE MOUNTAIN lAKE FACILITY PlANNING REGION
TABLE OF CONTENTS (continued)
WASTEWATER FACILITY CONCLUSIONS AND RECOMMENDATIONS FOR VARIOUS FACILITY PLANNING AREAS
TABLES
fIGURES
Page No.
B-47

GENERAL
APPENDIX B
EAGLE JIXlNTAIN lAKE FACILITY PlANNING REGION
INTRODUCTION
This appendix presents details of Facility Planning efforts conducted for the Eagle Mountain lake Facility Planning Region. Summary results of these detailed descriptions are also presented in Chapter IV of this report. The specific implementation requirements for the study results for the Eagle Mountain lake Region are somewhat contingent upon final conclusions developed by the Texas Water Commission as a result of their water quality mode 1 i ng of Eagl e Mountain lake as well as the outcome of a wastewater discharge permit hearing currently underway for the City of Azle.
The Eagle Mountain lake planning region is shown on Figures 8-1 and 8-2. Also shown are the 16 individual facility planning areas (FPA) which were defined for localized facility planning. The individual planning areas in most cases are drainage basins for the creeks which drain into Eagle Mountain lake. In some instances, however, the boundaries have been modi fi ed to account for pol it i cal boundari es such as city 1 imi ts. Al so included prior to the figures in this appendix is a legend sheet to be used for reference for all subsequent figures.
The FPAs are listed below:
Azle Facility Planning Area Ash Creek Facility Planning Area Pelican Bay Facility Planning Area Peden Facility Planning Area Swift Branch Facility Planning Area Reno Facility Planning Area
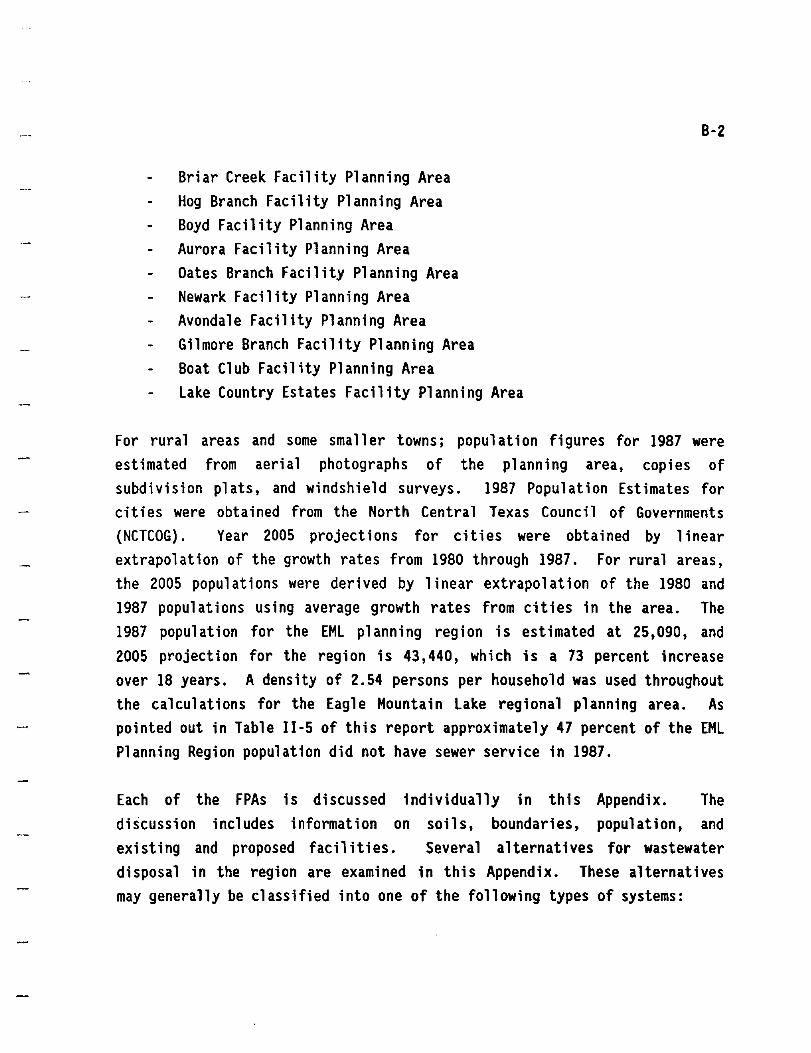
Briar Creek Facility Planning Area Hog Branch Facility Planning Area Boyd Facility Planning Area Aurora Facility Planning Area Oates Branch Facility Planning Area Newark Facility Planning Area Avondale Facility Planning Area Gilmore Branch Facility Planning Area Boat Club Facility Planning Area lake Country Estates Facility Planning Area
B-2
For rural areas and some smaller towns; population figures for 1987 were estimated from aerial photographs of the planning area, copies of subdivision plats, and windshield surveys. 1987 Population Estimates for cities were obtained from the North Central Texas Council of Governments (NCTCOG). Year 2005 projections for cities were obtained by linear extrapolation of the growth rates from 1980 through 1987. For rural areas, the 2005 popul at ions were deri ved by 1 i near extrapo 1 at i on of the 1980 and 1987 populations using average growth rates from cities in the area. The 1987 population for the EMl planning region is estimated at 25,090, and 2005 project i on for the reg i on is 43,440, wh i ch is a 73 percent increase over 18 years. A density of 2.54 persons per household was used throughout the calculations for the Eagle Mountain lake regional planning area. As pOinted out in Table 11-5 of this report approximately 47 percent of the EMl Planning Region population did not have sewer service in 1987.
Each of the FPAs is discussed individually in this Appendix. The discussion includes information on soils, boundaries, population, and existing and proposed facilities. Several alternatives for wastewater disposal in the region are examined in this Appendix. These alternatives may generally be classified into one of the following types of systems:

8-3
1. Individual organized wastewater systems 2. Subregional wastewater systems 3. Regional wastewater systems
For each alternative, the following factors are considered:
1. Effectiveness toward maintaining water quality and public health. 2. Cost of construction and operation. 3. Geographical, political, and other constraints.
In order to analyze the feasibil ity of each type of system, maps were prepared showing general collection system layouts, interceptor routes, and pump station and treatment plant locations. Maps showing the individual system 1 ayouts used for thi s study are i ncl uded herei n. The worksheets which were used to generate the cost information for each of the individual planning area systems, the subregional systems, and the regional systems are included at the end of this appendix.
LOCAL WASTEWATER SYSTEMS
) AIle Facility Planning Area
The City of Azle is located on the southeast shore of Eagle Mountain Lake in northern Tarrant and Parker Counties. State Highway 199 (SH-199) and Farm to Market 730 (FM 730) are the major roads in the planning area. The topography is gently roll ing, ranging in elevation from 650 to 800 feet above sea level. The city is naturally divided by the Ash Creek and Walnut Creek drainage basins, which drain from northwest to southeast into Eagle Mountain Lake.
Soils in the area are classified as clays and clay loams and have the

B-4
following distribution of Soil Conservation Service (SCS) ratings of suitability for use as septic tank absorption fields.
10 percent has slight limitation for use 5 percent has moderate limitations for use
65 percent has severe 1 imitations for use due to slow percolation rates
- 20 percent has severe 1 imitations for use due to shallow rock or flooding
Planning Area Boundaries. The Azle Planning Area includes portions of both the Ash Creek dra i nage bas i n and the Walnut Creek dra i nage bas in. The boundaries are similar to those defined in the Sanitary Sewer Master Plan for the City of Azle (July 1982) by Rady and Associates, Inc., but are expanded on the southwest and modified slightly in other areas. The boundaries are shown on Figures 8-3 and 8-4. Eagle Mountain Lake is the eastern boundary, and the northern and southern boundaries are modified to approximately follow the watershed limits. The planning area under consideration in this study is approximately 2120 acres in the Walnut Creek Basin and 6200 acres in the Ash Creek Basin.
Population. The 1987 North Central Texas Council of Governments (NCTCOG) Population Estimates have a 1987 population figure of 7,750 for the City of Azle, and data from aerial photographs indicate the 1987 population of 930 for the remaining portion of the planning area. The population projection for 2005 for the Azle planning area is 14,250 and for the current city limit area is 10,500. Population growth is occurring inside the city and outside the city limits, in the north, and west-southwest directions. However, the subdivisions outside the city tend to have larger lots, often 2 acres or larger in size. Three subdivisions were identified outside the city limits but in the Azle Facility Planning Area (Ash Creek Acres, Flat Rock, and Silver Creek Estates) with a total of 130 lots.
B-5
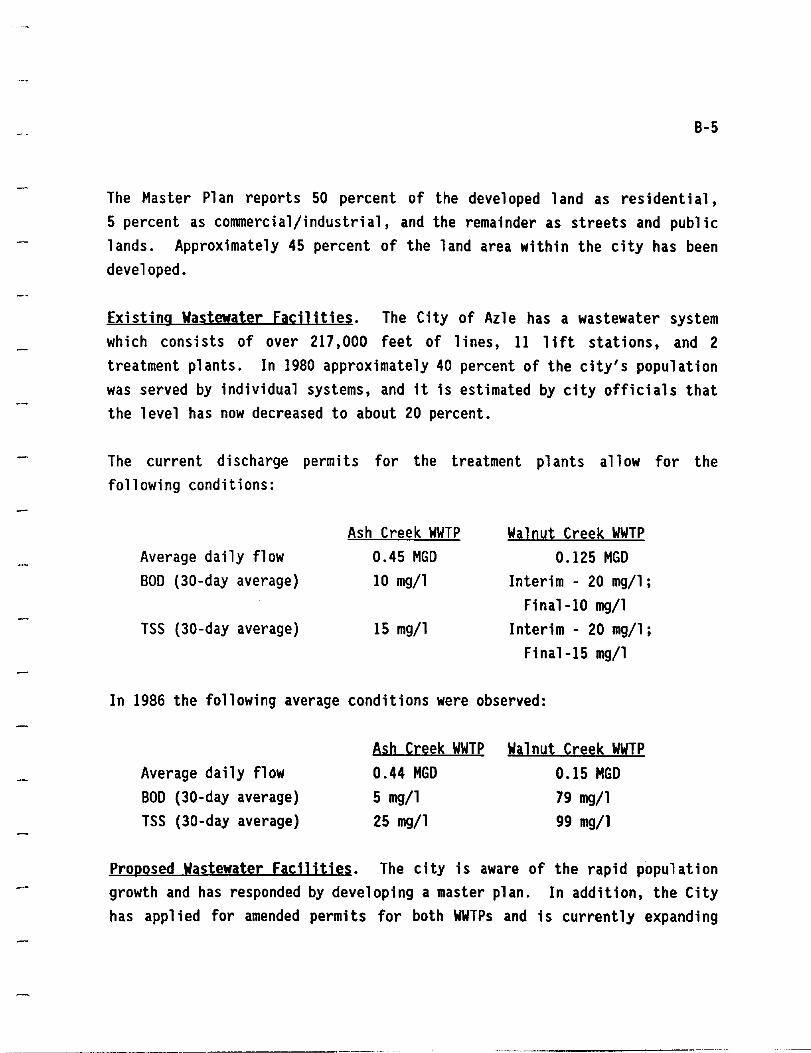
The Master Plan reports 50 percent of the developed land as residential, 5 percent as commercial/industrial, and the remainder as streets and public lands. Approximately 45 percent of the land area within the city has been developed.
Existing Wastewater Facilities. The City of Azle has a wastewater system which consists of over 217,000 feet of lines, 11 lift stations, and 2 treatment plants. In 1980 approximately 40 percent of the city's population was served by individual systems, and it is estimated by city officials that the level has now decreased to about 20 percent.
The current discharge permits for the treatment plants allow for the following conditions:
Average daily flow BOD (30-day average)
TSS (30-day average)
Ash Creek WWTP 0.45 MGD 10 mg/l
15 mg/l
Walnyt Creek WWTP 0.125 MGD
Interim - 20 mg/l; Final-l0 mg/l
Interim - 20 mg/l; Final-IS mg/l
In 1986 the following average conditions were observed:
Average daily flow BOD (30-day average) TSS (30-day average)
Ash Creek WWTP 0.44 MGD 5 mg/l 25 mg/l
Walnut Creek WWTP 0.15 MGD 79 mg/l 99 mg/l
Proposed Wastewater Facilities. The city is aware of the rapid population growth and has responded by developing a master plan. In addition, the City has applied for amended permits for both WWTPs and is currently expanding

8-6
the Walnut Creek WWTP. At the time of th i s wri t i ng the permit app 1 i cat i on heari ngs are st ill in progress and conc 1 us ions have not yet been reached. The plant expansion is scheduled to be completed and will provide an additional 0.185 MGD capacity to the existing Walnut Creek WWTP. The request to amend the Ash Creek permit reflects the 0.75 MGD constructed capacity of the Ash Creek WWTP. The discharge permit amendments currently being reviewed by TWC include the following:
Average daily flow BOD (30-day average) TSS (dO-day average)
Ash Creek WWTP 0.75 MGD
10 mg/l 15 mg/l
Walnut Creek WWTP 0.294 MGD
10 rng/l 15 mg/l
The City's master plan report defines future expansions to the collection system, which are repeated on Figures B-3 and B-4. Costs for the improvements were also identified in the city's master plan. The Ash Creek and Walnut Creek WWTPs have projected year 2005 flows of .84 MGD and .21 MGD, respectively based on 100 gpcd However for purposes of this study, more conservative values of 1.01 MGD and 0.25 MGD were used based on 120 gpcd after reviewing TWC self reporting data. No new areas within the Azle planning area, but outside the City's master planning area, were identified as having sufficient population to support additional facilities.
The Azle planning area was included in a subregional system in the Ash Creek drainage basin, a subregional system in the Walnut Creek drainage basin, and a regional system for the entire west side of Eagle Mountain Lake.
Ash Creek Facility Planning Area
The Ash Creek facility planning area (FPA) is that portion of the Ash Creek natural drainage basin upstream of the Azle planning area. The western boundaries of the FPA are approximately 6 miles from Eagle Mountain Lake in

8-7
northeast Parker County. Severa 1 small popul ated areas (unincorporated communities) are included in the FPA, such as Sanctuary and Sabathany next to Highway 199. Also 12 subdivisions were located in the planning area. The populated areas tend to center around the higher hilltops overlooking river valleys. The topography is gently rolling, ranging in elevation from 700 to over 1000 feet above sea level. The Ash Creek river basin drains in an easterly direction into Eagle Mountain Lake.
Soils in the area are mostly clay, however sandy loams are present and many of the higher hills consist of rock. The soils have been rated by the Soil Conservation Service for their suitability for use as septic tank absorption fields. Those soils in the populated areas are categorized as follows:
15 percent has moderate limitations for use 70 percent has severe limitations for use due to slow percolation rates 15 percent has severe 1 imitations for use due to shallow rock or
flooding
Planning Area Boundaries. The boundaries for the Ash Creek facility planning area are shown on Figure B-5. They are defined on the north and south by the natural drainage 1 imits to the Ash Creek basin. The eastern limits coincide with the boundary on the Azle planning area, and the western boundary was defined to include the populated areas within a 5- to 6-mile distance from the lake. approximately 5,550 acres.
The area under consideration in the FPA is
Population. Population figures for 1987 for this FPA were estiinated by house counts from recent aerial photographs in conjunction with windshield surveys. In addition, maps were obtained from the tax offices where possible, to identify recorded subdivisions. The 1987 population estimate
8-8
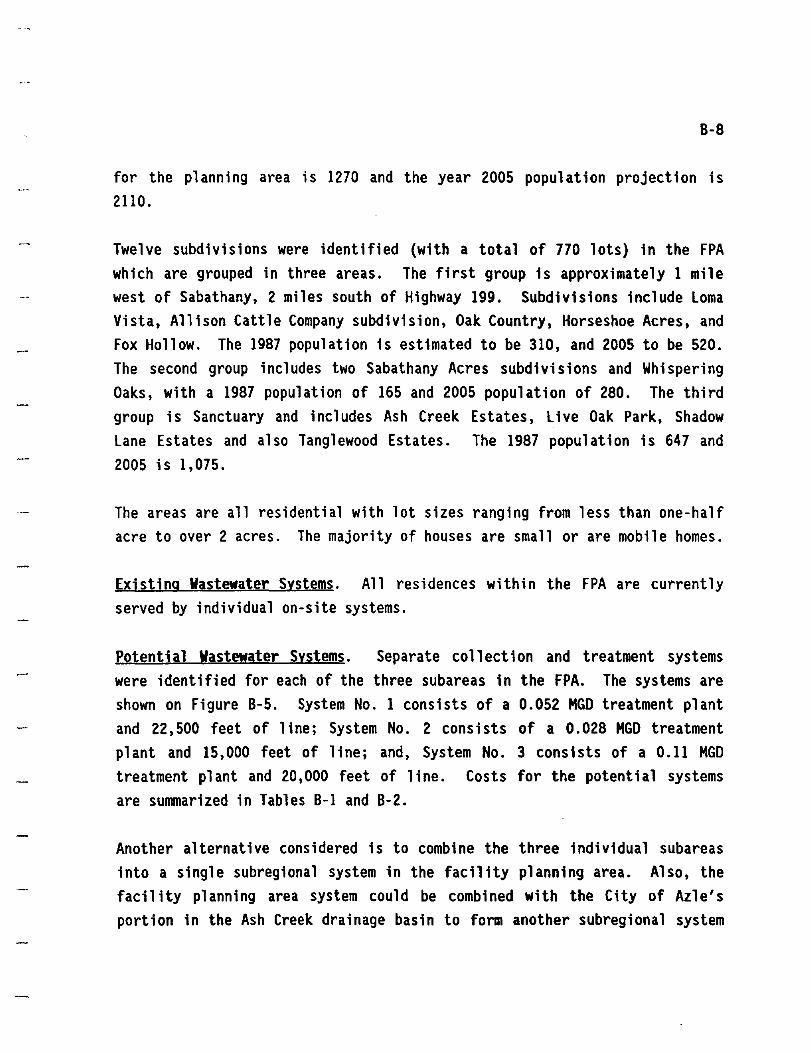
for the planning area is 1270 and the year 2005 population projection is 2110.
Twelve subdivisions were identified (with a total of 770 lots) in the FPA which are grouped in three areas. The first group is approximately 1 mile west of Sabathany, 2 miles south of Highway 199. Subdivisions include loma Vista, Allison Cattle Company subdivision, Oak Country, Horseshoe Acres, and Fox Hollow. The 1987 population is estimated to be 310, and 2005 to be 520. The second group i ncl udes two Sabathany Acres subdivi s ions and Whi speri ng Oaks, with a 1987 population of 165 and 2005 population of 280. The third group is Sanctuary and includes Ash Creek Estates, live Oak Park, Shadow lane Estates and also Tanglewood Estates. The 1987 population is 647 and 2005 is 1,075.
The areas are all residential with lot sizes ranging from less than one-half acre to over 2 acres. The majority of houses are small or are mobile homes.
Existing Wastewater Systems. All residences within the FPA are currently served by individual on-site systems.
Potential Wastewater Systems. Separate collection and treatment systems were identified for each of the three subareas in the FPA. The systems are shown on Figure 8-5. System No. 1 consists of a 0.052 MGD treatment plant and 22,500 feet of line; System No.2 consists of a 0.028 MGD treatment plant and 15,000 feet of line; and, System No. 3 consists of a 0.11 MGD treatment plant and 20,000 feet of line. Costs for the potential systems are summarized in Tables 8-1 and 8-2.
Another alternative considered is to combine the three individual subareas into a single subregional system in the facility planning area. Also, the facility planning area system could be combined with the City of Azle's portion in the Ash Creek drainage basin to form another subregional system

B-9
for the Ash Creek drainage basin. A regional system was also considered, combining the Ash Creek FPA with all the other FPAs on the west side of Eagle Mountain Lake.
Pelican Bay Facility Planning Area
The Pelican Bay facility planning area includes the City of Pelican Bay and the natural drainage basin to the immediate north of the city and to the east to Eagle Mountain Lake. Seven subdivisions were identified outside of the city limits of Pelican Bay. The topography is gently sloped to the lake from the drainage divide which forms the boundary for the planning area.
Elevations range from 650 at the lake to 770 at the hilltop on the basin boundary. The creek in the p 1 ann i ng area is located 2000 feet north of Pelican Bay, and it drains east into Eagle Mountain Lake.
Soils in the planning area are mostly clayey with some sandy clay areas along the 1 ake shore. The soil s have been rated by the SCS for thei r suitability for use as septic tank absorption fields, and have the following distribution:
5 percent of the soils have moderate limitation for use 95 percent of the soils have severe limitations for use due to slow
percolation rates
Planning Area Boundaries. The planning area boundaries are shown on Figure B-6. They are defined by the drainage limits on the north and northwest, city limits to the west, and Eagle Mountain Lake to the south and east. The area under consideration in the FPA is approximately 1270 acres.
Population. The NCTCOG estimates the 1987 population of Pelican Bay to be 1300. Population figures for the remainder of the planning area were
----------------------

B-I0
estimated by house counts from recent aerial photographs to be 240. The year 2005 population projection for the planning area is 3560.
Seven subdivisions with a total of 180 lots and an RV park were identified outside the limits of Pel ican Bay but in the planning area. Five of the subdivisions (Aqua Vista, Dunaway, Eustance-Hill-Stanfield, Tierra Grande, and L. W. Cole) and the RV park (Scotties West Bay Marina) are along the shore of the lake. The other two subdivisions (Executive Acres and Swan Estates) are northwest and north of Pelican Bay. lot sizes in Pelican Bay and several of the subdivisions are less than one-half acre in size.
Existing Wastewater Facilities. Residences within the planning area are currently served by individual on-site systems.
Potential Wastewater Facilities. A collection and treatment system was identified for the planning area and is shown on Figure B-6. A 0.35 MGD treatment plant, nearly 45,000 feet of line, and one pump station and force main would be necessary under the proposed system. Costs for the potential system are summarized in Table B-3.
Another a 1 tern at i ve cons i de red is to comb1 ne the Pe 11 can Bay FPA with the Peden and Swift Branch FPAs and form a subregional system. The Pelican Bay FPA was also included in a regional system along with all of the other FPAs on the west side of Eagle Mountain lake.
Peden Facility Planning Area
The Peden Facility Planning Area (FPA) is located north of the Pelican Bay FPA and includes the natural drainage basin associated with the next small creek north of the Pelican Bay FPA. Eight subdivisions were identified in this planning area. None of this FPA is within city boundaries except for along Highway 730 which is in the Azle city limits. The topography is

B-11
gently sloped to the lake from the natural drainage divide which forms the boundary for the planning area. Elevations range from 650 to 800 feet above sea level. The only creek in the FPA is unnamed and drains from the northwest to the southeast into Eagle Mountain Lake.
Soils in the planning area are sandy clays and clay loarns. The soils have been rated by the Soil Conservation Service (SCS) for their suitability for use as septic tank absorption fields, and have the following distribution:
55 percent has moderate limitations for use 35 percent has severe limitations for use due to slow percolation rates 10 percent has severe limitations for use due to shallow rock or flooding
Planning Area Boundaries. The boundaries for the Peden planning area are shown on Figure 8-7. They are defined on the east by Eagle Mountain Lake, to the north and south by the natural drainage divide, and the west by the Reno city limits (which nearly follows the drainage divide as well). The area under consideration in the FPA is approximately 1180 acres.
Population. Population figures for 1987 were estimated from recent aerial photographs in conjunction with windshield surveys. Also, plats of subdivisions were obtained from the tax offices and county records. The 1987 population estimate for the planning area is 425, and the year 2005 population projection is 710.
Eight subdivisions were identified in the FPA with an estimated total of 350 lots. Three subdivisions (Lake Forest, W. H. Younger, and L. W. Cole) are along the lake shore, three (the Estates, Schantile, and Wudco Trials) are located from north to south in the center of the area, and the last two (Wood Valley and Pocos Ranchos) are in the northwest corner of the area.

8-12
Existing Wastewater Facjlities. All residences within the planning area are currently served by individual on-site systems.
Potentjal Wastewater Facilities. A collection and treatment system was identified for the planning area and is shown on Figure B-7. It is composed of a 0.071 MGD treatment plant, 26,000 feet of line, and the three pump stations and force mains. Costs for the potential system are summarized in Table B-4.
The Peden FPA was also included in a subregional system with the Pelican Bay FPA and the Swift Branch FPA and in a regional system with all of the other FPAs on the west side of Eagle Mountain Lake.
Swift Branch Facility Planning Area
The Swift Branch planning area includes the natural drainage area for Swift Branch from the Reno city 1 imits (or Parker County 1 ine) in northwest Tarrant County east to Eagl e Mountain Lake. Seven subdivisions were identified in the planning area. There are no areas within city boundaries included in the planning area. The topography is gently sloped from the drainage 1 imits at the planning area boundaries to the lake. Elevations range from 650 to 850 feet above sea 1 eve 1 . Swi ft Branch drains from northwest to southeast across the p 1 anni ng area, into Eagle Mountai n Lake about 1300 feet south of the Tarrant-Wise County line.
Soils in the planning area are clays and clay loams with some smaller areas of sandy· cl ays near the 1 ake. The soil s have been rated by the SCS for their suitability for use as septic tank absorption fields, and have the following distribution.

B-13
- 5 percent has slight limitations for use 15 percent has moderate limitations for use
- 75 percent has severe 1 imitations for use due to slow percolation rates
- 5 percent has severe 1 imi tat i on for use due to shallow rock and flooding
Planning Area Boundaries. The planning area boundaries are shown on Figure 8-8. They are defined by the drainage limits on the north and south, Reno city 1 imi ts to the west, and Eag1 e Mountain lake on the east. The area under consideration in this facil ity planning area is approximately 1370 acres.
Population. Population figures for 1987 were estimated from recent aerial photographs, in conjunction with windshield surveys. Copies of subdivision plats were obtained from tax offices and county records. The 1987 population estimate for the planning area is 560 and the year 2005 population projection is 935.
Seven subdivisions were identified in the FPA with an estimated total of 240 lots. Four subdivisions (Perry Miller, Gantt-Stuart-Foster, R. W. Foster, and lake Forest) are along the lake shore, and the other three (Holly Hills, Ranch Oak Farms, and English Creek) are in the center portion of the planning area.
Existing Wastewater Facilities. All residences within the planning area are currently served by individual on-site systems.
Potential Wastewater Facilities. A collection and treatment system was identified for the planning area and is shown on Figure B-8. The system is composed of a 0.093 MGD treatment plant, 28,500 feet of line and four pump
8-14
stations and force mains. Costs for the potential system are summarized in Table B-5.
The Swift Branch FPA was also included in a subregional system with the Peden and Pel ican Bay FPAs and in a regional system with all of the other FPAs on the west side of Eagle Mountain Lake.
Reno Facility Planning Area
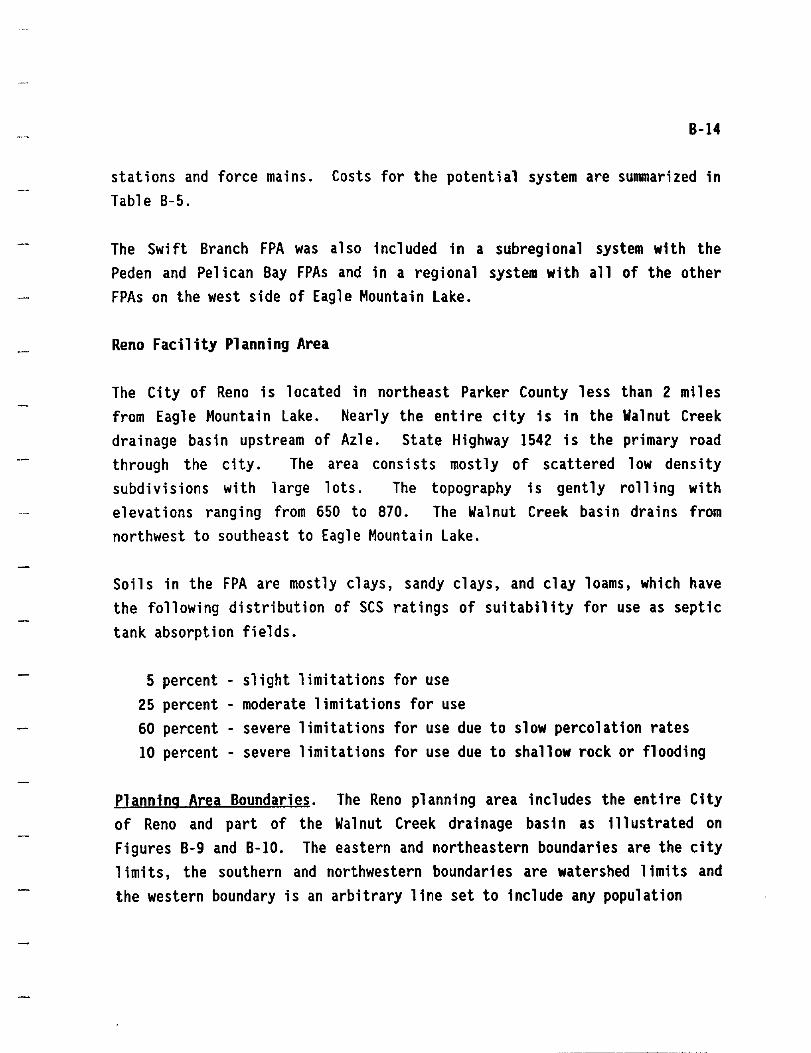
The City of Reno is located in northeast Parker County less than 2 miles from Eagle Mountain Lake. Nearly the entire city is in the Walnut Creek drainage basin upstream of Azle. State Highway 1542 is the primary road through the city. The area consists mostly of scattered low density subdivisions with large lots. The topography is gently rolling with elevations ranging from 650 to 870. The Walnut Creek basin drains from northwest to southeast to Eagle Mountain Lake.
Soils in the FPA are mostly clays, sandy clays, and clay loams, which have the following distribution of SCS ratings of suitability for use as septic tank absorption fields.
5 percent - slight limitations for use 25 percent - moderate limitations for use 60 percent - severe limitations for use due to slow percolation rates 10 percent - severe limitations for use due to shallow rock or flooding
Planning Area Boundaries. The Reno planning area includes the entire City of Reno and part of the Walnut Creek drainage basin as illustrated on Figures B-9 and B-I0. The eastern and northeastern boundaries are the city limits, the southern and northwestern boundaries are watershed limits and the western boundary is an arbitrary line set to include any population

8-15
areas within the 5- to 6-mile distance from the lake. The planning area under consideration in this study is 14,475 acres.
Population. The NCTCOG 1987 population estimate for the City of Reno is 2,200 and data from aerial photographs indicate a 1987 population of 497 for the remainder of the planning area. The population projection for the Reno planning area for year 2005 is 5,675. Growth in the planning area is occurring in the southwest area along Highway 199 (System NO.2) and in the east central area on both sides of Highway 1542 (System No.1). Nine subdivisions were identified in the planning area (Highlands Additions, H&H Investments Additions, Country Acres, La Junta, Midway, Oak Valley, Reno North, Walnut Creek Ranch, Walnut Creek Estates) with an estimated total of 415 lots. The growth, however, is very low density in most cases because of large lot sizes and open, undeveloped areas between developed areas.
Existing Wastewater Systems. All residents in the Reno planning area are currently served by individual on-site treatment systems.
Potential Wastewater Systems. Potential systems were identified to serve the populated areas in the planning area. Figures 8-9 and 8-10 have separate collection and treatment systems identified for both of the populated areas. System No.1 consists of 0.18 MGD treatment plant, 117,000 feet of line, and 2 pump stations and force mains. System No.2 consists of a 0.121 MGD treatment plant, 40,000 feet of line, and 3 pump stations and force mains. Costs for both individual systems are identified in Table 8-6.
The individual Systems Nos. 1 and 2 were combined to form a subregional system (Walnut Creek Subregional System No.1) and also with the portion of Az1e in the Walnut Creek basin to form a second subregional system (Walnut Creek Subregional System No.2). In addition, the Reno FPA was combined with all the other FPAs on the west side of Eagle Mountain lake to form a regional system.

B-16
Briar Creek Facility Planning Area
The Briar Creek Facility Planning Area (FPA) includes all of the natural drainage basin of Briar Creek except for a small portion that is within the city 1 imits of Reno, just west of the Tarrant-Parker County line. The planning area is located near the northern end of Eagle Mountain lake on the west side of the lake and includes portions of Tarrant, Parker and Wise Counties. Highway 2257 is the main east-west road through the basin, and Highway 730 is the main north-south road. Seven subdivisions and one other populated area were identified in the FPA. There are no areas within city limits in the FPA. The topography is gently rolling with elevations ranging from 650 to 890 feet above sea level. Briar Creek drains from west to east into Eagle Mountain lake, approximately 2000 feet south of the Tarrant-Wise County line.
Soils in the planning area are generally clays and clay loams; however, the areas along the lake and in the southern half of the planning area have more sand, and the areas in the northern half of the basin, particularly on the ridges and hills have a significant amount of rocky soil. The soils have been rated by the SCS for the suitability for use as septic tank absorption fields, and have the following distribution.
- 5 percent has slight limitations for use - 15 percent has moderate limitations for use - 60 percent has severe 1 imitations for use due to slow percolation
rates - 20 percent has severe 1 imitations for use due to shallow rock or
flooding
Planning Area Boundaries. The planning area boundaries are shown in Figure B-11. They are defined by the drainage 1 imits on the north, west, and

B-17
south, and by Eagle Mountain Lake on the east. There is a small portion of the natural basin that is within the city 1 imits of Reno which is not included in the Briar Creek FPA. The area under consideration in the Briar Creek FPA is approximately 4850 acres.
Popylation. Population figures for 1987 were estimated from recent aerial photographs, in conjunction with windshield surveys. Copies of subdivision plats were obtained from tax offices and county records as well. The 1987 population estimate for the planning area is 870, and the year 2005 population projection is 1420.
Seven subdivisions were identified in the FPA with an estimated total of 890 lots. Five of the subdivisions (Cooley, Eagle Mountain Acres, D. L.
Marshall, Allyndale and Turpin) are along the lake shore and the subdivisions of Briarwood Estates and Briar Acres are on Portwood Road east of FM 730. Also a smaller populated area was identified along FM 2257 in the center of the FPA approximately 1 mile west of FM 730.
Existing Wastewater Facilities. All residents within the planning area are currently served by individual on-site systems.
Potential Wastewater Facilities. Collection and treatment facilities were identified for the planning area and are shown on Figure B-11. The system is composed of two separate systems, 1) near the lake, and 2) 2.5 miles west along FM 2257. System No.1 consists of a 0.118 MGD treatment plant, 40,700 feet of line, and three pump stations and force mains. System No. 2 consists of a 0.036 MGD treatment plant, 21,000 feet of line and no pump stations. Costs for the potential individual systems are summarized in Table B-7. The two individual systems in the Briar Creek FPA were combined to form a subregional system. Also, the FPA was combined with all other FPAs on the west side of Eagle Mountain Lake to form a regional system.

B-18
J Hog Branch Facility Planning Area. The Hog Branch FPA is located northeast of Eagle Mountain lake in Wise County. It includes the entire natural drainage basin of Hog Branch, in addition to the drainage areas of the Dry Fork and two other small creeks which drain the Fairview area east of the lake. Hog Branch drains from west to east and enters the West Fork of the Trinity River approximately 4 miles upstream of Eagle Mountain lake. State highways 730 and 2048 are the major roads in the FPA. There are no areas in the FPA wh i ch are incorporated. The topography is gently roll i ng wi th elevations ranging from 650 to 910 feet above sea level.
Soils in the planning area are mixed sandy clays and clays. The soils have the following distribution of SCS ratings for suitability for use as septic tank absorption fields. The soil ratings are also shown on Figure B-12.
45 percent has moderate limitations for use 45 percent has severe limitations for use due to slow percolation rates 10 percent has severe 1 imitations for use due to shallow rock or flooding
Planning Area Boundaries. The boundaries for the planning area are shown on Figure B-12. They are defined by the natural drainage limits for Hog Branch, Dry Creek, and two smaller, unnamed creeks at the northeast side of Eagle Mountain lake. The area under consideration is approximately 10,180 acres.
Population. Population figures for 1987 for the Hog Branch FPA were estimated from recent aerial photographs in conjunction with windshield surveys. Future project ions were based on the average county growth rate for the previous 7 years. The FPA 1987 population estimates is 521 and the year 2005 projection is 740. No development activity was identified in this FPA.

B-19
Existing Wastewater Facilities. All residences within the planning area are currently served by individual on-site systems.
Potential Wastewater Facilities. There were no areas identified in this FPA which had sufficient development or density to promote additional facility planning.
~. Boyd Planning Area
The City of Boyd is located in Wise County on Highway 114 approximately 4.5 miles north of Eagle Mountain lake. Boyd lies within Segment 0810 of the West Fork of the Trinity River which is bounded by the Lake Bridgeport Dam upstream and Eagle Mountain lake downstream.
The City of Boyd was identified and officially designated as the management agency for the Boyd sewerage planning area (SPA) in the initial 208 Plan. This report will serve as a "SPA Update" to sunvnarize facility planning activities conducted or planned by the city in the Boyd facility planning area.
The FPA is characterized by gently sloping terrain with elevations ranging from 800 feet to 680 feet within the basin. Soils in the planning area are mostly clay and loam soils. The soils have been rated by the SCS for their suitability for use as septic tank absorption fields, and have the following distribution:
70 percent of the soils have moderate limitations for use 20 percent of the soils have severe limitations for use due to slow percolation rates 10 percent of the soils have severe limitations for use due to flooding
B-20
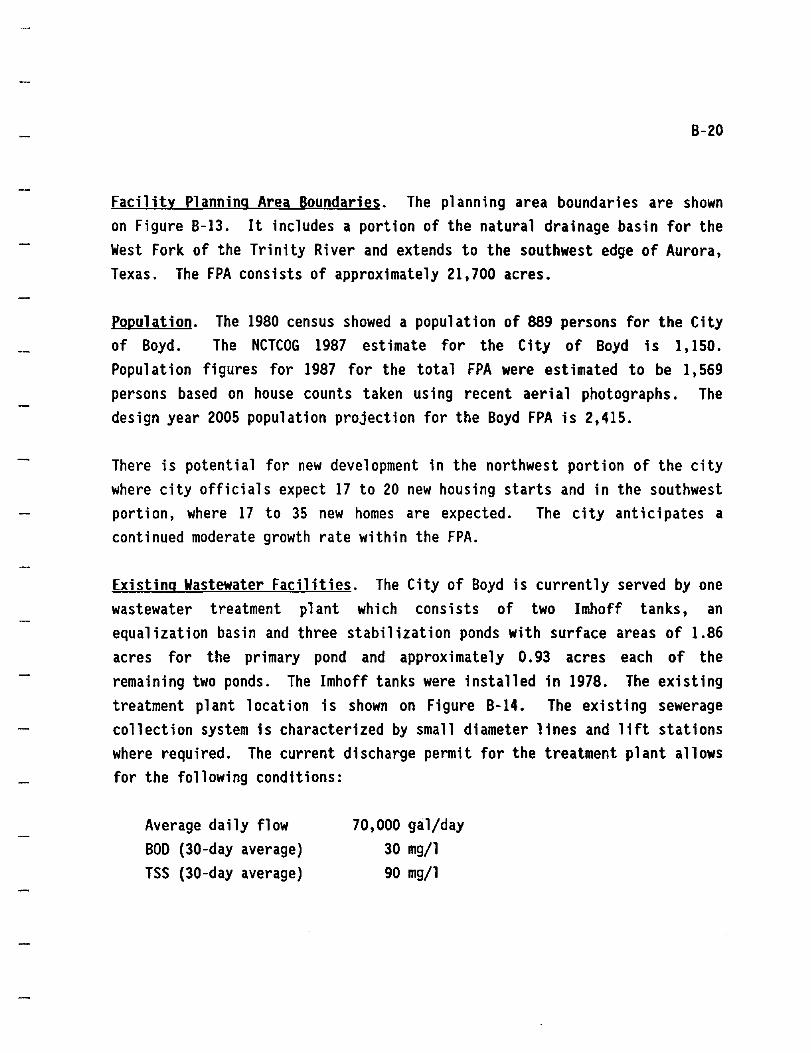
Facility Planning Area Boundaries. The planning area boundaries are shown on Figure B-13. It includes a portion of the natural drainage basin for the West Fork of the Trinity River and extends to the southwest edge of Aurora, Texas. The FPA consists of approximately 21,700 acres.
Population. The 1980 census showed a population of 889 persons for the City of Boyd. The NCTCOG 1987 estimate for the City of Boyd is 1,150. Population figures for 1987 for the total FPA were estimated to be 1,569 persons based on house counts taken using recent aerial photographs. The design year 2005 population projection for the Boyd FPA is 2,415.
There is potential for new development in the northwest portion of the city where city officials expect 17 to 20 new housing starts and in the southwest portion, where 17 to 35 new homes are expected. The city anticipates a continued moderate growth rate within the FPA.
Existing Wastewater Facilities. The City of Boyd is currently served by one wastewater treatment plant which consists of two Imhoff tanks, an equalization basin and three stabilization ponds with surface areas of 1.86 acres for the primary pond and approximately 0.93 acres each of the remaining two ponds. The Imhoff tanks were installed in 1978. The existing treatment plant location is shown on Figure B-14. The existing sewerage collection system is characterized by small diameter lines and lift stations where required. The current discharge permit for the treatment plant allows for the following conditions:
Average daily flow BOD (30-day average) TSS (30-day average)
70,000 gal/day 30 mg/l 90 mg/l

In 1986, the following average conditions were observed:
Average daily flow BOD (30-day average) TSS (30-day average)
64,200 gal/day 23.0 mg/1 65.5 mg/1
B-21
The city recently completed the installation of approximately 10,000 feet of 6-inch, 8-inch, and 10-inch diameter collection lines and two lift stations. This new collection system expansion services existing homes which were originally on septic tanks.
The city estimates that 30 homes are currently served by septic tank systems within the city limits.
Potential Wastewater Facilities. The City of Boyd has experienced rapid popu1 at i on growth and has taken pos it i ve steps to i ni t i ate and execute responsible facility planning for the Boyd FPA. City personnel are aware of discharge permit requirements and are consistently meeting these conditions. Boyd has 9 acres available to expand the existing wastewater treatment plant as the need requires. The city is considering the installation of a "race track" type expansion of the treatment plant and expects to initiate facil ity planning studies in 1988 to meet the projected needs of the Boyd FPA.
The Boyd FPA was included in a regional system with the City of Aurora and the Newark area, on the north end of Eagle Mountain lake.
Aurora Facility Planning Area
The Aurora planning area is in Wise County approximately 2 miles north of Eagle Mountain lake. It includes the City of Aurora and the natural drainage basin for Blue Creek. Aurora is located on State Highway 114

B-22
between Rhome and Boyd. Several subdivisions were identified along State Highway 718, which is a main road on the south and west areas of the city. The topography is gently roll ing with elevations ranging from 650 to 980 across the basin. The area in Aurora that is south of State Highway 114 is gradually sloped down to State Highway 718. The Blue Creek drainage basin drains from northeast to southwest into the West Fork of the Trinity River. However, the majority of the City of Aurora actually drains southwest into a small unnamed creek which enters the West Fork about 2 miles upstream of Eagle Mountain Lake.
Soils in the Aurora area are quite different than in the upper reaches of the Blue Creek basin. The soils in the Aurora area are very sandy with some clays, while the upper basin soils are rocky with some clays. The soils in Aurora have the following distribution 'of SCS ratings for suitabil ity for use in septic tank absorption fields.
60 percent has moderate limitations for use 25 percent has several limitations for use due to slow percolation rates 15 percent has severe 1 imitations for use due to shallow rock or flooding
Planning Area Boundaries. The planning area boundaries are shown on Figure B-14. They are defined by the drainage area limits for the Blue Creek basin on the northwest, north and northeast, by the Aurora city limits on the southeast and the drainage limits for the small creek south of Aurora on the south and southwest. The area under consideration is approximately 8315 acres.
Population. Population figures for 1987 were estimated photographs in conjunction with windshield surveys. located as well, to aid in locating projected future
from recent aeri a 1 Subdivisions were
growth. The 1987

B-23
population estimate for the planning area is 510 and the year 2005 population projection is 740.
Three subdivisions were identified in the southwest part of Aurora, with an estimated total of 85 lots, most of which are less than 1 acre. The remaining area of town consists of large tracts which are spread out along existing roads.
Existing Wastewater Facilities. All residences within the planning area are currently served by individual on-site systems.
Potential Wastewater Facilities. A potential collection and treatment system was identified for the populated portion of the Aurora planning area and is shown on Figure B-15. The system is composed of a 0.052-MGD treatment plant and 32,000 feet of line. Costs for the potential system are summarized in Table B-8.
The Aurora FPA was also included in a regional system with Boyd and the Newark area at the north end of Eagle Mountain Lake.
vi Oates Branch Facility Planning Area
The Oates Branch FPA is located northeast of Eagle Mountain Lake in Wise County. It includes the entire natural drainage basin of Oates Branch and a small unnamed creek south of it, with the exception of a portion of the City of Rhome. The drainage divide between the West Fork and Elm Fork of the Trinity passes through Rhome. The city's wastewater is treated and discharged into Elizabeth Creek to the east a tributary to Denton Creek and the Elm Fork. Therefore, the city area was not included in the FPA for Eagle Mountain Lake. No other incorporated areas are in the FPA. The Oates Branch basin lies just south of Aurora and north of Newark, and there is very little development in the FPA. Oates Branch drains from northeast to
8-24
southwest into the West Fork of the Trinity River, about 1 mile upstream of Eagle Mountain Lake. State Highway 718, U.S. 287 and State Highway 114, cross the southwest and northeast portions of the basin, respectively. The topography is gently roll ing with elevations ranging from 650 to 940 feet above sea level.
Soils in the planning area are sandy clays in the southwest portion and mixed clays with rock in the northeast portion. The soils have the following distribution of SCS ratings for suitability for use as septic tank absorption fields, which are shown on Figure 8-15.
50 percent moderate limitations for use 30 percent has severe limitations for use due to slow percolation rates 20 percent has severe 1 imi tat ions for use due to shallow rock or fl oodi ng
Planning Area Boundaries. The boundaries for the planning area are shown on Figure B-15. They are defined by the natural drainage limits for Oates Branch except for the port i on in Rhome wh i ch is excluded. The area under consideration is approximately 4095 acres.
Population. Population figures for 1987 for the Oates Branch FPA were estimated from recent aerial photographs in conjunction with windshield surveys. Future project ions were based on the average county growth rate for the previous 7 years. The FPA 1987 population estimate is 816 and the year 2005 projection is 1155. No development activity was identified in
this FPA.
Existing Wastewater Facilities. All residences within the planning area are currently served by individual on-site systems.

B-25
Potential Wastewater Facilities. There were no areas identified in this FPA which had sufficient development or density to promote additional facility planning.
Newark Facility Planning Area
The Newark planning area includes the natural drainage basin for Derrett Creek, which runs from northeast to southwest into a bay near the north end of Eagle Mountain lake. The City of Newark is within the drainage limits of the Derrett Creek basin about 1 mile east of Eagle Mountain lake in Wise County. State Highway 718 and the Chicago, Rock Island, and Pacific Railroad run through town in a northwest-southeast direction. U.S. Highway 287 and the Burlington Northern Railroad also run parallel, at the northeast or upstream drainage limits of the basin. Only a small portion of the basin is in Tarrant County, the balance is in Wi se County. The topography is rolling over most of the basin with elevations ranging from 650 to 920 feet above sea level. The ground is more gently sloped between the city and the lake with elevations changing only 50 feet in over a mile. The City of Newark has a collection system and treatment plant, however there is a significant population outside the city limits (between the city and the lake) that are served by individual on-site systems.
Soils in the area are variable from sands and sandy clays near the lake to clay soils in Newark and west of Newark, to rocky areas mixed with clays in the northern areas. The SCS has rated the vari ous so11 types for thei r suitability for use as septic tank absorption fields. The rating distribution for the soils in the Newark area are as follows:
60 percent moderate limitations for use 15 percent has severe limitations for use due to slow percolation rates

B-26
25 percent has severe 1 imi tat ions for use due to sha 11 ow rock or fl oodi ng
Planning Area Boundaries. The planning area boundaries are shown on Figure B-16. They are defined by the natural drainage limits for Derrett Creek and by Eagle Mountain Lake. The area under consideration is approximately 5090 acres.
Population. Population figures for the City of Newark and the remaining portion of the FPA were estimated from recent aerial photographs and conversations with city officials. The 1987 population is estimated to be 600 for the City of Newark and 650 for the remainder of the FPA. The year 2005 popul at ion is projected to be 1860 for the ent ire Newark facil i ty planning area.
The population outside of Newark is nearly all south of State Highway 718, between the city and the lake. However, population growth is also occurring to the north and northwest of the city as well.
Existing Wastewater Facil ities. The City of Newark has a wastewater collection and treatment system which serves most of the residents within the city limits. The city areas not served are those along the highway extensions and a subdivision about a mile north of the downtown area. The current discharge permit for the Newark treatment plant allows for the following conditions:
Average daily flow BOD (30-day average) TSS (30-day average)
0.15 MGD 10 mg/l 15 mg/l

In 1986 the following average conditions were observed:
Average daily flow 800 (30-day average) TSS (30-day average)
0.04 MGD 2.7 mg/l 5.2 mg.l
8-27
The areas in the city limits not served by the collection system and all other areas outside of the Newark city 1 imits are served by individual on-site systems.
The outfall for the Newark treatment plant is located on Derrett Creek about 500 feet upstream of a small bay of Eagle Mountain Lake. There are also many houses (with individual septic tank systems) located along the shore of the lake in this area. The creek flow is very small and water quality problems have occurred in the bay.
Potential Wastewater Facilities. The primary area for the development of wastewater facil it i es in the Newark area is the populated area south of State Highway 718, between the lake and Newark. Collection and treatment facilities were identified for this area and are shown on Figure 8-16. The system is composed of 64,000 feet of line, a 0.118 MGD treatment plant, and three pump stations and force mains. Costs for the potential systems are summarized in Table 8-9.
The Newark area was also included in a regional system with 80yd and Aurora at the north end of the lake.
Avondale Facility Planning Area
The Avondale FPA is located on the east side of Eagle Mountain Lake in northern Tarrant and southern Wise Counties. The FPA includes the Indian Creek drainage basin and the drainage areas of the three small creeks north
B-28
of Indian Creek, and south of Newark. There are no incorporated areas in this FPA. The area of interest for facility planning is known as Avondale and is between U.S. Highway 287 and State Highway 718 on the east side of the basin. The topography is roll i ng wi th e 1 evat ions rangi ng from 650 to 910 feet above sea level. In general, the basin drains from northeast to southwest into a large bay where Indian Creek enters Eagle Mountain Lake, about 2 miles south of the Tarrant-Wise County line.
Approximately half of the soils in the planning area are clay and half are rock, with some sandy areas in the river bottoms closer to the lake. The soils in the Avondale area of the basin have the following distribution of SCS ratings for suitabil ity for use as septic tank absorption fields have the following distribution.
60 percent has severe limitations for use due to slow percolation rates 40 percent has severe 1 imitations for use due to shallow rock or flooding
Planning Area Boundaries. The boundaries for the planning area are shown on Figure B-17. They are defined by the drainage limits for Indian Creek, and the drainage limits for the three small creeks north of Indian Creek and south of Newark which drain the area of the old National Guard Base that is currently owned by International Word of Faith Church. The area under consideration in the FPA is approximately 11,465 acres.
Population. Population figures for 1987 were estimated from recent aerial photographs in conjunction with windshield surveys. Also plats of subdivisions were obtained from tax offices and county records. The 1987 population estimate for the planning area is 406, and the year 2005 population projection is 655. The Avondale subdivision has about 175 lots of approximately 1 acre in size.

8-29
Existing Wastewater Facilitjes. All residences within the planning area are currently served by individual on-site systems. However the International Word of Faith Church has a small wastewater treatment plant with a 0.01 MGO no discharge permit. The effluent is used for irrigation.
Potent ia 1 Wastewater Facil iUes. A coll ect i on and treatment system was identified for the Avondale area and is shown on Figure 8-17. It is composed of a 0.058 MGO treatment plant and 20,500 feet of line. Costs for the potential system are summarized in Table 8-10. The Avondale FPA was not included in any subregional or regional systems.
Gilmore 8ranch Facility Planning Area
The Gilmore Branch planning area includes the entire area in the natural drainage basin for Gilmore Branch, which drains from east to west into Eagle Mountain lake just north of Peden Road. The FPA is 1n Tarrant County and there are no incorporated areas within it. State Highway 1220 and U.S. Highway 287 run north and south on the west and east sides of the basin, respectively. Peden Road runs east and west and 1s the access for the development along the lake. Five subdivisions and an RV park were identified in the FPA. The topography is gently roll ing with elevations ranging from 650 to 890 feet above sea level. The area of development along the lake is nearly flat.
Soils in the planning area are highly varied, from sand and clay areas near the lake to mostly rocky soils over the remainder of the basin. In the developed areas, the soil SCS ratings for suitability for use as septic tank absorption fields have the following distribution.
35 percent moderate limitations for use 65 percent severe limitations for use due to slow percolation rates

B-30
Planning Area Boundaries. The planning area boundaries are shown on Figure B-18. They are defined by the natural drainage limits for Gilmore Branch and by Eagle Mountain Lake. The area under consideration is approximately 5030 acres.
Population. Population figures were estimated from recent aerial photographs and windshield surveys. Also copies of subdivision plats were obtained from tax offices and county records. The 1987 population estimate for the planning area is 450 and the year 2005 population projection is 750.
Five subdivisions with an estimated total of 95 lots and a RV park were identified in the FPA, all of which are along the shore of Eagle Mountain Lake.
Existing Wastewater Facilities. All residents within the planning area are currently served by individual on-site systems. The RV park (permit to Larry Buck, Dido Retirement Center) has a small package treatment plant with a discharge permit of 0.011 MGD, 10 mg/l BOD and 15 mg/l TSS. The 1986 average daily flow was 0.0006 MGD, the average BOD was 8.3 mg/l, and the average TSS was 3.0 mg/l.
Proposed Wastewater Facilities. A collection and treatment system was identified for the planning area and is shown on Figure B-18. The system consists of a 0.058 MGD treatment plant, 12,000 feet of line, and three pump stations and force mains. Costs for the system are summarized in Table B-ll. The Gilmore Branch FPA was not included in any subregional or regional systems.

B-31
Boat Club Facility Planning Area
The Boat Club FPA is on the east shore of Eagle Mountain Lake, south of the Gilmore Branch FPA and west of the Lake Country FPA in Tarrant County. It includes the natural drainage basins of Little Dosier Creek and the remaining area west to the lake. State Highway 1220 is the major road in the area, with much of the existing development occurring by the lake, adjacent to Boat Club Road. Eight subdivisions were identified in the planning area and no portion of the area is within city limits. The topography is gently rolling along the lake and rolling in the upper reaches of the drainage area. Little Dosier Creek and a small unnamed creek both drain south into Dosier Slough, and two small unnamed creeks drain west into Flemming Slough.
Soils in the planning area are nearly all rocky with some clays and sandy loams in the Little Dosier Creek basin. The soils in the populated areas have the foll owi ng di stri but i on of SCS ratings for suitability for use as septic tank absorption fields.
5 percent has severe 1 imitations for use due to slow percolation rates 95 percent has severe limitations for use due to shallow or flooding
Planning Area Boundaries. The boundaries for the Boat Club FPA are shown on Figure B-19. They are defined on the east and north by the drainage limits of Little Dosier Creek and the smaller creeks which drain to Flemming Slough, and on the west and south by Eagle Mountain Lake. The area under considerations in the FPA is approximately 4010 acres.
Population. Population figures for 1987 were estimated by house counts from recent aerial photographs in conjunction with windshield surveys. In addition, copies of subdivision plats were obtained from tax offices and

B-32
county records. The 1987 population estimate for the planning area is 500
and the year 2005 population projection is 955.
Nine subdivisions (Ambrose Eagle Nest Estates. The Seville Addition. Burgess
Land, Corky Court. Crest POint, Marina Cove. Tranquil Acres, The West Fork
Addition, and The Landing) were identified in the planning area with an
estimated total of 170 lots (not including The Landing) in addition to the
Boat Club facility. The Landing is included in the Tarrant County
Municipal Utility District No. 1 (TCMUD No.1) service area. All of the
subdivisions are located south of Boat Club Road along the lakeshore.
Existing Wastewater Facilities. The Fort Worth Boat Club, at the end of
Boat Cl ub Road, has a small wastewater treatment pl ant whi ch serves a
port i on of the Boat Cl ub fac il it i es. The plant has a discharge permit for
an average daily flow of 0.015 MGD, 10 mg/l BOD, and 15 mg/l TSS. The
di scharge is off the end of the Boat Cl ub poi nt to the lake. The 1986
average daily flow was 0.014 MGD, the average BOD was 9.0 mg/l and the
average TSS was 14 mg/l. A few residences in the Boat Club, and all other
residences in the planning area are served by individual on-site systems.
except for those in The Landing. a subdivision on the northeast side of
Dosier Slough which is served by Tarrant County Municipal Utility District
No.1.
Potential Wastewater Facilities. A potential collection and treatment
system was identified for the planning area and is shown on Figure B-19.
The system consists of a 0.075 MGD treatment plant. 40,200 feet of line and
eight small pump stations and force mains.
summarized in Table 8-12.
Costs for the system are
A second a 1 ternat i ve for th is area is to re 1 i ft the wastewater into the
TCMUD No. 1 service area. or into the City of Fort Worth system.
B-33
lake Country Estates Facility Planning Area
The lake Country FPA includes the natural drainage basin for Dosier Creek and the area south of Dosier Creek which drains into Carter Slough of Eagle Mountain lake. The area is in Tarrant County east of Eagle Mountain lake and extends northeast to U.S. Highway 287. State Highway 1220 is the major access to this portion of the lake. The populated area is nearly all within the TCMUD No. 1 service area, most of which is lake Country Estates. Several other subdivisions were identified, one of which is not served by TCMUD No.1. The topography is rolling, with elevations ranging from 650 to 870 feet above sea level. The Dosier Creek Basin drains in a southwesterly direction into Dosier Slough.
Soils in the area are generally rocky with some sandy and clayey areas near the river bottoms. The populated areas have the following distribution of SCS ratings for suitability for use as septic tank absorption fields.
10 percent has slight limitations for use 90 percent has severe limitations for use due to shallow rock or flooding
Planning Area Boundaries. The boundaries for the lake Country FPA are shown on Figure B-20. They are defined on the north, south, and east by natural drainage limits and on the west by the lake. The area under consideration in the FPA is approximately 5510 acres.
PODylation. Population figures for 1987 were estimated by house counts from recent aerial photographs in conjunction with windshield surveys. Also the TCMUD No. 1 provided information on the number of water connections in their service area and average growth rates experienced in the past. Copies of subdivision plats were also obtained. The 1987 population estimate for the

B-34
planning area is 2450 and the year 2005 population projection for the FPA is 4680.
Four subdivisions (Lake Country Estates, Eagle Mountain Lake Estates, Secret Harbor, and Meacham Brants) were identified in the planning area with an estimated total of over 4600 lots. The Meacham Brants subdivision (about 40 lots) is located on the south side of Carter Slough and is not included in the TCMUO No. 1 service area.
Exhtinq Wastewater FacilHies. _ The TCMUO No. 1 serves approximately 97 percent of the population in the FPA. Prior to March 1987 TCMUD No. 1 operated a treatment plant north of Dosier Slough. However in March, the plant was abandoned and wastewater pumped into the City of Fort Worth wastewater system. The TCMUD No. 1 currently has nine pump stations in the service area to collect and transfer the wastewater.
The remaining 3 percent of the population in the FPA (mostly in the Meacham Brants subdivision) are served by individual on-site systems.
Potential Wastewater Facilities. A potential collection and treatment system has been identified on Figure B-20 for the portion of the FPA served by individual systems. The potential system consists of a 0.016 MGO treatment plant, 5500 feet of line and one pump station and force main. Costs for the potential system are summarized in Table B-13.
An alternative system is collecting the wastewater at the site of the treatment pl ant and transferri ng H to the Fort Worth system, or to the TCMUO No. 1 system.

8-35
WATER QUALITY ISSUES
There are two types of pollutant loads that affect water qual i ty . These loads are point source loads and nonpoint source loads. Point source loads are those loads that originate from a specific source such as an industrial facil ity or a wastewater treatment plant. Point source loads typically enter the river or lake through a discharge pipe. Nonpoint source loads are more diffuse in their generation and entry into a receiving stream. Nonpoint source pollutant loads are typically associated with runoff during rainfall events. For purposes of this study, pollutant loads from septic tanks around the lakes are considered nonpoint source loads.
Almost 50 percent of the population of the EML Facility Planning Region is currently unsewered and served by septic tanks, which can contribute to the amount of nonpoint source pollution in the EML region. Approximately 17 percent of the land area in the region is currently classified as agricultural land which also generates nonpoint source pollutant loadings. There are currently eleven point source dischargers in the EML region which release point source pollutant loads at a current annual flow rate equivalent to about 80 percent of the permitted flow rate. Tables 111-10 through III-14 of Chapter III of this report show a comparison of point source and nonpoint source loadings for existing and projected conditions for the EML watershed.
Modeling of the West Fork of the Trinity River and significant tributaries in the EML Planning Region has been performed to establish point source effluent requirements to meet the presently adopted Texas Stream Standards which call for a 5 mg/l DO level on the West Fork and Eagle Mountain Lake and a 3 mg/l DO level in unclassified tributaries including Ash Creek and Walnut Creek which flow into Eagle Mountain Lake. We also investigated the possible need for point source control of nutrients to protect Eagle Mountain Lake. This investigation generally showed that in order to meet

8-36
the above stream standards for DO levels, dischargers on the West Fork will be required to attain a minimum level of 20 mg/l BOD, 15 mg/l TSS, and 15 mg/l armnonia and have an effluent level of 5 mg/l. However certain Dischargers may be required to attain a 10 mg/l BOD, 15 mg/l TSS and 2 mg/l armnonia with a DO of 5 mg/l depending on stream geometry and mixing characteristics.
Eagle Mountain lake modeling studies have also shown that the existing chlorophyll "a" concentration is approximately 17 ug/l and is estimated to increase to approximately 20 ug/l if nutrient removal is not provided in the future. Nutrient removal for existing discharges is estimated to reduce concentrations to between 14 and 15 ug/l. The projected chlorophyll "a" concentrations change approximately ±3 ug/l. This magnitude of change has been considered to be significant in some situations. It is difficult to quant i tat i vel y relate th is concentration change to modi fi cat i on in water usage. In addition, the summer chlorophyll "a" data for Eagle Mountain lake has a standard devi at ion in excess of 8 ug/l. The projected change of ±3 ug/l would be difficult if not impossible to measure in the lake during a summer season. The projections indicated a potentially Significant trend associated with the increases in discharge to treated sewage without accompanying nutrient controls. As indicated in Chapter III of this report either nitrogen or phosphorous removal could be considered to control Chlorophyll "a" concentrations. Under existing conditions light is the factor that is limiting Chlorophyll "a" concentrations and the influence of nutrients appears to be modest in terms of limiting growth. Control of either nutrient can induce a limitation associated with the nutrient that is controlled. The modeling indicates that phosphorous control is somewhat more effective then nitrogen control and experience indicates that phosphorous control has the additional advantage of being more compatible with many nonpoint source control actions.

B-37
The APAI modeling can provide a basis for long term planning, but the more complex Eagle Mountain Lake eutrophication analysis being developed by TWC will be required to ultimately provide the basis for detailed planning and implementation that could consider both point and nonpoint source controls. The TWC is currently utilizing the water quality model WASP (Water Quality Analysis Simulation Program) to analyze the impacts of point and nonpoint sources on reservoir eutrophication process in EML. The modeling could be completed within the next 6 to 9 months.
In addition to this, the TWC hearings for the City of Azle permit application will likely establish what, if any, additional point source effluent requirements should be considered as the basis for subsequent detailed planning.
PROCEDURES AND RESULTS
FACILITY PLANNING METHODOLOGY
The facility planning work associated with this appendix develops data necessary to evaluate the feasibility of specific projects needed to protect water quality in the Eagle Mountain Lake Facility Planning Region of the Upper West Fork and Clear Fork of the Trinity River Basin while providing efficient, cost-effective wastewater treatment. These data will aid in identification of priorities, costs, and locations of necessary pollution abatement facilities. The identification of sound alternatives to maintain water quality and to provide cost-effective wastewater treatment is a primary objective of the study. A detailed description of the methodology used for development of the facility planning regions and treatment alternatives is provided in Appendix D.

8-38
ALTERNATIVES EVALUATED IN PHASE I
In addition to the wastewater systems evaluated for each of the sixteen FPAs discussed previously, Subregional Planning Areas which include FPAs within close proximity of each other were also studied. Subregional systems were developed by combining individual facility planning areas, as well as separate areas within a single FPA. Eight potential areas for subregional systems were identified in the EML regional area, as listed below, and shown on Figures B-21 through B-24. The eight subregional areas are:
Ash Creek Subregional systems 1 and 2 Walnut Creek Subregional systems 1 and 2 Swift Branch Subregional system Briar Creek Subregional system Newark Subregional system Boat Club Subregional system
Four of the eight subregional systems involved combining separate systems within a single FPA. The remaining four systems involved combining the individual systems from more than one FPA.
The subregional systems are defined to include the subregional treatment facilities and all facilities necessary to convey the collected wastewater from a single collection point in each area served to the subregional treatment plant. This includes the additional 1 ift stations, force mains, and gravity lines necessary to convey the wastewater from the individual treatment plant sites shown on the individual FPA figures to the subregional treatment plant. Estimated costs for households served by subregional systems can be determined by combining the cost for the subregional system which includes conveyance and treatment facilities only with the cost for the individual planning area collection system.

8-39
Ash Creek Subregional Systems
Two subregional systems identified in the Ash Creek 8asin are:
1. Combining the three individual systems in the Ash Creek FPA; and 2. Combi ni ng the three Ash Creek FPA systems and the port ion of the
City of Azle that is 1n the Ash Creek basin.
The first subregional system simply replaces the three individual WWTP's in the Ash Creek FPA with a single larger WWTP. It requires, in addition to the individual collection systems shown on Figure 8-5, 18,000 feet of sewer line and a 0.188 MGD WWTP. The regional system is shown on Figure 8-22. Costs for the subregional system (No.1) are summarized in Table 8-14. The costs shown are total costs for service and include all the facilities for both local and subregional systems in the Ash Creek FPA.
The Ash Creek subregional system (No.2) is shown in Figure 8-24. The service area for the system includes the entire area served by collection systems within the natural drainage 1 imits for Ash Creek, including the existing system in the City of Azle. Facilities required in addition to those identified in the City of Azle's Master Plan, and the individual collection systems identified in the FPAs, include 22,000 feet of sewer line and an additional 0.327 MGD of treatment capacity. Costs for the subregional system #2 are summarized in Table 8-15. The costs reflect only the WWTP expansion costs and the interceptor costs to serve the three subareas in the Ash Creek FPA. The additional cost for the local collection systems in the Ash Creek FPA ($220 per household per year) are not included in Table 8-15 costs. Therefore, the local collection system costs should be added to the subregional conveyance and treatment costs in determining the household costs for those in the Ash Creek FPA, under the subregional system No. 2 scenario.

8-40
Walnut Creek Subregional Systems
The two subregional systems identified in the Walnut Creek drainage basin are 1) combining the two individual systems in the Reno FPA and 2) combining both Reno individual systems and the portion of the City of Az1e which is in the Walnut Creek drainage basin.
The Walnut Creek subregional system No. 1 essentially serves the City of Reno and a small portion of unincorporated area west of Reno. In addition to the local collection systems shown on Figures 8-9 and 8-10, the subregional system No.1 includes 11,000 feet of sewer line (7,500 feet of which is included in Reno system No. 1 but would be 10 inches instead of 8 inches in diameter) and 0.301 MGD of additional WWTP capacity. Costs for the subregional system number 1 are summarized in Table 8-16. The costs shown are the total costs for service and include all the facn ities for both local and subregional systems in the Reno planning area. The system is shown in Figure 8-22.
The Walnut Creek subregional system number 2 is shown on Figure 8-24. The servi ce area i ncl udes everythi ng served by an organi zed co11 ect ion system (in the regional planning area) within the natural drainage limits for Walnut Creek, including the portion served by existing facilities in the City of Az1e. System number 2 includes 14,000 feet of sewer line and 0.335 MGD of additional WWTP capacity, in addition to the local collection systems and the existing and proposed City of Azle facilities. Costs for subregional system number 2 are summarized in Table 8-17. The costs reflect only the WWTP costs and subregional conveyance line costs. The cost for the individual collection system ($395 per household per year) should be added to determine the total costs for households in the Reno FPA.

B-41
Swift Branch Subregional System
The Swift Branch subregional system was developed by combining three individual planning areas, Pelican Bay, Peden, and Swift Branch into one system. The subregional system consists of two pump stations (0.344 MGO and 0.093 MGO), 9000 feet of force mains, 5000 feet of gravity lines (2000 feet of which is in the individual system but upsized from 6" to 12"), and a 0.508 MGO treatment facility. The system is shown in Figure B-24. Costs for the Swift Branch subregional conveyance and treatment facilities are summarized in Table B-18. These costs are subregional costs only and the annual costs for the individual collection systems ($105 per household for Pelican Bay, $335 per household for Peden and $280 per household for Swift Branch) should be added to determine the total costs for households in each of the individual facility planning areas.
Briar Creek Subregional System
The Briar Creek subregional system is shown on Figure B-21. It combines the two individual service areas within the Briar Creek area to produce a single system for the FPA. In addition to the individual collection systems shown on Figure B-ll, the subregional system also includes 7,000 feet of gravity sewer line and a single 0.154 MGO treatment facility. Costs for the subregional system are shown in Table B-19. The costs shown are total cost for service and include all the facilities for both local and subregional systems in the Briar Creek FPA.
Newark Subregional System
The Newark subregional system was identified to combine the area outside the Newark city limits with the city facilities and utilize a single system. The Newark FPA has an individual system identified for the area outside the city service area (on Figure B-16). The subregional system consists of an

8-42
additional 1,000 feet of gravity line, a 0.102 MGO pump station, 3,000 feet of force main, and 0.118 MGO of additional treatment capacity. current WWTP has sufficient capacity through the year 2005.
The city's The only
additional capacity required is for the area outside the city limits. The extra capacity at the Newark WWTP was not considered available for other than city use. The subregional system is shown on Figure 8-21. Costs for the subregional conveyance and treatment facilities are summarized in Table 8-20. These costs are subregional costs only, and the annual costs for the individual collection system ($415 per household) should be added to determine the total cost to the household users.
80at Club Subregional System
The Boat Club subregional system was developed by incorporating the unsewered areas in the southeast region of the lake into the sewered system. Tarrant County MUD No. 1 currently serves the Lake Country area and through a series of pump stations transfers the wastewater into the Fort Worth collection system. The soils in this area are very rocky and are unsuitable for individual sub-surface disposal systems. Individual collection systems were identified for both the Boat Club FPA (on Figure 8-19) and for the unsewered areas of the Lake Country FPA (on Figure 8-20). A subregional system was identified on Figure 8-24 to transfer the collected wastewater to the Fort Worth collection system for treatment. The additional facH ities necessary include two pump stations (0.016 MGO and 0.090 MGO) and 23,500 feet of force main. Costs for the subregional conveyance facilities are summarized in Table 8-21. These costs are subregional costs only, and the costs for the individual collection systems ($555 per household per year for 80at Club FPA and $335 per household per year for Lake County FPA) should be added to determine the total costs for each household user of the individual planning areas. The costs for treatment by the City of Fort Worth are based on present wholesale rates of $0.3374 per 1000 gallons for volume, plus

B-43
$0.0683 per pound for BOD and $0.0417 per pound for TSS, plus $27 per month for billing charges.
Regional Systems
Regional systems include all FPAs in a general geographic location and two such systems have been identified for the EMl regional planning area. One is on the north end of the lake (Northside regional system) and serves Boyd, Aurora, and Newark, and one is on the West s ide of the lake (Wests ide regional system) and serves all seven of the FPAs from Briar Creek south to Walnut Creek. The regional systems are shown on Figures B-25 and B-26. Facilities for the regional systems are limited to the treatment plant and the pump stations, force mains, and gravity lines necessary to transport the wastewater from the individual planning areas to the regional treatment plant. The regional system facilities do not include any local collection facil ities within the individual pl anning areas. In the cases of the Ash Creek, Reno, and Briar Creek FPAs, the regional system does include the lines within the FPA which were included in the subregional systems. The regional systems are described more completely, including cost information, below. Estimated costs for households served by regional systems are determined by combining the cost for the regional conveyance and treatment facilities, and the cost for the individual planning area collection system.
Westside Regional System
The Westside regional system was developed by combining all of the individual FPAs on the west side of Eagle Mountain lake. This includes the Azle, Ash Creek, Reno, Pelican Bay, Peden, Swift Branch and Briar Creek FPAs. The regional system includes the subregional systems for Ash Creek System No.1 (Figure B-22), Walnut Creek System No. I, (Figure B-22) and Briar Creek, (Figure B-21) but does not include the local collection

8-44
facil ities identified in any of the individual collection systems. The regional system is shown on Figures 8-25 and 8-26. It includes 82,500 feet of gravity 1 ine, 5 pump stations (0.154 MGO, 0.093 MGO, 0.071 MGO, 0.344 MGO, 1.167 MGO), 49,500 feet of force mains, and 1.496 MGO of additional treatment plant capacity. Costs for the regional system are summarized in Table 8-22. These costs reflect only the regional conveyance and treatment facilities costs, and do not include any individual collection system costs. The local collection facil ity costs associated with each individual area must be combined with the regional cost to obtain the total household user costs.
Northside Regional System
The Northside regional system was developed by combining FPAs on the north end of Eagle Mountain Lake, specifically 80yd, Aurora, and the Newark area. The regional system is shown on Figure 8-25. It includes 42,000 feet of gravity line, one 0.094 MGO pump station, 3,000 feet of force main, and a 0.446 MGO treatment plant. Costs for the regional conveyance and treatment facilities are summarized in Table 8-23. These costs reflect only the regional system costs and do not include any individual collection facility costs or subregional system costs. The local collection system costs associated with each individual area must be combined with the regional costs to obtain the total household user costs.
ADDITIONAL ALTERNATIVES EVALUATED IN PHASE II
Additional alternatives evaluated during Phase II of this study for wastewater discharges from the City of Azle and/or Pelican 8ay and other FPAs on the west side of EML can be divided into three basic groupings with treatment options based on point of treatment as follows:
1. Ash Creek and Walnut Creek WWTPs 10/15/2 10/15/2 with Phosphorous Removal 10/15/2 with Nitrogen Removal
2. Fort Worth Satellite WWTP 2.04 MGD 6.3 MGD
3. Fort Worth Village Creek WWTP
8-45
The first group which includes modification of existing plants, considered various treatment requirements as future effluent requirements have not yet been estab 1 i shed by TWC. The second group cons i ders a plant 1 ocat i on west of Lake Worth as shown in the 1983 201 Facilities Plan for the Village Creek WWTP. Two plant sizes were considered for this group. One plant size was based on the flow requi rement of 2.04 MGD to serve the popul at i on of the service area (17040) and a per capita flow of 120 gallons per day. The second considered the Fort Worth Facilities Plan plant sized at 6.3 MGD with outfall to Marys Creek. The third group considered discharge into the Fort Worth system wi th treatment at the Vi 11 age Creek WWTP in accordance with plans of the City's current wastewater master plan, soon to be completed.
Various service area options were considered for each of the groupings and treatment categories which resulted in the following list of eleven alternatives:

B-46
Alternative 2005 No. Treatment Facility Service Area Popylation
1 Ash Crk/Walnut Crk 10/15/2 Azle 10500
2 Ash Crk/Walnut Crk 10/15/2 Azle, Pelican Bay 13935
3 Ash Crk/Walnut Crk 10/15/2 with Phosphorous Removal Azle 10500
4 Ash Crk/Walnut Crk 10/15/2 with Phosphorous Removal Azle, Pelican Bay 13935
5 Ash Crk/Walnut Crk 10/15/2 with Nitrogen Removal Azle 10500
I 6 Ash Crk/Wal nut Crk 10/15/2 with Nitrogen Removal Azle, Pelican Bay 13935
) 7 Satellite WWTP 2.04 MGD Azle, Downstream 17040 Intervening
8 Satellite WWTP - 6.3 MGD Azle, Downstream 19377 Intervening Fort Worth Silver Crk/ Live Oak
9 Fort Worth Village Creek WWTP Azle 10500
10 Fort Worth Village Creek WWTP Azle, Pelican Bay 13935
11 Fort Worth Village Creek WWTP Azle, West Side EML 21995
Cost summary tables for these additional alternatives evaluated during Phase II are included on Tables B-24, B-25, and B-26. System layouts for Alternatives I, 3, and 5 modification of Azle WWTP for dischargers from Azle only would be the same as shown on Figure B-3 for the existing Walnut Creek section of the system and Figure B-4 for the Ash Creek section of the system. Alternates 2, 4 and 6 which include Pelican Bay with the Azle service area and treatment at the modified existing Azle WWTP are shown on Figure B-26 for the Walnut Creek drainage area and Figure B-4 for the Ash Creek drainage area. Figure B-27 shows the location of the satellite

B-47
treatment plant used in Alternates 7 and 8. ngure B-27 also shows the service area for Alternate 7 including the downstream intervening area from Azle to Lakeside as well as the Alternate 8 service area which also includes the Silver Creek and Live Oak Creek sewersheds on the west side of Lake Worth. Figures 8-28 and B-29 show local collection system in Azle modified to close existing treatment plants and provide lift stations at the existing Walnut Creek and Ash Creek plant sites. Figure 8-30 shows the proposed Fort Worth wastewater system expansion in EHL region per Fort Worth Haster Plan as well as conveyance route to the proposed Fort Worth system expans i on along Highway 199 including the proposed 1 ift station near Lakeside for transfer to the existing Fort Worth Jenkins Heights 1 ift station at Lake Worth and then downstream transfer to the Marine Creek sewershed and finally to Village Creek WWTP as identified for Alternates 9, 10, and 11. Local collection system in Azle for Alternates 7, 8, and 9 is shown on Figures B-28 and B-29 and Alternate 10 Figure 8-31 shows Pelican Bay/Azle layout per Alternate 10 for North Area. Layout for the south area is as shown on as Figure B-29. Figure B-32 shows layout of Westside facil ities for Alternate 11.
I!IASTEVATER FACILITY C(IICLUSI<ItS All) RECQIPlAII<ItS
FOR VARIOUS FACILITY PlANNING AREAS
The following summary conclusions are presented as a result of water quality and wastewater facility planning studies performed for the EML Region based on presently defined planning criteria and feasibility analysis utilized in these studies:
Organized wastewater systeMs are probably not cost effective in the immediate future for any areas which are presently unsewered. However, increased development and/or problems with on-site systems could alter this.

8-48
Increasingly stringent effluent requirements which are necessary to protect our water supply resources may require communities such as Az1e with existing organized systems to seriously consider the diversion of sewage flows out at the EML watershed.
Expansion of the existing Az1e wastewater treatment plants should be ina manner whi ch facil i tates ultimate i nc1 us i on of phosphorous removal and nitrification at all facilities
Gradual extension of sewerage service into outlying areas, could be achieved by requiring new housing or commercial developments to provide sewage collection systems with cluster on-site treatment facilities with either surface or subsurface land disposal of eff1 uent. Surface 1 and di sposa 1 systems must be permi tted by the TWC whereas subsurface disposal systems are licensed by either the District or County depending on proximity to the lake.
An operations agency should be identified which can guide local interests in properly operating and maintaining existing on-site systems and/or new c1 uster-type systems. Such an agency could possibly provide O&H services such as the pump out of holding tanks and could possibly operate septage treatment plants until a pub1 ic sewer system becomes available.
Table 8-27 summarizes determinations made during our current studies and 1 i sts the most des i rab 1 e a lternat i ves on the bas is of general feas i bll i ty based on current parameters, as opposed to a definite conclusion or recommendation for each. It can be seen from Table 8-27 that the identified system costs for 1990 vary from about $280 to over $1600 per household per year. The economic screening parameters utilized in costing studies for this current study have included the EPA affordability guidelines which for Tarrant County are $325 per household per year based on 1.75 percent of the
B-49
1979 medium household income of $18,642 (recent Census Bureau publication). Most of these costs are excessive since the EMl region is sparsley populated. Over 30 percent of the population of the EMl region is considered to be rural and in unincorporated areas and as such is not current ly amendabl e to the development of organi zed systems. Developed urban land areas cover only about 3 percent of the EHl watershed. The largest incorporated city in the EMl watershed is Azle which had a 1987 population 7750. There are five other incorporated cities in the region and their 1987 population varies from 500 to 2200 and the total of the five is only about 6000. All of these facts illustrate that most areas of the EMl region are still rural in nature. However, even though the evaluated wastewater facil Hies for most of the FPAs in the EMl planning region are uneconomical at this time based on evaluation parameters used for the planning criteria of the current study, the systems identified should be
reevaluated in the future as population density increases and other water quality management requirements become more acute.
The problems associated with the proper installation and maintenance of adequately designed on-site disposal systems are becoming more critical. Requi red compl i ance wi th the updated Construct ion Standards for On-Site Sewerage Facilities adopted by the Texas Department of Health in June 1987 which became effective January 1, 1988 will be imperative for new development if organized wastewater systems are not available as well as for existing develoPMnt served by on-site systems requiring major repair or modification. Use of the updated standards will be required to provide for facilities that will reduce potential contamination of potable water supplies and/or reduce the potential threat to the health and welfare of the pub 1 i c. As popu lit i on increases in the run 1 areas of the EMl p linn i ng region which do not have organized systems, the requirements for proper onsite systems will beca.e substantially more costly and this should provide additional incentive for the development of organized systems.
8-50
The importance of developing organized systems as soon as feasible cannot be overstated. The continued use of on-site disposal, particularly in areas of poor soil capabil ities, which covers much of the EMl region, adversely impacts nonpoint source loadings to EMl. The estimated current NPS loadings to EMl expressed as a percentage of the total 1 oadi ng for Phosphorous, Nitrogen and BOD are 70.9, 88.8 and 94.8 percent, respectively, as shown in Table 111-14 of this report.
Contingent upon the outcome of the City of Azle discharge permit application hearings currently being conducted by the TWC and completion of TWC modeling of EMl to establish effluent limitations, discussion should probably be initiated with the City of Fort Worth to evaluate requirements to ultimately divert all City of Azle sewage to the City of Fort Worth wastewater system as proposed in the Fort Worth Water and Wastewater System Master Pl an currently being developed by the City and its consultants. Also the inclusion of Pelican Bay should be carefully considered as it is one of the most densely popul ated areas located near the shore 1 i ne of EMl but st i 11 using on-site disposal systems. A plan such as this would meet the definition of a regional system as discussed by the Advisory Committee for this study in October 1987 in that it would convey the wastewater out of the watershed of EMl to the Fort Worth Wastewater System.

TABLES

TABLE B-1
COST SUMMARY FOR THE ASH CREEK FPA
Degree of S)!~te!!l 1 S)!stem Z Treatment 10/15 10/15/2 10/15 10/15/2
2005 population 520 520 280 280 served
Tota 1 collection $ 563,000 $ 563,000 $ 384,000 $ 384,000 system capital ~
cost
Treatment plant 500,000 550,000 360,000 380,000 capita 1 cost
Total capital 1,063,000 1,113,000 744,000 764,000 cost
Annualized capital 82,000 86,000 57,000 59,000 cost
Annual O&M Cost 25,000 29,000 21,000 25,000
Total annual 107,000 115,000 78,000 84,000 cost
Annual cost $ 520 $ 560 $ 710 $ 760 per household
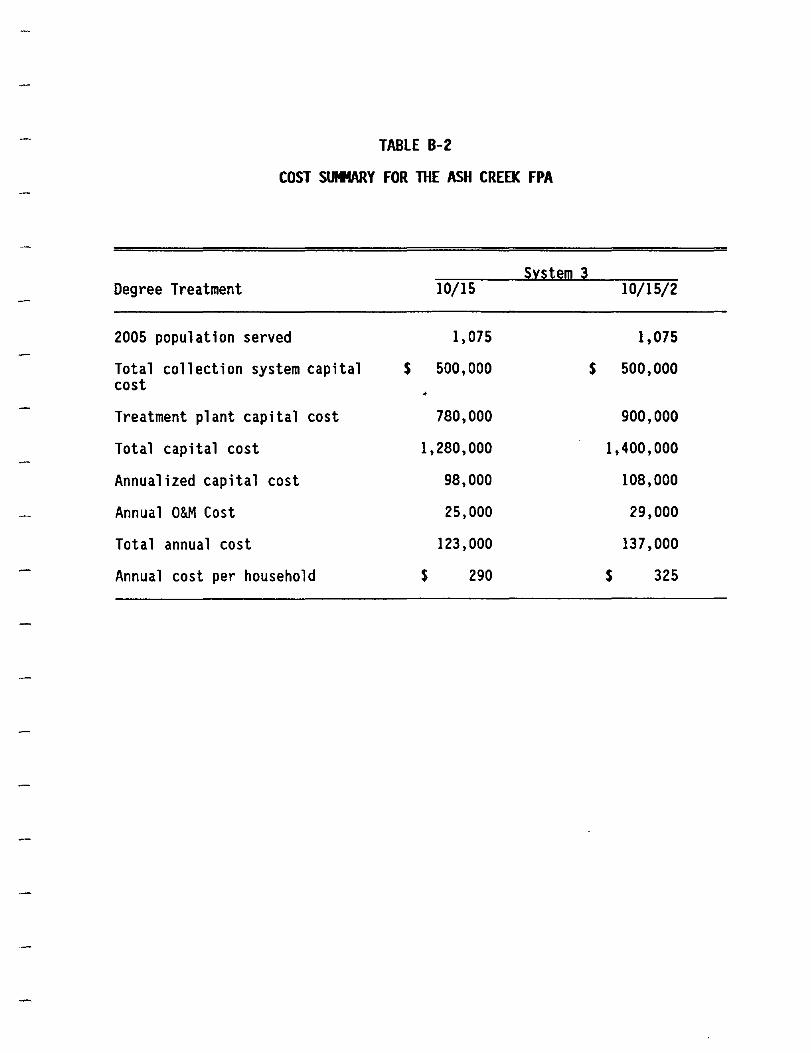
TABLE 8-2
COST SutltARY FOR THE ASH CREEK FPA
Degree Treatment
2005 population served
Total collection system capital cost
Treatment plant capital cost
Total capital cost
Annualized capital cost
Annual O&M Cost
Total annual cost
Annual cost per household
$
Sntem ~ 10/15
1,075
500,000
780,000
1,280,000
98,000
25,000
123,000
$ 290
10/15/2
1,075
$ 500,000
900,000
1,400,000
108,000
29,000
137,000
$ 325

TABLE B-3
COST SUMMARY FOR THE PELICAN BAY FPA
Description
2005 population served
Total collection system capital cost
Treatment plant capital cost
Total capital cost
Annualized capital cost
Annual O&M Cost
Total annual cost
Annual cost per household
10/15
3,435
$1,213,000
1,800,000
3,013,000
232,000
84,000
316,000
$ 235
Dggrge Qf Ire~lmgnl 10/15/2
3,435
$1,213,000
2,100,000
3,313,000
255,000
100,000
355,000
$ 260
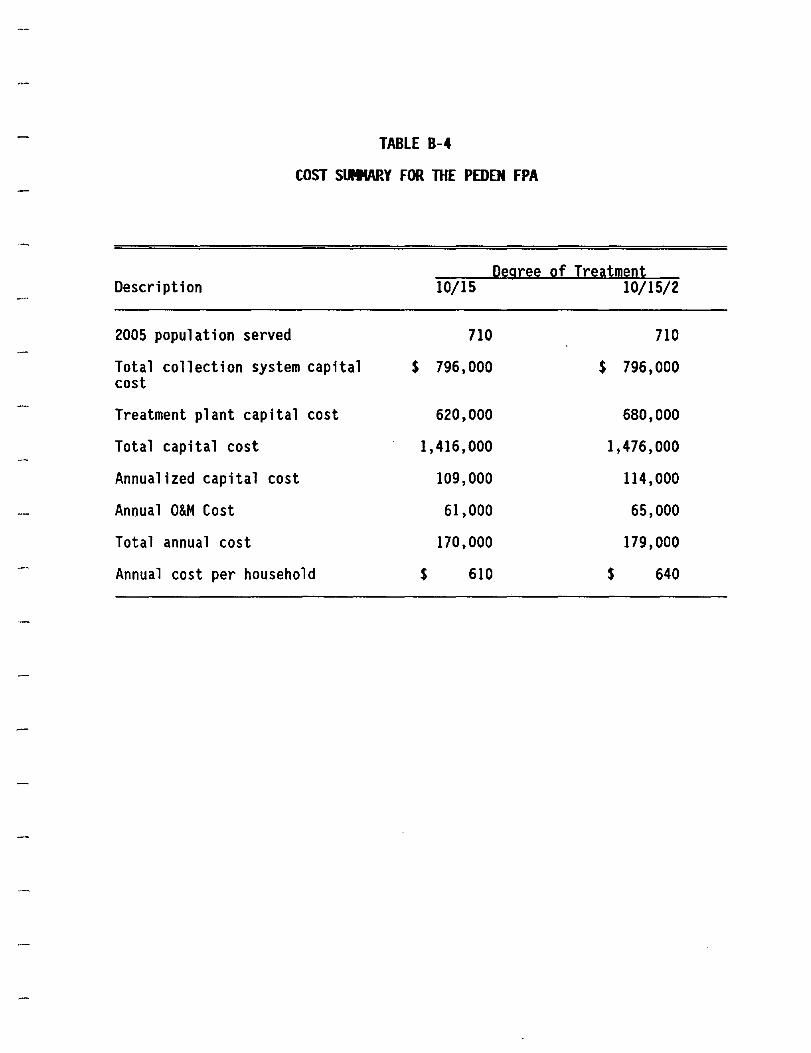
TABLE 8-4
COST SUMMARY FOR THE PEDEN FPA
Description
2005 population served
Total collection system capital cost
Treatment plant capital cost
Total capital cost
Annualized capital cost
Annual O&M Cost
Total annual cost
Annual cost per household
$
10115
710
796,000
620,000
1,416,000
109,000
61,000
170,000
$ 610
D~gr~~ Qf Ir~~!ment 10/15/2
710
$ 796,000
680,000
1,476,000
114,000
65,000
179,000
$ 640

TABLE B-5
COST SUMMARY FOR THE SWIFT BRANCH FPA
Description
2005 population served
Total collection system capital cost
Treatment plant capital cost
Total capital cost
Annualized capital cost
Annual O&M Cost
Total annual cost
Annual cost per household
$
10/15
930
878,000
730,000
1,608,000
124,000
74,000
198,000
$ 540
Oegr~~ Qf Ir~~tm~nt 10/15/2
930
$ 878,000
820,000
1,698,000
131,000
78,000
209,000
$ 570
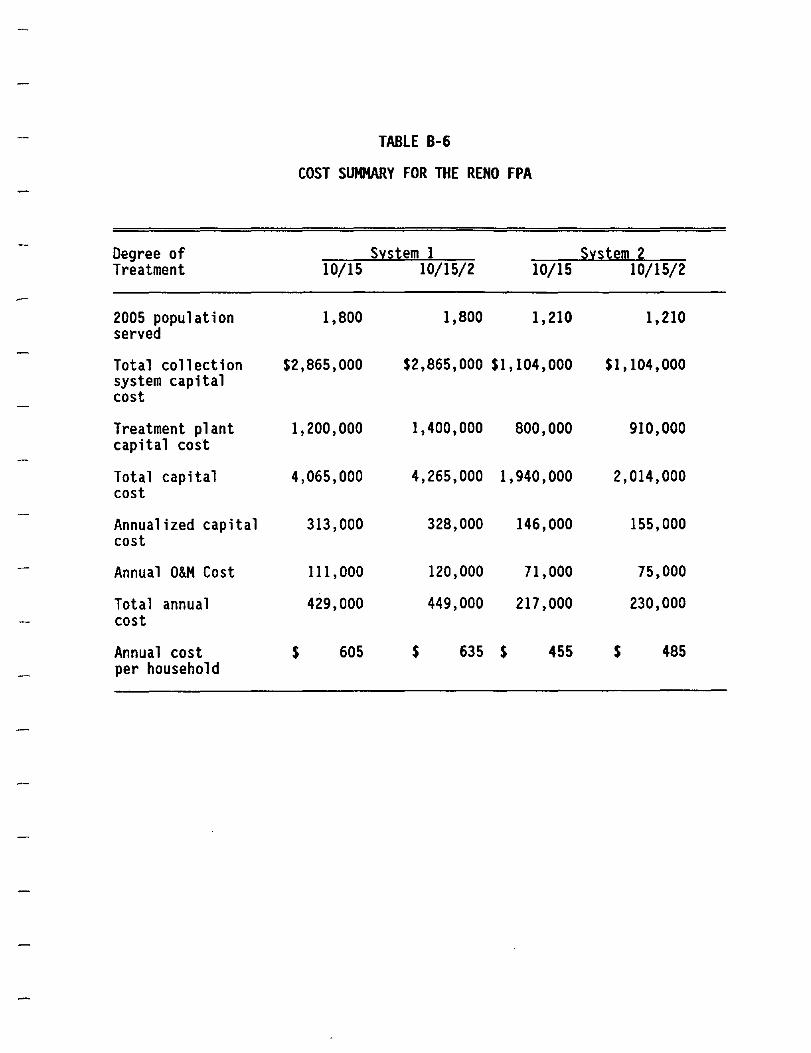
TABLE 8-6
COST SUMMARY FOR THE RENO FPA
Degree of S;tstem 1 S;t~tem Z Treatment 10/15 10/15/2 10/15 10/15/2
2005 population 1,800 1,800 1,210 1,210 served
Total collection $2,865,000 $2,865,000 $1,104,000 $1,104,000 system capital cost
Treatment plant 1,200,000 1,400,000 800,000 910,000 capital cost
Total capital 4,065,000 4,265,000 1,940,000 2,014,000 cost
Annualized capital 313,000 328,000 146,000 155,000 cost
Annual O&M Cost 111,000 120,000 71 ,000 75,000
Total annual 429,000 449,000 217,000 230,000 cost
Annual cost $ 605 $ 635 $ 455 $ 485 per household

TABLE B-7
COST S~Y FOR THE BRIAR CREEK FPA
Degree of ~:lst~m 1 ~:lstem Z Treatment 10/15 10/15/2 10/15 10/15/2
2005 population 1,180 1,180 355 355 served
Total collection $1,127,000 $1,127,000 $ 533,000 $ 533,000 system capital cost
Treatment plant 800,000 910,000 400,000 450,000 capital cost
Total capital 1,927,000 2,037,000 933,000 983,000 cost
Annualized capital 148,000 157,000 72,000 76,000 cost
Annual O&M Cost 70,000 74,000 24,000 28,000
Total annual 218,000 231,000 96,000 104,000 cost
Annual cost $ 470 $ 500 $ 685 $ 745 per household

TABLE 8-8
COST SUMMARY FOR THE AURORA FPA
Description
2005 population served
Total collection system capital cost
Treatment plant capital cost
Total capital cost
Annualized capital cost
Annual O&M Cost
Total annual cost
Annual cost per household
$
10/15
520
787,000
500,000
1,287,000
99,000
31,000
130,000
$ 635
gegr~~ Qf Treatment 10/15/2
520
$ 787,000
540,000
1,327,000
101,000
35,000
136,000
$ 665

TABLE 8-9
COST SUMMARY FOR THE NEWARK FPA
Description
2005 population served
Total collection system capital cost
Treatment plant capital cost
Total capital cost
Annualized capital cost
Annual O&M Cost
Total annual cost
Annual cost per household
10/15
1,175
$1,683,000
800,000
2,483,000
191,000
87,000
278,000
$ 600
~egre~ 2f Treatment 10/15/2
1,175
$1,683,000
900,000
2,583,000
199,000
90,000
289,000
$ 625

TABLE 8-10
COST SUMMARY FOR THE AVONDALE FPA
Description
2005 population served
Total collection system capital cost
Treatment plant capital cost
Total capital cost
Annualized capital cost
Annual O&M Cost
Total annual cost
Annual cost per household
$
10/15
575
517 ,000
550,000
1,067,000
82,000
24,000
106,000
$ 470
Degr~~ Qf Tre~tment 10/15/2
575
$ 517 ,000
610,000
1,127,000
87,000
28,000
115,000
$ 510

TABLE 8-11
COST SUMMARY FOR THE GIlMORE BRANCH FPA
Description
2005 population served
Total collection system capital cost
Treatment plant capital cost
Total capital cost
Annualized capital cost
Annual O&M Cost
Total annual cost
Annual cost per household
$
10/15
575
435,000
550,000
985,000
76,000
58,000
127,000
$ 560
Qegree Qf Tr~gtment 10/15/2
575
$ 435,000
610,000
1,045,000
78,000
55,000
123,000
$ 585

TABLE B-12
COST SUMMARY FOR THE BOAT CLUB FPA
Description
2005 population served
Total collection system capital cost
Treatment plant capital cost
Total capital cost
Annualized capital cost
Annual O&M Cost
Total annual cost
Annual cost per household
10/15
750
$1,385,000
640,000
2,025,000
156,000
125,000
281,000
$ 950
D~gr~~ gf Ir~~tm~nt 10/15/2
750
$1,385,000
700,000
2,085,000
160,000
129,000
289,000
$ 980

TABLE B-13
COST SUMMARY FOR THE lAKE COUNTRY FPA
Qegree of Treatment Description 10/15 10/15/2
2005 population served 160 160
Total collection system capital $ 186,000 $ 186,000 cost
Treatment plant capital cost 260,000 270,000
Total capital cost 446,000 456,000
Annualized capital cost 34,000 35,000
Annual O&M Cost 25,000 29,000
Total annual cost 59,000 64,000
Annual cost per household $ 935 $ 1,015
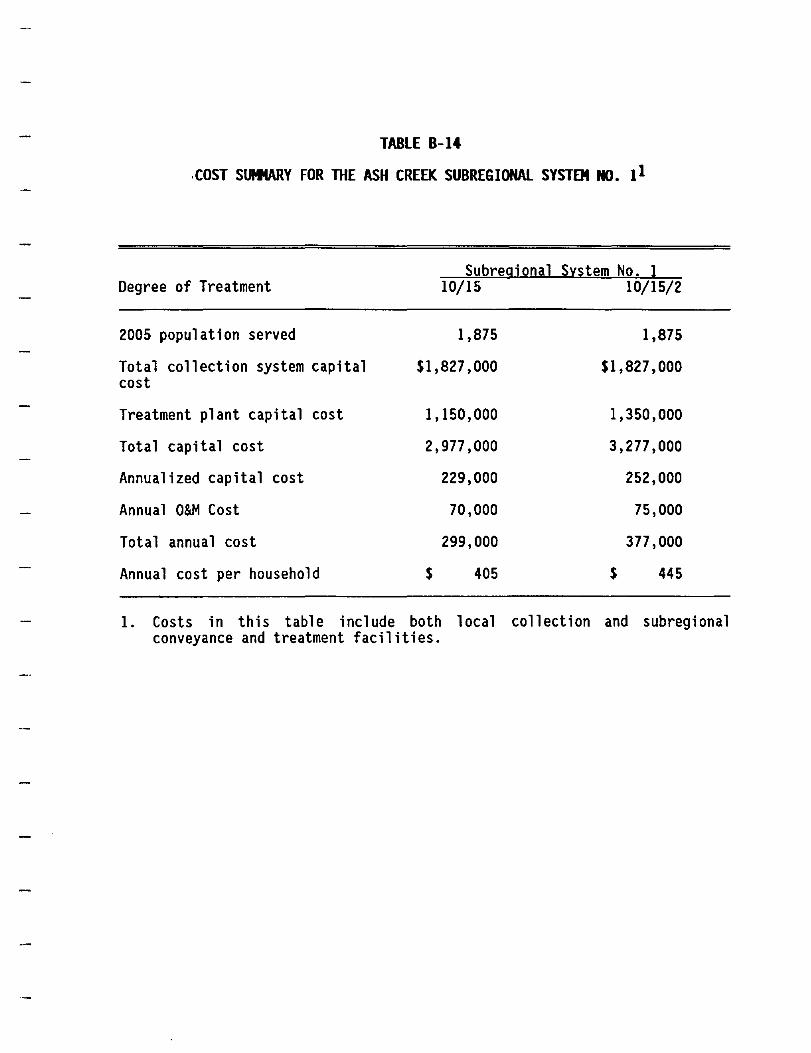
TABLE B-14
,COST SurtWlY FOR THE ASH CREEK SUBREGIONAl SYSTEM NO. 11
Degree of Treatment
2005 population served
Total collection system capital cost
Treatment plant capital cost
Total capital cost
Annualized capital cost
Annual O&M Cost
Total annual cost
Annual cost per household
Subregional 10/15
1,875
$1,827,000
1,150,000
2,977,000
229,000
70,000
299,000
$ 405
S~~tem No. 1 10/15/2
1,875
$1,827,000
1,350,000
3,277,000
252,000
75,000
377 ,000
$ 445
1. Costs in this table include both local collection and subregional conveyance and treatment facilities.
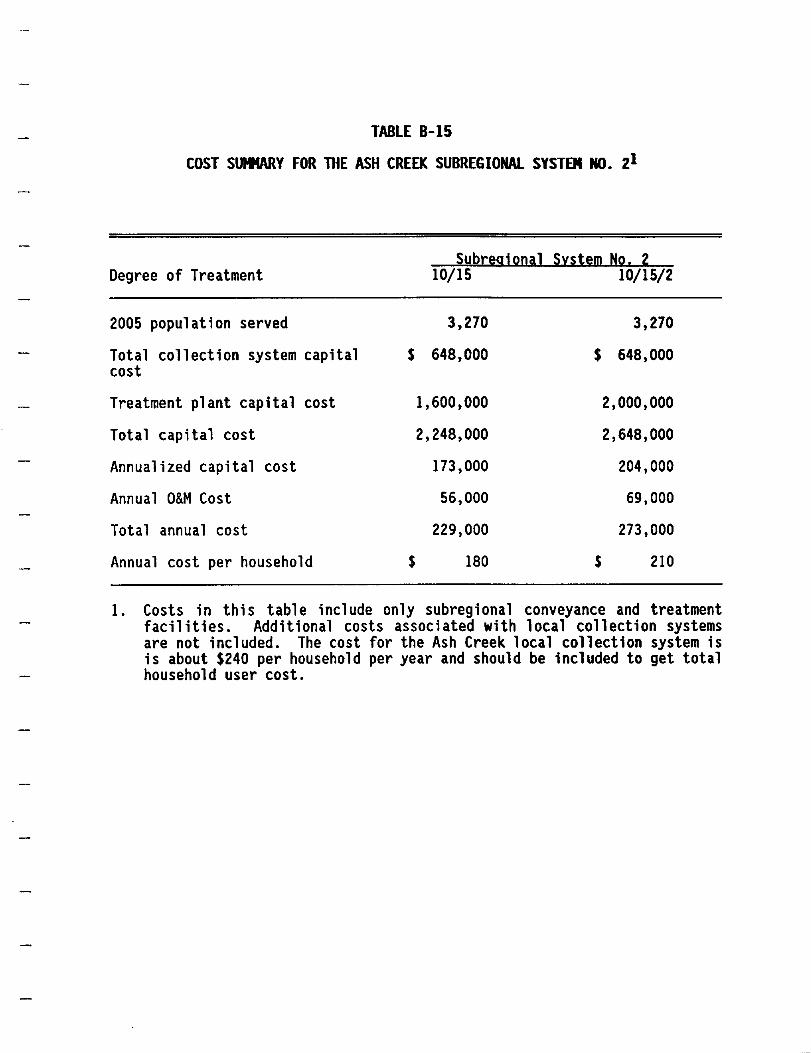
TABLE 8-15
COST SutMARY FOR THE ASH CREEK SUBREGIONAL SYSTEM NO. ZI
SybI:~9jQDi] S~~t~m HQ. Z Degree of Treatment 10/15 10/15/2
2005 population served 3,270 3,270
Total collection system capital $ 648,000 $ 648,000 cost
Treatment plant capital cost 1,600,000 2,000,000
Total capital cost 2,248,000 2,648,000
Annualized capital cost 173,000 204,000
Annual O&M Cost 56,000 69,000
Total annual cost 229,000 273,000
Annual cost per household $ 180 $ 210
1. Costs in this table include only subregional conveyance and treatment facil ities. Additional costs associated with local collection systems are not included. The cost for the Ash Creek local collection system is is about $240 per household per year and should be included to get total household user cost.
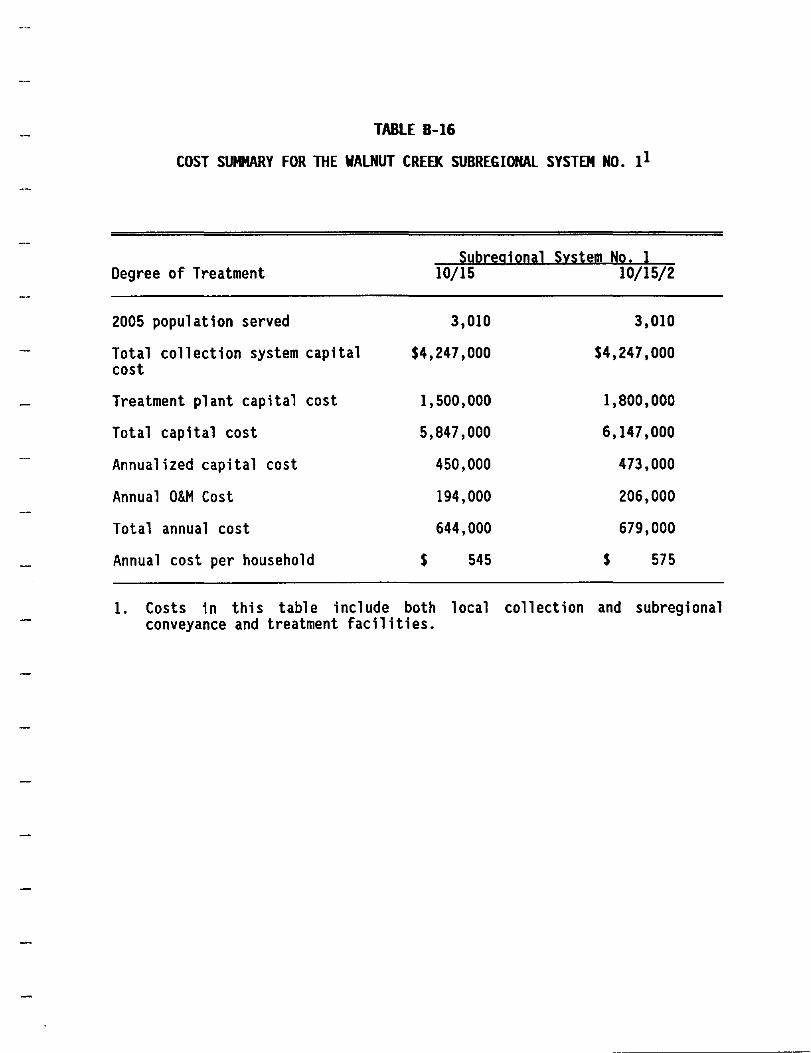
TABLE 8-16
COST SUMMARY FOR THE WALNUT CREEK SUBREGIONAL SYSTEM NO. 11
Degree of Treatment
2005 population served
Total collection system capital cost
Treatment plant capital cost
Total capital cost
Annualized capital cost
Annual O&M Cost
Total annual cost
Annual cost per household
Syb[~9j2Di] 10/15
3,010
$4,247,000
1,500,000
5,847,000
450,000
194,000
644,000
$ 545
Snt~m H2. 1 10/15/2
3,010
$4,247,000
1,800,000
6,147,000
473,000
206,000
679,000
$ 575
1. Costs in this table include both local collection and subregional conveyance and treatment facilities.
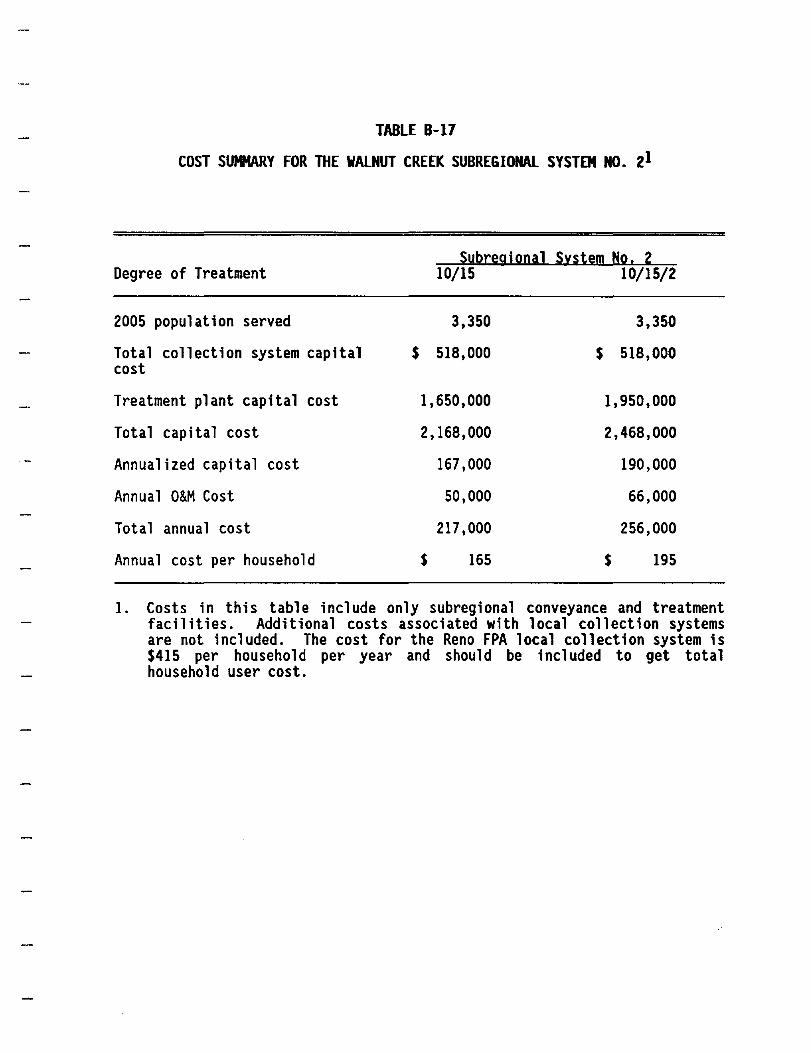
TABLE 8-17
COST SUMMARY FOR THE WALNUT CREEK SUBREGIONAl SYSTEM NO. 21
Degree of Treatment
2005 population served
Total collection system capital cost
Treatment plant capital cost
Total capital cost
Annualized capital cost
Annual O&M Cost
Total annual cost
Annual cost per household
$
Syt2r~gj2ni] 10/15
3,350
518,000
1,650,000
2,168,000
167,000
50,000
217,000
$ 165
Snt~m H2. Z 10/15/2
3,350
$ 518,000
1,950,000
2,468,000
190,000
66,000
256,000
$ 195
1. Costs in this table include only subregional conveyance and treatment facilities. Additional costs associated with local collection systems are not included. The cost for the Reno FPA local collection system is $415 per household per year and should be included to get total household user cost.

TABLE 8-18
COST SUMMARY FOR THE SWIFT BRANCH SUBREGIONAL SYSTEM!
Description
2005 population served
Total collection system capital cost
Treatment plant capital cost
Total capital cost
Annualized capital cost
Annual O&M Cost
Total annual cost
Annual cost per household
$
Degree of Treatment 10/15 10/15/2
5,075 5,075
470,000 $ 470,000
2,100,000 2,600,000
2,670,000 3,170,000
245,000 244,000
101,000 124,000
306,000 368,000
$ 155 $ 185
1. Costs in this table are for subregional conveyance and treatment facH ities only. Additional costs associated with local collection systems are not included. The annual cost for the Pelican Bay local collection system is $125 per household, for the Peden local system is $355 and for the Swift Branch 1 oca 1 system is $300 per household per year and hsould be included to get total household user cost for respective area.

TABLE B-19
COST SUMMARY FOR THE BRIAR CREEK SUBREGIONAL SYSTEMI
Description
2005 population served
Total collection system capital cost
Treatment plant capital cost
Total capital cost
Annualized capital cost
Annual O&M Cost
Total annual cost
Annual cost per household
Degree of Treatment 10/15 10/15/2
1,535 1,535
$1,766,000 $1,766,000
900,000 1,100,000
2,766,000 2,966,000
213,000 228,000
91,000 97,000
304,000 325,000
$ 505 $ 540
1. Costs in this table include both local collection and subregional conveyance and treatment facilities.

TABLE B-20
COST SlDItARY FOR THE NEWARK SUBREGIONAL SYSTEM
O~gr~~ Qf Ir~~tm~Dt Description
2005 population served
Total collection system capital cost
Treatment plant capital cost
Total capital cost
Annualized capital cost
Annual O&M Cost
Total annual cost
Annual cost per household
$
10/15
1,175
129,000
700,000
829,000
64,000
27,000
91,000
$ 195
10/15/2
1,175
$ 129,000
800,000
929,000
71 ,000
32,000
103,000
$ 225
1. Costs in this table include only subregional conveyance and treatment facil ities. Additional costs associated with local collection systems are not included. The annual costs for local collection system is about $435 per household and should be included to get total household user costs.
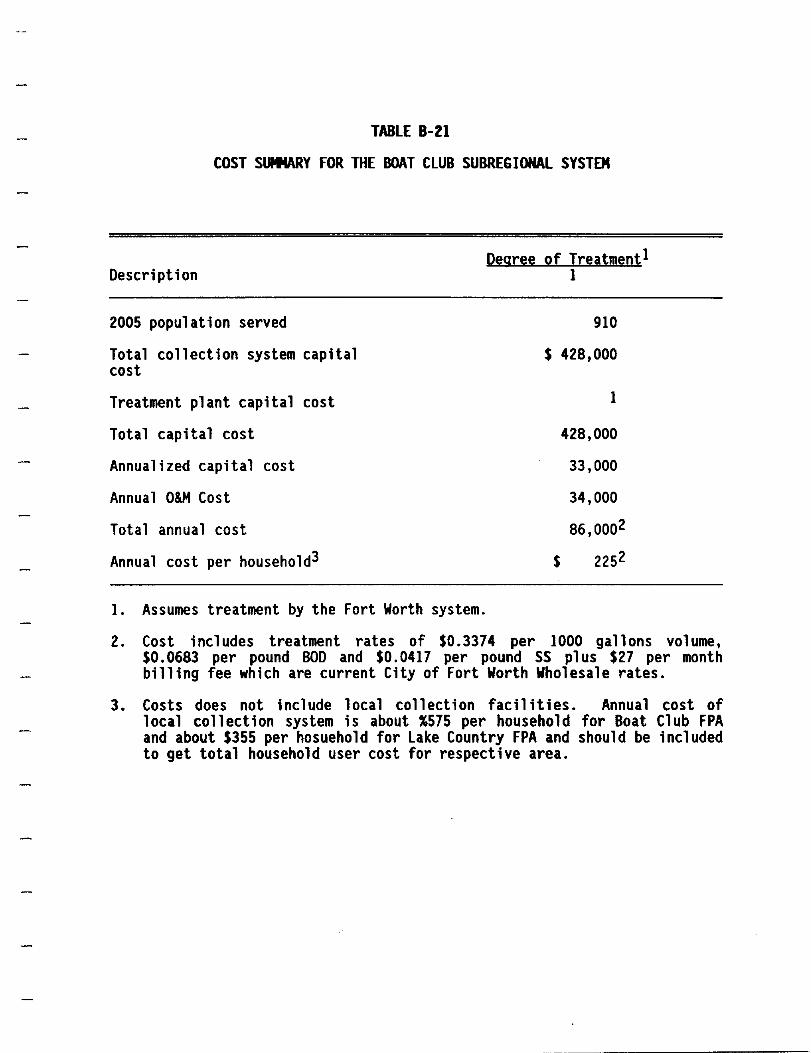
TABLE 8-21
COST SUMMARY FOR THE BOAT CLUB SUBREGIONAL SYSTEM
Description
2005 population served
Total collection system capital cost
Treatment plant capital cost
Total capital cost
Annualized capital cost
Annual O&M Cost
Total annual cost
Annual cost per household3
1. Assumes treatment by the Fort Worth system.
Degree of Treatment1 1
910
$ 428,000
1
428,000
33,000
34,000
86,0002
$ 2252
2. Cost includes treatment rates of $0.3374 per 1000 gallons volume, $0.0683 per pound BOD and $0.0417 per pound SS plus $27 per month billing fee which are current City of Fort Worth Wholesale rates.
3. Costs does not include local collection facil ities. Annual cost of local collection system is about %575 per household for Boat Club FPA and about $355 per hosuehold for lake Country FPA and should be included to get total household user cost for respective area.

TABLE 8-22
COST SUMMARY FOR THE WESTSIDE REGIONAL SYSTEMI
Description
2005 population served
Total collection system capital cost
Treatment plant capital cost
Total capital cost
Annualized capital cost
Annual O&M Cost
Total annual cost
Annual cost per household
Degree of Treatment 10/15 10/15/2
14,955 14,955 L/
>1.406,000 $4,406,000
5,786,000 6,019,000
10,192,000 10,425,000
784,000 802,000
375,000 378,000
1,159,000 1,327,000
$ 195 $ 210
1. Costs in this table include only regional conveyance and treatment facil ities. Additional costs associated with local collection systems for each respective area should be included to get total household user cost for respective area.

TABLE 8-23
COST SUMMARY FOR THE NORTHSIDE SUBREGIONAL SYSTEM 1
Description
2005 population served
Total collection system capital cost
Treatment plant capital cost
Total capital cost
Annualized capital cost
Annual O&M Cost
Total annual cost
Annual cost per household
Degree of Treatment 10/15 10/15/2
4,455 4,455
$1,590,000 $1,590,000
2,000,000 2,500,000
3,690,000 4,190,000
284,000 322,000
100,000 121,000
384,000 443,000
$ 220 $ 250
1. Costs in this table include only regional conveyance and treatment facil ities. Additional costs associated with local collection systems for each respective area should be included to get total household user cost for respective area.

TAILE 1-24
COST SUMMAR' FOR ALTER.ATES 1-6 MODIFICATIOI OF AZLE UUT'a
101151Z Pl.ntl 10/15/2 with P Re.oy.l 10/15/2 with N Re.ov.l
D.acrlptlon
zoos Population •• rved
Totll coll.ctlon systelll c.plt.l co.t
Tr •• t.ent pl.nt • • odlflcatlon clplUI cost
Tot! I c.pl U I COlt
Annu.llz.d c.pl ttl co.t
Annu.l LIM cost
Tot.l .nnu.l COlt
Annu.l COlt
Azl. Only
10500
11,700,000
1,700,000
131,000
280,000
411,000
p.r household l ,2 I 100
Azl •• nd P.llc.n Bay
13935
?
11,700,000
1,700,000
131,000
280,000
411,000
I 90
Azle Only
10500
12,005,000
2,005,000
154,000
369,000
523,000
I 125
Azle .nd Pelic.n B.y
13935
2
Azle Only
10500
12,005,000 12,553,000
2,005,000 2,553,000
154,000 196,000
369,000 369,000
523,000 565,000
I 110 I 135
Azle .nd Pelican Say
13935
2
12,553,000
2,553,000
196,000
369,000
565,000
120
1. Exl.tlng .y.t •• curr.nt cOltl to u •• rl Ire .bout 1130 per ye.r p.r hou.ehold. Projected co.t. for .xl.tlng .y.t •• could d.cr •••• to 195 per y •• r b •• ed on 2005 popul.tlon. co.t for .xlltlng .Ylt ••• hould b •• dded to .nnu.l co.t .hown to get tot.l household u •• r co.t,
2. Loc.l co.t. for propol.d p.llc.n S.y collection system .re .bout 1120 per household p.r ye.r b.l.d on 2005 popul.tlon .nd .hould b •• dded to annu.l cost .hown to get tot. I household user co.t.

TAILE 1-25
COST SUNNAIT FOR ALTER.ATES 7-8 DISCNAIGE TO SATELLITE WWTP
Description
2005 Population served
Total collection system capital cost
Treat.ent plants .odlflcetlon capital cost
Totel cepltel cost
Annuellzed cepltel cost
Annuel L&M cost
Total ennual cost
Annual cost per householdS
2,04 MGD S.tlllite Plant' Azle end Downstream Intervening to Lakeside 10/15 10/15/2
17040 17040
Sl,II36,0003 S1,836,0003
7,225,000 7,517,000
9,661,000 9,953,000
743,000 765,000
454,000 554,000
1,197,000 1,319,000
S 1110 S 195
1. Plent sized for population served 2. Plant size fro. Fort Worth 201 Fecilities Plan 3. Main conveyence fecilitle. to WWTP
6.3 MGD Setellite Plent 2
Azle end Downstree. Intervening + Ft. Worth Silver/Live Oak Crk
10/15
19377
Sl,II36,0003
20,900,000 4
23,336,000
1,795,000
1,244,000
3,039,000
S 400
4. Cost Include. effluent outf.ll line to Merys Creek for 10/15 plent only per f.cllitle. plen.
S. co.t for eKIstlng collection fecilitle. In Azle of ebout S130 per year should be edded to get totel household u.er co.t for these user •.

Description
2005 Population served
Total collection system capital cost
Total capital cost
Annualized capital cost
Annual treatment cost2
Annual O&M cost
Total annual cost
Annual cost per household
TABLE 8-2&
COST SUMMARY FOR AlTERNATES 9-11 DISCHARGE TO FORT WORTH VILlAGE CREEK WTP
l,'!ischarge tQ FQrt WQrtb S~~t~m l ~il]i9§ Cr~~k WWTP Azle Azle and Az1e and West Only Pelican Bay Side EML
10500 13935 21995
$1,391,0001 $1,955,0001 $5,523,0001
1,711,000 2,275,000 5,643,000
132,000 175,000 434,000
248,000 315,000 437,000
44,000 45,000 153,000
424,000 535,000 1,024,000
$ 105 $ 95 $ 125
1. Main conveyance facilities to lift station near Lakeside per Fort Worth Wastewater Master Plan. Local collection system costs not included. Additional local costs include $95 for Az1e and $120 per household per year for Pelican Bay. For local collection system costs for other individual FPAs on west side of EML see cost table for respective FPA.
2. Annual treatment costs based on current City of Fort Worth wholesale rates. Volume - $0.3375 per 1000 gal; BOD - $0.0683/1b.; SS - $0.0417/1b.; Billing $27 per month and estimated flows for 2005 population at average levels of BOD and 55 for domestic sewage.

TABLE B-27
EAGLE IIXJNTAIN lAKE REGICII WASTEWATER FACILITY SYSTEMS IDENTIFIED FOR VARIOUS FPAsl
Facil ity Planning Area
Azle Ash Creek Pel ican Bay
Peden Swift Branch Reno Briar Creek Hog Branch Boyd Aurora Oates Branch Newark Avondale Gilmore Branch Boat Club lake Country
Identified System local Management Agency
Annual Cost Type of Per Household System
$1503
$485-$1160 $4854
955 855
$885-$1165 750-1110
5
6
895 5
830 760 880
1645 16657
Ind. 3 City of Azle Ind. None Ind. City of
Pel ican Bay Ind. None Ind. None Ind. City of Reno Ind. None
5 None 6 City of Boyd
Ind. City of Aurora 5 None
Ind. City of Newark Ind. None Ind. Ind. Ind.
None None
7
On-Site Waste
Disposal
2 2
2
2
2
2 2
2
2
2
2
2 2
2 2 2
Existing System
Yes No No
No No No No No Yes No No
Yes No No No
Yes
1. 1990 cost based on 10/15/2 plant for individual area. Cost requirements subject to change based on treatment requirements/Eagle Mountain lake effluent guidelines to be established by TWC.
2. Generally on-site waste disposal regulations enforced by TWCID if household within 2000 feet of normal pool level (elevation 649.1) of EMl and/or municipal ity if located within incorporated area. Otherwise regulations enforced by Parker County Health Department, Tarrant County Health Department or Wise County Health Department according to location.
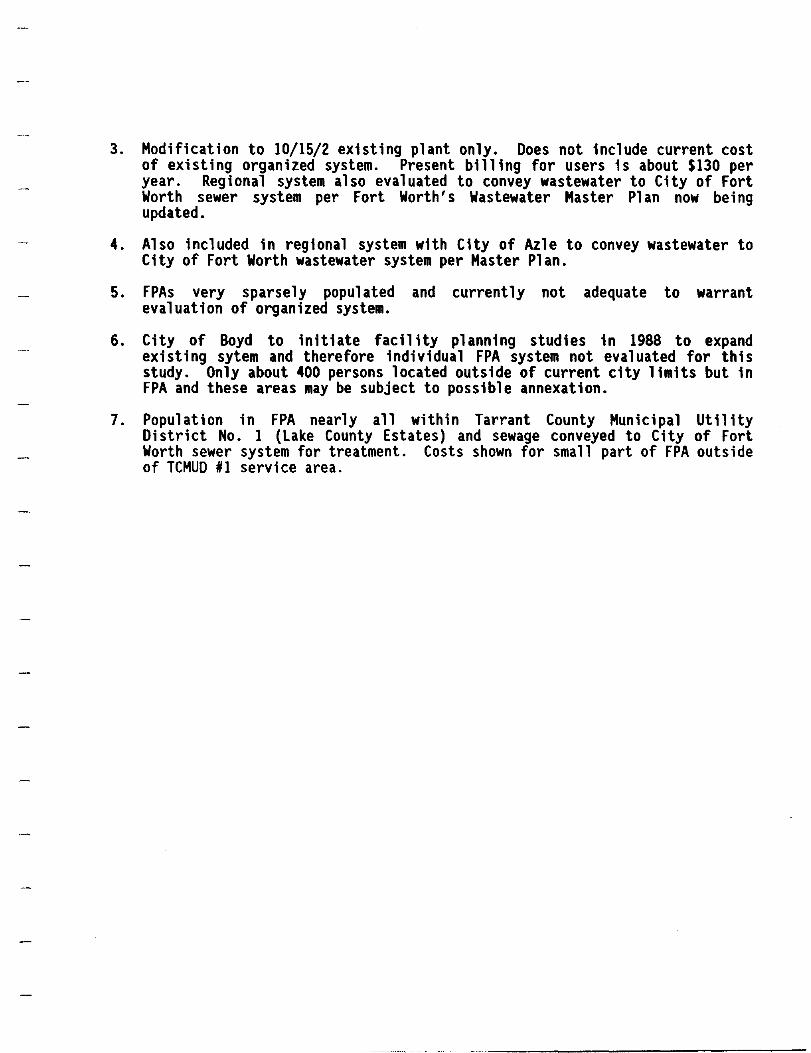
3. Modification to 10/15/2 existing plant only. Does not include current cost of existing organized system. Present billing for users is about $130 per year. Regional system also evaluated to convey wastewater to City of Fort Worth sewer system per Fort Worth's Wastewater Master Plan now being updated.
4. Also included in regional system with City of Azle to convey wastewater to City of Fort Worth wastewater system per Master Plan.
5. FPAs very sparsely populated and currently not adequate to warrant evaluation of organized system.
6. City of Boyd to initiate facil ity planning studies in 1988 to expand existing sytem and therefore individual FPA system not evaluated for this study. Only about 400 persons located outside of current city limits but in FPA and these areas may be subject to possible annexation.
7. Population in FPA nearly all within Tarrant County Municipal Utility District No. 1 (lake County Estates) and sewage conveyed to City of Fort Worth sewer system for treatment. Costs shown for small part of FPA outside of TCMUD '1 service area.

FIGURES
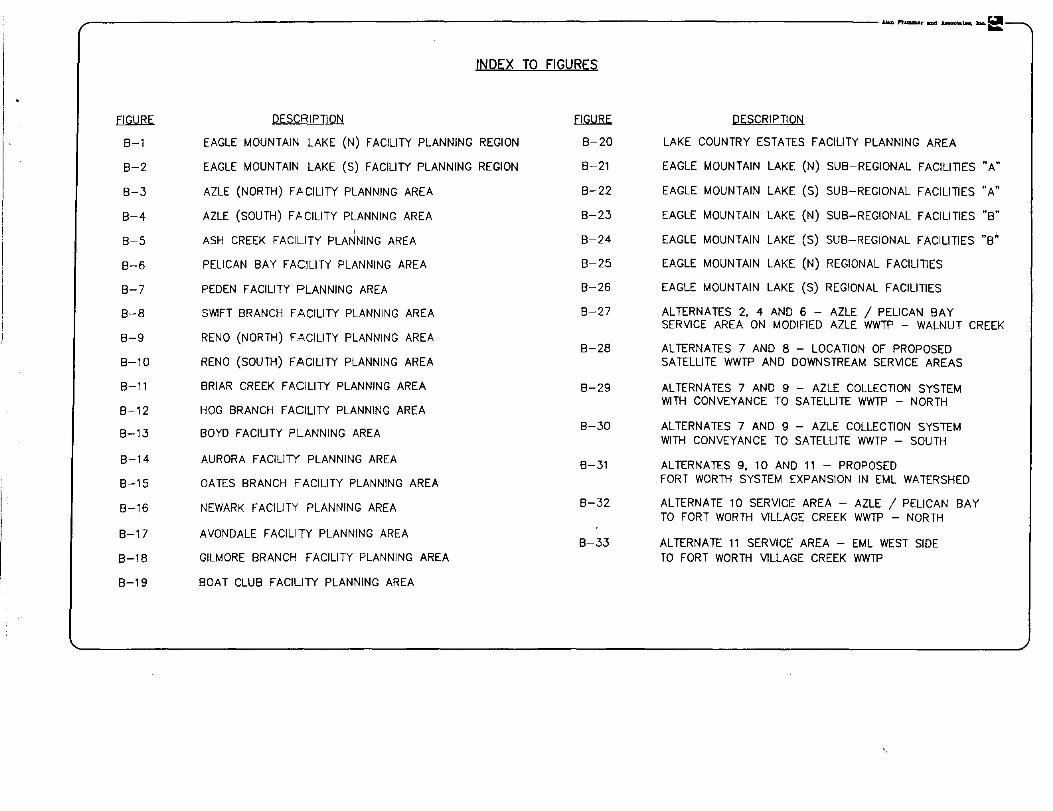
,~---------------------------------------------------------------------------------------------------------------------------------------------------------~"~r~ u...~ ~i:!
INDEX TO FIGURES
~
8-1
8-2
8-3
8-4
8-5
8-6
8-7
8-8
8-9
8-10
8-11
8-12
8-13
8-14
B-15
B-16
B-17
B-18
DESCRIPTION
EAGLE MOUNTAIN LAKE (N) FACILITY PLANNING REGION
EAGLE MOUNTAIN LAKE (S) FACILITY PLANNING REGION
AZLE (NORTH) F,A CILITY PLANNING AREA
AZLE (SOUTH) F,A CILITY PLANNING AREA I
ASH CREEK FACILITY PLANNING AREA
PELICAN BAY FACILITY PLANNING AREA
PEDEN FACILITY PLANNING AREA
SWIFT BRANCH FACILITY PLANNING AREA
RENO (NORTH) FACILITY PLANNING AREA
RENO (SOUTH) FACILITY PLANNING AREA
BRIAR CREEK FACILITY PLANNING AREA
HOG BRANCH FACILITY PLANNING AREA
BOYD FACILITY PLANNING AREA
AURORA FACILITY PLANNING AREA
OA TES BRANCH FACILITY PLANNING AREA
NEWARK FACILITY PLANNING AREA
AVONDALE FACILITY PLANNING AREA
GILMORE BRANCH FACILITY PLANNING AREA
B-19 BOAT CLUB FACILITY PLANNING AREA
.EI.G.URE.
B-20
B-21
B-22
B-23
B-24
B-25
B-26
B-27
B-28
B-29
B-30
B-31
B-32
B-33
DESCRIPTION
LAKE COUNTRY ESTATES FACILITY PLANNING AREA
EAGLE MOUNTAIN LAKE (N) SUB-REGIONAL FACILITIES "A"
EAGLE MOUNTAIN LAKE (S) SUB-REGIONAL FACILITIES "A"
EAGLE MOUNTAIN LAKE (N) SUB-REGIONAL FACILITIES "B"
EAGLE MOUNTAIN LAKE (S) SUB-REGIONAL FACILITIES "B·
EAGLE MOUNTAIN LAKE: (N) REGIONAL FACILITIES
EAGLE MOUNTAIN LAKE (S) REGIONAL FACILITIES
AL TERNA TES 2, 4 AND 6 - AZLE / PELICAN BAY SERVICE AREA ON MODIFIED AZLE WWTP - WALNUT CREEK
AL TERNA TES 7 AND 8 - LOCATION OF PROPOSED SATELLITE WWTP AND DOWNSTREAM SERVICE AREAS
AL TERNATES 7 AND 9 - AZLE COLLECTION SYSTEM WITH CONVEYANCE TO SATELLITE WWTP - NORTH
ALTERNATES 7 AND 9 - AZLE COLLECTION SYSTEM WITH CONVEYANCE TO SATELLITE WWTP - SOUTH
AL TERNA TES 9, 10 AND 11 - PROPOSED FORT WORTH SYSTEM EXPANSION IN EML WATERSHED
AL TERNATE 10 SERVICE AREA - AZLE / PELICAN BAY TO FORT WORTH VILLAGE CREEK WWTP - NORTH
AL TERNA TE 11 SERVICE AREA - EML WEST SIDE TO FORT WORTH VILLAGE CREEK WWTP

i •
Alan Plummer and Mlociatel. Inc. e I'
_,?l..-.,_~~;
~ ""-
"'"
~~.;.:-~----
~-::-,
"
....... ~ 2 ~-:-~};.~ ff
.. -;; ;. ~:>- -,' fD",CC
, , ::. .:::...=-~: 1}.~ ~ ~~ •• - .,.--;'- ~ ....
t~ "~T"') '--," ", ... -' _... : -0;;~ " , f' " .. '" ~.J L \ ... _......... ..... "'" \...(~
'--', "-;- :'>'''', ~ HOell BRANCH 'J,,-+~, , • -"';1- '"" '...... .. r" ~.,.. "~ 1;'~~ i FACH,ITYc pt._A~liiYNG AREA~. "
, / ( ~ A I. _~ t-t; r -"- "
"" .;
L / /~/ -'
- , "
90'" .. -.
;'';.,2-,
,/
AURORA
, FACILITY
AREA"
1 1 \\ 1/2 0
,~"r / /)-.
lJ; r. ';" . (+~,"~r~ ~»
~.~ ~-~..... . \~ ~ ,-" ~ -~ <V,
SCALE IN MILES
>;1. ~~l I t ~. i ., .. \ ' .. "'" ~ . ... : ............. _·~~li .. ~ •... -=-::6 .. _._. =-..... · .. · ... r·
~~. .. ' .. , " , 1 i' .', ,. • : "" ,....: " " \-:.
j' f co'· • ~, \1';c ~;~,~
·'1"'",·,A .- .",,:-' GI.JI.~D ,? , "-'" ! ." ~ I \ ~
t ~ , , , t ~.
i • ~ ,
,. . ~-~:-,~{
\1 <:0 ".
~d<~d , ~" , L.2 -;\ ...
-'-'''' -r-;.;-
':'-; .,
'7~'.
j 'I ,
I ,
J
~~'", I." ",,-
~.'''''- ...-
"
,)
j I
I ,
J
1
fiGURE B-1
EAGLE MOUNTAIN LAKE (N) FACILITY PLANNING REGION

di '1 ., ~
~J \ • ] " I
;- I 'J .!!
~ ~
~ ~ • · " il ~ • ~
I ... .. < Q
Z > ~ ~. < ..
~.
I -,.,. I' 1
f~';'I:~'':;;;---:'''' , ,
~, . ,~~;;..,. + .-------- .. ---r
;'Jill ;/
Ul W ...J :;; £' w ...J « u Ul

, ,.~~ Alan Plummer and klsociates, Inc. ~
) Pedti:n
)
1 ) ~ ~'--..\ ;
' If<
'----1, '\;>...
~ "¢I"
(""'-..
~~
~,
£ """
A.~ ~
" ./I)~I ~ ~.no ',>,
/ -~. -- 1--"- J
- ----I
\-" c, ••• / ',----,- ..
(.. . • I
/-
'-.
t 1000 0 1000 2000
H SCALE IN FEET
~- ~--.. • .... • ... ~7 ••
/., /:/ .~
A'#/ \
k-..
....... r
..A~ R".
!!I!'!. . ~~ •. :!.o!...!.~
FIGURE 8-3
AZLE (NORTH) FACILITY PLANNING AREA
"'"

• /i----r '-'1)
/-t ,J L' Sanet I
~( __ . .:~~ i \ '" ---L "---, 1'-7'
'_. \ ~'to/ f ~ \ ~/ I
/ j
/
l'i
)
~
c)
/ /
/
,/
1
J ~/\~ '\
'-" / t " , , V-. 1>'0
~"'~ 1000
/.---... /---j' p/
I I '
-,--- ~Ju--J '~:~;~'l~~
\' VI
!~/,,~=I..:; ==
, ..: .. ,01
I
All!ln Plummer and kJ3ocil!lte3, Inc, ~
FIGURE 8-4
AZLE (SOUTH) FACILITY PLANNING AREA

, Alan Plummer and A:lllocJalell, rne. ~
I
\
{
~
'-, \
//
--
/~
(~ ~----' ,,--....(
# 1
""-\--\
l_p~rf··
~ ~ /' ~~wwtp' (/ ______ :~~ _ '~-f ,053 MGD
) ( J (I
r /) / f (
) ~ (
2 /
\ I t
1000 0 1000 2000 ,..., SCALE IN FEET
~.-,,-\
,01
SYSTEM ~ 2 ) .'" r-~·-
) f~ \ -' ")
ASH CR \ EEK AREA !
) I
I j '\.
l!
'lL
I \
~
., '-.
/
"'I. SYSTEM #
) (
• Azle
/'~~-,.
FIGURE 8-5
ASH CREEK FACILITY PLANNING AREA

= • ."
• 0.
!
.. • « · . .... :~ · . • ~ W~{{H{{I · .
!{(1jliH{{·iHH,:_
'. H'''~'IHiHj{{Wijjj :0. .. ...
- ....... --- ........ -_r-" A·i~r()o·J .. _- ..... -: .LNVHH\li I- i _+--_____ _
-._. . . :.:;'Z"f'-·-~r-":... . . A.LNO();) J.... I /
" //
/' /''' '
" .. on
.---'--; "
/ .,
/ ,
'"
.. • • ,
<J
,
/
I i,
\
""'--'.-'",,"
----'-1---
\ "
H3>1l1Vd
J /
o o o

" c •
J ~
I
=
1...--
I I
:- I ~
;
I
\ \ ,
\ \
------I I · I I · I · I I
''----r/--'' L J
- ( I

~
SH 2157 L J ,..,.-) r
( Ie '-----r' _\- 1::, ! I -------_1:1:1
/
_ .. --_ .. ___ • ___ 1
'J [
1 \
"'\
/ I )
I I
?
Reno /
\ \ "-" IT ~ ..
II I I 'I ' • I I I
\', il i i '"-""""< I I •
(, III
~ 11 1 ! \ II I ..... ~'--j
-,
-/- IJ
,,///
............... -----.-- D
Peden \ \ ',-
E~~;~-~:~'-;~~i~ ·t •• e
... . ..
-~
Alan Plummer and Anociatea, Inc. ~
" " l:
"' '~--~
~i=. '\
C~r-f\-)il i i ~Iiil-li--A..-~IUI I
91-1 11542
1 \
"\ \~ -.c.
Am A
1000
~
i ..... ·~· 2:1 ~ ."'1. i:! I I
~! ! i ~,-
t o 1000 2000 ______ ..
SCALE IN FEET
\
\ ~--'~:r~ . .... . FIGURE B~B
SWIFT BRANCH FACILITY PLANNING AREA
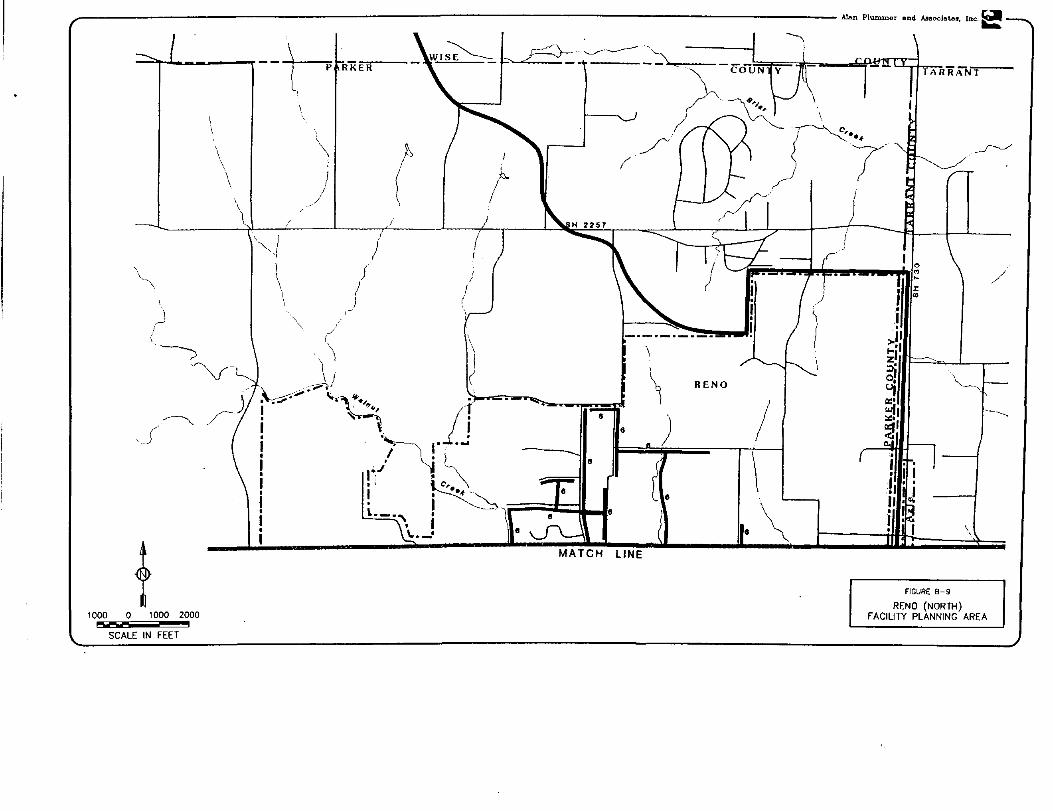
\
'"\,
j'
\ \
~'" .
V
~
,j
t 1000 0 1000 2000 ,...,
SCALE IN FEET
\
KER .~~~ .... ,....--
\ /
/ /
(
\ I -".-,
( ./ I \
/ I )
I
j
h / ( ,
/ ;
/
) , : -J ,1/ ~ . . _ . ......",. . _ r.:-....;;,=-oo f"~"~"'''i.·\~ j'l I ',,-_ 1" ...... ' I l' \ I . _,I (" • ',/ J \
I ~'b .. ' III i 1', il ~ .~~\( .; I L._ .• " i \ I \.._, , I
\
RENO
""'\
/ \ .\
Alftn Plummer Ilnd AaaocillUla, Inc. ~
T A II ii AN,1"T'---
~
FIGURE 8-9
RENO (NORTH) FACILITY PLANNING AREA
/
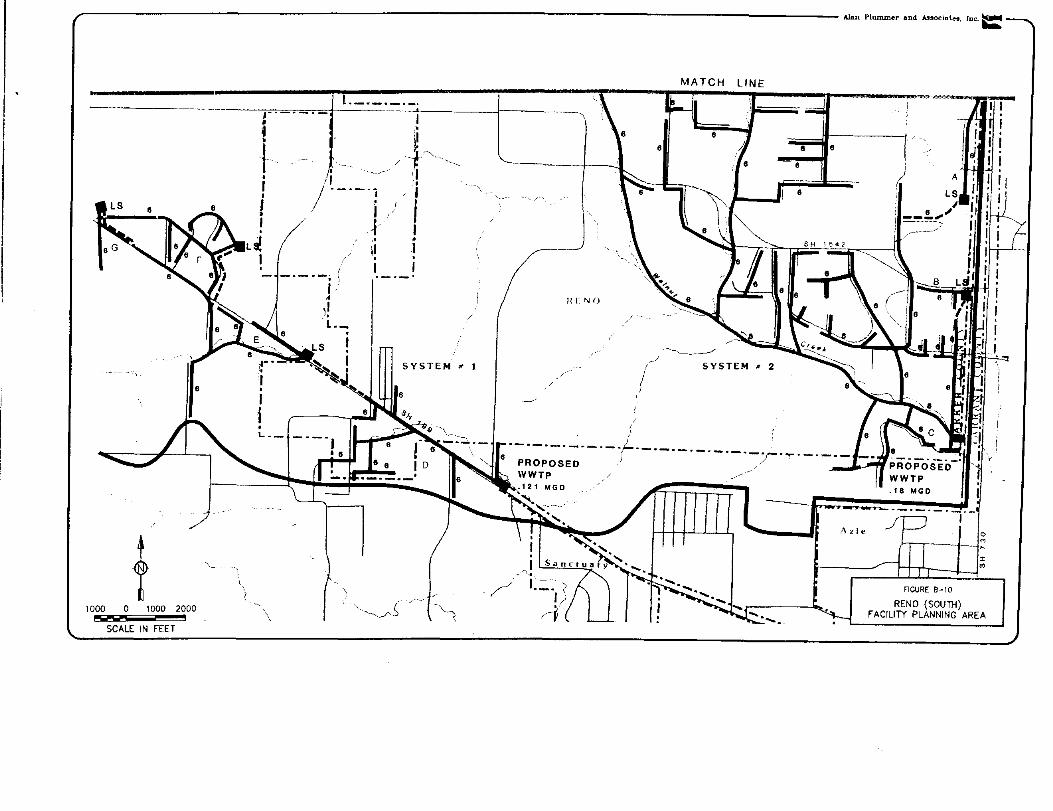
~~-------------------------------------------------------------------------------------------------------------------------------------------------- ~ Plununer and A!SOC1~te8. IDC.~
h .................... ...
t 1000 0 1000 2000
jftIj
SCALE IN FEET
'1
" (
\
L ________ .
I . 'I ~ ,// t'"
-----j
I L __
i l ~! I
• I
--"-'
",
./
SYSTEM It 1
"'~,.J'~
---, /'~.
,,/
_J' HI. N ()
I !
MATCH LINE
/--/ SYSTEM" 2
i I
-r9I.
•
r' zl p
f )
FIGURE 8-10
RENO (SOUTH) FACILITY PLANNING AREA
III
I il i
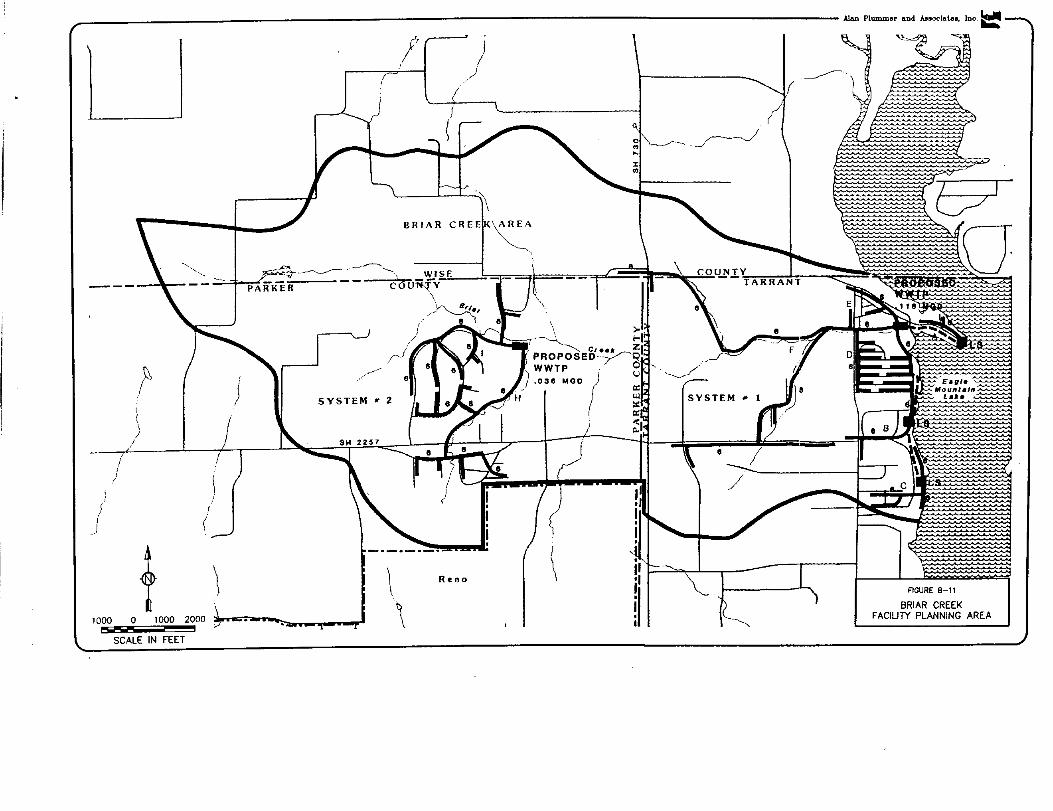
,,~ ______________________________________________________________________________________ ------------------------------------------------------------ ~ Plununer and AssocIA~ •. Inc,~
-"""'-'-
--- "
r ( \
I _/-, I I
)
)
j
t 1000 0 1000 2000 ...,
SCALE IN FEET
?j!r /
~\
BRIAR CREEIK'~EA
'----,
-"'" ~-- ,-~'-..." \ _-I ~;r __ ' . _WSE =tt=== PARKER COUN-T Y
\
'. ;~!y'.,
, - '1 >H' \. Z
~=r ~'''''' c".'/_ql, . -, PROPOSED, /' 0
WWTP / u ) •• 38 MOO
H' I I
/
....... I: ______ .=2_2<
\ \
Reno
,~ "J
f3? o
FIGURE B-11
BRIAR CREEK F ACIUTY PLANNING AREA

• o " , «
-. \

( / ) V / '. \, -"-'~-.~.'i:!! J / ~ ) rs ~~ ~~o ' ( \ ~
)0 (,/ "/' J I
". {! ~... , ". . '" - . ,. (
". . '\. ( .'/"/ .... L~ "\ I , .~ \ -- -( ·.....r'- A' '{ "-.--, ,-" ( '!
••••• ~\ ~J.--.; \J ~! .... '. r .... · ._._._._.-._._. fl ,. ,
• • ._._._._._. ' I -
J -', ! ( i lV' ~J
\ ....... v " ....... /. '--- f~ --, ~ ~'- , " ,
cr'" y.... ~ j) r:::- ---\ "'-.1 r~ \. ',~. --/l
~ , ·········· ................. i i "-,-~'
FOlk
./'~, , .
le ' / -,1-~/'II; C
/
,/
I
~ /
t
;- -.
j ) I
.f .".,.,. .. _'
.-.J
\ ..... ~ . , ( ----" o . . .../\J " ~ I
N " EXISTING
WWTP
( ~ \) ~
I
/ ~J I fT11-'~fi I r······ ..... . -•• ('I .. ~ ....
'.0 ', .
'j> ' ..
'.'1>
, f ~.~ - "'~~4: ' • '" '., I
- -'-._._.-.- .. -. . "~~.~ ! Q r------l. t. -.-.-.-.-::.;~' . \ ~ '\
/
\1 . ·.t.~~~~.'I»'l' '-.--. I ~~~ '- tj . '-- '.~. 'l -'~ ..
L I. \' ..•.•. -.!~'
I
\
'''(/ CJ'· )
., .. ~ "fl'
FIGURE 8-13
BOYD
'~
~ (
I
1000 a 1000 2000 ~
/ ·•·•• .•. 11( I.~ FACILITY PLANNING AREA
SCALE IN FEET

, , Boyd I .... ,
'. ". " .... .
...... , 0·. , 1,'.. ,
CI .. ;.... •
0·.... , .-.-.. -.~. ~.
/l " ~ ~_'\ .... :;.,; ... . \J~' '-... (>.,.~.-_
,,} .
\
) I )
] ~
')
t 1000 0 1000 2000
P"1 SCALE IN FEET
. '. ",; .. .•..•..
'.
I f
('
...
;-~ ~'jvv~
(
A1An PlUIDlner and MIOClate., Inc. i!
~ ",Iff ~\ ldl ~ ~--;
f ('
-~
---------

I \

.---
1000 0 1000 2000 I"'Ij
SCALE IN FEET
, ( r~
)
~
/
{
'-'-'-'-f I . . . 1 . .1 I __ .:.C~0.Y!:iT Y _ ...
COUNTY I •
~~ ~!
\ I · I · I · FIGURE 8-16
NEWARK FACILITY PLANNING AREA
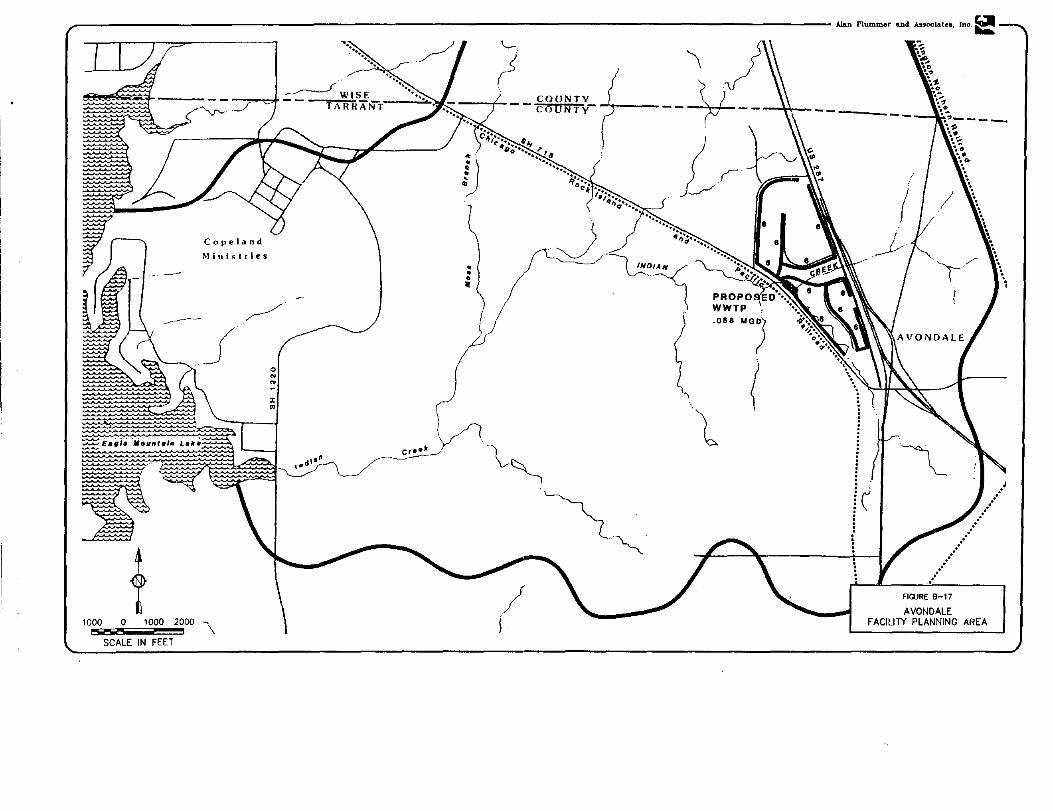
Copeland
Ministries
---- / j
o " "
l1i;i~~~,-/-"".0~, ~
~ .. ", ~
/ 1000 !!Iii 0 1000 2000 "\
SCALE IN FEET
l
MG)
(
/ .......
...•.... /
•.•.. / FIGURE 8-17
AVONDALE FACIUTY PLANNING AREA

t 1000 0 1000 2000
t'I SCALE IN FEET
---- Alan Plummer and Associate., Inc. ~
~ ~
"-z.~
( y ./~.",--;,.I GILMORE BRANCH AR~~··~
1 ~ ./
_J
/ Q \
) (
') .
~. ) ? / "Y
FIGURE 9-18
GILMORE BRANCH FACILITY PLANNING AREA

t 1000 2000 ~ • CCCT
Alan Plummer and AsIlOcl.!l.UllI, Inc. ~
.::> ................................................................ . ---=c~ ... ~ ....... f'. k4;y. r... .---"\ ' ............ \ r \
............ q
\" 1
.,~
...... \ ..... ~
... ,
9 \ )
j
J \ \
" I .. •
f °r"::'-~
I
.!'-, i~
(
\ }; ) ! \f
r--\ .. , ) I
( () i PROPOSED ) (
• ~ lW." \ r-.~~.~ .;-- '11:r Ii=... (" •• " . \ .
. '" "" ) I b
-'\..
FIGURE 6-19
BOAT CLUB FACILITY PLANNING

~ ... '" ....... ~ .. .... "\\ ....
..... .. ' .....
t 1000 0 1000 2000
SCALE IN FEET
/
'\
\ \
.---v-- \ j
z "-(\
.) l(
I
\~
~.
8ale
"
\
Alan Plummer and Aslloclat.ell, Inc. ~
--, , \-
o
" o
~~
6
d
II '-~~ \~ ~j 11
VLL--'T I I I I I \ .. ~
\ \
• o •
lake Cr •• ' i\ Estates '}
( \ FIGURE 8-20
LAKE COUNTRY ESTA ITS FACILITY PLANNING AREA

. j
I
i
/
,'.'
, \ ' ) ,
/ (I
'(
J, ! -,.
'/ ~""~, .......... J , L , ,
"'j;- ~ ~ ~ ,II
"'f '" ,~
" ~ ~, 1. • ,~' ,II /
--
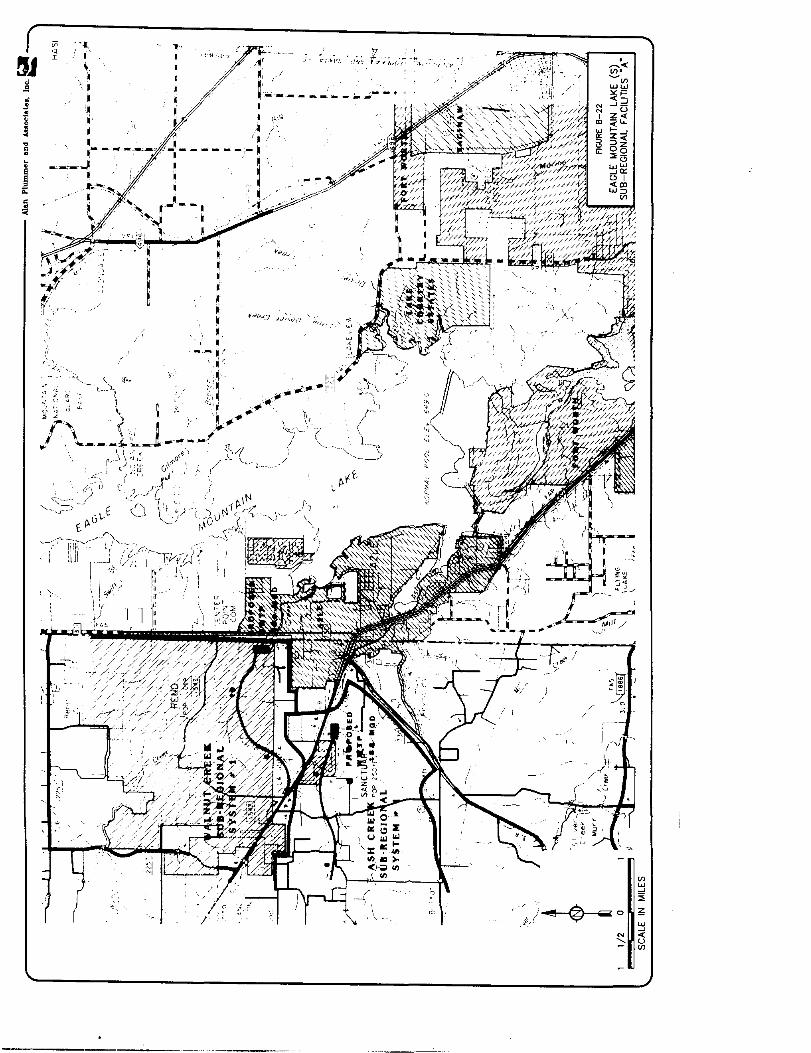
J
. 'J
•• \. I
" . I
.;
",.
I I
..:
.' ~--- . .' • - _____ ... .iI-.;...
I
.~
• - --;-.
l."
, "o>a ..
I j
! i !
1(..Jf.u:'J .Jd'\t.'(!
'~//,;
•

/
.(' \ ,
---\.<) ...
\ !i
.......... ~ "',~ ..... ,..,i .. ,~c1I
J !I '-U" T
I \ )
_______ --,.-.1, , -' ! "; , .-, -, / / /' 1-'
\ \
) ,/
, ,,/
If
,~ -" \
V1 W -'
'~o ~
~ w -'
'" « ~ u
V1

~ ... ___________________________________________________ --------------------- Alan Plummet and Aasocillle., Icc. ~
.'.~
t 1/2 0
SCALE IN MILES
\
r', ~,
'::,
\ . . ~ • t= ...... ~ Ij 1\.' ,~ • , -"-'~-~'~'
t\ ~
_\. • ....J' .• ;: - ~ -t;-::
.t..<.
1 I
'~ '.', .:~ I I :-"j.r:·' , """",J " ~~ ~ .\\. j' . I :;1
, '~>' \:1' ,I, ... ""." ' I
:" " ~,~ " ; - -,'", _ ... ----. -- -.. --I ' , " ,''''' ' I I . '-':~;I
f" ....... ~ .. '. '., " Ii" _ J '~':::: .. ,',.' ,,; ~'" • ____ .... ____ 1,/ '~_ I
1:----- _: .. ~
I I I I
',,----
~{'),
-~ - ~'-~, I l '~" -- ~'''~- - --- .. - .. I I'
BOAT CLUB FACILITY
I
IS' ~ ", -<;.,.
\'~ \. , \ '\.
-"'''- f~l;~'t '~~~: " I I
--.)" ~ ;,~:,,·l;\, 'F';< ':'"~'.~-~~' j', / /> 'r~"
, ~ ,,~ ~ ~, : :' !~tU:aNAW '", " ~ ~ ! ;-~ " ,,!--; '~
~'-
'~ -.'!>"l
.... "., ...• --- '-1 ",'J~.oJ ,7 / . ,,'
~S:,_._, : '.:-~~;-, : ~ I ' !' . ",,{ • ,
r~l :t(' h·, .... ;\-' '!Ir~~- .~ \..~
Ft~\{: '< 'v, x
/f:: _,_~ ... ~~",~ ",_' fiGURE 8-24
~ ~ :,~':\~":~,',,~ EAGLE MOUNTAIN LAKE (5) F-!; ~, .,:" SUB-REGIONAL FACILITIES "S"
,,-..!--- .... - -
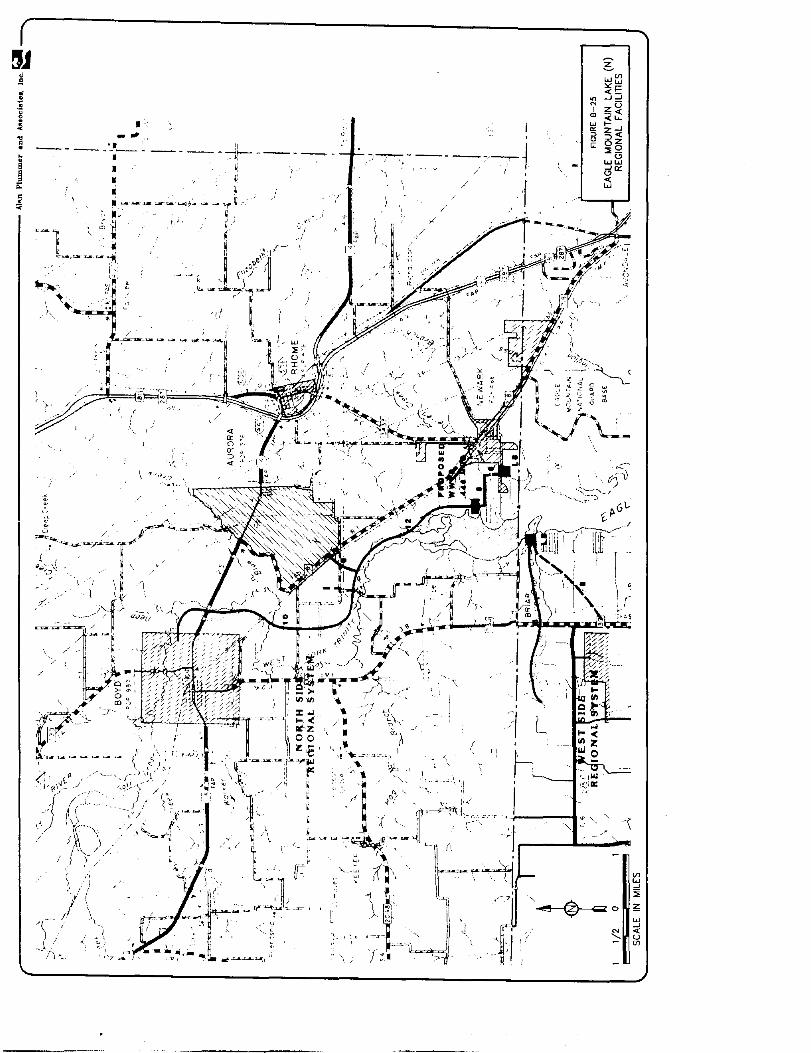
1l . ..f_1 .--•
/
•• T :1"'
/
• '. " " ~'-~
.'\-_. ~ • • 0/" -.
~:::.~
_ ";;,)
~ ... -... ',>3:--~")",,-j )
-----
~ « u If)

J
, --rc-(j 'l I "I •
~
I
1 ____ . .;;. I ----:
, "
"
I ~--l
[":Fr.-.0 ,f' .1'
//" : ,.// t- __ _
• • ~
, .
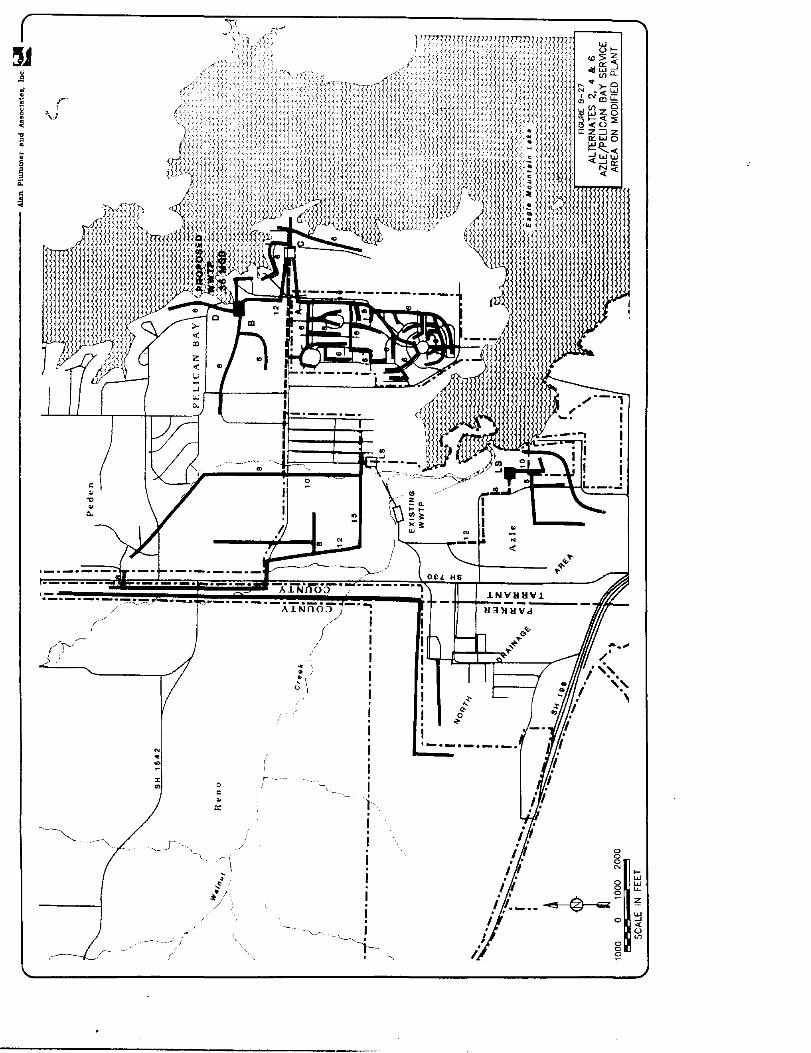
" .E
i . ] ,J
,
---~~~, /
-' (
-------- -----
---.. ------
" ~ ~ :J: ., c
0 , a:
,- .-. \ ..
~ .. /' /
(
~ . ~,
"
'",,--,", ----,
I , I
I I
, I I 1 I
I , I
I
I -' 1-, "
a a a N
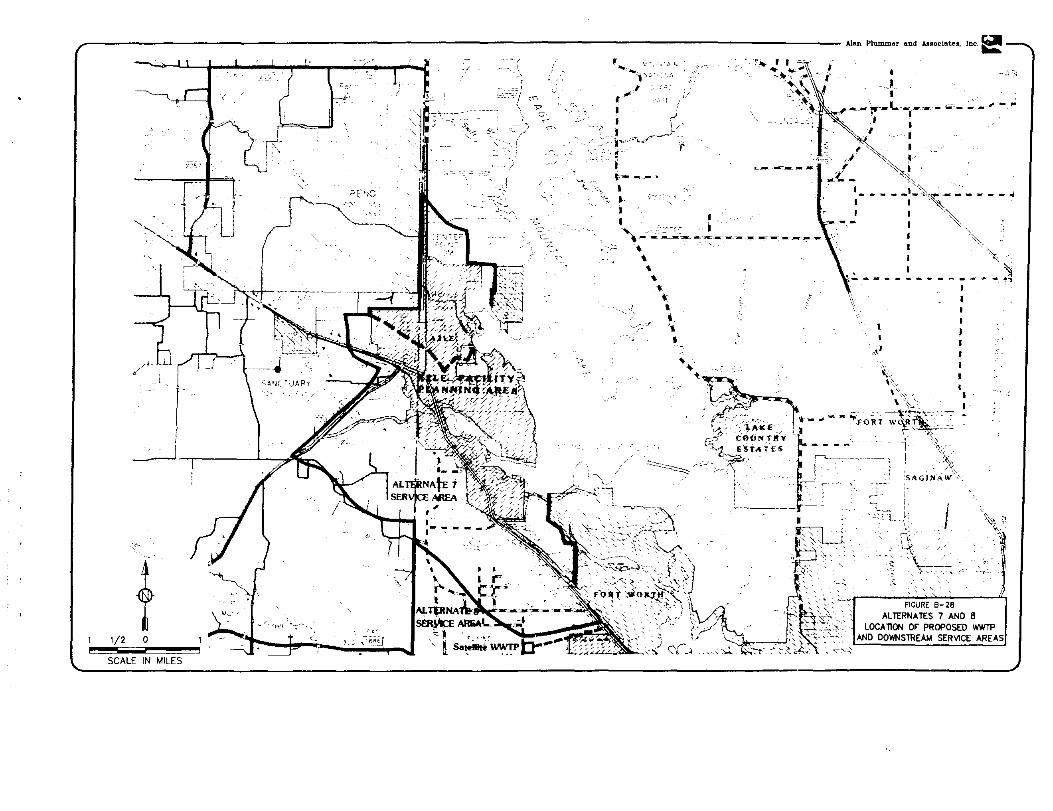
( Alan Plummer end Msoclates, Inc, ~
~,,,~
t L t ~/: 'H'<
1/2 0
SCALE IN MILES
,/
V c;.
~~:-;. \-r,
~"'....,
'- ~
.!:-''<'' -'..,
I~ AIIIOAI...,;.!
>, '
'"... . "-' '
" "-
r ""-,. ~,' ,'f:. ,_
... ~f".:.· ; '''. , ~ ,)_/
I ' ,./
I i / ~ .. ".::o-~~df!,,·~J ,",
. ~ t
l:"- --"
• l·
_. . I ':", I ' ... ~,,: . ,
' "!:.~". '''L' ' ... ' -J ..", .. _,. '., \ ! I __"' __ _ ,'.,'\ ''-- -- , , ", ~', -''1"-- I , ',J, .. I I
i I
'·,:,31
,
'"'"~ . ..;' /.1 ~~ .' -/ ~, ... -- ~,
I ,,~::.... ' .
I ,
\'''';';';;~~:';';'' -~----~-- ~".-
--,- ~--.. - -- .. , <~ I "\
,. . )~
'" • ,.~
;. ,. ;. ~ ,
I, " ,
.. -~ I
'z·:
_~\J ~ .,
~~1:'b" \\ I \ .... ;~,' '~, I ".. .. ~' '- \ '\"::..' I
, /I~ < • - .. - - "FO~-t;¥~~~ rCAP' C0(iN1"JItV - f '.:;', \A' ',1- Jlt<E, 'f . . ,.-.-':'1..:2,. EStATU - - - - j' ,\,
", , -?" j' i"-- ----, , '3<: --::::'~, 'r' ~ ,- . '!iAGINAW'>" ..
: j::: I,
---'----- - "'::;-1 i I '~ ~
:(A~'"
kl··j "'.--};.' \ .. '1'.' tS~'\-{' - ''''\7 ..
l~ji;' '~.,-:-:::-; "
~ , , ?
; '~'; . ~ ~--1 ~G~RE ~-28 ,J.;:- ~~____ ,
t" "'- ....... " ~ ..., "-
I~ , ~ __ , ___ ', AND DOWNSTREAM SERVlCE AREAS ~ ''', -' <'--.,. ...... ~" ";., ,<-,~ .. ~ , ........ ~" .

I . I
\
\ o g N
I . I
g o

0
gt!!
.E
5
5:J~
· o>(I)~t!!
]
~ (I)
~
~~~&; g""~0i"
'" " · If'.>-I-
J
CD(I)V)lLI~ il't!!z~~ a",,~~>-[;:~~~@5
•
~..JZ~
~
.,J...JOI-<8 uz
wi":5 ;:;:j~a...
"" I
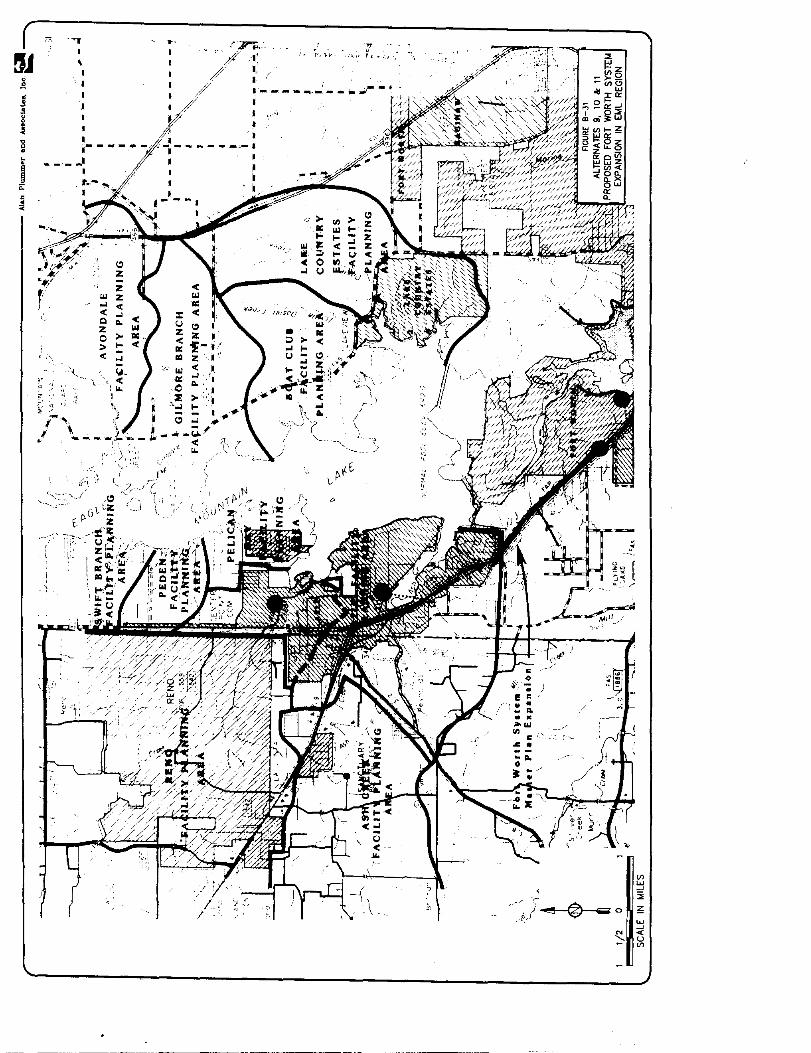
" ., I \ I I
>c'
1- _ .. __ I ___ oJ I
OJ ... < ... Q '" Z 0 >-> f--<: ...
~> ,'.' OJ '> J>: ;;.
\ , <: ,,0 ) ... ,. ., ., J :E
( « ~ ... > .'
i . ),
, " 1,1
'J ·,/C ,~ /
, (', l ", ,_ . .1 i,
>-f-
...
'~.
'.' , .: I ' __ .. 1- ___ -..-.' ___ "'"
""
/ \
" ~.
)
) ~ ~'.~ ./
Vl (oJ
--' ~
~ (oJ
--' ..: u Vl

JJ o .s
~ o . J "-
• ~
__ . I -'-" i ~.

" .E
171
,I
I I
i I r 1
'I
--.'-
, , I I I
I
I ,-,.) //
J r..... //
'j(
... I I
I
• i~---""":' .~::" . , .
__ .lIIOa -=;_. I
•
'( lj
""';', r-v ~
FACILITY PLANNING DATA SUMMARY

ASH CREEK FPA FACILITY PLANNING DATA SlIIIARY
1. PLANNING AREA BOUNDARY:
System No. 1 Subdivisions: loma Vista. Allison Cattle Company. Oak Country. Horseshoe Acres. Fox-Hollow
2. NUMBER OF SERVICE AREAS: 1
3. SIZE AND POPULATION SUMMARY:
4.
Service Area
A B C D E F G H
TOTAL
Service Area size (acres)
In City Rural
DISCHARGE SUMMARY:
Permit Flow BOD conditions 1MruU ~b/day)
10/15 .052 4 10/15/2 .052 4
population In City Rural ~ Wi ~ ~
310 520
310 520
TSS AIIIIIonia (]b/day) (lb/day)
7 7 7 1
Note: All figures given above reflect average daily values assuming full development of planning area.
1
1
1
1
1
1
1
1
1
1
1
1
1
1
1
1
1
1
1
1
1
1
1
1
1
1

5.
ASH CREEK FPA FACILITY PLANNING DATA SUMMARY
(continued)
ESTIMATED CAPITAL IMPROVEMENT NEEDS: COLLECTION SYSTEM
A. Gravity Collection System:
Pipe size Length Unit cost Extended ( i nchesl (Lf) (S/LE) cost
6 22,500 20 $ 450,000 8 25 10 30 12 34 15 42 18 49 21 56 24 63
Total 22,500 N/A $ 450,000
B. lift Stations: None
2005 Capacity lift population required
Station served (MGO) Cost
1 2 3 4 5
C. Force Mains: None
Pipe size Length Unit cost Extended (inches) (Lf) ($Ilf) cost
3 7.00 4 10.00 6 13.50 8 19.00 Total
2
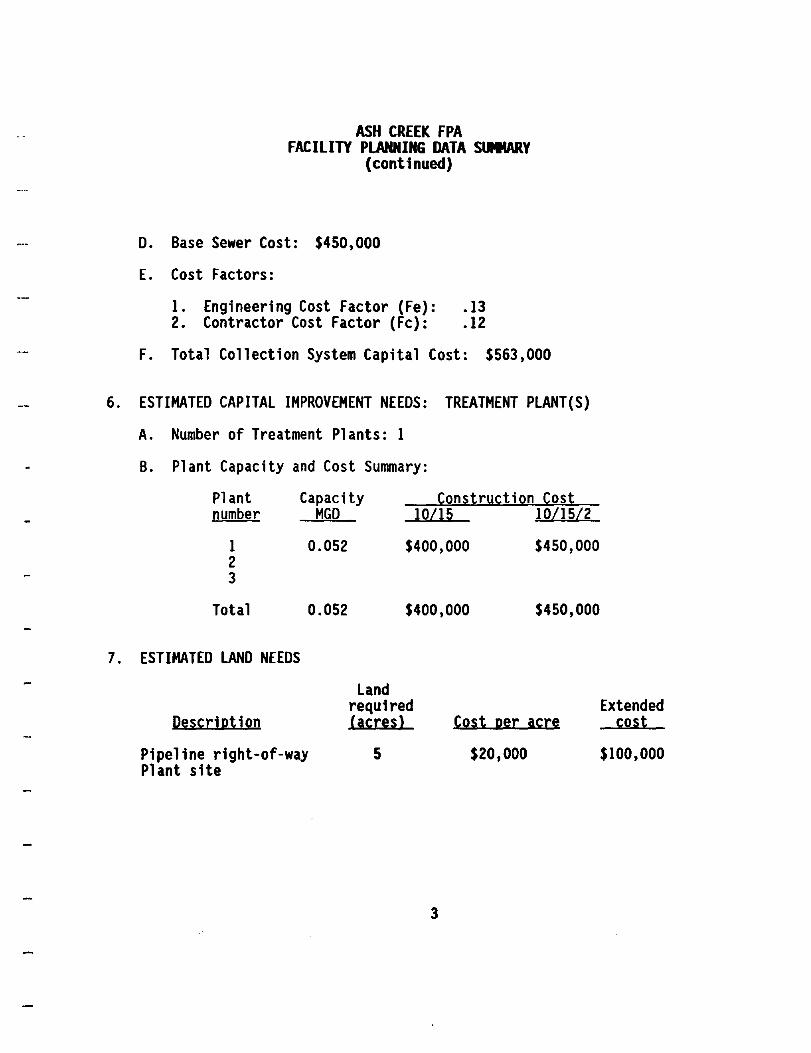
ASH CREEK FPA FACILITY PLANNING DATA SlIItARY
(continued)
D. Base Sewer Cost: $450,000
E. Cost Factors:
1. Engineering Cost Factor (Fe): .13 2. Contractor Cost Factor (Fc): .12
F. Total Collection System Capital Cost: $563,000
6. ESTIMATED CAPITAL IMPROVEMENT NEEDS: TREATMENT PLANT(S)
7.
A. Number of Treatment Plants: 1
B. Plant Capacity and Cost Summary:
Plant Capacity Construction Cost number MGD
1 0.052 2 3
Total 0.052
ESTIMATED LAND NEEDS
Description
Pipeline right-of-way Plant site
lOllS 10115/2
$400,000 $450,000
$400,000 $450,000
Land required (acres) Cost per acre
5 $20,000
3
Extended cost
$100,000

ASH CREEK FPA FACILITY PLANNING DATA SlJIIIARY
(continued)
13. ANNUAL COST PER HOUSEHOLD
Treatment leveJ
Household 10/15
10/15/2
Population ill2 ~
136 785 845
204.7 520 560
14. SOIL SUITABILITY FOR SEPTIC TANK SYSTEMS (for developed area)
Slight Limitations:
Moderation Limitations:
Severe Limitations: (slow percolation rates)
Severe Limitations: (rock or flooding)
15. LOT SIZE RESTRICTION SUMMARY
16. SEPTIC TANK REGULATIONS
17. COMMENTS
5
J percent
J percent
50 percent
~ percent

ASH CREEK FPA FACILITY PLANNING DATA SUMMARY
I. PLANNING AREA BOUNDARY:
System No.2 Subdivisions: Sabathany Acres (2), Whispering Oaks
2. NUMBER OF SERVICE AREAS: I
3. SIZE AND POPULATION SUMMARY:
4.
Service Area
A B C o E F G H
TOTAL
Service Area size <acres)
In City Ryral
DISCHARGE SUMMARY:
Permit Flow BOD conditions (MGDl (lb/dav)
10/15 0.028 2 10/15/2 0.028 2
Population In City Rural ~ Z1m ~ 2005
165 280
165 280
TSS Anlnonia (]b/day) (lb/day)
4 4 4 0.5
Note: All figures given above reflect average daily values assuming full development of planning area.

5.
ASH CREEK FPA FACILITY PLANNING DATA SUlllARY
(continued)
ESTIMATED CAPITAL IMPROVEMENT NEEDS: COLLECTION SYSTEM
A.
B.
C.
Gravity Collection System:
Pipe size Length Unit cost Cinches) eLf) CS/LE)
6 15,000 20 8 25 10 30 12 34 15 42 18 49 21 56 24 63
Total 15,000 N/A
li ft Stat ions: None
2005 Capacity Lift population required
Station served
1 2 3 4 5
Force Mains:
Pipe size Cinches)
3 4 6 8 Total
None
Length -1lli
(MGD)
Unit cost lS/LFl
7.00 10.00 13.50 19.00
2
$
$
Extended cost
300,000
300,000
Cost
Extended cost

ASH CREEK FPA FACILITY PlANNING DATA SUMMARY
(continued)
D. Base Sewer Cost: $300,000
E. Cost Factors:
1. Engineering Cost Factor (Fe): .15 2. Contractor Cost Factor (Fc): .13
F. Total Collection System Capital Cost: $384,000
6. ESTIMATED CAPITAL IMPROVEMENT NEEDS: TREATMENT PLANT(S)
A. Number of Treatment Plants: 1
7.
B. Plant Capacity and Cost Summary:
Plant Capacity Construction Cost number MGD
1 0.028 2 3
Total 0.028
ESTIMATED LAND NEEDS
Description
Pipeline right-of-way Plant site
10115 1011512
$260,000 $280,000
$260,000 $280,000
Land required (acres) Cost per acre
5 $20,000
3
Extended cost
$100,000

ASH CREEK FPA FACILITY PLANNING DATA stIIWlY
(continued)
8. TOTAL SYSTEM CAPITAL COST
Treatment level
10/10 10/15/2
Total cost
$ 744,000 $ 764,000
9. ANNUALIZED CAPITAL COSTS
Treatment 1 evel
10/15 10/15/2
Annual debt service cost
$ 57,000 $ 59,000
Annual capital costs based on ~ percent interest over a ZQ-year term.
10. ANNUAL COLLECTION SYSTEM O&M COST: $9,000 (total linear feet gravity sewers + force mains) X $.59/linear foot
11. ANNUAL O&M COSTS FOR TREATMENT FACILITY:
Treatment level
10/15 10/15/2
12. TOTAL ANNUAL COST:
Treatment level
10/15 10/15/2
Annual costs
$12,000 $16,000
Annual costs
$ 78,000 $ 84,000
4

ASH CREEK FPA FACILITY PLANNING DATA SlIIIARY
(continued)
13. ANNUAL COST PER HOUSEHOLD
Treatment level
Households 10/15
10/15/2
Population ~ ~
72.5 1075 1160
110.2 710 760
14. SOIL SUITABILITY FOR SEPTIC TANK SYSTEMS (for developed area) .
Slight Limitations:
Moderation Limitations:
Severe Limitations: (slow percolation rates)
Severe Limitations: (rock or flooding)
15. LOT SIZE RESTRICTION SUMMARY
16. SEPTIC TANK REGULATIONS
17. COMMENTS
5
.Jl percent
~ percent
iQ. percent
.Jl percent

ASH CREEK FPA FACILITY PLANNING DATA StIItARY
1. PLANNING AREA BOUNDARY:
System No. 3 (Sanctuary), Subdivisions: Ash Creek Estates, Live Oak Park, Shadow Lane Estates, Tanglewood Estates
2. NUMBER OF SERVICE AREAS: 1
3. SIZE AND POPULATION SUMMARY:
4.
Service Area
A B C o E F G H
TOTAL
Service Area size (acres)
In City RYlli
DISCHARGE SUMMARY:
Permit Flow BOD conditions 1.MG.IU ObJday)
10/15 .108 9 10/15/2 .108 9
Population In City Rural
1W ~ liSl. 2005
647 1075
647 1075
TSS AnIIIonia (lbJday) ClbJday)
14 14 14 2
Note: All figures given above reflect average daily values assuming full development of planning area.
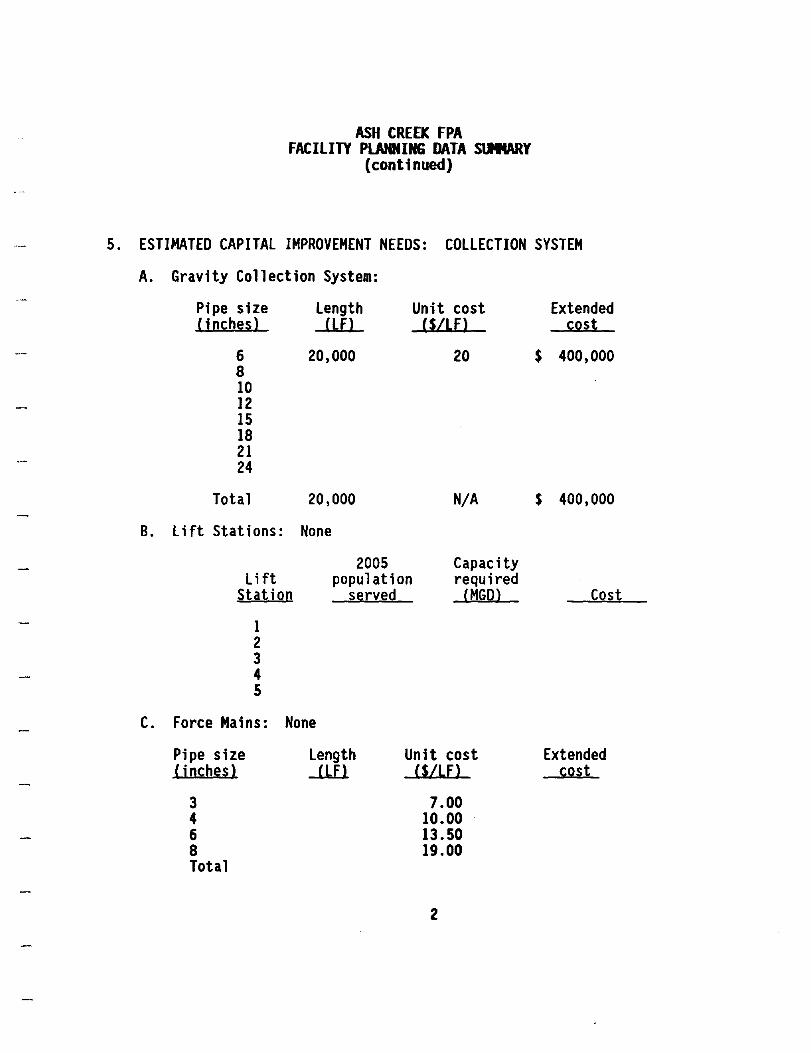
5.
ASH CREEK FPA FACILITY PLANNING DATA S\IItARy
(continued)
ESTIMATED CAPITAL IMPROVEMENT NEEDS: COLLECTION SYSTEM
A. Gravity Collection System:
Pipe size Length Unit cost Extended ( i nchesl (Lf) CS/LF) cost
6 20,000 20 $ 400,000 8 10 12 15 18 21 24
Total 20,000 N/A $ 400,000
B. li ft Stat ions: None
2005 Capacity Lift population required
Station served (MGD) Cost
1 2 3 4 5
C. Force Mains: None
Pipe size Length Unit cost Extended (inches) -1lli (S/LF) cost
3 7.00 4 10.00 6 13.50 8 19.00 Total
2
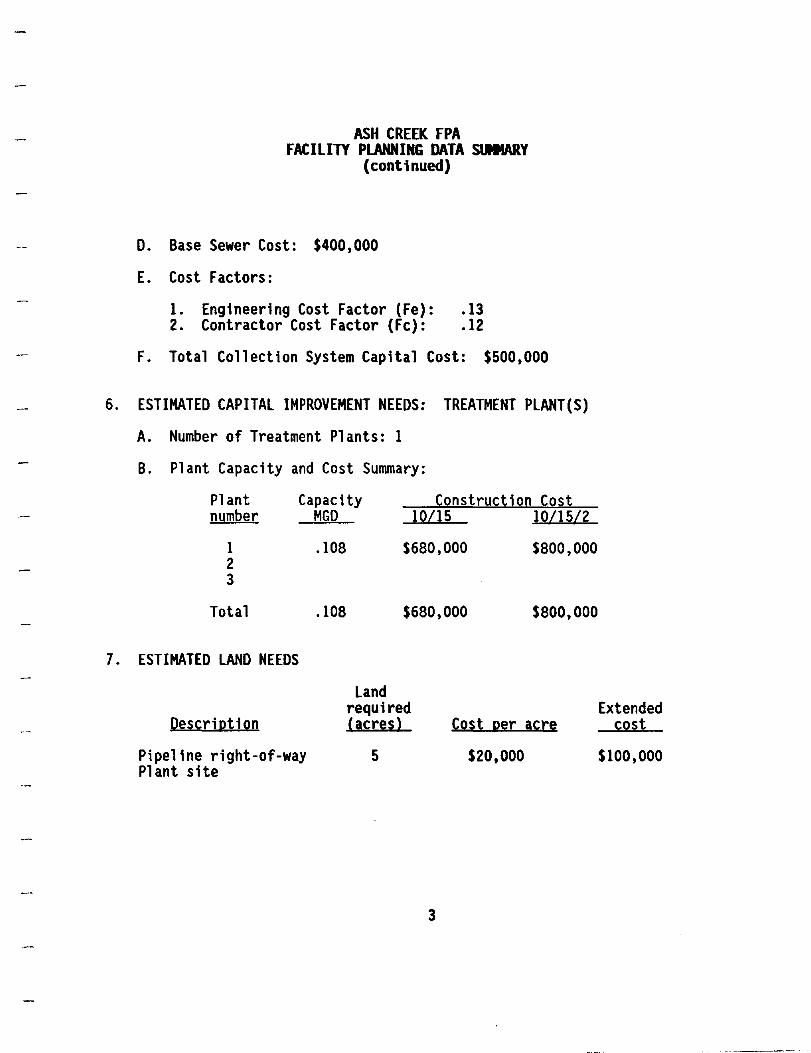
ASH CREEK FPA FACILITY PLANNING DATA SUMMARY
(continued)
D. Base Sewer Cost: $400,000
E. Cost Factors:
1. Engineering Cost Factor (Fe): .13 2. Contractor Cost Factor (Fc): .12
F. Total Collection System Capital Cost: $500,000
6. ESTIMATED CAPITAL IMPROVEMENT NEEDS: TREATMENT PLANT(S)
7.
A. Number of Treatment Plants: 1
B. Plant Capacity and Cost Summary:
Plant Capacity Construction Cost number
1 2 3
Total
ESTIMATED LAND NEEDS
Description
Pipeline right-of-way Pl ant site
MGD
.108
.108
10115 1011512
$680,000 $800,000
$680,000 $800,000
Land required (acres) Cost per acre
5 $20,000
3
Extended cost
$100,000

ASH CREEK FPA FACILITY PlANNING DATA SUMMARY
(continued)
8. TOTAL SYSTEM CAPITAL COST
Treatment level
10/10 10/15/2
Total cost
$1,280,000 $1,400,000
9. ANNUALIZED CAPITAL COSTS
Treatment level
10/15 10/15/2
Annual debt service cost
$ 98,000 $ 108,000
Annual capital costs based on ~ percent interest over a 20-year term.
10. ANNUAL COLLECTION SYSTEM O&M COST: $12,000 (total linear feet gravity sewers + force mains) X $.59/linear foot
11. ANNUAL O&M COSTS FOR TREATMENT FACILITY:
Treatment level Annual costs
10/15 $13,000 10/15/2 $17,000
12. TOTAL ANNUAL COST:
Treatment level Annual costs
10/15 $123,000 10/15/2 $137,000
4

ASH CREEK FPA FACILITY PlANNING DATA SlIIWtY
(continued)
13. ANNUAL COST PER HOUSEHOLD
Treatment level
Households 10/15
10/15/2
Population ill.Q ZQQ.5.
282.8 435 485
423.2 290 325
14. SOIL SUITABILITY FOR SEPTIC TANK SYSTEMS (for developed area)
Slight Limitations:
Moderation Limitations:
Severe Limitations: (slow percolation rates)
Severe Limitations: (rock or flooding)
IS. LOT SIZE RESTRICTION SUMMARY
16. SEPTIC TANK REGULATIONS
17. COMMENTS
5
--..2 percent
.......Q percent
100 percent
.......Q percent

PELICAN BAY FPA FACILITY PLANNING DATA SUMARY
1. PLANNING AREA BOUNDARY:
Swift Branch Basin, Subbasin I - Pelican Bay Subdivisions: Aqua Vista, Dunaway, Eustance-Hill-Stanfield, Executive Acres, Pelican Bay, Scotty's West Bay Marina, Swan Estates, Tierra Grande Phase I, L.W. Cole
2. NUMBER OF SERVICE AREAS: 4
3. SIZE AND POPULATION SUMMARY:
4.
Service Area
A B C o E F G H
TOTAL
Service Area size (acres)
In City Rural
DISCHARGE SUMMARY:
Permit Flow BOD conditions .LM.ruU llb/day)
10/15 0.35 29 10/15/2 0.35 29
Population In City
1300
1300
TSS (Jb/day)
44 44
2150 1010
3160
Almtonia llb/day)
44 6
100 140
240
Rural
15 110 150
275
Note: All figures given above reflect average daily values assuming full development of planning area.

5.
PELICAN BAY FPA FACILITY PLANNING DATA SlIIIARY
(continued)
ESTIMATED CAPITAL IMPROVEMENT NEEDS: COLLECTION SYSTEM
A. Gravity Collection System:
Pipe size Length Unit cost Extended (j nches) eLf) C$/Lf) cost
6 39,000 20 $780,000 8 3,000 25 75,000 10 1,500 30 45,000 12 2,000 34 68,000 15 42 18 49 21 56 24 63
Total 45,500 N/A $968,000
B. lift Stations: None
2005 Capacity lift population required
Station served (MGO) Cost
1 100 0.01 $25,000 2 3 4 5
Total Cost $25,000
2

C.
D.
E.
F.
Force Mains:
Pipe size (inches)
3 4 6 8
Total
PELICAN BAY FPA FACILITY PLANNING DATA SUMMARY
(continued)
Length Unit cost --LI.E.l. (S/Lfl
7.00 2,200 10.00
13.50 19.00
2,200
Base Sewer Cost: $1,015,000
Cost Factors:
1. Engineering Cost Factor (Fe): .097 2. Contractor Cost Factor (Fc): .098
Extended cost
$22,000
$22,000
Total Collection System Capital Cost: $1,213,000
6. ESTIMATED CAPITAL IMPROVEMENT NEEDS: TREATMENT PLANT(S)
A. Number of Treatment Plants: 1
B. Plant Capacity and Cost Summary:
Plant nymber
1 2 3
Total
Capacity MGD
.35
Construction Cost 10115 10/15/2
$1,700,000 $2,000,000
$1,700,000 $2,000,000
3

PELICAN BAY FPA FACILITY PlANNING DATA SUMMARY
(continued)
7. ESTIMATED LAND NEEDS
Description
land required (acres)
Pipeline right-Qf-way Plant site 5
TQtal land CQst
8. TOTAL SYSTEM CAPITAL COST
Treatment level
10/10 10/15/2
TQtal CQst
$3,013,000 $3,313,000
9. ANNUALIZED CAPITAL COSTS
Treatment level
10/15 10/15/2
Annual debt service CQst
$ 232,000 $ 255,000
CQst per acre
$20,000
Extended CQst
$100,000
$100,000
Annual capital CQsts based Qn ~ percent interest Qver a ZQ-year term.
10. ANNUAL COLLECTION SYSTEM O&M COST: $38,000 (total linear feet gravity sewers + fQrce mains X $.59/linear fQQt) + (lift statiQns (1) .01 MGD)
4

PELICAN BAY FPA FACILITY PLANNING DATA SlIIIARY
(continued)
11. ANNUAL OlM COSTS FOR TREATMENT FACILITY:
12.
13.
Treatment level
10/15 10/15/2
TOTAL ANNUAL COST:
Treatment level
10/15 10/15/2
Annual costs
$ 46,000 $ 62,000
Annyal costs
$316,000 $355,000
ANNUAL COST PER HOUSEHOLD
Treatment POQul!ltion 1 evel 1990 2005
Households 730.6 1352.4 10/15 435 235
10/15/2 485 260
14. SOIL SUITABILITY FOR SEPTIC TANK SYSTEMS (for developed area)
Slight Limitations:
Moderation Limitations:
Severe Limitations: (slow percolation rates)
Severe limitations: (rock or flooding)
5
....Jl percent
....Jl percent
....25. percent
....Jl percent

PELICAN BAY FPA FACILITY PLANNING DATA stIIIARY
(continued)
15. LOT SIZE RESTRICTION SUMMARY
16. SEPTIC TANK REGULATIONS
17. COMMENTS
6
~ ~ ~~~~~----~ --------

PEDEN FPA FACILITY PLANNING DATA SlIIIARY
1. PLANNING AREA BOUNDARY:
Swift Branch Basin, Subbasin 2 - Peden Subdivisions: L.W. Cole, The Estate, Pocos Ranchos Estates, Wood Valley Addition, Wudco Trails, W. H. Younger, Schantile, Lake Forest
2. NUMBER OF SERVICE AREAS: 5
3. SIZE AND POPULATION SUMMARY:
4.
Service Area
A B C o E F G H
TOTAL
Service Area size (acres)
In City RYW.
DISCHARGE SUMMARY:
Permit Flow BOD conditions (MGDl (lb/day)
10/15 .071 6 10/15/2 .071 6
Population In City Rural
12M ~ lle.Z 2005
TSS Clb/day)
9 9
Ammonia Clb/day)
9 I
15 65
150 150 50
430
20 80
300 250
60
710
Note: All figures given above reflect average daily values assuming full development of planning area.

5.
PEDEN FPA FACILITY PLANNING DATA SlIMARY
(continued)
ESTIMATED CAPITAL IMPROVEMENT NEEDS: COLLECTION SYSTEM
A. Gravity Collection System:
Pipe size Length Unit cost Extended (inches) elf) <S/LFl cost
6 26,000 20 520,000 8 10 12 15 18 21 24
Total NIA $520,000
B. Lift Stations:
2005 Capacity Lift population required
Station served eMGDl Cost
1 20 .002 $25,000 2 80 .008 $25,000 3 60 .006 $25,000 4 5
Total Cost $75,000
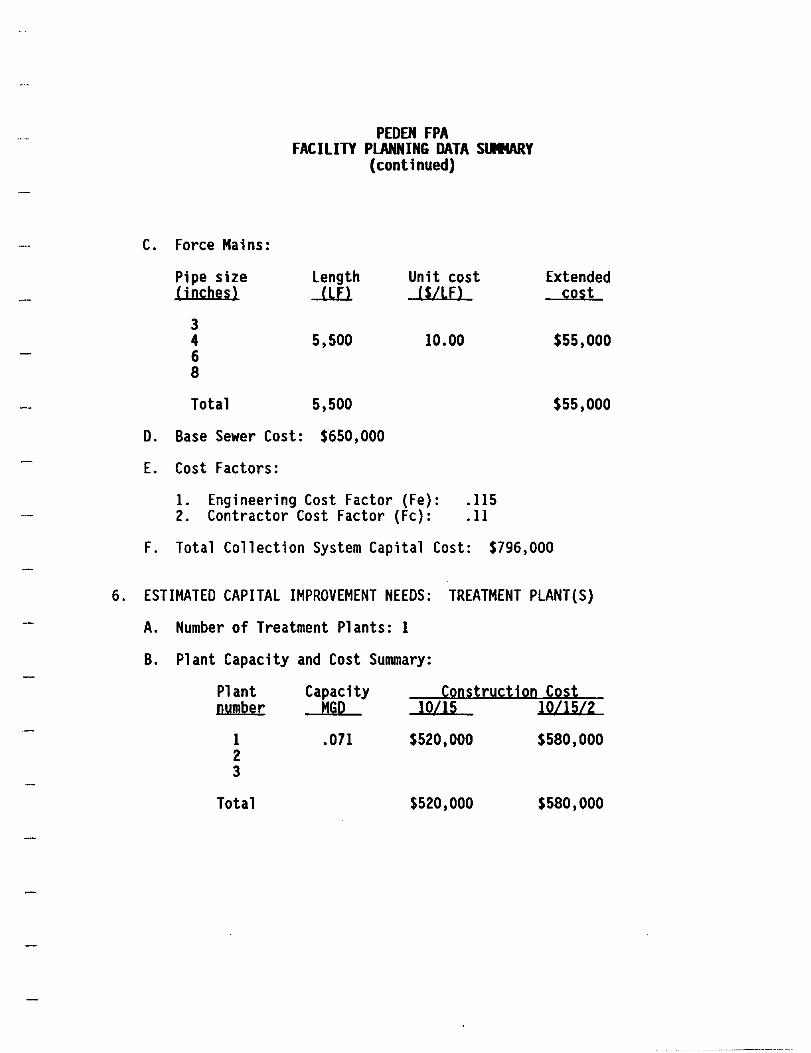
C.
D.
E.
F.
Force Mains:
Pipe size (i nches)
3 4 6 8
Total
PEDEN FPA FACILITY PLANNING DATA SUMMARY
(continued)
Length Unit cost -1.l.ll (S/Lfl
5,500 10.00
5,500
Base Sewer Cost: $650,000
Cost Factors:
1. Engineering Cost Factor (Fe): .115 2. Contractor Cost Factor (Fc): .11
Extended cost
$55,000
$55,000
Total Collection System Capital Cost: $796,000
6. ESTIMATED CAPITAL IMPROVEMENT NEEDS: TREATMENT PLANT(S)
A. Number of Treatment Plants: 1
B. Plant Capacity and Cost Summary:
Plant nymber
1 2 3
Total
Capacity MGO
.071
Construction Cost lOllS 10/15/2
$520,000 $580,000
$520,000 $580,000

PEDEN FPA FACILITY PLANNING DATA SUMMARY
(continued)
7. ESTIMATED LAND NEEDS
Description
Land required (acres)
Pipeline right-of-way Plant site 5
Total Land Cost
8. TOTAL SYSTEM CAPITAL COST
Treatment 1 eve1
10/10 10/15/2
Total cost
$1,416,000 $1,476,000
9. ANNUALIZED CAPITAL COSTS
Treatment level
10/15 10/15/2
Annual debt service cost
$ 109,000 $ 114,000
Cost per acre
$20,000
Extended cost
$100,000
$100,000
Annual capital costs based on !-lLZ percent interest over a 2Q-year term.
10. ANNUAL COLLECTION SYSTEM O&M COST: $49,000 (total linear feet gravity sewers + force mains X $.59/1inear foot) + (lift stations (3), total - 0.016 MGD)

PEDEN FPA FACILITY PLANNING DATA SUMMARY
(continued)
11. ANNUAL O&M COSTS FOR TREATMENT FACILITY:
12.
13.
Treatment leyel
10/15 10/15/2
TOTAL ANNUAL COST:
Treatment level
10/15 10/15/2
Annual costs
$ 12,000 $ 16,000
Annyal costs
$170,000 $179,000
ANNUAL COST PER HOUSEHOLD
Treatment POlly]ation level 1990 2005
Households 187.7 279.5 10/15 905 610
10/15/2 955 640
14. SOIL SUITABILITY FOR SEPTIC TANK SYSTEMS (for developed area)
Slight Limitations:
Moderation Limitations:
Severe Limitations: (slow percolation rates)
Severe Limitations: (rock or flooding)
--2 percent
...!5. percent
~ percent
..Z2 percent

PEDEN FPA FACILITY PLANNING DATA SllltARy
(continued)
15. LOT SIZE RESTRICTION SUMMARY
16. SEPTIC TANK REGULATIONS
17. COMMENTS

SWIFT BRANCH FPA FACILITY PI.JUfNING DATA StIIIARY
1. PLANNING AREA BOUNDARY:
Swift Branch Basin, Subbasin 3 Subdivisions: English Creek Estates, Gantt-Stuart-Foster, Holly Hills, Lake Forest, Perry Miller, R. W. Foster, Ranch Oak Farm Estates
2. NUMBER OF SERVICE AREAS: 6
3. SIZE AND POPULATION SUMMARY:
4.
Service Area
A B C o E F G H
TOTAL
Service Area size (acres)
In City RYrll
DISCHARGE SUMMARY:
Permit Flow BOD conditions (MGO) fJb/day)
10/15 .093 8 10/15/2 .093 8
Population In City Rural
1987 2005 1987 2005
TSS Ob/dayl
12 12
Anlnonia ~b/day)
12 2
135 50 65
125 60
125
560
175 60 80
ISO 220 245
930
Note: All figures given above reflect average daily values assuming full development of planning area.

5.
SWIFT BRANCH FPA FACILITY PlANNING DATA SlIIWlY
(continued)
ESTIMATED CAPITAL IMPROVEMENT NEEDS: COLLECTION SYSTEM
A. Gravity Collection System:
Pipe size Length Unit cost Extended (inches) (LEl (S/LEl cost
6 28,500 20 $570,000 8 10 12 15 18 21 24
Total N/A $570,000
B. Li ft Stations:
2005 Capacity Lift population required
Station served (MGD) Cost
1 175 0.018 $25,000 2 60 0.006 $25,000 3 80 0.008 $25,000 4 150 0.015 $25,000 5
Total Cost $100,000
2

C.
D.
Force Mains:
Pipe size (inches)
3 4 6 8
Total
SVIA BRANCH FPA FACILITY PLANNING DATA SllltARy
(continued)
Length Unit cost (LEl (S/LEl
5,000 10.00
5,000
Base Sewer Cost: $720,000
E. Cost Factors:
1. Engineering Cost Factor (Fe): .11 2. Contractor Cost Factor (Fc): .11
Extended cost
$50,000
$50,000
F. Total Collection System Capital Cost: $878,000
6. ESTIMATED CAPITAL IMPROVEMENT NEEDS: TREATMENT PLANT(S)
A. Number of Treatment Plants: 1
B. Plant Capacity and Cost Summary:
Plant nymber
1 2 3
Total
Capacity MGD
.093
Constryction Cost lOllS 10/15/2
$630,000 $720,000
$630,000 $720,000
3

SWIFT BRANCH FPA FACILITY PLANNING DATA SUMMARY
(continued)
7. ESTIMATED LAND NEEDS
Description
Pipeline right-of-way Plant site
Land required (acres)
5
Total Land Cost
8. TOTAL SYSTEM CAPITAL COST
Treatment level
10/10 10/15/2
Total cost
$1,608,000 $1,698,000
9. ANNUALIZED CAPITAL COSTS
Treatment level
10/15 10/15/2
Annual debt service cost
$ 124,000 $ 131,000
Cost per acre
$20,000
Extended cost
$100,000
$100,000
Annual capital costs based on ~ percent interest over a ZQ-year term.
10. ANNUAL COLLECTION SYSTEM O&M COST: $62,000 (total linear feet gravity sewers + force mains X $.59/1inear foot) + (lift stations (3), total 0.04 7 MGD)
4

SWIFT BRANCH FPA FACILITY PLANNING DATA StIIU\RY
(continued)
11. ANNUAL OaM COSTS FOR TREATMENT FACILITY:
12.
13.
Treatment level
10/15 10/15/2
TOTAL ANNUAL COST:
Treatment level
10/15 10/15/2
Annyal costs
$ 12,000 $ 16,000
Annyal costs
$198,000 $209,000
ANNUAL COST PER HOUSEHOLD
Treatment POllulation level 1990 2005
Households 244.8 366.1 10/15 810 540
10/15/2 855 570
14. SOIL SUITABILITY FOR SEPTIC TANK SYSTEMS (for developed area)
Slight Limitations:
Moderation Limitations:
Severe Limitations: (slow percolation rates)
Severe Limitations: (rock or flooding)
--...2 percent
-.ll percent
-!2 percent
...l5. percent
5

SWIFT BRANCH FPA FACILITY PLANNING DATA SlIItARy
(continued)
15. LOT SIZE RESTRICTION SUMMARY
16. SEPTIC TANK REGULATIONS
17. COMMENTS
6

RENO - SYSTEM 1 FACILITY PLANNING DATA SlIIIARY
1. PLANNING AREA BOUNDARY:
Walnut Creek Basin System No. 1
2. NUMBER OF SERVICE AREAS: 3
3. SIZE AND POPULATION SUMMARY:
4.
Service Area
A B C D E F G H
TOTAL
Service Area size (acres)
In City Rural
DISCHARGE SUMMARY:
Permit Flow BOD conditions iMW Clb/day)
10/15 .lS0 15 10/15/2 .lS0 15
Population In City Rural
1.ru ~ ~ 2005
TSS
45 40
730
SIS
(1 b/day)
23 23
100 90
1610
IS00
Ammonia Clb/day)
23 3
Note: All figures given above reflect average daily values assuming full development of planning area.

5.
RENO - SYSTEM 1 FACILITY PlANNING DATA SUMMARY
(continued)
ESTIMATED CAPITAL IMPROVEMENT NEEDS: COllECTION SYSTEM
A. Gravity Collection System:
Pipe size length Unit cost Extended e inches) elf) U/lE) cost
6 108,000 20 $2,160,000 8 9,000 25 $ 225,000 10 12 15 18 21 24
Total 117,000 NIA $2,385,000
B. Lift Stations:
2005 Capacity Lift population required
Station served (MGD) Cost
I 100 .010 $25,000 2 90 .009 $25,000 3 4 5
Total Cost $ 50,000
2

C.
D.
E.
F.
Force Mains:
Pipe size (inches)
3 4 6 8
Total
RENO - SYSTEM 1 FACILITY PLANNING DATA SlIItARy
(continued)
length Unit cost -LW. U/lf)
3,500 10.00
3,500
Base Sewer Cost: $2,470,000
Cost Factors:
1. Engineering Cost Factor (Fe): .075 2. Contractor Cost Factor (Fc): .085
Extended cost
$35,000
$35,000
Total Collection System Capital Cost: $2,865,000
6. ESTIMATED CAPITAL IMPROVEMENT NEEDS: TREATMENT PlANT(S)
A. Number of Treatment Plants: 1
B. Plant Capacity and Cost Summary:
Plant nymber
1 2 3
Total
Capacity MGD
.180
Constryction Cost 10/15 10/15/2
$1,100,000 $1,300,000
$1,100,000 $1,300,000
3
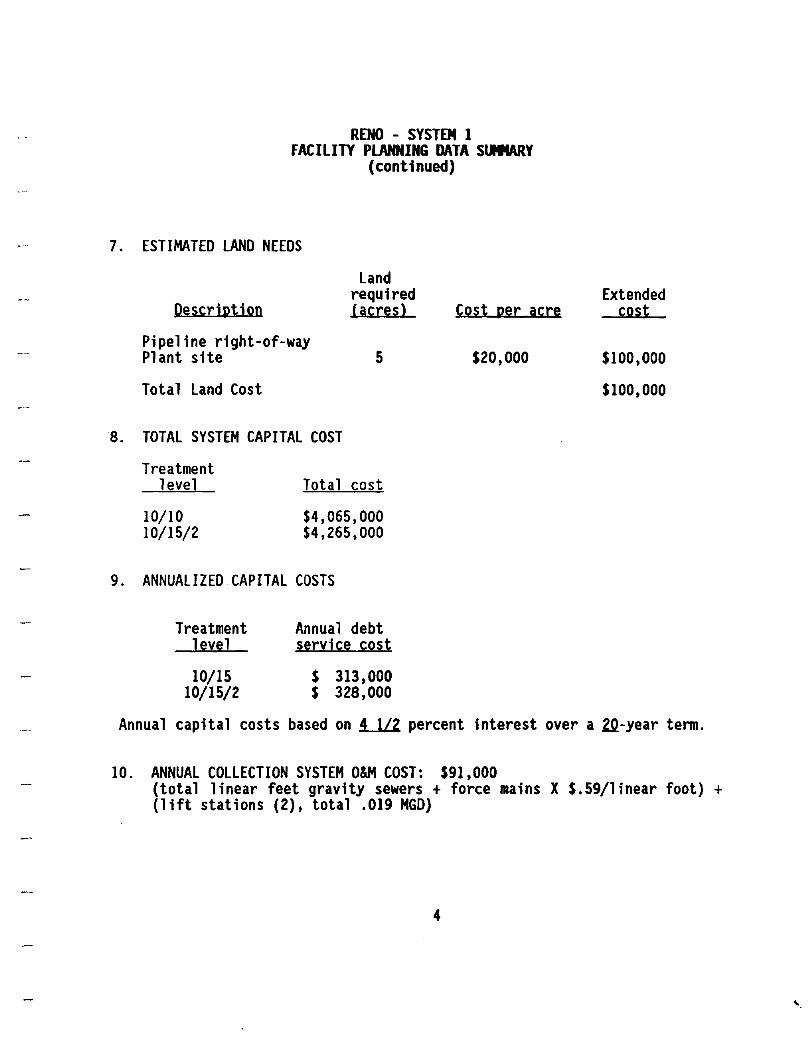
RENO - SYSTEM 1 FACILITY PLANNING DATA SUMMARY
(continued)
7. ESTIMATED LAND NEEDS
Description
Pipeline right-of-way Plant site
Land required (acres)
5
Total Land Cost
8. TOTAL SYSTEM CAPITAL COST
Treatment level
10/10 10/15/2
Total cost
$4,065,000 $4,265,000
9. ANNUALIZED CAPITAL COSTS
Treatment level
10/15 10/15/2
Annual debt service cost
$ 313,000 $ 328,000
Cost per acre
$20,000
Extended cost
$100,000
$100,000
Annual capital costs based on 4 1/2 percent interest over a ZQ-year term.
10. ANNUAL COLLECTION SYSTEM OlM COST: $91,000 (total linear feet gravity sewers + force mains X $.59/1inear foot) + (lift stations (2), total .019 MGD)
4
~.
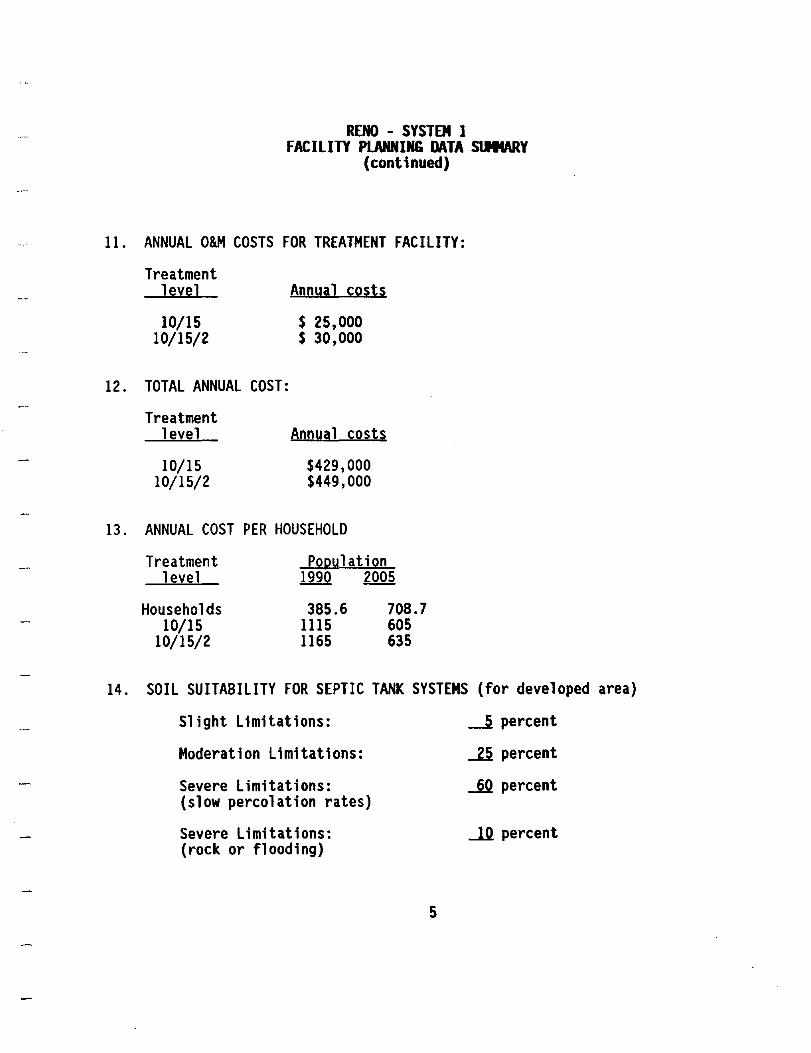
11.
12.
13.
RENO - SYSTEM 1 FACILITY PLANNING DATA SUMMARY
(continued)
ANNUAL O&M COSTS FOR TREATMENT FACILITY:
Treatment level Annyal costs
10/15 $ 25,000 10/15/2 $ 30,000
TOTAL ANNUAL COST:
Treatment level Annyal costs
10/15 $429,000 10/15/2 $449,000
ANNUAL COST PER HOUSEHOLD
Treatment 1 evel
Households 10/15
10/15/2
Population 1990 2005
385.6 1115 1165
708.7 605 635
14. SOIL SUITABILITY FOR SEPTIC TANK SYSTEMS (for developed area)
Slight Limitations:
Moderation Limitations:
Severe Limitations: (slow percolation rates)
Severe Limitations: (rock or flooding)
5
--1 percent
....n percent
-2Q percent
..l2 percent

RENO - SYSTEM 1 FACILITY PLANNING DATA SlIIWlY
(continued)
15. LOT SIZE RESTRICTION SUMMARY
16. SEPTIC TANK REGULATIONS
17. COMMENTS
6

RENO - SYSTEM 2 FACILITY PLANNING DATA SlIIWtY
1. PLANNING AREA BOUNDARY:
2.
3.
4.
Walnut Creek Basin System No. 2 Subdivisions: Midway, Oak Valley, Highlands Addition, H & H Investments Addition, Country Acres, LaJunta Addition, Reno North, Walnut Creek Ranch, Walnut Creek Estates
NUMBER OF SERVICE AREAS: 4
SIZE AND POPULATION SUMMARY:
Service Area ~QRylitiQn Service ~ize 'icr~s} In ~it~ Byral Area In Cit~ Rural 1987 2005 1987 2005
A 340 750 B 120 265 C 60 130 D 30 65 E F G H
TOTAL 340 750 210 460
DISCHARGE SUMMARY:
Permit Flow BOD TSS AnInonia conditions .L!1IDll (]b/da~) (lb/da~) llb/dav)
10/15 .121 10 15 15 10/15/2 .121 10 15 2
Note: All figures given above reflect average daily values assuming full development of planning area.

5.
RENO - SYSTEM 2 FACILITY PLANNING DATA SlIMARY
(continued)
ESTIMATED CAPITAL IMPROVEMENT NEEDS: COLLECTION SYSTEM
A. Gravity Collection System:
Pipe size Length Unit cost Extended (inches) eLF) U/LF) cost
6 40,000 20 $800,000 8 10 12 15 18 21 24
Total 40,000 N/A $800,000
B. li ft Stat ions:
2005 Capacity lift population required
Station served (MGDl Cost
1 460 .046 $25,000 2 195 .020 $25,000 3 65 .007 $25,000 4 5
Total Cost $ 75,000
2

C.
D.
E.
F.
Force Mains:
Pipe size Cinches)
3 4 6 8
Total
RENO - SYSTEM 2 FACILITY PLANNING DATA SUMMARY
(continued)
Length Unit cost -1.I.fl (S/LFl
4,500 10.00
4,500
Base Sewer Cost: $920,000
Cost Factors:
1. Engineering Cost Factor (Fe): .10 2. Contractor Cost Factor (Fc): .10
Extended cost
$45,000
$45,000
Total Collection System Capital Cost: $1,104,000
6. ESTIMATED CAPITAL IMPROVEMENT NEEDS: TREATMENT PLANT(S)
A. Number of Treatment Plants: 1
B. Plant Capacity and Cost Summary:
Plant nymber
1 2 3
Total
Capacity MGD
.121
.121
Construction Cost 10115 10/15/2
$700,000 $810,000
$700,000 $810,000
3
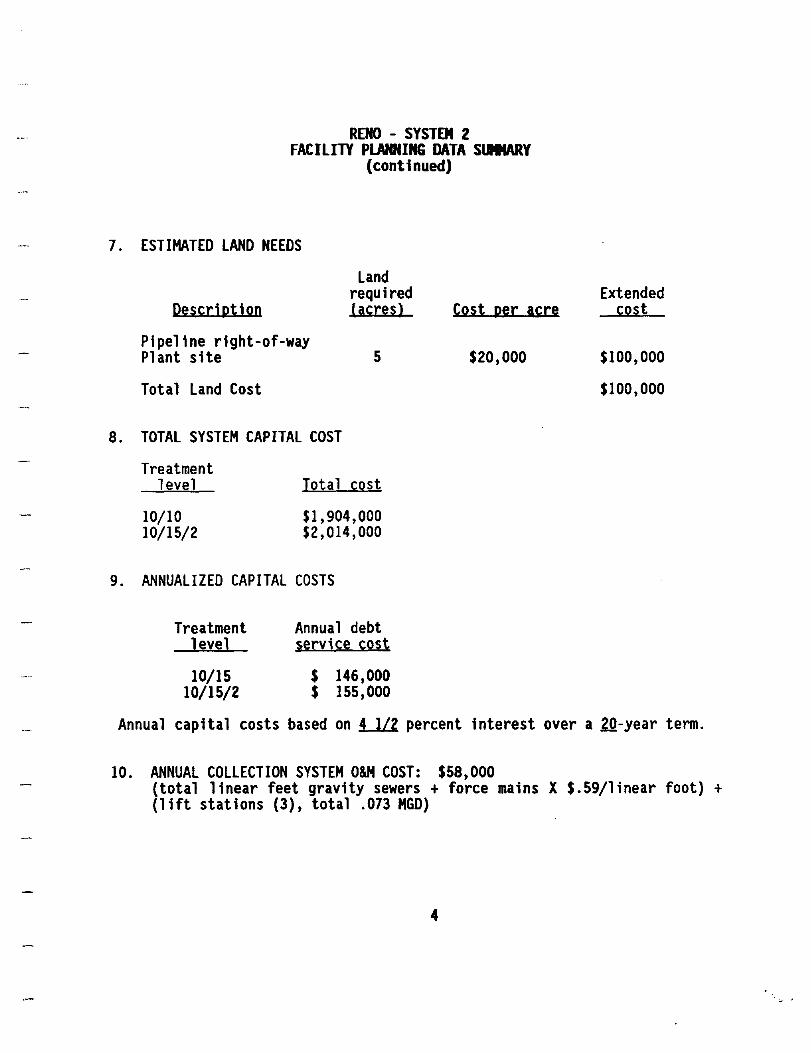
RENO - SYSTEM 2 FACILITY PLANNING DATA SlIIIARY
(continued)
7. ESTIMATED LAND NEEDS
Descrjption
Land required (acres)
Pipeline right-of-way Plant site 5
Total Land Cost
8. TOTAL SYSTEM CAPITAL COST
Treatment level
10/10 10/15/2
Total cost
$1,904,000 $2,014,000
9. ANNUALIZED CAPITAL COSTS
Treatment level
10/15 10/15/2
Annual debt service cost
$ 146,000 $ 155,000
Cost per acre
$20,000
Extended cost
$100,000
$100,000
Annual capital costs based on !-ILl percent interest over a ZQ-year term.
10. ANNUAL COLLECTION SYSTEM O&M COST: $58,000 (total linear feet gravity sewers + force mains X $.59/linear foot) + (lift stations (3), total .073 MGD)
4

RENO - SYSTEM 2 FACILITY PLANNING DATA SlIIIARY
(continued)
11. ANNUAL O&M COSTS FOR TREATMENT FACILITY:
12.
13.
Treatment level
10/15 10/15/2
TOTAL ANNUAL COST:
Treatment level
10/15 10/15/2
Annyal costs
$ 13,000 $ 17,000
Annyal costs
$217,000 $230,000
ANNUAL COST PER HOUSEHOLD
Treatment PO(1ulgtion 1 evel 1990 2005
Households 259.8 476.4 10/15 835 455
10/15/2 885 485
14. SOIL SUITABILITY FOR SEPTIC TANK SYSTEMS (for developed area)
Slight Limitations:
Moderation Limitations:
Severe Limitations: (slow percolation rates)
Severe Limitations: (rock or flooding)
5
~ percent
~ percent
....§.Q percent
-1Q percent
,.

RENO - SYSTEM 2 FACILITY PlANNING DATA SUMMARY
(continued)
15. LOT SIZE RESTRICTION SUMMARY
16. SEPTIC TANK REGULATIONS
17. COMMENTS
6
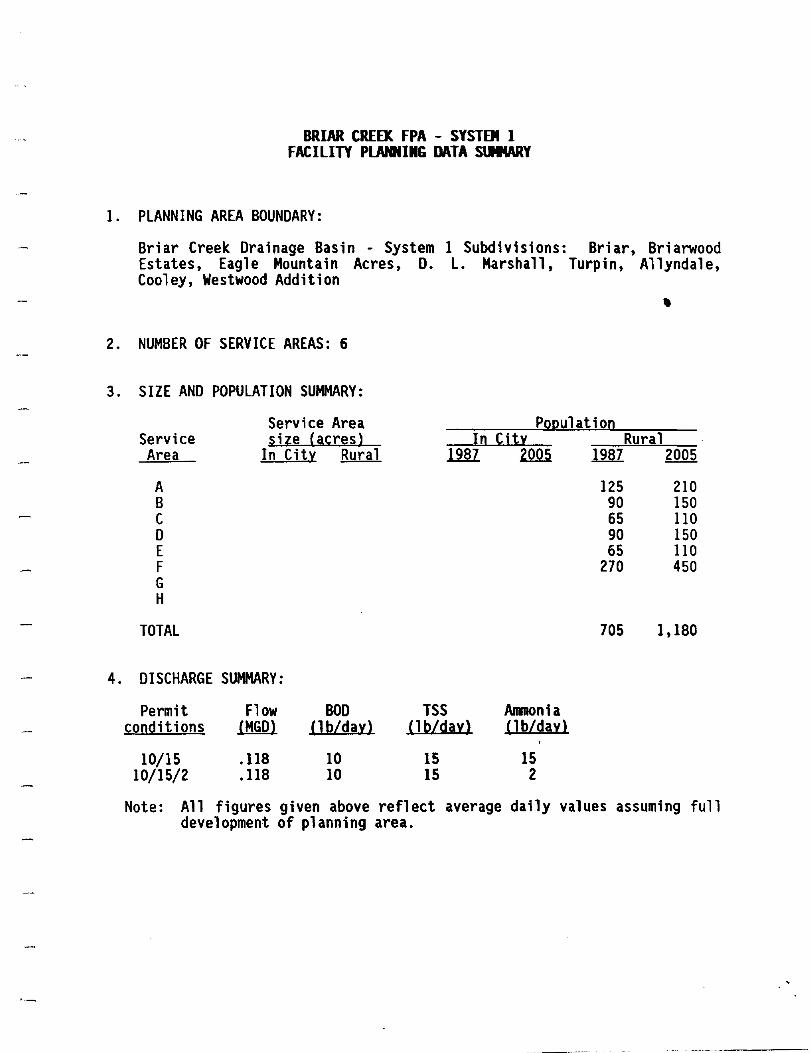
BRIAR CREEK FPA - SYSTEM 1 FACILITY PLANNING DATA SlIMARY
1. PLANNING AREA BOUNDARY:
Briar Creek Drainage Basin - System 1 Subdivisions: Briar, Briarwood Estates, Eagle Mountain Acres, D. L. Marshall, Turpin, Allyndale, Cooley, Westwood Addition
• 2. NUMBER OF SERVICE AREAS: 6
3. SIZE AND POPULATION SUMMARY:
4.
Service Area
A B C o E F G H
TOTAL
Service Area size (acres)
In City Rural
DISCHARGE SUMMARY:
Permit Flow BOD conditions (MGD) Ob/day)
10/15 .118 10 10/15/2 .US 10
Population In City Rural
19S7 2005 ~ 2005
TSS Annonia Ob/day) Ob/day)
15 15 15 2
125 90 65 90 65
270
705
210 150 110 150 110 450
1,IS0
Note: All figures given above reflect average daily values assuming full development of planning area.

5.
BRIAR CREEK FPA - SYSTEM 1 FACILITY PLANNING DATA SlIItARy
(continued)
ESTIMATED CAPITAL IMPROVEMENT NEEDS: COLLECTION SYSTEM
A. Gravity Collection System:
Pipe size Length Unit cost Extended (inches) (LFl (SlLFl cost
6 40,700 20 $814,000 8 25 10 30 12 34 15 42 18 49 21 56 24 63
Total 40,700 N/A $814,000
B. Lift Stations:
2005 Capacity Lift population required
Station served (MGD) Cost
1 210 .021 $25,000 2 150 .015 $25,000 3 110 .011 $25,000 4 5
Total Cost $ 75,000
2

6.
C.
D.
E.
F.
Force Mains:
Pipe size (inches)
3 4 6 8
Total
BRIAR CREEK FPA - SYSTEM 1 FACILITY PlANNING DATA SllltARy
(continued)
length Unit cost --1ill CS/lFl
7.00 5,000 10.00
13.50 19.00
5,000
Base Sewer Cost: $939,0000
Cost Factors:
1. Engineering Cost Factor (Fe): 0.1 2. Contractor Cost Factor (Fc): 0.1
Extended cost
$50,000
$50,000
Total Collection System Capital Cost: $1,127,000
ESTIMATED CAPITAL IMPROVEMENT NEEDS: TREATMENT PlANT(S)
A. Number of Treatment Plants: 1
B. Plant Capacity and Cost Summary:
Plant Capacity CQD~try~tiQn ~Q~t nymber MGO 10115 10/1512
1 .118 $700,000 $810,000 2 3
Total .118 $700,000 $810,000
3
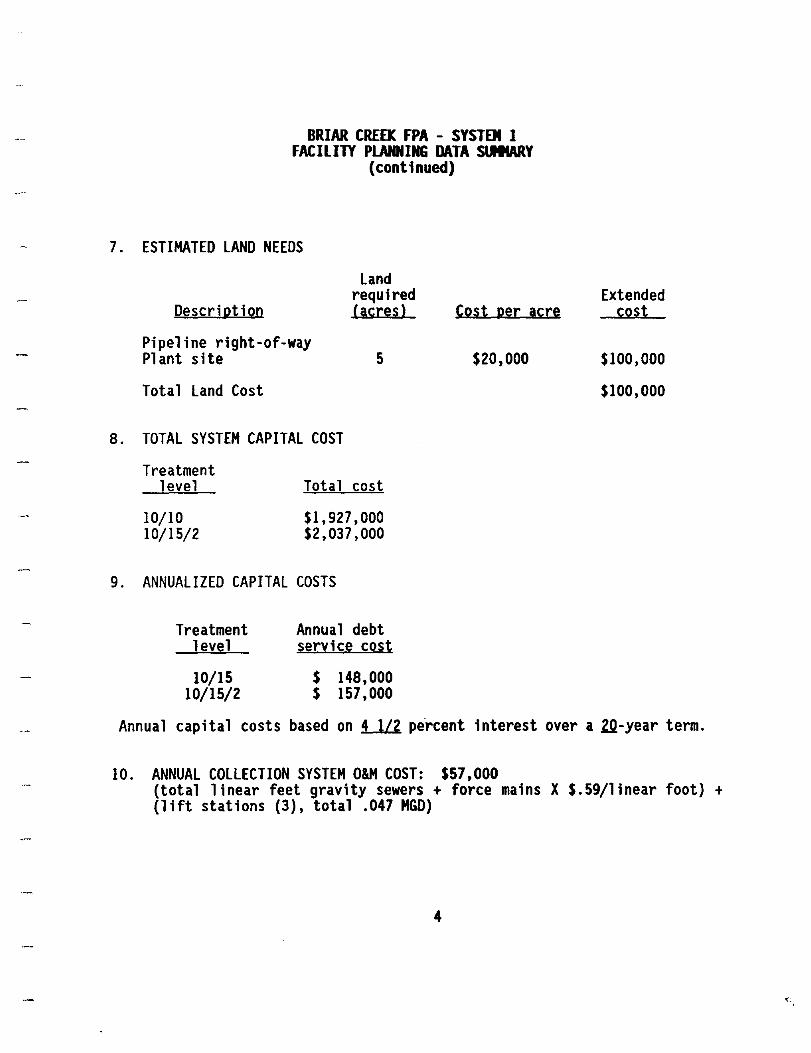
BRIAR CREEK FPA - SYSTEJI 1 FACILITY PLANNING DATA stIICARY
(continued)
7. ESTIMATED LAND NEEDS
Description
Pipeline right-of-way Plant site
Land required (acres)
5
Total Land Cost
8. TOTAL SYSTEM CAPITAL COST
Treatment level
10/10 10/15/2
Total cost
$1,927,000 $2,037,000
9. ANNUALIZED CAPITAL COSTS
Treatment level
10/15 10/15/2
Annual debt service cost
$ 148,000 $ 157,000
Cost per acre
$20,000
Extended cost
$100,000
$100,000
Annual capital costs based on !....la percent interest over a ZQ-year term.
10. ANNUAL COLLECTION SYSTEM OlM COST: $57,000 (total linear feet gravity sewers + force mains X $.59/linear foot) + (lift stations (3), total .047 MGD)
4
(.

BRIAR CREEK FPA - SYSTEJI 1 FACILITY PLANNING DATA SlIItARY
(continued)
11. ANNUAL O&M COSTS FOR TREATMENT FACILITY:
12.
13.
Treatment level
10/15 10/15/2
TOTAL ANNUAL COST:
Treatment level
10/15 10/15/2
Annyal costs
$ 13,000 $ 17,000
Annual costs
$218,000 $231,000
ANNUAL COST PER HOUSEHOLD
Treatment POl1ul1&tiQn level 1990 2005
Households 308.8 464.6 10/15 705 470
10/15/2 750 500
14. SOIL SUITABILITY FOR SEPTIC TANK SYSTEMS (for developed area)
Slight limitations:
Moderation limitations:
Severe limitations: (slow percolation rates)
Severe limitations: (rock or flooding)
---it percent
--4.Q percent
-12 percent
-12 percent
5

BRIAR CREEK FPA - SYSTEJII 1 FACILITY PLANNING DATA SlIItARY
(continued)
15. LOT SIZE RESTRICTION SUMMARY
16. SEPTIC TANK REGULATIONS
17. COMMENTS
6

BRIAR CREEK FPA - SYSTEM Z FACILITY PLANNING DATA SlIIWlY
1. PLANNING AREA BOUNDARY:
Briar Creek Drainage Basin - System 2
2. NUMBER OF SERVICE AREAS: 2
3. SIZE AND POPULATION SUMMARY:
Population In City Ryral Service
Area
Service Area s j ze <acres)
In City Ryral lW~mz.~
4.
A B C D E F G H
TOTAL
DISCHARGE SUMMARY:
Permit Flow conditions (MGD)
10/15 .036 10/15/2 .036
BOD Ob/dayl
3 3
TSS AnInonia Ob/dayl Ob/dayl
5 5 5 1
105 110
215
175 180
355
Note: All figures given above reflect average daily values assuming full development of planning area.

5.
BRIAR CREEK FPA - SYSTEM 2 FACILITY PLANNING DATA SlIIWlY
(continued)
ESTIMATED CAPITAL IMPROVEMENT NEEDS: COLLECTION SYSTEM
A. Gravity Collection System:
Pipe size Length Unit cost Extended (inches) (Lf) (S/Lf) cost
6 21,000 20 $420,000 8 25 10 30 12 34 15 42 18 49 21 56 24 63
Total 21,000 N/A $420,000
B. Lift Stations: None
2005 Capacity Lift population required
Station served (HGD) Cost
1 2 3 4 5
Total Cost
2

C.
D.
E.
Force Mains:
Pipe size (inches)
3 4 6 8
Total
BRIAR CREEK FPA - SYSTEM 2 FACILITY PlANNING DATA SUMMARY
(continued)
None
length Unit cost -1ill (S/lfl
Base Sewer Cost: $420,000
Cost Factors:
l. Engineering Cost Factor (Fe): 0.14 2. Contractor Cost Factor (Fc): 0.13
Extended cost
F. Total Collection System Capital Cost: $533,000
6. ESTIMATED CAPITAL IMPROVEMENT NEEDS: TREATMENT PlANT(S)
A. Number of Treatment Plants: 1
B. Plant Capacity and Cost Summary:
Plant nymber
1 2 3
Total
Capacity MGD
.036
.036
Constryction Cost 10/15 10/15/2
$300,000 $350,000
$300,000 $350,000
3
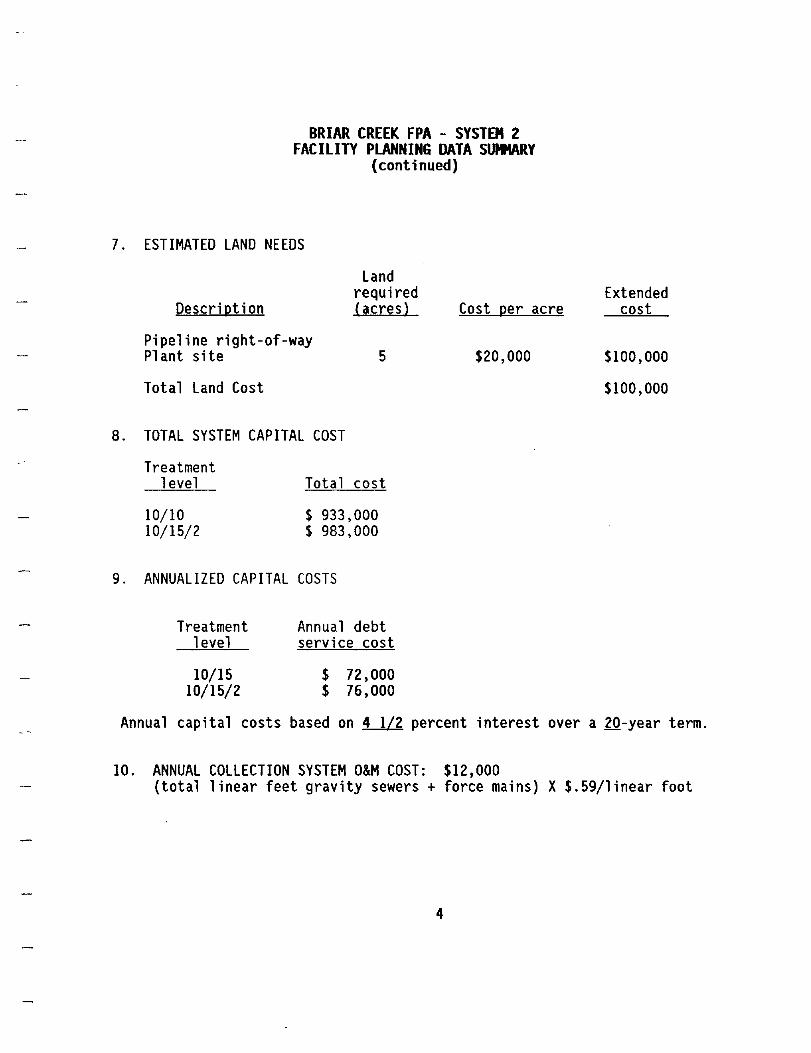
7.
8.
BRIAR CREEK FPA - SYSTEM 2 FACILITY PLANNING DATA SUMMARY
(continued)
ESTIMATED LAND NEEDS
Land required
Description (acres)
Pipeline right-of-way Pl ant site 5
Total Land Cost
TOTAL SYSTEM CAPITAL COST
Treatment 1 evel
10/10 10/15/2
Total cost
$ 933,000 $ 983,000
Cost per acre
$20,000
9. ANNUALIZED CAPITAL COSTS
Treatment 1 evel
10/15 10/15/2
Annual debt service cost
$ 72,000 $ 76,000
Extended cost
$100,000
$100,000
Annual capital costs based on 4 1/2 percent interest over a 20-year term.
10. ANNUAL COLLECTION SYSTEM O&M COST: $12,000 (total linear feet gravity sewers + force mains) X $.59/linear foot
4

11.
12.
13.
BRIAR CREEK FPA - SYSTEM 2 FACILITY PLANNING DATA SlIIWlY
(continued)
ANNUAL O&M COSTS FOR TREATMENT FACILITY:
Treatment level Annyal costs
10/15 $ 12,000 10/15/2 $ 16,000
TOTAL ANNUAL COST:
Treatment level Annual costs
10/15 $ 96,000 10/15/2 $104,000
ANNUAL COST PER HOUSEHOLD
Treatment PO(1ulation level 1990 2005
Households 93.8 139.8 10/15 1025 685
10/15/2 1110 745
14. SOIL SUITABILITY FOR SEPTIC TANK SYSTEMS (for developed area)
Slight limitations:
Moderation limitations:
Severe limitations: (slow percolation rates)
Severe limitations: (rock or flooding)
5
---2 percent
...!Q. percent
....1Q percent
....1Q percent
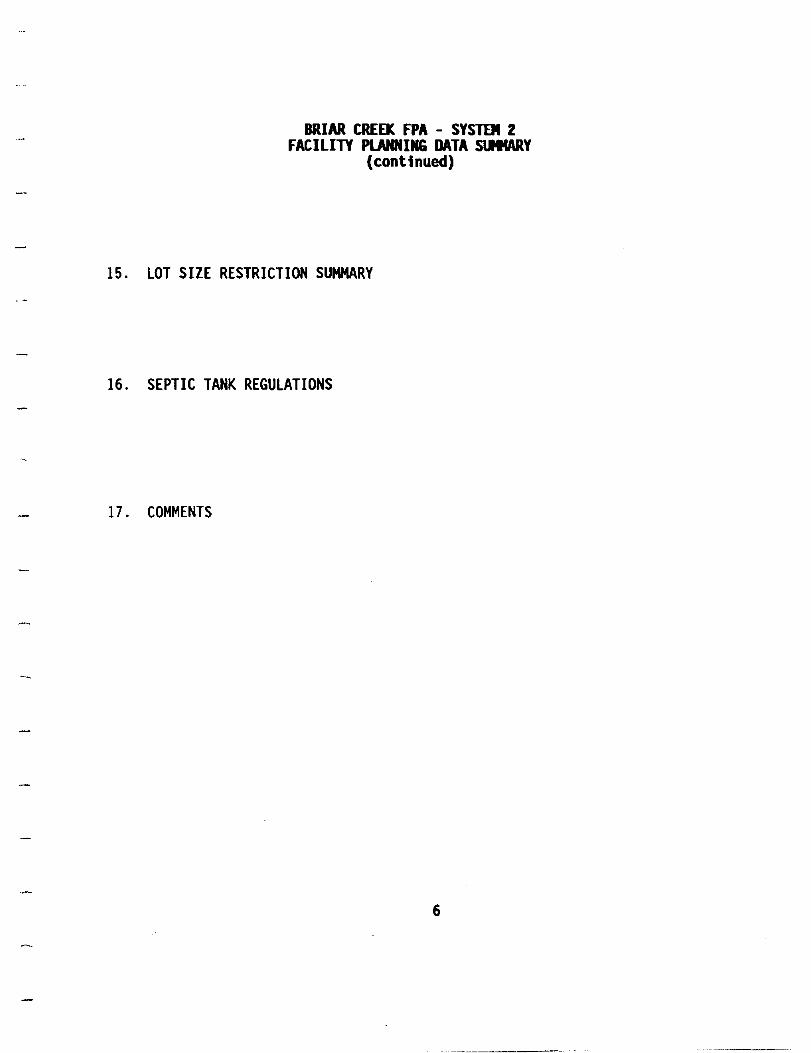
BRIAR CREEK FPA - SYSTEJI 2 FACILITY PLANNING DATA S\IItARY
(continued)
15. LOT SIZE RESTRICTION SUMMARY
16. SEPTIC TANK REGULATIONS
17. COMMENTS
6

AURORA FACILITY PLANNING DATA SllllARY
1. PLANNING AREA BOUNDARY:
Blue Creek Basin - Three mobile home subdivision (.7 ac) and large lot (2 ac+) areas
2. NUMBER OF SERVICE AREAS: 1
3. SIZE AND POPULATION SUMMARY:
4.
Service Area
A B C o E F G H
TOTAL
Service Area size (acres)
In City Rura]
DISCHARGE SUMMARY:
Permit Flow BOD conditions 1MW (lb/day)
10/15 .052 4 10/15/2 .052 4
Population In City Rural
l2R ~ .lmlI 2005
360 520
360 520
TSS Anlnonia (lb/day) (lb/day)
7 7 7 1
Note: All figures given above reflect average daily values assuming full development of planning area.

5.
AURORA FACILITY PlANNING DATA SUMMARY
(continued)
ESTIMATED CAPITAL IMPROVEMENT NEEDS: COllECTION SYSTEM
A. Gravity Collection System:
Pipe size length Unit cost Extended (inches) (IF) CS/lFl cost
6 32,000 20 $640,000 8 25 10 30 12 34 15 42 18 49 21 56 24 63
Total 32,000 NIA $640,000
B. lift Stations: NONE
2005 Capacity Lift population required
Station served (MGD) Cost
1 2 3 4 5
Total Cost
2
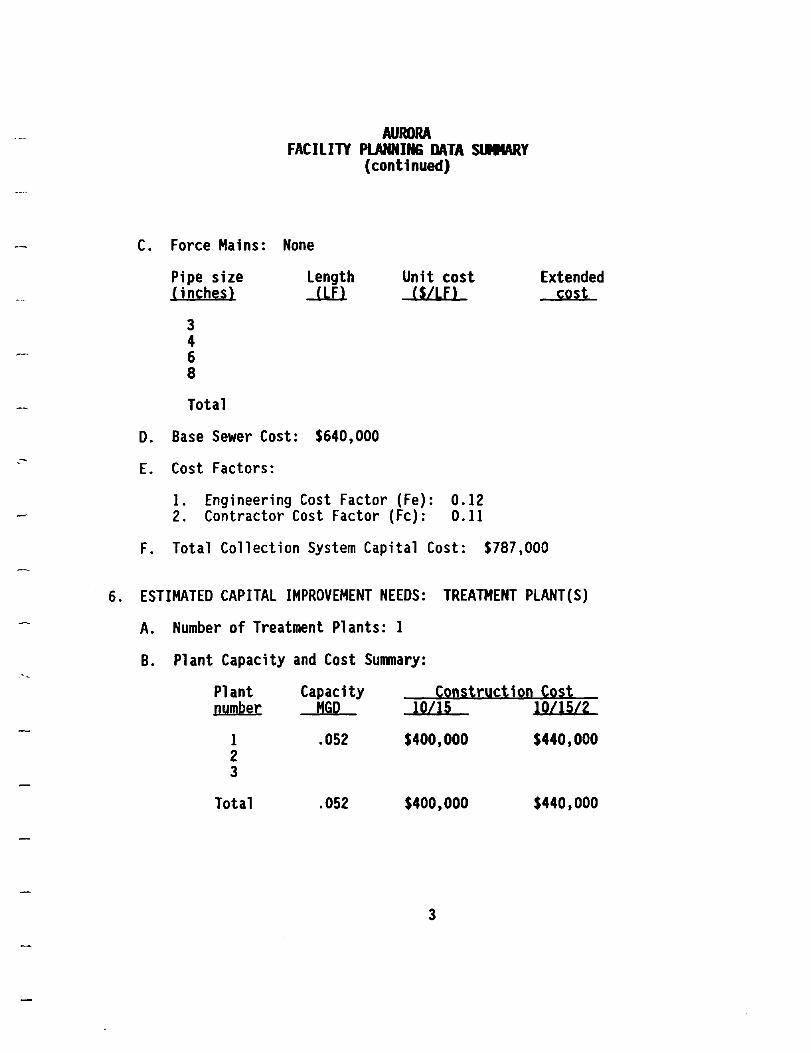
-
C.
D.
E.
F.
Force Mains:
Pipe size (inches)
3 4 6 8
Total
AURORA FACILITY PLANNING DATA StIIIARY
(continued)
None
Length Unit cost -1lli (S/Lf)
Base Sewer Cost: $640,000
Cost Factors:
1. Engineering Cost Factor (Fe): 0.12 2. Contractor Cost Factor (Fc): 0.11
Extended cost
Total Collection System Capital Cost: $787,000
6. ESTIMATED CAPITAL IMPROVEMENT NEEDS: TREATMENT PLANT(S)
A. Number of Treatment Plants: 1
B. Plant Capacity and Cost Summary:
Plant number
1 2 3
Total
Capacity MGD
.OS2
.OS2
Constryction Cost lOllS 10/1S/2
$400,000 $440,000
$400,000 $440,000
3

AURORA FACILITY PLANNING DATA SllllARY
(continued)
7. ESTIMATED LAND NEEDS
Descriptjon
Land required (acres)
Pipeline right-of-way Plant site 5
Total Land Cost
8. TOTAL SYSTEM CAPITAL COST
Treatment level
10/10 10/15/2
Total cost
$1,287,000 $I ,327,000
9. ANNUALIZED CAPITAL COSTS
Treatment level
10/15 10/15/2
Annual debt service CQst
$ 99,000 $ 101,000
Cost per acre
$20,000
Extended cost
$100,000
$100,000
Annual capital costs based on ~ percent interest Qver a ZQ-year term.
10. ANNUAL COLLECTION SYSTEM OlM COST: $19,000 (total linear feet gravity sewers + fQrce mains) X $.59/linear fQot
4
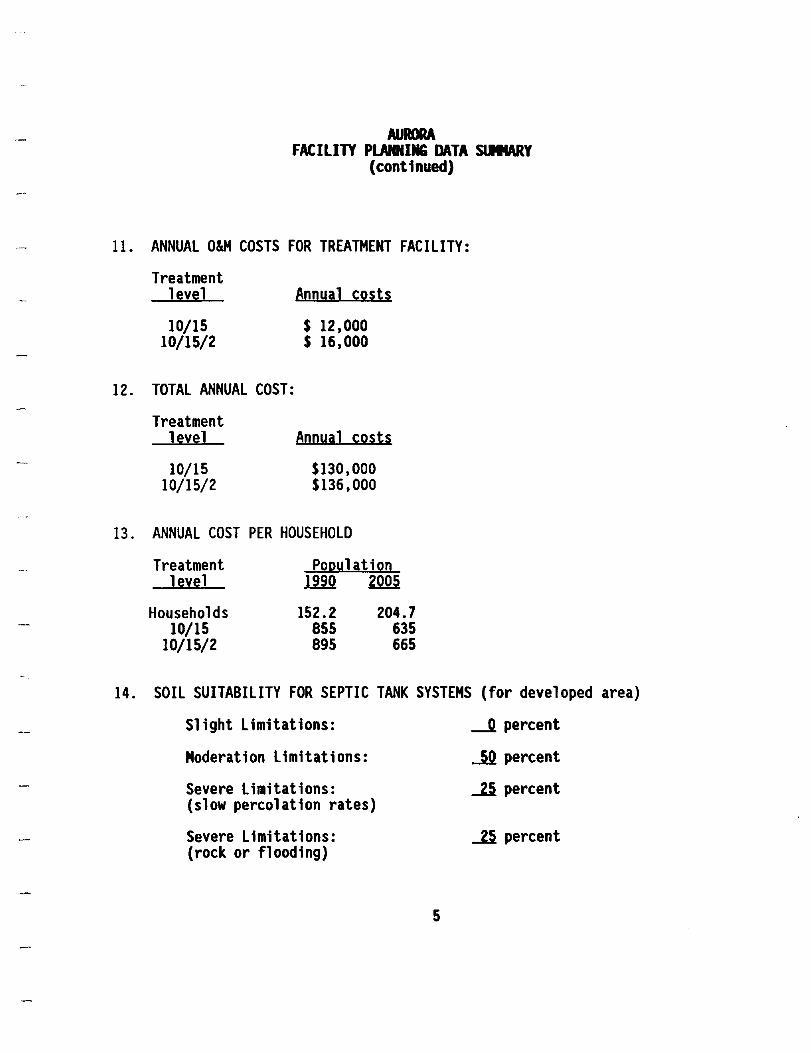
AURORA FACILITY PLANNING DATA StJIW{y
(continued)
11. ANNUAL O&M COSTS FOR TREATMENT FACILITY:
12.
13.
Treatment level
10/15 10/15/2
TOTAL ANNUAL COST:
Treatment level
10/15 10/15/2
Annyal costs
$ 12,000 $ 16,000
Annual costs
$130,000 $136,000
ANNUAL COST PER HOUSEHOLD
Treatment PQl!yhtiQD level ill2 ~
Households 152.2 204.7 10/15 855 635
10/15/2 895 665
14. SOIL SUITABILITY FOR SEPTIC TANK SYSTEMS (for developed area)
Slight Limitations:
Moderation Limitations:
Severe Limitations: (slow percolation rates)
Severe Limitations: (rock or flooding)
5
~ percent
~ percent
....n percent
....n percent

AURORA FACILITY PLANNING DATA SlIIIARY
(continued)
15. LOT SIZE RESTRICTION SUMMARY
16. SEPTIC TANK REGULATIONS
17. COMMENTS
6

NEVARK FACILITY PLANNING DATA SlIItARY
1. PLANNING AREA BOUNDARY:
Derrett Creek Drainage Basin - No known subdivisions
2. NUMBER OF SERVICE AREAS: 6
3. SIZE AND POPULATION SUMMARY:
4.
Service Area
A B C o E F G H
TOTAL
Service Area size (acres)
In City Ryral
DISCHARGE SUMMARY:
Permit Flow BOD conditions 1HruU Clb/day)
10/15 .118 10 10/15/2 .118 10
Popylation In City Ryral ~~~2005
TSS AnInonia Cl b/day) Clb/day)
IS 15 IS 2
110 125 70
120 290 115
830
155 175 100 170 410 165
1,175
Note: All figures given above reflect average daily values assuming full development of planning area.
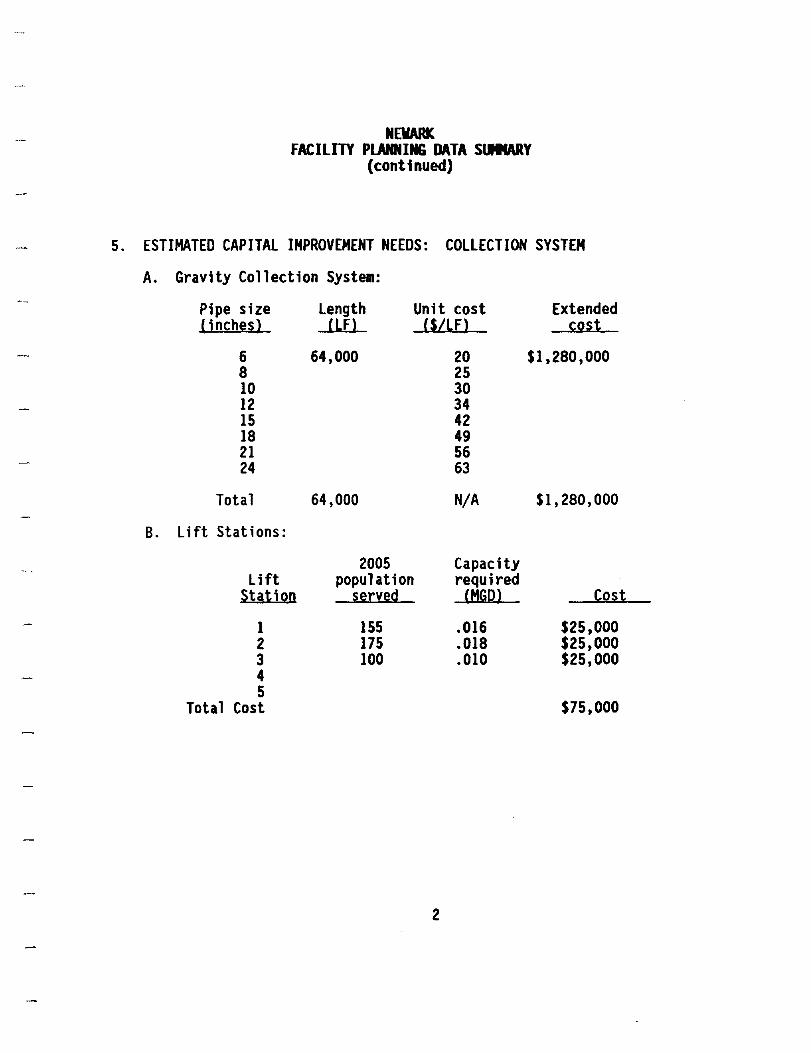
5.
NEWARK FACILITY PLANNING DATA SllltARy
(continued)
ESTIMATED CAPITAL IMPROVEMENT NEEDS: COLLECTION SYSTEM
A. Gravity Collection System:
Pipe size Length Unit cost Extended (inches) eLf) (s/LE) cost
6 64,000 20 $I ,280,000 8 25 10 30 12 34 15 42 18 49 21 56 24 63
Total 64,000 N/A $1 ,280,000
B. Lift Stations:
2005 Capacity Lift population required
Station served (MGDl Cost
1 155 .016 $25,000 2 175 .018 $25,000 3 100 .010 $25,000 4 5
Total Cost $75,000
2

--
C.
D.
f-
F.
Force Mains:
Pipe size (inches)
3 4 6 8
Total
NEWARK FACILITY PLANNING DATA SlIIU\RY
(continued)
Length Unit cost -1ill (S/Lf)
7.00 6,500 10.00
13.50 19.00
6,500
Base Sewer Cost: $1,420,000
Cost Factors:
1. Engineering Cost Factor (Fe): .090 2. Contractor Cost Factor (Fc): .095
Extended cost
$65,000
$65,000
Total Collection System Capital Cost: $1,683,000
6. ESTIMATED CAPITAL IMPROVEMENT NEEDS: TREATMENT PLANT(S)
A. Number of Treatment Plants: 1
B. Plant Capacity and Cost Summary:
Plant nymber
1 2 3
Total
Capacity MGD
.118
.118
Construction Cost 10115 10/15/2
$700,000 $800,000
$700,000 $800,000
3
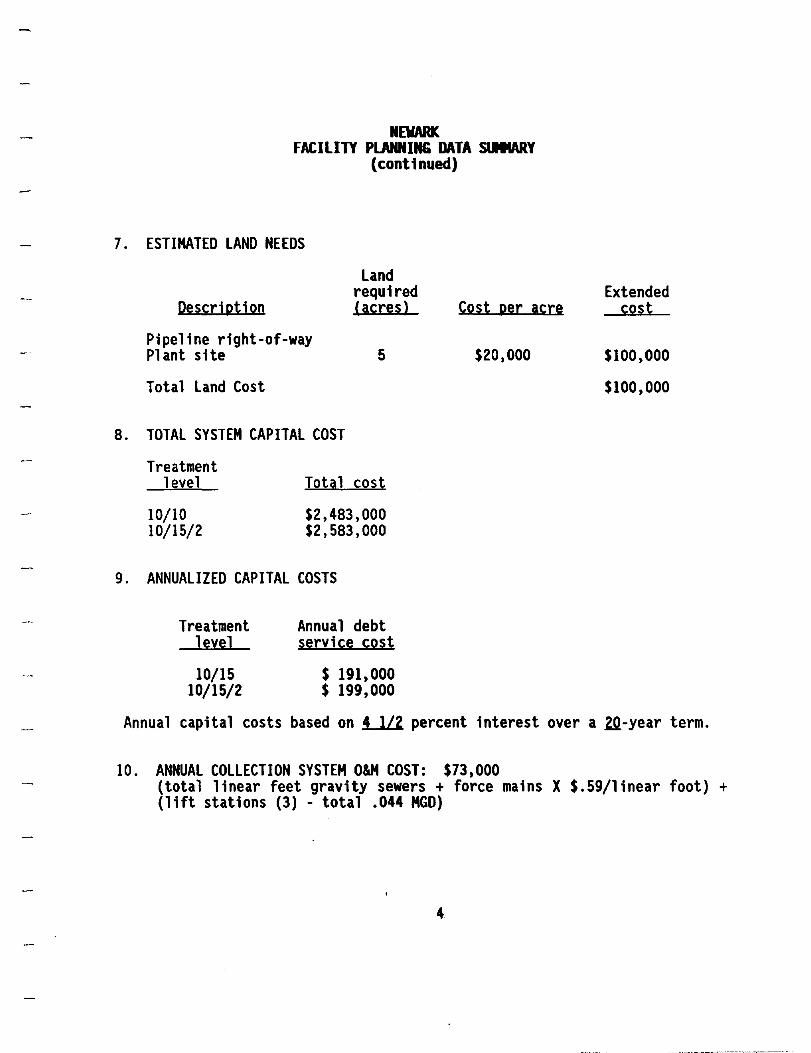
NEWARK FACILITY PLANNING DATA stIIMRY
(continued)
7. ESTIMATED LAND NEEDS
Description
Pipeline right-of-way P1 ant site
Land required (acres)
5
Total Land Cost
8. TOTAL SYSTEM CAPITAL COST
Treatment level
10/10 10/15/2
Total cost
$2,483,000 $2,583,000
9. ANNUALIZED CAPITAL COSTS
Treatment level
10/15 10/15/2
Annual debt service cost
$ 191,000 $ 199,000
Cost per acre
$20,000
Extended cost
$100,000
$100,000
Annual capital costs based on 4 1/2 percent interest over a ZQ-year term.
10. ANNUAL COLLECTION SYSTEM O&M COST: $73,000 (total linear feet gravity sewers + force mains X $.59/1inear foot) + (lift stations (3) - total .044 MGD)
4
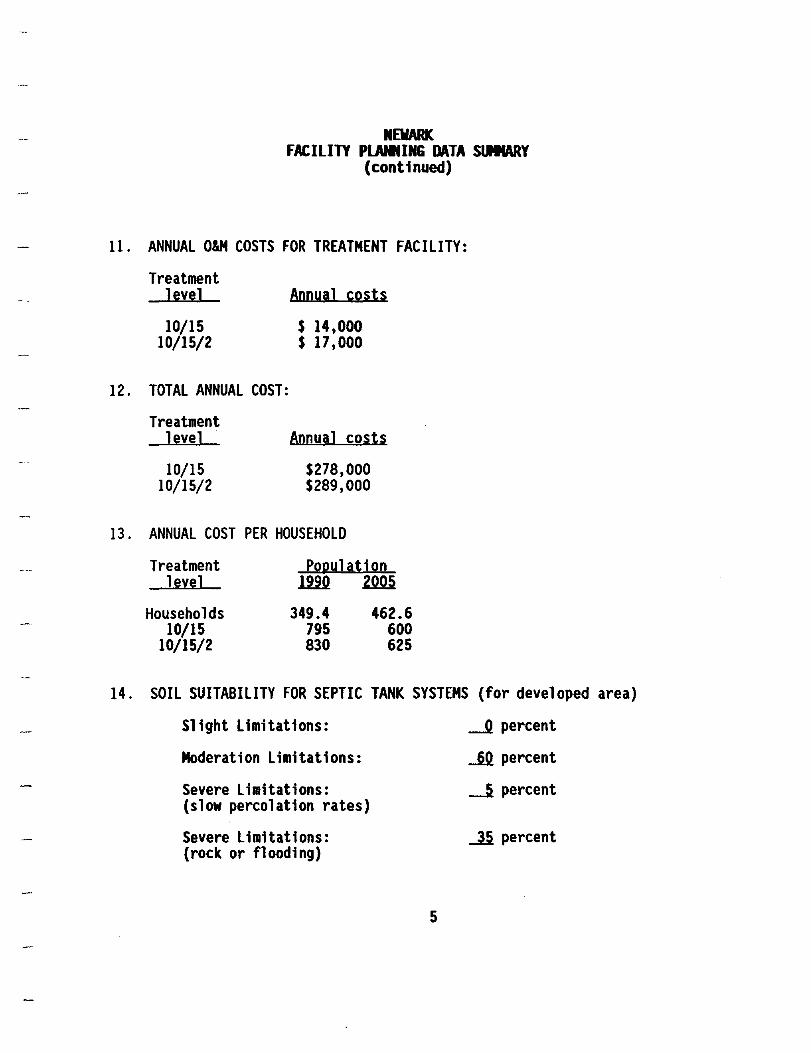
NElfARI(
FACILITY PLANNING DATA SlIIIARY (continued)
11. ANNUAL O&M COSTS FOR TREATMENT FACILITY:
12.
13.
Treatment level
10/15 10/15/2
TOTAL ANNUAL COST:
Treatment level
10/15 10/15/2
Annual costs
$ 14,000 $ 17,000
Annual costs
$278,000 $289,000
ANNUAL COST PER HOUSEHOLD
Treatment PQQyhtjQn level 1m Wi
Households 349.4 462.6 10/15 795 600
10/15/2 830 625
14. SOIL SUITABILITY FOR SEPTIC TANK SYSTEMS (for developed area)
Slight Limitations:
Moderation Limitations:
Severe Limitations: (slow percolation rates)
Severe Limitations: (rock or flooding)
5
J percent
..§2 percent
J percent
~ percent
NEWARK FACILITY PlANNING DATA stIItARY
(continued)
15. LOT SIZE RESTRICTION SUMMARY
16. SEPTIC TANK REGULATIONS
17. COMMENTS
6
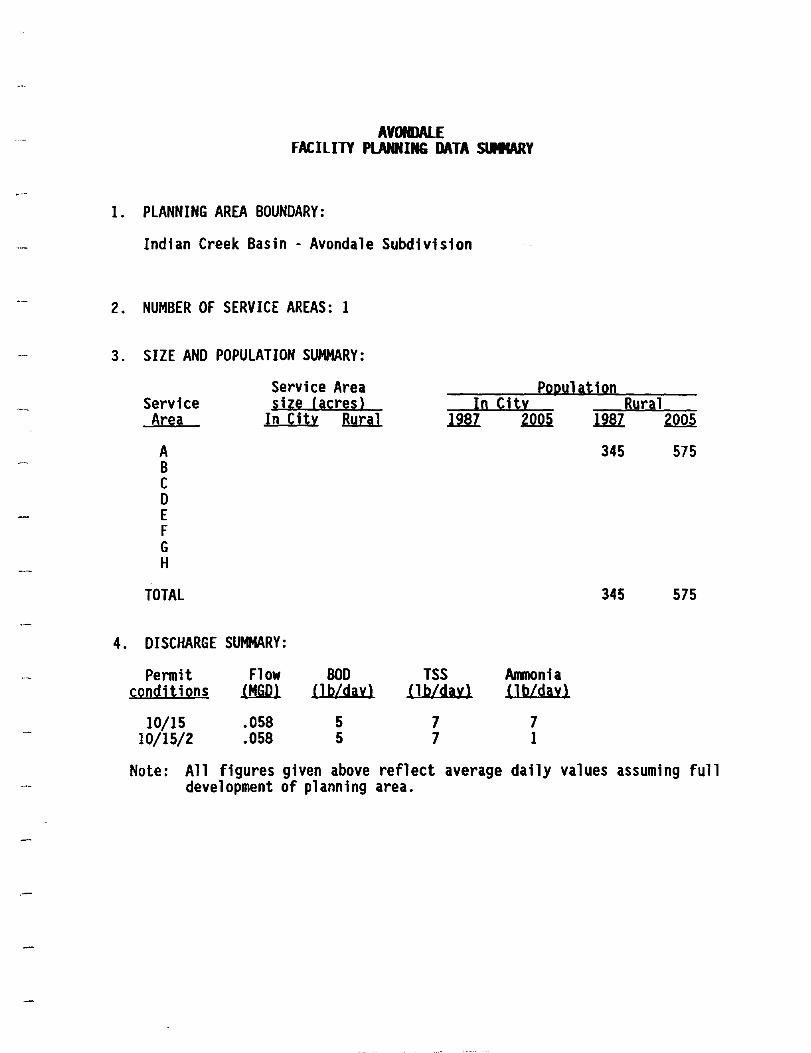
AVONDALE FACILITY PLANNING DATA SlIIIARY
1. PLANNING AREA BOUNDARY:
Indian Creek Basin - Avondale Subdivision
2. NUMBER OF SERVICE AREAS: 1
3. SIZE AND POPULATION SUMMARY:
4.
Service Area
A B C o E F G H
TOTAL
Service Area size (acres)
In City RYr.il
DISCHARGE SUMMARY:
Permit Flow BOD conditjons .LHruU (1 b/day)
10/15 .058 5 10/15/2 .058 5
Population In City Rural
llM ~ 1m 2005
345 575
345 575
TSS AnInonia (lb/dayl (]b/day)
7 7 7 1
Note: All figures given above reflect average daily values assuming full development of planning area.

5.
AVONDALE FACILITY PLANNING DATA s(JIWlY
(continued)
ESTIMATED CAPITAL IMPROV MENT NEEDS: COLLECTION SYSTEM A. Gravity Collection S stem:
Pipe size Le gth Unit cost Extended (inches) (~F) (tILE) cost 6 20,500 20 $410,000 8 25 10 30 12 34 15 42 18 49 21 56 24 63
Total 20,5 0 N/A $410,000 B. lift Stations: NONE
Capacity lift required Station (MGD) Cost 1 2 3 4 5
Total Cost
2

C.
D.
E.
Force Mains:
Pipe size (inches)
3 4 6 8
Total
AVONDALE FACILITY PLANNING DATA stIIIARY
(continued)
NONE
length Unit cost (Lf) CS/lFl
Base Sewer Cost: $410,000
Cost Factors:
1. Engineering Cost Factor (Fe): 0.14 2. Contractor Cost Factor (Fc): 0.12
Extended cost
F. Total Collection System Capital Cost: $517,000
6. ESTIMATED CAPITAL IMPROVEMENT NEEDS: TREATMENT PlANT(S)
A. Number of Treatment Plants: 1
B. Plant Capacity and Cost Summary:
Plant nymber
1 2 3
Total
Capacity MGO
.058
.058
Construction Cost 10115 10/15/2
$450,000 $510,000
$450,000 $510,000
3
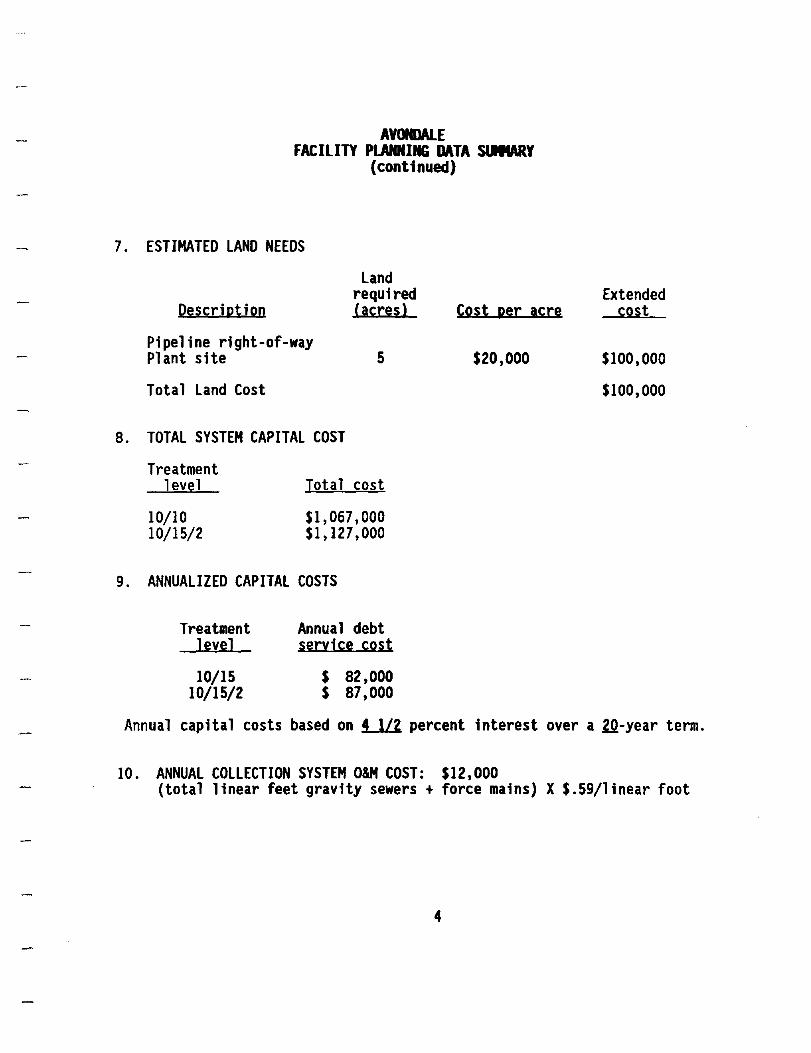
AYotlW.E FACILITY PLANNING DATA SlIIIARY
(continued)
7. ESTIMATED LAND NEEDS
Description
Land required (acres)
Pipeline right-of-way Plant site 5
Total Land Cost
8. TOTAL SYSTEM CAPITAL COST
Treatment 1 evel
10/10 10/15/2
Total cost
$1,067,000 $1,127,000
9. ANNUALIZED CAPITAL COSTS
Treatment level
10/15 10/15/2
Annual debt service cost
$ 82,000 $ 87,000
Cost per acre
$20,000
Extended cost
$100,000
$100,000
Annual capital costs based on ~ percent interest over a ZQ-year term.
10. ANNUAL COLLECTION SYSTEM OlM COST: $12,000 (total linear feet gravity sewers + force mains) X $.59/1inear foot
4
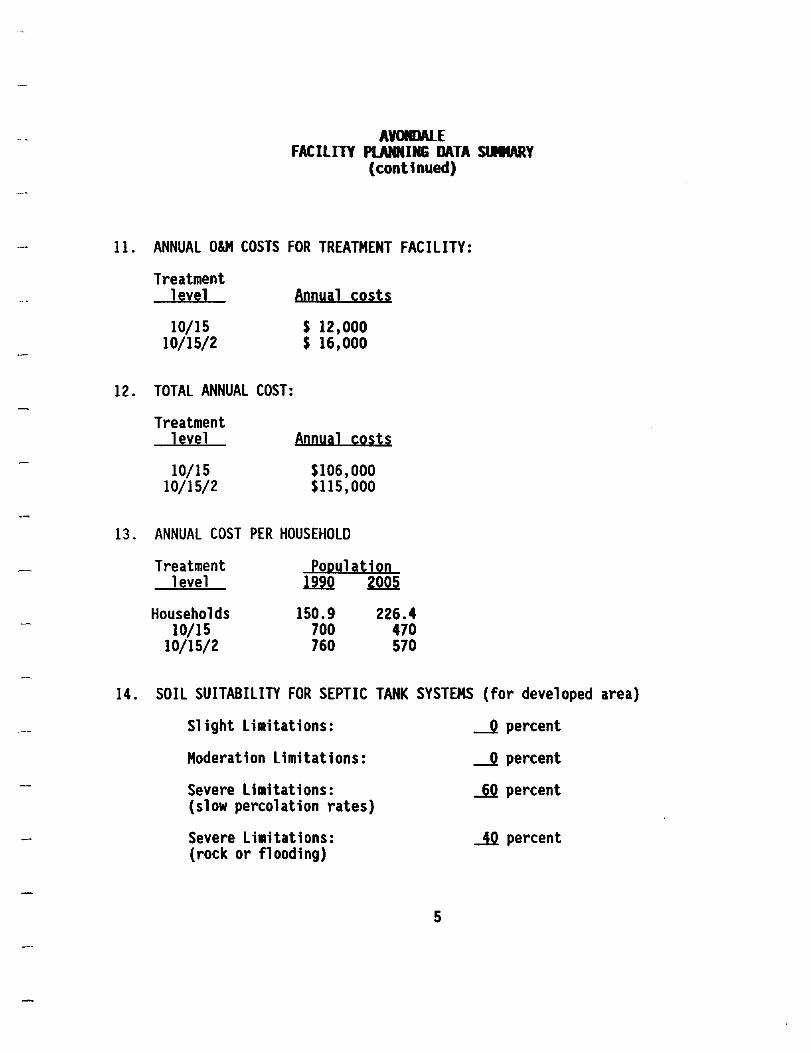
AYCRW.E FACILITY PLANNING DATA StlMARY
(continued)
11. ANNUAL O&M COSTS FOR TREATMENT FACILITY:
12.
13.
Treatment level
10/15 10/15/2
TOTAL ANNUAL COST:
Treatment level
10/15 10/15/2
Annual costs
$ 12,000 $ 16,000
Annyal costs
$106,000 $115,000
ANNUAL COST PER HOUSEHOLD
Treatment ~Q~YhtiQn level lfiQ ~
Households 150.9 226.4 10/15 700 470
10/15/2 760 570
14. SOIL SUITABILITY FOR SEPTIC TANK SYSTEMS (for developed area)
Slight Limitations:
Moderation Limitations:
Severe Limitations: (slow percolation rates)
Severe Limitations: (rock or flooding)
5
J percent
J percent
~ percent
.32 percent

AVONDALE FACILITY PLANNING DATA SlJIMRY
(continued)
15. LOT SIZE RESTRICTION SUMMARY
Soil: In Avondale - 6~ C 4~ 0
In Basin - 5% A 2~ C 75% 0
16. SEPTIC TANK REGULATIONS
17. COMMENTS
6

GIlJI)R[ BRANCH FACILITY PLANNING DATA StIItARY
1. PLANNING AREA BOUNDARY:
Gilmore Branch - Sub-Basin 5 (Dido Area) Subdivisions: Harbor East Estates, Lake Shore Acres, Lakeside Acres, McKee's Port, Oak Lane Subdivision
2. NUMBER OF SERVICE AREAS: 4
3. SIZE AND POPULATION SUMMARY:
4.
Service Area
A B C o E F G H
TOTAL
Service Area size (acres)
In Citv BYlli
DISCHARGE SUMMARY:
Permit Flow BOD conditions .utrull Ob/day)
10/15 .058 5 10/15/2 .058 5
Population In Citv Ryral ~ 2M2 ~ 2005
TSS Anmonia (Jb/day) Ob/day)
7 7 7 1
125 70 70
345
210 115 135 115
575
Note: All figures given above reflect average daily values assuming full development of planning area.
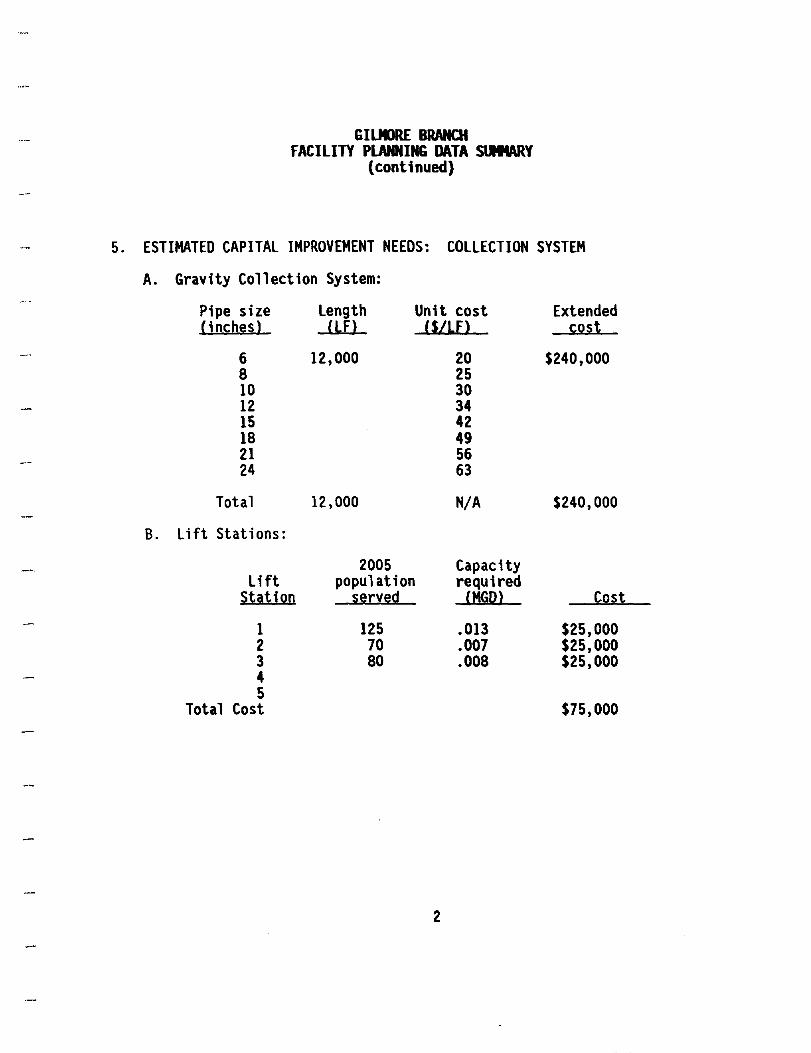
5.
GIUIlRE BRANCH FACILITY PLANNING DATA SllltARy
(continued)
ESTIMATED CAPITAL IMPROVEMENT NEEDS: COllECTION SYSTEM
A. Gravity Collection System:
Pipe size length Unit cost Extended (inches) (IF> (tILE> cost
6 12,000 20 $240,000 8 25 10 30 12 34 15 42 18 49 21 56 24 63
Total 12,000 N/A $240,000
B. Li ft Stat ions:
2005 Capacity Lift population required
Station served (MGO) Cost
1 125 .013 $25,000 2 70 .007 $25,000 3 80 .008 $25,000 4 5
Total Cost $75,000
2
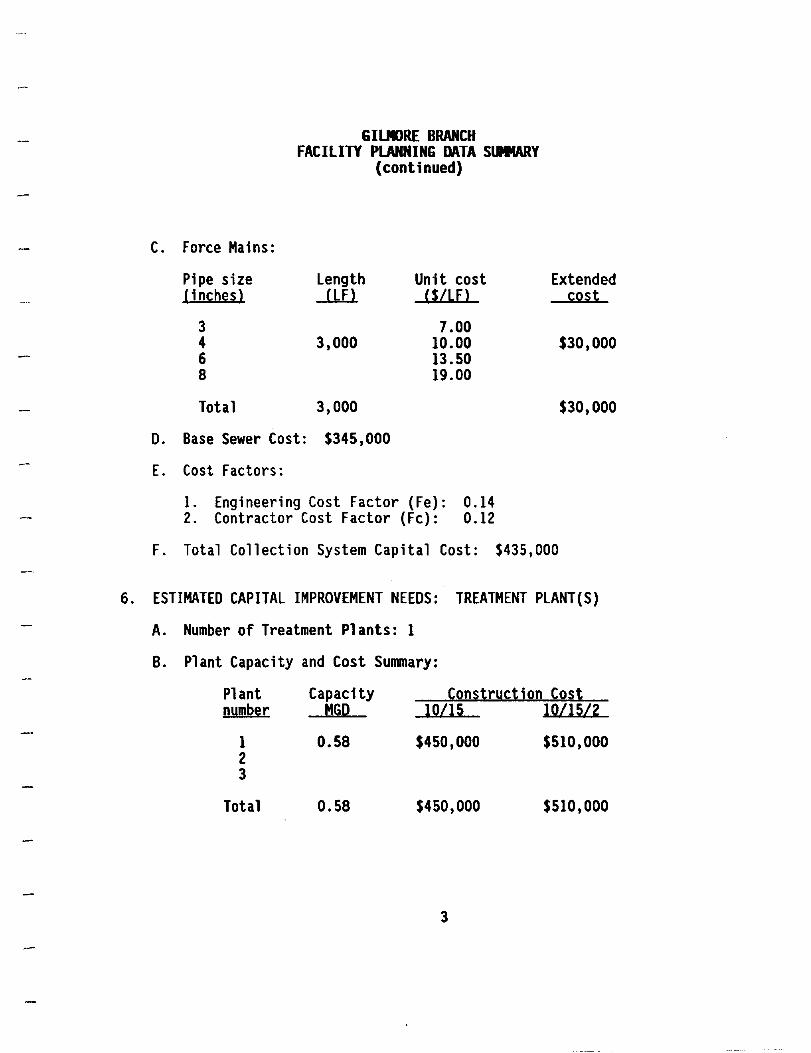
C.
D.
E.
F.
Force Mains:
Pipe size (inches)
3 4 6 8
Total
GIUIlRE BRANCH FACILITY PLANNING DATA SUMMARY
(continued)
length Unit cost (IF) (S/lF)
7.00 3,000 10.00
13.50 19.00
3,000
Base Sewer Cost: $345,000
Cost Factors:
l. Engineering Cost Factor (Fe): 0.14 2. Contractor Cost Factor (Fc): 0.12
Extended cost
$30,000
$30,000
Total Collection System Capital Cost: $435,000
6. ESTIMATED CAPITAL IMPROVEMENT NEEDS: TREATMENT PlANT(S)
A. Number of Treatment Plants: 1
B. Plant Capacity and Cost Summary:
Plant number
1 2 3
Total
Capacity MGD
0.58
0.58
Constryction Cost 10115 10/15/2
$450,000 $510,000
$450,000 $510,000
3

GIUIJRE BRANCH FACILITY PlANNING DATA SUMMARY
(continued)
7. ESTIMATED LAND NEEDS
Description
Land required (acres)
Pipeline right-of-way Plant site 5
Total Land Cost
8. TOTAL SYSTEM CAPITAL COST
Treatment level
10/10 10/15/2
Total cost
$ 985,000 $1,045,000
9. ANNUALIZED CAPITAL COSTS
Treatment level
10/15 10/15/2
Annual debt service cost
$ 76,000 $ 78,000
Cost per acre
$20,000
Extended cost
$100,000
$100,000
Annual capital costs based on ~ percent interest over a ZQ-year term.
10. ANNUAL COLLECTION SYSTEM O&M COST: $39,000 (total linear feet gravity sewers + force mains X $.59/1inear foot) + (lift station (3) total .028 MGD)
4
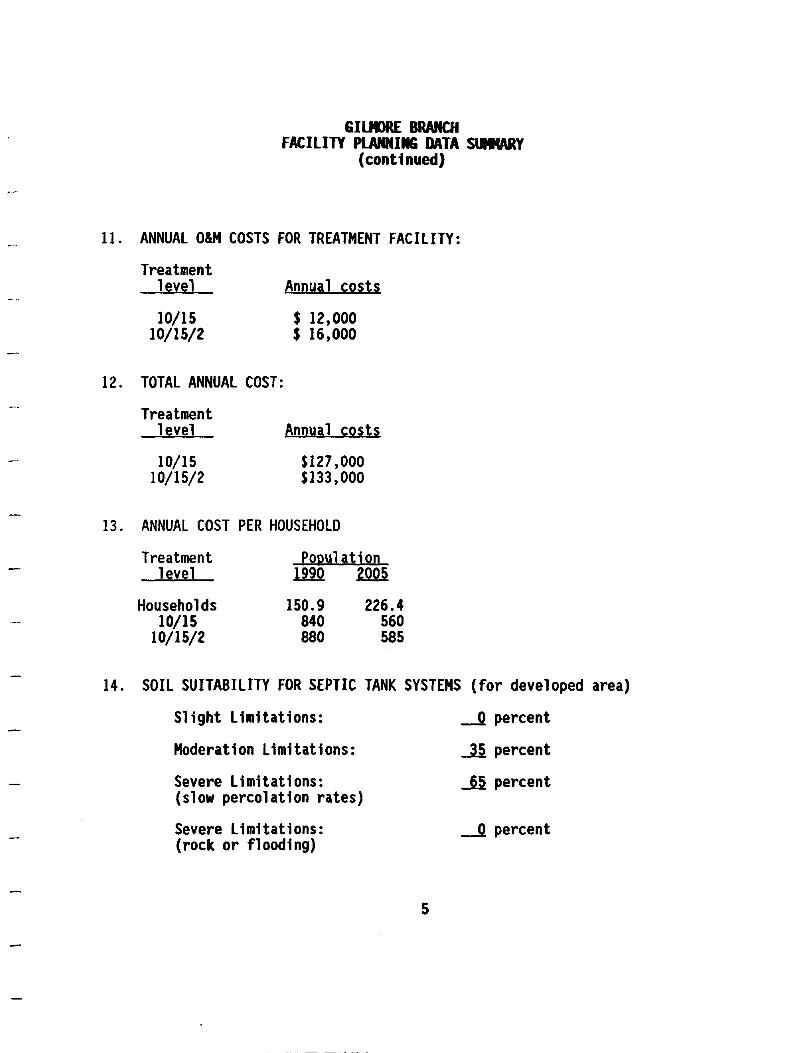
GIlIIlRE BRANCH FACILITY PLANNING DATA $lIIWly
(continued)
11. ANNUAL O&M COSTS FOR TREATMENT FACILITY:
12.
13.
Treatment level
10/15 10/15/2
TOTAL ANNUAL COST:
Treatment level
10/15 10/15/2
Annual costs
$ 12,000 $ 16,000
Annyal costs
SI27,000 $133,000
ANNUAL COST PER HOUSEHOLD
Treatment PonylatjoD level 1m W}
Households 150.9 226.4 10/15 840 560
10/15/2 880 585
14. SOIL SUITABILITY FOR SEPTIC TANK SYSTEMS (for developed area)
Slight Limitations:
Moderation Limitations:
Severe Limitations: (slow percolation rates)
Severe Limitations: (rock or flooding)
- -~-~-----------
---.Q percent
-.ll percent
~ percent
---.Q percent
5
GIIJI)R£ BRANCH FACILITY PLANNING DATA stIIU\Ry
(continued)
15. LOT SIZE RESTRICTION SUMMARY
16. SEPTIC TANK REGULATIONS
17. COMMENTS
6

BOAT CLUB FPA FACILITY PLANNING DATA SlIIIARY
1. PLANNING AREA BOUNDARY:
Dosier Creek Subbasins 1 and 2 Subdivisions: Ambrose Eagle Nest Estates, Seville, Burgess Land, Corky Court, Crest Point, Marina Cove, Tranquil Acres, West Fork Addition
2. NUMBER OF SERVICE AREAS: 10
3. SIZE AND POPULATION SUMMARY:
4.
Service Area
A B C D E F G H
TOTAL
Service Area size (acres)
In City Rural
DISCHARGE SUMMARY:
Permit Flow BOD conditions 1MW llb/day)
10/15 .075 6 10/15/2 .075 6
Population In City Rural
1Ml ~ 1MZ 2005
TSS AnInonia Clb/day) Ob/day)
9 9 9 1
75 65 30 50 10 15 75 65
385
145 125 60 95 20 35
145 125
750
Note: All figures given above reflect average daily values assuming full development of planning area.

5.
BOAT CLUB FPA FACILITY PLANNING DATA stIIWlY
(continued)
ESTIMATED CAPITAL IMPROVEMENT NEEDS: COLLECTION SYSTEM
A. Gravity Collection System:
Pipe size length Unit cost Extended (inches) (If) CS/lf) cost
6 40,200 20 $804,000 8 25 10 30 12 34 15 42 18 49 21 56 24 63
Total 40,200 NIA $804,000
B. Lift Stations:
2005 Capacity Lift population required
Station served (MGPl Cost
1 145 .015 $ 25,000 2 125 .013 $ 25,000 3 60 .006 $ 25,000 4 95 .010 $ 25,000 5 20 .002 $ 25,000 6 35 .004 $ 25,000 7 145 .015 $ 25,000 8 125 .013 $ 25,000
Total Cost $200,000
2

C.
D.
E.
F.
Force Mains:
Pipe size Cinches)
3 4 6 8
Total
BOAT CLUB FPA FACILITY PLANNING DATA SlIIWlY
(continued)
length Unit cost ..illl nILE)
16,000 10.00
16,000
Base Sewer Cost: $1,164,000
Cost Factors:
1. Engineering Cost Factor (Fe): 0.095 2. Contractor Cost Factor (Fc): 0.095
Extended cost
$160,000
$160,000
Total Collection System Capital Cost: $1,385,000
6. ESTIMATED CAPITAL IMPROVEMENT NEEDS: TREATMENT PlANT(S)
A. Number of Treatment Plants: 1
B. Plant Capacity and Cost Summary:
Plant nymber
1 2 3
Total
Capacity MGD
.075
Construction Cost 10115 10/15/2
$540,000 $600,000
$540,000 $600,000
3
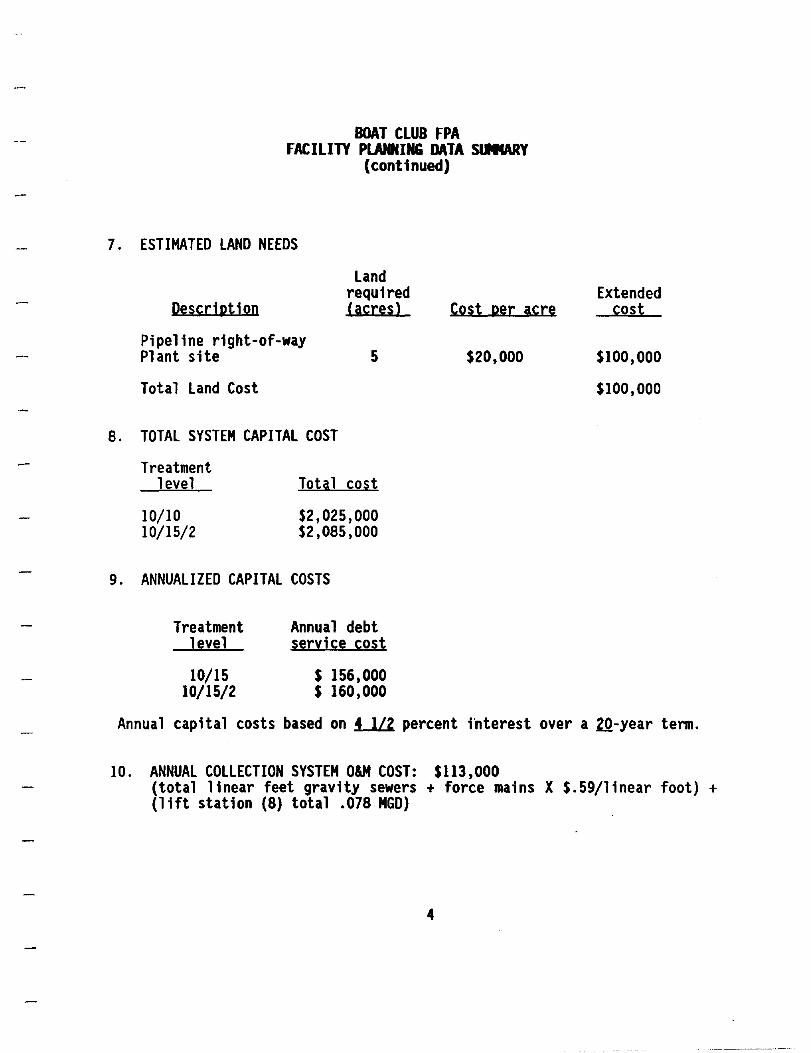
BOAT CLUB FPA FACILITY PLANNING DATA SIIIWlY
(continued)
7. ESTIMATED LAND NEEDS
Description
Land required (acres)
Pipeline right-of-way Plant site 5
Total Land Cost
8. TOTAL SYSTEM CAPITAL COST
Treatment level
10/10 10/15/2
Total cost
$2,025,000 $2,085,000
9. ANNUALIZED CAPITAL COSTS
Treatment level
10/15 10/15/2
Annual debt service cost
$ 156,000 $ 160,000
Cost per acre
$20,000
Extended cost
$100,000
$100,000
Annual capital costs based on ua percent fnterest over a ZQ-year tenn.
10. ANNUAL COLLECTION SYSTEM OlM COST: $113,000 (total linear feet gravity sewers + force mains X $.59/1inear foot) + (lift station (8) total .078 MGD)
4

BOAT CLUB FPA FACILITY PLANNING DATA SlIIIARY
(continued)
11. ANNUAL O&M COSTS FOR TREATMENT FACILITY:
12.
13.
Treatment level
10/15 10/15/2
TOTAL ANNUAL COST:
Treatment level
10/15 10/15/2
Annyal costs
$ 12,000 $ 16,000
Annyal costs
$281,000 $289,000
ANNUAL COST PER HOUSEHOLD
Treatment PQllylSltion level ll2Q Zill
Households 175.5 295.3 10/15 1600 950
10/15/2 1645 980
14. SOIL SUITABILITY FOR SEPTIC TANK SYSTEMS (for developed area)
Slight Limitations:
Moderation Limitations:
Severe Limitations: (slow percolation rates)
Severe Limitations: (rock or flooding)
5
~ percent
~ percent
J percent
~ percent

BOAT CLUB FPA FACILITY PLANNING DATA StIIIARY
(continued)
15. LOT SIZE RESTRICTION SUMMARY
16. SEPTIC TANK REGULATIONS
17. COMMENTS
6
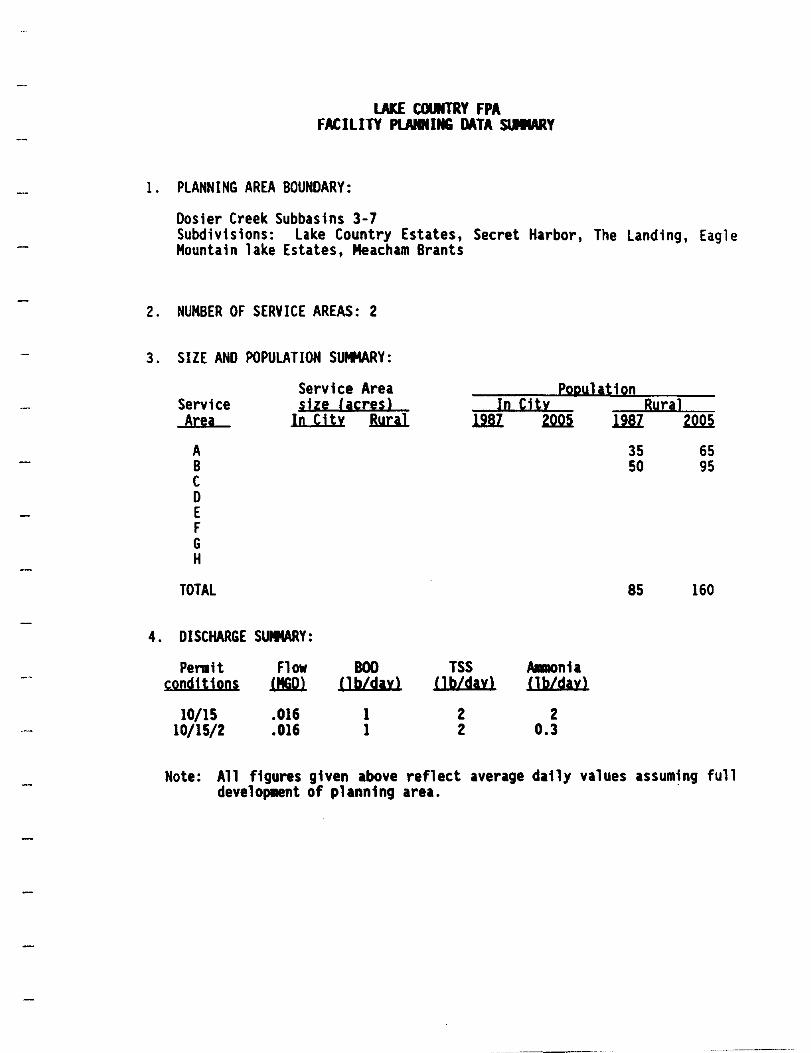
LAKE COUNTRY FPA FACILITY PlANNING DATA SlIIIARY
1. PLANNING AREA BOUNDARY:
Dosier Creek Subbasins 3-7 Subdivisions: Lake Country Estates, Secret Harbor, The Landing, Eagle Mountain lake Estates, Meacham Brants
2. NUMBER OF SERVICE AREAS: 2
3. SIZE AND POPULATION SUfl4ARY:
4.
Service Area
A B C D E F G H
TOTAL
Service Area size (acres)
In City BYrJl
DISCHARGE SUMMARY:
Permit Flow BOD cond1tions .U!iW. Ob/dav)
10115 .016 1 10/15/2 .016 1
PODylation In City Rural
1m ~ 1m ~
TSS ~nia Ob/dayl Clb/day)
2 2 2 0.3
35 50
85
65 95
160
Note: All figures given above reflect average daily values assuming full developaent of planning area.

5.
LAKE COUNTRY FPA FACILITY PLANNING DATA SlIIIARY
(continued)
ESTIMATED CAPITAL IMPROVEMENT NEEDS: COLLECTION SYSTEM
A. Gravity Collection System:
Pipe size Length Unit cost Extended (inches) (LFl U/LE) cost
6 5,500 20 $110,000 8 25 10 30 12 34 15 42 18 49 21 56 24 63
Total 5,500 N/A $110,000
B. li ft Stat ions:
2005 Capacity Lift population required
Station served (MGD) Cost
1 65 .007 $25,000 2 3 4 5
Total Cost $25,000
2

C. Force Mains:
Pipe size Cinches)
3 4 6 8
Total
LAKE COUNTRY FPA FACILITY PLANNING DATA SlIIWlY
(continued)
Length .J.ill
500
500
Unit cost (S/LFl
7.00 10.00 13.50 19.00
D. Base Sewer Cost: $140,000
E. Cost Factors:
1. Engineering Cost Factor (Fe): 0.018 2. Contractor Cost Factor (Fc): 0.015
Extended cost
$5,000
$5,000
F. Total Collection System Capital Cost: $186,000
6. ESTIMATED CAPITAL IMPROVEMENT NEEDS: TREATMENT PLANT(S)
A. Number of Treatment Plants: 1
B. Plant Capacity and Cost Summary:
Plant nymber
1 2 3
Total
Capacity MGO
.016
Construction Cost 10115 10/15/2
$160,000 $170,000
$160,000 $170,000
3

LAKE COUNTRY FPA FACILITY PlANNING DATA SlIIIARY
(continued)
7. ESTIMATED LAND NEEDS
Description
Pipeline right-of-way Plant site
Land required (acres)
5
Total Land Cost
8. TOTAL SYSTEM CAPITAL COST
Treatment level
10/10 10/15/2
Total cost
$446,000 $456,000
9. ANNUALIZED CAPITAL COSTS
Treatment level
10/15 10/15/2
Annual debt seryj ce cost
S 34,000 S 35,000
Cost per acre
S20,OOO
Extended cost
S100,OOO
$100,000
Annual capital costs based on ~ percent interest over a ZQ-year term.
10. ANNUAL COLLECTION SYSTEM OlM COST: S14,OOO {total linear feet gravity sewers + force mains X S.59/1inear foot} + (lift station - .007 MGD - SI0,OOO)
4
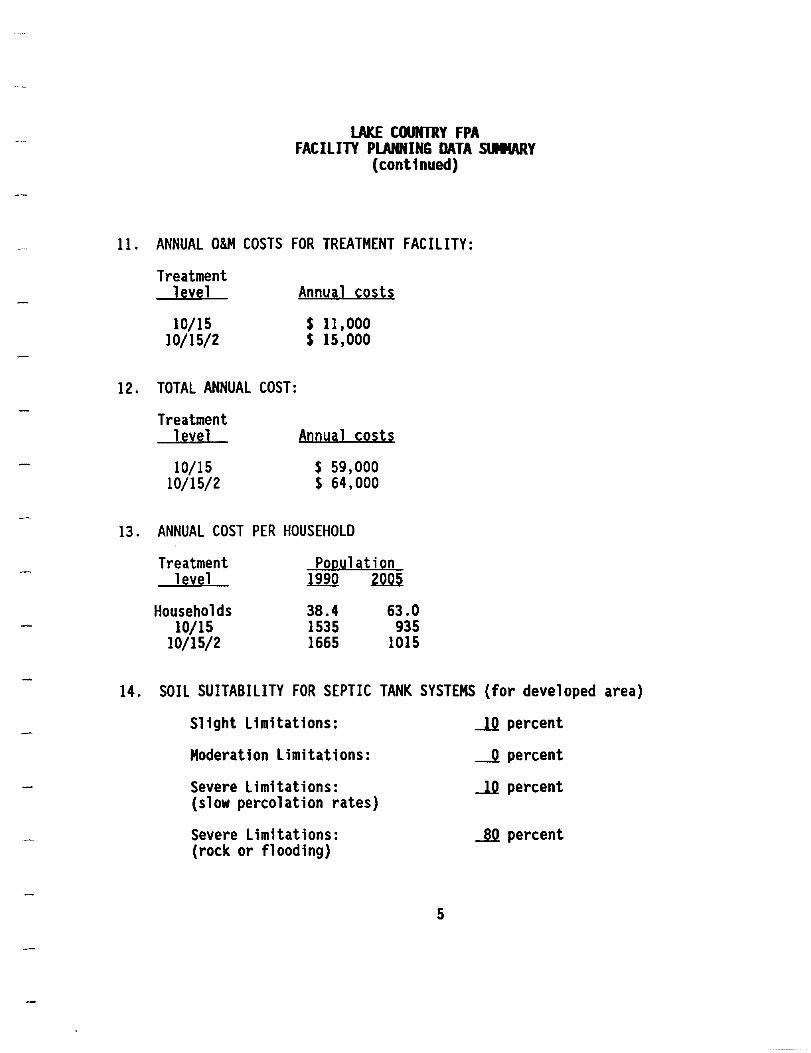
II.
12.
13.
LAKE COUNTRY FPA FACILITY PLANNING DATA SUMMARY
(continued)
ANNUAL O&M COSTS FOR TREATMENT FACILITY:
Treatment level Annyal costs
10/15 $ 11,000 10/15/2 $ 15,000
TOTAL ANNUAL COST:
Treatment level Annyal costs
10/15 $ 59,000 10/15/2 $ 64,000
ANNUAL COST PER HOUSEHOLD
Treatment level
Households 10/15
10/15/2
Population ll.2Q ~
38.4 1535 1665
63.0 935
1015
14. SOIL SUITABILITY FOR SEPTIC TANK SYSTEMS {for developed area}
Slight Limitations:
Moderation limitations:
Severe Limitations: {slow percolation rates}
Severe Limitations: {rock or flooding}
5
...lQ percent
--2 percent
...lQ percent
~ percent
LAKE COUNTRY FPA FACILITY PLANNING DATA SlIIIARY
(continued)
15. LOT SIZE RESTRICTION SUMMARY
16. SEPTIC TANK REGULATIONS
17. COMMENTS
6

ASH CREEK SUBREGIONAl SYSTEM NO. 1 FACILITY PlANNING DATA SlIIIARY
1. PLANNING AREA BOUNDARY:
Entire Ash Creek FPA
2. NUMBER OF SERVICE AREAS: 3
3. SIZE AND POPULATION SUMMARY:
Popylation In Cjty Ryral Service
Area
Service Area size (acres)
In City Rural 1.ru ~ 1m ZQQ}
4.
A B C o E F G H
TOTAL
DISCHARGE SUMMARY:
Permit Flow conditions .£Mrull
10/15 .188 10/15/2 .188
BOD Clb/day)
47 16
TSS Ob/day)
47 24
AnIIIonia llb/day)
24 3
310 165 647
1122
520 280
1075
1875
Note: All figures given above reflect average daily values assuming full development of planning area.

5.
ASH CREEK SUBREGIONAl SYSTEM NO. 1 FACILITY PLANNING DATA StlltARy
ESTIMATED CAPITAL IMPROVEMENT NEEDS: COLLECTION SYSTEM
A. Gravity Collection System:
Pipe size Length Unit cost Extended System Cinches) (LF) (S/Lf) cost
6 9,000 20 $ 180,000 8 9,000 25 $ 225,000 10 30 12 34 15 42
1 22,500 $ 450,000 2 15,000 $ 300,000 3 20,000 $ 400,000
Total 75,500 N/A $1,555,000
B. Lift Stations: None
2005 Capacity lift population required
Station served (MGO) Cost
1 2 3 4 5
C. Force Mains: None
Pipe size length Unit cost Extended (inches) -1lli (SILO cost
3 7.00 4 10.00 6 13.50 8 19.00 Total
D. Base Sewer Cost: $1,555,000
2
j
j
j
j
j
j
j
j
j
j
j
j ~---l
j
j
j
j
j
j
j
j
j
j
j
j
j
I

ASH CREEK SUBREGIONAL SYSTEM flO. 1 FACILITY PUUDUHG DATA StIIIARY
E. Cost Factors:
1. Engineering Cost Factor (Fe): .085 2. Contractor Cost Factor (Fc): .090
F. Total Collection System Capital Cost: $1,827,000
6. ESTIMATED CAPITAL IMPROVEMENT NEEDS: TREATMENT PlANT(S)
7.
8.
A. Number of Treatment Plants: 1
B. Plant Capacity and Cost Summary:
Plant number
1 2 3
Total
Capacity MGO
.188
.188
ESTIMATED LAND NEEDS
Land
Construction Cost 10115 10/15/2
$1,050,000 $1,350,000
$1,050,000 $1 ,350,000
required Description (acres)
Pipeline right-of-way 5 Plant site
TOTAL SYSTEM CAPITAL COST
Treatment level
10/10 10/15/2
Iotal cost
$2,977,000 $3,277,000
Cost·per acre
$20,000
3
Extended cost
$100,000

ASH CREEK SUBREGIONAL SYSTEM NO. 1 FACILITY PLANNING DATA SlIIIARY
9. ANNUALIZED CAPITAL COSTS
Treatment leyel
10/15 10/15/2
Annual debt service cost
$ 229,000 $ 252,000
Annual capital costs based on ~ percent interest over a ZQ-year term.
10. ANNUAL COLLECTION SYSTEM O&M COST: $45,000 (total linear feet gravity sewers + force mains) X $.59/linear foot
11. ANNUAL O&M COSTS FOR TREATMENT FACILITY:
Treatment level
10/15 10/15/2
12. TOTAL ANNUAL COST:
Treatment level
10/15 10/15/2
Annyal costs
$25,000 $30,000
Annyal costs
$299,000 $327,000
4

ASH CREEK SUBREGIONAL SYSTEII NO. 2 FACILITY PLANNING DATA SUMMARY
1. PLANNING AREA BOUNDARY:
Azle FPA and Ash Creek FPA 1. Q ... 053 MGD 2. Q ... 028 MGD 3. Q - .110 MGD
Azle Ash Creek STP, Q •. 84 MGD (Qavail - .704) Qdesign •. 136 Plant Design Q •. 327 MGD
2. NUMBER OF SERVICE AREAS: 4
3. SIZE AND POPULATION SUMMARY:
Service Area
A B C o E F G H
TOTAL
Service Area size (acres)
In City Rural
*Additional for Azle
4. DISCHARGE SUMMARY: Additional exist Qrotal - .327 + .704 - 1.031
Permit Flow BOD conditjons .LMruU Ob/day)
10/15 1.031 86 10/15/2 1.031 86
Population In City Rural
mz. 2005 1987 2005
o
o
TSS Ob/dav)
129 129
1395
310 165 647
520 280
1075
1395 1122 1875 1987 - 1122, Q-.112 2005 - 3270, Q-.327
Alm\onia (lb/day)
129 17
Note: All figures given above reflect average daily values assuming full development of planning area.

5.
ASH CREEK SUBREGIONAL SYSTEM NO. 2 FACILITY PLANNING DATA SlIIV\RY
ESTIMATED CAPITAL IMPROVEMENT NEEDS: COllECTION SYSTEM
A. Gravity Collection System:
Pipe size length Unit cost Extended (j nches) (If) U/lE) cost
6 9,000 20 $180,000 8 9,000 25 $225,000 10 4,000 30 $120,000 12 34 15 42 18 49 21 56 24 63
Total 22,000 N/A $525,000
B. Li ft Stations: None
2005 Capacity Lift population required
Station served (MGD) Cost
1 2 3 4 5
C. Force Mains: None
Pipe size length Unit cost Extended (inches) -1lli ($/lFl cost
3 7.00 4 10.00 6 13.50 8 19.00 Total
2
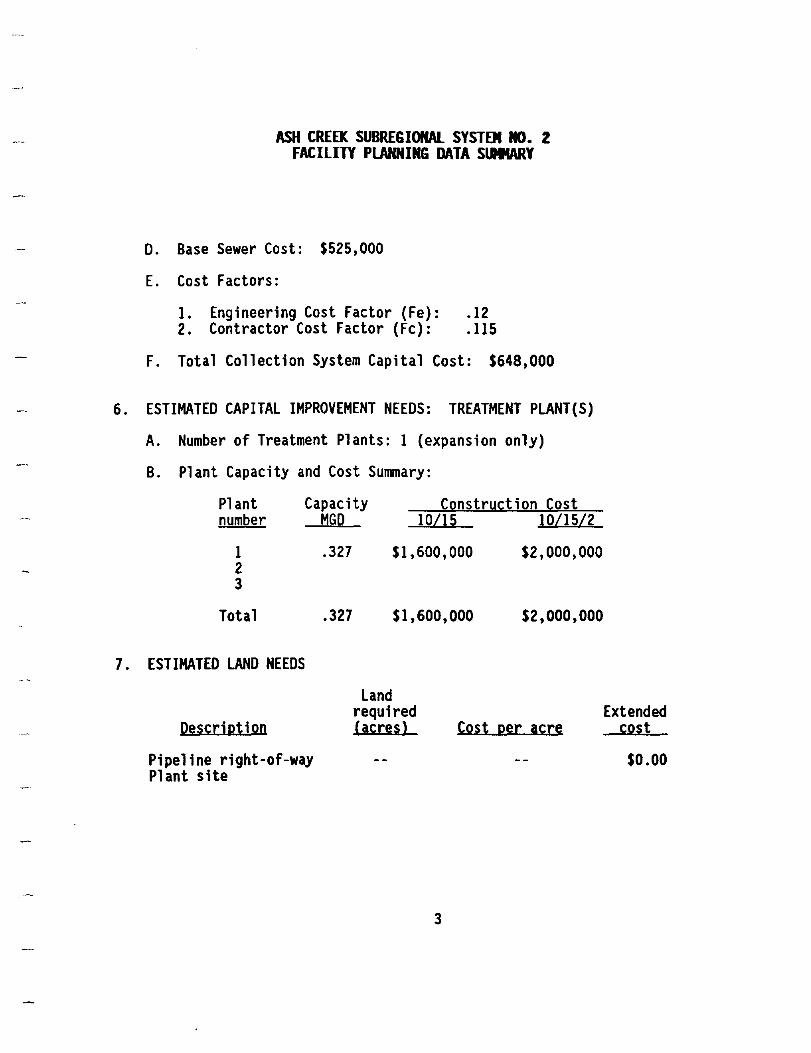
ASH CREEK SUBREGIONAL SYSTEM NO. 2 FACILITY PLANNING DATA SlIIIARY
D. Base Sewer Cost: $525,000
E. Cost Factors:
1. Engineering Cost Factor (Fe): .12 2. Contractor Cost Factor (Fc): .115
F. Total Collection System Capital Cost: $648,000
6. ESTIMATED CAPITAL IMPROVEMENT NEEDS: TREATMENT PLANT(S)
7.
A. Number of Treatment Plants: 1 (expansion only)
B. Plant Capacity and Cost Summary:
Plant Capacity Constryction Cost number
1 2 3
Total
ESTIMATED LAND NEEDS
Description
Pipeline right-of-way Plant site
MGD
.327
.327
10115 10115/2
$1,600,000 $2,000,000
$1,600,000 $2,000,000
Land required (acres) Cost per acre
3
Extended cost
$0.00

ASH CREEK SUBREGIONAL SYSTEM NO. 2 FACILITY PlANNING DATA SUMMARY
8. TOTAL SYSTEM CAPITAL COST
Treatment level
10/10 10/15/2
Total cost
$2,248,000 $2,648,000
9. ANNUALIZED CAPITAL COSTS
Treatment level
10/15 10/15/2
Annual debt service cost
$173,000 $204,000
Annual capital costs based on ~ percent interest over a 20-year term.
10. ANNUAL COLLECTION SYSTEM O&H COST: $13,000 (total linear feet gravity sewers + force mains) X $.59/linear foot
11. ANNUAL O&H COSTS FOR TREATMENT FACILITY:
Treatment level
10/15 10/15/2
12. TOTAL ANNUAL COST:
Treatment level
10/15 10/15/2
Annyal costs
$43,000 $56,000
Annyal costs
$229,000 $273,000
4
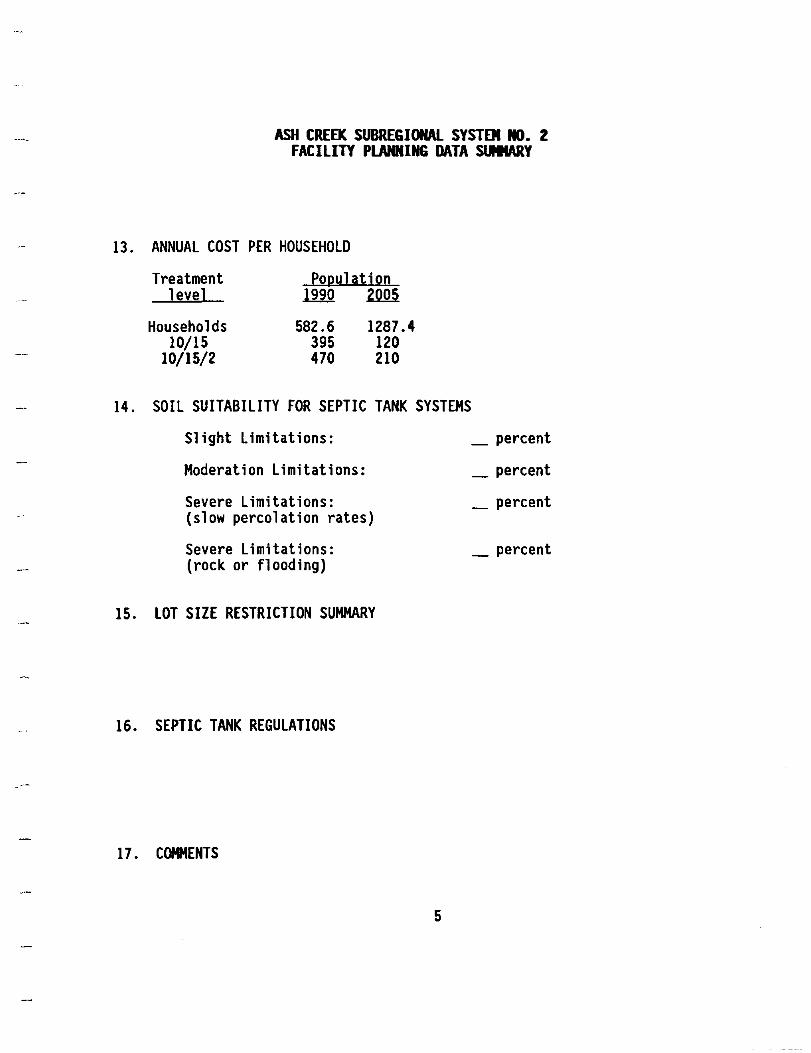
ASH CREEK SUBREGIONAL SYSTEM NO. 2 FACILITY PLANNING DATA SUMMARY
13. ANNUAL COST PER HOUSEHOLD
Treatment level
Households 10/15
10/15/2
PODylation ill.Q ~
582.6 395 470
1287.4 120 210
14. SOIL SUITABILITY FOR SEPTIC TANK SYSTEMS
Slight Limitations:
Moderation Limitations:
Severe Limitations: {slow percolation rates}
Severe Limitations: {rock or flooding}
15. LOT SIZE RESTRICTION SUMMARY
16. SEPTIC TANK REGULATIONS
17. COMMENTS
5
_ percent
_ percent
_ percent
_ percent

WALNUT CREEK SUBREGIONAl SYSTEM NO. 1 TOWN OF RENO
FACILITY PLANNING DATA SIIIMARY
1. PLANNING AREA BOUNDARY:
2.
3.
4.
Walnut Creek Basin in Reno Subdivisions: Midway, Oak Valley, Highlands Addition, H&H Investments Addition, Country Acres, La Junta Addition, Reno North Walnut Creek Ranch, Walnut Creek Estates
NUMBER OF SERVICE AREAS: 7
SIZE AND POPULATION SUMMARY:
Service Area Service size (acres) Area In Citv Rural
A B C D E F G H
TOTAL
DISCHARGE SUMMARY:
Permit Flow BOD conditions !MW Ob/day)
10/15 1.301 25 10/15/2 1.301 25
eQ~yl~tio!] I!] tity
.1.2!!l
45 40
730 340
1,155
TSS Ob/dayl
38 38
ZQ92
100 90
1610 750
2,550
Anlnonia (lb/day)
38 5
1987
120 60 30
210
Rural 2005
262 130 65
460
Note: All figures given above reflect average daily values assuming full development of planning area.

C.
D.
E.
F.
WALNUT CREEK SUBREGIONAL SYSTEM NO. 1 TOWN OF RENO
FACILITY PLANNING DATA SlIIWlY
Force Mains:
Pipe size Length Unit cost Extended Unchesl .J.lli ($/LFl cost
3 8,000 10.00 $80,000 4 6 8
Total $80,000
Base Sewer Cost: $3,703,000
Cost Factors:
1. Engineering Cost Factor (Fe): .067 2. Contractor Cost Factor (Fc): .08
Total Collection System Capital Cost: $4,247,000
6. ESTIMATED CAPITAL IMPROVEMENT NEEDS: TREATMENT PlANT(S)
A. Number of Treatment Plants: 1
B. Plant Capac1ty and Cost Summary:
Plant number
1 2 3
Total
Capac1ty MGD
.301
Construct1on Cost 10115 10/15/2
$1,500,000 $1,800,000
$1,500,000 $1,800,000
3

WALNUT CREEK SUBREGIONAL SYSTEM NO. I TOWN OF RENO
FACILITY PLANNING DATA stIIIARY
7. ESTIMATED LAND NEEDS
DescriptiQn
Land required (acres)
Pipeline right-Qf-way Plant site
5
TQtal land CQst
8. TOTAL SYSTEM CAPITAL COST
Treatment level
10/10 10/15/2
TQtal CQst
$5,847,000 $6,147,000
9. ANNUALIZED CAPITAL COSTS
Treatment level
10/15 10/15/2
Annual debt service CQst
$450,000 $473,000
CQst per acre
$20,000
Extended CQst
$100,000
$100,000
Annual capital CQsts based Qn ~ percent interest Qver a ZQ-year term.
10. ANNUAL COLLECTION SYSTEM O&M COST: $154,000 (tQtal linear feet gravity sewers + fQrce mains X $.59/linear fQQt) + (Lift statiQns (5) .267 MGD)
4
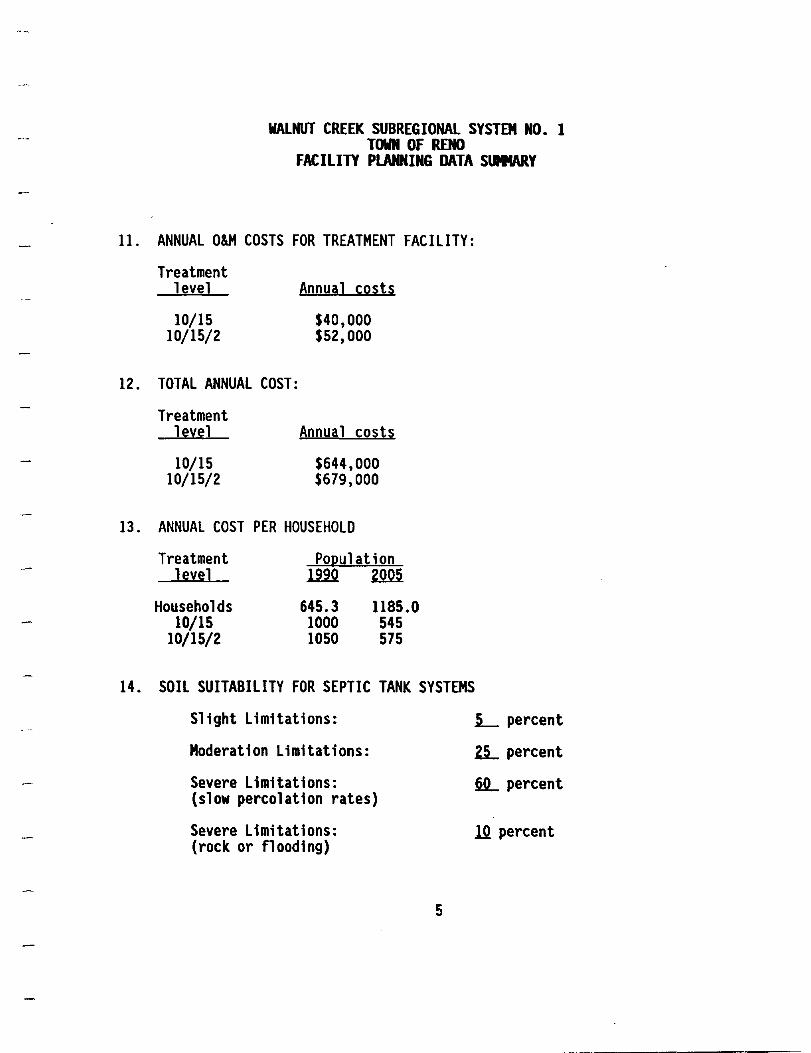
11.
12.
13.
14.
WALNUT CREEK SUBREGIONAL SYSTEM NO. 1 TOWN OF RENO
FACILITY PLANNING DATA SlIW\RY
ANNUAL O&M COSTS FOR TREATMENT FACILITY:
Treatment level Annyal costs
10/15 $40,000 10/15/2 $52,000
TOTAL ANNUAL COST:
Treatment level Annual costs
10/15 $644,000 10/15/2 $679,000
ANNUAL COST PER HOUSEHOLD
Treatment PQRylation level lli2 2ill
Households 645.3 1185.0 10/15 1000 545
10/15/2 1050 575
SOIL SUITABILITY FOR SEPTIC TANK SYSTEMS
Slight limitations:
Moderation Limitations:
Severe Limitations: (slow percolation rates)
Severe Limitations: (rock or flooding)
5
L percent
Z..L percent
22- percent
12 percent

WALNUT CREEK SUBREGIONAL SYSTEM NO. 1 TOWN OF RENO
FACILITY PlANNING DATA SUMMARY
15. LOT SIZE RESTRICTION SUMMARY
16. SEPTIC TANK REGULATIONS
17. COMMENTS
6

WALNUT CREEK SUBREGIONAL SYSTEM No. 2 FACILITY PlANNING DATA SlIIIARY
1. PLANNING AREA BOUNDARY:
Azle FPA and Reno FPA Reno FPA:
Q •. 121 MGD, system No.2 Q = .18 MGD, system No.1
Azle Ash Creek STP, Q - .21 MGD (Qavail - .176) Qdesign = .034 Plant Design Q = .335 MGD
2. NUMBER OF SERVICE AREAS: 3
3.
4.
SIZE AND POPULATION SUMMARY:
Service Area Service ~iz~ (acres) Area In Cih Rural
Reno System 2 Reno System 1 Addtl for Azle
TOTAL
DISCHARGE SUMMARY:
Permit Flow BOD conditions 1Mrull llb/day)
10/15 .511 43 10/15/2 .511 43
POllylatiQn In Cit:r: Rural
1987
340 815
0
1155
TSS Ob/da:r:)
64 64
2005 1987 2005
750 210 460 1800 340
2890 210 460
1987 • 1365, Q-.1365 2005 - 3350, Q-.335
Alllnonia (lb/dn)
64 9
Note: All figures given above reflect average daily values assuming full development of planning area.

5.
WALNUT CREEK SUBREGIONAL SYSTEM No. 2 FACILITY PlANNING DATA S\IItARy
ESTIMATED CAPITAL IMPROVEMENT NEEDS: COLLECTION SYSTEM
A. Gravity Collection System:
Pipe size Length Unit cost Extended (jnches) (IF) U/lFl cost
6 20 8 11 ,000 25 $275,000 10 (7,500) 30 $ 37,500 (change from 8") 12 3,000 34 102,000 15 42 18 49 21 56 24 63
Total 14,000 N/A $414,500
B. li ft Stations: None
2005 Capacity lift population required
Station served (MGD) Cost
1 2 3 4 5
C. Force Mains: None
Pipe size Length Unit cost Extended (inches) -1lli (S/Lfl cost
3 7.00 4 10.00 6 13.50 8 19.00 Total
D. Base Sewer Cost: $415,000
2
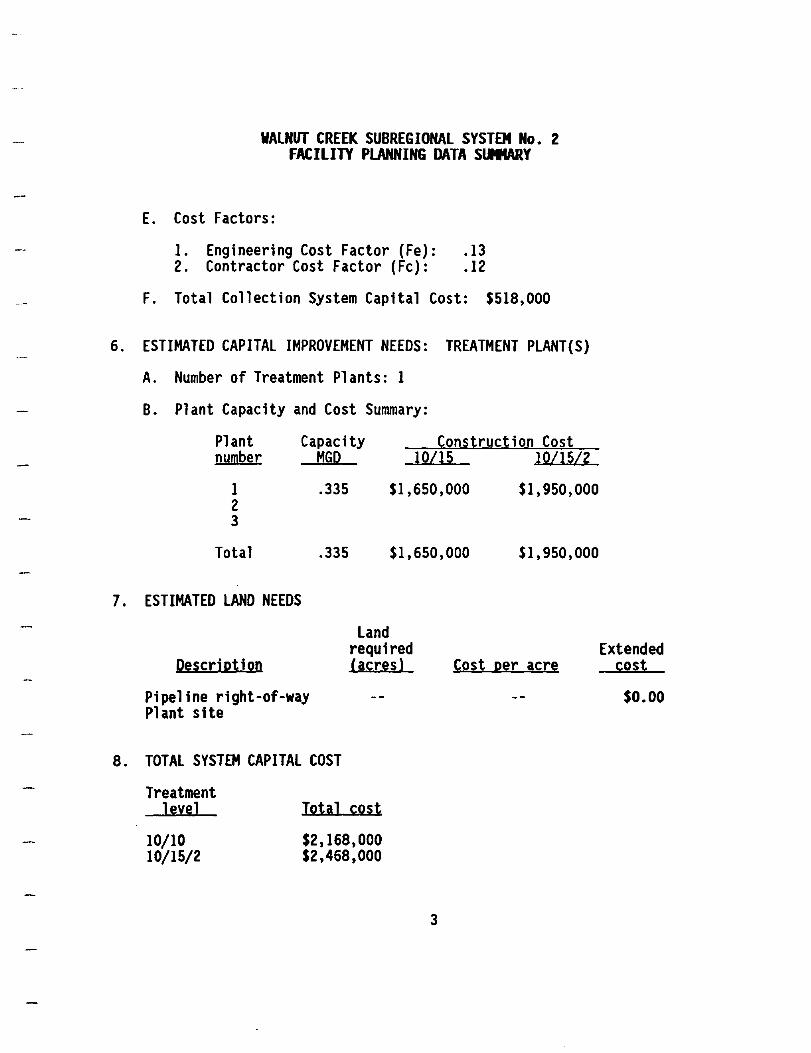
WALNUT CREEK SUBREGIONAL SYSTEM No. 2 FACILITY PLANNING DATA SlIIIARY
E. Cost Factors:
1. Engineering Cost Factor (Fe): .13 2. Contractor Cost Factor (Fc): .12
F. Total Collection System Capital Cost: $518,000
6. ESTIMATED CAPITAL IMPROVEMENT NEEDS: TREATMENT PLANT(S)
A. Number of Treatment Plants: 1
B. Plant Capacity and Cost Summary:
Plant number
Capacity MGD
Construction Cost lOllS 10/15/2
1 2 3
.335 $1,650,000 $1,950,000
Total .335 $1,650,000 $1,950,000
7. ESTIMATED LAND NEEDS
Descri ptj on
Land required (acres)
Pipeline right-of-way Plant site
8. TOTAL SYSTEM CAPITAL COST
Treatment level
10/10 10/15/2
Total cost
$2,168,000 $2,468,000
Cost per acre
3
Extended cost
$0.00

WALNUT CREEK SUBREGIONAL SYSTEM No. 2 FACILITY PlANNING DATA SUMMARY
9. ANNUALIZED CAPITAL COSTS
Treatment level
10/15 10/15/2
Annual debt service CQst
$167,000 $190,000
Annual capital CQsts based Qn ~ percent interest over a lQ-year term.
10. ANNUAL COLLECTION SYSTEM O&M COST: $8,000 (tQtal linear feet gravity sewers + fQrce mains) X $.59/linear fQQt
11. ANNUAL O&M COSTS FOR TREATMENT FACILITY:
Treatment level
10/15 10/15/2
12. TOTAL ANNUAL COST:
Treatment level
10/15 10/15/2
Annual CQsts
$42,000 $58,000
Annual costs
$217 ,000 $256,000
13. ANNUAL COST PER HOUSEHOLD
Treatment level
Households 10/15
10/15/2
PopylatiQn 1m ~
667.6 325 385
1318.9 165 195
4
WALNUT CREEK SUBREGIONAl SYSTEM No. 2 FACILITY PLANNING DATA SlIItARY
14. SOIL SUITABILITY FOR SEPTIC TANK SYSTEMS
Slight Limitations:
Moderation Limitations:
Severe Limitations: (slow percolation rates)
Severe Limitations: (rock or flooding)
15. LOT SIZE RESTRICTION SUMMARY
16. SEPTIC TANK REGULATIONS
17. COMMENTS
5
_ percent
_ percent
_ percent
_ percent

SWIFT BRANCH SUBREGIONAL SYSTEJI FACILITY PLANNING DATA stIIIARY
1. PLANNING AREA BOUNDARY:
Subregional System 1. Pelican Bay FPA 2. Peden FPA 3. Swift Branch FPA
2. NUMBER OF SERVICE AREAS: 3
3. SIZE AND POPULATION SUMMARY:
4.
Service Area
Service Area size (acres)
In City RY!:li
A Pel ican Bay B Swift C Peden o E F G H
TOTAL
DISCHARGE SUMMARY:
Permit Flow BOD conditions .ilW. Clb/day)
10/15 .508 42 10/15/2 .508 42
TSS
Population In City Ryral
1987 2005 1987 ~
1300
1300
3160 240 560 430
275 930 710
3160 1230 1915 1987 - 2530. Q-.253 2005 - 5075. Q-.508
Anlnonia CJb/day) Clb/day)
64 64 64 8
Note: All figures given above reflect average daily values assuming full development of planning area.

5.
SWIFT BRANCH SUBREGIONAL SYSTEJI FACILITY PLANNING DATA stlMARY
ESTIMATED CAPITAL IMPROVEMENT NEEDS: COllECTION SYSTEM
A. Gravity Collection System:
Pipe size length Unit cost Extended Cinches) (lFl ($/lFl cost
6 20 8 2,000 25 $ 50,000 10 30 $ 62,000 12 3,000 34 15 (2,000' 18 @ 14 IF, 21 6"-12") 24
Total 3,000' for O&M N/A $112,000
B. Li ft Stations:
2005 Capacity Lift population required
Station served (MGD) Cost
1 3435 .344 $90,000 2 930 .093 $25,000 3 4 5
Total Cost $115,000
2

6.
C.
D.
E.
F.
Force Mains:
Pipe size (inches)
3 4 6 8
Total
SWIFT BRANCH SUBREGIONAL SYSTEM FACILITY PLANNING DATA SlIIIARY
Length Unit cost ..llli (S/LFl
7.00 10.00
4,500 13.50 4,500 19.00
9,000
Base Sewer Cost: $373,000
Cost Factors:
1. Engineering Cost Factor (Fe): .135 2. Contractor Cost Factor (Fc): .125
Extended cost
$ 60,750 $ 85,500
$146,000
Total Collection System Capital Cost: $470,000
ESTIMATED CAPITAL IMPROVEMENT NEEDS: TREATMENT PLANT(S)
A. Number of Treatment Plants: 1
B. Plant Capacity and Cost Summary:
Plant Capacity ~2Ds1rY~1jQn ~Q~1 number MGD 10115 10115/2
1 .508 $2,100,000 $2,600,000 2 3
Total .508 $2,100,000 $2,600,000
3

SWIFT BRANCH SUBREGIONAL SYSTEM FACILITY PLANNING DATA SlII4ARY
7. ESTIMATED LAND NEEDS
Description
Land required (acres)
Pipeline right-of-way Plant site
5
Total Land Cost
8. TOTAL SYSTEM CAPITAL COST ~
Treatment leyel
10/10 10/15/2
Total cost
$2,670,000 $3,170,000
9. ANNUALIZED CAPITAL COSTS
Treatment level
10/15 10/15/2
Annual debt service cost
$205,000 $244,000
Cost per acre
$20,000
Extended cost
$100,000
$100,000
Annual capital costs based on ~ percent interest over a ZQ-year term.
10. ANNUAL COLLECTION SYSTEM OlM COST: $29,000 (total linear feet gravity sewers + force mains X $.59/linear foot) + (Lift Station, (2) .437 MGD)
4
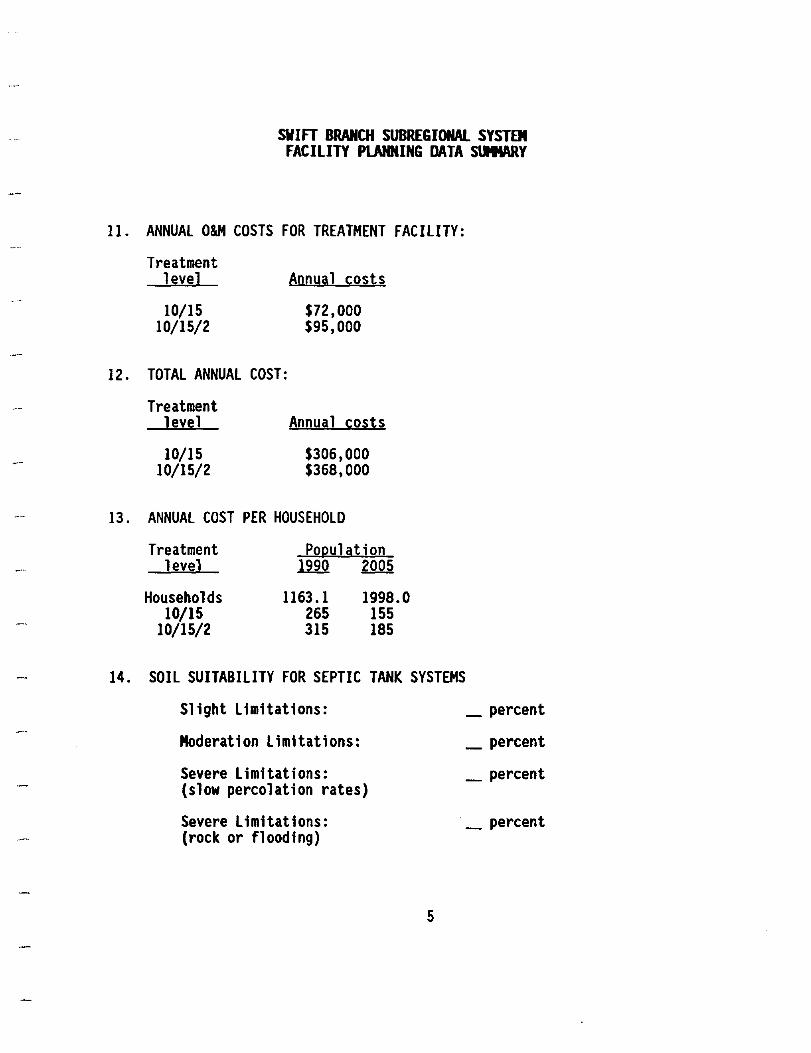
SWIFT BRANCH SUBREGIONAL SYSTEJI FACILITY PLANNING DATA SUMMARY
11. ANNUAL O&M COSTS FOR TREATMENT FACILITY:
12.
13.
Treatment level
10/15 10/15/2
Annual costs
$72,000 $95,000
TOTAL ANNUAL COST:
Treatment level Annual costs
10/15 $306,000 10/15/2 $368,000
ANNUAL COST PER HOUSEHOLD
Treatment level
Households 10/15
10/15/2
Population li2Q 2005
1163.1 265 315
1998.0 155 185
14. SOIL SUITABILITY FOR SEPTIC TANK SYSTEMS
Slight Limitations:
Moderation Limitations:
Severe Limitations: (slow percolation rates)
Severe Limitations: (rock or flooding)
5
_ percent
_ percent
_ percent
._ percent

SWIFT BRANCH SUBREGIONAL SYSTEM FACILITY PLANNING DATA SUtIUUlY
15. LOT SIZE RESTRICTION SUMMARY
16. SEPTIC TANK REGULATIONS
17. COMMENTS
6

BRIAR CREEK SUBREGIONAL SYSTEM FACILITY PLANNING DATA SlItMARy
1. PLANNING AREA BOUNDARY:
Briar Creek Drainage Basin
Subdivisions: Briar, Briarwood Estates, Eagle Mountain Acres, D. L. Marshall, Turpin, Allyndale, Cooley, Westwood Addition
2. NUMBER OF SERVICE AREAS: 8
3. SIZE AND POPULATION SUMMARY:
4.
Service Area
A B C o E F G H
TOTAL
Service Area size (acres)
In City Rura 1
DISCHARGE SUMMARY:
Permit Flow BOD conditions (MGD) Clb/dayl
10/15 .154 13 10/15/2 .154 13
TSS Clb/day)
19 19
Population In City
Anlnonia (lb/day)
19 3
125 90 65 90 65
270 105 110
920
Rural
210 150 110 ISO 110 450 175 180
1,535
Note: All figures given above reflect average daily values assuming full development of planning area.
.~-----.-.-

BRIAR CREEK SUBREGIONAL SYSTEM FACILITY PLANNING DATA StIIIARY
5. ESTIMATED CAPITAL IMPROVEMENT NEEDS: COllECTION SYSTEM
A. Gravity Collection System:
Pipe size length Unit cost Extended System (inches) (IF) (S/lFl cost
6 7,000 20 S140,000 8 25 10 30 12 34 15 42 18 49
1 40,700 56 S814,000 2 21,000 63 S420,000
Total 68,700 N/A $1,374,000
B. Lift Stations:
2005 Capacity lift population required
Station served (MGD) Cost
1 210 .021 $25,000 2 150 .015 $25,000 3 110 .Oll $25,000 4 5
Total Cost $ 75,000
C. Force Mains:
Pipe size length Unit cost Extended (inches) --1ill (S/lFl cost
3 7.00 4 5,000 10.00 $50,000 6 13.50 8 19.00
Total 5,000 S50,000
2

BRIAR CREEK SUBREGIONAL SYSTEJt FACILITY PLANNING DATA SlJIIW{Y
D. Base Sewer Cost: $1,499,000
E. Cost Factors:
1. Engineering Cost Factor (Fe): 0.088 2. Contractor Cost Factor (Fc): 0.090
F. Total Collection System Capital Cost: $1,766,000
6. ESTIMATED CAPITAL IMPROVEMENT NEEDS: TREATMENT PLANT(S)
7.
A. Number of Treatment Plants: 1
B. Plant Capacity and Cost Summary:
Plant Capacity Construction Cost number
1 2 3
Total
ESTIMATED LAND NEEDS
Description
Pipeline right-of-way Plant site
Total Land Cost
MGD
.154
.154
10115 10/1512
$900,000 $1,100,000
$900,000 $1,100,000
$2,200,000
Land required (acres) Cost per acre
5 $20,000
3
Extended cost
$100,000
$100,000

BRIAR CREEK SUBREGIONAL SYSTEM FACILITY PLANNING DATA StlMARY
8. TOTAL SYSTEM CAPITAL COST
Treatment level
10/10 10/15/2
Total cost
$2,766,000 $2,966,000
9. ANNUALIZED CAPITAL COSTS
Treatment level
10/15 10/15/2
Annual debt service cost
$ 213,000 $ 228,000
Annual capital costs based on ~ percent interest over a 2Q-year term.
10. ANNUAL COLLECTION SYSTEM O&M COST: $73,000 (total linear feet gravity sewers + force mains X $.59/1inear foot) + (lift stations (3), total .047 MGD)
11. ANNUAL O&M COSTS FOR TREATMENT FACILITY:
Treatment level
10/15 10/15/2
12. TOTAL ANNUAL COST:
Treatment level
10/15 10/15/2
Annyal costs
$ 18,000 $ 24,000
Annyal costs
$304,000 $325,000
4

TOWN OF NEWARK SUBREGIONAL SYSTEM FACILITY PlANNING DATA stIIWlY
1. PLANNING AREA BOUNDARY:
City of Newark and area in FPA outside of city
2. NUHBER OF SERVICE AREAS: 3
3. SIZE AND POPULATION SUMMARY:
Service Area size (acres)
In City Rural
Population
4.
Service Area
A B C o E F G H
TOTAL
DISCHARGE SUMMARY:
Permit Flow conditions (HGO)
10/15 .212 10/15/2 .212
BOD (1b/day)
18 18
In City Rural 1987 2005
110 155 720 1020
830 1,175 Q- .118
TSS AIIIIIonia (1 b/day) Clb/day)
27 27 27 4
Note: All figures given above reflect average daily values assuming full development of planning area.

5.
TOWN OF NEWARK SUBREGIONAL SYSTEM FACILITY PLANNING DATA SUMMARY
ESTIMATED CAPITAL IMPROVEMENT NEEDS: COLLECTION SYSTEM
A. Gravity Collection System:
Pipe size Length Unit cost Extended (inches) (LF) ($/lFl cost
6 1,000 30 $30,000 8 25 10 30 12 34 15 42 18 49 21 56 24 63
Total 1,000 NIA $30,000
B. lift Stations:
2005 Capacity lift population required
Station served (MGD) Cost
1 .102 $25,000 2 3 4 5
Total Cost $25,000
C. Force Mains:
Pipe size Length Unit cost Extended (inches) ...ill.l ($!LF> cost
3 4 3,000 $40,500 6 8
Total 3,000 $40,500
2

TOWN OF NEWARK SUBREGIONAL SYSTEM FACILITY PLANNING DATA SlIItARy
D. Base Sewer Cost: S96,000
E. Cost Factors:
1. Engineering Cost Factor (Fe): .20 2. Contractor Cost Factor (Fc): .15
F. Total Collection System Capital Cost: S129,000
6. ESTIMATED CAPITAL IMPROVEMENT NEEDS: TREATMENT PLANT(S)
7.
A. Number of Treatment Plants: 1
B. Plant Capacity and Cost Summary:
Plant Capacity Construction Cost number
1 2 3
Total
ESTIMATED LAND NEEDS
Description
Pipeline right-of-way Plant site
Total Land Cost
MGD
.118
.118
10115 1011512
S700,000 S800,000
S700,000 S800,000
Land required (acres) Cost per acre
3
Extended cost
SO.OO

TOWN OF NEWARK SUBREGIONAL SYSTEM FACILITY PLANNING DATA SlIItARy
8. TOTAL SYSTEM CAPITAL COST
Treatment level
10/10 10/15/2
Total cost
$829,000 $929,000
9. ANNUALIZED CAPITAL COSTS
Treatment level
10/15 10/15/2
Annual debt service cost
$ 64,000 $ 71 ,000
Annual capital costs based on ~ percent interest over a 20-year term.
10. ANNUAL COLLECTION SYSTEM O&M COST: $13,000
11.
12.
(total linear feet gravity sewers + force mains X $.59/1inear foot) + (lift stations (1) - total .102 MGD)
ANNUAL O&H COSTS FOR TREATMENT FACILITY:
Treatment level Annual costs
10/15 $ 14,000 10/15/2 $ 19,000
TOTAL ANNUAL COST:
Treatment level Annyal costs
10/15 $ 91,000 10/15/2 $103,000
4
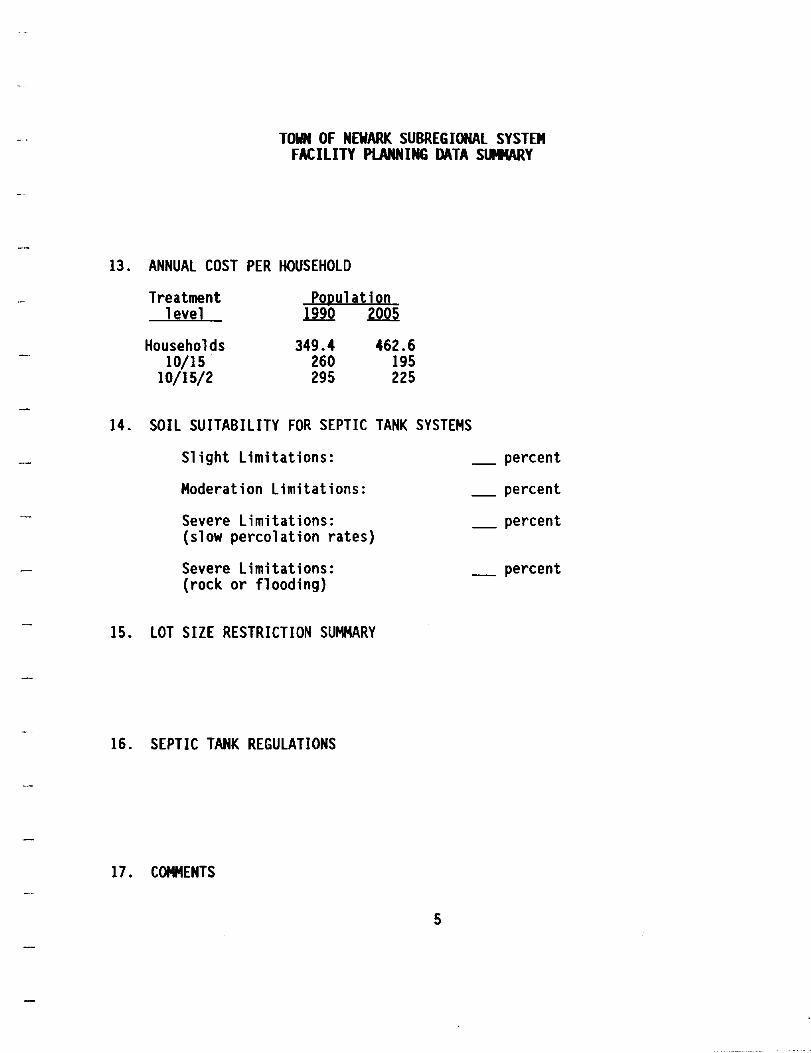
TOWN OF NEWARK SUBREGIONAL SYSTEM FACILITY PlANNING DATA SlMIARY
13. ANNUAL COST PER HOUSEHOLD
Treatment level
Households 10/15
10/15/2
Population illQ ~
349.4 260 295
462.6 195 225
14. SOIL SUITABILITY FOR SEPTIC TANK SYSTEMS
Slight Limitations:
Moderation Limitations:
Severe Limitations: (slow percolation rates)
Severe Limitations: (rock or flooding)
15. LOT SIZE RESTRICTION SUMMARY
16. SEPTIC TANK REGULATIONS
17. COMMENTS
_ percent
_ percent
_ percent
_ percent
5
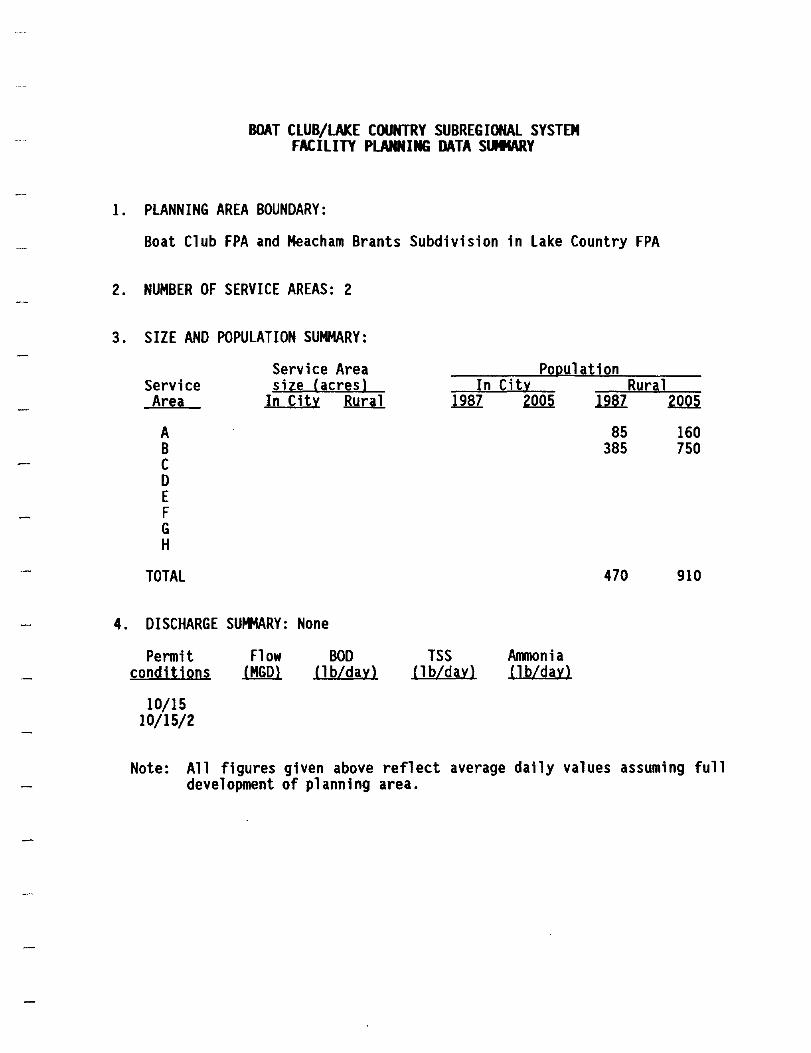
BOAT CLUB/LAKE COUNTRY SUBREGIONAL SYSTEM FACILITY PlANNING DATA SlIItARY
1. PLANNING AREA BOUNDARY:
Boat Club FPA and Meacham Brants Subdivision in Lake Country FPA
2. NUMBER OF SERVICE AREAS: 2
3. SIZE AND POPULATION SUMMARY:
Population In City Ryral Service
Area
Service Area size (acres)
In City Rural 1987 ZQQ.5. ~ .2.QQ5.
A B C o E F G H
TOTAL
4. DISCHARGE SUMMARY: None
Permit conditions
10/15 10/15/2
Flow (MGD)
BOD (1b/day)
TSS (1b/day)
Ammonia (1 b/day)
85 385
470
160 750
910
Note: All figures given above reflect average daily values assuming full development of planning area.

5.
BOAT CLUB/LAKE COUNTRY SUBREGIONAL SYSTEM FACILITY PLANNING DATA SlJIMARY
ESTIMATED CAPITAL IMPROVEMENT NEEDS: COLLECTION SYSTEM
A. Gravity Collection System: None
Pipe size Length Unit cost Extended (inches) (LF> ($/LF> cost
6 8 10 12 15 18 21 24
Total
B. Li ft Stat ions:
2005 Capacity Lift population required
Station served (MGO) Cost
1 160 .016 $25,000 2 750 .075 $25,000 3 4 5
Total Cost $50,000
2

C.
D.
E.
F.
BOAT CLUB/lAKE COUNTRY SUBREGIONAL SYSTEM FACILITY PLANNING DATA SlIMARY
Force Mains:
Pipe size Length Unit cost Extended (inches) -1LEl (S/LF) cost
3 4 9,500 10.00 $ 95,000 6 14,000 13.50 $189,000 8
Total 23,500 $284,000
Base Sewer Cost: $334,000
Cost Factors:
1. Engineering Cost Factor (Fe): 0.15 2. Contractor Cost Factor (Fc): 0.13
Total Collection System Capital Cost: $428,000
6. ESTIMATED CAPITAL IMPROVEMENT NEEDS: TREATMENT PLANT(S)
A. Number of Treatment Plants: 0 TCMUD #1 to Fort Worth
B. Plant Capacity and Cost Summary: None
Plant number
1 2 3
Total
Capacity MGD
Construction Cost 10/15 10/15/2
3

BOAT CLUB/lAKE COUNTRY SUBREGIONAL SYSTEM FACILITY PLANNING DATA SlIItARY
7. ESTIMATED LAND NEEDS
Description
Land required (acres)
Pipeline right-of-way Plant site
Total Land Cost
8. TOTAL SYSTEM CAPITAL COST
Treatment level
By Fort Worth
Total cost
$428,000
9. ANNUALIZED CAPITAL COSTS
Treatment level
By Fort Worth
Annual debt service cost
$ 33 ,000
Cost per acre Extended
cost
$0.00
Annual capital costs based on ~ percent interest over a lQ-year term.
10. ANNUAL COLLECTION SYSTEM O&M COST: $34,000 (total linear feet gravity sewers + force mains X $.59/1inear foot) + (lift station (2) total .091 MGD)
11. ANNUAL O&M COSTS FOR TREATMENT FACILITY:
Treatment Costs: $19,000
4
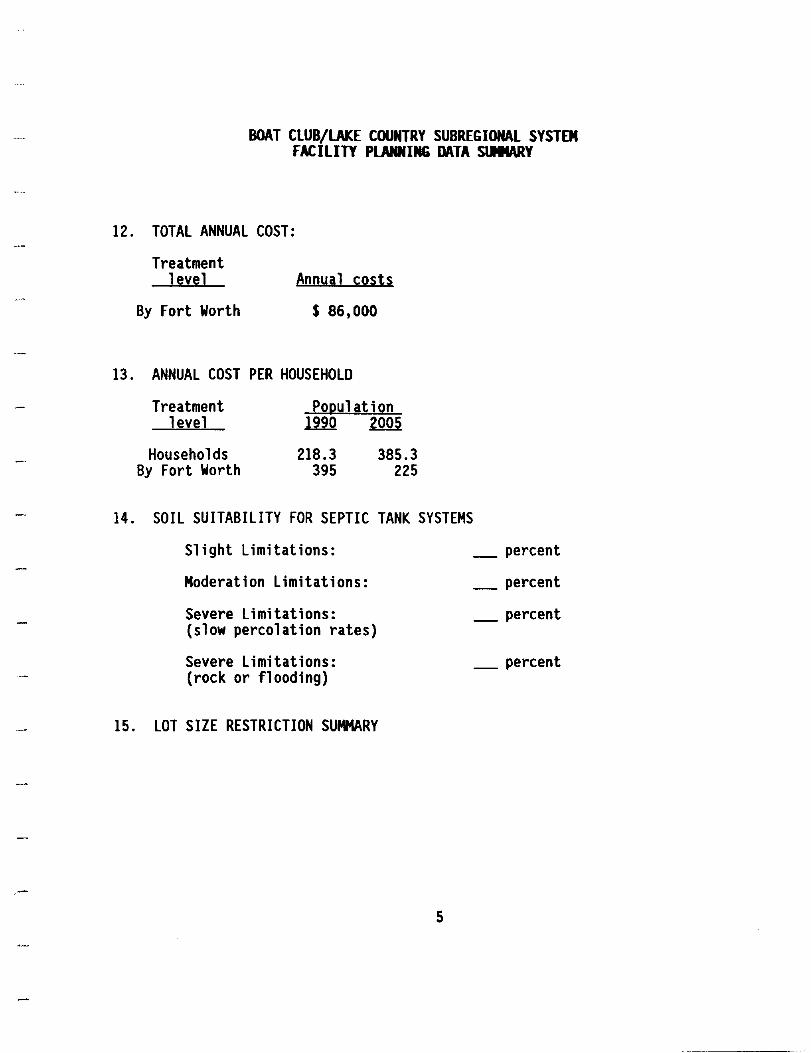
BOAT CLUB/lAKE COUNTRY SUBREGIONAL SYSTEM FACILITY PLANNING DATA stMARY
12. TOTAL ANNUAL COST:
Treatment level
By Fort Worth
Annyal costs
$ 86,000
13. ANNUAL COST PER HOUSEHOLD
Treatment level
Households By Fort Worth
Population li2.Q ~
218.3 395
385.3 225
14. SOIL SUITABILITY FOR SEPTIC TANK SYSTEMS
Slight Limitations:
Moderation Limitations:
Severe Limitations: (slow percolation rates)
Severe Limitations: (rock or flooding)
15. LOT SIZE RESTRICTION SUMMARY
5
_ percent
_ percent
_ percent
_ percent

BOAT CLUB/lAKE COUNTRY SUBREGIONAL SYSTEM FACILITY PLANNING DATA SlIItARY
16. SEPTIC TANK REGULATIONS
17. COMMENTS
6

WESTSIDE REGIONAL SYSTEM FACIllll PlANNING DATA stIICARY
1. PLANNING AREA BOUNDARY:
Briar Creek, Swift Branch, Peden, Pelican Bay, Reno, Azle (Walnut Creek) Ash Creek and Azle (Ash Creek)
2. NUMBER OF SERVICE AREAS: 8
3. SIZE AND POPULATION SUMMARY:
4.
Service Area
A B C o E F G H
TOTAL
Service Area size (acres)
In City .BYlli
DISCHARGE SUMMARY:
Permit Flow BOD conditions (MGO) (lb/day)
10/15 2.2 183 10/15/2 2.2 183
Population In City Rural
12iU ~ ~ 2005
920 1,535 560 930 430 710
1,300 3,160 240 275 1,155 2,550 210 460 1,550 2,100 6,200 8,400
1,122 1,875
10,205 16,210 3,482 5,785
TSS (lb/day)
275 275
WWTP Azle Exist· 7,050 1987· 6,627 2005 = 14,955
AnIoonia Ob/day)
275 37
Note: All figures given above reflect average daily values assuming full development of planning area.
. • "

WESTSIDE REGIONAL SYSTEM FACILITY Pl..ANNING DATA SlIIIARY
5. ESTIMATED CAPITAL IMPROVEMENT NEEDS: COLLECTION SYSTEM
A. Gravity Collection System: None
Pipe size Length Unit cost Extended (inches) (LF) ($!LFl cost
6 16,000 20 $320,000 8 31,500 25 787,500 10 16,500 30 307,500(7500'@ $5/LF; 12 18,000 34 612,000 8" to 10") 15 2,000 42 84,000 18 6,000 49 294,000 21 24
Total 82,500 NIA $2,405,000 (for O&M)
B. li ft Stat ions:
2005 Capacity lift population required
Station served {MGD} Cost
Briar Creek 1 .154 38,000 Swift Branch 2 .093 25,000 Peden 3 .071 25,000 Pelican Bay 4 .344 90,000
5 1,167 340,000
Total Cost $518,000
2
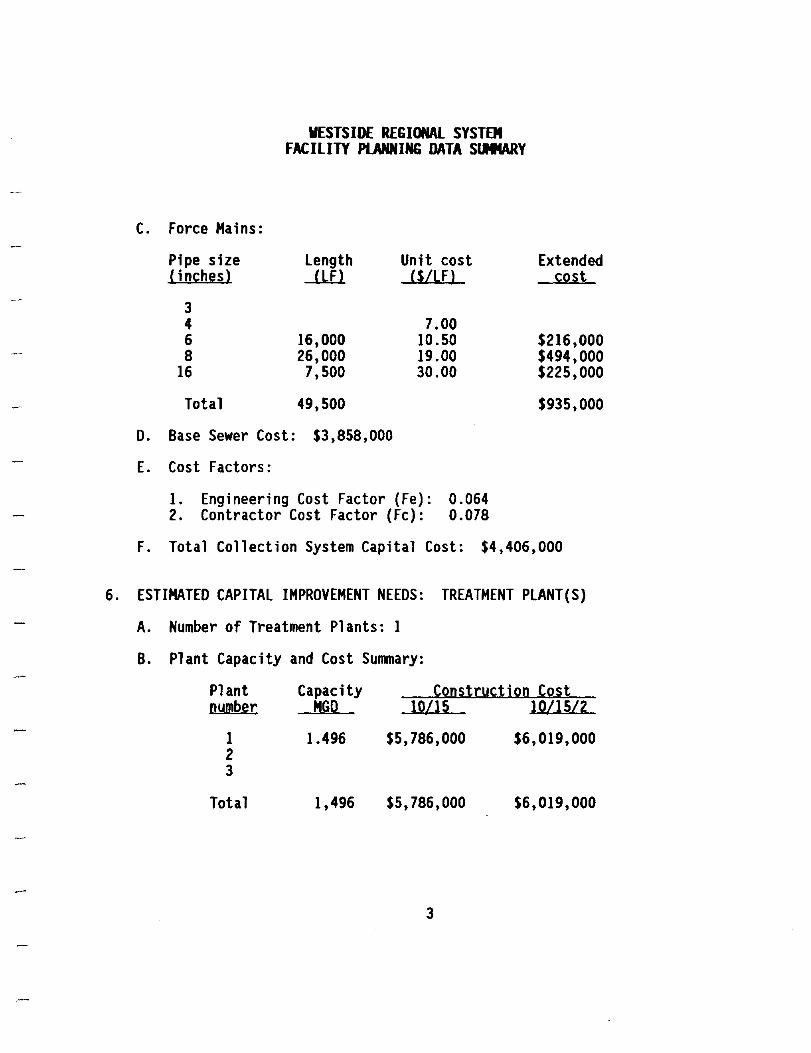
WESTSIDE REGIONAl SYSTEM FACILITY PLANNING DATA SlItMARy
C. Force Mains:
Pipe size (inches)
3 4 6 8
16
Total
length -LL£J.
16,000 26,000 7,500
49,500
D. Base Sewer Cost: $3,858,000
E. Cost Factors:
Unit cost (S/lF)
7.00 10.50 19.00 30.00
1. Engineering Cost Factor (Fe): 0.064 2. Contractor Cost Factor (Fc): 0.078
Extended cost
$216,000 $494,000 $225,000
$935,000
F. Total Collection System Capital Cost: $4,406,000
6. ESTIMATED CAPITAL IMPROVEMENT NEEDS: TREATMENT PlANT(S)
A. Number of Treatment Plants: 1
B. Plant Capacity and Cost Summary:
Plant number
1 2 3
Total
Capacity MGO
1.496
1,496
Construction Cost 10115 10/15/2
$5,786,000 $6,019,000
$5,786,000 $6,019,000
3

WESTSIDE REGIONAL SYSTEM FACILITY PlANNING DATA SUMMARY
7. ESTIMATED LAND NEEDS
Description
Pipeline right-of-way Plant site
Land required (acres)
Total Land Cost
8. TOTAL SYSTEM CAPITAL COST
Treatment level
10/10 10/15/2
Total cost
$10,192,000 $10,425,000
9. ANNUALIZED CAPITAL COSTS
Treatment level
10/15 10/15/2
Annual debt service cost
$ 784,000 $ 802,000
Cost per acre Extended
cost
$0.00
Annual capital costs based on ~ percent interest over a ZQ-year term.
10. ANNUAL COLLECTION SYSTEM O&M COST: $135,000 (total linear feet gravity sewers + force mains X $.59/1inear foot) + (lift station (5) total 1.829 MGD)
4
---_._-------------
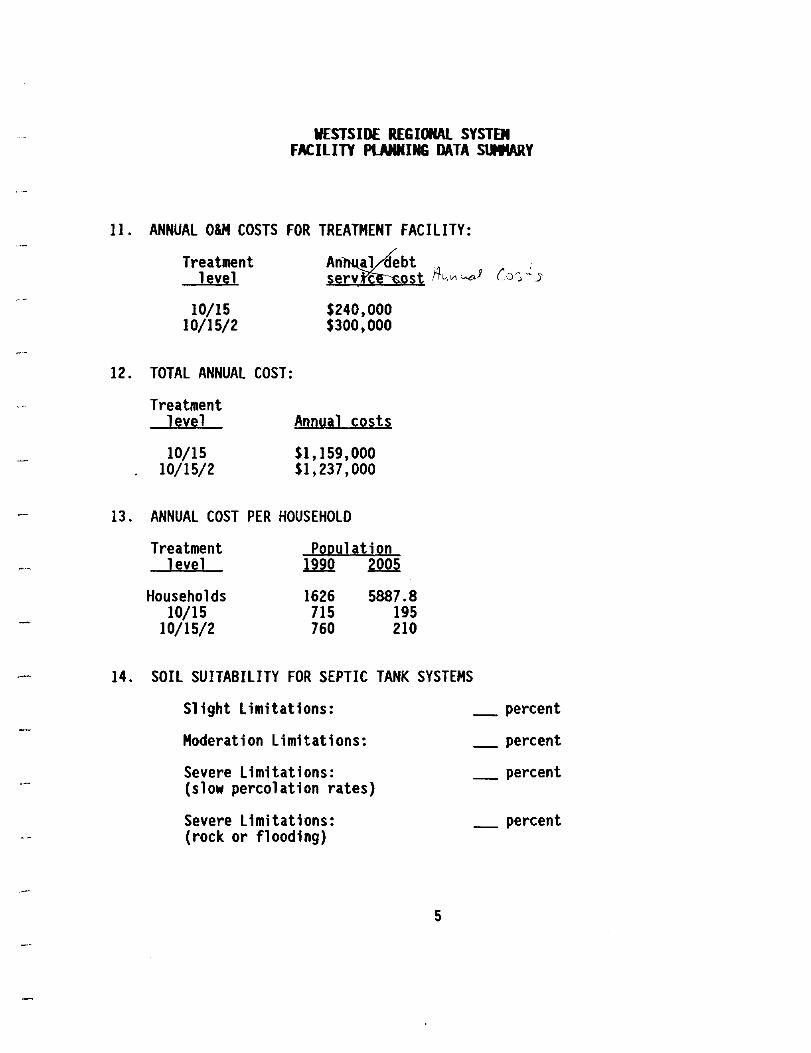
11.
12.
13.
WESTSIDE REGIONAl SYSTEM FACILITY PL.ANNING DATA S\ll4ARY
ANNUAL OlM COSTS FOR TREATMENT FACILITY:
Treatment An~bt (0';, ,: 5 level se~ost ,44"'~;
10/15 $240,000 10/15/2 $300,000
TOTAL ANNUAL COST:
Treatment level Annual costs
10/15 $1,159,000 10/15/2 $1,237,000
ANNUAL COST PER HOUSEHOLD
Treatment PQ~ulatiQn level lli.Q 2005
Households 1626 5887.8 10/15 715 195
10/15/2 760 210
14. SOIL SUITABILITY FOR SEPTIC TANK SYSTEMS
Slight Limitations:
Moderation Limitations:
Severe Limitations: (slow percolation rates)
Severe Limitations: (rock or flooding)
5
_ percent
_ percent
_ percent
_ percent

WESTSIDE REGIONAl SYSTEM FACILITY PlANNING DATA SlIIIARY
15. LOT SIZE RESTRICTION SUMMARY
16. SEPTIC TANK REGULATIONS
17. COMMENTS
6
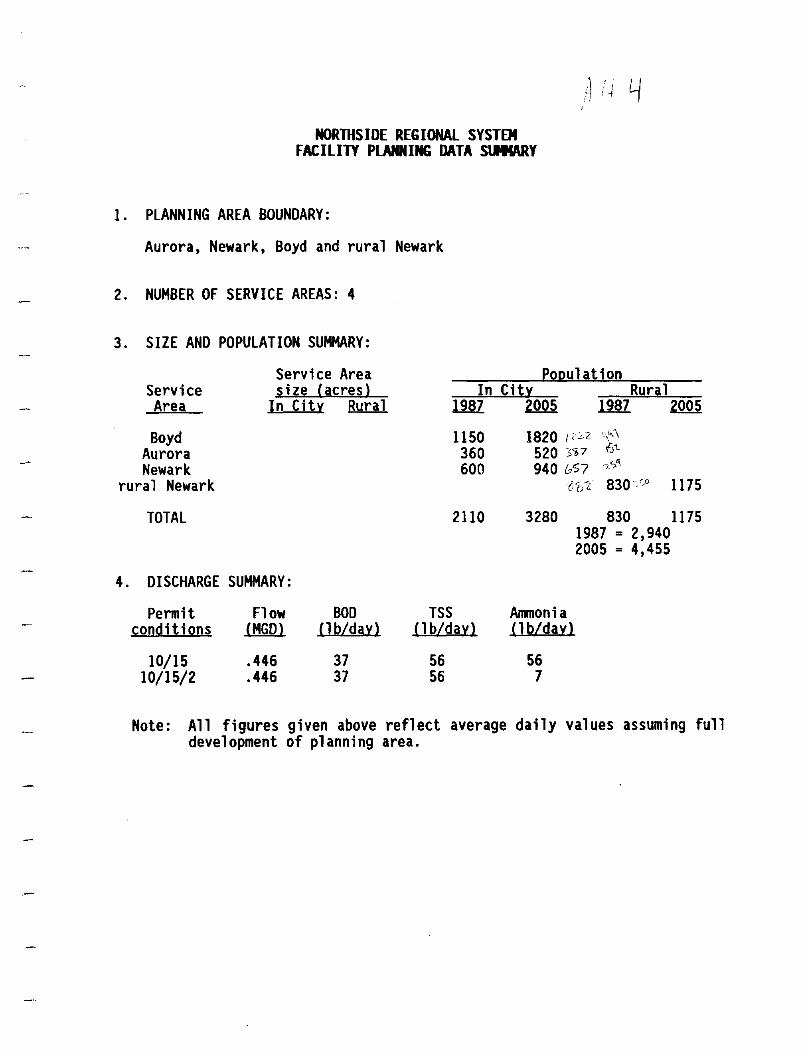
NORTHSIDE REGIONAL SYSTEM FACILITY PLANNING DATA SlIIIARY
1. PLANNING AREA BOUNDARY:
Aurora, Newark, Boyd and rural Newark
2. NUMBER OF SERVICE AREAS: 4
3. SIZE AND POPULATION SUMMARY:
Service Area
Boyd Aurora Newark
rural Newark
TOTAL
Service Area size (acres)
InC i tv B.Yr!.l.
4. DISCHARGE SUMMARY:
Permit Flow BOD conditions (MGD) (lb/day)
10/15 .446 37 10/15/2 .446 37
population In Citv Rural
TSS
1150 360 600
2110
(l b/day)
56 56
l~~~ ~~~7 '~~ 940 &S7 L'>"
t'fol: 830~'P 1175
3280 830 1175
Anlnonia (lb/day)
56 7
1987 = 2,940 2005 = 4,455
Note: All figures given above reflect average daily values assuming full development of planning area.
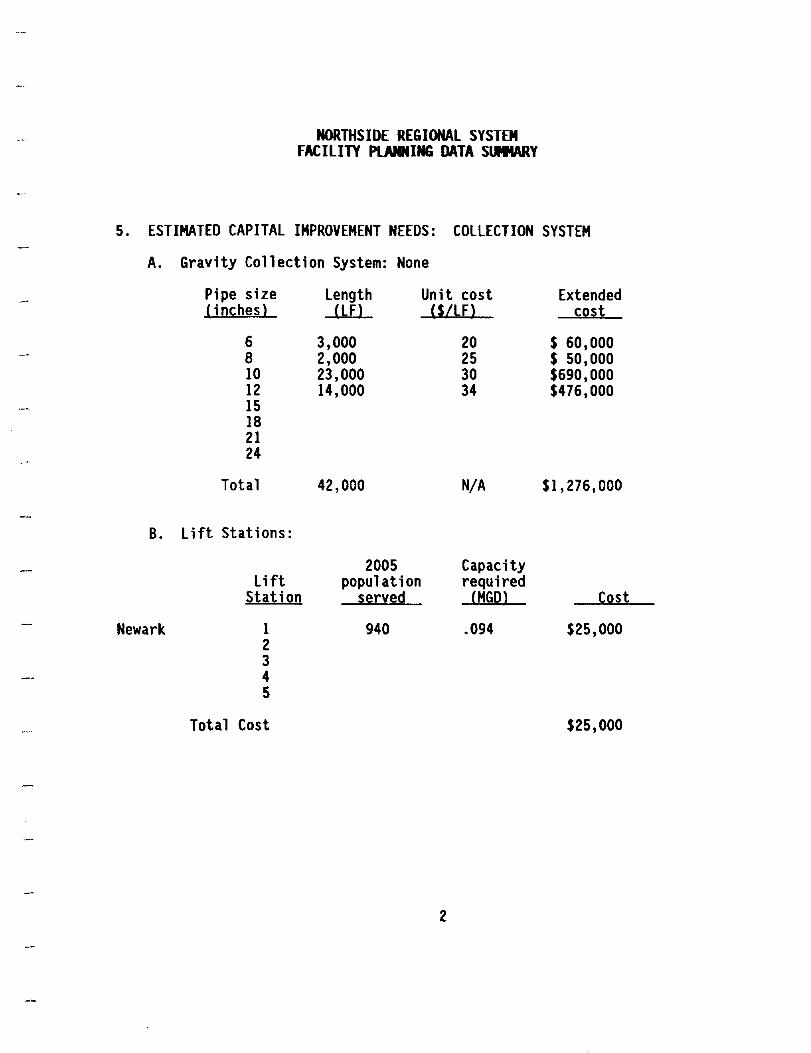
NORTHSIDE REGIONAL SYSTEM FACILITY PlANNING DATA SlIItARy
5. ESTIMATED CAPITAL IMPROVEMENT NEEDS: COLLECTION SYSTEM
A. Gravity Collection System: None
Pipe size Length Unit cost Extended ( inches) (LFl (S/LFl cost
6 3,000 20 $ 60,000 8 2,000 25 $ 50,000 10 23,000 30 $690,000 12 14,000 34 $476,000 15 18 21 24
Total 42,000 N/A $1,276,000
B. lift Stations:
2005 Capacity lift population required
Station served (MGD) Cost
Newark 1 940 .094 $25,000 2 3 4 5
Total Cost $25,000
2

C.
D.
E.
F.
Force Mains:
Pipe size (inches)
3 4 6 8
Total
NORTHSIDE REGIONAL SYSTEM FACILITY PlANNING DATA SlIIWlY
length Unit cost elF) ($/LFl
3,000 13.50
3,000
Base Sewer Cost: $1,342,000
Cost Factors:
1. Engineering Cost Factor (Fe): 0.09 2. Contractor Cost Factor (Fc): 0.095
Extended cost
$41,000
$41,000
Total Collection System Capital Cost: $1 ,590,000
6. ESTIMATED CAPITAL IMPROVEMENT NEEDS: TREATMENT PlANT(S)
A. Number of Treatment Plants: 1
B. Plant Capacity and Cost Summary:
Plant number
1 2 3
Total
Capacity MGD
.446
.446
Constryction Cost 10115 10/15/2
$2,000,000 $2,500,000
$2,000,000 $2,500,000
3

NORTHSIDE REGIONAL SYSTEM FACILITY PLANNING DATA SlIIWtY
7. ESTIMATED LAND NEEDS
Description
Pipeline right-of-way Plant site
Land required (acres)
5
Total Land Cost
8. TOTAL SYSTEM CAPITAL COST
Treatment level
10/10 10/15/2
Total cost
$3,690,000 $4,190,000
9. ANNUALIZED CAPITAL COSTS
Treatment level
10/15 10/15/2
Annual debt service cost
$ 284,000 $ 322,000
Cost per acre
$20,000
Extended cost
$100,000
$100,000
Annual capital costs based on 4 1/2 percent interest over a ZQ-year term.
10. ANNUAL COLLECTION SYSTEM O&M COST: $38,000 (total linear feet gravity sewers + force mains X $.59/1inear foot) + (lift station (1) total .094 MGD)
4
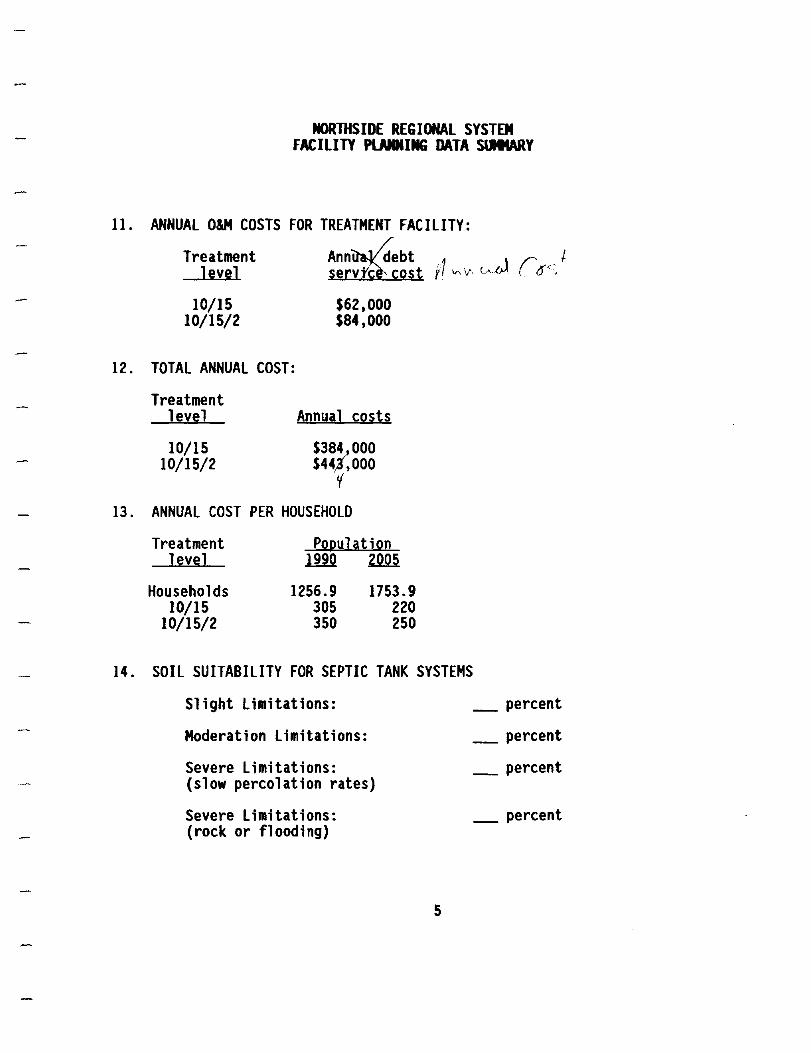
NORTHSIDE REGIONAL SYSTEM FACILITY PlNIIING DATA SlIIWlY
11. ANNUAL O&M COSTS FOR TREATMENT FACILITY:
12.
13.
Treatment level
10/15 10/15/2
$62,000 $84,000
TOTAL ANNUAL COST:
Treatment level Annya] !;;Q~t~
10/15 $384,000 10/15/2 $44,,3,000
'f
ANNUAL COST PER HOUSEHOLD
Treatment level
Households 10/15
10/15/2
Population 1990 2..Q§
1256.9 305 350
1753.9 220 250
14. SOIL SUITABILITY FOR SEPTIC TANK SYSTEMS
Slight Limitations:
Moderation Limitations:
Severe Limitations: (slow percolation rates)
Severe Limitations: (rock or flooding)
. -.----.----
5
_ percent
_ percent
_ percent
_ percent

NORTHSIDE REGIONAL SYSTEM FACILITY PLMNING DATA stIIIARY
15. LOT SIZE RESTRICTION SUMMARY
16. SEPTIC TANK REGULATIONS
17. COMMENTS
6

ALTERNATE NO. 1 AZLE PLANTS MODIFICATION TO 10/15/2
AZLE SERVICE AREA
1. PLANNING AREA BOUNDARY:
Azle City limits
2. NUMBER OF SERVICE AREAS:
3. SIZE AND POPULATION SUMMARY:
4.
Service area size (acres) Service
area In city Ryral
Total
DISCHARGE SUMMARY:
Permit Flow BOD condit ions (MGD) ( 1 b/day)
10/15/2 1.26 10
7750
7750
Population In city
10500
10500
TSS (1b/day)
15
Ammonia (1 b/day)
2
Rural
Note: Proposed modifications by adding new units to existing plants. Size based on 2005 population at 120 gpcd.
5. ESTIMATED CAPITAL IMPROVEMENT NEED: Collection System (Existing System)
A. Gravity Collection System: None
B. Lift Stations: None
C. Force Mains: None
D. Base Sewer Cost: None
E. Cost Factors: 1. Engineering Cost Factor (Fe): 2. Contractor Cost Factor (Fc):
F. Total Collection System Capital Cost: None

ALTERNATE NO. 1 AZlE PLANTS MODIFICATION TO 10/15/2
AZlE SERVICE AREA
6. ESTIMATED CAPITAL IMPROVEMENT NEEDS: Treatment Plant(s)
A. Number of Treatment Plants: 2
7.
8.
9.
B. Plant CapacHy and Cost Summary: Cost of new units at existing plants
Plant Capacity Nymber ~
1 & 2 1.26
Total
ESTIMATED LAND NEEDS: None
TOTAL SYSTEM CAPITAL COST
Treatment Level Total Cost
10/15/2 $1,700,000
ANNUALIZED CAPITAL COST
Treatment Level
10/15/2
Annual Debt Service Cost
$131,000
Construction Cost 1011512
1,700,000
1,700,000
Annual Capital costs based on 4 1/2 percent interest over a 20-year term.
10. ANNUAL COLLECTION SYSTEM OlM COST: Existing System
11. ANNUAL OlM COSTS FOR TREATMENT FACILITY:
Treatment Level
10/15/2
Annual Costs
$280,000
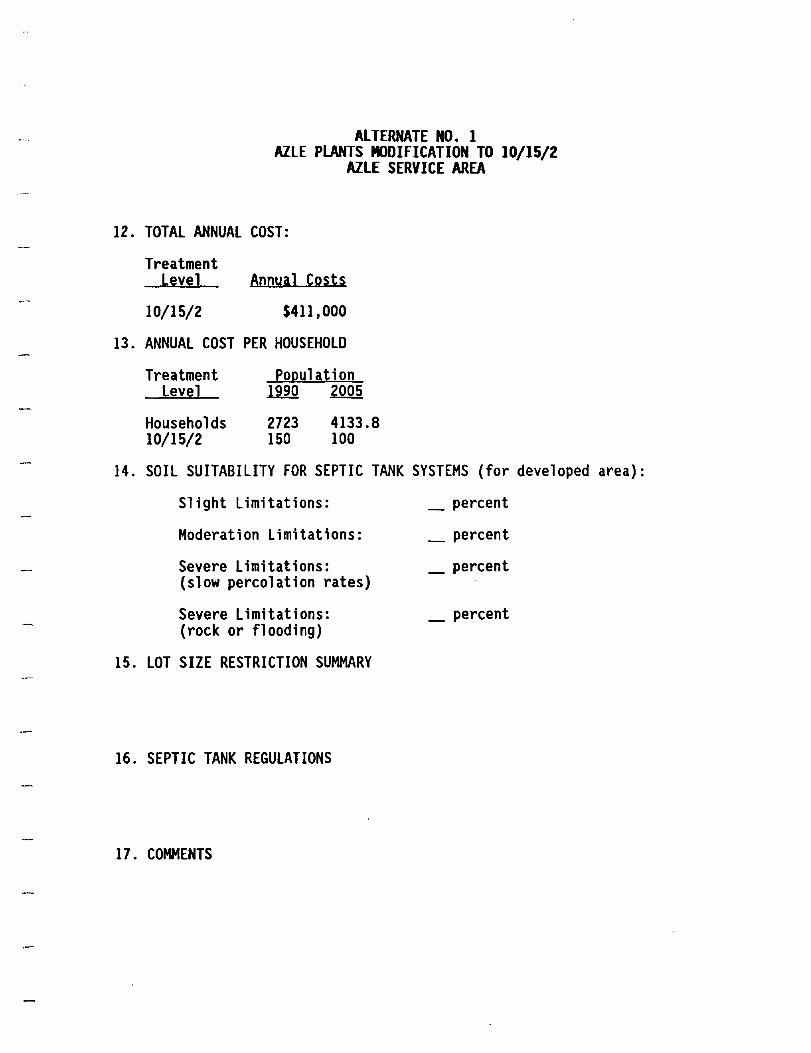
ALTERNATE NO. 1 AZLE PLANTS MODIFICATION TO 10/15/2
AZLE SERVICE AREA
12. TOTAL ANNUAL COST:
Treatment Level
10/15/2
Annual Costs
$411 ,000
13. ANNUAL COST PER HOUSEHOLD
Treatment Level
Households 10/15/2
Popylation .lliQ ~
2723 150
4133.8 100
14. SOIL SUITABILITY FOR SEPTIC TANK SYSTEMS (for developed area):
Slight Limitations:
Moderation Limitations:
Severe Limitations: (slow percolation rates)
Severe Limitations: (rock or flooding)
15. LOT SIZE RESTRICTION SUMMARY
16. SEPTIC TANK REGULATIONS
17. COMMENTS
_ percent
_ percent
_ percent
_ percent

ALTERNATE NO. 2 AZLE PlANTS MODIFICATION TO 10/15/2
AZLE/PELICAN BAY SERVICE AREA
1. PLANNING AREA BOUNDARY:
Azle and Pelican Bay
2. NUMBER OF SERVICE AREAS:
3. SIZE AND POPULATION SUMMARY:
4.
Service area size (acres) Service
area In city BYril
Total
DISCHARGE SUMMARY:
Permit Flow BOD conditions 1Millll (lb/day)
10/15/2 1.604 10
Population In city
9290 13935
9290 13935
TSS Anvnonia (l b/day) (l b/day)
15 2
Ryral
Note: Proposed modifications by adding new units to existing plants. Size based on 2005 population at 120 gpcd for Azle and 100 gpcd for Pelican Bay.
5. ESTIMATED CAPITAL IMPROVEMENT NEED: Collection System (Azle - Existing; Pelican Bay - See individual FPA)
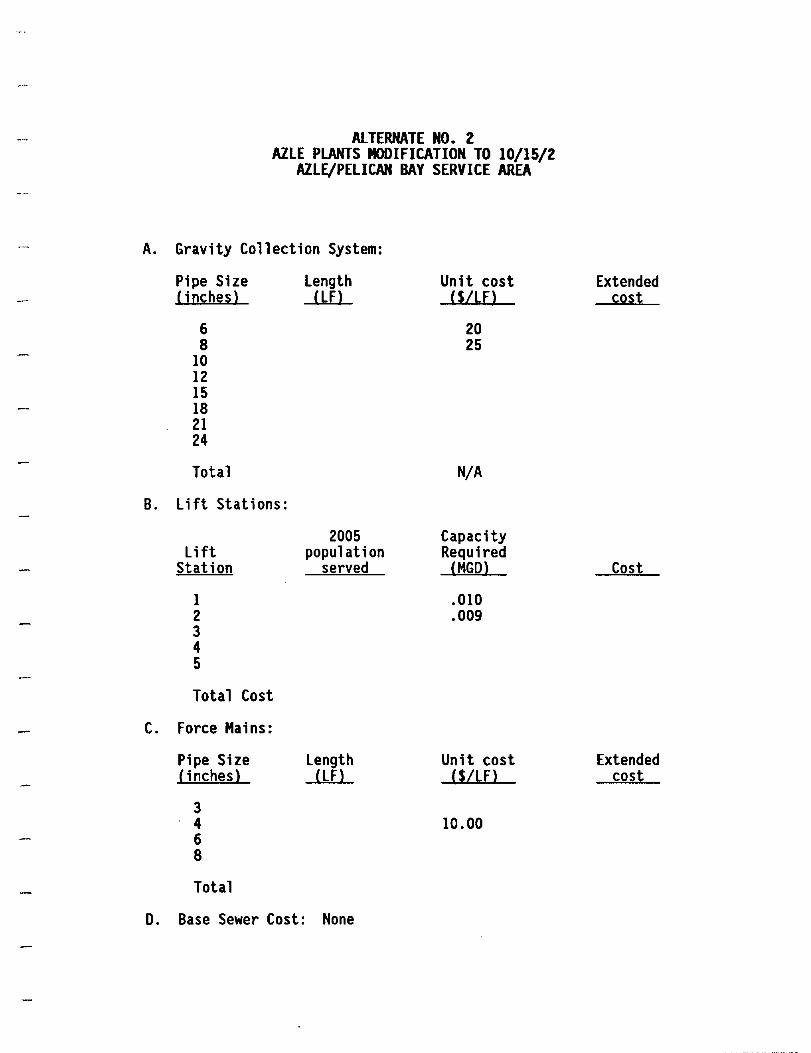
A.
B.
C.
D.
ALTERNATE NO. Z AZLE PlANTS MODIFICATION TO 10/15/Z
AZLE/PELICAN BAY SERVICE AREA
Gravity Collection System:
Pipe Size Length Unit cost ( inches) (If) U/Lf)
6 20 8 25
10 12 15 18 21 24
Total N/A
Lift Stations:
2005 Capacity Lift population Required
Station served (MGO)
1 .010 2 .009 3 4 5
Total Cost
Force Mains:
Pipe Size length Unit cost Ci nches) (If) U/lf)
3 4 10.00 6 8
Total
Base Sewer Cost: None
Extended cost
Cost
Extended cost

ALTERNATE NO. 2 AZLE PLANTS MODIFICATION TO 10/15/2
AZLE/PELICAN BAY SERVICE AREA
E. Cost Factors: 1. Engineering Cost Factor (Fe): 2. Contractor Cost Factor (Fc):
F. Total Collection System Capital Cost: None
6. ESTIMATED CAPITAL IMPROVEMENT NEEDS: Treatment Plant{s)
A. Number of Treatment Plants: 2
B. Plant Capacity and Cost Summary: Cost of new units at existing plants
Plant Number
1 & 2
Capacity ~
1.604
Construction Cost 10/15/2
2,900,000
Total 2,900,000
7. ESTIMATED LAND NEEDS: None
8. TOTAL SYSTEM CAPITAL COST
Treatment Level
10/15/2
Total Cost
$2,900,000
9. ANNUALIZED CAPITAL COST
Treatment Level
10/15/2
Annual Debt Service Cost
$223,000
Annual Capital costs based on 4 1/2 percent interest over a 20-year term.
10. ANNUAL COLLECTION SYSTEM O&M COST: None (total linear feet gravity sewers + force mains x $.59/linear foot)

ALTERNATE NO. 2 AZLE PlANTS MODIFICATION TO 10/15/2
AZLE/PELICAN BAY SERVICE AREA
11. ANNUAL O&M COSTS FOR TREATMENT FACILITY:
Treatment Level
10/15/2
Annyal Costs
$280,000
12. TOTAL ANNUAL COST:
Treatment Level
10/15/2
Annual Costs
$503,000
13. ANNUAL COST PER HOUSEHOLD
Treatment Level
Households 10/15/2
Population 1990 ~
3962.2 5486.2 125 90
14. SOIL SUITABILITY FOR SEPTIC TANK SYSTEMS (for developed area):
Slight Limitations:
Moderation Limitations:
Severe Limitations: (slow percolation rates)
Severe Limitations: (rock or flooding)
15. LOT SIZE RESTRICTION SUMMARY
_ percent
_ percent
_ percent
_ percent
ALTERNATE NO. 2 AZLE PLANTS MODIFICATION TO 10/15/2
AZLE/PELICAN BAY SERVICE AREA
16. SEPTIC TANK REGULATIONS
17. COMMENTS
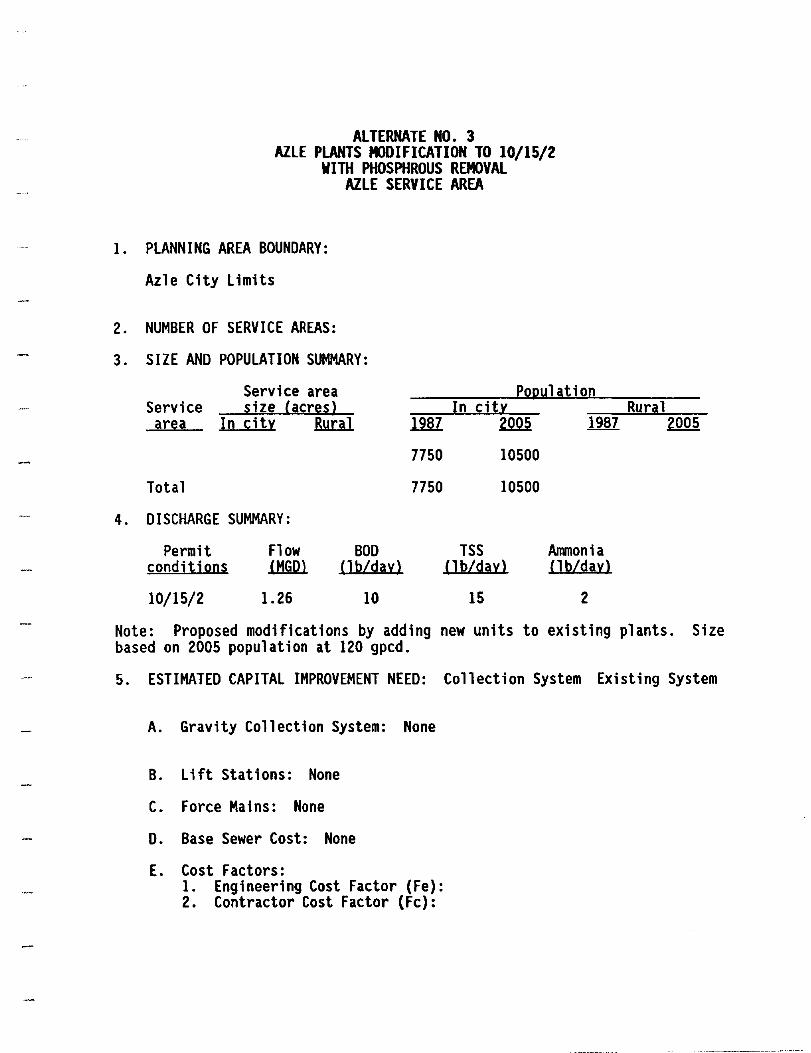
ALTERNATE NO. 3 AZLE PlANTS MODIFICATION TO 10/15/2
WITH PHOSPHROUS REMOVAl AZLE SERVICE AREA
1. PLANNING AREA BOUNDARY:
Azle City Limits
2. NUMBER OF SERVICE AREAS:
3. SIZE AND POPULATION SUMMARY:
Service area sjze (acres) Service
area In city Rural
Total
4. DISCHARGE SUMMARY:
Permit conditions
10/15/2
Flow .il1G.O.l
1.26
BOD Clb/day)
10
Population In city
7750 10500
7750 10500
TSS Clb/day)
15
Ammonia Clb/day)
2
Rural
Note: Proposed modifications by adding new units to existing plants. Size based on 2005 population at 120 gpcd.
5. ESTIMATED CAPITAL IMPROVEMENT NEED: Collection System Existing System
A. Gravity Collection System: None
B. Lift Stations: None
C. Force Mains: None
D. Base Sewer Cost: None
E. Cost Factors: 1. Engineering Cost Factor (Fe): 2. Contractor Cost Factor (Fc):
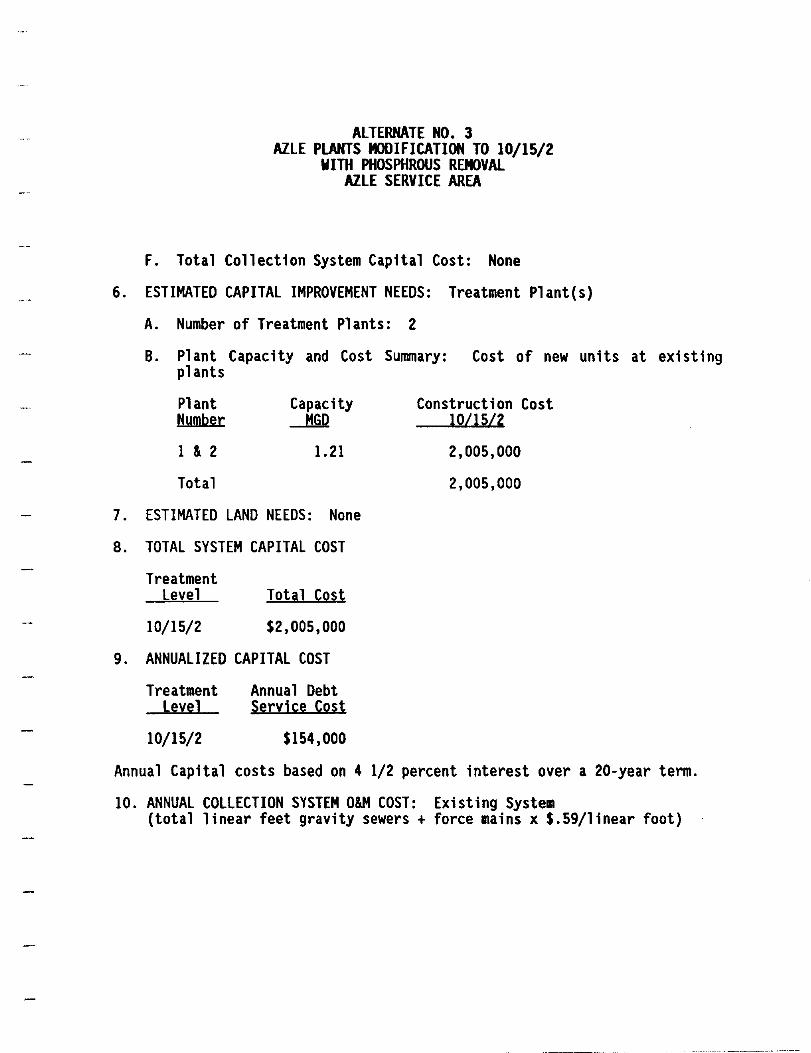
ALTERNATE NO. 3 AILE PlANTS MODIFICATION TO 10/15/2
WITH PHOSPHROUS REMOVAL AILE SERVICE AREA
F. Total Collection System Capital Cost: None
6. ESTIMATED CAPITAL IMPROVEMENT NEEDS: Treatment Plant(s)
A. Number of Treatment Plants: 2
7.
8.
9.
B. Plant Capacity and Cost Summary: Cost of new units at existing plants
Plant Capacity Nymber ~
1 & 2 1. 21
Total
ESTIMATED LAND NEEDS: None
TOTAL SYSTEM CAPITAL COST
Treatment Level Total Cost
10/15/2 $2,005,000
ANNUALIZED CAPITAL COST
Treatment Level
10/15/2
Annual Debt Service Cost
$154,000
Construction Cost 10115/2
2,005,000
2,005,000
Annual Capital costs based on 4 1/2 percent interest over a 20-year term.
10. ANNUAL COLLECTION SYSTEM O&M COST: Existing System (total linear feet gravity sewers + force mains x $.59/linear foot)

ALTERNATE NO. 3 AILE PLANTS MODIFICATION TO 10/15/2
WITH PHOSPHROUS REMOVAL AILE SERVICE AREA
11. ANNUAL O&M COSTS FOR TREATMENT FACILITY:
Treatment Leyel
10/15/2
Annual Costs
$369,000
12. TOTAL ANNUAL COST:
Treatment Level
10/15/2
Annyal Costs
$523,000
13. ANNUAL COST PER HOUSEHOLD
Treatment level
Households 10/15/2
Population 1990 2005
2723.2 4133.8 190 125
14. SOIL SUITABILITY FOR SEPTIC TANK SYSTEMS (for developed area):
Slight Limitations:
Moderation Limitations:
Severe Limitations: (slow percolation rates)
Severe Limitations: (rock or flooding)
15. LOT SIZE RESTRICTION SUMMARY
_ percent
_ percent
_ percent
_ percent

ALTERNATE NO. 3 AILE PlANTS MODIFICATION TO 10/15/2
WITH PHOSPHROUS REMOVAl AILE SERVICE AREA
16. SEPTIC TANK REGULATIONS
17. COMMENTS
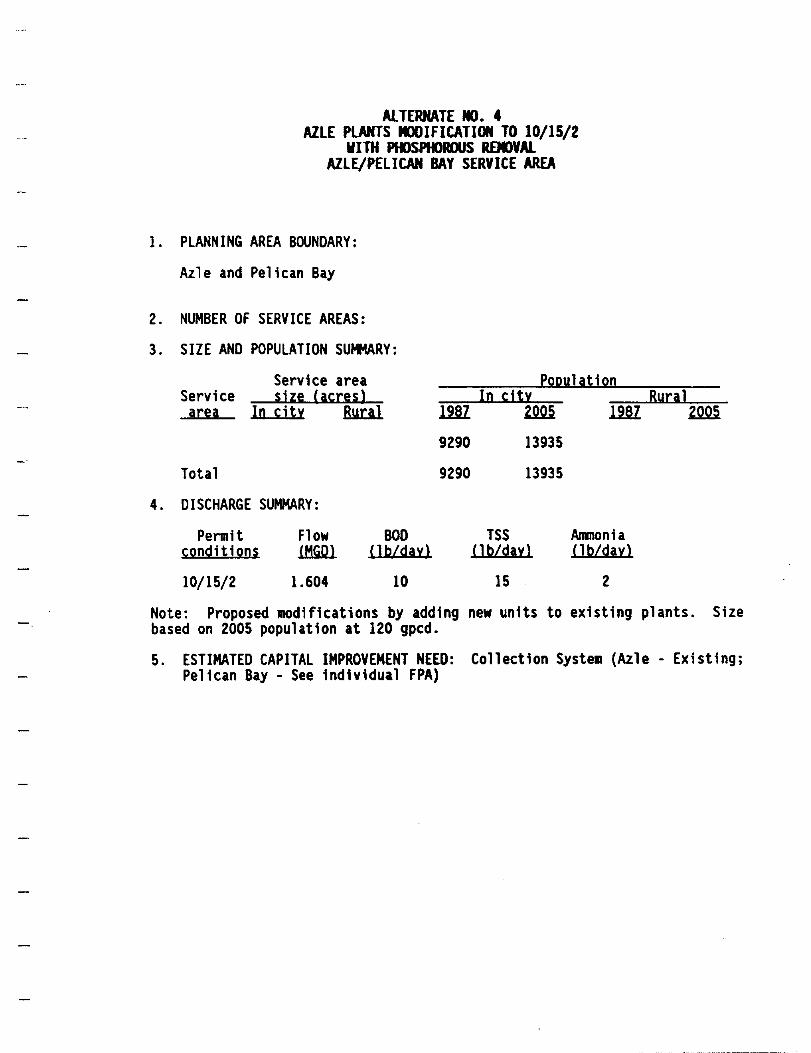
At TERNATE NO. 4 AILE PLANTS MODIFICATION TO 10/15/2
WITH PHOSPHOROUS ROOVAL AILE/PELICAN BAY SERVICE AREA
1. PLANNING AREA BOUNDARY:
Azle and Pelican Bay
2. NUMBER OF SERVICE AREAS:
3. SIZE AND POPULATION SUMMARY:
Service area size (acres)
Population
4.
Service area In city BYril
Total
DISCHARGE SUMMARY:
Permit Flow BOD conditions .il1W. (]b/day)
10/15/2 1.604 10
In city
9290 13935
9290 13935
TSS Anlnonia (] b/day) (] b/day)
15 2
Ryral
Note: Proposed modifications by adding new units to existing plants. Size based on 2005 population at 120 gpcd.
5. ESTIMATED CAPITAL IMPROVEMENT NEED: Collection System (Azle - Existing; Pelican Bay - See individual FPA)

A.
B.
C.
ALTERNATE NO. 4 AZLE PlANTS MODIFICATION TO 10/15/2
WITH POOSPOOROUS REMOVAL AZLE/PELICAN BAY SERVICE AREA
Gravity Collection System:
Pipe Size Length Unit cost (jnches) (lFl (S/lFl
6 20 8 25
10 30 12 34 15 42 18 49 21 56 24 63
Total N/A
Li ft Stat ions:
2005 Capacity Lift population Required
Station served (MGD)
1 2 3 4 5
Total Cost
Force Mains:
Pipe Size length Unit cost ( i nches) (IF) CS/LFl
3 7.00 4 10.00 6 13.50 8 17 .00
Total
Extended cost
Cost
Extended cost
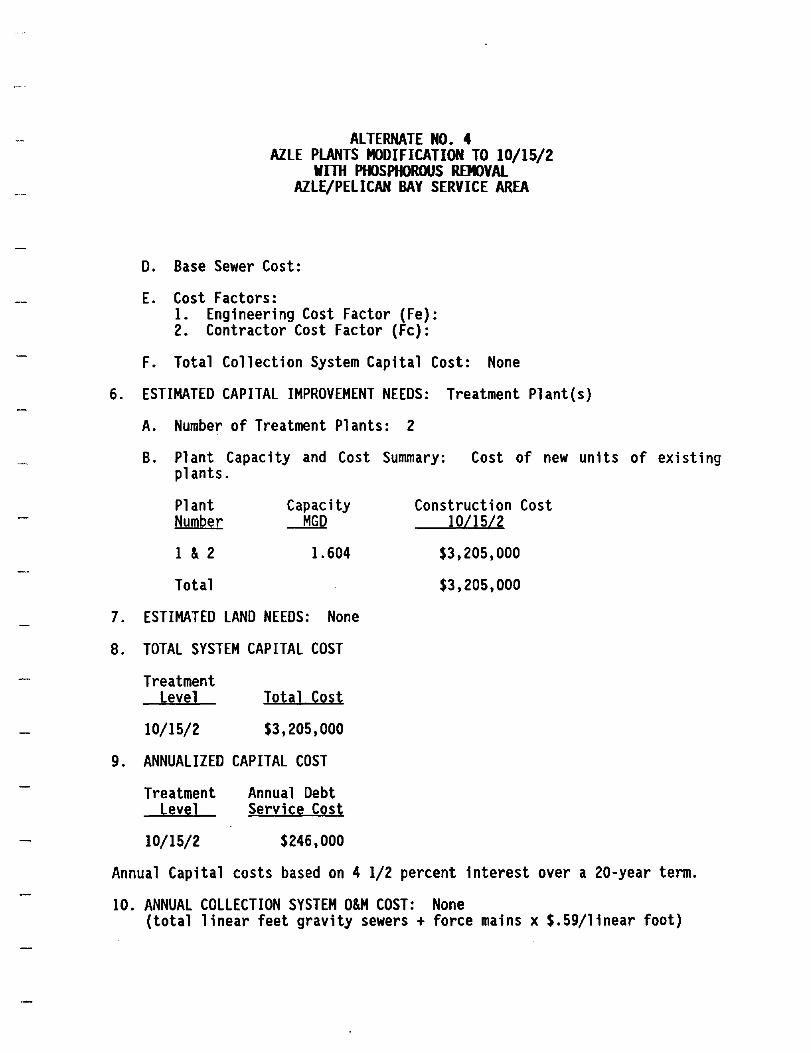
ALTERNATE NO. 4 AZLE PlANTS MODIFICATION TO 10/15/2
WITH PHOSPHOROUS REJIlVAL AZLE/PELICAN BAY SERVICE AREA
D. Base Sewer Cost:
E. Cost Factors: 1. Engineering Cost Factor (Fe): 2. Contractor Cost Factor (Fc):
F. Total Collection System Capital Cost: None
6. ESTIMATED CAPITAL IMPROVEMENT NEEDS: Treatment Plant(s)
A. Number of Treatment Plants: 2
B. Plant Capacity and Cost Summary: Cost of new units of existing plants.
Plant Number
1 & 2
Capacity MGD
1.604
Construction Cost 10115/2
$3,205,000
Total $3,205,000
7. ESTIMATED LAND NEEDS: None
8. TOTAL SYSTEM CAPITAL COST
Treatment Level
10/15/2
Total Cost
$3,205,000
9. ANNUALIZED CAPITAL COST
Treatment Level
10/15/2
Annual Debt Service Cost
$246,000
Annual Capital costs based on 4 1/2 percent interest over a 20-year term.
10. ANNUAL COLLECTION SYSTEM O&M COST: None (total linear feet gravity sewers + force mains x $.59/linear foot)

ALTERNATE NO. 4 AZLE PlANTS MODIFICATION TO 10/15/2
WITH PHOSPHOROUS REMOVAL AZLE/PELICAN BAY SERVICE AREA
11. ANNUAL O&M COSTS FOR TREATMENT FACILITY:
Treatment Level
10/15/2
Annual Costs
$369,000
12. TOTAL ANNUAL COST:
Treatment Level
10/15/2
Annual Costs
$615,000
13. ANNUAL COST PER HOUSEHOLD
Treatment Level
Households 10/15/2
Population 1990 2005
3962.2 5486.2 155 110
14. SOIL SUITABILITY FOR SEPTIC TANK SYSTEMS (for developed area):
Slight Limitations:
Moderation Limitations:
Severe Limitations: (slow percolation rates)
Severe Limitations: (rock or flooding)
15. LOT SIZE RESTRICTION SUMMARY
_ percent
_ percent
_ percent
_ percent
ALTERNATE NO.4 AZLE PLANTS MODIFICATION TO 10/15/2
WITH PHOSPHOROUS ROOYAL AZLE/PELICAN BAY SERVICE AREA
16. SEPTIC TANK REGULATIONS
17. COMMENTS
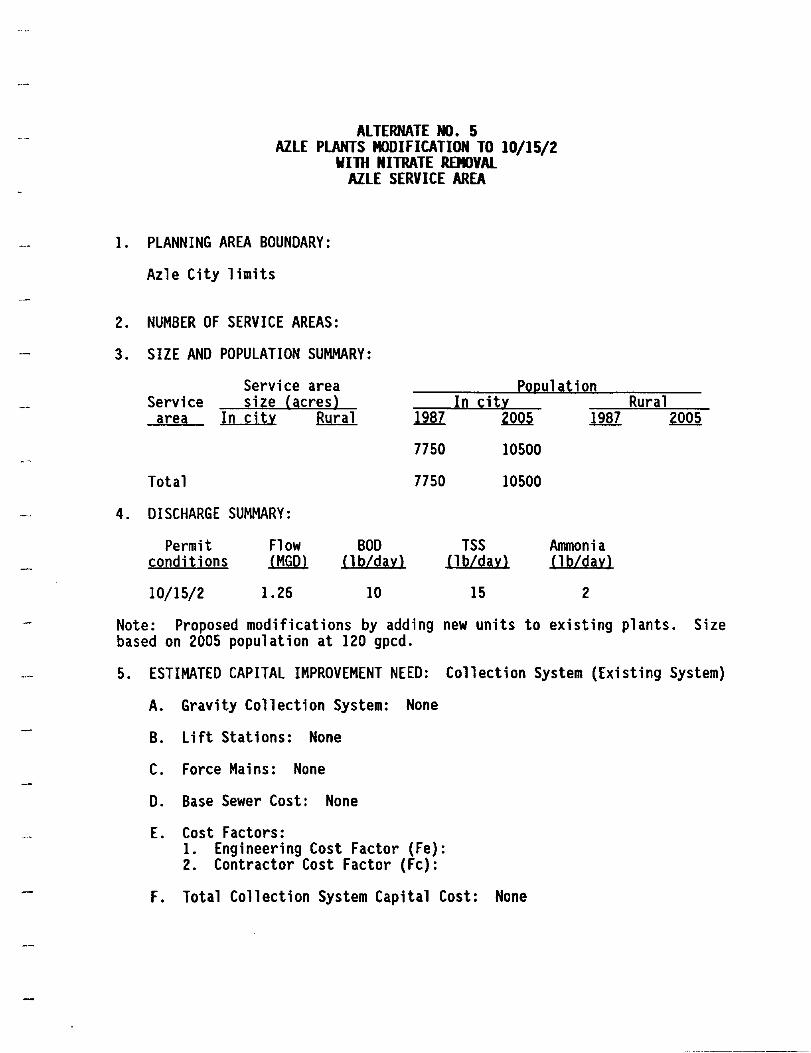
ALTERNATE NO. 5 AlLE PlANTS MODIFICATION TO 10/15/2
WITH NITRATE ROOYAL AlLE SERVICE AREA
1. PLANNING AREA BOUNDARY:
Azle City limits
2. NUMBER OF SERVICE AREAS:
3. SIZE AND POPULATION SUMMARY:
4.
Service area size (acres) Service
area In city Ryral
Total
DISCHARGE SUMMARY:
Permit Flow BOD conditions (MGDl Clb/day)
10/15/2 1.26 10
Popylation In city
7750 10500
7750 10500
TSS Anvnonia Clb/day) Cl b/day)
15 2
Rural
Note: Proposed modifications by adding new units to existing plants. Size based on 2005 population at 120 gpcd.
5. ESTIMATED CAPITAL IMPROVEMENT NEED: Collection System (Existing System)
A. Gravity Collection System: None
B. Lift Stations: None
C. Force Mains: None
D. Base Sewer Cost: None
E. Cost Factors: 1. Engineering Cost Factor (Fe): 2. Contractor Cost Factor (Fc):
F. Total Collection System Capital Cost: None
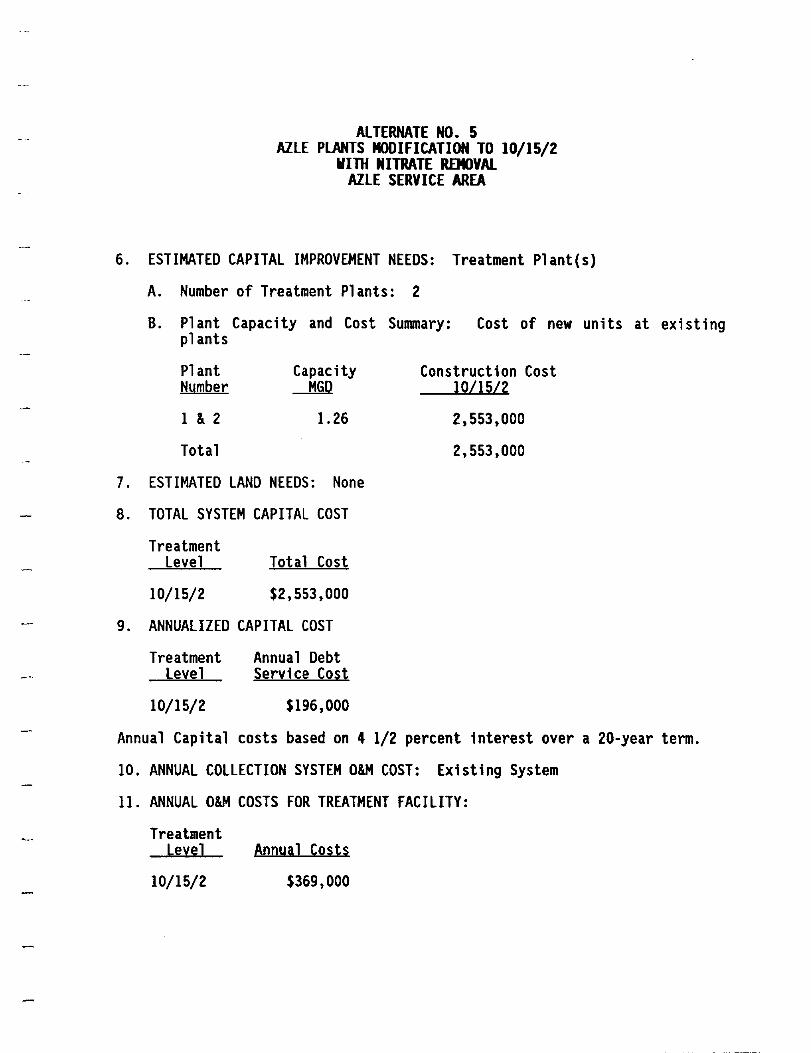
ALTERNATE NO. 5 AILE PlANTS MODIFICATION TO 10/15/2
'lInt NITRATE REIIlYAL AILE SERVICE AREA
6. ESTIMATED CAPITAL IMPROVEMENT NEEDS: Treatment Plant(s)
A. Number of Treatment Plants: 2
7.
8.
9.
B. Pl ant Capaci ty and Cost Summary: Cost of new units at exi st i ng plants
Plant Capacity Nymber ~
1 & 2 1.26
Total
ESTIMATED lAND NEEDS: None
TOTAL SYSTEM CAPITAL COST
Treatment level Total Cost
10/15/2 $2,553,000
ANNUALIZED CAPITAL COST
Treatment Level
10/15/2
Annual Debt Service Cost
$196,000
Construction Cost 10/1512
2,553,000
2,553,000
Annual Capital costs based on 4 1/2 percent interest over a 20-year term.
10. ANNUAL COLLECTION SYSTEM O&M COST: Existing System
11. ANNUAL O&M COSTS FOR TREATMENT FACILITY:
Treatment level
10/15/2
Annyal Costs
$369,000
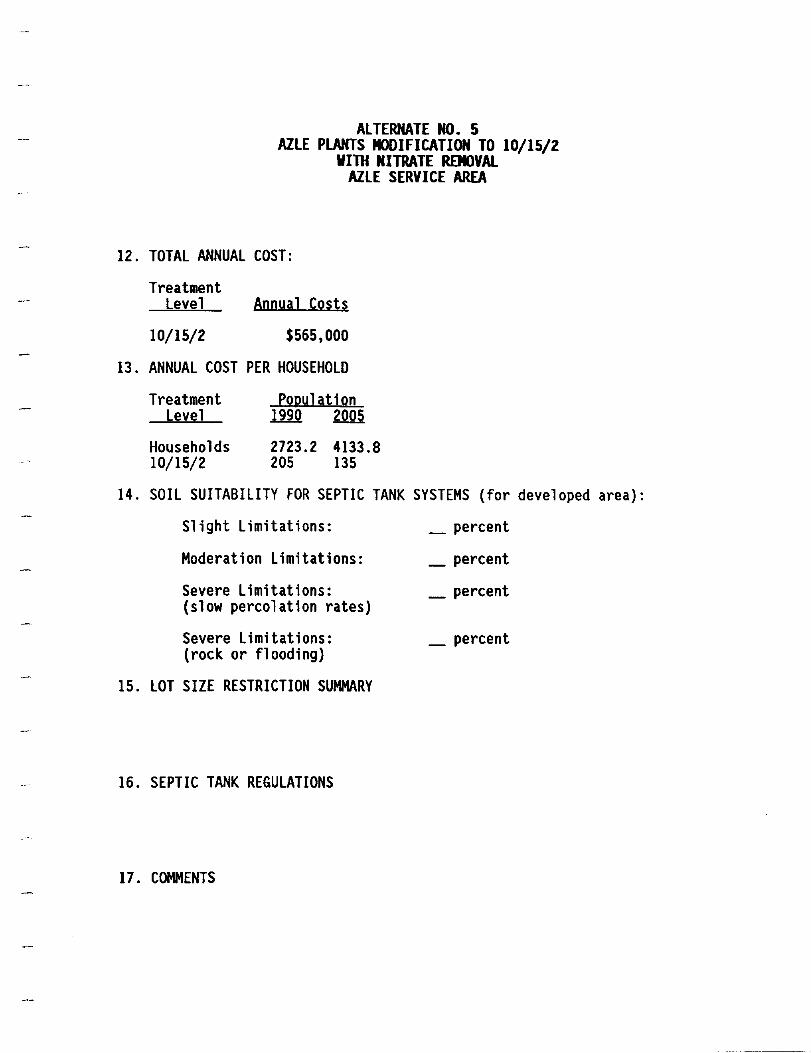
ALTERNATE NO. 5 AZLE PLANTS MODIFICATION TO 10/15/2
WITH NITRATE ROOVAL AZLE SERVICE AREA
12. TOTAL ANNUAL COST:
Treatment Level
10/15/2
Annyal Costs
$565,000
13. ANNUAL COST PER HOUSEHOLD
Treatment Level
Households 10/15/2
Popylation 1990 ~
2723.2 4133.8 205 135
14. SOIL SUITABILITY FOR SEPTIC TANK SYSTEMS (for developed area):
Slight Limitations:
Moderation Limitations:
Severe Limitations: (slow percolation rates)
Severe Limitations: (rock or flooding)
15. LOT SIZE RESTRICTION SUMMARY
16. SEPTIC TANK REGULATIONS
17. COMMENTS
_ percent
_ percent
_ percent
_ percent

l.
2.
3.
4.
AlTERNATE NO. 6 AZLE PlANTS MODIFICATION TO 10/15/2
VITIf IUTRATE REJl)YAl AZLE, PELICAN BAY SERVICE AREA
PLANNING AREA BOUNDARY:
Azle, Pelican Bay
NUMBER OF SERVICE AREAS:
SIZE AND POPULATION SUMMARY:
Service area PODuhtioo Service ~il:!l 'i~[n) 10 city i[!:iI 10 ~it:r: &I.r.iIl
;! , ~ ~
RY[ill
r pj
9290 13935 '0' ~ :-'1;;5 I I ·'.177
1 '- <
Total
DISCHARGE SUMMARY:
Permit condHions
10/15/2
Flow ~
1.604
BOD (l b/diIY)
10
9290 13935
TSS (l b/diIY)
15
AnInonia (lb/diY)
2
Note: Proposed modifications by adding new units to existing plants. Size based on 2005 population at 120 gpcd for Azle and 100 gpcd for Pelican Bay.
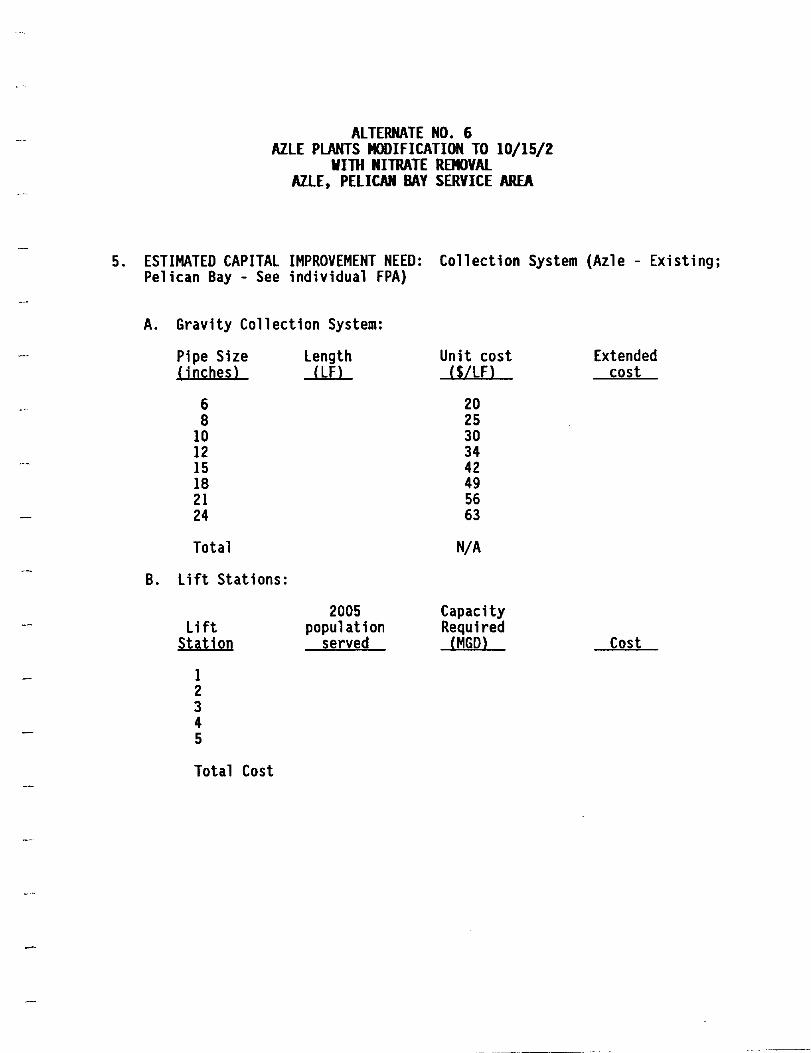
ALTERNATE NO.6 AILE PLANTS MODIFICATION TO 10/15/2
WITH NITRATE REMOVAL AILE, PELICAN BAY SERVICE AREA
5. ESTIMATED CAPITAL IMPROVEMENT NEED: Collection System (Azle - Existing; Pelican Bay - See individual FPA)
A. Gravity Collection System:
Pipe Size length (inches) (lEl
6 8
10 12 15 18 21 24
Total
B. Li ft Stations:
2005 Lift population
Station served
1 2 3 4 5
Total Cost
Unit cost (s/lEl
20 25 30 34 42 49 56 63
NIA
Capacity Required
(MGD)
Extended cost
Cost
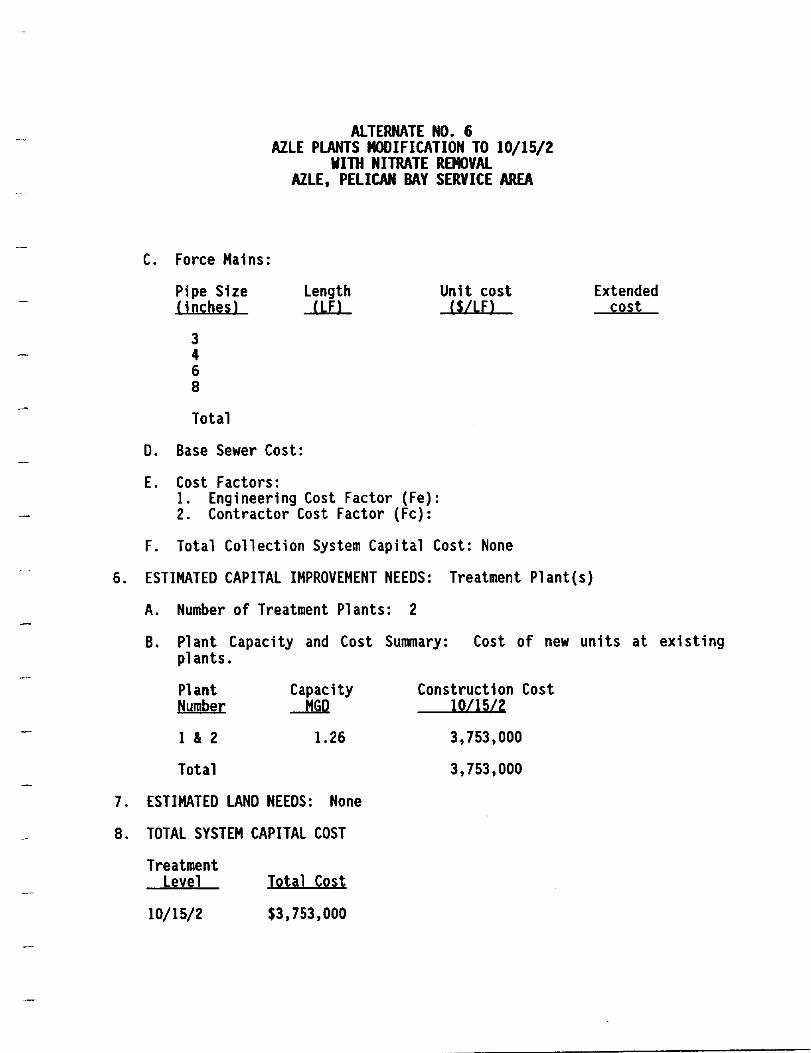
C. Force Mains:
Pipe Size (inches)
3 4 6 8
Total
ALTERNATE NO. 6 AZLE PlANTS MODIFICATION TO 10/15/2
WIlH NITRATE REMOVAl AZLE, PELICAN BAY SERVICE AREA
length (If)
Unit cost ($/lf)
D. Base Sewer Cost:
E. Cost Factors: 1. Engineering Cost Factor (Fe): 2. Contractor Cost Factor (Fc):
F. Total Collection System Capital Cost: None
Extended cost
6. ESTIMATED CAPITAL IMPROVEMENT NEEDS: Treatment Plant(s)
7.
8.
A. Number of Treatment Plants: 2
B. Plant Capacity and Cost Summary: Cost of new units at existing plants.
Plant Capacity Construction Cost Nymber Jill! 10115/2
1 & 2 1.26 3.753.000
Total 3.753.000
ESTIMATED LAND NEEDS: None
TOTAL SYSTEM CAPITAL COST
Treatment level Total Cost
10/15/2 $3.753.000

ALTERNATE NO. 6 AZlE PlANTS MODIFICATION TO 10/15/2
WITH NITRATE REMOVAl AZlE, PELICAN BAY SERVICE AREA
9. ANNUALIZED CAPITAL COST
Treatment Level
10/15/2
Annual Debt Service Cost
$289,000
Annual Capital costs based on 4 1/2 percent interest over a 20-year term.
10. ANNUAL COllECTION SYSTEM O&M COST: None (total linear feet gravity sewers + force mains x $.59/linear foot)
11. ANNUAL O&M COSTS FOR TREATMENT FACILITY:
Treatment Level
10/15/2
Annual Costs
$369,000
12. TOTAL ANNUAL COST:
Treatment Level
10/15/2
Annual Costs
$658,000
13. ANNUAL COST PER HOUSEHOLD
Treatment Level
Households 10/15/2
Population ~ 2..Q.Q2
3962.2 5486.2 165 120

ALTERNATE NO. 6 AILE PlANTS MODIFICATION TO 10/15/Z
WITH NITRATE REMOVAl AILE, PELICAN BAY SERVICE AREA
14. SOIL SUITABILITY FOR SEPTIC TANK SYSTEMS (for developed area):
Slight limitations:
Moderation limitations:
Severe limitations: (slow percolation rates)
Severe limitations: (rock or flooding)
15. LOT SIZE RESTRICTION SUMMARY
16. SEPTIC TANK REGULATIONS
17. COMMENTS
_ percent
_ percent
_ percent
_ percent

ALTERNATE NO.7 AILE/FORT WORTH REGIONAL SYSTEM
SATELLITE TREATMENT SYSTEM 2.04 MGO
1. PLANNING AREA BOUNDARY:
ill.; J r-f j I
Azle City Limits, Fort Worth Intervening Area, Azle to Lakeside
2. NUMBER Of SERVICE AREAS:
3. SIZE AND POPULATION SUMMARY:
Service area Service size (acres) area In city Rural
Total
4. DISCHARGE SUMMARY:
Permit conditions
10/15 10/15/2
Flow (MGD)
2.04 2.04
BOD Clb/day)
10 10
7750
7750
popylation In city
10500
10500
TSS Clb/day)
15 15
2068
2068
Ammonia Clb/day)
2 2
Note: Size based on 2005 population at 120 gpcd.
Rural
6540
6540

5.
ALTERNATE NO. 1 AZLE/FORT WORTH REGIONAL SYSTEM
SATELLITE TREATMENT SYSTEM 2.04 MGO
ESTIMATED CAPITAL IMPROVEMENT NEED: Conveyance Facilities Only
A. Gravity Collection System:
Pipe Size length Unit cost Extended ( inches) (IF> ($/lF> cost
6 20 8 25
10 30 12 5600 34 $190,000 15 42 18 49 21 56 24 63
Total 5600 NIA $190,000
B. Li ft Stations:
2005 Capacity Lift population Required
Station served (MGD) Cost
1 2500 0.30 $120,000 2 10,500 1.26 $380,000 3 4 5
Total Cost $500,000

C. Force Mains:
Pipe Size (inches)
3 4 6 8 10
ALTERNATE NO. 7 AZLE/FORT WORTH REGIONAL SYSTEM
SATELLITE TREATMENT SYSTEM 2.04 MGO
Length (LEl
6,800 24,400
Unit cost ($/LFl
7.00 10.00 13.50 19.00 30,00
Extended cost
$129,000 $732,000
lota 1 $861,000
D. Base Sewer Cost: $1,551,000
E. Cost Factors: 1. Engineering Cost Factor (Fe): .088 2. Contractor Cost Factor (Fc): .096
F. Total Collection System Capital Cost: $1,836,000
6. ESTIMATED CAPITAL IMPROVEMENT NEEDS: Treatment Plant(s)
A. Number of Treatment Plants: 1
B. Plant Capacity and Cost Summary:
Plant Nymber
1
Total
Capacity J1rul
2.04
2.04
Constryction Cost 10/15 10/15/2
7,225,000 7,517,000
7,225,000 7,517,000
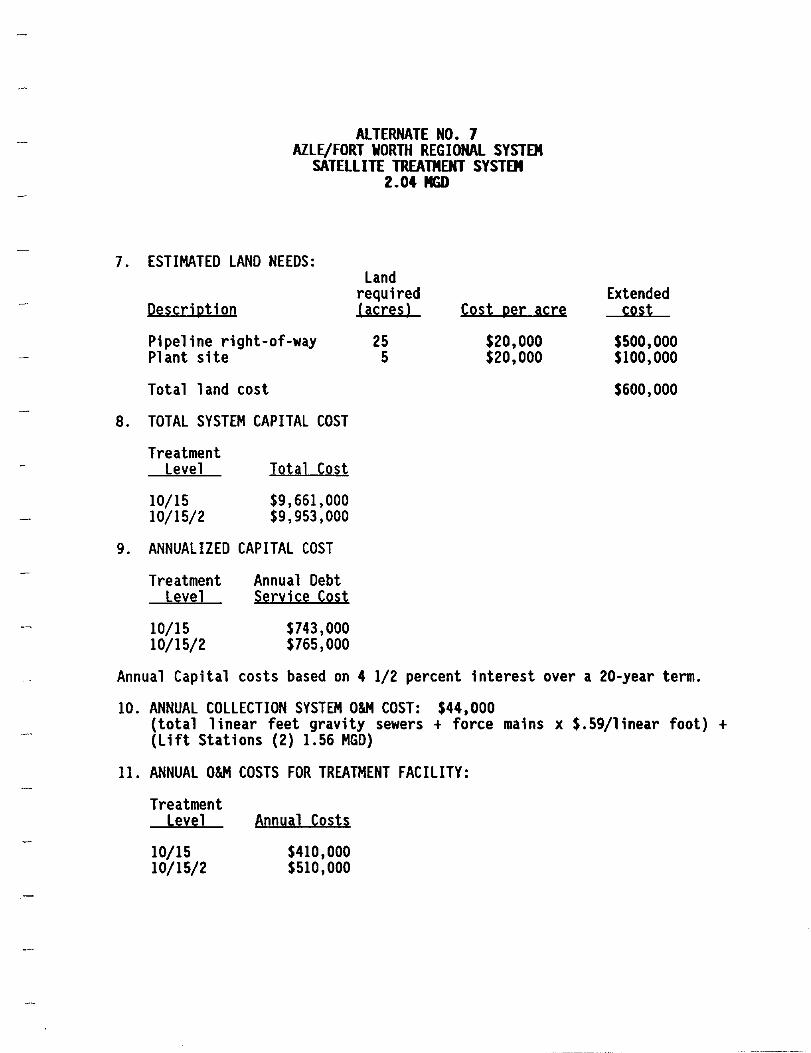
7.
8.
9.
ALTERNATE NO. 7 AILE/FORT WORTH REGIONAL SYSTEM
SATELLITE TREATMENT SYSTEM Z.04 MGO
ESTIMATED LAND NEEDS:
Description
Pipeline right-of-way Pl ant site
Total land cost
TOTAL SYSTEM CAPITAL COST
Treatment Level Total Cost
10115 $9,661,000 10/15/2 $9,953,000
ANNUALIZED CAPITAL COST
Treatment Level
10115 10/15/2
Annual Debt Service Cost
$743,000 $765,000
Land required (acres) Cost per acre
25 $20,000 5 $20,000
Extended cost
$500,000 $100,000
$600,000
Annual Capital costs based on 4 1/2 percent interest over a 20-year term.
10. ANNUAL COLLECTION SYSTEM O&M COST: $44,000 (total linear feet gravity sewers + force mains x $.59/linear foot) + (Lift Stations (2) 1.56 MGD)
11. ANNUAL O&M COSTS FOR TREATMENT FACILITY:
Treatment Level
10/15 10/15/2
Annyal Costs
$410,000 $510,000
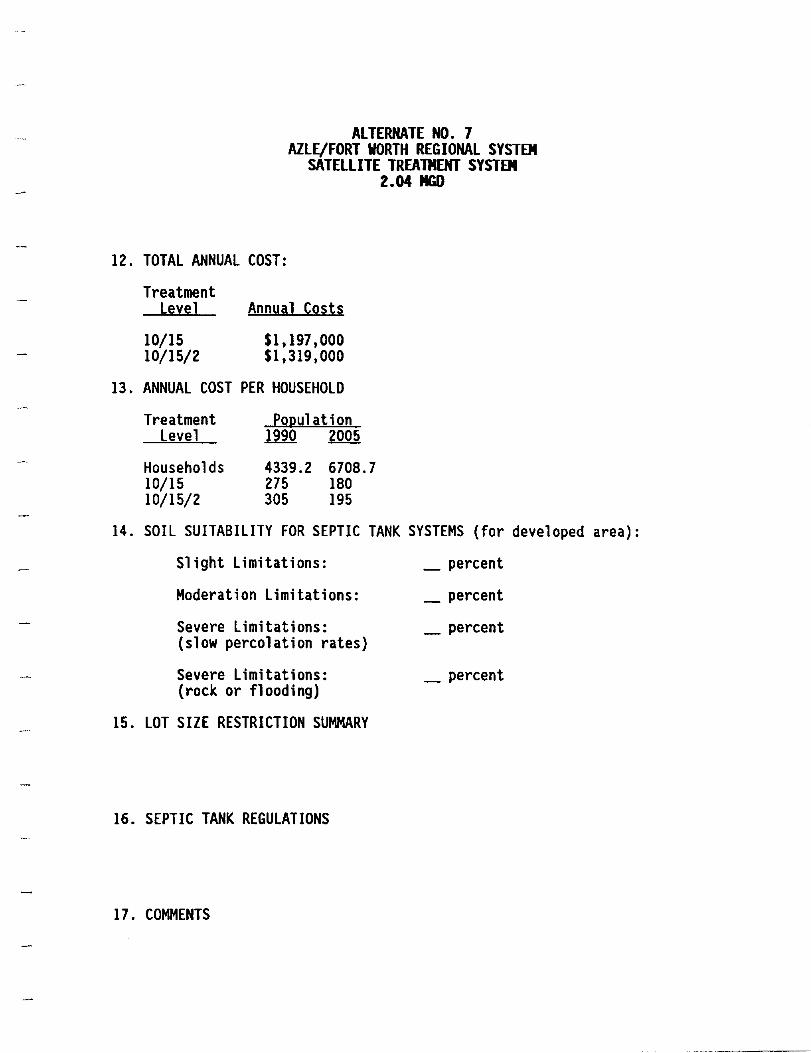
ALTERNATE NO.7 AZLE/FORT WORTH REGIONAL SYSTEM
SATELLITE TREATMENT SYSTEM 2.04 MGD
12. TOTAL ANNUAL COST:
Treatment Level
10/15 10/15/2
Annyal Costs
$1,197,000 $1,319,000
13. ANNUAL COST PER HOUSEHOLD
Treatment Level
Households 10/15 10/15/2
Popylation 1990 2005
4339.2 6708.7 275 180 305 195
14. SOIL SUITABILITY FOR SEPTIC TANK SYSTEMS (for developed area):
Slight Limitations:
Moderation Limitations:
Severe Limitations: (slow percolation rates)
Severe Limitations: (rock or flooding)
15. LOT SIZE RESTRICTION SUMMARY
16. SEPTIC TANK REGULATIONS
17. COMMENTS
_ percent
_ percent
_ percent
_ percent

ALTERNATE NO. 8 AZLE/FORT WORTH REGIONAL SYSTEM
SATELLITE TREATMENT SYSTEM 6.3 MGD
1. PLANNING AREA BOUNDARY:
Azle City Limits, Fort Worth Intervening Area, Azle to Lakeside, Live Oak and Silver Creek Watersheds
2. NUMBER OF SERVICE AREAS:
3. SIZE AND POPULATION SUMMARY:
Service area Popylation Service size (acres) In city Ryral area In city RYril ~ 2..Q92 ~ 2005
7750 10500 4288 8877
Total 7750 10500 4288 8877
4. DISCHARGE SUMMARY:
Permit Flow BOD TSS Ammonia conditions (MGD) Ob/day) Ob/day) (] b/day)
10/15 6.3 10 15 2
Note: Plant size and permit requirements per Fort Worth 201 Facilities Plan with effluent discharge to Marys Creek.

5.
ALTERNATE NO.8 AZLE/FORT WORTH REGIONAL SYSTEM
SATELLITE TREATMENT SYSTEM 6.3 "GO
ESTIMATED CAPITAL IMPROVEMENT NEED: Conveyance Facilities Only
A. Gravity Collection System:
Pipe Size Length Unit cost Extended (inches) (LF> ($/LF> cost
6 20 8 25
10 30 12 5600 34 $190,000 15 42 18 49 21 56 24 63
Total 5600 N/A $190,000
B. Lift Stations:
2005 Capacity Lift population Required
Station served (MGD) Cost
1 2500 0.30 $120,000 2 10,500 1.26 $380,000 3 4 5
Total Cost $500,000

C. Force Mains:
Pipe Size (inches)
3 4 6 8 16
ALTERNATE NO. 8 AZLE/FORT WORTH REGIONAL SYSTEM
SATELLITE TREATMENT SYSTEM 6.3 MGO
Length ClFl
6,800 24,400
Unit cost (S/LFl
7.00 10.00 13.50 19.00 30.00
Extended cost
S129,000 S732,000
Total $861,000
D. Base Sewer Cost: $1,551,000
E. Cost Factors: 1. Engineering Cost Factor (Fe): .088 2. Contractor Cost Factor (Fc): .096
F. Total Collection System Capital Cost: $1,836,000
6. ESTIMATED CAPITAL IMPROVEMENT NEEDS: Treatment Plant(s)
A. Number of Treatment Plants: 1
B. Plant Capacity and Cost Summary: Taken from Fort Worth 201 Facilities Plan and includes $2,000,000 for outfall to Marys Creek.
Plant Number
1
Total
Capacity ~
6.3
6.3
Construction Cost 10115
$20,900,000
$20,900,000

7.
S.
ALTERNATE NO. 8 AILE/FORT WORTH REGIONAL SYSTEM
SATELLITE TREATMENT SYSTEM 6.3 MGO
ESTIMATED lAND NEEDS:
Description
Pipeline right-of-way Plant site
Total land cost
TOTAL SYSTEM CAPITAL COST
Treatment level
10/15
Total Cost
$23,336,000
land required (acres) Cost per acre
25 $20,000 5 $20,000
9. ANNUALIZED CAPITAL COST
Treatment Level
10/15
Annual Debt Service Cost
$1,795,000
Extended cost
$500,000 $100,000
$600,000
Annual Capital costs based on 4 1/2 percent interest over a 20-year term.
10. ANNUAL COLLECTION SYSTEM O&M COST: $44,000 (total linear feet gravity sewers + force mains x $.59/1inear foot) + (lift stations (2) 1.56 MGD)
11. ANNUAL O&M COSTS FOR TREATMENT FACILITY:
Treatment Level
10/15
Annual Costs
$1,200,000

ALTERNATE NO.8 AZLE/FORT WORTH REGIONAL SYSTEM
SATELLITE TREATMENT SYSTEM 6.3 MGO
12. TOTAL ANNUAL COST:
Treatment Level
10/15
Annual Costs
$3,039,000
13. ANNUAL COST PER HOUSEHOLD
Treatment Level
Households 10/15
popylation ll2Q 2005
5220.9 7628.7 580 400
14. SOIL SUITABILITY FOR SEPTIC TANK SYSTEMS (for developed area):
Slight Limitations:
Moderation Limitations:
Severe Limitations: (slow percolation rates)
Severe Limitations: (rock or flooding)
15. LOT SIZE RESTRICTION SUMMARY
16. SEPTIC TANK REGULATIONS
17. COMMENTS
_ percent
_ percent
_ percent
_ percent

ALTERNATE NO. 9 AZLE/FORT WORTH REGIONAL SYSTEM
VILLAGE CREEK WTP
1. PLANNING AREA BOUNDARY:
Azle City Limits
2. NUMBER OF SERVICE AREAS:
3. SIZE AND POPULATION SUMMARY:
Service area
Total
Service area size (acres)
In city RYril
AZLE ONLY
Population In city
7750 10500
7750 10500
4. DISCHARGE SUMMARY: No Local Discharge
Rural
Note: Discharge to Fort Worth System for treatment at Village Creek WWTP. In 1980 approximately 60% of Azle population served by municipal system and present level has increased to 80%.

5.
ALTERNATE NO. 9 AZLE/FORT WORTH REGIONAL SYSTEM
VILLAGE CREEK WTP AZLE ONLY
ESTIMATED CAPITAL IMPROVEMENT NEED: Conveyance Facilities Only
A. Gravity Collection System:
Pipe Size Length Unit cost Extended (inches) (LF) ($/LF) cost
6 20 8 25
10 8,700 30 $261,000 12 34 15 42 18 49 21 56 24 63
Total 8,700 N/A $261,000
B. Li ft Stat ions:
2005 Capacity Lift population Required
Station served (MGD) Cost
1 2,100 .252 $ 65,000 2 10,500 1.26 $380,000 3 4 5
Total Cost $445,000

C. Force Mains:
Pipe Size (inches)
3 4 6 8 16
ALTERNATE NO. 9 AZL~FORT WORTH REGIONAL SYSTEM
VILLAGE CREEK WTP
Length (If)
6,800 11 ,000
AZLE ONLY
Unit cost ($/LF)
7.00 10.00 13.50 19.00 30.00
Extended cost
$129,000 $330,000
Total $459,000
D. Base Sewer Cost: $1,165,000
E. Cost Factors: 1. Engineering Cost Factor (Fe): .094 2. Contractor Cost Factor (Fc): .10
F. Total Collection System Capital Cost: $1,391,000
6. ESTIMATED CAPITAL IMPROVEMENT NEEDS: Treatment Plant(s)
A. Number of Treatment Plants: None
7. ESTIMATED LAND NEEDS: Land
required Extended Description (acres) Cost per acre cost
Pipeline right-of-way 16 $20,000 $320,000
Total land cost $320,000
8. TOTAL SYSTEM CAPITAL COST: $1,711,000
9. ANNUALIZED CAPITAL COST: $132,000
Annual Capital costs based on 4 1/2 percent interest over a 20-year term.

ALTERNATE NO.9 AZLE/FORT WORTH REGIONAL SYSTEM
VILLAGE CREEK WVTP AZLE ONLY
10. ANNUAL COLLECTION SYSTEM O&M COST: $44,000 (total 1 inear feet gravity sewers + force mains x $.59/linear foot) + (lift stations (2) 1.512 MGD)
11. ANNUAL TREATMENT COSTS: $248,000 Flow based on 2005 population at 120 gpcd
12. TOTAL ANNUAL COST: $424,000
13. ANNUAL COST PER HOUSEHOLD
Treatment Level
Population 1990 2005
Households 2723 4134 By Fort Worth 155 105
14. SOIL SUITABILITY FOR SEPTIC TANK SYSTEMS (for developed area):
Slight Limitations:
Moderation Limitations:
Severe Limitations: (slow percolation rates)
Severe Limitations: (rock or flooding)
15. LOT SIZE RESTRICTION SUMMARY
_ percent
_ percent
_ percent
_ percent
ALTERNATE NO.9 AZL~FORT WORTH REGIONAL SYSTEM
VI LLAGE CREEK WTP AZLE ONLY
16. SEPTIC TANK REGULATIONS
17. COMMENTS

ALTERNATE NO. 10 AZLE/FORT VORTH REGIONAL SYSTEM
VILLAGE CREEK WTP AZLE, PELICAN BAY
1. PLANNING AREA BOUNDARY:
Azle, Pelican Bay
2. NUMBER OF SERVICE AREAS:
3. SIZE AND POPULATION SUMMARY:
Service area Popylation Service size (acres) In city Ryral area In city RYrsl .rnz ~
9290 13,935
Total 9290 13,935
4. DISCHARGE SUMMARY: No Local Discharge
Note: Discharge to Fort Worth System for treatment at Village Creek WWTP.
5. ESTIMATED CAPITAL IMPROVEMENT NEED: Conveyance Facilities Only
A. Gravity Collection System:
Pipe Size ( inches)
6 8
10 12 15 18 21 24
Total
Length lLF)
8,700
8,700
Unit cost CS/LFl
20 25 30 34 42 49 56 63
N/A
Extended cost
$365,000
$365,000

6.
B.
C.
D.
E.
F.
Lift Stations:
Lift Station
1 2 3 4 5
Total Cost
Force Mains:
Pipe Size (inches)
3 4 6 8 12 21
Total
ALTERNATE NO. 10 AZlE/FORT WORTH REGIONAL SYSTEM
VILLAGE CREEK WTP AZlE, PELICAN BAY
2005 Capacity population Required
served (MGDl
5,535 .596 13,935 1.604
length Unit cost (lFl U/lFl
7.00 10.00 13.50 19.00
6,800 24.00 11 ,000 45.00
17 ,800
Base Sewer Cost: $1,653,000
Cost Factors: 1. Engineering Cost Factor (Fe): .088 2. Contractor Cost Factor (Fc): .095
Total Collection System Capital Cost: $1,955,000
Cost
$180,000 $450,000
$630,000
Extended cost
$163,000 495,000
$658,000
ESTIMATED CAPITAL IMPROVEMENT NEEDS: Treatment Plant(s)
A. Number of Treatment Plants: None

7.
8.
9.
ALTERNATE NO. 10 AZLE/FORT WORTH REGIONAL SYSTEM
VILLAGE CREEl( WTP AZLE, PELICAN BAY
ESTIMATED LAND NEEDS: Land
required Descriptjon (acres) Cost per acre
Pipeline right-of-way 16 $20,000
Total land cost
TOTAL SYSTEM CAPITAL COST: $2,275,000
ANNUALIZED CAPITAL COST: $175,000
Extended cost
$320,000
$320,000
Annual Capital costs based on 4 1/2 percent interest over a 20-year term.
10. ANNUAL COLLECTION SYSTEM O&M COST: $45,000 (total linear feet gravity sewers + force mains x $.59/1inear foot) + (lift stations (2) 2.2 MGD)
11. ANNUAL TREATMENT COSTS: $315,000 F1 ow based on 2005 popu1 at i on at 120 gpcd for Azl e and 100 gpcd for Pel ican Bay.
12. TOTAL ANNUAL COST: $535,000
13. ANNUAL COST PER HOUSEHOLD
Treatment Level
Population lli2 ~
Households 3962.2 5486.2 By Fort Worth 135 95

ALTERNATE NO. 10 AZLE/FORT WORTH REGIONAL SYSTEM
VILlAGE CREEK WTP AZLE. PELICAN BAY
14. SOIL SUITABILITY FOR SEPTIC TANK SYSTEMS (for developed area):
Slight Limitations:
Moderation Limitations:
Severe Limitations: (slow percolation rates)
Severe Limitations: (rock or flooding)
15. LOT SIZE RESTRICTION SUMMARY
16. SEPTIC TANK REGULATIONS
17. COMMENTS
_ percent
_ percent
_ percent
_ percent

ALTERNATE NO. 11 AILE/FORT WORTH REGIONAL SYSTEM
VILLAGE CREEK WTP AILE, WEST SIDE EML
1. PLANNING AREA BOUNDARY:
Hli 7 "
Azle, Pelican Bay, Briar Creek, Swift Branch, Peden, Reno, Ash Creek, Walnut Creek
2. NUMBER OF SERVICE AREAS: 8
3. SIZE AND POPULATION SUMMARY:
Service area size (acres) Service
area In city RYril
Briar Crk Swift Br Peden Pelican Bay Reno Azle (Walnut) Azle (Ash) Ash Crk
Total
Population In city
1 , 300 . i 1 3 , 160 1,155 (jFb 2,550 (/,'J
1, 550? ~(",r 2,100 6,2003' 8,400
10,205 16,210 1'(
Rural .l2.aI 2005
920 .'1. 1,535 560 \9"1. 't. 930 430 '\11 710 240 275
1,122 /2 irL 1,875
3,482 5,785
4. DISCHARGE SUMMARY: No Local Discharge
Note: Discharge to Fort Worth System for treatment at Village Creek WWTP.
5. ESTIMATED CAPITAL IMPROVEMENT NEED: Collection System
L\ .~
'c ", S \ 'j 't

ALTERNATE NO. 11 AZLE/FORT WORTH REGIONAL SYSTEM
VILLAGE CREEK WTP AZLE, VEST SIDE EML
A. Gravity Collection System:
Pipe Size Length Unit cost ( inches 1 (LF) ($/Lfl
6 16,000 20 8 31,500 25
10 16,500 30 12 18,000 34 15 2,000 42 18 6,000 49 21 56 24 63
Total 82,500 N/A (for O&M)
B. Lift Stations:
2005 Capacity Lift population Required
Station served (MGDl
Briar Crk 1 .154 Swi ft Br 2 .093 Peden 3 .071 Pelican B 4 .344 Walnut Ck 5 1.167 Ash Crk 6 2.2
Total Cost
Extended cost
$ 320,000 787,500 307,500 (7500' @ 612,000 $5/LF; 84,000 8"tol0")
294,000
$2,405,000
Cost
38,000 25,000 25,000 90,000
340,000 740,000
$1,258,000
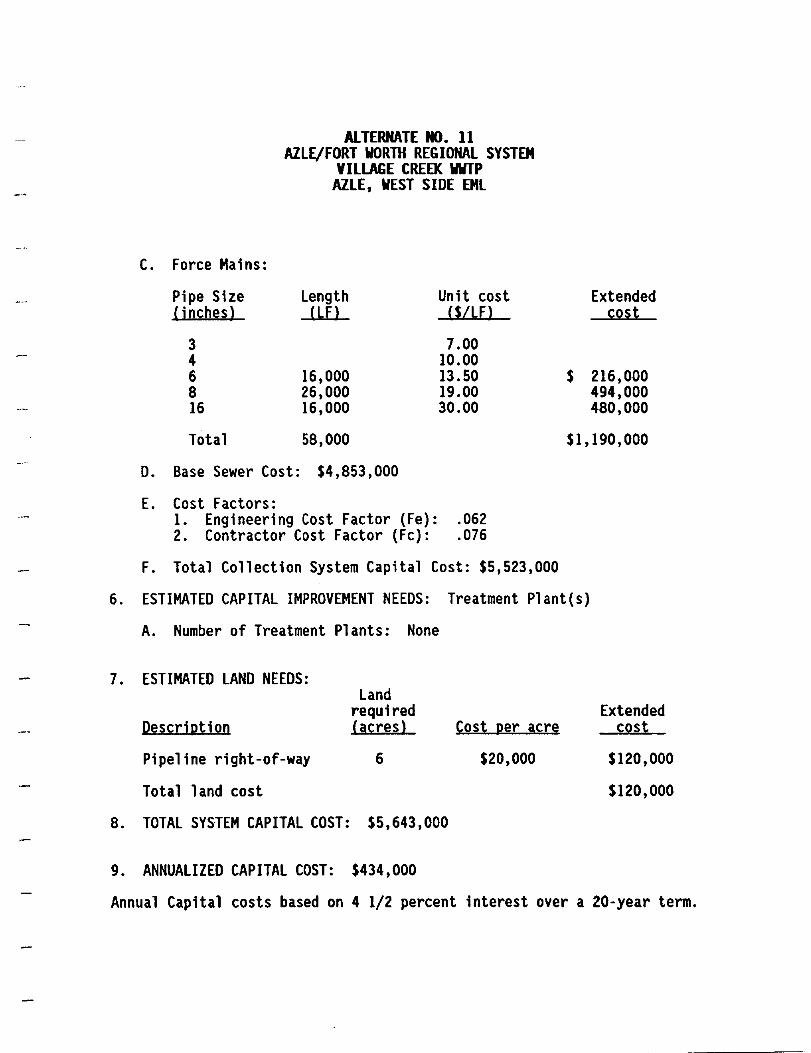
C. Force Mains:
Pipe Size Cinches)
3 4 6 8 16
Total
ALTERNATE NO. 11 AILE/FORT WORTH REGIONAL SYSTEM
VILLAGE CREEK WTP AILE, WEST SIDE EML
Length (Lf)
16,000 26,000 16,000
58,000
Unit cost (S/LFl
7.00 10.00 13.50 19.00 30.00
D. Base Sewer Cost: $4,853,000
E. Cost Factors: 1. Engineering Cost Factor (Fe): .062 2. Contractor Cost Factor (Fc): .076
F. Total Collection System Capital Cost: $5,523,000
Extended cost
$ 216,000 494,000 480,000
$1,190,000
6. ESTIMATED CAPITAL IMPROVEMENT NEEDS: Treatment Plant(s)
A. Number of Treatment Plants: None
7. ESTIMATED LAND NEEDS: Land
required Descrjption (acres)
Pipeline right-of-way 6
Total land cost
8. TOTAL SYSTEM CAPITAL COST: $5,643,000
9. ANNUALIZED CAPITAL COST: $434,000
Cost per acre
$20,000
Extended cost
$120,000
$120,000
Annual Capital costs based on 4 1/2 percent interest over a 20-year term.

ALTERNATE NO. 11 AILE/FORT WORTH REGIONAL SYSTEM
VILLAGE CREEK WTP AZLE, WEST SIDE EML
10. ANNUAL COLLECTION SYSTEM O&M COST: $153,000 (total linear feet gravity sewers + force mains x $.59/1inear foot) + (lift stations (6) 4.029 MGD)
11. ANNUAL TREATMENT COSTS: $475,000 Flow based on 2005 population at 120 gpcd for Az1e and 100 gpcd for Other Service Areas.
12. TOTAL ANNUAL COST: $1,062,000
13. ANNUAL COST PER HOUSEHOLD
Treatment Level
Population 1990 2005
Households 5933.7 8659.4 By Fort Worth 180 125
14. SOIL SUITABILITY FOR SEPTIC TANK SYSTEMS (for developed area):
Slight Limitations:
Moderation Limitations:
Severe Limitations: (slow percolation rates)
Severe Limitations: (rock or flooding)
15. LOT SIZE RESTRICTION SUMMARY
_ percent
_ percent
_ percent
_ percent