EADS CFIR Roadshow Presentation October 2010 · Roadshow Presentation October 2010 . 2 Safe Harbour...
52
EADS Hans Peter Ring CFO Roadshow Presentation October 2010
Transcript of EADS CFIR Roadshow Presentation October 2010 · Roadshow Presentation October 2010 . 2 Safe Harbour...
EADS
Hans Peter RingCFO
Roadshow PresentationOctober 2010
2
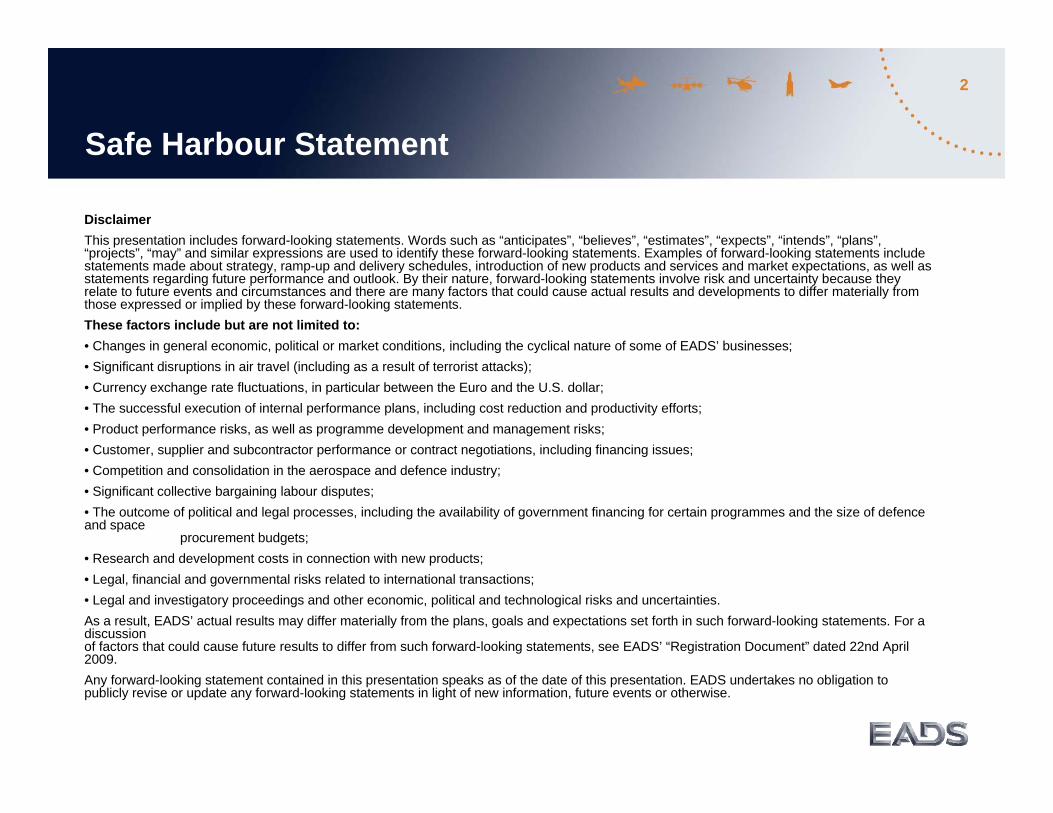
Safe Harbour Statement
DisclaimerThis presentation includes forward-looking statements. Words such as “anticipates”, “believes”, “estimates”, “expects”, “intends”, “plans”, “projects”, “may” and similar expressions are used to identify these forward-looking statements. Examples of forward-looking statements include statements made about strategy, ramp-up and delivery schedules, introduction of new products and services and market expectations, as well as statements regarding future performance and outlook. By their nature, forward-looking statements involve risk and uncertainty because they relate to future events and circumstances and there are many factors that could cause actual results and developments to differ materially from those expressed or implied by these forward-looking statements.These factors include but are not limited to:• Changes in general economic, political or market conditions, including the cyclical nature of some of EADS’ businesses;• Significant disruptions in air travel (including as a result of terrorist attacks);• Currency exchange rate fluctuations, in particular between the Euro and the U.S. dollar;• The successful execution of internal performance plans, including cost reduction and productivity efforts; • Product performance risks, as well as programme development and management risks;• Customer, supplier and subcontractor performance or contract negotiations, including financing issues;• Competition and consolidation in the aerospace and defence industry;• Significant collective bargaining labour disputes;• The outcome of political and legal processes, including the availability of government financing for certain programmes and the size of defence and space
procurement budgets; • Research and development costs in connection with new products;• Legal, financial and governmental risks related to international transactions;• Legal and investigatory proceedings and other economic, political and technological risks and uncertainties.As a result, EADS’ actual results may differ materially from the plans, goals and expectations set forth in such forward-looking statements. For a discussion of factors that could cause future results to differ from such forward-looking statements, see EADS’ “Registration Document” dated 22nd April 2009.Any forward-looking statement contained in this presentation speaks as of the date of this presentation. EADS undertakes no obligation to publicly revise or update any forward-looking statements in light of new information, future events or otherwise.
Group HighlightsHighlights H1 2010Drivers of ProfitabilityGuidance 2010 & Outlook
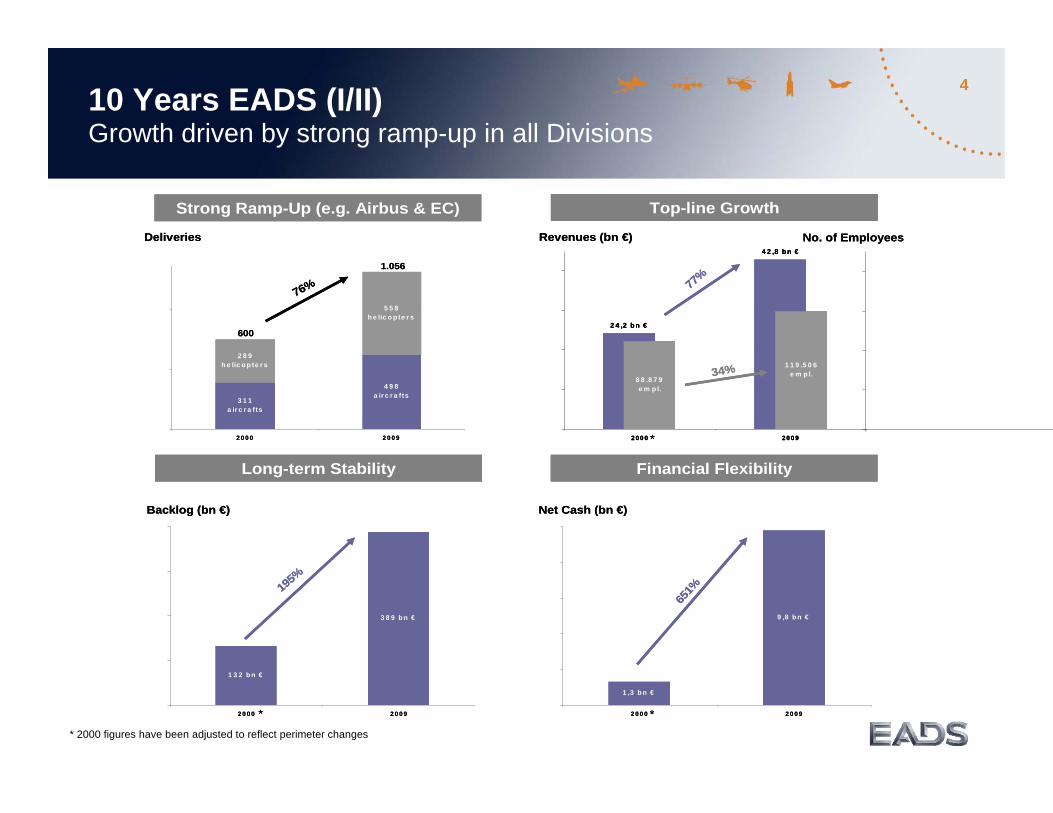
410 Years EADS (I/II) Growth driven by strong ramp-up in all Divisions
9 ,8 b n €
1 ,3 b n €
2 0 0 0 2 0 0 9
1 3 2 b n €
3 8 9 b n €
2 0 0 0 2 0 0 9
3 1 1a ir c r a f ts
4 9 8a ir c r a fts
5 5 8h e lic o p te r s
2 8 9h e lic o p te r s
2 0 0 0 2 0 0 9
2 4 ,2 b n €
4 2 ,8 b n €
8 8 .8 7 9e m p l.
1 1 9 .5 0 6e m p l.
2 0 0 0 2 0 0 9
Strong Ramp-Up (e.g. Airbus & EC)
Long-term Stability
Top-line Growth
Financial Flexibility
Deliveries
Backlog (bn €)
Revenues (bn €) No. of Employees
Net Cash (bn €)
600
1.056
76%
195%
651%
77%
34%
*
*
*
9 ,8 b n €
1 ,3 b n €
2 0 0 0 2 0 0 9
1 3 2 b n €
3 8 9 b n €
2 0 0 0 2 0 0 9
3 1 1a ir c r a f ts
4 9 8a ir c r a fts
5 5 8h e lic o p te r s
2 8 9h e lic o p te r s
2 0 0 0 2 0 0 9
2 4 ,2 b n €
4 2 ,8 b n €
8 8 .8 7 9e m p l.
1 1 9 .5 0 6e m p l.
2 0 0 0 2 0 0 9
2 4 ,2 b n €
4 2 ,8 b n €
8 8 .8 7 9e m p l.
1 1 9 .5 0 6e m p l.
2 0 0 0 2 0 0 9
Strong Ramp-Up (e.g. Airbus & EC)
Long-term Stability
Top-line Growth
Financial Flexibility
Deliveries
Backlog (bn €)
Revenues (bn €) No. of Employees
Net Cash (bn €)
600
1.056
76%
195%
651%
77%
34%
*
*
*
* 2000 figures have been adjusted to reflect perimeter changes
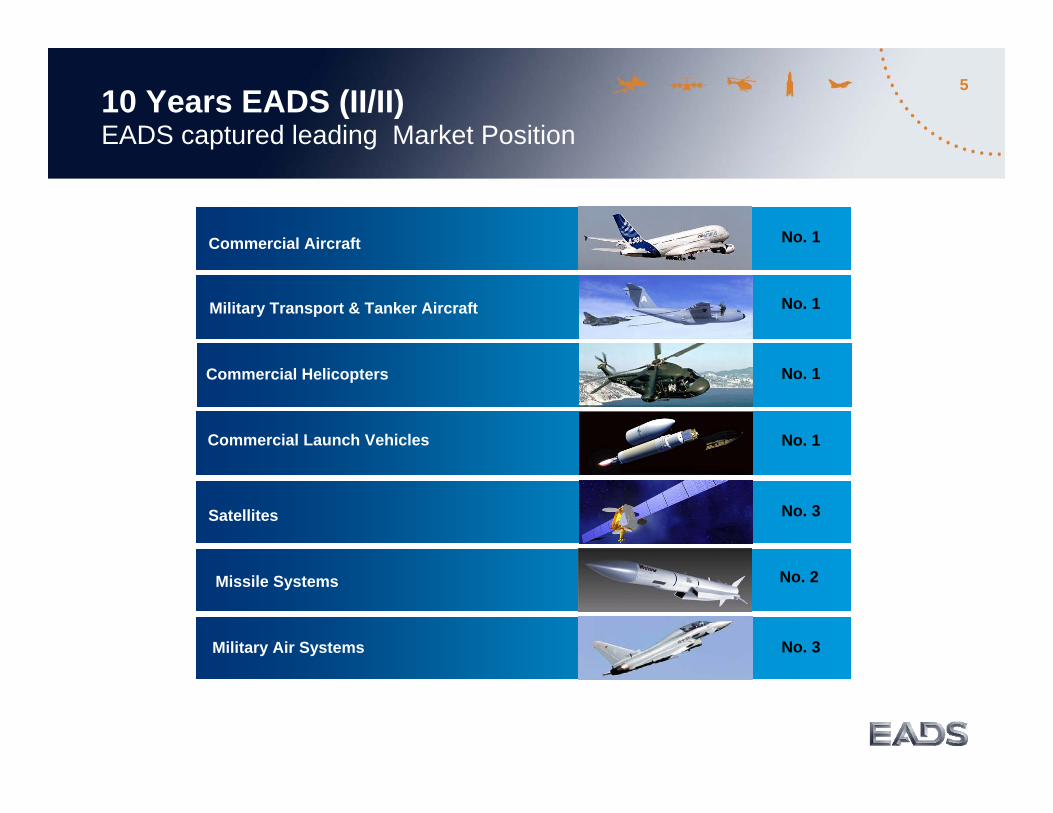
510 Years EADS (II/II) EADS captured leading Market Position
No. 2
No. 3
No. 3
No. 1
No. 1
Commercial Aircraft
Commercial Helicopters
Commercial Launch Vehicles
Missile Systems
Satellites
Military Transport & Tanker Aircraft
Military Air Systems
No. 1
No. 1
Group HighlightsHighlights H1 2010Drivers of ProfitabilityGuidance 2010 & Outlook

7
Business & Financial Highlights: H1 2010
* Pre-goodwill impairment and exceptionals
Business Highlights• Signs of improvement in commercial aircraft environment; orders and commitments for 255 aircraft at
Farnborough; Single Aisle rate increase to 38 aircraft per month in Q3 2011 and 40 in Q1 2012;• Deliveries: 250 commercial aircraft, 249 helicopters; 37th consecutive success for Ariane 5;• Order book: € 454 bn at H1 2010 of which Defence € 56.6 bn;• A400M:
– Working towards a contract amendment; management assumptions for the provision remain valid;– Flight test programme results better than expected; Flight Management System on the critical path.
• EADS North America: bid submitted for US Air Force Tanker.
Financial Highlights• Revenues € 20.3 bn, of which € 13.9 bn for Airbus; • EBIT* before one-off: € 0.6 bn for EADS, € 0.3 bn for Airbus; • Net cash: € 8.9 bn after pension contributions of € 0.3 bn;
– Free Cash Flow consumption of € 0.7 bn; customer financing cash outflow € 0.3 bn;– Receipts from governments for development programs compensate payment delays.
• Net income € 0.2 bn.
8
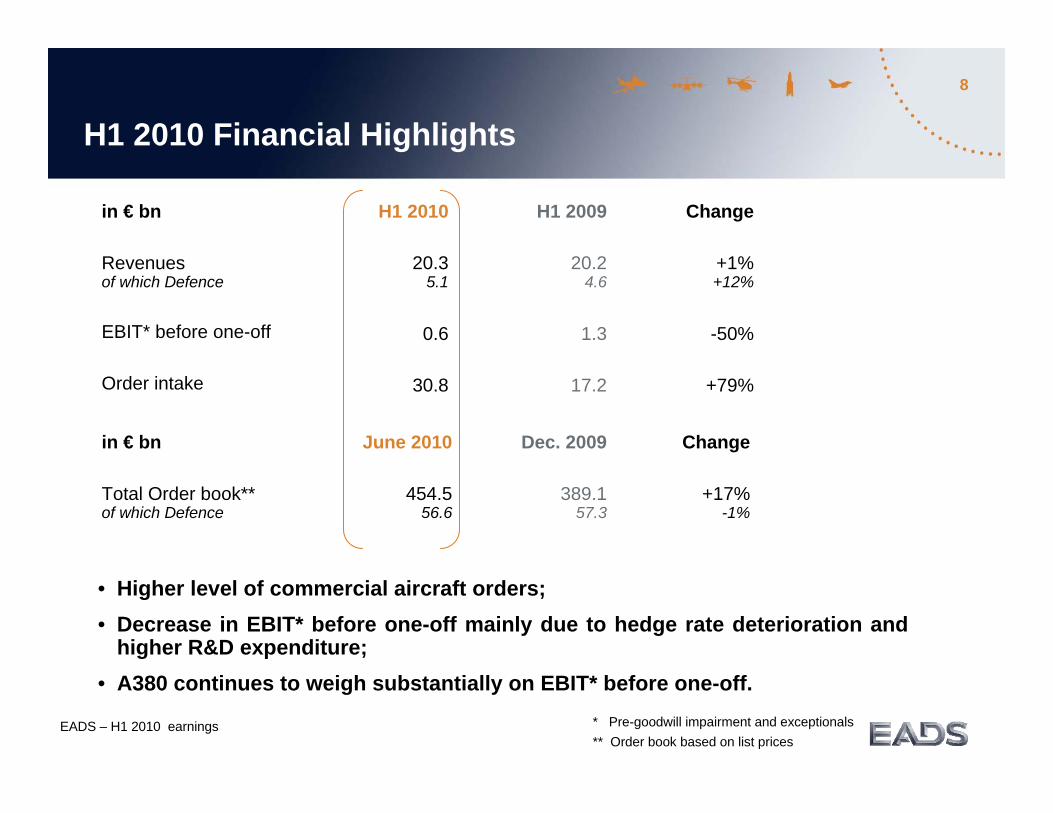
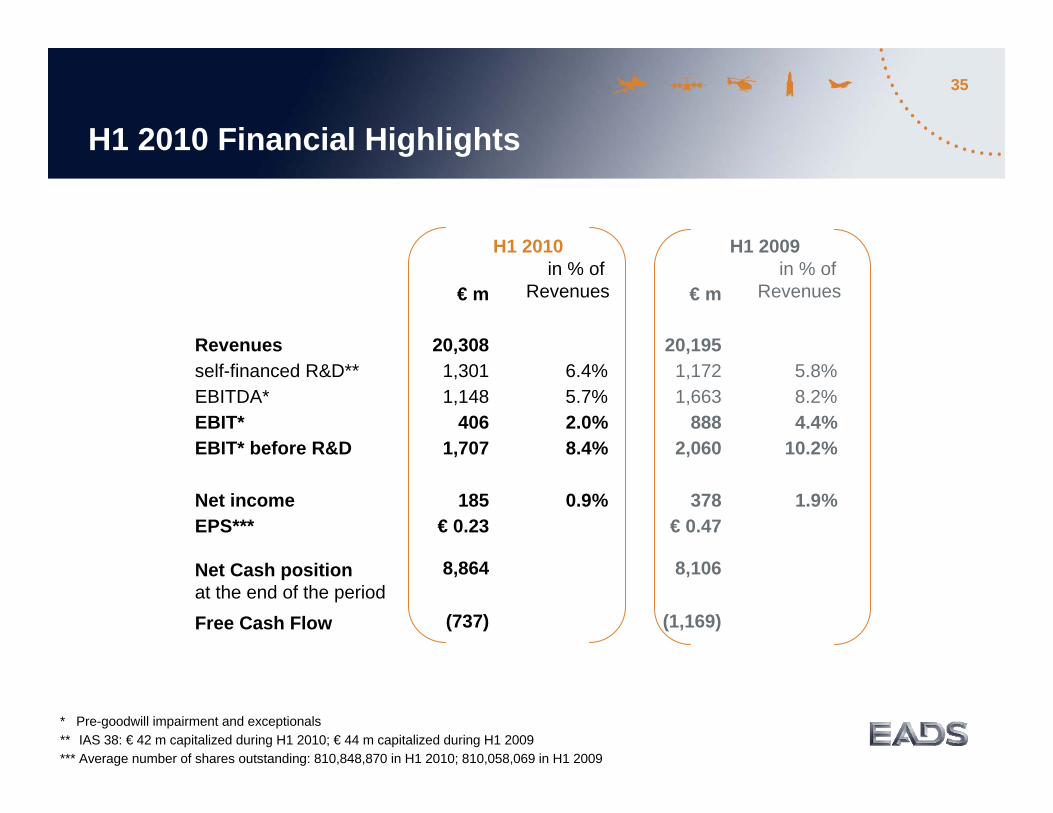
H1 2010 Financial Highlights
EADS – H1 2010 earnings * Pre-goodwill impairment and exceptionals** Order book based on list prices
in € bn
Revenuesof which Defence
EBIT* before one-off
Order intake
H1 2009
20.24.6
1.3
17.2
in € bn
Total Order book**of which Defence
June 2010
454.556.6
Dec. 2009
389.157.3
Change
+17%-1%
• Higher level of commercial aircraft orders; • Decrease in EBIT* before one-off mainly due to hedge rate deterioration and
higher R&D expenditure;• A380 continues to weigh substantially on EBIT* before one-off.
H1 2010
20.3 5.1
0.6
30.8
Change
+1% +12%
-50%
+79%
9
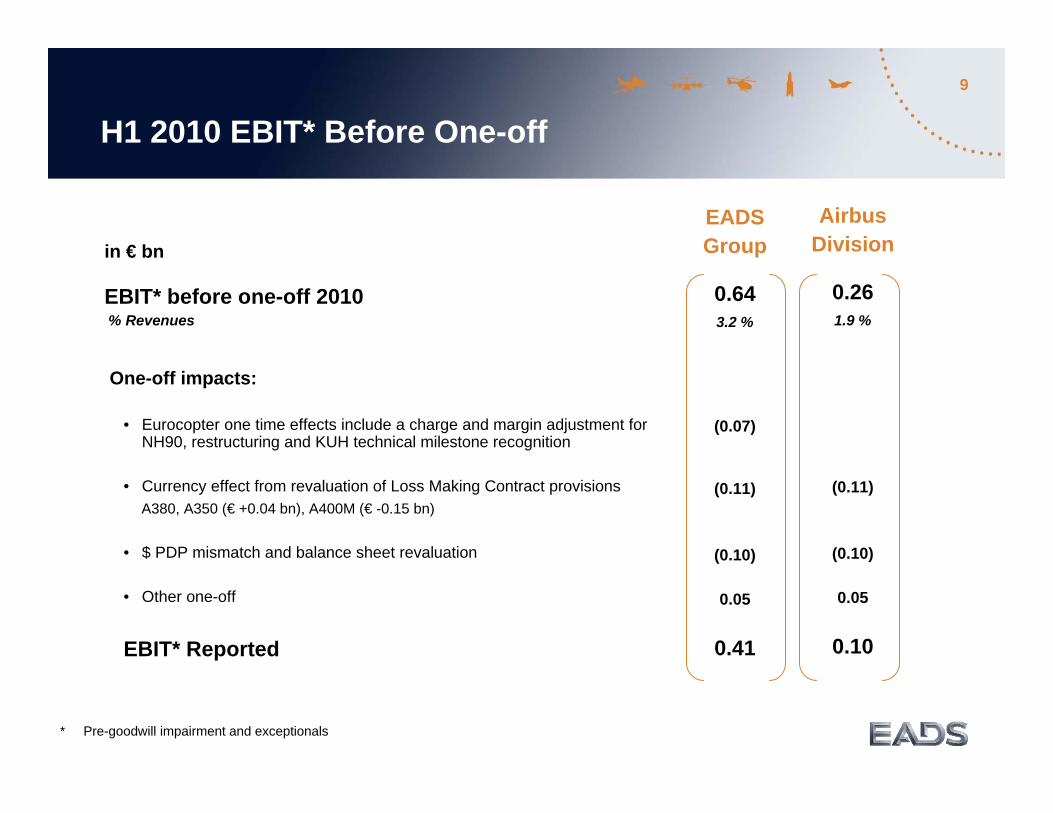
H1 2010 EBIT* Before One-off
* Pre-goodwill impairment and exceptionals
in € bn
EBIT* before one-off 2010% Revenues
One-off impacts:
• Eurocopter one time effects include a charge and margin adjustment for NH90, restructuring and KUH technical milestone recognition
• Currency effect from revaluation of Loss Making Contract provisions A380, A350 (€ +0.04 bn), A400M (€ -0.15 bn)
• $ PDP mismatch and balance sheet revaluation
• Other one-off
EBIT* Reported
AirbusDivision
0.261.9 %
(0.11)
(0.10)
0.05
0.10
EADSGroup
0.643.2 %
(0.07)
(0.11)
(0.10)
0.05
0.41
10
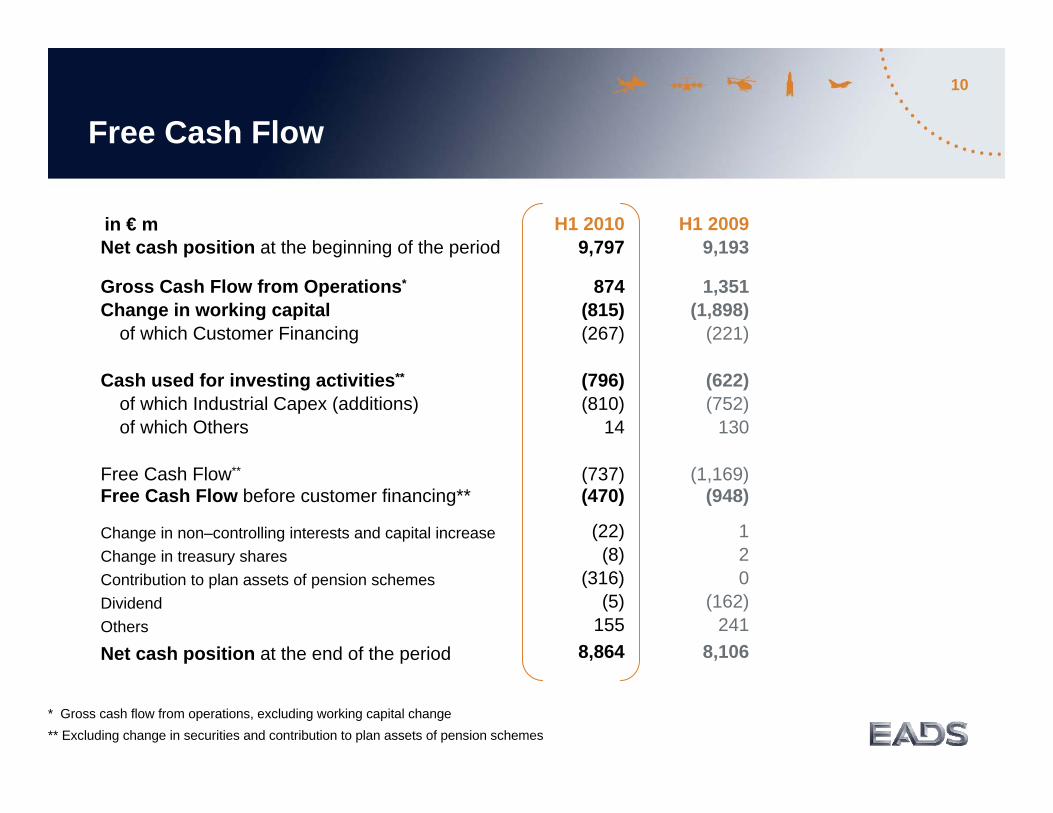
* Gross cash flow from operations, excluding working capital change** Excluding change in securities and contribution to plan assets of pension schemes
Free Cash Flow
874(815)(267)
(796)(810)
14
(737)
in € mNet cash position at the beginning of the period
Net cash position at the end of the period
Change in non–controlling interests and capital increaseChange in treasury sharesContribution to plan assets of pension schemesDividendOthers
8,864
Free Cash Flow before customer financing** (948)(470)
8,106
H1 20099,193
H1 20109,797
1,351(1,898)
(221)
(622)(752)
130
(1,169)
Gross Cash Flow from Operations*
Change in working capitalof which Customer Financing
Cash used for investing activities**
of which Industrial Capex (additions)of which Others
Free Cash Flow**
120
(162)241
(22)(8)
(316)(5)
155
Group HighlightsFinancial Highlights H1 2010Drivers of ProfitabilityGuidance 2010 & Outlook
12
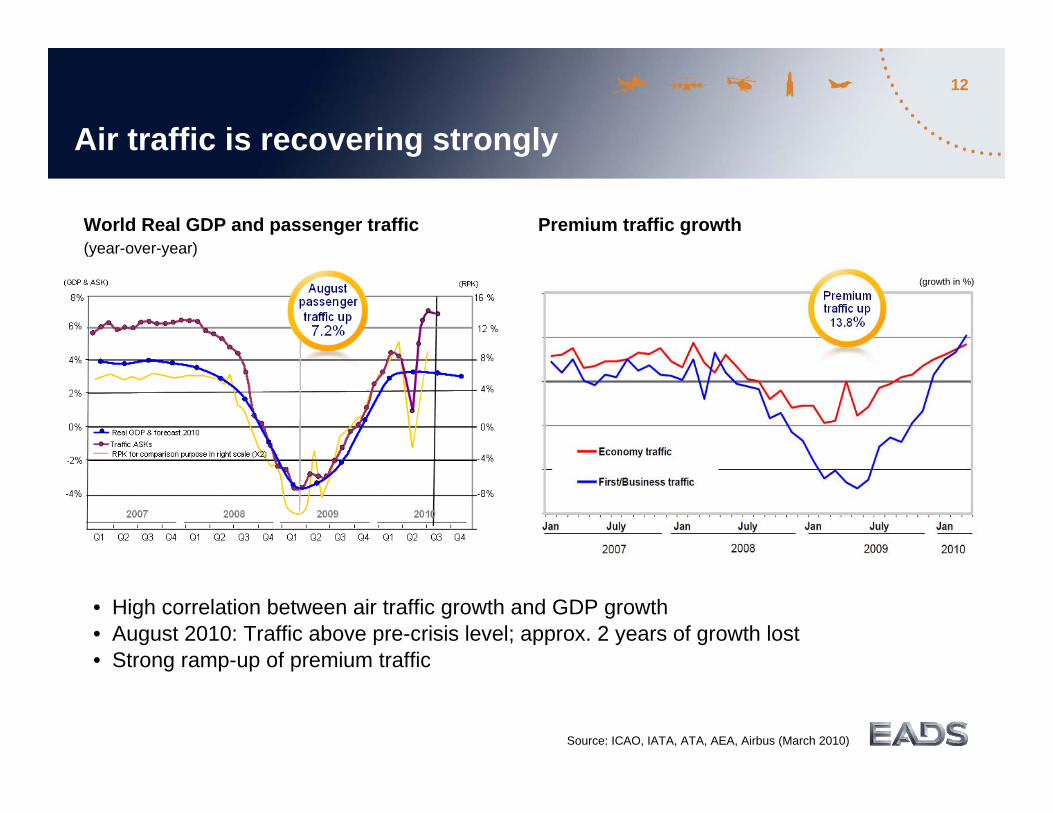
Air traffic is recovering strongly
Source: ICAO, IATA, ATA, AEA, Airbus (March 2010)
• High correlation between air traffic growth and GDP growth• August 2010: Traffic above pre-crisis level; approx. 2 years of growth lost• Strong ramp-up of premium traffic
World Real GDP and passenger traffic(year-over-year)
Premium traffic growth
(growth in %)
13
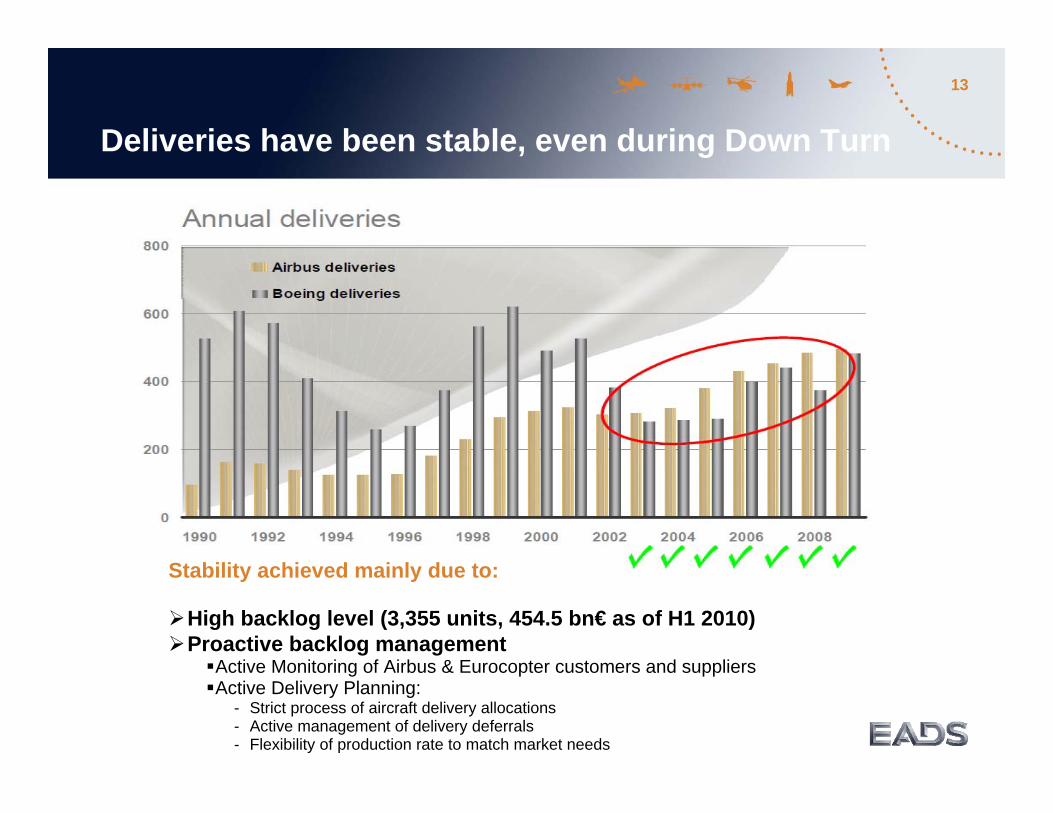
Deliveries have been stable, even during Down Turn
Stability achieved mainly due to:
High backlog level (3,355 units, 454.5 bn€ as of H1 2010)Proactive backlog management
Active Monitoring of Airbus & Eurocopter customers and suppliersActive Delivery Planning:
- Strict process of aircraft delivery allocations- Active management of delivery deferrals- Flexibility of production rate to match market needs
14
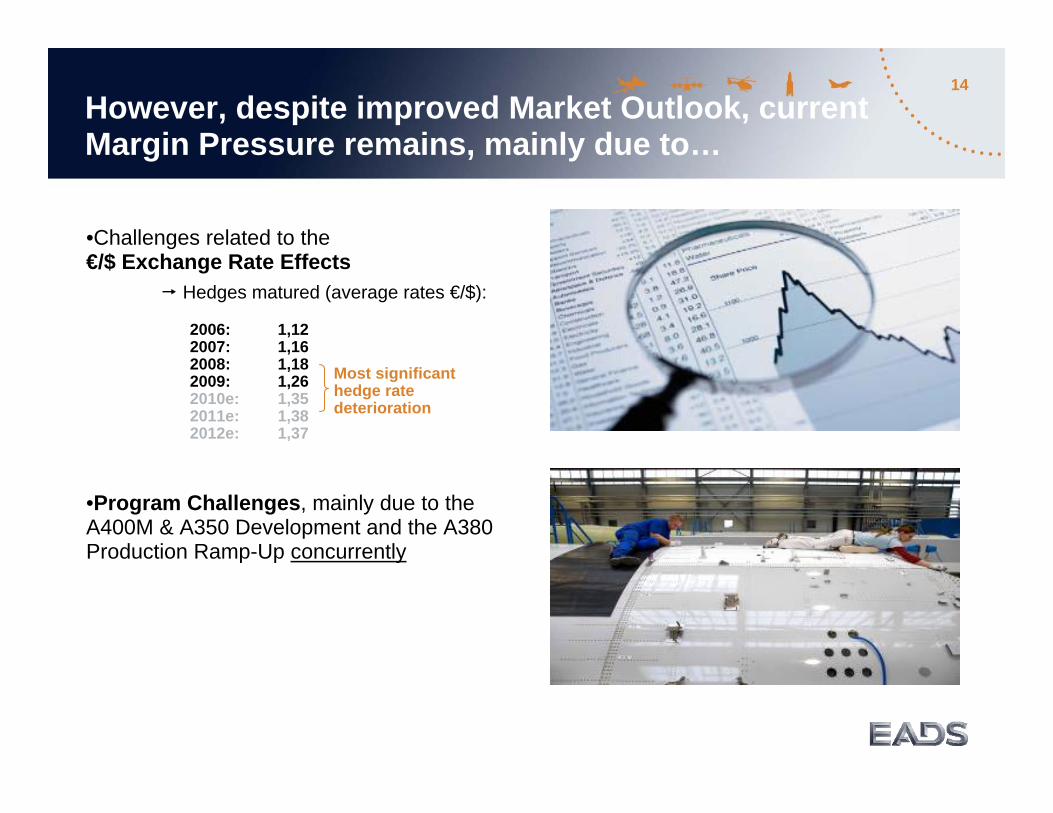
•Challenges related to the€/$ Exchange Rate Effects
Hedges matured (average rates €/$):
2006: 1,122007: 1,162008: 1,182009: 1,262010e: 1,352011e: 1,382012e: 1,37
•Program Challenges, mainly due to the A400M & A350 Development and the A380 Production Ramp-Up concurrently
Most significant hedge rate deterioration
However, despite improved Market Outlook, current Margin Pressure remains, mainly due to…

15
Currency Hedge Policy
Mark-to-market value = € - 6.2 bn
€ vs $*** 1,37 1,38 1,37 1,39 1,40 1,41£ vs $ 1,73 1,75 1,63 1,58 1,59 1,63
EADS hedge portfolio, 30th June 2010($ 70.1 bn*), average rates of € 1 = $ 1.38*** and £ 1 = $ 1.67
• Approximately 50% of EADS’ US$ revenues naturally hedged by US$ procurement;• In H1 2010, hedges of $ 9.4 bn* matured at an average hedge rate of € 1 = $ 1.34; • In H1 2010, new hedge contracts of $ 20.6 bn** were added at an average rate of € 1= $ 1.34***.
Average hedge rates
Remaining6 months
7,3
0,80,4
9,0
19,2 18,0
11,9
4,7
0
5
10
15
20
2010 2011 2012 2013 2014 2015+
US$ bn Collars
Forward contracts
* Total hedge amount also contains $/ £ hedges** Includes $ 1.9 bn of options restructuring*** includes Collars at their least favourable rates
16
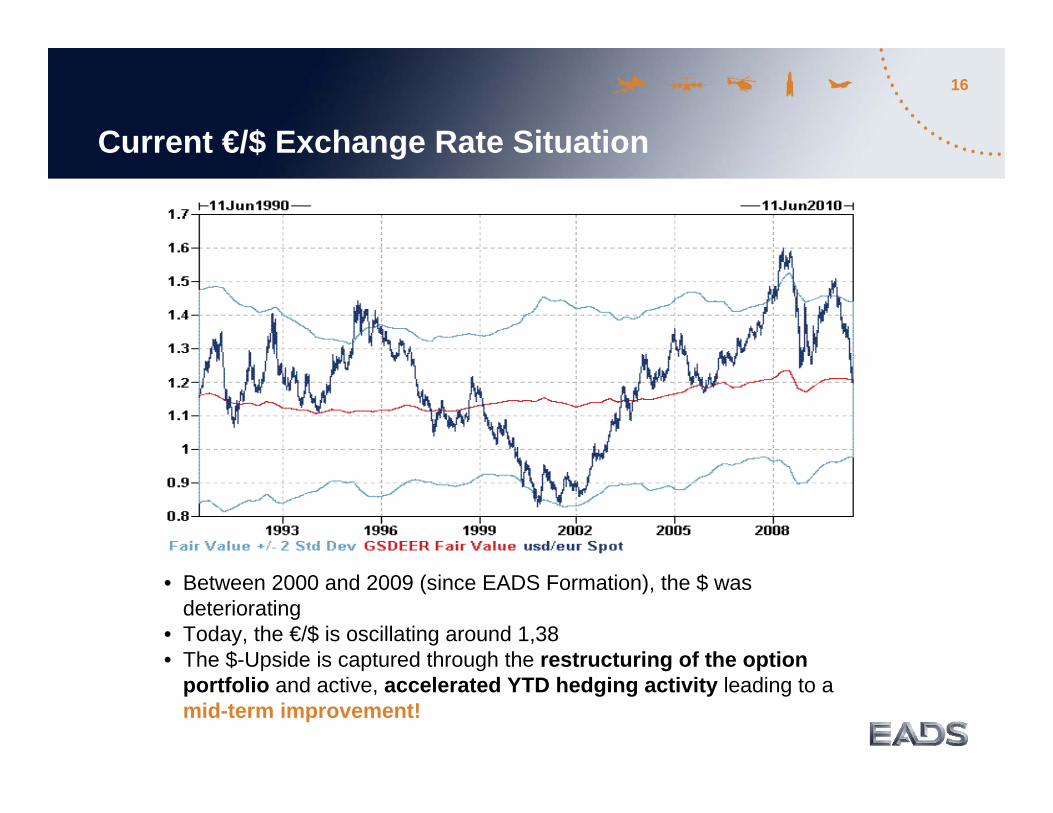
Current €/$ Exchange Rate Situation
• Between 2000 and 2009 (since EADS Formation), the $ was deteriorating
• Today, the €/$ is oscillating around 1,38 • The $-Upside is captured through the restructuring of the option
portfolio and active, accelerated YTD hedging activity leading to amid-term improvement!

17
Efficiency and IntegrationStatus as of YE 2009
• Power 8: € 2.0 bn gross savings in Airbus by end 2009, compared to projected cost base.– ROC: ~8,000 overhead positions reduced 2009; less costly than expected; restructuring provision adjusted € +140
m; working on 2,000 positions to be reduced in 2010;– Supply chain streamlining and logistics integration;– Lean manufacturing implemented across all sites.
• Power 8+: € 1.0 bn gross annual savings at EADS targeted for end 2012. – Airbus: Continue Power 8 efforts; Redesign implementation SA / LR; Subcontracting engineering off-shoring; more
low cost dollar zone sourcing;– Eurocopter: Lead time reduction, enhanced productivity;– Astrium and Cassidian: Engineering optimization, production flow management, procurement improvement.
• Future EADS: € 350 m gross annual savings targeted for end 2012. – Savings will be achieved through simplification, harmonization and integration of support functions;– 700 people working on 120 projects – for details see slide 25 in appendix;– Integration and Co-ordination:
– Airbus Military: optimization of program management and resource allocation;– Co-ordination of Space and Defence: creation of Centre of Excellence electronics manufacturing and
manufacturing-related engineering. – After Non Recurring Cost impact, net EBIT* impact neutral in 2010, slightly positive in 2011.
* Pre-goodwill impairment and exceptionals
18
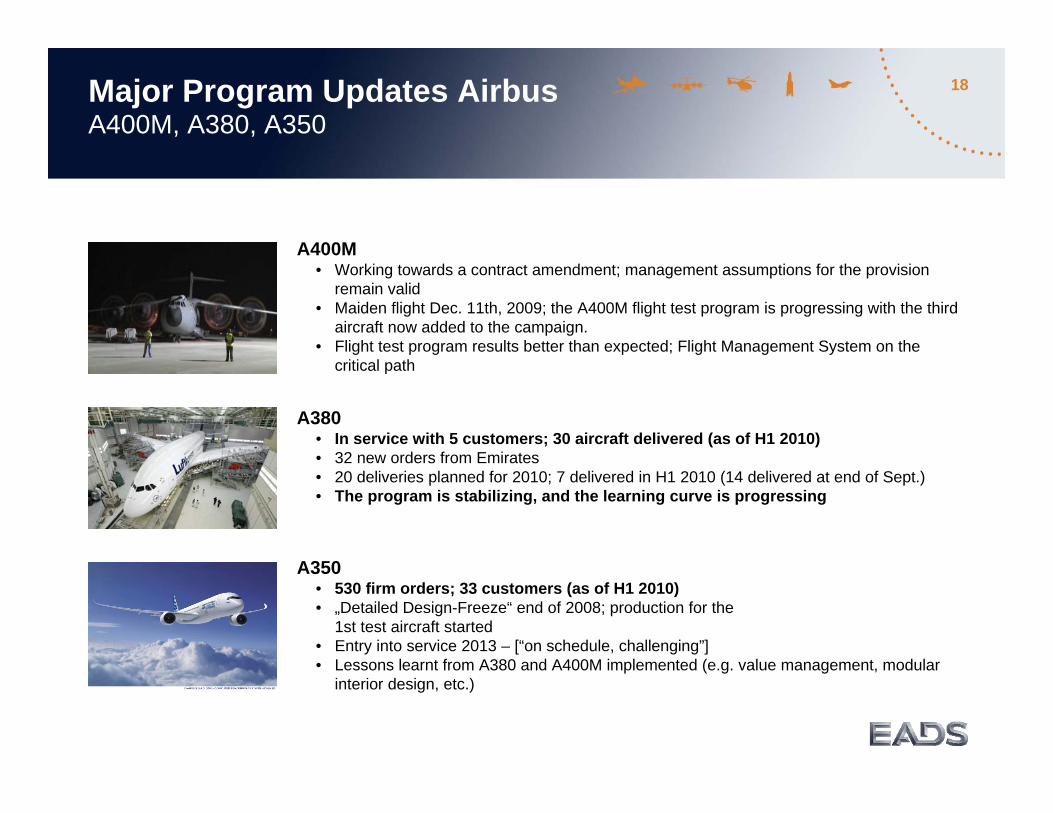
A400M• Working towards a contract amendment; management assumptions for the provision
remain valid• Maiden flight Dec. 11th, 2009; the A400M flight test program is progressing with the third
aircraft now added to the campaign.• Flight test program results better than expected; Flight Management System on the
critical path
A380• In service with 5 customers; 30 aircraft delivered (as of H1 2010)• 32 new orders from Emirates• 20 deliveries planned for 2010; 7 delivered in H1 2010 (14 delivered at end of Sept.)• The program is stabilizing, and the learning curve is progressing
A350• 530 firm orders; 33 customers (as of H1 2010)• „Detailed Design-Freeze“ end of 2008; production for the
1st test aircraft started• Entry into service 2013 – [“on schedule, challenging”]• Lessons learnt from A380 and A400M implemented (e.g. value management, modular
interior design, etc.)
Major Program Updates AirbusA400M, A380, A350
19
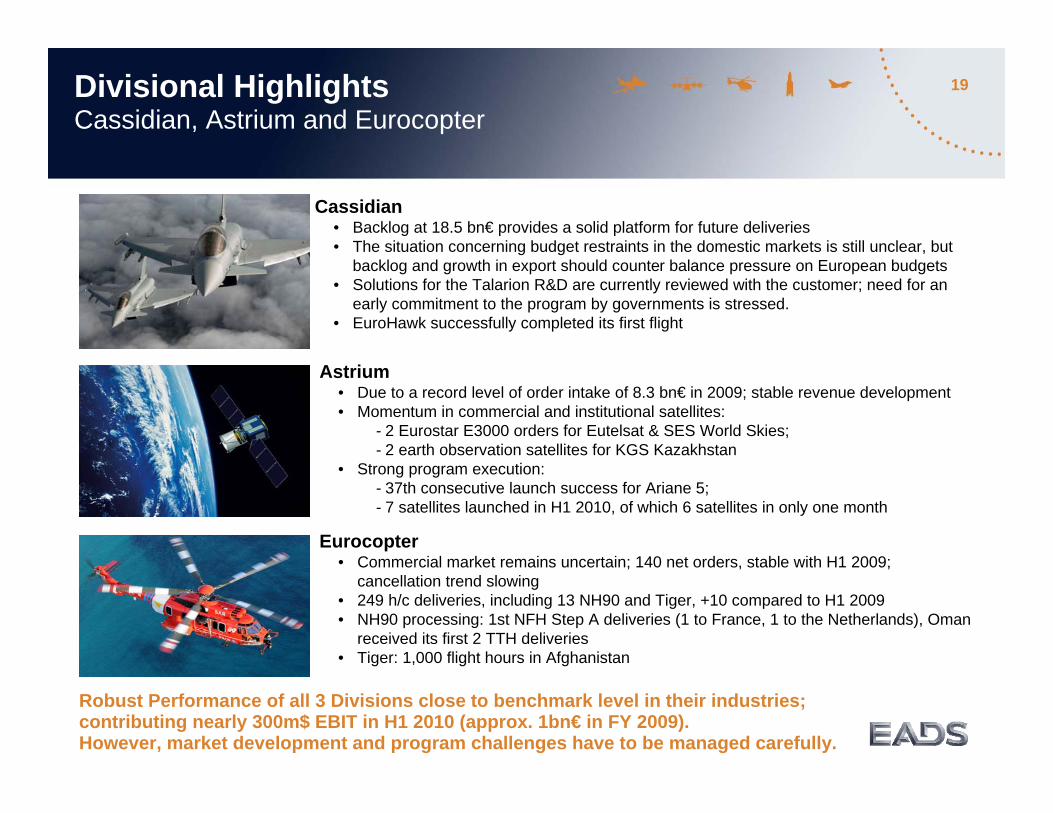
Cassidian• Backlog at 18.5 bn€ provides a solid platform for future deliveries• The situation concerning budget restraints in the domestic markets is still unclear, but
backlog and growth in export should counter balance pressure on European budgets• Solutions for the Talarion R&D are currently reviewed with the customer; need for an
early commitment to the program by governments is stressed.• EuroHawk successfully completed its first flight
Divisional HighlightsCassidian, Astrium and Eurocopter
Astrium• Due to a record level of order intake of 8.3 bn€ in 2009; stable revenue development• Momentum in commercial and institutional satellites:
- 2 Eurostar E3000 orders for Eutelsat & SES World Skies; - 2 earth observation satellites for KGS Kazakhstan
• Strong program execution:- 37th consecutive launch success for Ariane 5;- 7 satellites launched in H1 2010, of which 6 satellites in only one month
Eurocopter• Commercial market remains uncertain; 140 net orders, stable with H1 2009;
cancellation trend slowing• 249 h/c deliveries, including 13 NH90 and Tiger, +10 compared to H1 2009• NH90 processing: 1st NFH Step A deliveries (1 to France, 1 to the Netherlands), Oman
received its first 2 TTH deliveries• Tiger: 1,000 flight hours in Afghanistan
Robust Performance of all 3 Divisions close to benchmark level in their industries; contributing nearly 300m$ EBIT in H1 2010 (approx. 1bn€ in FY 2009).However, market development and program challenges have to be managed carefully.

Group HighlightsHighlights Q1 2010 & FY 2009Drivers of ProfitabilityGuidance 2010 & Outlook
21
Guidance 2010
Commercial Cycle• Airbus gross orders above 400 at the end of 2010;• Eurocopter civil market and related order stream sluggish;• Airbus deliveries around 500; Eurocopter slightly below the 2009 level.
At €1: $1.35
Revenues• EADS revenues more than € 44 bn.
EBIT* before one off• Thanks to a higher number of expected deliveries and an upside to our underlying profitability, EADS EBIT* before one-off
should reach around €1.2 billion in 2010. • At Airbus, H2 EBIT* before one-off will be lower than in H1. Compared to H1, the positive impact of higher volumes and
better pricing will be more than offset by higher R&D and the deterioration of hedge rates compared to the first half of the year.
EBIT*• Going forward, the EBIT* performance of EADS will be dependent on the Group’s ability to execute on the A400M, A380
and A350 programs, in line with the commitments made to its customers. • At €1 / $1.35, EADS maintains its EBIT* guidance of around € 1 billion despite the negative exceptional impacts from
foreign exchange accrued in H1.
Free Cash Flow• Provided a sustainable year end cash inflow of institutional and government business and subject to pre delivery payment
advances for the A400M programme, the Free Cash Flow before customer financing should be break even. Free cash-flow after customer financing should be negative due to customer financing cash-outflows of around 600 million euros.
* Pre-goodwill impairment and exceptionals
22
0
1
2
3
4
5
1970 1975 1980 1985 1990 1995 2000 2005
+40%
2009
Stock*market drop
-20%
Financial CrisisSARSAsian Crisis 11/09Gulf CrisisOil CrisisOil Crisis
Stock*market drop
-27%
Stock*market drop
-34%
Stock*market drop
-21%
Stock*market drop
-21%Stock*
market drop-19%
Stock*market drop
-28%
Stock*market drop
-21%
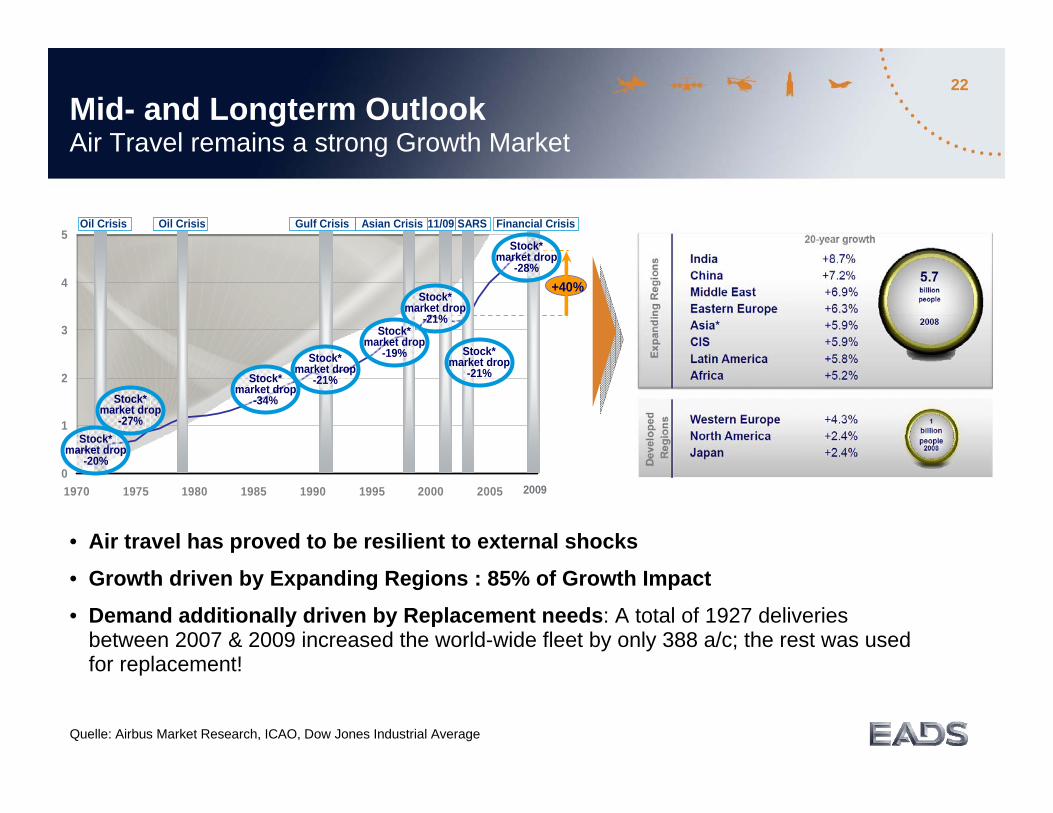
Mid- and Longterm OutlookAir Travel remains a strong Growth Market
• Air travel has proved to be resilient to external shocks
• Growth driven by Expanding Regions : 85% of Growth Impact
• Demand additionally driven by Replacement needs: A total of 1927 deliveries between 2007 & 2009 increased the world-wide fleet by only 388 a/c; the rest was used for replacement!
Quelle: Airbus Market Research, ICAO, Dow Jones Industrial Average
23
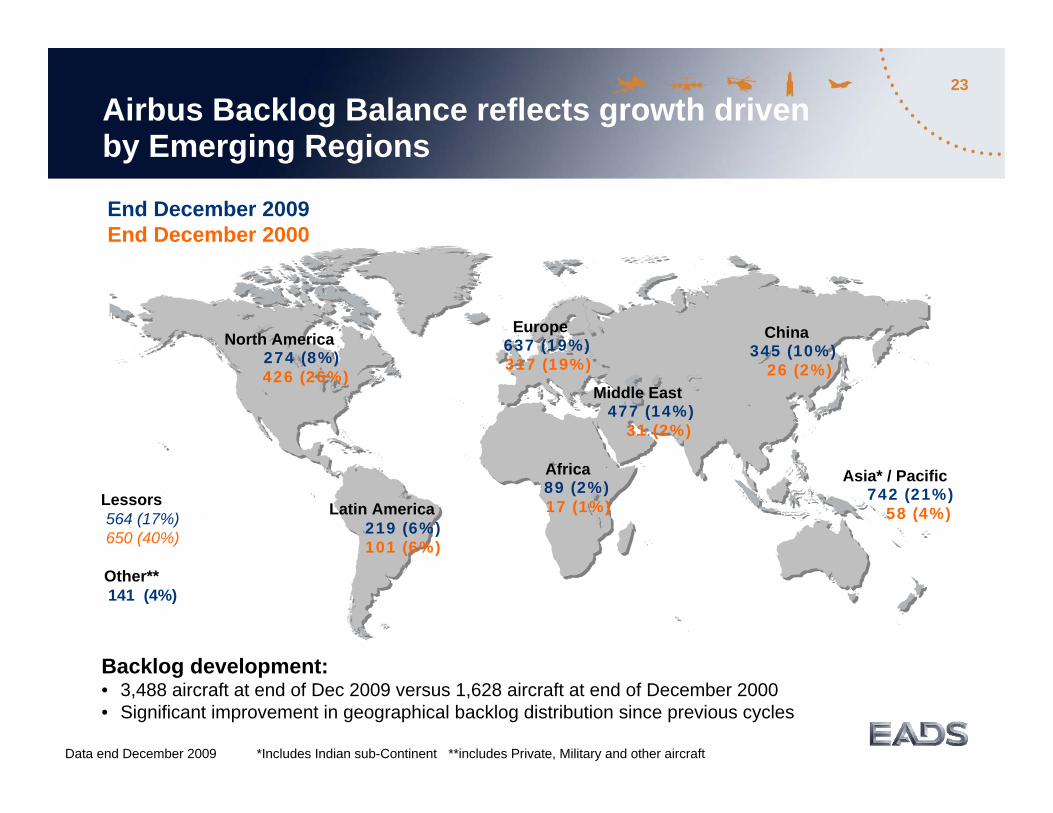
Data end December 2009 *Includes Indian sub-Continent **includes Private, Military and other aircraft
Backlog development:• 3,488 aircraft at end of Dec 2009 versus 1,628 aircraft at end of December 2000• Significant improvement in geographical backlog distribution since previous cycles
Airbus Backlog Balance reflects growth driven by Emerging Regions
North America274 (8%)426 (26%)
Europe637 (19%)317 (19%)
Middle East477 (14%)
31 (2%)
China345 (10%)
26 (2%)
Asia* / Pacific742 (21%)
58 (4%)
Africa89 (2%)17 (1%)Latin America
219 (6%)101 (6%)
Lessors564 (17%)650 (40%)
Other**141 (4%)
End December 2009End December 2000
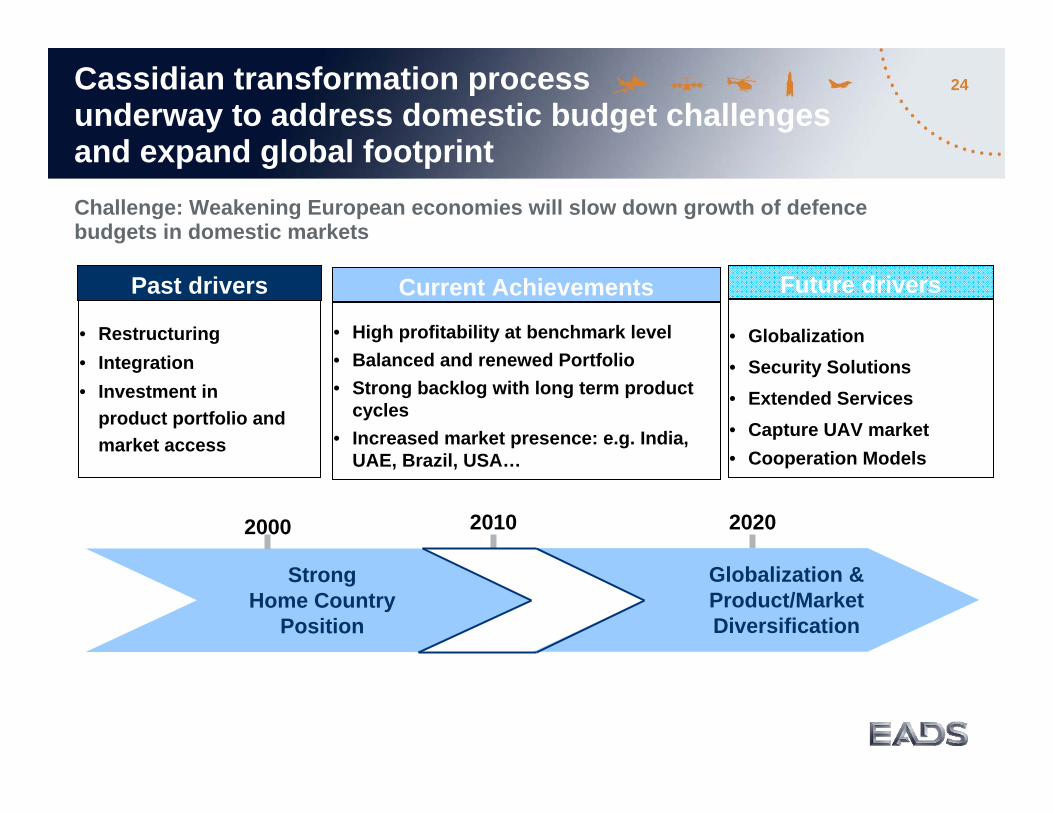
24Cassidian transformation processunderway to address domestic budget challenges and expand global footprint
StrongHome Country
Position
2000 2020
Globalization & Product/Market Diversification
2010
Past drivers
• Restructuring• Integration• Investment in
product portfolio and market access
Future drivers
• Globalization• Security Solutions• Extended Services• Capture UAV market• Cooperation Models
Current Achievements
• High profitability at benchmark level• Balanced and renewed Portfolio• Strong backlog with long term product
cycles• Increased market presence: e.g. India,
UAE, Brazil, USA…
Challenge: Weakening European economies will slow down growth of defence budgets in domestic markets
25
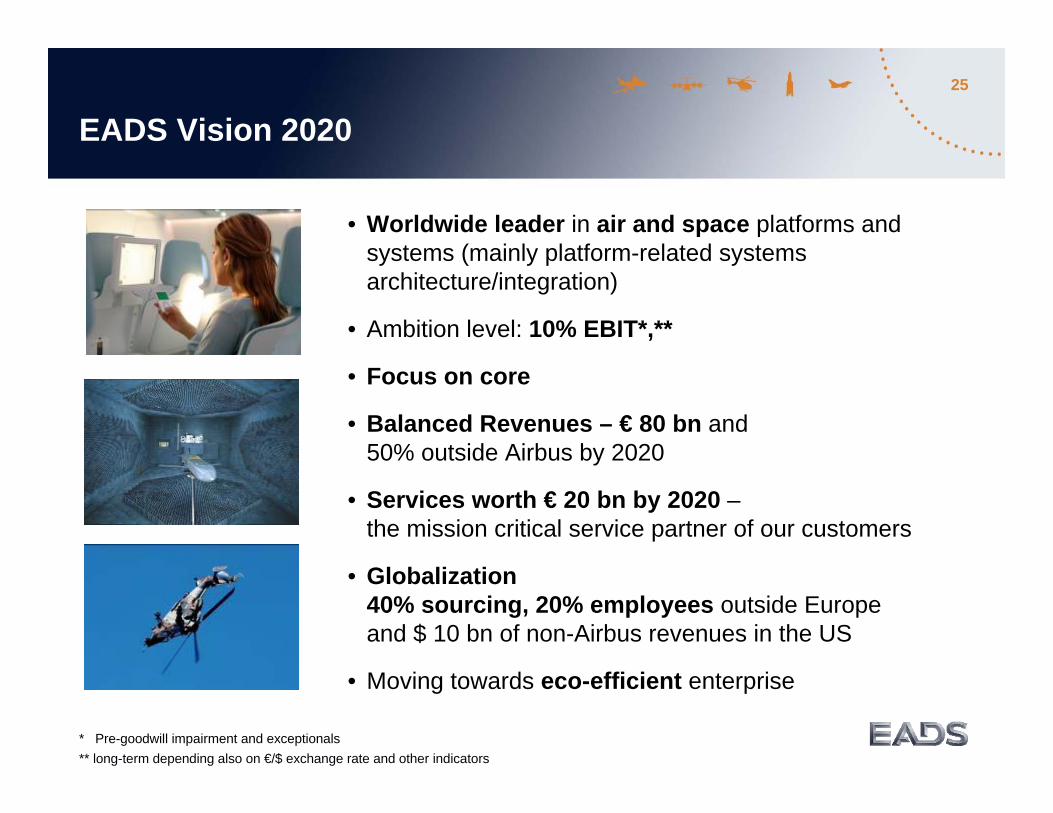
EADS Vision 2020
• Worldwide leader in air and space platforms and systems (mainly platform-related systems architecture/integration)
• Ambition level: 10% EBIT*,**
• Focus on core
• Balanced Revenues – € 80 bn and 50% outside Airbus by 2020
• Services worth € 20 bn by 2020 –the mission critical service partner of our customers
• Globalization 40% sourcing, 20% employees outside Europe and $ 10 bn of non-Airbus revenues in the US
• Moving towards eco-efficient enterprise
* Pre-goodwill impairment and exceptionals** long-term depending also on €/$ exchange rate and other indicators
Appendix
27
42% LR
32% SA
0% Europe
23% Asia Pacific
0% Leasing
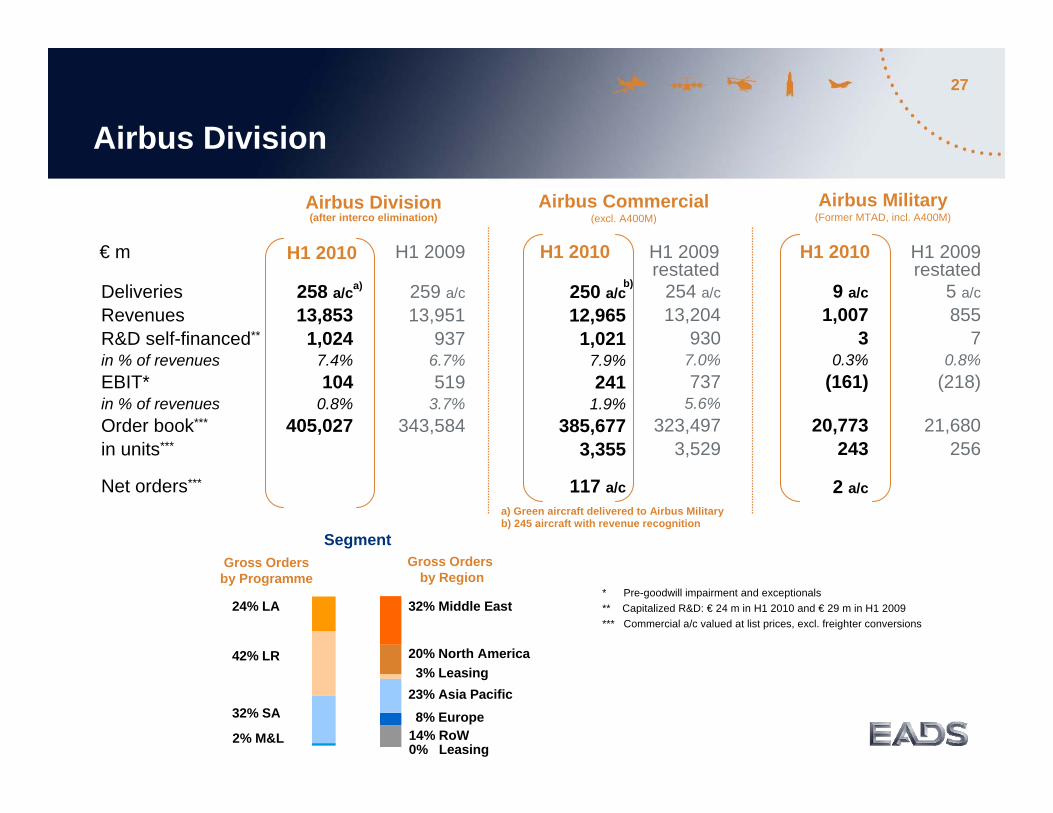
* Pre-goodwill impairment and exceptionals** Capitalized R&D: € 24 m in H1 2010 and € 29 m in H1 2009 *** Commercial a/c valued at list prices, excl. freighter conversions
Airbus Division
€ m
DeliveriesRevenuesR&D self-financed**
in % of revenuesEBIT*in % of revenuesOrder book***
in units***
Net orders***
H1 2010
259 a/c13,951
9376.7% 519
3.7%343,584
Gross Orders by Programme
Gross Ordersby Region
Segment
H1 2010
254 a/c13,204
9307.0%737
5.6%323,497
3,529
250 a/c12,965
1,0217.9%241
1.9%385,677
3,355
117 a/c
H1 2009restated
H1 2010
5 a/c855
70.8%
(218)
21,680256
9 a/c1,007
30.3%
(161)
20,773243
2 a/c
Airbus Division (after interco elimination)
Airbus Commercial(excl. A400M)
Airbus Military(Former MTAD, incl. A400M)
258 a/c13,8531,024
7.4%104
0.8%405,027
32% Middle East
14% RoWx% Tanker
H1 2009restated
H1 2009
20% North America
b)
a) Green aircraft delivered to Airbus Militaryb) 245 aircraft with revenue recognition
8% Europe
3% Leasing
24% LA
2% M&L
a)
28
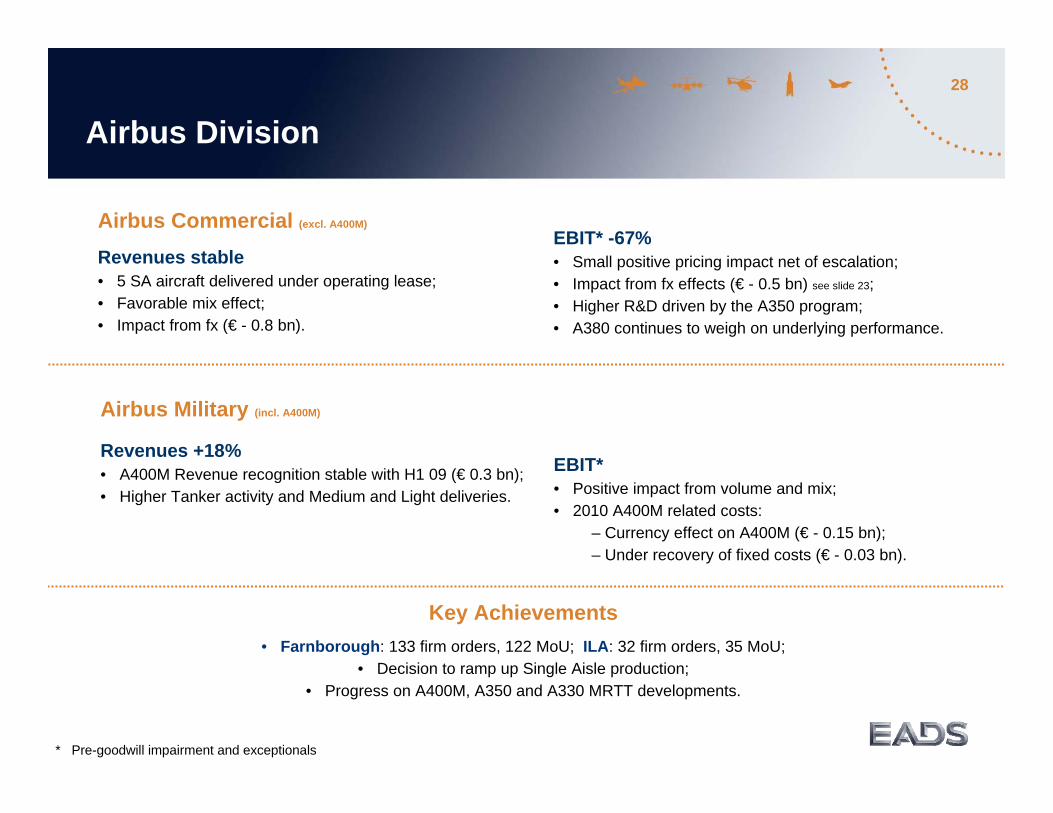
Airbus Division
Airbus Commercial (excl. A400M)
Revenues stable• 5 SA aircraft delivered under operating lease;• Favorable mix effect;• Impact from fx (€ - 0.8 bn).
EBIT* -67% • Small positive pricing impact net of escalation; • Impact from fx effects (€ - 0.5 bn) see slide 23;• Higher R&D driven by the A350 program;• A380 continues to weigh on underlying performance.
Airbus Military (incl. A400M)
Revenues +18%• A400M Revenue recognition stable with H1 09 (€ 0.3 bn); • Higher Tanker activity and Medium and Light deliveries.
Key Achievements• Farnborough: 133 firm orders, 122 MoU; ILA: 32 firm orders, 35 MoU;
• Decision to ramp up Single Aisle production;• Progress on A400M, A350 and A330 MRTT developments.
* Pre-goodwill impairment and exceptionals
EBIT* • Positive impact from volume and mix;• 2010 A400M related costs:
– Currency effect on A400M (€ - 0.15 bn);– Under recovery of fixed costs (€ - 0.03 bn).
29
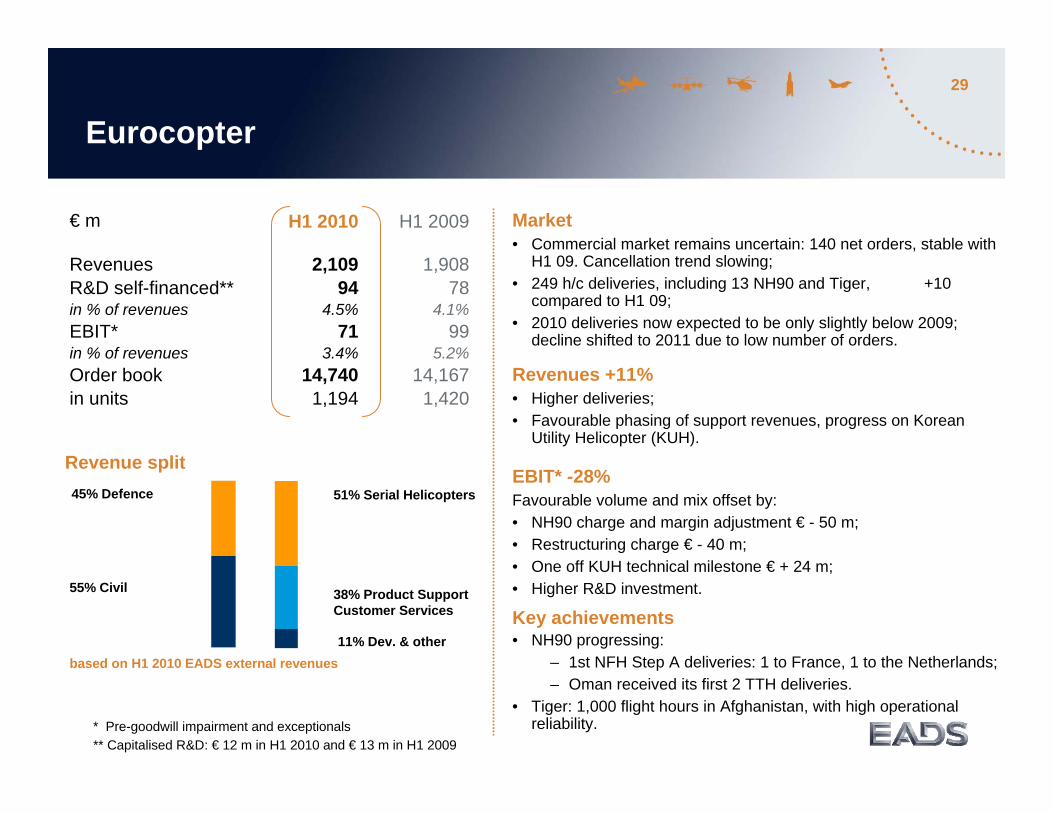
Eurocopter
Market • Commercial market remains uncertain: 140 net orders, stable with
H1 09. Cancellation trend slowing;• 249 h/c deliveries, including 13 NH90 and Tiger, +10
compared to H1 09;• 2010 deliveries now expected to be only slightly below 2009;
decline shifted to 2011 due to low number of orders.
Revenues +11%• Higher deliveries; • Favourable phasing of support revenues, progress on Korean
Utility Helicopter (KUH).
EBIT* -28%Favourable volume and mix offset by:• NH90 charge and margin adjustment € - 50 m;• Restructuring charge € - 40 m; • One off KUH technical milestone € + 24 m;• Higher R&D investment.
Key achievements• NH90 progressing:
– 1st NFH Step A deliveries: 1 to France, 1 to the Netherlands;– Oman received its first 2 TTH deliveries.
• Tiger: 1,000 flight hours in Afghanistan, with high operational reliability.
€ m
RevenuesR&D self-financed**in % of revenuesEBIT*in % of revenuesOrder bookin units
H1 2009H1 2010
1,90878
4.1%99
5.2%14,167
1,420
2,10994
4.5%71
3.4%14,7401,194
* Pre-goodwill impairment and exceptionals** Capitalised R&D: € 12 m in H1 2010 and € 13 m in H1 2009
38% Product SupportCustomer Services
11% Dev. & other
51% Serial Helicopters
55% Civil
Revenue split45% Defence
based on H1 2010 EADS external revenues
30
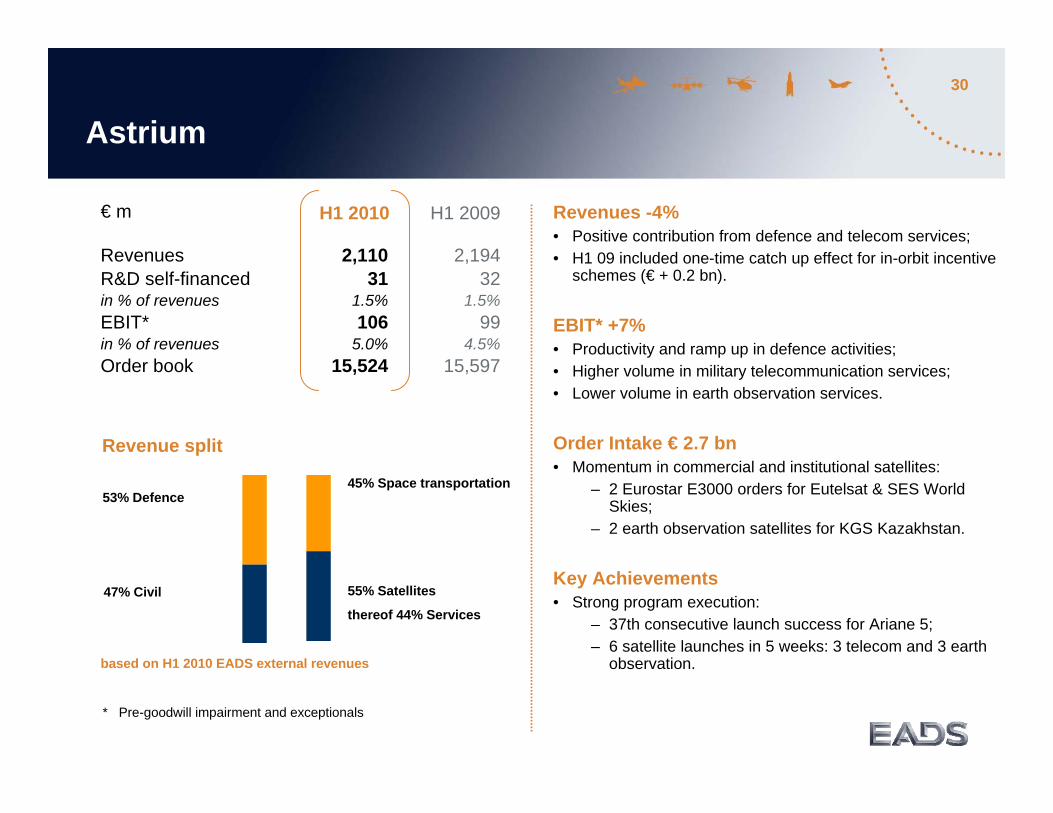
Astrium
€ m
RevenuesR&D self-financedin % of revenuesEBIT*in % of revenuesOrder book
H1 2009H1 2010
2,19432
1.5%99
4.5%15,597
2,11031
1.5%106
5.0%15,524
* Pre-goodwill impairment and exceptionals
47% Civil
53% Defence
Revenue split
Revenues -4%• Positive contribution from defence and telecom services;• H1 09 included one-time catch up effect for in-orbit incentive
schemes (€ + 0.2 bn).
EBIT* +7%• Productivity and ramp up in defence activities;• Higher volume in military telecommunication services;• Lower volume in earth observation services.
Order Intake € 2.7 bn• Momentum in commercial and institutional satellites:
– 2 Eurostar E3000 orders for Eutelsat & SES World Skies;
– 2 earth observation satellites for KGS Kazakhstan.
Key Achievements• Strong program execution:
– 37th consecutive launch success for Ariane 5;– 6 satellite launches in 5 weeks: 3 telecom and 3 earth
observation.based on H1 2010 EADS external revenues
55% Satellites
thereof 44% Services
45% Space transportation
31
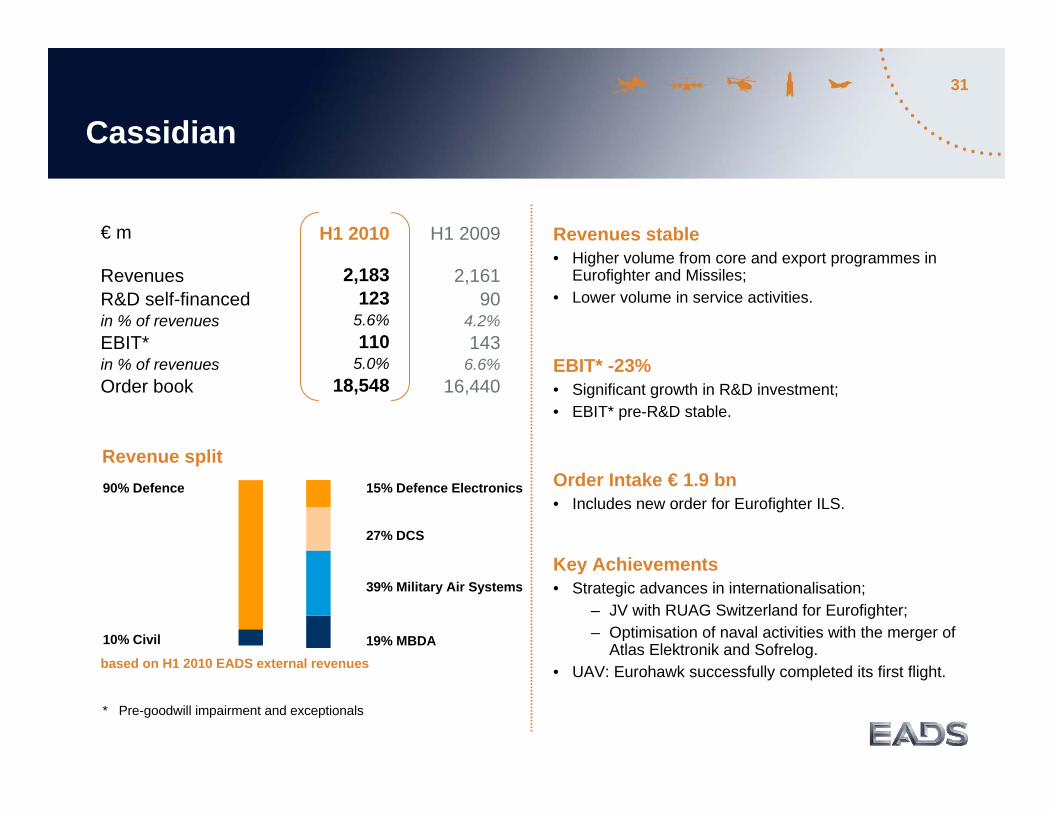
90% Defence
Cassidian
€ m
RevenuesR&D self-financedin % of revenuesEBIT*in % of revenuesOrder book
H1 2009H1 2010
2,16190
4.2%143
6.6%16,440
2,183123
5.6%110
5.0%18,548
* Pre-goodwill impairment and exceptionals
based on H1 2010 EADS external revenues
15% Defence Electronics
Revenue split
19% MBDA
39% Military Air Systems
27% DCS
10% Civil
Revenues stable• Higher volume from core and export programmes in
Eurofighter and Missiles;• Lower volume in service activities.
EBIT* -23%• Significant growth in R&D investment;• EBIT* pre-R&D stable.
Order Intake € 1.9 bn• Includes new order for Eurofighter ILS.
Key Achievements• Strategic advances in internationalisation;
– JV with RUAG Switzerland for Eurofighter;– Optimisation of naval activities with the merger of
Atlas Elektronik and Sofrelog.• UAV: Eurohawk successfully completed its first flight.
32
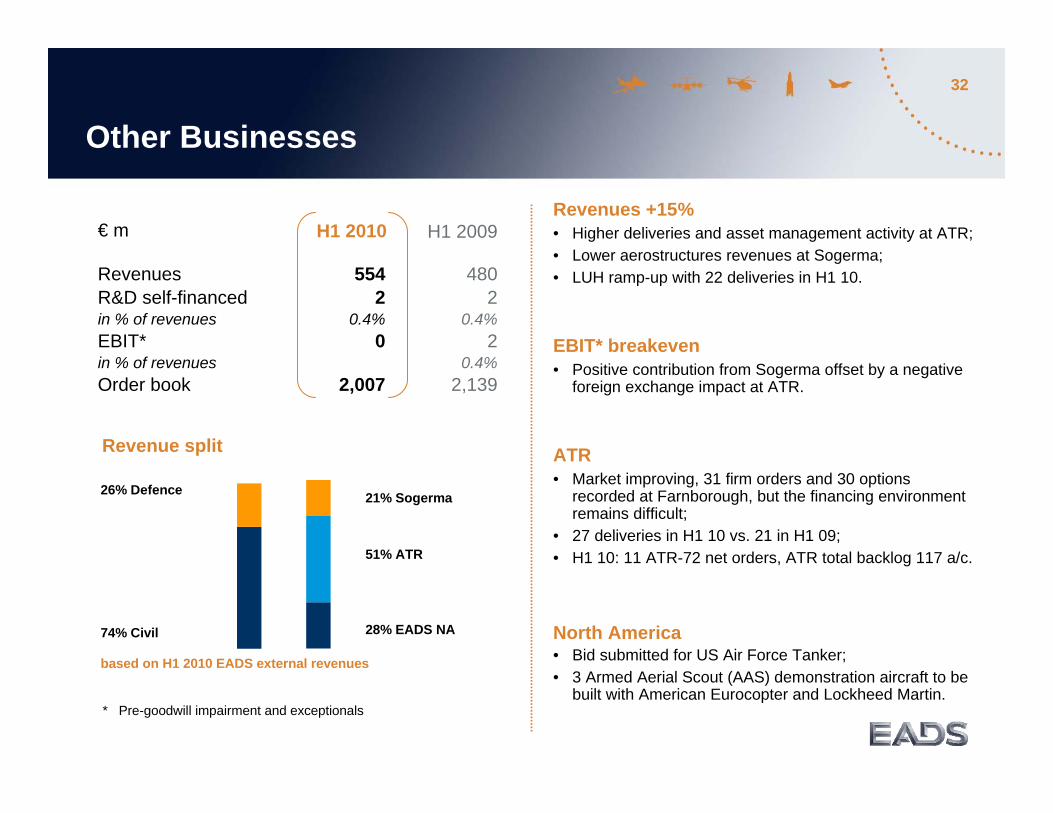
Other Businesses
€ m
RevenuesR&D self-financedin % of revenuesEBIT*in % of revenuesOrder book
H1 2009H1 2010
4802
0.4%2
0.4%2,139
5542
0.4%0
2,007
* Pre-goodwill impairment and exceptionals
74% Civil
Revenue split
28% EADS NA
21% Sogerma26% Defence
51% ATR
Revenues +15%• Higher deliveries and asset management activity at ATR;• Lower aerostructures revenues at Sogerma;• LUH ramp-up with 22 deliveries in H1 10.
EBIT* breakeven• Positive contribution from Sogerma offset by a negative
foreign exchange impact at ATR.
ATR • Market improving, 31 firm orders and 30 options
recorded at Farnborough, but the financing environment remains difficult;
• 27 deliveries in H1 10 vs. 21 in H1 09; • H1 10: 11 ATR-72 net orders, ATR total backlog 117 a/c.
North America• Bid submitted for US Air Force Tanker;• 3 Armed Aerial Scout (AAS) demonstration aircraft to be
built with American Eurocopter and Lockheed Martin.
based on H1 2010 EADS external revenues
33
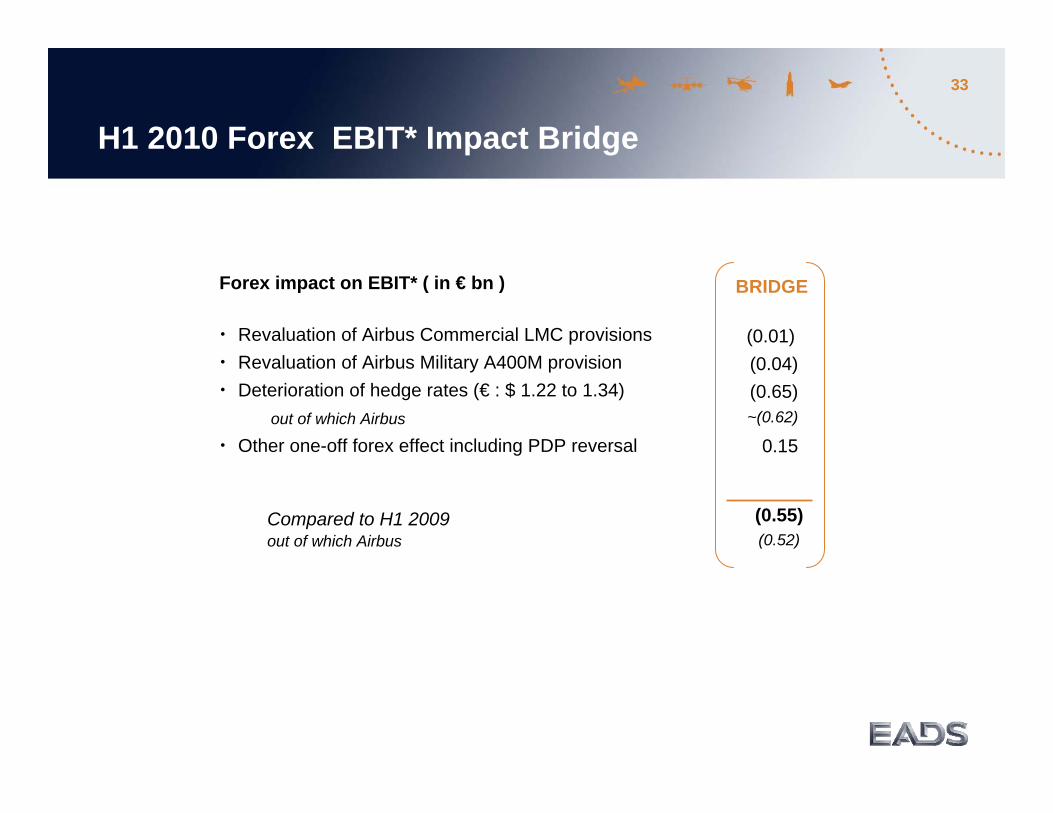
• Revaluation of Airbus Commercial LMC provisions • Revaluation of Airbus Military A400M provision• Deterioration of hedge rates (€ : $ 1.22 to 1.34)
out of which Airbus
• Other one-off forex effect including PDP reversal
Compared to H1 2009out of which Airbus
(0.55)(0.52)
BRIDGE
(0.01)(0.04)(0.65)~(0.62)
0.15
Forex impact on EBIT* ( in € bn )
H1 2010 Forex EBIT* Impact Bridge
34
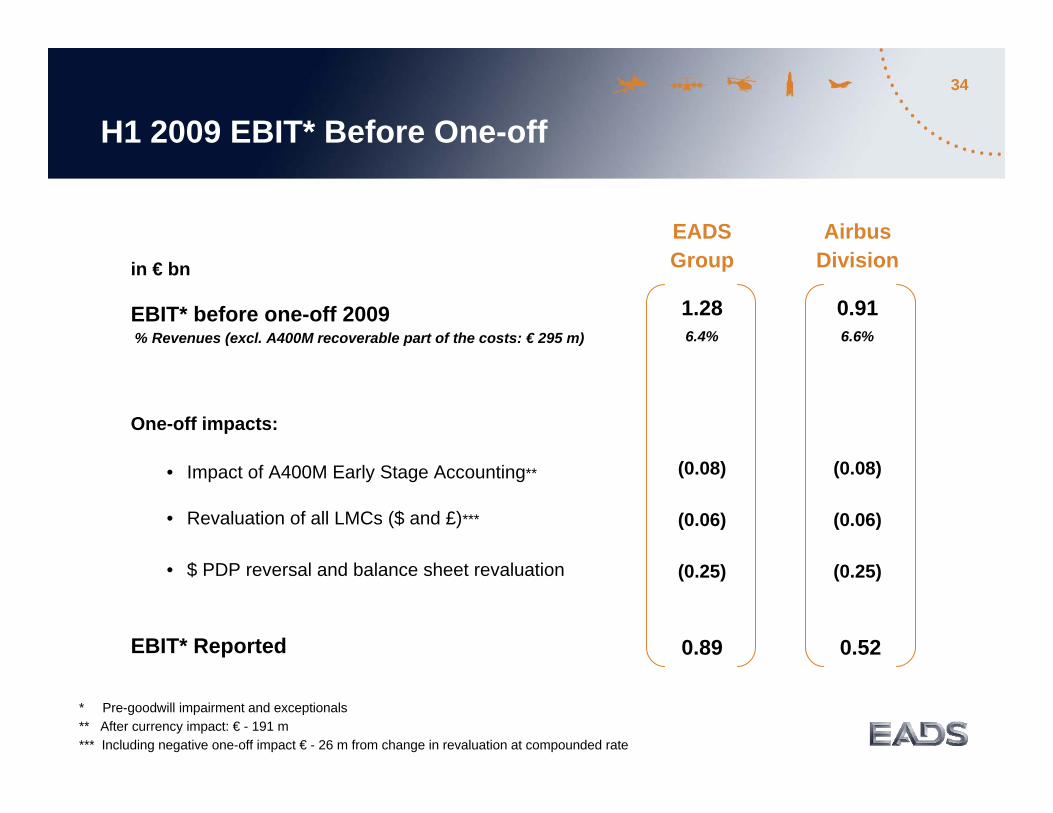
in € bn
EBIT* before one-off 2009% Revenues (excl. A400M recoverable part of the costs: € 295 m)
One-off impacts:
• Impact of A400M Early Stage Accounting**
• Revaluation of all LMCs ($ and £)***
• $ PDP reversal and balance sheet revaluation
EBIT* Reported
H1 2009 EBIT* Before One-off
* Pre-goodwill impairment and exceptionals** After currency impact: € - 191 m*** Including negative one-off impact € - 26 m from change in revaluation at compounded rate
AirbusDivision
0.916.6%
(0.08)
(0.06)
(0.25)
0.52
EADSGroup
1.286.4%
(0.08)
(0.06)
(0.25)
0.89
35
H1 2010 Financial Highlights
H1 2009 in % of
Revenues€ m€ m
H1 2010 in % of
Revenues
Revenuesself-financed R&D**EBITDA*EBIT* EBIT* before R&D
20,3081,3011,148
4061,707
6.4%5.7%2.0%8.4%
20,1951,1721,663
8882,060
5.8%8.2%4.4%
10.2%
Net incomeEPS***
185€ 0.23
0.9% 378€ 0.47
1.9%
8,864 8,106Net Cash positionat the end of the periodFree Cash Flow
* Pre-goodwill impairment and exceptionals** IAS 38: € 42 m capitalized during H1 2010; € 44 m capitalized during H1 2009*** Average number of shares outstanding: 810,848,870 in H1 2010; 810,058,069 in H1 2009
(737) (1,169)
36
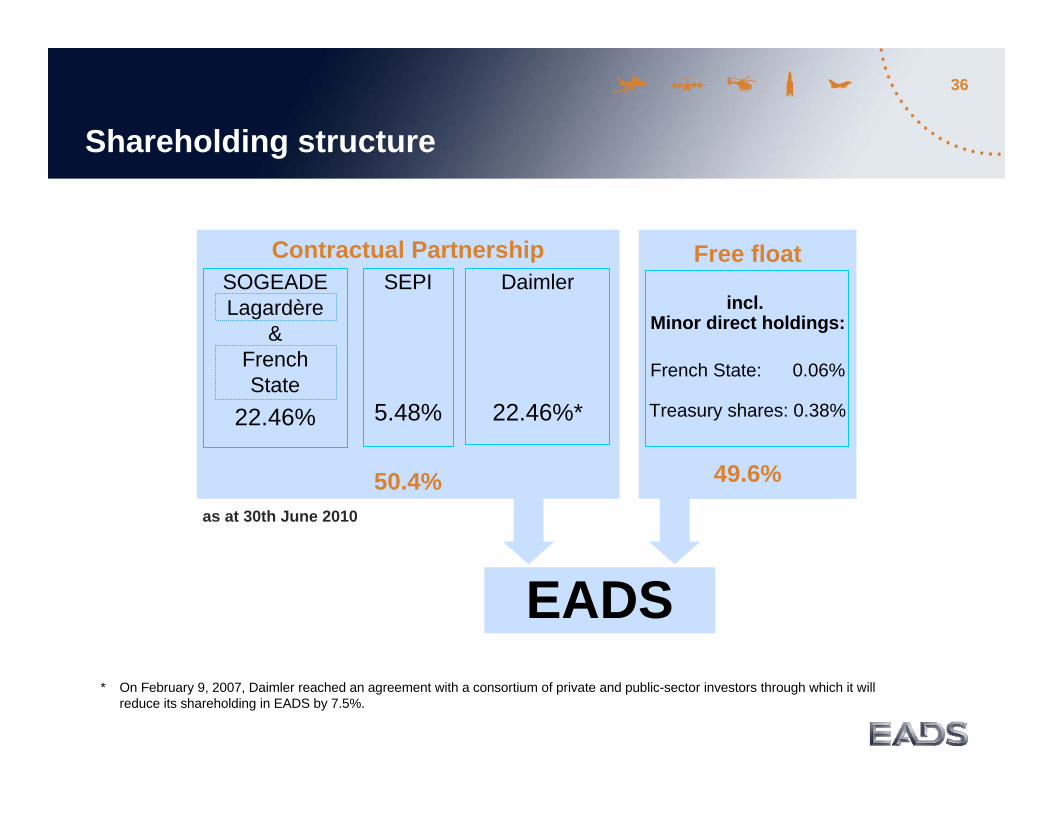
Free float
incl. Minor direct holdings:
French State: 0.06%
Treasury shares: 0.38%
49.6%
Shareholding structure
* On February 9, 2007, Daimler reached an agreement with a consortium of private and public-sector investors through which it will reduce its shareholding in EADS by 7.5%.
as at 30th June 2010
Contractual Partnership
50.4%
SOGEADELagardère
&FrenchState
22.46%
Daimler
22.46%*
EADS
SEPI
5.48%
37
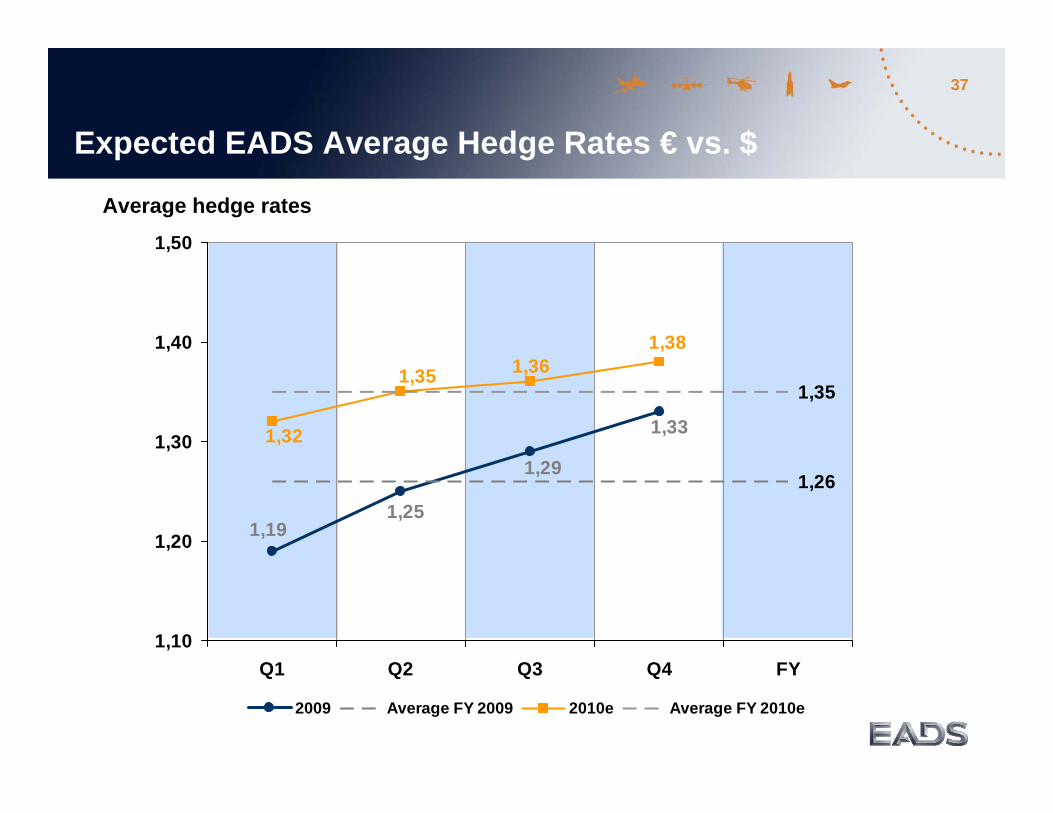
Expected EADS Average Hedge Rates € vs. $
Average hedge rates
1,26
1,35
1,191,25
1,29
1,33
1,381,36
1,32
1,35
1,10
1,20
1,30
1,40
1,50
Q1 Q2 Q3 Q4 FY
2009 Average FY 2009 2010e Average FY 2010e
38
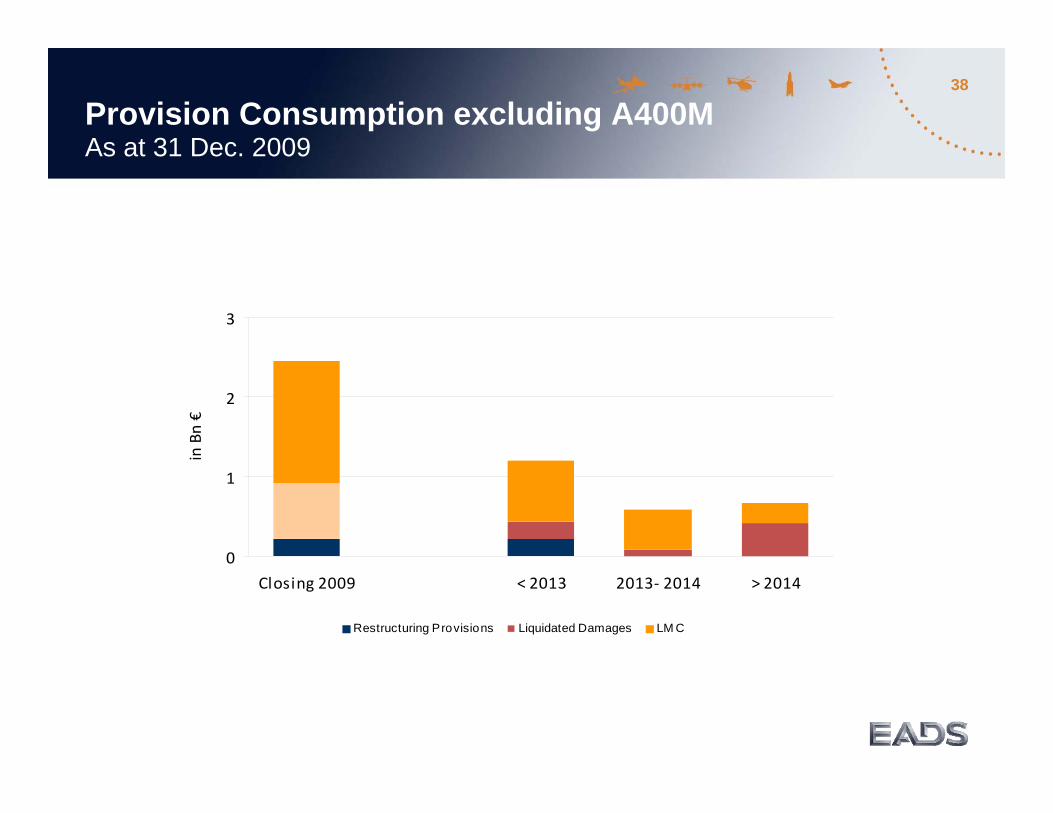
Provision Consumption excluding A400M As at 31 Dec. 2009
0
1
2
3
Closing 2009 < 2013 2013‐ 2014 > 2014
in Bn €
Restructuring Provisions Liquidated Damages LM C
39
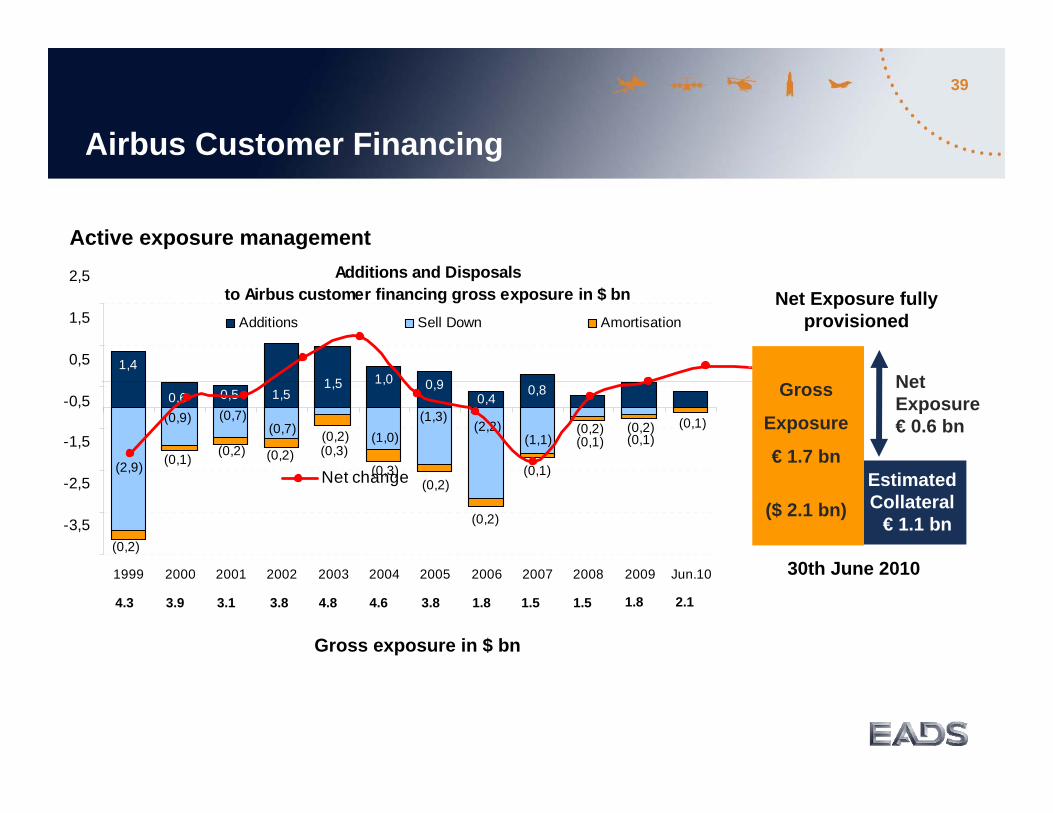
Additions and Disposalsto Airbus customer financing gross exposure in $ bn
1,40,9
(0,2)
0,40,6
1,5 0,60,30,80,4
1,01,50,5
(1,0) (0,9)
(0,2) (0,2)
(2,9)
(1,1) (0,2) (0,7) (0,7)
(2,2) (1,3) (0,1)
(0,1)
(0,1)
(0,1)
(0,2)
(0,2)
(0,1)
(0,2) (0,3)
(0,3) (0,2)
1999 2000 2001 2002 2003 2004 2005 2006 2007 2008 2009 Jun.10
Additions Sell Down Amortisation
-3,5
-2,5
-1,5
-0,5
0,5
1,5
2,5
Net change
Airbus Customer Financing
Estimated Collateral
€ 1.1 bn
Gross exposure in $ bn
Gross
Exposure
€ 1.7 bn
($ 2.1 bn)
Net Exposure€ 0.6 bn
Net Exposure fully provisioned
30th June 2010
Active exposure management
4.3 3.9 3.1 3.8 4.8 4.6 3.8 1.8 1.5 1.5 1.8 2.1
40
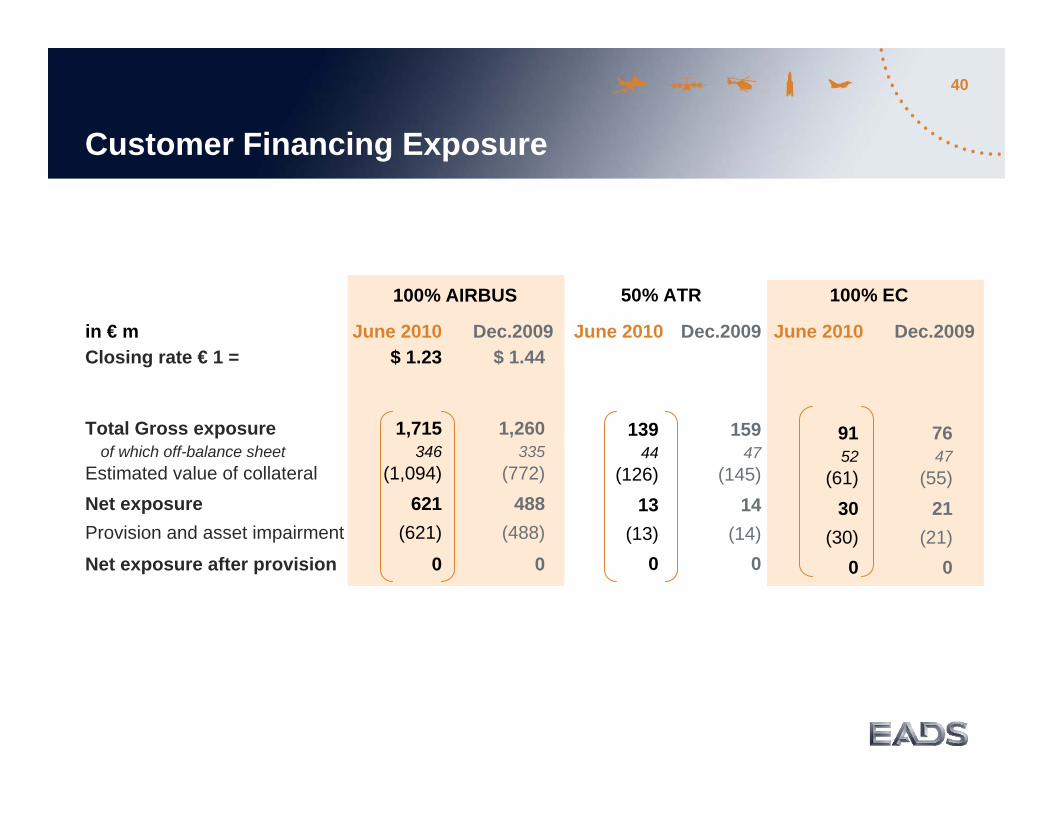
June 2010 Dec.2009
91 7652 47
(61) (55)30 21
(30) (21)0 0
in € m June 2010 Dec.2009Closing rate € 1 = $ 1.23 $ 1.44
Total Gross exposure 1,715 1,260of which off-balance sheet 346 335
Estimated value of collateral (1,094) (772)Net exposure 621 488Provision and asset impairment (621) (488)
Net exposure after provision 0 0
Customer Financing Exposure
100% AIRBUS
June 2010 Dec.2009
139 15944 47
(126) (145)13 14
(13) (14)0 0
50% ATR 100% EC
41
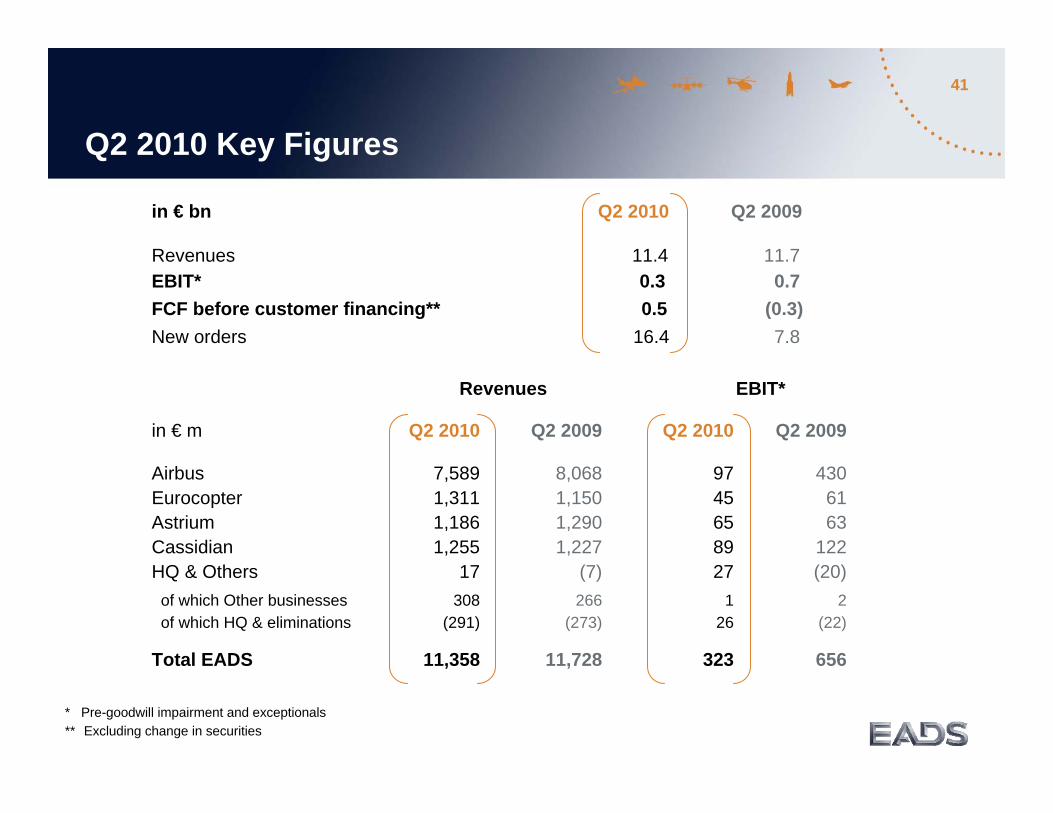
in € m Q2 2010 Q2 2009 Q2 2010 Q2 2009
Airbus 7,589 8,068 97 430Eurocopter 1,311 1,150 45 61Astrium 1,186 1,290 65 63Cassidian 1,255 1,227 89 122HQ & Others 17 (7) 27 (20)
of which Other businesses 308 266 1 2of which HQ & eliminations (291) (273) 26 (22)
Total EADS 11,358 11,728 323 656
Revenues EBIT*
Q2 2010 Key Figures
in € bn Q2 2010 Q2 2009
Revenues 11.4 11.7EBIT* 0.3 0.7FCF before customer financing** 0.5 (0.3)New orders 16.4 7.8
* Pre-goodwill impairment and exceptionals** Excluding change in securities
42
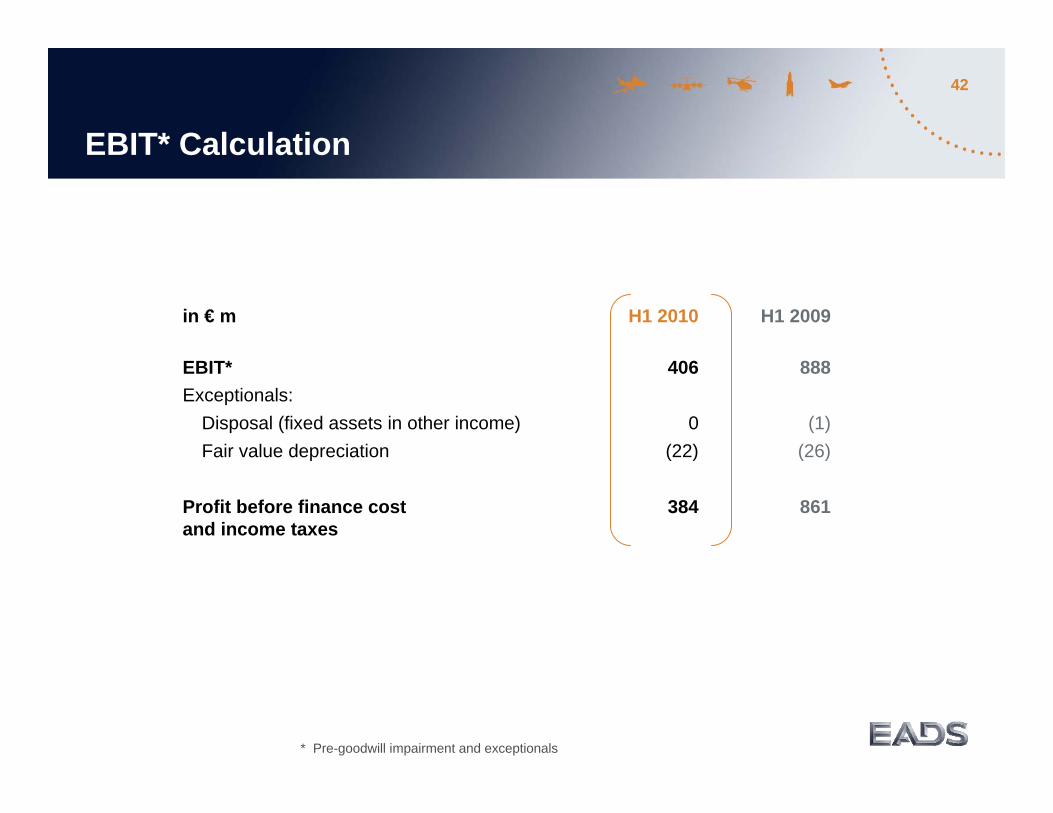
in € m H1 2010 H1 2009
EBIT* 406 888Exceptionals:
Disposal (fixed assets in other income) 0 (1)Fair value depreciation (22) (26)
Profit before finance cost 384 861and income taxes
EBIT* Calculation
* Pre-goodwill impairment and exceptionals
43
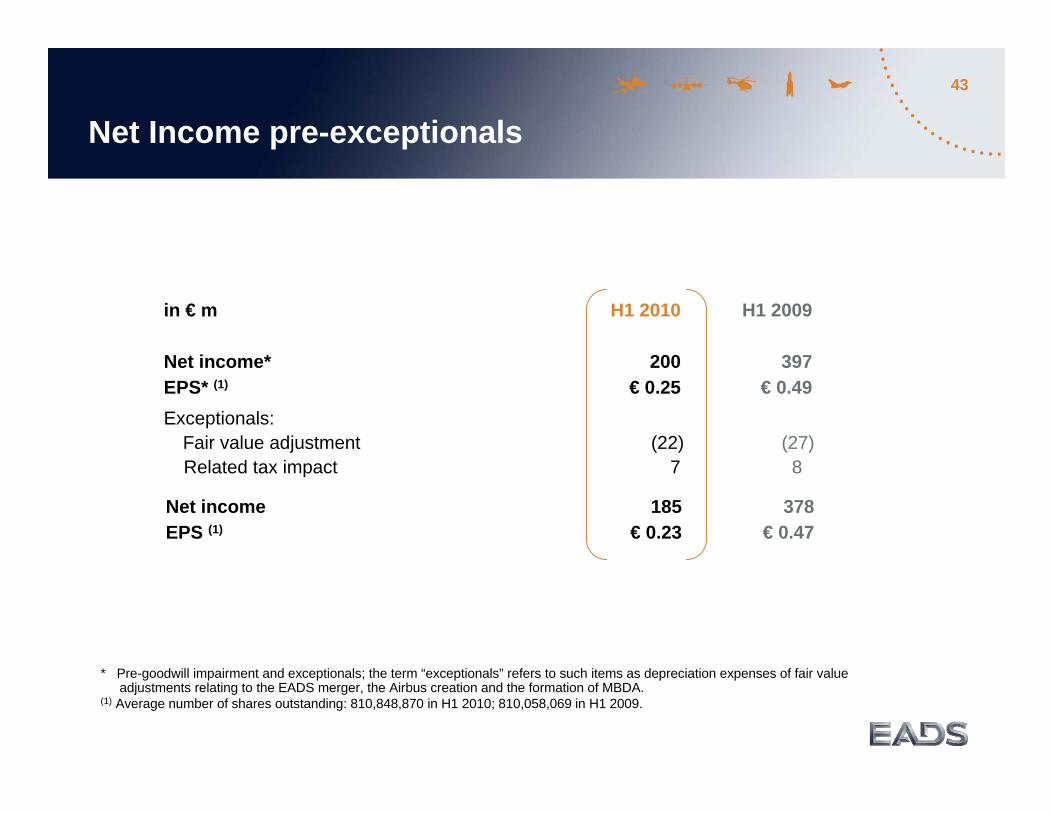
Net Income pre-exceptionals
* Pre-goodwill impairment and exceptionals; the term “exceptionals” refers to such items as depreciation expenses of fair value adjustments relating to the EADS merger, the Airbus creation and the formation of MBDA.
(1) Average number of shares outstanding: 810,848,870 in H1 2010; 810,058,069 in H1 2009.
Exceptionals:Fair value adjustment (22) (27)Related tax impact 7 8
in € m H1 2010 H1 2009
Net income* 200 397EPS* (1) € 0.25 € 0.49
Net income 185 378EPS (1) € 0.23 € 0.47
44
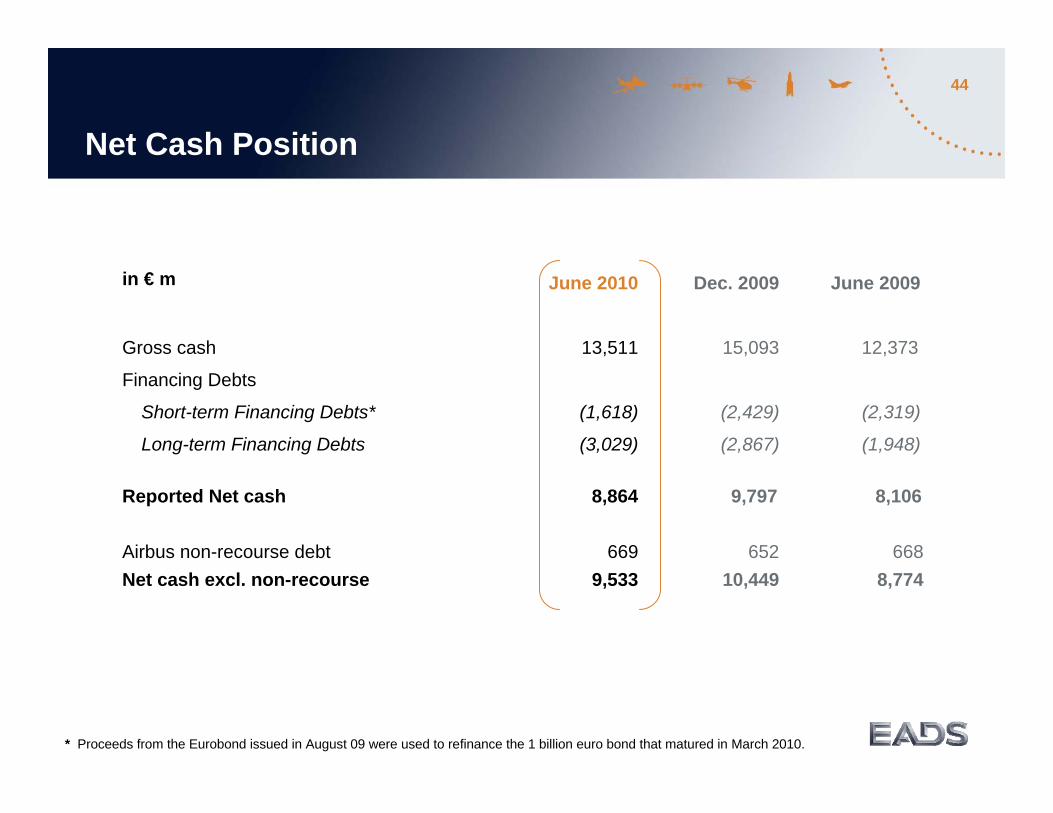
Net Cash Position
in € m
* Proceeds from the Eurobond issued in August 09 were used to refinance the 1 billion euro bond that matured in March 2010.
June 2010 Dec. 2009 June 2009
Gross cash 13,511 15,093 12,373
Financing Debts
Short-term Financing Debts* (1,618) (2,429) (2,319)
Long-term Financing Debts (3,029) (2,867) (1,948)
Reported Net cash 8,864 9,797 8,106
Airbus non-recourse debt 669 652 668Net cash excl. non-recourse 9,533 10,449 8,774
45
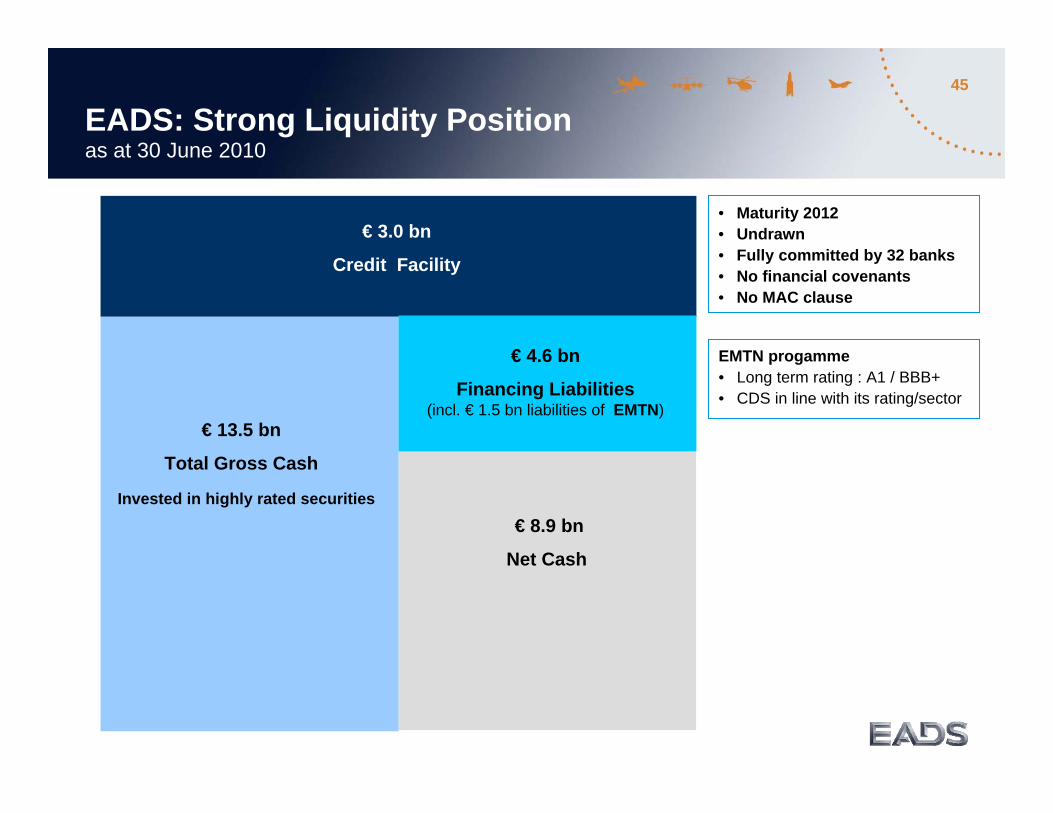
EADS: Strong Liquidity Position as at 30 June 2010
€ 13.5 bn
Total Gross Cash
• Maturity 2012• Undrawn• Fully committed by 32 banks• No financial covenants• No MAC clause
€ 8.9 bn
Net Cash
€ 3.0 bn
Credit Facility
Invested in highly rated securities
€ 4.6 bn
Financing Liabilities(incl. € 1.5 bn liabilities of EMTN)
EMTN progamme• Long term rating : A1 / BBB+• CDS in line with its rating/sector
46
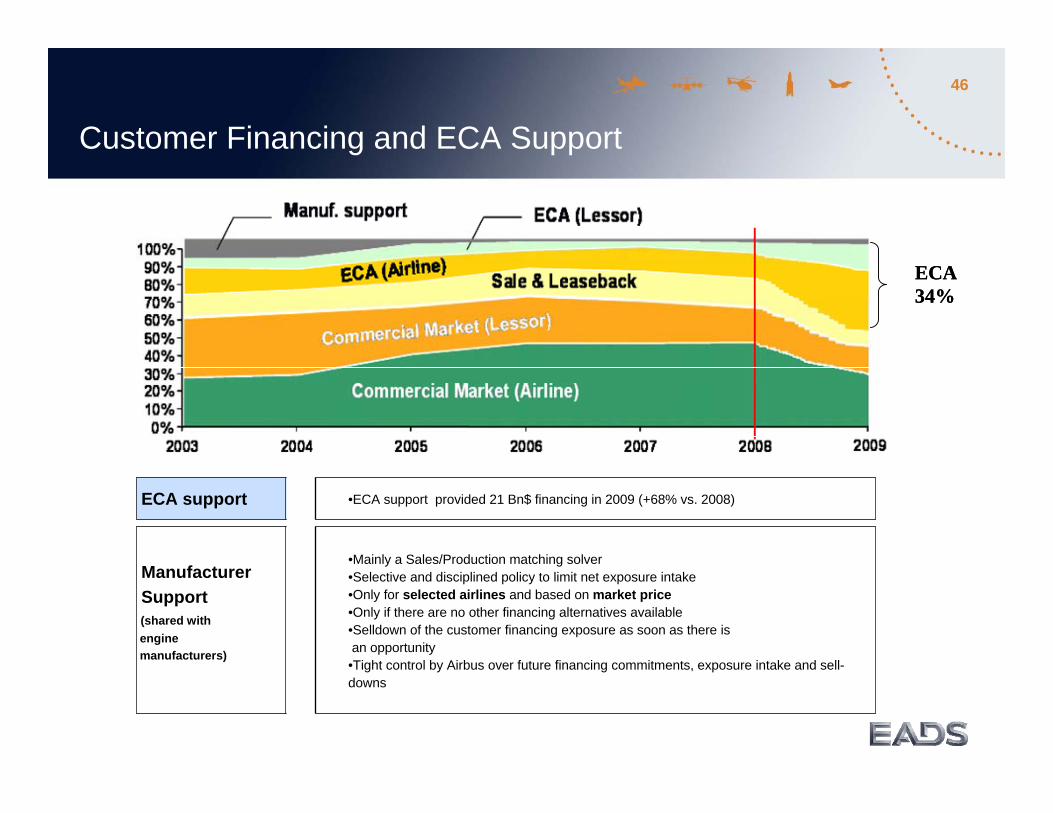
•Mainly a Sales/Production matching solver•Selective and disciplined policy to limit net exposure intake•Only for selected airlines and based on market price•Only if there are no other financing alternatives available•Selldown of the customer financing exposure as soon as there is an opportunity•Tight control by Airbus over future financing commitments, exposure intake and sell-downs
•ECA support provided 21 Bn$ financing in 2009 (+68% vs. 2008)ECA support
ManufacturerSupport (shared withenginemanufacturers)
Customer Financing and ECA Support
ECA34%ECA34%
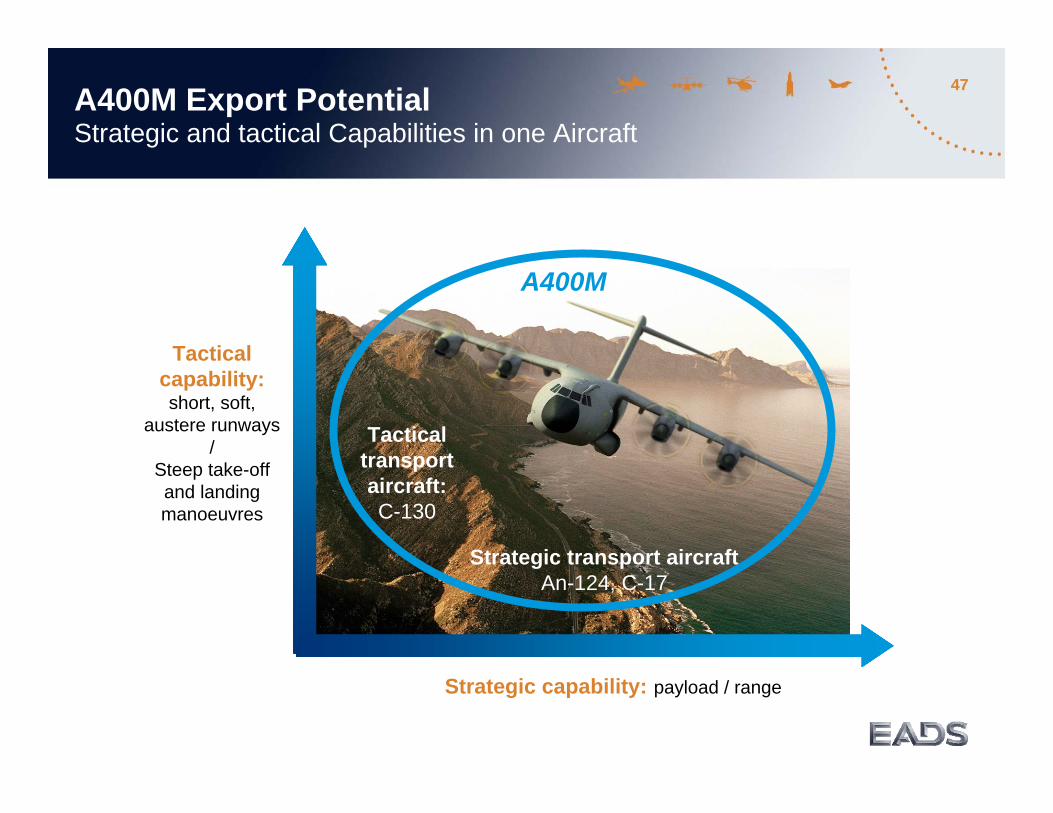
47A400M Export PotentialStrategic and tactical Capabilities in one Aircraft
Tactical capability:short, soft,
austere runways /
Steep take-off and landing manoeuvres
Strategic capability: payload / range
Tactical transport aircraft:C-130
Strategic transport aircraftAn-124, C-17
A400M
48
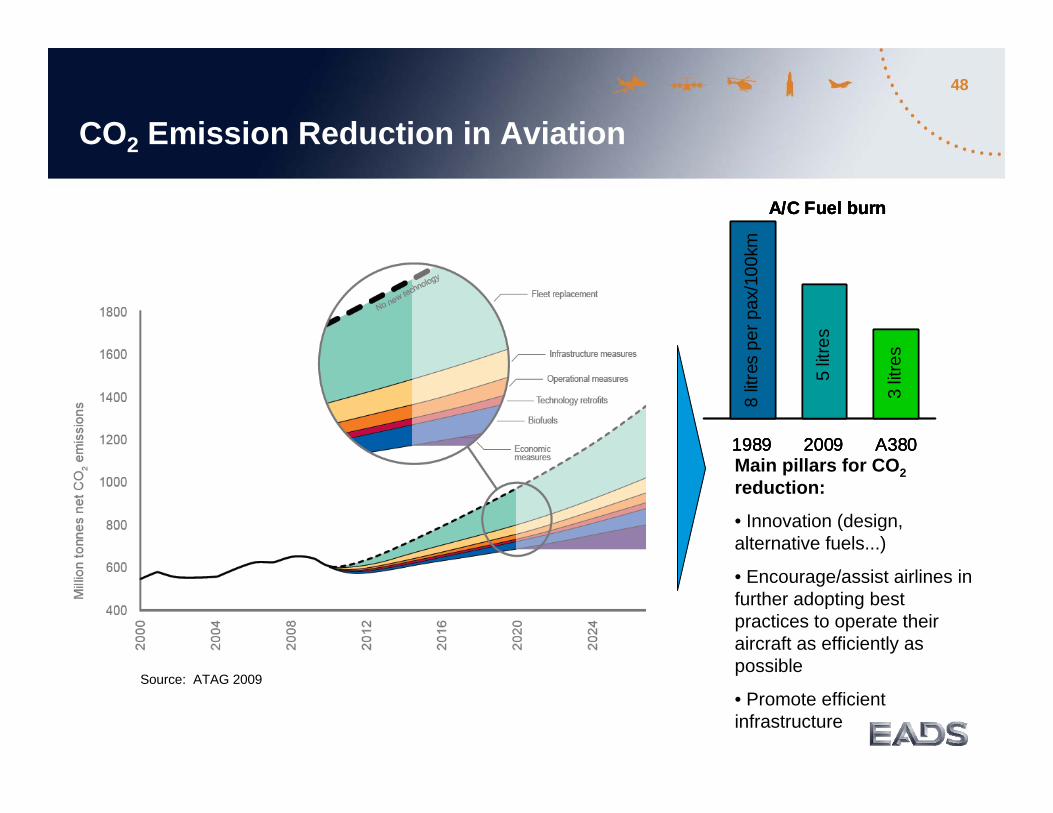
CO2 Emission Reduction in Aviation
Source: ATAG 2009
Main pillars for CO2reduction:
• Innovation (design, alternative fuels...)
• Encourage/assist airlines in further adopting best practices to operate their aircraft as efficiently as possible
• Promote efficient infrastructure
A/C Fuel burn
1989 2009 A380
3 lit
res
5 lit
res
8 lit
res
per p
ax/1
00km
A/C Fuel burn
1989 2009 A380
A/C Fuel burn
1989 2009 A380
3 lit
res
5 lit
res
8 lit
res
per p
ax/1
00km

49A320 Development To maintain the Lead
€ 100 M per year investment – to enhance long term value
50
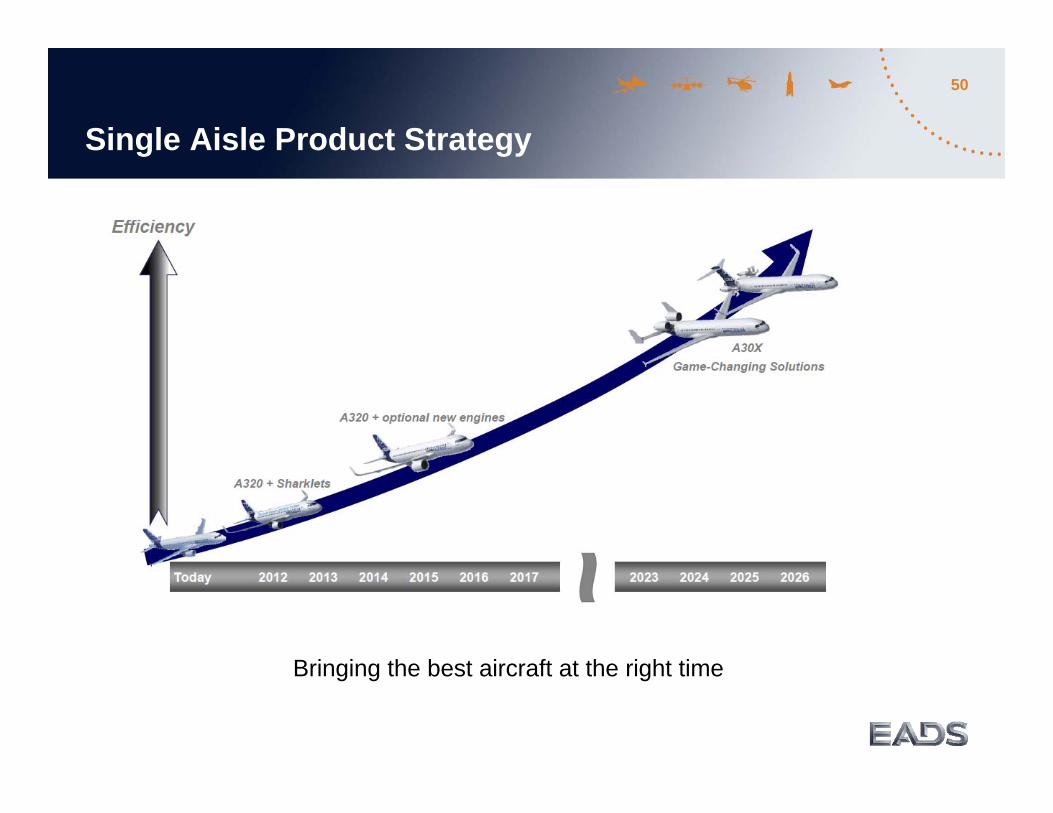
Single Aisle Product Strategy
Bringing the best aircraft at the right time
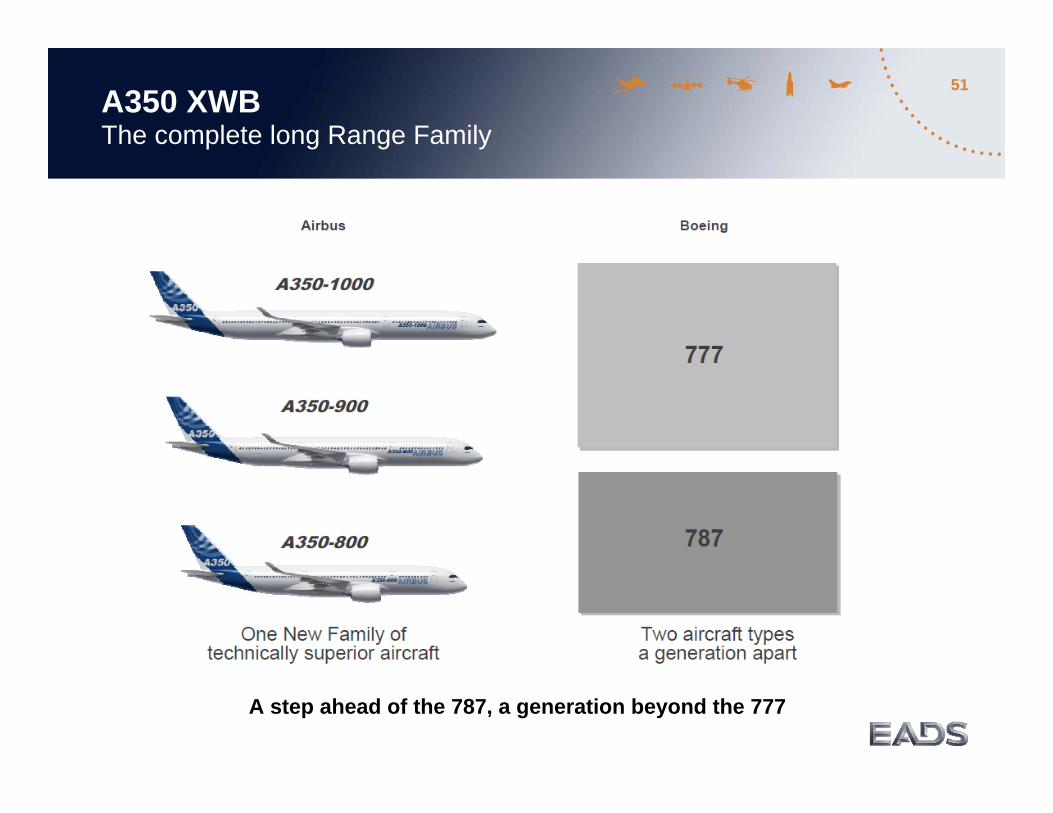
51A350 XWBThe complete long Range Family
A step ahead of the 787, a generation beyond the 777
52
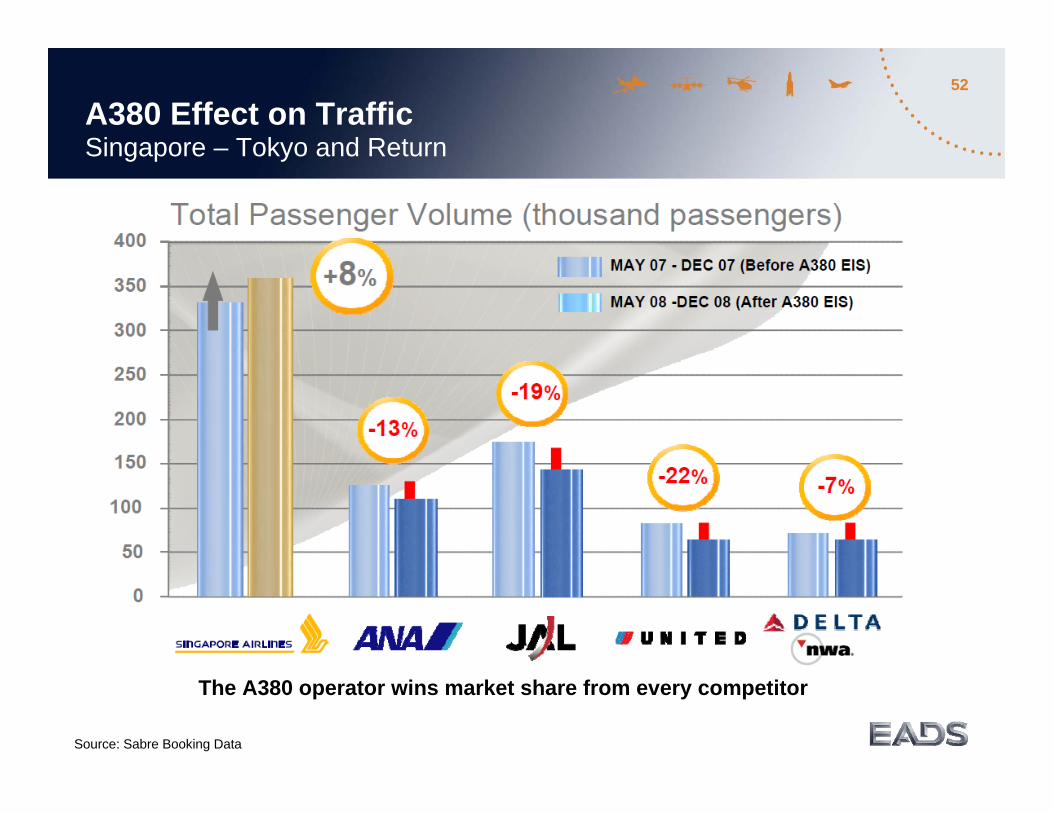
A380 Effect on TrafficSingapore – Tokyo and Return
The A380 operator wins market share from every competitor
Source: Sabre Booking Data