Table in the Wilderness? Towards a Post-Liberal Agenda for Old Testament Studv. J Crais Bartholome

;
1
c
li
)
EA4it
Waterways National
Studv o - - u ' I FINAL REPORT
ANALYSIS OF ENVIRONMENTAL ASPECTS OF WATERWAYS NAVIGATION
PREPARED FOR
U.S. ARMY CORPS OF ENGINEERS INSTITUTE FOR WATER RESOURCES
WATER RESOURCES SUPPORT CENTER KINGMAN BUILDING
FORT BELVOIR, VA 22060
UNDER CONTRACT NUMBER DACW 72-79-C-0003
AUGUST 1981
VOW .<*----->

TRAFFIC FORECASTING
METHODOLOGY
FINDINGS AND
CONCLUSIONS
EVALUATION OF ALTERNATIVE FUTURE
STRATEGIES FOR ACTION
FINAL REPORT
ANALYSIS
REPORTS AVAILABLE
FROM NTIS•
EVALUATION OF THE PRESENT NAVIGATION SYSTEM
FORECASTS AND NEEDS IDENTIFICATION
/COMMERCIAL WATER
TRANSPORTATION USERS
(Shippers)
OVERVIEW OF
THE TRANSPORTATION
INDUSTRY
REVIEW OF NATIONAL DEFENSE,
EMERGENCY AND SAFETY
ISSUES AFFECTING
THE WATERWAYS
\ ' \ \ \ \ ANALYSIS \
VIRCINMENTAI. \
\\ ASPECTS\ \ OF \ •
,\NAVIGATION WATERWAYS \
ANALYSIS OF
NAVIGATION RELATIONSHIPS
TO OTHER WATER
USES
WATERWAYS' SCIENCE
AND TECHNOLOGY
\ \
TECHNICAL REPORTS
ENGINEERING ANALYSIS OF WATERWAYS
SYSTEMS
METHODOLOGIES
NATIONAL WATERWAYS STUDY AVAILABLE CONTRACTOR REPORTS
— INVENTORY OF NAVIGATION SYSTEM (Corps)
— DETAILED WATERBORNE COMMERCE STATISTICS (Corps)
— ACCIDENT & COLLISION STATISTICS (Coast Guard)
— INDUSTRY STATISTICS (USDA, NCA, ISI, DOE, etc.)
— LOCKAGE DATA FROM PERFORMANCE MONITORING SYSTEM (Corps)
— PROJECT STUDIES (Corps)
— NATIONAL WATER ASSESSMENT (Water Resources Council)
— EXTENSIVE INTERVIEWS WITH SHIPPERS, CARRIERS, & PORTS
— LITERATURE SEARCH AND RESEARCH
—CONFERENCES AND PUBLIC REVIEW SESSIONS
PRINCIPAL DATA BASES
SECURITY CLASSIFICATION OF THIS PAGE '4'11en Date Entered)
REPORT DOCUMENTATION PAGE READ INSTRUCTIONS BEFORE COMPLETING FORM
1 REPORT NUMBER 12. GOVT ACCESSION NO 3 RECIPIENT'S CATALOG NUMBER
I
4. TITLE (and Subtitle) 5 TYPE OF REPORT et PERIOD COVERED
NATIONAL WATERWAYS STUDY Final Report January 1979-July 1981
Analysis of Environmental Aspects of s PERFORMING ORG REPOPT NUMBER
Waterways Navigation 7 AUTHOR(,) 8 CONTRACT OR GRANT SuMBER!s)
Thomas Weck Brook Crossan DACW 72-79-C-0003 Louis Berger and Associates, Inc.
9. PERFORMING ORGANIZATION NAME AND ADDRESS , 0 PROGRAM ELEMENT PROJECT, TASK • AREA & WORK UNIT NUMBERS
Louis Berger and Associates, Inc. 100 Halsted St. East ()rang, NJ (17n1q
11. CONTROLLING OFFICE NAME AND ADDRESS 12. REPORT DATE
Institute for Water Resources July 1981 Corps of Engineers, Kingman Building 13. NUMBER OF PAGES
Telegraph and Leaf Rds, Fort Belvoir, VA 460 14. MONITORING AGENCY NAME et ADDRESS(/( different from Controlling Office) IS SECURITY CLASS (of :hie eport)
Unclassified
15a DECLASSIFICATION/ DOWNGRADING SCHEDULE
16. DISTRIBUTION STATEMENT (of this Report)
17 DISTRIBUTION STATEMENT (of the abetract entered fr Block 20, if different from Report)
18 SUPPLEMENTARY NOTES
19. KEY WORDS (Contaase on reverse st de it -tecessery erd •denofty by block number)
water quality, aquatic habitat, terrestrial habitat, air quality, dredging and dredged material disposal,turbidity, suspended sediment
20. A BST-RACT rCcearfasse OM t• t L. SiVig ft 7•CettMLICT aird identify by block dumber)
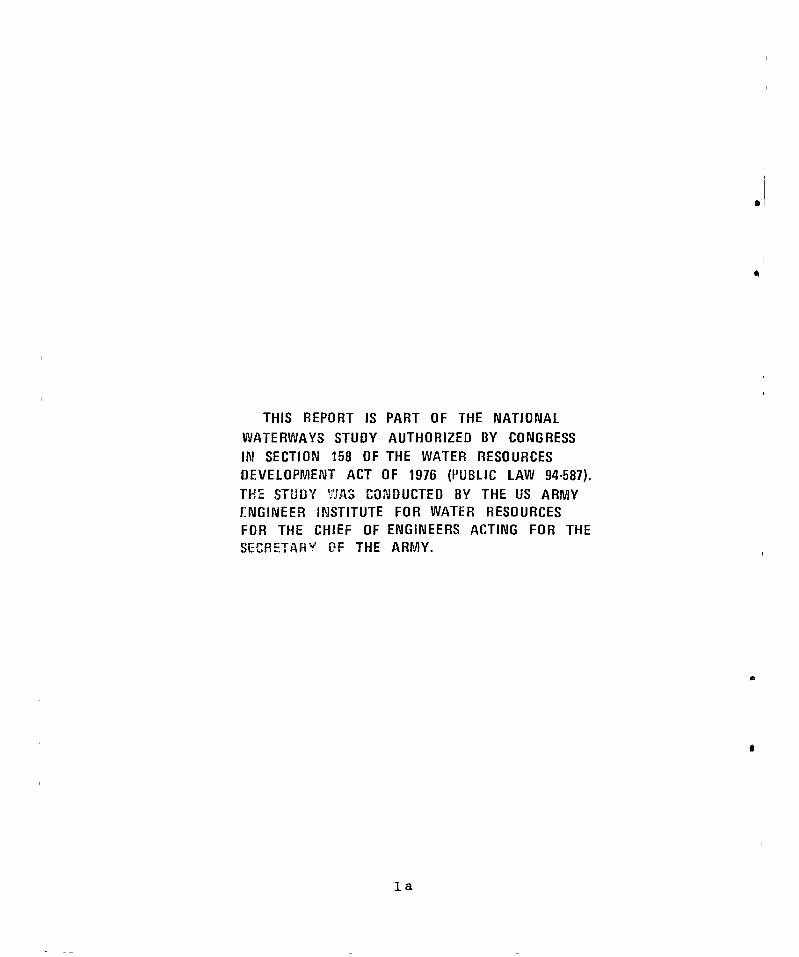
A critical element in the assessment of the present waterways system capacity is the identification of the environmental impacts of waterways activities and the subsequent evaluation of their significance to the overall aquatic and terrestrial ecosystems. The purpose of this report was to identify the full range of environmental impacts of navigation, both beneficial and adverse, assess their significance and suggest possible mitigation measures.
----- ...--...
Do FiCA: 147.3 1473 Eo• -n014 OF 1 NOV 55 15 OBSOLETE 1 Unclassified
SECURITY CLASSI•FIC.ATION OF THIS PAGE When Date ered)
THIS REPORT IS PART OF THE NATIONAL WATERWAYS STUDY AUTHORIZED BY CONGRESS IN SECTION 158 OF THE WATER RESOURCES DEVELOPMENT ACT OF 1976 (PUBLIC LAW 94-587). THE. STUDY VMS CONDUCTED BY THE US ARMY ENGINEER INSTITUTE FOR WATER RESOURCES FOR THE CHIEF OF ENGINEERS ACTING FOR THE SECRETARY OF THE ARMY.
la
NATIONAL WATERWAYS STUDY
ANALYSIS OF ENVIRONMENTAL ASPECTS OF WATERWAYS NAVIGATION
PREFACE
This report is one of eleven technical reports pro-vided to the Corps of Engineers in support of the National Waterways Study by A. T. Kearney, Inc. and its subcon-tractors. This set of reports contains all significant findings and conclusions from the contractor effort over more than two years.
A. T. Kearney, Inc. (Management Consultants) was the prime contractor to the Institute for Water Resources of the United States Army Corps of Engineers for the National Waterways Study. Kearney was supported by two subcontrac-tors: Data Resources, Inc. (economics and forecasting) and Louis Berger & Associates (waterway and environmental engineering).
The purpose of the contractor effort has been to pro-fessionally and evenhandedly analyze potential alternative strategies for the management of the nation's waterways through the year 2000. The purpose of the National Water-ways Study is to provide the basis for policy recommenda-tions by the Secretary of the Army and for the formulation of national waterways policy by Congress.
This report forms part of the base of technical research conducted for this study. This report focused on the identification of the environmental impacts of waterways activities and the subsequent evaluation of their significance to the overall aquatic and terrestrial ecosystems. The results of this analysis were reviewed at public meetings held throughout the country. Comments and suggestions from the public were incorporated.
This is deliverable under Contract DAM 72-79-C-0003. It represents the output to satisfy the requirements for the deliverable in the Statement of Work. This report constitutes the single requirement of this Project Element, completed Imj A. T. Kearney, Inc. and its primary subcontrectors, Data Resouroes, Inc. and Louis Berger and Associates, Inc. The primary technical work on this report was the responsibility of Louis Berger and Associates, Inc. This document supercedes all deliverable working papers. This report is the sole official deliverable available for use under this Project Element.
2
•
National Lwow eideurrysi
FINAL REPORT
ANALYSIS OF ENVIRONMENTAL ASPECTS OF WATERWAYS NAVIGATION
PREPARED FOR
U.S. ARMY CORPS OF ENGINEERS INSTITUTE FOR WATER RESOURCES
WATER RESOURCES SUPPORT CENTER KINGMAN BUILDING
FORT BELVOIR, VA 22060
UNDER CONTRACT NUMBER DACW 72-79-C-0003
AUGUST 1981
U.S. CORPS OF ENGINEERS
NATIONAL WATERWAYS STUDY
ANALYSIS OF ENVIRONMENTAL ASPECTS OF WATERWAY NAVIGATION
TABLE OF CONTENTS
SECTION TITLE PAGE
EXECUTIVE SUMMARY 11
I INTRODUCTION 19
II METHODOLOGY 21
III FINDINGS 22
A. Water Quality and Aquatic Habitat Impacts 22
Overview of Water Quality and Aquatic Habitat 23
Dredging Impacts 38
Impacts of Dredged Material Disposal 56
Lock and Dam Impacts 83
Reservoir Impacts 111
Other Waterways Impacts 114
Critical Issue/Turbidity and Suspended Sediment 147
Summary 158
B. Terrestrial Habitat Impacts 161
Overview of Terrestrial Habitats 161
Dredged Material Disposal Impacts 172
Impacts of Dams 178
Other Waterways Impacts 188
4 1

TABLE OF CONTENTS
SECTION TITLE PAGE
Mitigation 195
Alternative uses of Dredged Material as Mitigation 197
Summary 204
C. Air Quality Impacts 207
Pollutants and Effects 208
Primary Impacts 211
Secondary Impacts 215
Overview of Air Quality Standards 216
Potential Mitigation Measures 216
Summary 218
D. Noise Impacts 221
Environmental Concerns 221
Measures for Mitigating Noise Impacts 224
E. Socioeconomic Impacts 226
Introduction 226
Construction 227
Operation 230
Maintenance 234
Mitigating Measures for Adverse Impacts 235
Summary 237
F. Cultural Resources and Aesthetic Impacts 238
Cultural and Historic Impacts 238
5
TABLE OF CONTENTS
SECTION TITLE PAGE
Aesthetic Impacts 243
G. Environmental Impact of Different Trans- portation Modes 245
Railroads 245
•
Pipeline Transportation 263
APPENDICES
APPENDIX A - GLOSSARY
APPENDIX B - BIBLIOGRAPHY
APPENDIX C - COE DIVISION INTERVIEWS
APPENDIX D - DREDGING AND DREDGED MATERIAL DISPOSAL CONSTRAINTS
I
AI
Table No.
III-1
LIST OF TABLES
111-2
Title Page
Characteristic Natural Estuarine Zone 36 Circulation and Water Quality
Comparison of Short-term Effects of Dredged Material Disposal Between Shallow Water and the Deep OceaLl
78
111-3 Bioaccumulation: Elements and Organisms 157
III-4a Diagram of the Classification Hierarchy for the Marine System 166
111-4b Diagram of the Classification Hierarchy for the Estuarine System 167
III-4c Diagram of the Classification Hierarchy for the Riverine System 168
III-4d Diagram of the Classification Hierarchy for the Lacustrine System 169
III-4e Diagram of the Classification Hierarchy for the Palustrine System 170
III-5 Comparison of Air Emissions of Diesel Fuel and Gasoline 209
111-6 Fuel Consumption Rates for Motorships 212
111-7 Emission Factors for Motorships 213
111-8 Emission Factors At Idle 214
111-9 National Ambient Air Quality Standards 217
III-10 Annual Emissions For St. Louis Air Quality Control Region 219
III-11 Air Pollution Emissions/Dredging 219
111-12 Noise Emission From Dredging Operations 224
7

ii
Table No.
111-13
111-14
LIST OF TABLES
Title
Air Pollution Generation Factors for Railroad and Marine Diesel Engines 257
Railroad Yard Noise Levels 259
Page
i S 111-15 Liquid Pipeline Accident Characteristics 268
111-16 Comparative Impacts of Liquid Petroleum Products Transport Modes 269
#

LIST OF FIGURES
Figure
No. Title Page
III-1 Present Water Quality Problems 27
111-2 Three Major Lentic Zones 30
111-3 Environmental Influences on Fish 32
111-4 Ocean Zonation 33
111-5 Estuarine Environment 34
9
LIST OF EXHIBITS
Sources of Petroleum Products Discharged United States 1973
Sources of Petroleum Products Discharged, United States 1974
Oil and Other Substances, United States 1975
Sources of Petroleum Products Discharged, United States 1976
Sources of Petroleum Products, United States
III-1
111-2
111-3
111-4
111-5
272
273
274
275
276
*
S

EXECUTIVE SUMMARY
The following presentation is a summary of the report entitled "Analysis of Environmental Aspects of Waterways Navigation." The summary and conclusions have been orga-nized by specific sections, each addressing an area of waterway impact assessment. Following each section heading is a synopsis of the significant issues which have been identified and the conclusions drawn. It may be noted that all the studies that appear in this report are generic, in nature, except the analysis of Dredging and Dredged Material Disposal Constraints. This study, which appears as a technical appendix to this report, has been developed on a waterways segment-specific basis. This study was prepared on a segment-specific basis be-cause of the extremely critical environmental issues related to dredging and disposal activity and the availa-bility of relevant information concerning the individual waterways segments.
WATER QUALITY AND AQUATIC HABITAT IMPACTS
The major impact effects associated with waterways were found to be dam construction and dam-related phenom-ena such as flow allocation and alteration of the aquatic environment, maintenance dredging, subaqueous dredged ma-terial disposal and general navigation impacts, viz. spills.
The activities associated with large-scale construc-tion of dams involve clearing large areas, oftentimes forestland, to permit location of batch plants, etc., lo-cation of roadways to facilitate the movement of vehicles and the setting aside of certain areas as dredged material storage sites. It may be noted that although these activ-ities are terrestrial in nature, they function as the pri-mary source of sediment which is carried into the water body by surface runoff. The actual construction of dam, spillway, dike and downstream portals often yeilds large amounts of sediment and subsequent turbidity, while the inundation of areas upstream creates greater aquatic hab-itat at the sacrifice of terrestrial habitat. It should be noted that the downstream turbidity resulting from these types of construction activities is generally a short term impact and, once constructed, structures such
11

as dams and reservoirs serve to trap sediments and prevent their transport and deposition downstream. While the im-pacts associated with individual activities may be miti-gated, the overall impact is significant and major.
In a similar sense, damming and its associated flow control can typically lessen the seasonal variation in flow regime, thereby causing significant changes in water quality and the aquatic biotic community. The impacts do not result simply from the volume of flow released, but include the rate of change, timing and duration of high and low flows, water quality, temperature differences and the velocities of low release from dams. The alteration of the upstream area from a freely-flowing stream environ-ment to a calmer, pool-like environment with a subse-quently significant increase in depth constitutes a major impact on the aquatic habitat.
Dredging and subaqueous dredged material disposal are major, recurrent maintenance activities directed toward the preservaion of open-channel navigation. The major issues raised by these activities include large temporary increases in suspended sediment, increased turbidity, decreased dissolved oxygen and the localized disruption of the benthic (i.e.. bottom) habitat.
The combined impact of dredging and subaqueous dredged material disposal on water quality, however, is generally of a short-term duration and, with the exception of dred-ging in areas where extensive industrial dumping has occurred, accounts for relatively small amounts of resus-pended toxic wastes.
The impacts on the aquatic habitat primarily involve disruption of bottom substrate, thereby destroying certain benthic organisms such as shellfish; the negative effects of increased turbidity and suspended sediment upon fish such as impaired gill function and limited depth of vision; the general reduction in available DO; and the actual burial of sessile or slow-moving organisms by dumping and disposal operations. It may be noted, how-ever, that in many cases, these impacts are temporary and localized and the dredged or disposal area is able to recover and firmly reestablish itself within a reasonable
12
period of time. If major, recurrent disruption occurs, reversion to the original substrate conditions may be precluded.
The major impacts from general waterways navigation typically result from cargo loss due to spillage and from tow movement. Spills, especially of petroleum and other organic chemicals, represent the major long-term impacts to water quality and aquatic organisms. Certain chemi-cals, certain heavy metals and phenols have been docu-mented to maintain their toxicity over extremely long time periods and, furthermore, to accumulate in the tissues of aquatic organisms. The major impacts associated with the movement of tows are resuspension of bottom sediment and wave-induced bank erosion.
It has been noted that long-term, irreversible impacts may result if endangered or threatened species are present but undetected in those areas where water-ways construc-tion or maintenance activities are occurring.
TERRESTRIAL HABITAT IMPACTS
Concerning the effects of waterways activities upon the terrestrial and wetland habitats, several major impact areas were noted to be significant. These were the im-pacts of inundation associated with dams, the impacts of terrestrial disposal of dredged material and the navi-gation-related impact of spills on wetland areas.
The terrestrial impacts associated with the actual construction of a dam and related facilities were con-sidered to be minimal as the site area is small with respect to general overall surrounding areas and, perhaps most importantly, the construction activity is phased over a relatively short time period (i.e., two to five years) thereby generally resulting in impacts of a short-term nature. This statement may be applied to any of the gen-eral construction activities presented in this report. By far, the most significant impact of dams is that associ-ated with their operation whereby large upstream terres-trial and wetland areas are inundated. The impacts of inundation to the existing biota are well established in
13
the literature and typically result in the loss of plant species and displacement/migration and loss of habitat for terrestrial species. Those terrestrial species that are displaced usually face destruction as they are forced to reestablish themselves against indigenous species in an alien habitat where competition and stress are notably more significant.
The impacts associated with dredged material disposal typically involve the loss of less flora than is the case with dam-related inundation, hence, the total range of impacts is relatively less. Usually disposal sites use relatively little of the available habitat and thereby tend to cause minor loss of wildlife species. Disposal is ;perhaps most detrimental when the site chosen is a wet-land or quasi-wetland area. Executive Order 11990 addres-ses the role of the Federal government and its agencies in protecting wetland areas by avoiding the long and short term adverse impacts associated with the destruction or modification of wetlands and avoiding direct or indirect support of new construction in wetlands wherever there is a practicable alternative. The concern for wetlands is due to the inherent sensitivity of the wetlands ecosystem and the frequent presence of endangered and threatened species, primarily avain and aquatic within the area. There are, however, mitigation measures which may be used to compensate for these impacts. Good planning may allow for the selection of sites which are not ecologically critical or the usage of the material in a way that may be more beneficial to the existing environment or that may create new habitats.
It should be noted, however, that the selection of alternative disposal sites, i.e., sites that may not be ecologically critical, often involves some type of trade-off. Alternative sites may be located in an area already developed or more distant from the dredging area. A pro-ject sponsor is generally unwilling to condemn developed lands for use as disposal sites for a multitude of eco-nomic and social reasons and the use of more remote sites affects the cost, level, and frequency of maintenance. The avoidance of ecologically critical areas may, there- fore, require additional funds be set aside to either pur-chase developed lands or offset costs associated with increased distance to disposal areas. Use of diked retaining walls for slurry deposition and the treatment of
14
v
1
I
site runoff are major measures to preserve water quality. These measures are particularly important in light of con-tinuing opposition by public and private interest groups to the location if disposal sites in coastal or floodplain areas. A practicable methodology for avoiding adverse environmental impacts would be the instigation of site-specific studies before, during and after establishment of disposal sites or disposal activities. Studies beforehand would help to distinguish between suitable and inappro-priate areas for disposal while studies during and after can lead to more accurate assessments of impacts and to measures to reduce significant impacts.
Navigation, per se, gives rise to many impacts, such as bank erosion, noise and air quality disturbances. How-ever, the most significant impact is associated with cargo spillage, especially in wetland areas. This is primarily due to the fact that wetlands are ecologically sensitite and to their propensity as habitat for many rare endan-gered species.
In short, both dam-related inundation and wetlands disposal of dredged material typically result in irrever-sible and irretrievable commitments of terrestrial resources.
AIR QUALITY IMPACTS OF WATERWAYS NAVIGATION
This study identified the major air pollutants asso-ciated with waterways navigation, compared diesel towboat emission against their gasoline engine counterparts and attempted to quantify waterways-related pollution in rela-tion to other modes of transportation.
From an historical perspective, the navigational im-pacts on air quality have been treated cursorily and, to a large extent, this treatment has been somewhat justified. The overall air pollution resulting from navigation is far less than that from other surface modes of transportation, such as trucks, and is also comarable to, or less than, railroad, depending upon such a varialbe as terrain. Air pollution from navigation activity, however, as a subset of overall transportation modes, is rather minor. A study
t
15
of riverboat emissions in the St. Louis, Missouri region showed that waterways traffic, when compared to the total percent emissions of other transportation modes, yielded 3.1% of NO 0.4% of HC, 0.21% of CO, 5.9% of SO x and 2.2% of particulates.
The major maintenance operation (i.e., dredging) would, in most cases, be expected to create no significant air quality impact. Estimations of emissions from COE dredging operations in the San Francisco Bay area have been compared to total Bay area emissions and total Bay area ship emissions. This comparison indicated that dred-ging operations resulted in the annual addition of 757 tons 50x, 71 tons NOx, and 99 tons TSP or 0.79%, 0.02%, and 0.16%, respectively of the total annual Bay area emissions.
It appears possible for the future that for those geo-graphical areas presently experiencing aggravated air quality conditions, the additional atmospheric pollutants introduced by navigation will receive greater interest.
MINOR IMPACTS
The following additional studies have been undertaken so as to address all areas of environmental concern:
- Noise Impacts.
- Socio-Economic Impacts.
- Cultural Resources and Aesthetic Impacts.
- Impact of Different Transportation Modes.
These studies have been developed with less level of detail than the aforenoted sections and, due to their brevity, have not been summarized herein. The primary reason for this differentation in level of detail is that the greatest emphasis was placed on those study areas where the environmental impacts from navigation were determined to be most critical.
16
4
This prioritization of the environmental impact issues was determined on the basis of a number of meetings held with COE personnel, an extensive literature survey of waterways-related reports and documents and our own expe-rience concerning the identification and evaluation of environmental impacts. The meetings held with Division and District COE personnel were phased over a several month period and provided direct accounting and feedback concerning their interpretation of the major environmental issues. Furthermore, the literature survey provided clear insight into the range of present and anticipated environ-mental impacts of navigation activities and were most helpful in the assignment of environmental significance.
DREDGING AND DREDGED MATERIAL DISPOSAL CONSTRAINTS
As noted earlier, this segment-specific study has been included as a technical appendix to the overall environmental report. It acts, in a sense, as a comple-ment to the previous studies on Water Quality and Aquatic Habitat and Terrestrial Habitat Impacts which identified the environmental impacts of dredging and dredged material disposal on a generic basis.
This study summarized on a segment-level basis the cubic yards of material dredged annually, costs per cubic yard and mile, types of dredging predominantly used, pre-dominant types of disposal and the relative importance of dredging to that particular segment under analysis. Fur-thermore, the relative level of environmental concern experienced by that waterway segment was categorized as either low, moderate or high. This assessment of environ-mental concern essentially represents a range of relative judgmental values based upon the interrelationship between environmental regulations and their effect upon the dred-ging potential for any specific waterways segment. As an example, it may be noted that in the Upper Mississippi River (Segment 1), the environmental constraints are rated as high on this relative scale because there is currently great difficulty in obtaining disposal sites, which in turn supplies the impetus to change dredging technology and reduce the quantity of dredged material. Techniques such as the reduction of dredging depths and the delayed initiation of dredging activities can result in major
17

decreases in dredged material volumes. On the other hand, the Middle and Lower Mississippi River (Segments 3-6) cur-rently have few environmental constraints to dredging or disposal and, hence, are rate as low on this relative scale.
The areas of most critical environmental concern appear to be the upper main stem of the Mississippi River, the approaches to the major ports, and the Great Lakes.
It should be noted that major problems were encoun-tered in assessing the environmental constraints to dred-ging and disposal activities. Primarily these problems were a direct result of the general weaknesses present in the data base, i.e., the specific dredging-and-disposal-related EISs. In most cases these EISs did not address the technical aspects of dredging as they relate to en-vironmental considerations nor did they present alterna-tive methods for possibily reducing dredge material quan-tities. It should be recognized, however, that many of the EISs were outdated and, as such, did not incorporate the results of the DMRP and other state-of-the-art research.
18
4
4
I. INTRODUCTION
The National Waterways Study (NWS) has been developed by the United States Army Corps of Engineers (COE) to evaluate the existing national waterway system and assess the capability of this system to meet progected future demands. A critical element in the assessment of this capacity is the identification of the environmental im-pacts of waterways activities and the subsequent evalua-tion of their significance to the overall aquatic and ter-restrial ecosystems.
In addition, this environmental element report serves to give depth and comprehensiveness to other element reports directed at the same goal of assessing the capa-bility and projecting the demand for our waterways system. The sections of this report which delineate the environmental impacts of dredging and dredged material disposal conjoined with the technical appendix, Dredging and Dredged Material Disposal Constraints, logically com-plement the element report which presents the engineering aspects of dredging. In the same sense, the aquatic and terrestrial ecosystem impacts as presented in this report relate to the element report on multipurpose water use which analyzes the competing fish and wildlife require- ments for water use. In an overall sense, the information developed and presented in this environmental element report will serve as an input into the evaluation of strategy options in the latter phase of the study.
Therefore, it is the intent of this element report, Analysis of Environmental Aspects of Waterways Navigation, to identify the full range of environmental impacts of navigation, both beneficial and adverse, assess their sig-nificance and suggest measures to mitigate adverse im-pacts, where applicable.
The following section, Methodology, Section II, con-cisely explains the development of the data base upon which this report is predicated and, furthermore, dis-cusses the general techniques used to classify and synthe-size the pertinent data.
19
Under the topic Findings, Section III, the environ-mental impacts of navigation are presented on the basis of the following sub-topics:
- Water Quality and Aquatic Habitat Impacts.
- Terrestrial Habitat Impacts.
- Air Quality Impacts.
- Noise Impacts.
- Socioeconomic Impacts.
- Cultural Resource Impacts.
- Impact of Different Transportation Modes.
Each sub-topic is prefaced with a brief introductory statement which clarifies the format and organization of the specific impact section. In addition, Section IV, Recommendations for Further Investigation, discusses the drawbacks and potential constraints concerning the effi-ciency of the existing state-of-the-art environmental analysis of impacts and present some suggestions as to how this analysis may be improved, including subject areas which require added emphasis. A brief discussion of secondary impacts is also included in this section.
The appendices contain a glossary of key terms and a complete bibliography, which is subdivided to correspond to the respective subject areas discussed under Findings. In addition, a comprehensive study, "Dredging and Dredged Material Disposal Constraints", is included as a technical appendix. This technical appendix discusses constraints on a waterways segment-specific basis and includes tabular summary of such segment-specific information.
20

II. METHODOLOGY
In order to fully assess the capacity of the national waterway system and enable accurate projection of the en-vironmental impacts, a thorough comprehension of available information on all facets of waterways activity that may influence the environment had to be attained. To that purpose, a series of informational meetings was held with COE personnel from the Division and District levels (See Appendix C). At these meetings the extent and type of information required were fully discussed resulting in the accumulation of an extensive listing of documents, studies and reports, which were felt to adequately address the identified enviornmental subjects. In addition, other federal agencies (e.g., EPA and Fish & Wildlife) and regional agencies (e.g., River Basin commissions) were contacted.
Thus, a major component of this environmental assess-ment of navigation impacts has been the execution of an extensive literature search and survey. The intent of this literature search has been to identify the various environmental disciplines germane to the objectives of the study, catalog the material in terms of these disciplines and, furthermore, subdivide and rate the sufficiency of the material in terms of coverage, detail and applica-bility.
The material received from the eleven COE Divisions represented, primarily, three types of studies: Dredged Material Research Program Reports from the United States Army Waterways Experiment Station (WES reports), Draft and Final Environmental Impact Statements issued by the COE, and specific technical reports detailing studies on dredging, environmental constraints, and ecology.
As these documents, studies and reports were re-ceived, they were reviewed and catalogued according to the relevant impact topic to which they related. This col-lection of written material formed the primary basis from which the environmental impact of navigation, as presented in this report, has been identified.
The individual impact assessment topics, as indicated in the preceding introduction, follow this section.
21
III. FINDINGS
A. WATER QUALITY AND AQUATIC HABITAT IMPACTS
The following section identifies the environmental impacts to the existing water quality and aquatic habitat associated with the construction, maintenance and opera-tion of the national waterways system.
1 The format of this section consists of an initial
overview of existing water quality criteria and conditions and a general description of the types and nature of major aquatic habitats. A discussion is also presented concern-ing the issue of rare and endangered plant and animal species.
The overview is followed by a detailed discussion of the associated navigational impacts. These impacts are classified both by waterway type, i.e., channelized, free flowing and tidal, and activity, i.e., construction, oper-ation and maintenance. It should be noted that the im-pacts of dredging and dredged material disposal are ad-dressed on a generic basis and are not directed toward a segment-specific significance. A report presenting the environmental constraints to dredging and dredged material disposal on a segment-specific basis has been developed and is included with this report as a separate technical appendix.
A detailed discussion of turbidity is included as a subsection titled, "Critical Issues, Turbidity and Sus-pended Sediment", as it is a major effect of all waterways activity and constitutes a significant impact on water quality and aquatic habitat.
• A summary of this section is provided at the conclusion.
41
•
OVERVIEW OF WATER QUALITY AND AQUATIC HABITAT
(a) Water Quality
1. General Background and Classification. The following discussion of water quality classifications and parameters is directed toward the development of a quali-tative framework against which the impacts of waterways activity may be clearly understood. Furthermore, the con-cluding tables provide definitions as to the major water quality problems presently experienced in the nation's waterways.
The Federal Water Pollution Control Act of 1972 (WPCA) established the national goal that the discharge of pollutants into the navigable waters be eliminated by 1985, and that wherever attainable, an interim goal of water quality that provides for the protection and propa-gation of fish, shellfish and wildlife and provides for recreation in and on the water be achieved by July 1, 1983. This act was followed by the Clean Water Act of 1977.
It became the responsibility of the individual states to classify the existing water quality of those applicable water bodies within their boundaries and deter-mine strategies whereby the national goals may be best realized. An example from the New Jersey Surface Water Classification follows below:
(a) Class FW-1 - Fresh waters, which because of their clarity, color, scenic setting, or other characteristics of aesthetic value or unique special interest, have been designated to be set aside for pos-terity to represent the natural aquatic environment and its associated biota.
(b) Class FW-2 - Fresh surface waters approved as sources of public water sup-ply and shall also be suitable for the maintenance, migration and propagation of the natural and established biota; and for primary contact recreation, industrial and agricultural water supply and any other reasonable uses.
2 2,

(c) Class FW-3 - Fresh surface waters suit-able for the maintenance, migration and propagation of the natural and estab-lished biota; and for primary contact recreation, industrial and agricultural water supply and any other reasonable uses.
For the purpose of this report, indications of general water quality may be characterized by six commonly observed variables. These variables and their appropriate definitions follow below:
(a) Dissolved Oxygen (DO) - The oxygen freely available in water and necessary for aquatic life and the decay of or-ganic materials. The amount of DO in a river or stream will determine the type and quantity of aquatic life that can be supported. Generally, as the amount of DO decreases, the diversity of species decreases.
Nutrients (Nitrogen and Phosphorus) - Nitrogen and phosphorus are essential nutrients presented in a variety of forms in the aquatic environment. Nitrate (NO3) and dissolved phosphate (PO4) are fertilizing nutrients which are important in controlling the rate of plant growth in the terrestrial and aquatic environment. When plants and animals that have absorbed the nutrients die, the organic forms of phosphorus and nitrogen they contain break down and release the needed nutrients to renew the natural growth and decay cycle. The total amount of phosphorus and nitrogen (in organic and inorganic forms) in an aquatic system represents the relative potential to support plant growth. The amount of inorganic nitrogen and phos-phorus is a better indicator of the amount of nutrients immediately avail-able to support plant growth. Once available, the nitrate and phosphate can be taken up by plants in a relatively brief period of time, phosphate in a
(b
24
matter of hours in coastal water during mid-summer.
(c) Turbidity (Suspended Solids) - This parameter represents the amount of mate-rial that could settle out of a given quantity of water. The chemical nature of such solids can vary considerably from inert mineral material, such as sand, to chemically reactive material such as clay particles and organic mat-ter. The significance of this indicator is that it makes the water appear tur-bid, restricts the penetration of sun-light into the water (and thus the light available for photosynthesis in aquatic plants), and upon settling can cover the ocean or stream bottom where many orga-nisms live or reproduce. In certain instances, turbidity can be high with relatively low suspended solids if a colloidal suspension of clays is present.
(d) Coliform Bacteria - Fecal coliform are waterborne bacteria associated with the intestinal tract of warm blooded ani-mals. Their sanitary significance as an indicator of fecal contamination lies in their ability to suggest the presence of microbial pathogens and the possible degree of health risk associated with the use of water for drinking, swimming or shellfish harvesting.
(e) Toxic Substances - Toxic substances include heavy metals such as arsenic, cadmium, chromium, lead, mercury and zinc; industrial chemicals such as cya-nides, phenols and PCBs; pesticides such as DDT, chlordane, aldrin and dieldrin; and other chlorinated hydro-carbons. They can cause death or repro-ductive failures in fish and wildlife, and can be carcinogenic or cause other severe health problems in humans. Many of the substances accumulate and concen-trate in the food chain and some, such as PCBs, are highly persistent and may remain in the environment for decades.
25
(f) Total Dissolved Solids (TDS) - These are the inorganic and organic salts that are dissolved in the water resulting, wholly or partially, in such physical charac- teristics as conductivity, salinity, hardness, pH and taste. High TDS in inland water are objectionable because of possible physiological effects, min-eral taste and economic consequences such as for irrigation, municipalities and certain industrial uses. Generally, rapid change in TDS levels are detri- mental to aquatic life.
2. National Overview. In respect to all of the water quality criteria defined in the previous section (except toxic substances), Figure III-1 presents a synop-sis of the present water quality problems on a national basis.
Dissolved oxygen depletion in reaches of rivers and estuaries below major wastewater discharges is evident throughout the country. Levels are further reduced in regions of low stream flow, such as in the Southern Plains and Midwest regions. In the highly populated Northeast, a region of high runoff, DO depletions still occur, often complicated by combined sewer overflows and urban storm runoff which deliver pulse loadings of oxygen-demanding materials (i.e., BOD) to receiving waters. It has been found that supersaturated gases (primarily dissolved ni-trogen) below dams on the Columbia and Snake Rivers cause physiological damage to migratory salmon and related species.
High nutrient levels can stimulate excessive aquatic plant growth causing oxygen depletion, odors and aesthetic degradation. Municipal discharges, urban storm runoff and combined storm and sewer overflows account for much of the nutrient loadings in the Northeast. Land run-off is a major contributor in the agricultural areas of the Southeast, Midwest and West. Several states, includ-ing Vermont, Maryland and Florida, report high nutrient levels as their most serious water quality problem.
Natural turbidity varies regionally and waste-water discharges, construction activities and man-induced erosion through various land uses can add to these turbid-ity levels. Often, very turbid water, high in suspended
26

ALASKA
JCALE s.y.t.cant
MID Al SO CUL F OAHU HAWAI
SO LAI IF RIGHT
PACIFIC NOOTHWES1
\14
Moder■ te
M f101
1.01F OF ALASKA
LOL 1M6 A PLATEAU NORTHERN PLAINS MIDWEST /GREAT LAKES
NEW END AND
CENTRAL VAL LEY
POE HT° RICO
(.RE 11ASIN I. COL RIA00 PI AT LAO SO( 1111 RN PLAINS
SW DLSE“ I
Al III
HAWAII P011110 RICO
LEM
Figure III-1
Present Water Quality Problems
Nab" Amealment.
•oe KEy 1 iDusoNed Oxpip•R
FurImUly
C!..:5 Study Ai. 01Ji Dp.soNed
A M Lit..giJpIIl 114910M FiaLl. ■ .■
Source: National Commission on Water Quality, February 1976
A

solids, will limit light penetration inhibiting plant growth. In general, turbidity levels are highest in the "soft-rock" and arid areas of the country, including the Southwest, the Great Plains and Midwest. High natural color (resulting from the presence of dissolved organic and inorganic materials) and turbidity levels also are associated with swamp drainage in the South Atlantic and Gulf Coast regions.
Total dissolved solids problems are generally associated with regions of high natural background concen-trations of minerals, viz., the Southwest and Northern and Southern Great Plains. However, man's activities, partic-ularly intensive agricultural practices involving irriga-tion, contribute to the loads in each of these regions. Saltwater intrusion into fresh groundwater supply, due to groundwater withdrawal, is a concern in coastal areas as is saltwater intrusion at the mouths of rivers discharging into estuaries, which is caused by channelization or the withdrawal of freshwater. Several southwestern states, such as Texas and Oklahoma report that the disposal of brines used in drilling for oil has caused severe salinity problems in certain areas as well as the fact that these areas also have numerous natural salt sources. Chloride levels in Lake Erie, although not a severe problem, are trending steadily upwards and have been related to the use of salt as a deicer. Acid mine drainage is evident prima-rily in the Appalachian coal mine regions drained by the Ohio, Delaware, Susquehanna and Potomac rivers.
The most widely reported water pollution problem fecal contamination as indicated by excess concentrations of fecal coliform bacteria. The major source of bacterial contamination varies with land use and geographical loca-tion; however, for most parts of the country, urban areas are the primary problem. High concentrations of coliform bateria represent a pathogenic condition which makes the waterbody unsuitable for many forms of recreation. It should be noted that several states, including Alabama, Kansas, Nebraska and New Mexico, believe that many of their waterbodies are not suited for swimming even in their natural states because of channel geometries, high flow rates, high natural turbidity or high background levels of bacteria.
Two major categories of recognized toxics - heavy metals, including mercury and cadmium, and pesticides - have been increasingly observed in the nation's waters.
2R

Metals problems are particularly widespread because they can come from different sources. The states east of the Mississippi generally indicate that excess toxic metal concentrations are due to industrial discharges, urban stormwater runoff and atmospheric fallout of pollutants. Massachusetts describes high metals concentrations in the Blackstone, Hoosic, Ten Mile and Westfield rivers attribu-table to industrial discharge. High concentrations of mercury and other toxics around New York City waters are attributable to urban runoff. Western states, however, attribute active and abandoned mining operations as their primary source of contamination. High arsenic concentra-tions in the Yellowstone River are from natural rock for-mation (National Commission on Water Quality, 1976).
Eighteen states recognize major problems with pesticides. Certain industrial chemicals such as cyanides and phenols are major pollutants in several of the North-east water bodies and Great Lakes.
(b) Aquatic Habitat
The discussion presented herein concerning freshwater and marine habitats is directed at the identification of general habitat components, their interrelationships and an indication of their relative sensitivities with respect to navigation activities. Furthermore, the information concerning water quality, presented previously, indicates the type of water quality disruption or degradation that will effect significant changes to the habitats described.
Aquatic habitats may be divided into those associated with fresh water and those associated with salt water or marine environments. Estuaries represent some aspects of both but, for the purposes of this report, have been in-cluded as a marine habitat.
1. Fresh Water Habitats. Fresh water habitats may be considered as consisting of two general types: lentic and lotic. Lentic habitats are those characterized by calm, standing waters, including lakes, ponds, swamps and bogs. Lotic habitats are characterized by running water and include springs, streams and rivers.
29
LITTORAL ZONE \
LIMNETIC ZONE
- - - - LIGHT COMPENSATION LEVEL
PROFUNDAL ZONE
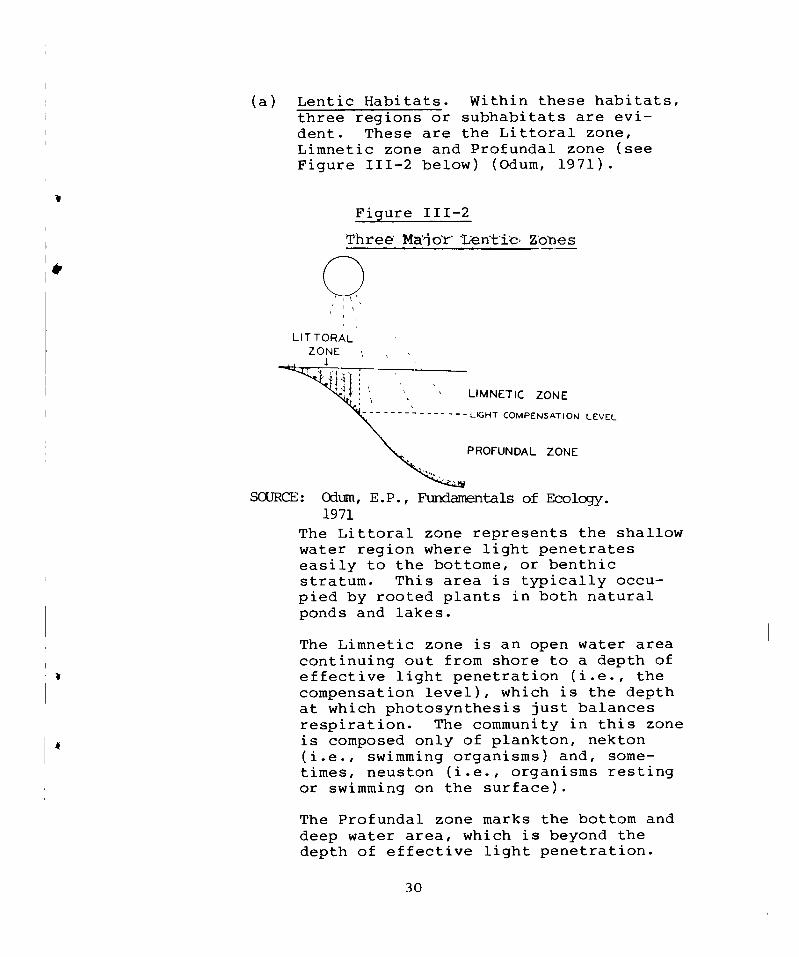
(a) Lentic Habitats. Within these habitats, three regions or subhabitats are evi-dent. These are the Littoral zone, Limnetic zone and Profundal zone (see Figure 111-2 below) (Odum, 1971).
Figure 111-2
Three Major Ieriti.C , &piles
MAKE: Cdum, E.P., Fundamentals of Ecology. 1971
The Littoral zone represents the shallow water region where light penetrates easily to the bottome, or benthic stratum. This area is typically occu-pied by rooted plants in both natural ponds and lakes.
The Limnetic zone is an open water area continuing out from shore to a depth of effective light penetration (i.e., the compensation level), which is the depth at which photosynthesis just balances respiration. The community in this zone is composed only of plankton, nekton (i.e., swimming organisms) and, some-times, neuston (i.e., organisms resting or swimming on the surface).
The Profundal zone marks the bottom and deep water area, which is beyond the depth of effective light penetration.
30
This zone is, likewise, at a depth suf-ficient to mitigate most impacts resulting from navigational activities.
(b) Lotic Habitats. Within these current-directed water bodies, two major zones are generally evident: Rapids zone and Pool zone. The Rapids zone is charac-terized by shallow water where the cur-rent velocity is great enough to keep the bottom stratum clear of silt and other loose material, thereby providing a furm substrate. This extremely diverse zone is occupied largely by specialized benthic or periphytic organisms, which become firmly attached or cling to the substrate, and by stron swimmers such as darters, a type of fish.
The Pool zone is characterized by deeper water where the current celovity is reduced and silt and other loose mate-rial tends to settle to the bottom, pro-viding a soft substrate fro those ben-thic species that prefer burrowing. This zone is normally rich in aquatic life, fish, amphibians, insects, plankton, etc. (Odum, 1971).
The construction of a dam, for example, greatly alters the characteristics of the lotic environment. Upstream from the dam, the Pool zone is gretly enlarged, diminishing flow velocity and increasing the deposition of bottom sed-iment. Downstream, the flow velocity is increased as the channel cross-section is often decreased. This results in an added degree of scour and maynindicate an environment that is characteris-tically extreme lotic.
Generally speaking, major zonal areas subject to navigational impacts to fresh water habitats include the Littoral and Limnetic zones (together comprising the Euphotic zone) of the lentic habitats and the Rapids and Pool zones of the
31

or IL
Al ASK A
SCALE Maw --I
■ :::::
PACIFIC NOH TIME Si cOLUMNIA Plateau
CENTRAL VALI EV
NEW ENGLAND
I
lights ER 01
\*Ct
MID AEC 10 CUL,
PULA FO 11100
OAHLI
IFAWAII 10 CALIF BIGHT GREAT BASIN &
S W DESERT RN PLAINS PUER I 0 RICO
POtyca•I Hab.lat Mothl/cat.on
Et6Imally
0.1sulaed Oxygon
A M - 4e..ant
KEY E:=1
SOY". 0a11 Con...11w.. sm. INala•
cumpdad Noon •naolumnental conoacest top°. is
November 1975
Figure 111-3
Environmental Influences on Fish

Intertidal Nentic
— -t- —
Continental
Shelf
Ui
2 4 000
50 00 [
C000 - -
I000
Oceanic __Ly photic Zone
Aphc tic Zone
Trenches,Conyons
and Ridges _
; Continental Rise nyssol Plain
1000
2000
C2 3000 Mid Ocean Ridges /
lotic habitats. The potential for dis-ruption of these habitats is great and, due to their interdependency and inter-relation, an impact on one habitat com-ponent may result in an equal or more severe impact on another habitat com-ponent. The environmental impcat of three factors (i.e., physical habitat modification, turbidity and dissolved oxygen depletion) on fish is presented in Figure 111-3.
2. Marine Habitats. There are three primary habitat zones to be found within the oceanic environment. These are the Intertidal (coastal), Neritic (near shore) and Oceanic zones, as illustrated in Figure 111-4 (odum, 1971.)
Figure 111-4
Oceanic Zonation
SOURCE: Odum, E.P., Fundamentals of Ecology. 1971.
Only two of these zones, the Intertidal and Neritc, bear importance concerning navigational activi-ties, and the Oceanic zone, extending outward from the continental shelf, is beyond the impact zone as described in this report.
Only the Intertidal zone is a specialized, highly sensitive area known as an estuary. An estuary is a semi-enclosed coastal body of water which receives both fresh
33
UNI I S
PHYTOPLANKTON
otaillun t HI GH
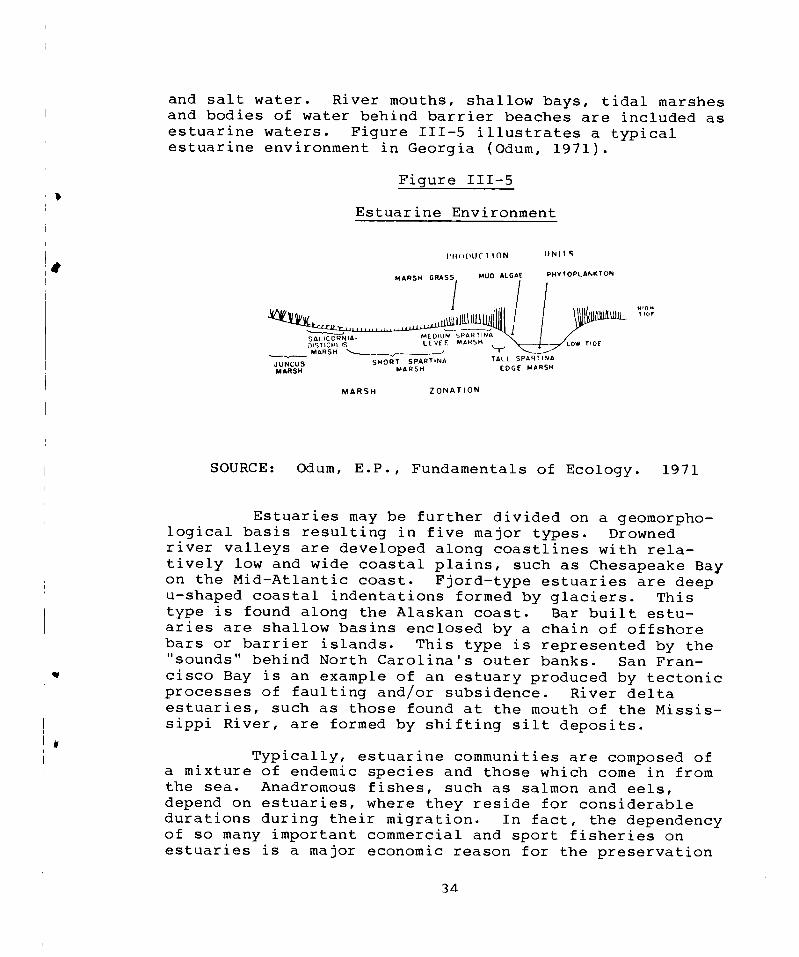
and salt water. River mouths, shallow bays, tidal marshes and bodies of water behind barrier beaches are included as estuarine waters. Figure 111-5 illustrates a typical estuarine environment in Georgia (Odum, 1971).
Figure 111-5
Estuarine Environment
l'a()DOC HON
MARSH GRASS MUD ALGAE
SALICORNIA - MEDIUM SPAR T INA
DISTICHLIS LEVEE MARSH
...._..._____ MARSH
JUNCUS SHORT SPARTINA TALL SPARTINA
MARSH MARSH EDGE MARSH
MARSH ZONATION
LOW TIDE
SOURCE: Odum, E.P., Fundamentals of Ecology. 1971
Estuaries may be further divided on a geomorpho-logical basis resulting in five major types. Drowned river valleys are developed along coastlines with rela-tively low and wide coastal plains, such as Chesapeake Bay on the Mid-Atlantic coast. Fjord-type estuaries are deep u-shaped coastal indentations formed by glaciers. This type is found along the Alaskan coast. Bar built estu-aries are shallow basins enclosed by a chain of offshore bars or barrier islands. This type is represented by the "sounds" behind North Carolina's outer banks. San Fran-cisco Bay is an example of an estuary produced by tectonic processes of faulting and/or subsidence. River delta estuaries, such as those found at the mouth of the Missis-sippi River, are formed by shifting silt deposits.
Typically, estuarine communities are composed of a mixture of endemic species and those which come in from the sea. Anadromous fishes, such as salmon and eels, depend on estuaries, where they reside for considerable durations during their migration. In fact, the dependency of so many important commercial and sport fisheries on estuaries is a major economic reason for the preservation
34
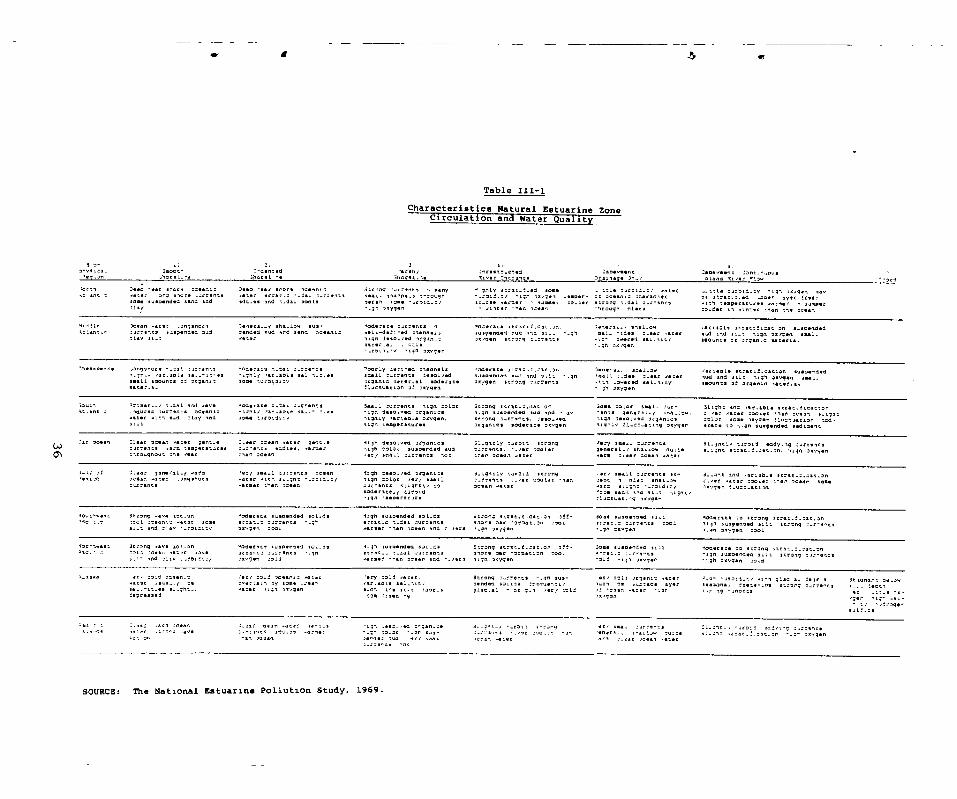
of these habitats (Reid and Wood, 1976). Table III-1 pre-sents a national perspective on estuarine and nearshore characteristics and associated water quality.
Following is a general discussion of the endan-gered and threatened aquatic flora and fauna species which must be addressed each time a waterways activity en-croaches on such a habitat.
(c) Endangered and Threatened Species
Wildlife preservation became a federal concern in 1903 when the first wildlife refuge at Pelican Island in Florida was designated by President Theodore Roosevelt. Since then, the wildlife refuge system, under the manage-ment of the Bureau of Sport Fisheries and Wildlife, has grown to well over 300 units. The Endangered Species Act of 1966 directed the Secretary of the Department of the Interior to develop and coordinate a national endangered species program and to acquire habitat for their preser-vation. It directed the Secretaries of the Departments of the Interior, Agriculture and Defense to protect endan-gered species and their habitat on the lands which they administer when such action is consistent with the primary purpose of the area. In 1968, the Bureau of Sport Fish-eries and Wildlife published the "List of Rare and Endan-gered Species of Fish and Wildlife in the United States;" the list included 350 species of concern, of which 89 were considered threatened or endangered.* In 1970, the list was updated to include 101 additional species, of which one-half were birds (Federal Register, October 13, 1970). Only 25 of these species are protected in wildlife refuges.
The 1970 Endangered Species Act (Public Law 91-935) prohibits importation of any wildlife species found by the Secretary of the Interior to be threatened with worldwide extinction. (Importation for certain scientific and educational purposes is excepted). Various wildlife
*The term "endangered species" means any species which is in danger of extinction throughout all or a significant portion of its range. The term "threatened species" refers to any species which is likely to become an endan-gered species within the foreseeable future throughout all or a significant portion of its range.
35
er/ Toad ocsan.o 4aGsr .sua--( oe
al-mho-, !ear's,.
ler, aoi4 ocaario overla4, ay a0MO -rya ,
4a.ter 11;n olvq.
oold 44C.,
much i^e 31 ■ C lapr_s - ram trees - q
Strong T-rrents - .on sus-dendea 10LICS !recuenri, glac.al DC ..1 , OC( C01 ,
or/ rol4 troanac .ater IUC1 .2 .6fC3C0 ay. od . resn racer -ma, as/gen
J.7^ - orptd.m/ 4t - n oiac a- leo: 3 Stacnart ae.aw COOCAP-COO sr,orm CcCCO^C3 3.-- leo,
I.: SO ',ROCCO
ii234C2
Table III-1
Characteristics Natural Estuarine Zone Circulation and Water Quality
30001. '4C3O, Jnresmo.ctod :mpoyment :mpaymenm :ant. - -ous
:150 11.-a 3horel me Shorel.ne gayer 7.1.1. 1.1.2 Drainage Jp_, ?Land 11,er 't..
,ort, .-)eep -ear 3,0[4 ocean, Osseo -mar snore ncesnia Strong -torrents 'many 4 only acrat.t.ed .320 - MCI* C4r,...:( ..o: La tarail.my -551 ox/den may mt ant r .amar onq snore _irments .ater errat.m CJCZOIC3 sma. - vlarne.s o-ro,q, - -raid.,/ •igt, ox/gon ot ma'am, mharacrer an strati,. .moer ayer :rear
some suspended land and add.. and m-dal Loots marsh so. - -raid.t, as.ras t 342SOC atrang o.r - encs .tth oesperiv-res ao nina 34m2OC clay -.gm oxygen ..Inter - -an ocean - hrougn clams t1 +inter tnan mne 'COOS
Ocean wars: .Jn7snort Ooneral-/ ...low 314,.. .oderate oirrents n .oderato scracif.cat.an , ,anermi., snal-ou .arianle stracatioat an a-saended Torrents suspend. aud aanded mud ard sana ace.), ...-detl.ed mnannolo suspended mud ana at.. ..41 mal- tides :.aar .acet mud and 11-, 110 La/gin .41. :lay si.t oats: 117n leso./ed argan.c ax/den strong - -- sr,. .imm seared 24J.-11C/ amounts mc argan.o materlao
maser .al . rmle - .oh oxygen - orMia.my limn oxygen
3 n- anysLos-
mec.on
noddle aslant-a
7.1074242C* oongsnore - .aal oorrants t. tai 1.7n.. ,40-50ts 1.7h14 , eit.SOLS sal 1.M.es aea/l amounts at argania some turdialmv ma ter -
o'OrLy deca-ed onannels mall currents desolt. argantc meter-al moderace Itoctuation of axygen
.oderate arra - - -ar.on auspencea mua and s.lo - .In axig. strong CarrOCCI,
loneral. anal.ow small r-des 000ar oar. . irn Sil.11ty
. 1 oxYgen
/artaolo at:emit-cation susnended mud and silt high oxygen seal. asounts at organic mates..
Moderate o.dai o-rrents nmohl/ Par.apie sal. , r.as 3024 maratdimi
Scut, 'rim... , 1.001 4nd oat. it-anc o .1050e0 :urrencs aCean.
.acer -dud mlay and
3.11 ourrents ligh oolor Strong strat.r.cat on ligh deso.Y. organics nidh suspended mud end m_ay nighly varlalala oxygen, actong o.rrents, oesolved 110 temperatures organics moderate oxygen
3,ame molor small our- Slight and /..able otrac-tacation - ants general./ sna-law, ::.c +at. 000.. than DCO41 sitan: nmgh Ie.,. organics color some oxygen Iluctoation nod- nigt, y dlact-actng oxyger *rata to 1.4n suspended sediment
:at anean :Lass ocean 4acor ;enc.* C. ear ocean oat.: one.. -fish desol.d organics 31-qhtly CJCOld strong /goy smai. aJrrents 31.gnste moraid eddying a_lrrencs LO oortents +arm memperatoras m.r - ontm eadias. 4arner nigh rolos susparded mud oirrencs, - .an -not,: general./ shaiooso noire •lacnt strat.d.cat.on, hign oxygon CN Inrowonoum the 'mar amen oc•an /art m.arrents not than ocean nacer 44.11 2/44C IC4211 WO.:
:tear ;anorak./ +arm 'srf a15.1 a.arrencs ocean gigh lesol/ed organics Slignty CJC.41 strdnq , ar/ meal/ r.irrencs ex- Sl.ont Ind , OCI4O44 scoac.m.cat.on ocean oat. Longshore +at. .itn s..;nt - -ratd-o/ nign dolor /er/ small torrents r_/er oaolat - Ian oeot 1 :lam snal - 'w C-VOC 44Cir coo,Ot t - an ace., 3040 lurrents +ernfl l'-an on.. aor - anta 5117,1/ to ..441 44COC sera "ion: - -raid,/ oxygen !-uct-acman
moderate l/ tordtd `ram sand 11. 3L-C tigh - amperacire ,14ct,..-g axyge^
Scut... Strong .a. vot_on .oderate suspended sol.ds imqn suspended aol-ds Strong 51041.C.00C.,1 Ott- So. a,spanded si.m gocorate to strong at:at-Loam-an mac ocol aceanmr water some ecoar.o rorrarts treat .n m-dai ourrents ano^e 74C 'ornat.on mooi errat_o our:elms o001 nmgn suspended alit strong ro.r - e^ca
si.r and o , a ,o - -roadlty oxygen opal .armer - han acean and r ',CS 1.0 01(f.02 1..h SCVOO. 1.0 oxygen r0o1
Out: at 4 13,1.0
go. suspend. ILI,
- old magn oxygen
lormnweso 'Strong +are act_on ...race suanerded so,_ds 1.0 suspended soi_ds Strong strat.t.olt.on 200- ,c. - . mot! ocean .acer some irtACIC a.m. :ants -Ign strati -, o.mal oorrents 3.0,4 74C - arnatman too.
s.lr inn olav ..ICCICIC/ asvoen mold 4armar - -en ocmar and t_vers lion oxygen
"oder.. to strong stram_o-oar.an - Ion susaend. silo strong oor - enms
axyg. acid
- :1 -tdroge^ aolt.os
'lc :.mat /arm ocean :.ear -cean .acer tert_s -ion .41.1 , S. ....411.C3 SA. - 0 t - i - 4rm 1 t 3 - rorg
IC ., 7n -an ocean ae,, ded mud ar / .pai_ ocean 241LCOr
C-C74^=3 'OC
4C , 304- t.imre.ma Slirlc_, - orail 4ad/a-q zooments - enerao. s-ai2.aw ouime st.ont imoat.t_oat-or oxygen Of. 1. -22C DCO41 .4Csr
SOURCE: The National Estuarine Pollution Study, 1969.
study commission reports have culminated in a Presidential message, "Environmental Awakening" (House Document 92-247, February 8, 1972), which, among other things, urges pro-tection of animals that could become endangered; the message also suggests that the killing of an endangered species should be a federal offense.
On 28 December 1973, the Endangered Species Act became effective and thereby, provided a means whereby both plants and animals in danger of extinction and their dependent ecosystems may be protected. Amendments to the endangered Species Act were passed in 1978 and 1979. These amendments require public input during the process whereby new species are listed. Additionally, a Cabinet level Exemption Board was instituted, composed of the secretaries of the Interior, Agriculture, EPA and the Chairman of the Council on Environmental Quality. The prime function of this board is to resolve conflicts con-cerning biological opinions issued by the United States Fish and Wildlife Service regarding a project and that project's implementing agency or institution.
Species become extinct directly by killing or in-directly by removing or changing their habitat. A species does not exist by itself, isolated and independent, but is part of a complex ecologic web. Human activities, such as agricultural reclamation, channelization, construction of reservoirs, some forms of lumbering, and urbanization can virtually annihilate entire habitat webs (Talbot, 1966). Many species have become extinct before man arrived on the scene, but these species evolved and became extinct over geological periods of millions of years (Talbot, 1966; Goodwin and Denson, 1971). Compared with this period of time, the rate of modern man-caused extinction is almost instantaneous. All mammal species lost during recorded history owe their extinction to man's activities (Talbot, 1966).
Threatened species, such as the California Condor, can provide real links with past conditions and can supply much needed information on basic biological processes. The condor provides a genetic reservoir that is unchanged since Pleistocene times a million years ago (California Department of Fish and Game, 1972). It may be noted that
37
50 years ago, few would have believed that the sea otter could be restored to become of economic significance (Goodwin and Denson, 1971).
In addition to their scientific value, endangered species are important for aesthetic and cultural reasons. They add to the diversity of the world and their elimina-tion is seen by many as a symbol of deterioration of the human habitat. Much public support and effort is expended for the preservation of threatened species, as was seen recently when the wild mustangs of Nevada were given federal protection.
Removal of the habitat of threatened or endangered species constitutes an irretrievable commitment of resources and diminishes diversity. Changes in the habi-tat may also be detrimental to these species although there are alterations which are deemed beneficial. This is recognized by Section 7(c) of the Endangered Species Act and the Consultation process. It is the continuing responsibility of the Federal government, according to NEPA and the ESA, to avoid adverse effects by seeking reasonable alternatives.
The impact of the Endangered Species Act on waterways improvements is significant. If such imporovements are to occur in areas where endangered species may be present, a biological opinion from the United States Fish and Wild-life Service must be compiled with or a formal exemption obtained.
A complete tabulation of the federal endangered and threatened species is available through the United States Department of Interior, Fish and Wildlife Service regional and state offices. For additional state-sanctioned endan-gered and threatened species, the specific state agencies having such jurisdiction should be consulted.
DREDGING IMPACTS
Dredging has been defined as "an earth-moving process specialized to remove bottom material from under water to increase the water depth or gain the bottom material"
38
(Mohr, 1974). Dredging to increase the water depth for navigation and disposal of the resultant material are the subjects of this section.
A more detailed, segment-specific discussion of the impacts and constraints of dredging and dredged material disposal (the subject of the following section) has been developed and is included as an appendix with this report.
It should be noted that the Dredged Material Research Program at the United States Army Engineer's Waterways Experiment Station at Vicksburg, Mississippi has resulted in the publication of several hundred reports concerning dredging and dredged material disposal impacts. Many of them are included in the bibliography. In addition there are several textbooks (Huston, 1970; Herbich, 1975) on the subject. These textbooks deal primarily with the tech-nical aspects of dredging rather than with the environ-mental aspects and, furthermore, were written before much of the DMRP material was available. The information in this section can only summarize the great volume of infor-mation available.
(a) Introduction
The effects on the environment of the operation of dredging are materially influenced by the conditions at the dredging site, by the nature of the materials dredged, and both directly and indirectly by the types of equipment used. These are all interrelated and mutually influenced (Final Report, PIANC, 1977).
By their actions, dredges may cause a variety of negative environmental impacts to the water quality and aquatic ecosystem. They include:
1. changed habitat in dredged area.
2. removal of benthic organisms and the shellfish beds.
3. increased levels of turbidity and suspended solids.
41.
39
4. release of heavy metals, nutrients and other pollutants from resuspended material.
5. biological uptake of released pollutants.
6. covering of benthic organisms by sediment.
7. aesthetic disruption.
The first three items are addressed in the following three sub-sections. The impact of turbidity and suspended solids, in addition to the release of pollutants and bio-logical uptake, is further addressed in the subsection titled Critical Issue/Turbidity and Suspended Sediment. The covering of benthic organisms by sediment is only a minor impact associated with dredging. Depending upon the disposal method used, however, it can be a significant impact associated with dredged material disposal and is further addressed in that subsection.
One impact not widely addressed in the literature is aesthetics. Sediment disturbance from dredging operations creates highly turbid situations which are considered to be unappealing by most people. Recreational boaters might generally be disturbed by the sight of the sediments sus-pended by a dredge and their enjoyment of the boating decreased. It is acknowledged, however, that turbidity resulting from dredge operation is temporary in nature. Aesthetic impacts are not further addressed in this report.
Investigators have noted that the actual intensity, duration, and area influenced by sediment-water inter-actions are greater during open water disposal (Sustar et al., 1976) and storms (Slotta et al., 1974; Suster et al., 1976) than during dredging, per se. Increases in sus-pended solid levels during dredging are confined basically to the channel, whereas increases at disposal sites often influence areas outside the site boundaries. The influ-ence of storms is even more widespread.
The secondary effects of dredging (increased marine traffic, industrialization and urbanization), which are impacts more likely to be associated with navigation, are addressed elsewhere in this report.
40

One area that is not well documented concerns impacts to subtidal populations. Studies by Slotta et al. (1974) have strongly suggested that highly productive intertidal areas of estuaries may be highly dependent on less pro-ductive but more stable subtidal populations. The impacts of dredging and disposal on these areas are extremely im-portant and are frequently overlooked. The existence of mature populations of shellfish in depths ranging from three to 18 meters in Coos and Yaquina Bays in Oregon has been shown. The existence of similar clam populations has been verified in other Oregon estuaries. These areas must receive primary consideration in assessing the impacts of dredging on estuarine systems, since they frequently occur in, or adjacent to, areas which are subject to being dredged. The failure of normal benthic sampling devices to adequately sample subtidal communities has caused us to overlook the importance and the impacts of dredging on these areas. Additionally, since these areas are found subtidally, they are generally not directly utilized in a commercial or recreational fishery on the West Coast, although they may be the source of larvae to repopulate the more accessible fishing areas.
Investigators have noted positive impacts associated with dredging also. Information from Herbich (1975) indi-cates that dredging can have advantageous effects on the aquatic environment by removing polluted bottom sediments for safe storage and/or treatment, reoxygenating sediments and the water column through mixing, resuspending nutri-ents and making them available to suspension feeders, and removing dissolved and particulate pollutants from the water column by absorption and resettling. Gustafson (1972) also detailed the beneficial effects of dredging. Bacteria attack sewage substances much more readily when the substances are attached to clay rather than dispersed within the water, as long as the clay remains suspended. Turbid waters also offer shelter and protection to larval and immature life which use bay waters as nursery grounds.
1. Changed Habitat in Dredged Area/Effect of Altered Flow Regime. Removal of bottom material to deepen channels changes the aquatic habitat in several ways. It:
(a) alters hydraulic conditions (i.e., flow velocities and volumes).
41

(b) exposes different substrate material.
(c) alters geometry and depth of bed.
Changes in current regimes may alter sediment composition, water quality, established patterns (spatially and temporally) or erosion and sedimentation, and/or create a loss of food sources. Channelization of estuaries produces changes in hydraulic conditions which may alter the function of reserve populations by changing the transport patterns of the larval stages.
Slotta et al. (1974) found that there was a decrease in median grain size at the dredge sites they investigated due to exposure of fine subsurface material. Obviously, the extent of such differences will vary from site to site.
2. Removal of Benthic Organisms and Shellfish Beds. That dredging disrupts the benthic habitat at the excavation site is obvious (Hirsch et al., 1978). The substrate and associated organisms at the dredge site are removed for disposal elsewhere.
The removal of a significant number of benthic infauna from the dredged channel areas creates an environ-ment of depleted biological activity. The percentage of organisms removed is proportional to the intensity of the dredging activity, which includes the number of passes in a shoal area by a dredge and the frequency of maintenance over a long-term period (COE, 1975). On a short-term basis, studies (cited in COE, 1975) of a dredged channel in Chesapeake Bay indicated that hydraulic pipeline dredging had removed up to 72% of the benthic organisms in areas actually dredged. Observations in Coos Bay, Oregon, of channels dredged with a hopper dredge indicated removal was between 74% to 88% in dredged areas. Other studies at Moss Landing Harbor (Monterey County) indicate that with a clamshell dredge, benthic organism removal in some area approached 100%. In order to put the loss of biological activity resulting from dredging operations in perspec-tive, it should be noted that navigation channels may occupy a relatively small area of the cross-sectional bot-tom of a natural waterway and only selected segments of the channel (where deposition tends to occur) may be dredged regularly.
42
Even though a large percentage of bottom life may be removed, it has been shown by many investigators that dredged channels repopulate rapidly after cessation of the dredging operation. Repopulation, however, is not the sole measure of recovery from dredging opeations. Species diversity remains a critical factor, especially to the extent that the particular organisms involved are an inte- gral part of the food web. In Coos Bay, that total faunal abundance returned to predredging levels in 14 to 28 days. In Mobile Bay, Alabama (COE, 1975), recovery in terms of numbers in a channel area took less than six months. Dredging sampling conducted by the Corps of Engi-neers in the San Francisco Main Ship Channel Bar study also noted an in crease in the number of species and number of organisms during the recovery period.
It should be noted that the frequency with which a river channel may require dredging is highly variable and usually specific to a particular river or river seg-ment. Such factors as the rate of sedimentation, river and areal physiography, river current patterns and age contribute to the rate of dredging activity. Generally speaking, river channels typically require dredging every one to five years, thereby allowing benthic organisms time to recover and reestablish.
Though repopulation appears to be very rapid in dredged channels, recovery in terms of the reestablishment of a community similar to that which inhabited the area prior to dredging may take considerable longer than just a few months. Investigations conducted by Tennesse valley Authority malacologists have indicated that molluscan fauna are extremely sensitive to disruption. Mussel beds in large rivers are well defined by population numbers and substrate such that their distribution is very localized. Any activity which disrupts or alters the nature of suita-ble substrate may permanently impair this resource. Observations in Mobile Bay (COE, 1975) show that areas influenced by dredging do not generally return to what may be considered a normal condition for a period of at least two years. The studies at Moss Landing noted that even after one and one-half years the recolonized harbor area was completely different in terms of species number, com-position, number of individuals, species diversity, even-ness and trophic dominance. Channel areas that are dredged frequently (i.e., every one to three years) may never develop faunal assemblages similar to those found in comparable environments not subject to periodic disturbances.
43
3. Turbidity and Suspended Sediment. Suspended sediment is generated by dredging, certain types of dredged material disposal, and many construction activi-ties. For this reason, the impact of turbidity and sus-pended sediment on water quality and aquatic ecosystems is addressed separately. This discussion will deal solely with the generation of suspended sediment by dredging activities.
Under a given set of environmental conditions, different types of dredges will generate different levels of turbidity. While the dredging equipment certainly has a large effect on the amount and concentration of sediment that is resuspended, the techniques for operating this equipment are also important.
Although operator training and performance may be one of the most important factors controlling turbidity generation, it is often difficult to evaluate the various parameters of a dredge's operation that reflect the skills of the operator. Unfortunately, turbidity levels are typically measured with little regard to the operation of the dredges or their rates of production (i.e., cubic meters of material dredged per hour) (Barnard, 1978).
The most widely studied dredges are the clam-shell, hopper, and cutterhead dredges. Depending on the above factors, clam-shell or bucket dredges might be gen-erally expected to create plumes in the water column with suspended solids concentrations not exceeding 0.5 grams per liter (g/l) and with average concentrations probably less than 0.1 g/1 (Barnard, 1978). Hydraulic cutter head or pipeline dredges generally do not create suspended solids levels in excess of a few hundred milligrams per litre (mg/1) in the water column near the dredging site. Hopper dredges probably do not create water column sus-pended solids concentrations in excess of 1 g/1 over any appreciable area of the dredging site (Barnard, 1978). In addition, these levels are intermittent as the hopper dredge moves between dredging and disposal sites, often with a cycle time of an hour or more (Peddicord & McFar-land, 1978). A more detailed discussion of the differ-ences between the dredges follows.
(a) Grab/Bucket/Clamshell Dredges. The grab, bucket, or clamshell dredge con-sists of a bucket or clamshell operated from a crane or derrick mounted on a
44

barge (Huston, 1970). It is used ex-tensively for removing relatively small volumes of material (i.e., a few tens or hundreds of thousands of cubic meters) particularly around docks and piers or within other restricted areas. The sed-iment is removed at nearly its in situ density; however, production rates (rel-ative to a cutterhead dredge) are low, especially in consolidated material. The material is usually placed in barges or scows for transportation to the dis-posal area. Although the dredging depth is practically unlimited, the deeper the depth the lower the production rate. In addition, the clamshell dredge usually leaves an irregular, cratered bottom (Barnard, 1978).
1. Sources of Turbidity. The turbidity generated by a typical clamshell op-eration can be traced to four major sources. Most of this turbidity is the result of sediment resuspension occurring when the bucket impacts on and is pulled off the bottom. Also, because most buckets are not cover-ed, the "surface" material in the bucket and the material adhering to the outside of the bucket are expos-ed to the water column as the bucket is pulled up through the water column. When the bucket breaks the water surface, turbid water may spill out of the bucket or may leak through openings between the jaws. In addition to inadvertent spillage of material during the barge loading operation, turbid water in the barges is often intentionally over-flowed (i.e., displaced by higher density material) to increase the barge's effective load (Barnard, 1978).
2. Field Measurements. Based upon a variety of studies (COE, 1975; Cronin et al., 1976; Bohlen & Tramontano, 1977; Yagi et al.,
45

1977), Barnard (1978) made the fol- lowing remarks: "Based on these limited measurements, it appears that, depending on current velocit-ies, the turbidity plume downstream of a typical clamshell operation may extend approximately 300 m at the surface and 500 m near the bottom. Maximum concentrations of suspended solids in the surface plume should be less than 500 mg/1 in the immed-iate vicinity of the operation and decrease rapidly with distance from the operation due to settling and dilution of the material. Average water-column concentrations should generally be less than 100 mg/l. The near-bottom plume will probably have a higher solids concentration, indicating that resuspension of bot-tom material near the clamshell im-pact point is probably the primary source of turbidity in the lower water-column. The visible near-surface plume will probably dissi-pate rapidly within an hour or two after the operation ceases."
Other studies (Brown & Clark, 1968; MPCA, 1975; GREAT I, 1978b) show compatible results.
3. Turbidity Control Using Watertight Buckets. To minimize the turbidity generated by a typical clamshell operation, the Port and Harbor Research Institute, Japan, developed a watertight bucket with edges that seal when the bucket is covered so that the dredged material is totally enclosed within the bucket. Avail-able sizes range from two to 20 cubic meters. According to the man-ufacturer, these buckets are best adapted for dredging fine-grained, soft mud (Barnard, 1978).
46
A direct comparison of typical bucket and watertight bucket clam-shell operations indicates that watertight buckets generate 30% to 70% less turbidity in the water-column than the typical buckets. This reduction is probably due primarily to the fact that leakage of dredged material from watertight buckets is reduced by approximately 35% (Yagi et al., 1977).
(b) Hopper Dredges. In those areas charac-terized by heavy ship traffic or rough water, a self-propelled hopper dredge would probably be used. During a hopper dredge operation, as the dredge moves forward, the bottom sediment is hydrau-lically lifted from the channel bottom through a draghead, up the dragarm (i.e., trailing suction pipe), and tem-porarily stored in hopper bins in the ship's hull. Most modern hopper dredges have one or two dragarms mounted on the side of the dredge and have storage capacities ranging from several hundred to over 9000 cubic yards. The hoppers are either emptied by dumping the dredged material through doors in the bottom of the ship's hull or by direct pumpout through a pipeline (Huston, 1970; Herbich, 1975).
1. Sources of Turbidity. Resuspension of fine-grained dredged material during hopper dredge operations is caused by the dragheads as they are pulled through the sediment, turbu-lence generated by the vessel and its prop wash, overflow of turbid water during hopper filling opera-tions, and dispersion of dredged material during open-water disposal (Barnard, 1978).
The most obvious source of near-surface turbidity is the overflow water. During the filling operation, dredged material slurry is often
47

+
it
pumped into the hoppers after they have been filled in order to maximize the amount of higher density material in the hopper. The lower density, turbid water at the surface of the filled hoppers overflows and is usually discharged through ports located near the waterline of the dredge. Distributions of suspended solids in these overflow plumes are primarily dependent on the nature of the sediment being dredged; the design and operation of the dredge (such as forward speed and pumping rate); the nature, concentration, and volume of overflowed material; the locations of the overflow ports; and the hydrologic characteristics of the dredging site (such as water depth, salinity, and current direc-tion and velocity). Although there may be no increase in the hopper load achieved by continued pumping of fine-grained sediment into filled hoppers (Thorn, 1975; deBree,1977) overflowing is a common practice.
2. Field Measurements. Using data from a variety of sources (Pollack, 1968; JBF, 1974; COE, 1976), Barnard (1978) concluded that the suspended solids levels generated by a hopper dredge operation are primarily caused by hopper overflow in the near-surface water and draghead resuspension in nearbottom water. Suspended solids concentrations may be as high as several tens of grams per liter (g/l) near the discharge port and as high as a few g/1 near the draghead. Turbidity levels in the nearsurface plume appear to decrease exponenti-ally with increasing distance from the dredge due to settling and dis-persion, quickly reaching concentra-tions less than 1 g/l. However, plume concentrations may exceed background levels even at dis-tances in excess of 1200 m.
48
I
3. Turbidity Control Operational Procedures. Levels of suspended solids in a plume generated by typical hopper dredge overflow can be decreased by reducing the solids concentration of the overflowed material (Barnard, 1978). This can be accomplished by reducing the flow rate of the slurry being pumped into the hoppers during the latter phases of the hopper filling operation (deBree, 1977). By using this technique, the solids content of the overflow can be decreased substanti-ally (e.g., from 200 to 100 g/1 or less by weight) while the loading efficiency of the dredge is simul-taneously increased. Silt cur-tains, which are generally a fabric used to trap sediment, may also be effective in reducing turbidity levels.
4. Turbidity Control - Flocculant Injection. The settling rate of the suspended material in the overflow water may be increased marginally by injecting polyelectrolytes (flocculants) into the overflow water before it is discharged overboard (Barnard, 1978).
5. Turbidity Control - Submerged Overflow System. To minimize the dispersion of the discharged over-flow, there has been developed a relatively simple submerged dis-charge system for hopper dredge overflow. The overflow collection system in the dredge was streamlined to minimize the incorporation of air bubbles and the overflow discharge ports were moved from the sides to the bottom of the dredge's hull. With this arrangement, the slurry descends rapidly to the bottom with a minimum amount of dispersion within the water column.
49
A
*
This modified overflow system has been successfully used on three Japanese trailing hopper dredges with capacities ranging from 2000 to 4000 cubic meters without generating any significant nearsurface turbidity in the vicinity of the dredge. Suspended solids concentrations were 8 mg/1, whereas with the submerged system solids concentrations were at most only 5 mg/1 above ambient levels of 7 mg/l.
(c) Cutterhead Dredges. The cutterhead dredge is the most commonly used dredge in the United States. With this type of dredge a rotating cutter at the end of a ladder excavates the bottom sediment and guides it into the suction. The exca-vated material is picked up and pumped by a centrifugal pump to a designated disposal area through a 15 cm (six inch) to 112 cm (44 inch) pipeline as a slurry with a typical solids content of 10% to 20% by weight. The nominal size of the dredge is usually defined by the diam- eter of its discharge pipeline. For conventional cutterhead dredges the diameter of the cutter is approximately three to four times the diameter of the suction pipe. The typical cutterhead dredge is swung in an arc from side to side by alternately pulling on port and starboard swing wires connected to anchors through pulleys mounted on the ladder just behind the cutter. Pivoting on one of two spuds at the stern, the dredge "steps" or "sets" forward. Al-though the cost of mobilizing a cutter-head dredge is relatively high, its ope-ration is nearly continuous and produc-tion rates (i.e., cubic meters of mate- rial dredged per hour) are generally high (Huston, 1970; Herbich, 1975).
1. Sources of Turbidity. Most of the turbidity generated by a cutterhead dredging operation (exclusive of disposal) is usually found in the
, 4
50
vicinity of the cutter (Huston & Huston, 1976). The levels of turbidity are directly related to the type and quantity of material cut but not picked up by the suction. The amount of material supplied to the suction is controll-ed primarily by the rate of cutter rotation, the vertical thickness of the dredge cut, and the swing rate of the dredge (i.e., the horizontal velocity of the cutter moving across the cut). The ability of the dredge's suction to pick up this bottom material determines the amount of cut material that remains on the bottom or suspended in the water column. In addition to the dredging equipment used and its mode of operation, turbidity may also be caused by sloughing of material from the sides of vertical cuts, inef-ficient operational techniques, and the prop wash from the tenders (tugboats) used to move pipeline, anchors, etc., in the shallow water outside the channel (Barnard, 1978). From his review, Barnard (1978) concluded that the turbidity generated around the cutter of a cutterhead dredge apparently increases exponentially as the thickness of the cut, rate of swing, and cutter rotation rate increase. Although suspended solids levels around the cutter also increase with increasing rates of production, it is possible to maximize the produc- tion rate of the dredge without resuspending excessive amounts of bottom sediment.
2. Turbidity Control. There are several factors that can be altered to reduce turbidity. They are addressed in greater detail in Barnard (1978).
51
a. Cutter design.
b. Cutter removal - In some cases where the material will flow naturally (i.e., non-cohesive materials), the efficiency of the dredging operation can be increased by removing the cutter altogether.
c. Suction - Sufficient suction to pick up all the material distributed by the cutter will result in lower turbidity levels.
d. Cutter suction combination - A new and more efficient combination.
e. Production metering system.
3. Field Measurements. Although a properly designed cutter will efficiently cut and guide the bottom material toward the suction, the cutting action and turbulence associated with the rotation of the cutter will resuspend a portion of the bottom material being dredged. Excessive cutter rotation rates tend to propel the excavated material away from the suction pipe inlet.
Based on limited field data (Yagi et al., 1975; Huston & Huston, 1976) collected under low current condi-tions, Barnard (1978) concluded that elevated levels of suspended material appeared to be localized within the immediate vicinity of the cutter as the dredge swung back and forth across the dredging site. Within 3 m of the cutter, sus- pended solids concentrations are highly variable but may be as high as a few tens of grams per liter; these concentrations decrease
52
exponentially from the cutter to the water surface. Near-bottom suspend-ed solids concentrations may be elevated to levels of a few hun-dred milligrams per liter at distances of a few hundred meters from the cutter. This led Yagi et al. (1975) to conclude that "in the case of steady dredging of a thin sedimented mud layer, the effect of dredging on turbidity was found to be almost imperceptible at lo-cations several tens of meters distance from the cutter."
4. Summary. On the basis of laboratory experi-ments and a comprehensive literature review, Peddicord & McFarland (1978) concluded the following:
Ecological degradation due to the direct or in-direct effects of typical suspended sediment con-ditions created in the water column by dredging operations is unlikely. Water column suspended sediment levels created by most such operations are lower than lethal levels and exist for times far shorter than lethal exposure times for most adults and larvae. Coral reef communities may be an exception to this generalization.
Tissue accumulation of contaminants, even from contaminated sediments, was the exception rather than the rule in the above. That uptake which did occur was seen only after days of exposure to suspended sediment concentrations typical of fluid muds (see following subsection, Impacts of Dredged Material Disposal). When uptake occurred, the contaminants were concentrated in the tissues to levels only a few times higher than in the sediment.
Suspensions of contaminated sediment are poten-tially more harmful than uncontaminated sedi-ments, but even so the lethal conditions are un-likely to be created in the water column by typi-cal dredging operations.
5. Mitigation. Some measures that can be uti-lized to minimize dredging impacts were noted in the im-pact sections dealing with cutterhead, clamshell and
53

*
1
hopper dredging. Huston & Huston (1976) have addressed the topic in even greater detail. The following recom-mendations are taken from their report:
(a) Cutter. Turn the cutter as slowly as possible within the confines of eco-nomical production. Usually slower speeds are more economical and create less turbidity.
1 Use cutters properly designed for the 14 job, particularly during deep dredging. 1 A cutter designed for a shallow depth does not produce as much pumpable material on a deep-depth job.
(b) Suction. Remove cutters whenever pos-sible to allow the suction to be placed closer to the material.
Do not attempt to bury the cutter unless all the material will be picked up by the suction.
Use a rotating suction assembly whenever possible. This permits using smaller cutters that create less material disturbance.
(c) Ladder. Use properly designed ladders for each job. Do not use dredges with too-long ladders. Such ladders disturb material not available to the suction.
Use ladder pumps and jets where pos-sible, particularly when doing deep dredging to overcome the effects of suction-line head losses.
(d) Hull. Keep dredge decks and all equip-ment clear and clean. Use dredges with sufficient freeboard. Use dredges of proper size. Hulls that are too wide, long, or deep create turbidity by hit-ting the sides and bottom of the cut.
(e) Dredge Plant. Keep anchor wires free of soft bottoms and banks to prevent dis-turbance and caving of material. Keep
54

anchor barges and pontoons away from banks. Use properly sized tenders. When tenders are not in use, disengage propellers.
(f) Pipeline. Keep pipeline connections tight, particularly on floating lines. Rotate lines to equalize wear.
(g) Operational Techniques. Use only the amount of set that will provide adequate material to the suction. Swing only as fast as is required to provide the material to the cutter.
Use proper methods of swing and set to pick up all material. Reduce necessity for cleanup where possible.
Dredge upstream where possible to maxi- mize the dispersion of any suspended solids and reduce the visibility of any turbidity plume.
(h) Personnel. Establish a continuing school or short courses for training dredge personnel. Establish a contin-uing school or short courses for train-ing dredging inspectors. Employ suffi-cient numbers of trained inspectors on all projects.
Contracts. Write contracts whenever possible so that smaller dredges can compete. Schedule work in the smallest quantities possible. Break very large-quantity contracts into several smaller ones.
Write contracts to take advantage of time, weather, and tide or stream velo-city when natural turbidity is expected to be the highest in order to minimize the environmental impact of dredge-induced turbidity.
(i)
55

*
IMPACTS OF DREDGED MATERIAL DISPOSAL
(a) General Types of Disposal Sites (Holliday, 1978)
There are four primary environments that may contain a subaqueous dredged material disposal site: the ocean, an estuary, a river, and a lake. It may be noted that the impacts associated with wetlands disposal have been ad-dressed in the following section, Terrestrial Habitat Im-pacts. Basco et al. (1974) compiled and discussed a large number of reports concerning the investigation of factors that affect the fate of dredged material in various environments of deposition. Each environment con-tains a group of energy regimes attributed to its position within the system.
1. The Ocean. Within the ocean environment four distinct zones should be considered: the deep ocean, the open shelf, the nearshore, and that zone adjacent to in-lets, rivers, and estuaries (herein termed the inlet zone for simplification).
(a) The Deep Ocean. This zone is the por-tion of the ocean with water generally deeper than 600 feet or the area beyond the continental shelf break. An excel-lent discussion of the physical factors and various bottom environments may be found in Pequegnat (1978). It is gen-erally assumed that once material reaches the bottom of the deep ocean, the deposit will not move.
(b) The Open Shelf. The outer limit of the ocean shelf is the well-defined conti-nental shelf break; the shoreward limit, for the purposes of this discussion, will be the 100 foot depth contour. This zone experiences many physical pro-cesses and may contain a variety of sed-iment types. The primary energy is gen-erated by tidal currents, waves, and semi-permanent shelf currents with sub-stantial increases attributed to storms and frontal movements. Good references for most shelf processes can be found in
f
it
56
Graf (1971) and Swift et al. (1972). This zone of the ocean does not contain many disposal sites and few studies have been undertaken with respect to the fate of dredged material deposited on the open shelf.
(c) The Nearshore. This zone includes that portion of the ocean from the 100-foot depth contour to and including the breaker zone at the beach. The dominant energy forces are waves, longshore cur-rents, and tidal currents. The bottom sediment is primarily sand. This is generally a highenergy zone with a sub-stantial potential for dispersion and reworking of any deposit of dredged material. Most dredged material dis-posal sites in the ocean are found with-in this zone and various reports are available that address the fate of the deposits: Saila et al. (1972), Estes and Scrudato (1977), Sternberg et al. (1977) and Moherek (1978).
(d) The Inlet Zone. Adjacent to the mouths of estuaries, rivers, inlets, and bays directly flowing into the ocean is a complex zone where large volumes of sed-iment are constantly being reworked and where large volumes of material are dredged and disposed. This zone exper-iences energy extremes similar to the nearshore zone. Additionally, it is subjected to strong tidal currents, multidirectional wave effects, the effects attributed to control struc-tures, such as jetties, and is signifi-cantly impacted during storms and major frontal systems. This high-energy erosional zone generally can accept large volumes of dredged material with little apparent net change to the bot-tom. This has been documented by Oertel (1972) and Estes and Scrudato (1977). With the proper knowledge of where this material is going, planned disposal operations could help contribute to down-current nourishment of the beaches
57

or facilitate effective sidecasting operations.
2. The Estuary. For this report, an estuary is defined as a semi-enclosed coastal body of water that has a free connection with the open sea and within which sea water is measurably diluted with fresh water derived from land drainage (Pritchard, 1967). This broad definition includes many different types of estuaries from the lower portion of the Mississippi River to the Chesapeake Bay. However, for the purposes of this discussion, an estuary will be more closely represented by the Chesapeake Bay system. Within this system there are four distinct zones where disposal sites may be located: the mouth or outlet, the central bay, the tributary entrance or mouth, and the upper bay. Ippen (1966) and Lauff (1967) are useful references.
(a) The Mouth or Outlet. This zone of the estuary is differentiated from the inlet zone of the oceans in that the ocean inlet zone is that area seaward of the estuary mouth while the estuary outlet zone is that area from the mouth to some point inside the estuary. This area is generally dominated by ebb or flood-tidal dominated sand shoals that may change with each tidal cycle, seasonally or only during storms. Besides the strong tidal flows, heavy wave action is usually experienced on the seaward side of the entrance zone. For good dis-cussions of the flow and shoaling systems, refer to Ludwick (1972) and Oertel and Howard (1972). Generally, this is a zone of much dredging but very little disposal.
(b) The Central Bay. Depending on the con-figuration and tidal amplitude of the estuarine system, this zone is generally an area of potential sedimentation having a fine-grained bottom sediment. Central Long Island Sound is a good example of this type of depositional environment (Gordon, 1974). Here, water depth and proximity to shipping channels will dictate the fate of dredged material deposits. This zone is usually
58
dominated by tidal currents with a net nontidal component and wave action usually dependent on the wind direction and fetch length (Bokuniewicz et al., 1977). Postma (1967) described the pro-cesses of sediment transport and sedi-mentation in estuaries. According to Bokuniewicz et al. (1977), areas of measured accumulation of fine sediment within this estuarine zone should be considered good potential disposal sites for dredged material if the water depth is sufficient. However, in order to ensure the effectiveness of this zone as a disposal site, careful planning must be undertaken to calculate the site capacity of each designated disposal area.
(c) The Tributary Entrance or Mouth. This zone may represent an area of shoaling, high tidal currents, and, possibly, sig-nificant wave activity. Dredging and disposal operations often occur within this zone and the sediment may vary from fine clay to sand. Material disposed in this environment will be subjected to periodic erosion from natural physical processes, fisheries activities, and shipping operations. The depth within this zone can vary from tidal flats to 100 feet deep channels, and the zone represents a highly variable deposi-tional/erosional environment. Any dis-posal operation within this zone must be carefully planned to ensure minimal im-pact to adjacent biologically active shoal areas where oystering or clamming may occur.
(d) The Upper Bay. Within an estuary, there will generally be found in the upper reaches of the system a relatively low energy tidal zone with fine silts and clays the predominant bottom sediment. This region usually supports a sub-stantial fishery and, in most major estuarine systems, is highly populated
59
and industrialized (e.g., Baltimore in the Upper Chesapeake Bay). Conse-quently, there are conflicting opinions about whether such an area should be kept in a pristine condition.
This area usually experiences annual maintenance dredging, and disposal is often required on land or confined to ensure minimal impact on the fishery. However, many of these upper bay zones have well-defined depositional environ-ments where open-water disposal could occur with little potential movement after deposition. This has been found with areas investigated by Biggs (1970) and Westley et al. (1975).
3. Rivers. Like estuaries, rivers have quite variable physical characteristics and configurations. The characteristics of a river are determined by the geolo-gical system through which it flows and the range from unidirectional fresh-water tributaries to complete estuarine systems. The unidirectional flowing river has a relatively constant environment of deposition throughout its length, while the complex river system may have a full spectrum of depositional environments to consider:
- unidirectional.
- upper tidal.
- salt-wedge zone.
- mouth.
(a) Unidirectional. Rivers and those sec-tions of rivers with this type of flow characteristic generally have sandy bot-tom sediment and are dredged by hy-draulic suction dredges with pipeline disposal in areas adjacent to the chan-nels. The fate of material in this zone is dependent on the current speeds and stage of the river. Material dredged and disposed at one section often will re-enter the system and may be dredged again downstream.
60

(b) Upper Tidal. This zone experiences tidal fluctuations but is fresh water with seasonal low-flow periods when a saltwedge may develop. Material dredged from this zone is usually disposed ad-jacent to the channel if it is too far to transport it elsewhere. Studies have indicated that portions of this dredged material may return to the same channel reach (Nicholas et al., 1978) as fluid mud (fluff) during disposal or by tidal current reworking of the post-deposi-tional mound. Ships' wakes and propel-lers may significantly affect the sta-bility of these channel deposits (Slotta et al., 1973).
(c) Salt-Wedge Zone. Where river water mixes with ocean water, there is a com-plex zone that is generally described as a salt wedge. At this section of a river or estuary, Krone (1972) has described a mixing process that causes enhanced deposition and a turbidity max-imum in the water column. This zone usually represents an area of constant shoaling and thus constantly requires dredging and disposal. If material is placed in this part of the river it will experience tidal currents that may be sufficient to erode and rework the sed-iment.
(d) River Mouth. The mouth of the river can be a complex deltaic system, such as the mouth of the Mississippi River, or a relatively simple tidal opening into an estuary or ocean. The variability is as great as the number of rivers. This depositional environment will be site-specific and dependent on the energy regime and tidal range of each river. Many characteristics of estuary mouths and tributary entrances will be the same for this zone of a river.
4. Lakes. This environment of deposition pri-marily involves the Great Lakes region. The physical pro-cesses are very similar to those of an estuary or the open
61

ocean but the source of energy is not the same. Gene-rally, the bottom currents are affected by the wind direc-tion, the thermal stratification of the water column, and proximity to rivers as described by Hough (1958). Uncon-fined subaqueous disposal of dredged material within the Great Lakes is in the open lake in depths ranging from 30 to 100 feet. Recent studies near Ashtabula, Ohio, by Danek et al. (1977) have shown that dredged material deposits in 50 ft. of water (or less) are susceptible to removal by winter storms.
(b) Subaqueous Disposal of Dredged Material (Wright, 1978)
Upon release, the material may fall as a coherent unit that entrains ambient water and descends as a dense mass. Water column interaction is minimal as descent to the bot-tom occurs in a matter of seconds.
If the material does not fall as a cohesive mass, the opportunity exists for it to interact with the water column. If the water depth is sufficient, the dense mass may entrain enough ambient water to create a neutrally buoyant plume. In this case, maximum water column inter-action occurs and little bottom impact will occur. Such interaction may result in the formation of a turbid plume and the exchange of chemical substances between the dredged material and the water column. This interchange depends on a number of variable factors such as particle-size distribution, the chemical nature of the sediment and the water column, the presence of currents, and variable water density. These interactions will tend to be mini-mized if the sediment is of such a nature as to descend as a more or less cohesive unit. The impact of suspended sediment on water quality and aquatic biota is addressed in a later subsection.)
The duration of the turbid plume depends on particle size, currents, turbulent mixing, and similar phenomena. A turbid plume composed of very fine particles will per-sist longer than one made up of coarser particles. Depth is a factor, as, in many instances, bottom waters are more dense than surface waters. A plume which has disappeared
62
from the surface may persist at intermediate depths or near the bottom because of the differential rate of parti-cle settling.
Ultimately, the disposed sediment will reach the bot-tom. In the case of barge-dumped disposal, if the mate-rial is cohesive and falls as a mass it may produce a mound or existing sediment may become displaced with a turbidity current and/or shock wave which travels outward from the impact point.
If the material is not cohesive, it will tend to settle gently upon the bottom. A pronounced mound may not be present and a greater area will be covered with a les-ser thickness of material. Under most field conditions, a combination of these two types of impact is expected because the dredged material is generally heterogeneous.
There is, however, some variation dependent upon the type of disposal methodology employed. The above dis-cussion pertains most readily to barge-dumped material from a moving vessel. For pipeline disposal in open water, non-cohesive material tends to mound much more effectively than cohesive sediment.
Following impact, material may remain in place for a long period of time or may undergo relatively rapid ero-sion and dispersal. Which event (or combination) occurs depends on the nature of the material and bottom cur- rents. The latter, of course, are influenced by depth and the adjacent subaqueous topography. After deposition, whether or not extensive erosion and movement occurs, the dredged material may become mixed and incorporated with the underlying natural sediment (Wright, 1978).
The most important factors affecting the long-term fate of dredged material in shallow bays and estuaries Basco et al., 1978) are:
1. bottom-layer mudf lows.
2. suspension by wind-wave action.
63
3. transport by tidal currents.
4. deposition affected by salinity induced flocculation.
In addition to the items above, oceans and large lake systems have additional influencing factors, namely:
- Earth's rotation (Coriolis force).
- depth stratifications.
- upwelling.
- Other local boundary effects.
River dredged material deposits are simply influenced by the magnitude of flood flow rates.
Storms are an important factor in sediment (dredged material) transport in all systems (Basco et al., 1978).
1. Impacts. The disposal of dredged material in open water can have the following impacts:
(a) alteration of water quality.
(b) release of sediment-bound toxicants.
(c) covering of benthic organisms.
(d) creation of fluid mud.
(e) bottom topography effects. •
The first two items are summarized in the next subsection and addressed in detail in the critical issue subsection. The third and fourth items are addressed in subsequent subsections. Item five has been addressed in the previous subsection on dredging impacts.
(a) Water Quality. An in-depth review (Burks & Engler, 1978) of the published literature and results of the Dredged Material Research Program (DMRP) at WES indicate that openwater disposal of
64
dredged material can have a temporary impact upon the receiving aqueous envi-ronment if the dredged sediments contain elevated levels of chlorinated pesti-cides, PCBs or ammonia. Harmful levels of heavy metals can be released from sediments at certain combinations of pH and oxidation reduction potential but probably would not be released by most typical dredging or disposal opera-tions. Chlorinated hydrocarbon pesti-cides, PCBs, oil and grease compounds, heavy metals, and phosphates are rapidly adsorbed by suspended particulate material in the water column that may resediment in quiescent areas.
Resedimentation of suspended particles that have absorbed any of the above con-taminants creates a potential for impact upon benthic organisms. After coloni- zation occurs, detrital-feeding orga-nisms may accumulate pesticides, PCBs, oil and grease compounds, and heavy metals and thus introduce these con-stituents into the biological food chain. These effects were reviewed and synthesized by Hirsch et al. (1978).
(b) Covering of Benthic Organisms. Depend- ing upon the depth and nature of the sediments that cover the benthic orga-nisms there are several responses:
- death of some of the organisms.
- vertical migration of some of the organisms through the dredged material.
- recolonization of the dredged material from areas adjacent to the disposal site.
The magnitude of each individual response appears to be highly variable from site to site.
65

1. Vertical Migration. A literature review (Maurer et al. 1978) based on laboratory and limited field studies of other workers showed the following points:
a. Disinterment ability of organisms appears to be related to life habitat and body or shell morphology. Most authors felt that orga-nisms of similar life style and morphology would react similarly when covered with an overburden. For example, all epifaunal (surface-dwelling) forms are generally killed if trapped under dredged material overburdens, while infauna (subsurface dwellers) migrated to varying degrees. This factor can very likely be extrapolated across species lines.
b. Exotic sediments (those in or on which the species in ques-tion does not normally live) are likely to have more severe effects when organisms are buried than sediments similar to those of the disposal site. Generally, physical impacts are minimized when sand is placed on a sandy bottom and are maximized when mud is deposited over a sandy bottom.
c. Smaller animals of a given type of organism are generally more susceptible to the effects of burial than are larger organisms.
d. There have been few attempts to determine the contribution of vertical migration to
66

recovery after dredged material deposition.
In addition, Hirsch et al. (1978) and Maurer et al. (1978) postulate that environmental factors (e.g., the quality of the interstitial sedimentary waters) could be of great importance to vertical migration ability.
2. Recolonization. Studies at some sites where there was no vertical migration (Hirsch et al., 1978) showed trends toward reestablishment of the original community within several months of disturbance, and complete recovery was approached within one year. There was no predictable sequence of recoloni-zation of disturbed areas. The study did not indicate the qualitative differences between existing bottom sediments and the deposited sedi-ments in regard to organism impact. Disturbed areas such as shallower inshore waters, benthic regions near the head of a submarine canyon, and a harbor area were quicker to recol-onize than normally undisturbed quiet water areas. The general recolonization pattern was de- pendent, in major part, upon the nature of the adjacent undisturbed community which was able to provide a pool of replacement organisms capable of recolonizing the site by adult migration or larval recolonization.
Other studies have shown that although recolonization of the impacted area usually took place within months, the colonizing organisms were often different from those which had been present prior to disposal. This change probably represents successional phenomena, and if the sites were to be
67

revisited in two to five years, the original communities may be found to have returned. Alternately, habitat alteration (i.e., a change in the physical nature of the substrate) by disposal may favor the more or less
, 4 permanent establishment of a com- munity quite different from that which previously existed (Wright, 1978).
The physical habitat alteration resulting from dredged material disposal may persist for long or short periods of time (Holliday, 1977). This depends on the nature of the material and the effective-ness of natural phenomena in restoring predisposal conditions. At one site investigated, dredged material migrated outward from the center of the disposal area; as it did, benthic communities were affected (Wright, 1978). Again, it was not clear whether the effects were due to physical factors or to some of the chemical constituents of the material (especially PCBs). At other sites, there was a reasonably rapid return to predisposal condi-tions so far as physical and chemical characteristics of the sediment were concerned, but this was not accompanied by a concurrent return of the benthic community to predisposal conditions.
Where changes in the benthic com-munity did occur as a presumed effect of dredged material disposal, there is little that can be said as to whether these changes were adverse. As noted above, many of the communities are poorly under-stood and the substitution of one species assemblage for another can- not be easily evaluated. In general, a decrease in biomass or in the
68
number of organisms present would be considered undesirable as would the establishment of a completely dif-ferent community from that which existed prior to disposal (Wright, 1978). On the other hand, it appears that many years of disposal at the Eatons Neck site were, at least in part, responsible for the creation of conditions which have led to increased populations of lobsters. Likewise, openwater disposal in Lake Superior resulted (at least on a short-term basis) in an increase of organisms which are considered to be an important com-ponent of the diet of fish species of recreational and commercial importance (Wright et al. 1975). In the former instance (lobsters), an enhancement seemed to result from the dredged material providing a more suitable substrate for burrow-ing animals, and, in the latter, the deposition of organic material upon a relatively sterile bottom increas-ed the population of detritus feeders.
(c) Fluid Muds. Open-water disposal of hydraulically dredged fine-grained mate-rial with high water content can create fluid mud. Very little background in-formation is available concerning the occurrence and effects of fluid muds (Hirsch et al., 1978). There is no gen-erally accepted definition of fluid mud; Nichols, Thompson, and Faas (1978) arbi-trarily assign concentrations of greater than 10 g/1 suspended sediment to the fluid mud category.
Peddicord et al. (1975) and Peddicord & McFarland (1978) have shown that such conditions could impact a variety of species, particularly if the suspended sediment is highly contaminated. In addition, Peddicord et al. (1975) have
69

shown that low dissolved oxygen, which has been documented in fluid mud by May (1973), increases the impact of sus-pended solids. Since fluid mud is con-fined to a distinct and relatively thin layer on the bottom, it probably poses little threat to water column fish, which are unlikely to encounter it and can easily avoid it if they find the conditions adverse. However, benthic and perhaps even motile epibenthic orga-nisms could be covered by a high-sus-pended-sediment, low-dissolved-oxygen layer which is not dense enough to phy-sically support the weight or activity of organisms attempting to move upward to reestablish contact with the clearer overlying water (Peddicord & McFarland, 1978). The impact of this phenomenon has been researched by Diaz and Boesch (1977), who measured species diversity and populations in a predredging and post disposal survey at a number of sta-tions in the tidal freshwater James River in Virginia. After dredging and disposal of the material in the river, several stations were found to be covered with up to 1.6 m of fluid muds. Different species varied in their responses to the environmental perturba-tion caused by fluid mud. Insect larvae were most sensitive, being extensively lost from the environment. The most resilient species, particularly the oligochaetes, were only slightly affected. Recolonization of the sub-strate provided by the consolidating fluid mud took only three months due to the general resilience of the indigenous species and the naturally unstable phy-sical conditions of the ecosystem studied. This recovery was monitored in late summer and early fall months. Recolonization, reproduction, and growth probably vary throughout the year, and the results obtained cannot be accepted as universal for the system unless studies are carried out during different seasons (Hirsch et al., 1978).
70
(d) Summary. Based upon his review of the literature, Wright (1978) concluded that open-water disposal appeared to have a negligible impact upon physical, chemi-cal, and biological variables. However, the impacts observed were usually site-specific, suggesting that the results from a limited number of sites cannot be universally applied or cited as being conclusive in all situations.
Overall, most impacts seemed to be relatively short-term. The conditions of the water column associated with dis- posal generally returned to ambient within minutes to hours. Chemical changes in the sediment persisted or days to weeks (where they occurred at 11), while physical changes often lasted for several months. An exception con-cerned PCBs however, PCBs are a rather unusual constituent of dredged sediment, and the fact that they ere detectable long after disposal is not an indication that other contaminants behave in a sim-ilar manner (Wright, 1978).
In view of the limitations associated with the studies, the lack (i.e., appar-ent absence) of definitive impacts should not be construed to indicate that none existed. It may be a reflection of inadequate study design and great natural variability in the field, or a combination of these and other factors. This is borne out by the effort devoted to determining the effects of disposal upon pelagic organisms. An excellent review is presented by Sullivan and Han- cock (1977) concerning zooplankton; their conclusions are equally valid for phytoplankton. They concluded that temporal and spatial variations from natural causes are so large that an al-most infinite sampling effort would be required to obtain results concerning the impact of disposal.
71
In addition, more concern over impacts outside of the disposal area rather than a concentration of effort within the disposal area would be useful. In essence, a worst-case approach has been employed in that it was assumed that, if impacts were minimal within the disposal area, they would almost certainly be less outside of the disposal area. There is no firm reason to suspect that this was not the case, but it should be recognized that a lack of effects out-side this disposal area is, in general, assumed and has not been exhaustively demonstrated (Wright, 1978).
(c) Subaqueous Borrow Pits (Connor et al., 1979)
Subaqueous borrow pits are irregularly shaped, shallow sloped sea-floor depressions caused by sand and gravel mining, typically for construction material and beach replenishment. In this alternative, dredged material would be transported to the spot over the pit, dropped through the water column into the pit, and covered with a layer of clean sand. It is anticipated that this would isolate the dredged material from the marine ecosystem.
One criterion would be low near-bottom current velo-cities. Johansen et al. (1976) suggest that until better data are obtained borrow pit disposal be restricted to locations where normal bottom currents do not exceed 0.1 feet/second (about 3 cm/second). Swift et al. (1976), however, in studying geologic processes on the New York, New Jersey shelf, applied a threshold sediment transport velocity of 18 cm/second for fine to very fine sand (mean diameter = 1/8 mm) and found that one storm event (Decem-ber 14, 1974) moved more sediment at a 20 meter water depth than the combination of all other transport events. Such a concept (low near-bottom velocities) may be useful in judging the feasibility of specific sites. Another criterion would be the infeasibility of locating potential sites in water depths greater than 100 feet, the approxi-mate limit for suction pumps, unless it would be economi-cally feasible to use jet-assisted suction pumps or even
72
jet pumps for pit evacuation. A third likely criterion is that the potential site be distant from public bathing, water recreational, and water supply areas.
Accurate placement is largely a function of accurate navigation. Generally, hopper dredges have greater navi-gation capabilities than barges, and their use reduces the chance for errors in placement. In either case, special navigation aids would increase navigation and placement accuracy (Johansen et al., 1976). Additionally, the chance of error can be virtually eliminated by using pump-down systems,such as those described by Johansen et al. (1976).
The use of pump-down systems would also avoid physical (and other) impacts resulting from dredged material con-tact with the water column during deposition.
Although a sand cover would be subject to the same hydraulic processes as the dredged material after dumping, sand particles traveling through the water column and spreading across the bottom after impact would not travel as far or remain in suspension as long under equivalent energy conditions as would finer materials.
An equally serious problem is ensuring that dredged material is covered with sand as soon as possible. One point of concern is whether the dredged material would stay in the pit until emplacement of the cover. Bokuniewicz (1979) reports that 4 to 5 meter holes can trap fine-grained sediment and have a high rate of sedi-mentation. This suggests that dredged material would stay in the pit. However, initially trapped material may be escaping and the high sedimentation rate may be the result of an even greater rate of sediment input. Another point of concern is the ability of the dredged material to sup-port a sand cover. Generally, the fine-grained unconsoli-dated dredged material would have a high water content and would be incapable of supporting the weight of the sand cover. Premature capping may result in the sand cover penetrating the contaminated material. The dredged mate-rial should remain uncapped until it becomes consolidated enough to support the cap; however, it would be subject to erosion and re-suspension during this period. Once con-solidation is complete, resistance to erosion may be
73

*
it
#
greater for the disposed material than for a sand cover (Johansen et al., 1976). This problem may be mitigated by modifying the dredged material by reducing the water con-tent or chemically treating the overflow water and/or solids (Johansen et al., 1976). These treatments would significantly increase the cost of disposal. The state-of-the-art survey by Johansen et al. (1976) presents additional details concerning the methodology for covering subaqueous borrow pits.
The sand cover's erosion resistance is affected by the same processes that affect the dredged material. The desired cap thickness is determined by normal near-bottom currents, and whether these currents would transport sedi-ment off the site or simply shift the sand over the site depends on storm-frequency and intensity, water depth, and degree of consolidation.
1. Chemical Impacts. Short-term impacts from the release of chemical constituents during transport through the water column and before capping are relatively well known. Long term impacts from the accumulation of contaminated material are not well known. The concept of disposal in subaqueous borrow pits is to isolate the con-taminated sediment from the marine ecosystem. If impro-perly implemented, this alternative's long range impacts could be the same as those of shallow ocean disposal.
If anoxic conditions existed in the borrow pit, any hydrogen sulfide present would tend to complex with heavy metals in the dredged material. Large, shallow bor-row pits, such as those likely to be used for dredged material disposal, would not substantially restrict circu-lation and do not favor the formation of stagnant conditions.
2. Biological Impacts. Biological impacts of dredged material deposition in borrow pits include the burial and general disruption of established communities in the borrow pit and those related to short-term water contamination and long-term sediment contamination. If a borrow pit is in an area of significantly different sedi-ment grain size than the capping material (sand), benthic organisms would be affected and community structure al-tered. Initial construction of a borrow pit would also alter the benthic assemblage present, and the significance of further disruption from filling the pit would be deter-mined by the nature of the community at the time of filling.
74

In Mobile Bay, Alabama, pits were used by fish during colder months, but due to low dissolved oxygen levels in the summer, the dredged pits were not suitable as fish habitat (Broughton, 1977). In San Francisco Bay, borrow pits were preferred by striped bass and supported abundant seaweed and shellfish (Broughton, 1977). Murawski (1969) reported that borrow pits were acceptable as fish habitats in New Jersey estuaries. These studies suggest that borrow pits might serve as artificially created habitat or congregation areas for fish and other free swimming marine organisms, at least seasonally. Fil-ling of borrow pits would result in the removal of such artificial habitat. While warmer water temperatures in borrow pits during winter months are beneficial to biota, summer conditions may be poor because of low dissolved oxygen levels resulting from the decomposition and oxi-dation of accumulated organic material.
(d) Beach Nourish-ment (Conner et al., 1979)
The beach nourishment alternative involves the depo-sition of dredged sands onto beaches. The acceptability of a given sand for use in beach nourishment is dependent upon its grain size composition as well as that of the receiving beaches.
The direct biological impacts of beach nourishment are not severe and are of short duration assuming the use of compatible material. There would be little impact to beach organisms directly because they are generally mobile and adapted to a constantly changing environment. There would be physical disruption and mechanical disturbance of benthic organisms caused by the addition of dredged mate-rial to a beach, particularly at the active discharge point. This may cause temporary reduction in the popula-tion density of intertidal benthic invertebrates in the discharge zone (United States Department of the Interior, 1974). The migration of animals from adjoining non-nourished beach areas is expected to quickly fill any ecological voids created by beach nourishment.
75

(e) Ocean Dumping (Conner et al., 1979)
1. Physical Impacts. Disposal of dredged mate-rial results in several types of direct impacts to the local physical environment, including:
(a) changes in submarine topography.
(b) alteration of existing sediment type.
(c) increases in concentrations of suspended particulates.
(d) sporadic deposition of sediment, resulting.
(e) in a high but intermittent sedimentation rate.
These impacts result from the disposal of both contaminated and uncontaminated material. Direct physical impacts are generally observed only in the local area of the dump site because they are limited by the dispersion and fate of the disposed material.
2. Chemical Impacts. The disposal of dredged material into the marine environment causes adverse chem-ical alterations only if the disposed materials are con-taminated with hazardous or undesirable substances and if such contaminants are released or become available for biological uptake. Although it is apparent from bulk chemical analysis that much of the dredged material from the New York District is contaminated with harmful con-stituents, several lines of evidence indicate that these contaminants are generally not released nor are they sol-uble in large amounts during the disposal action. Any constituents released in high concentration are quickly diluted to safe or background levels. The short-term, dump-related release of chemical constituents is rela-tively well known, but the consequences of the long-term accumulation of foreign, contaminated material on the bot-tom is not well understood. For example, analysis of bulk loading data and New York Bight contaminant budgets indi-cates that a major portion, up to 34%, of the input of selected contaminants to the New York Bight results di-rectly from the disposal of dredged material. It does not
76

appear that the observed accumulation of contaminants in New York Bight sediments is likely to adversely affect water quality in the Bight. However, the consequences of long-term exposure of benthic organisms to contaminated sediments and associated waters are not well known.
3. Biological Impacts. The biological impacts that might potentially result from ocean dumping of dredged material are derived from physical burial and hab-itat alteration, short-term water column contamination, and long-term sediment contamination. The impacts of phy-sical burial and habitat alteration probably would not be observed beyond the boundaries of the dump site. Short-term water quality degradation resulting from single dis-posal actions is not expected to exceed EPA water quality criteria and should involve no major impacts. However, the impacts associated with long-term exposure of marine organisms to contaminated sediments are not well studied, nor well understood. These impacts potentially include water contamination, biaccumulation, biomagnification, biological transport, and sublethal effects, as well as acute toxicity.
4. Summary. Pequegnat et al. (1978) in a com-prehensive study assessed the potential impact of dredged material disposal in the open ocean. They prepared a com-parison of short-term impacts of dredged material disposal between shallow water and the deep ocean. This comparison is presented in the following table, Table 111-2.
(f) Mitigating Measures
Measures to mitigate the impact of the disposal of dredged material fall into two general areas: engineering and planning. Engineering measures relate to equipment selection and equipment operation procedures. Planning measures relate to the planning with regard to time and location of disposal.
1. Engineering Measures. Barnard (1978) pre-sents detailed discussions with regard to methods for con-trolling dredging and dredged material disposal induced turbidity. They are summarized below.
(a) Pipeline Discharge Configurations. Of all the environmental and operational
77
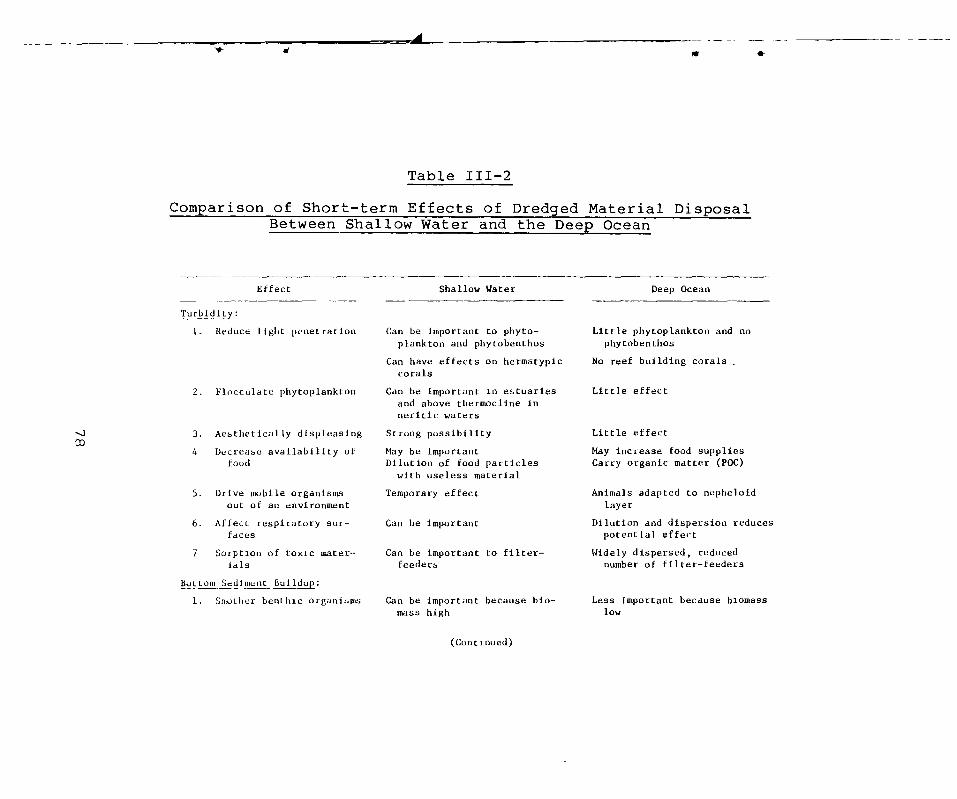
* *
Table III-2
Comparison of Short-term Effects of Dredged Material Disposal Between Shallow Water and the Deep Ocean
Effect
Turbidity:
1. Reduce light penetration
2. Flocculate phytoplankton
3. Aesthetically displeasing
4 Decrease availability of food
5. Drive mobile organisms Out of an environment
6. Affect respiratory sur-faces
7 Sorption of toxic mater- ials
Bottom Sediment Buildup:
1. Smother benthic organisms
Shallow Water
Can be important to phyto-plankton and phytobenthos
Can have effects on hermatypic corals
Can be important in estuaries and above thermocline in neritic waters
Strong possibility
May be important Dilution of food particles with useless material
Temporary effect
Can be important
Can be important to filter-feeders
Can be important because bio-mass high
Deep Ocean
Little phytoplankton and no phytobenthos
No reef building corals _
Little effect
Little effect
May increase food supplies Carry organic matter (POC)
Animals adapted to nepheloid layer
Dilution and dispersion reduces potential effect
Widely dispersed, reduced number of filter-feeders
Less important because biomass low
(Continued)
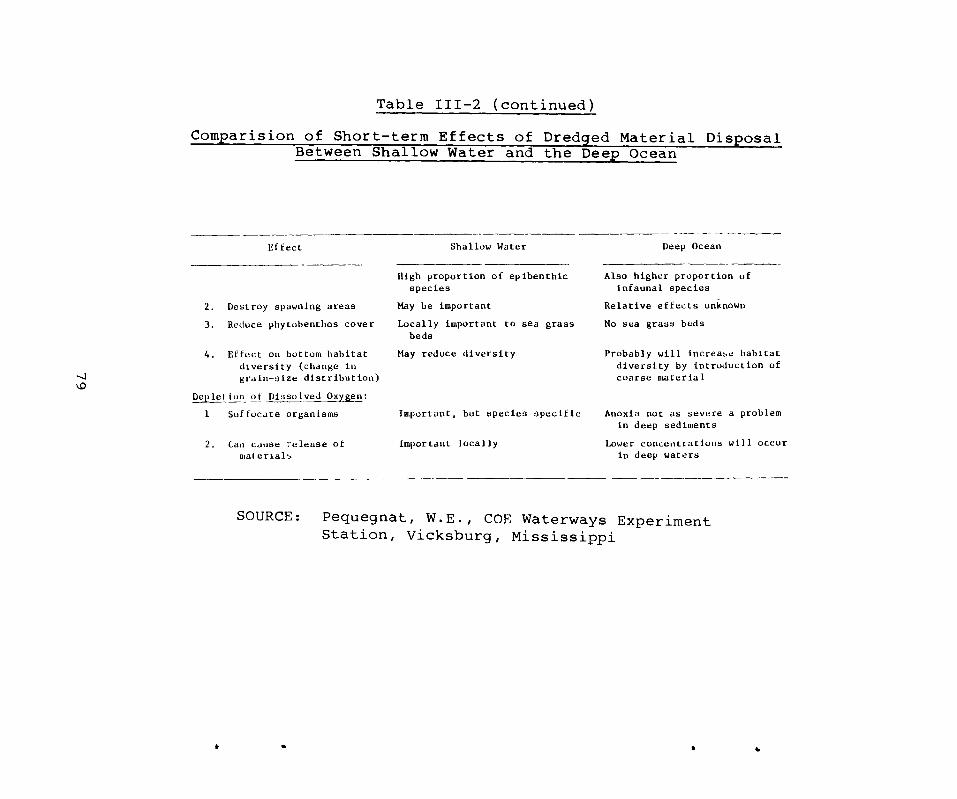
2. Destroy spawning areas
3. Reduce phytobenthos cover
4. Effect on bottom habitat diversity (change in grain-size distribution)
Depletion of Dissolved Oxygen:
I Suffocate organisms
2. Can cause release of materials
4.
Table 111-2 (continued)
Comparision of Short-term Effects of Dredged Material Disposal Between Shallow Water and the Deep Ocean
Effect Shallow Water Deep Ocean
High proportion of epibenthic Also higher proportion of species infaunal species
May be important Relative effects unknown
Locally important to sea grass No sea grass beds beds
May reduce diversity
Important, but species specific Anoxia not as severe a problem in deep sediments
important locally Lower concentrations will occur in deep waters
Probably will increase habitat diversity by introduction of coarse material
SOURCE: Pequegnat, W.E., COE Waterways Experiment Station, Vicksburg, Mississippi
factors affecting the dispersion of dredged material slurry during open-water pipeline disposal operations, the configuration of the pipeline at the discharge point appears to be the only parameter that, from a practical point of view, can be varied to effectively control the characteristics of dis-persion. The pattern of dredged mate-rial dispersal is apparently controlled by the configuration of the pipeline at the discharge point as well as the angle and height of the discharge relative to the water surface (for above water dis-charge) or bottom (for submerged discharge).
Generally speaking, pipeline configu-rations that minimize water column tur-bidity tend to produce fluid mud mounds with steep side slopes, maximum thick-ness, and minimal areal coverage. Con-versely, those configurations that gen- erate maximum levels of water column turbidity produce relatively thin fluid mud mounds of maximum areal extent.
(b) Submerged Diffuser System. The amount of water column turbidity generated by an openwater pipeline disposal operation can probably be minimized most effec- tively by using a submerged diffuser system that has been developed through extensive laboratory flume tests. (Un-fortunately, the diffuser system has not been field tested.) This system has been designed to eliminate all inter- action between the slurry and upper water column by radially discharging the slurry parallel to and just above the bottom at a low velocity. The entire discharge system is composed of a sub-merged diffuser and an anchored support barge attached to the end of the dis-charge pipeline that positions the dif-fuser relative to the bottom.
80
Use of the submerged diffuser system has the potential for eliminating turbidity in the water column. Unfortunately, it will not eliminate or mitigate the impact of the fluid mud on the benthic organisms, nor does it eliminate the possible resuspension of low density material at the surface of the fluid mud mound by waves and ambient currents.
(c) Silt Curtains. One method for physi-cally controlling the dispersion of near-surface turbid water in the vicin-ity of open-water pipeline disposal operations, effluent discharges from upland containment areas, and possibly clamshell dredging operations in quiescent environments involves placing a silt curtain or turbidity barrier either downcurrent from or around the operation. Barnard (1978) did not recommend silt curtains for operations in the open ocean, in currents exceeding 50 cm/second (I knot). in areas fre-quently exposed to high winds and large breaking waves, or around hopper or cut-terhead dredges where frequent curtain movement would be necessary.
(d) Flocculant Injection. It may be pos-sible under certain conditions to mar-ginally increase the settling velocity of the small percentage of dredged material slurry that is suspended in the water column during an open-water pipe-line disposal operation by injecting polyelectrolytes (flocculants) into the dredge pipeline before the slurry is discharged. However, the practicality of this technique is probably limited, at best, due to the variability in the solids concentration of the slurry, the high cost and many logistical problems associated with handling, mixing, and injecting flocculants into the slurry. Flocculants have been used unsuccess-fully on the Upper Mississippi River (Claffin, 1976). Therefore, the use of
81

I
, I • -
i
flocculants to reduce dredged material dispersion at open-water pipeline dis-posal operations is not recommended (Barnard, 1978).
2. Planning Measures.
(a) Timing. Peddicord et al. (1975) have suggested that dredging and dredged material disposal be done in seasons in which local organisms or biological com-munities were at low ebb in their pro-ductivity or reproductive cycle. Hirsch et al. (1978) add further that since larval recruitment and lateral migration of adults are primary mechanisms of recolonization, recovery from physical impacts will generally be most rapid if disposal operations are completed shortly before the seasonal increase in biological activity or larval abundance in the area. Both this consideration and the desire to maximize dispersion by wave and current action would point in many cases to winter or spring sched-uling of dredging and disposal operations.
(b) Location (Hirsch et al., 1978). The available literature shows that habitat disruptions due to disposal are mini-mized at disposal sites which have a naturally unstable or shifting substrate due to wave or current action. At such sites the dredged material is rather quickly dispersed, instead of covering the area to substantial depths. This natural dispersion, which usually occurs most rapidly and effectively during the stormy winter season, can be assisted by conducting the disposal operation so as to maximize the spread of dredged material, producing the thinnest pos-sible layer of overburden.
The desirability of minimizing physical impacts by dispersion can be overridden by other considerations, however. For
4
82
example, dredged material shown by bio-logical or chemical testing to have a potential for adverse environmental impacts might best be placed in an area of retention, rather than dispersion. This would maximize habitat disruption in a restricted area, but would confine potentially more important chemical impacts to that same small area. This has been discussed previously under sub-aqueous borrow pits.
Habitat disruption can also be minimized by locating disposal sites in the least sensitive or critical habitats. This can often be done on a seasonal basis. Known fish spawning or nursery grounds should be avoided just before and during use, but might be acceptable for dis-posal during other periods of the year. However, care must be taken to ensure that the physical substrate and bio-logical community in spawning or nursery areas return to their original condition before the next use of the areas by the fish. Clam or oyster beds, municipal or industrial water intakes, highly pro-ductive backwater areas, etc. should be avoided in selecting disposal sites.
Habitat disruption can be further mini-mized by matching the physical charac-teristics of the dredged material to the substrate found at the disposal site. The ability of fauna to migrate is heav-ily dependent on the physical nature of the dredged material overburden. Not only do overburdens of mud placed on sand produce maximum immediate impact, they change the nature of the substrate at the disposal site, often making it unsuitable for the species originally found there.
LOCK AND DAM IMPACTS
A dam may be most conveniently defined as a barrier to the passage of water. It is usually constructed of either
83
1 I * I
earth or concrete, the latter being the medium of choice for most major dams. A dam, in this sense, extends across the river channel and results in an upstream rise in water level. The water level on the downstream side of the dam may be carefully regulated by way of floodgates, down-stream portals of spillway control. In order to maintain navigation on this type of dammed river channel, locks are constructed, usually along one side of the channel. A lock is essentially a captive segment of water held between two relatively watertight gates.
A tow or barge is allowed passage through such a lock by a series of water level changes within the captive lock waters. A boat traveling downstream would enter a lock on the upstream side of the dam. With the upstream gate closed, water is then released from the lock, lowering the boat to the downstream water level. The downstream gate is then opened, allowing the boat egress from the lock.
A series of locks and dams may impose delays on the passage of vessels, but may nevertheless be required in order to providew adequate draft to vessels, in addition to providing storage for other purposes including flood prevention.
The following discussion presents the major impacts to water quality and aquatic habitat from general construc-tion activities. Although the impacts presented below are somewhat specific to locks and dams, they may also be rea-sonably broadened to describe the construction impacts associated with other types of waterways construction, viz., dikes, jetties, reservoirs, revetments, sills, etc.
*
*
(a) Construction Impacts
Construction operations are capable of generating many types of water pollutants. The amount and type of pol-lutants generated during construction will depend upon the type and time duration of the various construction prac-tices; the location and size of the construction site; the rainfall distribution and frequency pest control measures; the resistance of the soil or land surface to erosion by
84

gravity water, and wind; the chemical properties and geol-ogy of subsurface soils; and the number of people and machines linked with each construction site (EPA, 1973).
1. Types of Pollutants (EPA, 1973). Construc-tion activities can generate a wide variety of pol-lutants. They include:
(a) Sediment. Sediment is one of the greatest pollutants resulting from con-struction activity. Sediment includes solid and organic materials transported by rainfall runoff, wind, ice, and the pull of gravity.
(b) Petroleum Products. Petroleum products are the largest group of materials con-sumed in construction activities. Petroleum products consist of oils, grease, fuels, certain solvents, and many others. Pollutants from construc-tion activities include crank case oil wastes, leaky storage containers, oil solvents, dust control oils, minor oil spills during transfers and transpor-tation, oil laden rags, and degreasers.
(c) Pesticides. The three most commonly used pesticides at construction sites are herbicides, insecticides, and rodenticides. Herbicides are used for removing weeds and other undesirable plants growing around the construction area. Their use is limited since most plants are removed by bulldozers during land clearing and grubbing.
Insecticides are widely used on con-struction sites. The particular insec-ticide used is controlled by the geogra-phical area, climate, and the insect type. Rodenticides are also widely used, depending essentially upon the same factors mentioned for insecticides.
(d) Fertilizers. One of the most effective means of reducing soil erosion and sed-imentation from construction activities
85

•
14,
is the early establishment of vegetation on the exposed soil surfaces. The ad-dition of commercial fertilizers pro-motes vegetative growth and thus helps to prevent the loss of soil. Nitrogen and phosphorus are the major plant nu-trients needed for the successful estab- lishment of vegetation on most sub-soils. Limestone is needed for the neu-tralization of acid subsoils exposed to the surface as a result of land clear-ing, trench digging, and backfilling of construction areas.
(e) Metals. The concern over metal pol-lution of water bodies is associated mostly with the heavy metals (mercury, lead, zinc, silver, cadmium, arsenic, copper, aluminum, iron, etc.). Metals are used extensively in construction activities for structural frames, wir-ing, ducts, pipes, beams, and many other uses. Construction vehicles, gasoline, paints, pesticides, fungicides, and con-struction chemicals are also potential sources of heavy metals pollutants. When these latter materials are weathered, decomposed and disintegrated by various agents, they ultimately form oxides and salts that can affect aquatic organisms.
(f) Soil Additives. Soil additives are chemicals and materials that are applied to the soil during construction activi-ties in order to obtain desired soil characteristics. Ofttimes construction activities cover large areas consisting of several different types of soils.
The nature of soils is dependent on the climatic, topographic and geological conditions. The type of soil additive applied depends on the objectives of the construction activities. Soils may vary from one location to another in the amount of water they contain, particle size distribution (clays, silt, sand and
86
gravel), water infiltration rate, abil-ity to support heavy structures, and resistance to compaction by construction equipment. Soil additives are used to control the amount of moisture absorbed by roadway surfaces, to reduce the degree of shrinking and expanding of clay soils in order to prevent struc-tural damage of buildings and air field runways, and to increase the firmness of soils.
Several chemicals and materials are used to obtain desired soil properties. Com-monly used materials include lime, fly ash, asphalt, phosphoric acid, salt, and calcium chloride. The soil additives carried in runoff from construction sites alter the quality of receiving waters.
(g) Construction Chemicals. Many types of chemicals are used in construction for purposes such as: pasting boards together, sealing cracks, surface treat-ment, solvents for oils and paints, and dyeing and cleaning. The amounts of chemicals leaving construction sites as pollutants have not been established. Poor construction activities that are liable to contaminate water resources include the following practices: dumping of excess chemicals and wash water into storm water sewers; indis-criminate discharging of undiluted or unneutralized chemicals; disregard for proper handling procedures resulting in major or minor spills at the construc-tion site; and leaking storage con-tainers and construction equipment.
2. Sediment Erosion (McElroy et al., 1976).
(a) Factors Affecting Surface Erosion. Factors which have been considered the most significant in affecting erosion of topsoil consist of:
87
1. Rainfall Characteristics - Rain-fall characteristics define the ability of the rain to splash and erode soil. Rainfall energy is determined by drop size, velocity, and intensity characteristics of rainfall.
2. Soil Properties - Soil properties affect both detachment and trans-port processes. Detachment is related to soil stability, basi-cally the size, shape, composi-tion, and strength of soil aggre-gates and clods. Transport is influenced by permeability of soil to water, which determines infil-tration capabilities and drainage characteristics; by porosity, which affects storage and movement of water; and by soil surface roughness,which creates a poten-tial for temporary detention of water.
3. Slope Factors - Slope factors define the transport portion of the erosion process. Slope gradient and slope length influence the flow and velocity of runoff.
4. Land Cover Conditions - Land cover conditions affect detachment and transportation of soil. Land cover by plants and their residues provides protection from impact of raindrops. Vegetation protects the ground from excessive evaporation, keeps the soil moist, and thus makes the soil aggregates less susceptible to detachment. In addition, residues and stems of plants furnish resistance to overland flow, slowing down runoff velocity and reducing erosion.
5. Conservation Practices - Conserva-tion practices concern modifica-tion of the soil factor or the slope
88
factor, or both, as they affect the erosion sequence. Practices for erosion control are designed to do one or more of the following: (a) dissipate raindrop impact forces, (b) reduce quantity of runoff, (c) reduce runoff velocity, and (d) manipulate soils to enhance the resistance to erosion.
(b) Surface Erosion from Construction Sites. Construction activities involve extensive earthmoving operations. In these diverse earthmoving activities the natural protective ground cover is dis-tributed; compacted soils are dislodged and redistributed; highly erosive soils from the deeper horizons are exposed to the elements; and runoff is often increased and accelerated.
Sediment production from construction sites differs from that caused by other types of nonpoint sources in that it is generally of limited duration. Agricul- tural operations continue to produce sediment-containing runoff year after year, while intensive sediment yields from a construction project typically last from a few weeks to a few years, during which time the areas of exposed solids may be well stabilized by vegeta- tion, chemical application, or other control measures, either permanent or temporary.
Sediment Delivery Ratio. Sediment load-ings to surface waters are dependent on erosion processes at the sediment sources and on the transport of eroded material to the receptor water. Only a part of the material eroded from upland areas in a watershed is carried to streams or lakes. Varying proportions of the eroded materials are deposited at the base of slopes, in swales, or on flood plains.
89
•
The portion of sediment delivered from the erosion source to the receptor water is expressed by the delivery ratio.
Many factors influence the sediment delivery ratio. Variations in delivery ratio may be dependent on some or all of the following factors and others not identified.
1. Proximity of Sediment Sources to the Receptor Water - Channel-type erosion produces sediment that is immediately available to the stream transport system and, therefore, has a high delivery ratio. Materials derived from surface erosion, however, often move only short distances and may lodge in areas remote from the stream. Therefore they have a low delivery ratio.
2. Size and Density of Sediment Sources - When the amount of sediment avail-able for transport exceeds the capability of the runoff transport system deposition occurs and the sediment delivery ratio is decreased.
3. Characteristics of Transport System - Runoff resulting from rainfall and snowmelt is the chief agent for transporting eroded material. The ability to transport sediment is dependent on the velocity and volume of water discharge.
4. Texture of Eroded Material - In general, delivery ratio is higher for silt or clay soils than for coarse-textured soils.
5. Availability of Deposition Areas - Deposition of eroded material mostly occurs at the foot of upland slopes along the edges of valleys and in valley flats.
90
6. Relief and Length of Watershed Slopes - The relief ratio of a watershed has been found to be a significant factor influencing the sediment-delivery ratio. The relief ratio is defined as the ratio between the relief of watershed between the minimum and maxi mum elevation and the maximum length of watershed.
(d) Universal Soil Loss Equation. The sedi-ment loading function is based on con-cepts of the mechanisms of gross erosion and sediment delivery. The Universal Soil Loss Equation (USLE) is chosen to predict the on-site surface (including sheet and rill) erosion for the fol-lowing reasons:
1. This equation is applicable to a wide variety of land uses and cli-matic conditions.
2. It predicts erosion rates by storm event and season, in addition to annual averages.
3. An extensive nationwide collection of data has been made for factors included in the equation.
The sediment loading function has the form:
n Y(S) = .
E 1=1
Where: Y(S)E =
A1
. (R.K.L.S.C.P.S. d )i
sediment loading from surface erosion, tons/year.
n = number of subareas in the area
Source areal factor: Ai = acreage of subarea i, acres
Source characteristic factors:
R = The rainfall factor, expressing the ero-sion potential of average annual rain-fall in the locality, is a summation of
91
the individual storm products of the kinetic energy of rainfall in hundreds of foot-tons per acre, and the maximum 30 minute rainfall intensity in inches per hour, for all significant storms on an average annual basis.
K = The soil-erodibility factor commonly expressed in tons per acre per R unit.
L = The slope-length factor, dimensionless ratio.
S = The slope-steepness factor, dimensionless ratio.
C = The cover factor, dimensionless ratio.
P = The erosion control practice factor, dimensionless ratio.
Sd = The sediment delivery ratio, dimensionless.
3. Water Quality Impacts. Construction of a lock and dam has negative impacts on downstream water quality. The previous sections discussed the full range of pollutants associated with construction activity as well as a method for estimating the loading of the primary pollutant-sediment. Sediment originates from disturbances of the river banks and bottom sediments as well as from on-shore activities.
Pesticides, metals, sulfides, methane, oil and grease, nutrients, and other substances, if present in the bottom and bank deposits, may be released into the water column by resuspension of sediments under certain con-ditions (COE, 1976). Organic materials will be resus-pended into the water column. This resuspension can cause the degradation of water quality by increasing biochemical oxygen demand and chemical oxygen demand and by decreasing the dissolved oxygen concentrations. The previous sub-section on dredging impacts provides a more detailed dis-cussion of changes in water quality due to disturbances of sediments.
92

4. Aquatic Habitat Impacts
(a) Alteration of Habitat. Construction will cause the direct elimination of aquatic habitat and associated sessile or slow-moving organisms. This impact, though, is restricted to the actual con-struction area and affects only a small area in comparison to the entire body of water. The significance of this impact is dependent on the size of the con-struction area, the duration of activi-ties and the biotic community present.
(b) Sedimentation and Turbidity. The increase in turbidity resulting from construction of locks and dams can also affect the existing aquatic habitat and biota, both at the site and downstream. One of the major effects of increased turbidity is the reduction of light pen-etration. This interferes with primary production. Photosynthesis decreases, less oxygen is produced, and aquatic plants may die and decompose. The oxy-gen demand subsequently increases and the dissolved oxygen concentration decreases. This effect is most severe during the early growing season of sub-merged and emergent plants (Low and Bellrose, 1944). Other researchers have observed a similar relationship between turbidity and aquatic plant production (Martin and Uhler, 1939; Low and Bell-rose, 1944; Chamberlain, 1948; Robel, 1961).
Turbidity has been noted to cause the flocculation of planktonic organisms (COE, 1976). It can also result in abrasion and clogging of the respiratory organs of fish and other aquatic orga-nisms and may cause death.
As discussed previously, turbidity and resuspended organic material and other pollutants can reduce the concentration of dissolved oxygen in the water
I
ii•
-*
93
column. Reduced dissolved oxygen can also reduce the activity of aquatic animals and cause death to intolerant species. Resuspended pollutants,such as heavy metals and pesticides, can cause toxic impacts to aquatic organisms, while nutrients can increase algal production.
Turbidity and the reduction of light penetration can visually impair feeding and reproduction of motile organisms. This is especially important for orga-nisms dependent on sight to carry on these activities, such as most fish species.
Buck (1956) reported in an investigation of several ponds and reservoirs that maximum fish production of 161.5 lb/acre occurred in ponds where average turbid-ity was less than 25 Jackson Turbidity Units (JTU). Fish yield dropped 41.7% to 94 lb/acre where turbidity was between 25 and 100 JTU. The yield was only 29.3 lb/acre or 18.2% of clear ponds, and in muddy ponds turbidity exceeded 100 JTU. Fish can tolerate high turbidities for short periods of time (EPA, 1972) and so can other aquatic animals. However, fish produc-tivity depends upon plant life and a good bottom fauna, and there can be lit-tle of either when turbidity above 200 JTU is maintained continuously (COE, 1976).
The EPA (1973) states that to maintain a good to moderate fishery, suspended solids concentrations should be less than 80 mg/l.
Suspended solids ultimately will settle out of the water column either at the site of construction or downstream. Sedimentation can cover and destroy rooted vegetation, benthos and fish
94

nests. The impact is contingent on the extent of coverage.
The impact of lock and dam construction are usually short-term and usually occur primarily during construction. The aquatic community is capable of recover-ing from such impacts to some degree.
(b) Operation . Impacts
This section concerns the actual aquatic impacts of a lock and dam in relationship to its operation, but excludes a discussion on navigational usage, which is dis-cussed in a later subsection.
1. Water Quality. Upstream, locks and dams cause the impoundment of waters, a rise in water levels and a decrease in fluctuations of the water level. Asso-ciated with these impacts are effects on water quality.
(a) Suspended Solids. Damming reduces the flow velocity and turbulence through this area. Since the capacity of a stream to carry suspended solids is an exponential function of velocity and a direct function of turbulence, reduc-tions in these factors cause greater sedimentation (COE, 1978). As the sus-pended solids settle out, turbidity decreases, though wind-wave turbulence can lessen the decreases. In addition, deposits of suspended matter may form at the mouths of tributary streams because of the insufficient velocity of flow encountered in the dammed areas. Nor-mally, this material is carried away by river flow.
(b) Dissolved Oxygen Decrease and Reaera-tion. Damming causes greater depth and surface area but reduces the surface area per volume, coupled with the reduc-tion in surface turbulence. These fac-tors cause a reduction in the rate and degree of atmospheric reaeration. The
95
.
*
I 1,
total quantity of oxygen which would be transferred decreases as the surface area available for the mass transfer operation decreases. The dissolved oxy-gen in the river would be related to the surface area to pool volume ratio.
Pools with large volumes, i.e., deep pools, have a relatively small surface area/volume ratio so that oxygen concen-trations will be low. As pool depth decreases the surface area/volume ratio generally decreases; hence, dam opera-tion may influence dissolved oxygen values upstream.
The greater depth and reduction in velo-city can also cause greater differences in dissolved oxygen concentrations rela-tive to depth. In streams, flow velo-city and turbulence permit mixing and reaeration of the entire body of water. Damming causes a reduction in flow velocity and turbulence and increases depth. This hinders mixing and reaera-tion,resulting in a greater dissolved oxygen gradient. Atmospheric reaeration may be limited to the upper strata of the dammed waters and decomposition of settled organic material may reduce dis-solved oxygen concentrations near the bottom. Navigation on the waterway can cause mixing in most areas: though in backwaters, circulation can be non-existant.
The lesser surface area per volume also reduces the exchange of other gases with the atmosphere. This is especially important when considering nitrogen because of its toxic potential to fish and other aquatic organisms.
Lower velocities, greater volumes and less turbidity caused by damming favor the growth of planktonic algae. Such growth is confined largely to the zone of light penetration. Large algal popu-lations generate great quantities of
96
oxygen during photosynthesis and con-sume oxygen in respiration at night, giving rise to a daily fluctuation of dissolved oxygen. The myriad of photo-synthetic organisms also have the poten-tial for causing dissolved oxygen super-saturation near the surface and along the sides of the impoundment.
Spillways release waters from the impoundment to the downstream portion of the river. The discharge varies with upstram flow and operational proce-dures. During discharge reaeration occurs because of turbulence and greater surface exposure to the atmosphere. Waters can become supersaturated with dissolved gases, such as oxygen and nitrogen, and can cause substantial con-centrations to be realized at distances downstream (COE, 1975). The high degree of aeration provided by dams causes higher dissolved oxygen levels than natural to occur and a greater ability of downstream reaches to assimilate oxy-gen demanding wastes (COE, 1975). This occurrence is especially beneficial to rivers which have low dissolved oxygen concentrations and high concentrations of oxygen-requiring substances.
Though spillways can enhance dissolved oxygen concentrations, the associated increases in nitrogen from reaeration and in turbidity from turbulence can offset its value to aquatic biota (COE, 1975).
When a series of impoundments and dams is involved, the release or use of dis-solved gases between dams may not be adequate to reduce concentrations below supersaturation during the spilling season. High supersaturation poses an acute problem along the Columbia River because the spill season coincides with the major upstream and downstream fish migration season (COE, 1974). Hydraulic
97
structures (and particular features of their construction, such as sill ele-vation and weir configuration) have been found to be significant sources of reaeration of oxygen deficient waters (Holler, 1970).
Crest dams are generally efficient in reaeration, although discharge largely dictates the degree of efficiency. Dams with submerged inlets dictate the degree of efficiency. Dams with submerged in-lets remove bottom water from the impoundment. Those with submerged out-let sills tend to be less efficient in reaeration. Structures which discharge over elevated sills, step weirs, or a combination of these features tend to cause efficient reaeration of the receiving pool under a variety of flow conditions (COE, 1978). Moveable gated underflow structures have been found to be particularly effective in this regard (Holler, 1970). Although the reaeration characteristics of broadcrested overflow structures were not studied by Holler, they are expected to be significantly less effective for reaeration purposes because of the lesser flow concentration and turbulence involved in their opera-tion. In addition, gate operation at low flows can regulate reaeration; e.g., for a given flow, high discharge through a few gates aerates more efficiently than low discharge through many gates. Gate operations for aeration, though, are subject to design, safety, and navi-gational constraints which can make them impractical.
No environmental ramifications resulting from operation of the lock system are cited in the professional literature (COE, 1979) or Corps Engineering Manual (COE, 1945). It is concluded that nor-mal lockage routines are such that the exchange of water from the upper to
e
98
lower pools compared to the overall vol- ume of water present in the natural channel makes insignificant contri-butions to flow velocities and water elevations (COE, 1979). Therefore, there should be no significant impact on physical parameters downstream and on the related aquatic biota.
(c) Temperature. Damming can also cause changes in temperature of a stream. Less surface area per volume hinders temperature changes in the impoundment. On the Columbia and Snake rivers damming has been found to generally delay water temperature changes creating cooler tem-perature records (COE, 1975). Greater depths, reduced flow velocities and tur-bulence can result in temperature stra- tification and other characteristics similar to lentic waters. When rela-tively small artificial pools are created they are usually shallow and become very warm during the hot summer months. As a result, these pools have less oxygen carrying capacities than cool water and become unsuitable for many species of stream life. In addi-tion, it has been observed that reduced flows have resulted in changes in natural temperature regimes (Colbert, 1975).
The general difficulty in developing suitable criteria for temperature stems from determining the departure from "natural" temperature a particular body of water can experience without suffer-ing adverse effects on its biota.
Whatever requirements are suggested, a "natural" seasonal cycle must be retained, annual spring and fall changes in temperature must be gradual, and large unnatural day-to-day fluctuations should be avoided. In view of the many variables, it seems obvious that no sin- gle temperature requirement will be
99
e
e
4
applicable to continental or large regional areas. The requirements must be closely related to each body of water and to its particular biota with empha-sis on the more important species. These should include plant and animal life that may be of importance to food chains or otherwise interact with species of direct interest to man.
(d) Flows. The operation of a lock does cause hydraulic effects in its prox-imity. A venturi effect is generated on the downstream side of the water flowing through the lock, and the velocity of water is greatly reduced just after pas- sing through the lock. This usually causes some suspended materials to set-tle out of the water column, but sedi-mentation is very minor and is experi-enced only near the locks. Its effects on aquatic biota ue considered insigni-ficant (COE, 1978).
Dams reduce maximum flows (flood preven-tion) and increase minimum flows (low-flow augmentation). This reduces the volume and velocity of flows during high-flow periods which results in decreased erosion, less sediment trans-port, decreased depths and less flood-ing. Low-flow augmentation increases the quality of water flowing at low-flow periods, which provides higher dissolved oxygen conditions and lower tempera-tures, increases velocities, and reduces stagnant-pool formation downstream.
(e) Effects Near Estuaries. Lock and dam construction and operation can lead to significant departures from the natural characteristics and operation of the estuary. Dams can alter in composition, magnitude and temporal order the exchange of information and resources (biotic and abiotic) between the estuarine and fresh-watersystems (Bella, 1975). Dams are used near estuaries to
/
100

regulate fresh-waterflows so as to reduce maximum flows (flood prevention) and increase minimum flows (low-flow augmentation) and to halt salt-water intrusion. Reduced maximum flow and increased minimum flows might reduce the seasonal fluctuation and extremes of water quality in the estuary. For exam-ple, low-flow augmentation might provide higher dissolved oxygen conditions, lower temperature and lower salinities during low-flow periods. Reductions in maximum flows, contrarily, will reduce dilution of ocean waters during high-flow periods. In addition, the occur-rence of periodic flushing, overturning and oxidation of sediments may be hin-dered because they depend on extreme stream flows which might be mitigated by a lock and dam. Dams can also hinder the upstream intrusions of salt water. This may result in salinity concentra-tions being drastically reduced upstream of the lock and dam.
2. Aquatic Habitat. The impacts of operation of locks and dams on the biota and associated habitat are discussed in the following paragraphs. Additional discus-sion on impacts to biota resulting from sedimentation can be found in the previous discussion of dredging impacts.
(a) Alteration of Habitat. The operation of a dam usually causes upstream elevations to increase, flow velocities to decrease, and water levels to stabilize under a wide range of conditions. The once biotic stream assumes a lentic character, resulting in a change of the biotic community.
The impoundments created by damming favor the growth of planktonic algae (COE, 1978). This is attributed to the lower velocities and less turbidity, which permits greater light penetra-tion. Such growth, though, is primarily confined to the zone of light penetra-tion. The growth of planktonic algae
101

and the suitable environmental condi-tions also benefit the growth of zoo-plankton populations. Increased planktonic organisms may subsequently cause an increase in the number of forage fish and the number of game fish.
Dams can increase the volume of aquatic habitat by creating wetlands, backwaters and other aquatic habitat by inundation of dry or occasional inundated lands. These newly submerged lands provide additional aquatic habitat. The cre-ation of wetlands and backwaters are especially important where previously these features did not exist or were limited in number and area.
The reduction in flow velocities up-stream causes suspended materials to settle out. Sedimentation alters the stream bottom, producing a mud-bottom habitat for aquatic organisms. The pop-ulation of benthic invertebrates usually changes from one requiring strong cur-rents and high dissolved oxygen concen-trations to one preferring or tolerant of quiescent conditions and lower dis-solved oxygen regimes. Increased sta-bility of bottom sediments and an increase in organic content of these sediments usually accompany the reduc-tion in flow velocities. For example, in the study of the environmental impacts of replacement of Lock and Dam No. 26 on the Upper Mississippi the pop-ulation of benthic invertebrates were larger and were comprised of more types of organisms because of the increased stability and increased organic mate-rials (Harland Bartheolomew and Asso-ciates, 1974). This impact analysis also stated that the rise in water level and ground water would create additional habitat for such bothersome insects as mosquitoes, black flies, gnats, horse-flies and deerflies (COE, 1976). In the Illinois Waterway, dams probably
102

increased the amount of mud-bottom hab-itat favorable to fingernail clams, Musculium transversum, but appears to have been at least the partial cause of elimination of monkey-faced mussels from the upper reaches of the Illinois River (COE, 1977). The impacts are attributed to reduction in current, critically low dissolved oxygen levels, and pollution.
Conversion of the main river channel to lake habitat will affect fish and other nektonic macro-organisms. The impact may be a reduction or elimination of fish populations specifically adapted only to the main channel or its border habitats. The species which will be eliminated will be those which have nar-row habitat requirements, while those species which can survive in several aquatic habitats should not be elimi-nated. Critically important to their long-term survival is the presence of spawning grounds (COE, 1974). The impact of this elimination on these species is difficult to assess. Any change in benthic invertebrates, forage fish, aquatic and marsh vegetation and algae has the potential to affect the fish populations. This can be caused by a reduction in the quality of fish food or its character,which can be deleteri-ous to those species with specific food requirements. Sedimentation, the increased amount of organic material present and the associated reduction in dissolved oxygen can also produce an unsuitable habitat for some species of fish.
(b) Sedimentation. Sedimentation can directly destroy aquatic animals. Ben-thic organisms will be smothered if suf-ficiently covered by sediments, espe-cially the sessile forms. Motile species may be able to avoid complete coverage. Sediment can hinder respira- tory and feeding functions. Motile
103

4-
aquatic organisms can be affected by this loss because of their dependence on benthic organisms for food. Additional impact can result from elimination of breeding habitat. Some fish species, such as Catostomids (suckers), Acipenserids (sturgeon) and the paddle-fish, spawn in grave bottoms. Sedimen-tation will bury these spawning areas, destroying fish eggs and any further use of the spawning area. Other examples include the extirpation of the smooth soft-shell turtle and perhaps the Ill-inois mudturtle from the lower reach of the Illinois River and adjacent lakes due to silt deposits on former sandy banks and bottoms, and the elimination of the yellow sand-shell mussel and the Ozark minnow in the lower reach from decreased river current and increased sedimentation.
The initial rise in water levels and sedimentation will adversely affect marsh and aquatic vegetation. Permanent inundation will destroy those species which require shallow waters for sur-vival, such as emergent species, or species which require seasonal exposure to the terrestrial environs for repro-duction. In addition, light penetration may be greatly reduced and thereby will effect photosynthesis and plant produc-tion. The sedimentation associated with the reduction in flow will also have an adverse impact on marsh and aquatic veg-etation. Sedimentation can cause direct smothering of valuable plant beds and the filling of backwater lakes. In a study on the Illinois Waterway, sedi-mentation was found to reduce the acreage of water and cause the bottom of lakes to become more uniform, thereby decreasing species diversity of the plant community (COE, 1977). It can also produce a soft false bottom which covers the original firm substrate and thereby makes it difficult for marsh and
104
aquatic plants to gain or retain anchor-age. Uprooting by wind or wave action can easily occur.
This impact on aquatic and marsh vege-tation will also affect the biota directly dependent on it. Epiphytic organisms will feel the impact from loss of habitat and plant nourishment. Other organisms which depend on the completely or partially submerged vegetation for shelter, food or breeding habitat will also be affected.
In the Illinois Waterway before the con-struction of the nine-foot channel pro- ject, turtles, such as the red-eared slider, painted and false-map turtles, fed primarily on aquatic plants,but now feed primarily on midge larvae (COE, 1977). Aquatic and marsh vegetation also provide breeding habitat for some fish species and a refuge for juvenile game fish. The disappearance of yellow perch from the Illinois River in the nine-foot channel project area is attributed to this loss of breeding hab- itat and shelter because of the pro-ject. Blanding's Turtle, a marsh- dwelling species of aquatic turtle, appears to have also been adversely affected by the reduction of marshes in this area.
Increased sedimentation can also result in the creation and recreation of mud flats and wetlands that were lost due to rising water level.
(c) Dissolved Gases. Discharge over a dam can cause reaerat ion of the waters because of turbulence and greater sur-face exposure to the atmosphere. Waters can become supersaturated with dissolved gases such as oxygen and nitrogen and can cause substantial concentrations to be realized at distances downstream
105

(COE, 1975). When a series of impound-ments and dams are involved, the release or use of dissolved gases between dams may not be adequate to reduce concentra-tions below supersaturation during the spill season. The high dissolved oxygen concentrations are beneficial because they permit maximum oxidation of oxygen requiring substances and provide ade-quate quantities of oxygen for aquatic animal respiration. The high concen-trations of nitrogen,though, can be detrimental to aquatic animals (Ebel, 1969). In fish, supersaturation of nitrogen often causes what is referred to as gas bubble disease and other stresses not clearly established (COE, 1972). Although the magnitude of impact from gas bubble disease has not, to date, been conclusively defined, its damage has frequently been observed on adult salmonids in the Columbia River (COE, 1974). Through use of gills, fish extract the dissolved gases from the water and transfer them to their body tissues through the blood stream. These gases remain dissolved as long as the fish is subjected to similar tempera-tures and pressure conditions. If the fish moves to an area of lower pressure, such as shallower water, or into higher temperatures of surface waters for a sufficient length of time, the dissolved gases in the blood and tissues revert back to their gaseous form. These gas bubbles may block the blood vessels and result in death or damage to the fish. Physical signs of significant infection include blisters of gas in the fins and roof of the mouth and hemorrhaging of the eyes (Smith, 1974).
Though supersaturation of dissolved gases, especially nitrogen, can be detrimental to fish, an increase in dis-solved oxygen in rivers having low con-centrations can be beneficial. The
106

(d
(e
greater D.O. concentrations will aid in removal of organic matter from the system and will provide additional oxy-gen for respiration by aquatic animals.
Flow Alteration. Damming and its asso-ciated flow control can lessen the sea-sonal variation of flow. This will reduce during low-flow periods the exposure of aquatic habitat and fish spawning areas to desiccation and the formation of isolated pools in which fish and other aquatic animals become stranded and die. This can be detri-mental to marsh plants, which require seasonal exposure of plant parts or mud-flats for reproduction and growth. Spill way discharge at low-flow periods also tends to increase velocity and water quality and therefore benefits the aquatic biota. Dams also afford some detention of waters during high-flow periods, which may lessen the dislodge-ment and destruction of aquatic and marsh plants and animals.
Estuarine Impacts. The construction and operation of a lock and dam can lead to significant departures from the natural characteristics and operation of the estuary. Dams can alter in composition, magnitude and temporal order the ex-change of information and resources (biotic and abiotic) between the estuarine and freshwater systems (Bella, 1975). The reduction of seasonal flow variations can produce organizational changes within the estuarine systems, such as encouraging the establishment of resident populations at the sacrifice of the seasonal visitor. For example, while low-flow augmentation might pro-vide higher dissolved oxygen conditions, lower temperatures and lower salinities during the low-flow periods, the bene-fits to anadromous fish may eventually be negated because of their exclusion from the system by resident communi-ties. In addition, extreme conditions
107
may no longer appear and their "bene-fits" to the system may be eliminated. For example, the extreme stream flow and weather conditions may be altered and the periodic flushing and overturning of the estuary and oxidation of reduced sediments may subside or be eliminated. Damming will also limit the intrusion of marine organisms up the river both phy- sically and by inhibiting salt-water intrusion. By reducing the seasonal variations, the extremes in salinity will be reduced, which may permit orga-nisms that were restricted from portions of the estuary because of these extremes to inhabit these portions. For example, higher salinities caused by a reduction in fresh-water flow into the estuary may permit oyster drills (Urosalpinx sp) to inhabit further up the Delaware Bay, resulting in a deleterious impact on its prey, the oyster (Crassostrea virginica).
(f) Fish Movements. Locks and dams repre-sent major obstacles to the movement of local and anadromous fish. They can prevent or impede fish from successful passage upstream or downstream. The impacts on anadromous fish are numerous and varied, ranging from direct mortality to hindering the successful completion of the migratory life cycle because of project related river conditions.
•
•
During the upstream migration of adult anadromous fish, many individuals are lost through natural mortality, delay, injury, nitrogen fixation, disease and harvest by commercial,recreational and Indian fisheries. Conclusive figures of losses imputable to each and every fac-tor are not available, but their com-bined effect is significant and sub-stantial (COE, 1979).
Andromous fishes migrating upstream expend BO% of their energy reserve
108
(Evans, 1976). The remaining 20% is unused reserve, and presumably, beyond its use a fish would not be able to con-tinue its journey. Therefore, a delay because of barrier or any other major changes in energy requirements may result in a fish not reaching the spawning grounds. Delay can result from a fish's inability to jump over the dam, swim through the existing stream current or locate entrances to fish ladders or other passage structures. Fallback, disorientation or injury may also aug-ment energy consumption. Any delay pro-longs exposure to gas supersaturated waters, subjects the fish to disease and higher water temperatures, and increases the possibility of physical injury and predation.
Some fish are physically unable, for one reason or another, to locate the en-trance to the fish ladders. These fish either retreat back below the dam and attempt to locate an alternative spawning area or die without reproducing.
Fish ladders have been found to harbor rough fish with high incidence of infec-tion by Chondroccus columnaris (COE, 1976). Water samples taken in the fish ladders were found to contain signifi-cantly more columnaris organisms than those taken from waters entering the ladders (Fujihara and Hungate, 1971). The severity of this impact on anadromous fish is contingent on water temperature, number of migrating fish, rate of fish passage and density of infected fish.
It has been common knowledge for some time that there is inter-dam loss of anadromous fish. Studies are presently being conducted to discover the causes of this loss (COE, 1976).
109
Juvenile anadromous fish are also lost through natural mortality, delay, in-_. jury, disease, and nitrogen fixation on their migration downstream. They usually travel downstream during the hours of darkness and periods of high flow (Bell, 1973) and spillage over the dam. Juvenile fish are subjected to two harmful effects by passing over a spill-way. They include direct physical damage and exposure to gas supersatu-rated waters. The National Marine Fish-eries Service estimates the 1956 loss of juvenile fish because of the spillway at McNary Dam on the Columbia River to be about 1% to 3% (COE, 1976). Gas super-saturation may also exist downstream of the dam.
Any increase in passage time could interfere with the physiological adjust-ments of smolts to seawater, subject the juvenile fish to higher temperatures found in late spring, cause additional predation and disease, and increase the failure of fish to migrate downstream. Higher water temperatures produce addi-tional stress on fish, which causes an increase in the incidence of disease and slows or stops the growth rate. Higher temperatures tend to favor anadromous fish. Delays in migration tend to off-set the benefits of temperature increases. Significant cumulative delay in migration could potentially cause some fish to encounter increasing tem-peratures later in the season, thereby subjecting them to adverse impacts of warmer waters.
(c) Mitigation
The following measures are suggested as viable means by which to lessen the environmental impact from the con-struction and operation of locks and dams:
I
110

1. The incorporation of an efficient fingerling bypass system with the lock and dam facility can reduce injuries to juvenile fish as they travel downstream and over the spillway.
2. In the same sense, the introduction of other types of collection and transportation schemes for adult and juvenile fish can likewise reduce injuries.
3. The incorporation of certain operational mod-ifications, such as deflector installation or upstream storage, can effectively regulate gas saturation levels and avoid the damage to aquatic organisms from super-saturated concentrations.
4. Hatchery and rearing compensation programs may effectively offset lock and dam losses of young and juvenile fish.
5. The incorporation of fish ladders is critical near coastal areas so as to allow for proper passage by adult anadromous fish as they proceed on their upstream migration to spawning grounds.
6. The post-construction restoration of the aquatic habitat can greatly aid in the quick and success-ful re-establishment of aquatic organisms.
7. The upstream pool surface elevations may be regulated to allow:
(a) the flushing of backwater areas to alleviate DO depletion problems.
(b) control of marsh vegetation and weeds.
8. Utilization of a flow allocation program can be used to maintain minimum flow requirements for fish and other organisms during periods of drought and low flow.
RESERVOIR IMPACTS
Reservoirs may be best considered as artificial lakes created by constructing a dam somewhere downstream from a river or drainage basin, resulting in the accumulation of upstream waters behind the dam. These waters are normally lentic-like pools and may inundate vast areas of upstream
111
['
•
land. The location of a reservoir is primarily along a tributary somewhere lateral to a mainstream river or on the river upstream from the head of navigation.
Reservoirs are created to serve a variety of purposes, all of which essentially derive from their obvious func-tion as a reserve of water. This reserve may be tapped by localities as potable water supply and/or may serve as a flow allocation system, augmenting volumes during low-flow periods and impounding waters during flood times. It may also be used as an occasional "purge" device, allowing purges of excess to cleanse downstream channels of snags and rocks. Occasionally, reservoir dams are used as a source of potential energy for hydroelectric generation. The impacts associated with flow allocation are addressed separately in this section.
The impacts associated with reservoirs are similar to those previously discussed for the construction and opera-tion of a dam. Following is a brief discussion of these impacts. More details can be found in the previous sub-section, Lock and Dam Impacts.
(a) Construction Impact
Refer to the previous section, Lock and Dam Impacts, for a discussion of the construction related impacts to water quality and aquatic habitat from dams.
(b) Operation Impacts
1. Water Quality. Impoundment by a reservoir will decrease flow velocity upstream; cause additional sedimentation, which will remove other pollutants from the water column and clarify the water; cause a greater depth and surface area, but reduce the surface area per volume; and produce lentic conditions and their associated biotic characteristics. It should be noted that portions of the river and its tributaries above resevoir surface level neither experience a decrease in flow velocity nor an increase in sedimentation. The spillway associated with a dam provides reaeration, which may be released at dis-tances downstream and may cause high supersaturation of
112

dissolved gases such as oxygen and nitrogen. Dams also reduce maximum flows (flood prevention) and increase min-imum flows (low-flow augmentation), which results in a more stable environment downstream and better water qual-ity during low flow. A dam can also alter in composition, magnitude and temporal order the exchange of information and resources (biotic and abiotic) between the estuarine and freshwater systems (Bella, 1975). .
2. Aquatic Habitat. Creation of a reservoir changes a lotic body of water to a lentic one and thereby alters the biotic community to one which favors these con-ditions. In general, dams increase the volume of aquatic habitat, backwaters, and wetlands by permanent inundation of dry or occasionally inundated areas. The increased sedimentation creates a muddy bottom and can cause the suffocation of benthic and slow-moving organisms, affect highly motile organisms such as fish, and destroy vege-tation by burial or producing an unsuitable growing med-ium. The reaeration caused by discharge over the spillway can benefit downstream organisms by increasing dissolved oxygen levels. Supersaturation by nitrogen gas, however, can be detrimental to fish by causing "gas bubble disease" and other stresses not clearly established (Ebel, 1969).
The dam associated with a reservoir can be a major obstacle to anadromous fish. It can prevent or impede fish migration and thereby cause impacts which range from direct mortality to hindering the successful completion of the migratory cycle. The downstream migra-tion of juvenile anadromous fish can also be affected by the dam. This can result in direct mortality, migration delay, injury, disease and subjection to supersaturation of dissolved gases.
3. Impacts Associated with Flow Allocation. Regulating flow in a river or stream can cause drastic changes in water quality and the aquatic biotic com-munity. The impacts do not result simply from the volume of flow released but from the rate of change, timing and duration of high and low flows, water quality, temperature differences, and the velocities of low release from reser-voirs. Natural riverine ecosystems develop in response to short and long term patterns. When these patterns are altered by flow allocation, the aquatic and wetland eco-systems cannot avoid alteration themselves.
113
Discharges influence the physical characteristics of the river or stream, such as velocity, depth, channel width and configuration, and stream bed gradient and sub-strate. Flow allocation will affect these parameters and thereby will impact the aquatic microhabitats. Frazer (1972) and Ward (1976) present literature reviews on the effects of flow modification on fish and benthos inhabi-ting streams. An aquatic organism usually has definite environmental requirements for survival, and if they are not met, the organism will not be able to become estab-lished there. In the case of changing conditions, the organism may be eliminated from the area. In addition, the different stages of an organism may have different (broader or narrower) requirements and different sensiti-vities to changes. Flow changes can affect the biotic community in general by changing species diversity and composition (Ward, 1976).
Low-flow augmentation can benefit aquatic biota by increasing the amount of habitat inundated by water. Without low-flow augmentation some areas will not be inun-dated and will not be suitable for most aquatic orga-nisms. Organisms inhabiting these areas are subject to desiccation and may die because of the lack of inun-dation. Other organisms, such as some marsh plants, require exposure of soil and plant parts to the atmosphere during parts of the year and inundation during other parts to enable reproduction activities. Low-flow augmentation may eliminate this yearly pattern and thereby may hinder reproduction or cause elimination of these plants.
(c) Mitigation
Those measures used to mitigate or lessen the impacts associated with the construction and operation of a reser-voir are similar to those listed in the preceding sub-section, Lock and Dam Impacts.
OTHER WATERWAYS IMPACTS
(a) Dikes
A dike is a structure designed to develop and maintain the required channel dimensions and a particular channel alignment. It is essentially a finger-like projection extending outward from a bank into the river channel and
114
effectively functions to lessen the river's width, direct the flow in the particular alignment and cause bottom scour to deepen the selected navigation channel.
Dikes have been used most often in fluvial rivers, such as the Missouri and Mississippi, where sediment deposition encroaches on the main river channel and retards navigation. The positioning of a dike, however, changes the characteristic river flow patterns and volumes and, hence, alters the aquatic habitat in a commensurate manner. By acting to constrict the river channel, flow velocities in the remaining free-flowing main channel are increased, with a subsequent increase in bottom scour. This affects the obvious objective of a dike, i.e., to maintain or deepen a navigation channel.
The dike also creates a second type of aquatic envi-ronment, however, by acting as a breakwall and inhibiting current and flow on the leeward or downstream side of the dike. Here the river environment is characterized by more lentic, pool-like waters with reduced velocities and increased sediment deposition, particularly along the interface between the faster flowing waters of the main channel and the backwater pool.
Of particular note, is the ongoing research program, Environmental and Water Quality Operational Studies (EWQOS), conducted by WES to evaluate environmental impacts and develop construction and design guidelines for many structures including dikes, revetments, clearing, snagging, and channelization.
The following subsection presents the impacts to water quality and aquatic habitat resulting from the construc-tion and operation (i.e., post-construction) of a dike.
1. Construction Impacts. The actual construc-tion of a dike will destroy aquatic habitat by substrate coverage and disruption and will alter water quality through resuspension of settled materials and any bound chemicals (COE, 1975). The impacts, though, are very localized and temporary.
115
*
lb
a
Dikes cover the river bottom and destroy the ben-thic community that inhabits the area. However, they usually create more surface area and a different substrate type for a new plant and animal community which becomes established after construction.
2. Operation Impacts. (i.e., Post-Construction)
(a) Water Quality. As aforementioned, dikes serve to constrict the main channel in order to maintain the navigation chan-nel. The reduced width causes an increase in depth per unit of width and an increase in velocity, which results in an increase in the transport capacity of the channel waters (COE, 1976). Tur-bidity is greater in this free-flowing channel because of the increased capacity of the water to carry more sus-pended material. The increased turbid-ity results in a reduction of algae and their production of oxygen by photo-synthesis. This can cause a detrimental impact up through the food chain. The increased transport capacity augments river bottom degradation by scouring, which resuspends and keeps in suspension sediments, including organic materials and other pollutants such as heavy metals and pesticides. These can result in a further reduction of water quality, such as increasing BOD and COD,and reducing dissolved oxygen concentrations.
When pile-type dikes are constructed in a series, the flow velocity between dikes is reduced, resulting in the deposition of suspended solids. This causes water quality to improve by reducing turbidity and suspended solids. Submerged dikes in a river tend to channelize flow. They increase the sedimentation rates on the bank side of the dike and increase bottom scour on the midchannel side (COE, 1975).
116

Within the backwater area of the dike, turbidity and flow velocities are lower. Reduced turbidity permits greater light penetration, stimulating algae production and increasing the DO concentration within the water column.
(b) Aquatic Habitat. In general, a dike may provide additional habitat, food, resting areas, shelter and refuge from predators. Dikes have been found to increase benthic diversity by providing artificial substrates, but may decrease the diversity of all aquatic organisms by reducing the quantity and quality of habitat (Daley, 1977).
Within the lentic backwaters created by the dike, the reduction in flow veloci-ties cause suspended materials to settle out. This sedimentation can alter the stream bottom and produce a mud-bottom habitat for aquatic organisms. The pop- ulation of benthic invertebrates may change from one requiring strong cur-rents and high dissolved oxygen concen-trations to one preferring or tolerant of quiescent conditions and lower dis-solved oxygen regimes. Increased sta-bility of bottom sediments and an increase in organic content of these sediments may accompany the reduction in flow velocity.
Lower velocities and less turbidity favor the growth of planktonic algae (COE, 1978) by permitting greater light penetration. However, growth is pri-marily confined to the zone of light penetration. The oxygen produced by algae contributes to the dissolved oxy-gen concentrations in the water column.
The growth of planktonic algae and the suitable environmental conditions also benefit the growth of zooplankton popu-lations. Increased planktonic organisms
117
may subsequently cause an increase in the number of forage fish and the number of game fish.
An additional impact of dikes may be a reduction or elimination of fish popu-lations specifically adapted only to the main channel or its border habitats. The species that will be eliminated will be those which have narrow habitat requirements, while those species which can survive in several aquatic habitats should not be eliminated. Critically important to a species long-term sur-vival, however, is the presence of suit-able spawning grounds. Most Catostomids (suckers), Acipenserids (sturgeons) and the paddle fish, for example, typically spawn in gravel bottoms in main chan-nels. Transformation to lentic habitat will probably destroy these spawning grounds (COE, 1974). The impact of this elimination on these species is diffi-cult to assess. Any change in benthic invertebrates, forage fish, aquatic and marsh vegetation and algae has the potential to affect the fish popula-tions. This can be caused by a reduc-tion in the quality of fish food or its character which can be deleterious to those species with specific food requirements.
Sedimentation, the increased amount of organic material present and the associ-ated reduction in dissolved oxygen can also produce an unsuitable habitat for some species of fish. For a more detailed discussion of the affects of sedimentation on aquatic biota, refer to the subsection titled Lock and Dam Impacts.
Floating debris tends to collect at pile dikes. Occasionally the pile dike and debris provide habitat and protection to
118
fish (COE, 1975). Usually, however, pile dikes reduce the bank fishery and obstruct fish passage.
3. Mitigation. The St. Louis District has low-ered the design elevation of dike fields in an effort to preserve and possibly enhance fish habitat (COE, 1976). Some of the dike fields have notched dikes which were in-tended to improve fish habitat; however, this has pre-cluded any major or rapid change of the channel boundary in the future. There has also occurred an extensive notching program on the Missouri River where the value of notches as habitat enhancement is generally acknowledged.
The Missouri River, with several flood control resevoirs upstream, has more stable flows rather than the extreme flows characteristic of the Mississippi River. Hence the dikes in the Missouri River are normally visible above the water surface except during extremely heavy local flooding. The Middle and Lower Mississippi River, by contrast, normally has its water covering the dikes, and they are exposed only during periods when low flows occur. The Upper (pooled area) Mississippi River dikes are nearly all covered by water all the time. It should be noted that the impacts of dikes in each of these sys-tems are not identical.
Other mitigation measures as noted below may also be used:
(a) The use of construction materials that provide suitable habitat to aquatic biota will benefit the aquatic ecosystem and minimize impacts.
(b) Scheduling construction activities to non-breeding and non-migratory seasons will minimize impacts to reproduction activities of aquatic organisms.
(c) Limiting construction to low-flow periods should minimize impacts on water quality because lower velocities will result in less sediment erosion.
119

a
r
1 ‘
...i.
(b) Revetments
A revetment is a structure built to continuously pro-tect the bank of a river from eroding and collapsing. With proper design, a revetment will protect the upper portion of the bank from wave action and protect the sub- merged portion from the scouring or undercutting resulting from current action.
There are several types of revetments that'are cur-rently used to protect the bank area. These include rub-ble mound revetments which are constructed parrallel to the banks, articulated concrete mattresses which blanket the bank and riprap paving which covers the bank with stone or similar materials thereby maintaining bank inte-grity. Armoring banks with these structures may have an overall positive environmental effect on both water qual-ity and aquatic habitat as they reduce the degree of bank erosion, lessening turbidity and suspended sediment and providing desirable habitat in areas where caving banks have formerly provided poor habitat. It should be noted
1. Construction and Operation Impacts
(a) Water Quality. The actual construction of a revetment will reduce water quality by resuspending sediments, though it will be very localized and temporary.
Bank stabilization through revetment has resulted in lower flow velocities and sediment transport in the area between the revetment and the bank. This results in the deposition of suspended solids and increased water quality in this area. The resulting environmental condition favors the growth of algae and other aquatic plants by permitting greater light penetration (COE, 1978). Growth, though, is primarily confined to the zone of light penetration. The growth of algae and other aquatic plants increases the amount of oxygen produced through photosynthesis which contributes to the dissolved oxygen concentrations in the water column.
120
The reduction in flow velocities causes suspended materials to settle out. Sed-imentation can alter the stream bottom and produce a mud-bottom habitat for aquatic organisms. The population of benthic invertebrates may change from one requiring strong currents and high dissolved oxygen concentrations to one preferring or tolerant of quiescent con-ditions and lower dissolved oxygen reg- imes. Increased stability of bottom sediments and an increase in organic content of these sediments may accompany the reduction in flow velocity.
A revetment may also result in limited constriction of the main channel pre-venting meandering and bank erosion but causing an increase in depth per unit of width, which results in an increase in the transport capacity of the water. Turbidity is greater because of the increased capacity of the water to carry more suspended material. The increased turbidity results in a reduction of algae and their production of oxygen by photosynthesis. This can cause a detri-mental impact up through the food chain. The increased transport capacity augments river bottom degradation by scouring, which resuspends and keeps in suspension sediments, including organic materials, heavy metals and pesticides. These can result in a further reduction of water quality such as increasing BOD and COD and reducing dissolved oxygen concentrations.
(b) Aquatic Habitat. Aquatic habitat will be destroyed by substrate coverage and disruption, resulting in the loss of the associated benthic community. After construction, the revetment itself will provide additional surface area and a different substrate type for plants and animals. It can also provide nesting areas, shelter, refuge from predators and a prey population for predators.
121

■••
Revetments have been found to increase benthic diversity by providing artifi-cial substrates, but may decrease the diversity of all aquatic organisms by reducing the quantity and quality of habitat (Deley, 1977).
The populations of many aquatic orga-nisms may show a change if the flow velocity reduction caused by the revet-ment is significant enough. The impact may be a reduction or elimination of fish populations specifically adapted only to the main channel or its border habitats. The species which will be eliminated will be those which have nar-row habitat requirements, while those species which can survive in several aquatic habitats should not be elimi-nated. Critically important to their long-term survival is the presence of spawning grounds. Most catostomids (suckers), Acipenserids (sturgeons) and the paddlefish, for example, typically spawn in gravel bottoms in main chan-nels. Transformation to lake habitat will probably destroy these spawning grounds (COE, 1974). The impact of this elimination on these species is dif-ficult to assess. Any change in benthic invertebrates, forage fish, aquatic and marsh vegetation and algae has the potential to affect the fish popula-tions. This can be caused by a reduc-tion in the quality of fish food or its character, which can be deleterious to those species with specific food requirements.
Sedimentation, the increased amount of organic material present and the asso-ciated reduction in dissolved oxygen can also produce an unsuitable habitat for some species of fish. The specific impacts of sedimentation are identical to those addressed in the preceding dis-cussion on dikes in this subsection.
122

Additionally, floating debris may col-lect at the revetment and may provide additional habitat and protection to fish.
2. Mitigation. The following measures may be utilized to lessen the anticipated impacts associated with the construction of a revetment.
(a) The use of construction materials that provide suitable habitat to aquatic biota will benefit the aquatic ecosystem and minimize impacts.
(b) Designing revetments to minimize the effect on flow velocity can also reduce the impact to the aquatic ecosystem and minimize impacts.
(c) Scheduling construction activities to non-breeding and non-migratory seasons will minimize impacts to reproduction activities of aquatic organisms.
(d) Limiting construction to low-flow periods corresponding to the period that other river-related activities will be minimally present will minimize sedi-mentation related impacts.
( c) Sills
The purpose of the sill is to impede the landward movement of ocean waters near the bottom of the channel.
1. Construction Impacts Impacts due to con- struction of a sill are similar to those for construction of a lock and dam.
(a) Water Quality and Aquatic Habitat. A study has been conducted by the U.S. Army Corps of Engineers (COE, 1977) on the impact of a submerged sill in Car-quinez Strait (Sacramento, California District) on suspended sediment concentration.
123
Jr
4
I 1 1 le
1
1 4,
Salt water intrusion has been steadily increasing its landward movement up the San Francisco Bay and estuarine system because of a reduction of fresh-water flows into the system from the Central Valley drainage and deepening of the navigation channel upstream of Carquinez Strait. The increase in the salinity of these waters will adversely affect their quality and their use by municipalities, industry and agricultural establishments.
The study concluded that the sill will not have a significant impact on either upstream or downstream sediment trans-port. Any effect resulting from the sill would be much smaller than normal daily, seasonal or annual variations in suspended solids transport in the estuary landward of the sill. However, during high flows the sill will cause increases in upstream water surface elevations, surface current above the sill and bank erosion if banks are not protected.
The increase in upstream water surface elevation during high flows will cause additional areas to be inundated with water. This may benefit wetland and aquatic plants and animals by providing additional habitat. However, the increased surface elevation will also cause greater and longer inundation of some areas and thereby effect those organisms that are intolerant of such conditions. For example, submergence of emergent plants may destroy intolerant species. In addition, increased eleva-tion may eliminate the necessary light penetration to submerged plants, which may result in an elimination of photo-synthesis during the period of greater inundation and in some cases,may result in the death of vegetation.
124
Increased surface current and bank ero-sion can have a detrimental impact to aquatic organisms. They can cause the physical dislodgement of wetland and aquatic plants and animals and direct and indirect destruction of these orga-nisms by such factors as the physical impact with other objects, altering hab-itat and increasing predation. In-creased bank erosion will also cause the resuspension of sediments and the de-crease of water quality thereby affect-ing aquatic biota. The subsection on dredging impacts discusses the impacts of suspended solids and decreased water quality on aquatic biota.
2. Mitigation. In order to lessen the impacts as sociated with the construction of a sill, attempts should be made to schedule construction activities to non-breeding and non-migratory seasons. This will minimize impacts to reproductive activities of aquatic organisms.
(d) Jetties
Jetties are barriers built out from a seashore to pro-tect the land from erosion and sand movement. They are constructed at the entrances of estuaries for harbor pro-tection or along beach fronts to maintain beaches. Jet-ties extend beyond the surf zone intercept and disrupt littoral currents (Bella, 1975).
1. Construction Impacts. Construction of a jetty requires equipment movements in and disruptions to the surf zone. Due to the nature of the zone the impacts will be small and of short duration.
2. Operation Impacts.
(a) Water Quality. Jetties can decrease amounts of suspended sand,causing its deposition and hindering its resuspens ion.
(b) Aquatic Habitat. The disruption of lit-toral currents produces a more stable
125
I .
I
[ k .
environment, which will benefit many marine organisms but may be detrimental to others. Jetties also hinder the dis-lodgement of organisms associated with the beaches and littoral zone.
Jetties provide solid substrate for attachment of many sessile organisms. They also attract sport fish and facili-tate the movement of fish and crusta-ceans into the estuaries and littoral zones.
3. Mitigation. The following measures may be utilized to lessen the anticipated impacts from construc-tion of a jetty:
(a) The use of construction materials that provide suitable habitat to aquatic biota will benefit the aquatic ecosystem and minimize impacts.
(b) Scheduling construction activities to nonbreeding and non-migratory seasons will minimize impacts to reproductive activities of aquatic organisms.
(e) Clearing and Snagging Activities
Clearing and snagging operations remove obstruction in the river. Though they benefit navigation, adverse and beneficial impacts to water quality and aquatic biota may ensue.
• 1. Operation Impacts
(a) Water Quality. Clearing and snagging activities remove substances from the river which decay and otherwise increase the biochemical oxygen demand (BOD), chemical oxygen demand (COD), or metals concentrations. Snags cause restricted flow during the low-flow season and cre-ate stagnation problems. Their removal eliminates the impacts to flow and water
126

quality (COE, 1975). Although their removal from the river benefits water quality the physical removal causes the resuspension of sediments. The amounts of materials and chemicals resuspended usually are not sufficient to cause sig-nificant and long-term changes in water quality (COE, 1975). Suspended solids concentrations may increase, but sedi-mentation often occurs shortly after resuspension further downstream. Resus-pension of oxygen-demanding substances can cause a reduction in dissolved oxy-gen concentration, but because of sedi-mentation, the small quantities resus-pended, and reaeration, the impact is not significant. The impacts associated with resuspension of other materials, such as metals, are also insignificant.
(b) Aquatic Habitat. Clearing and snagging operations affect aquatic biota by removing debris which serve as suitable habitat. They may afford a substrate for benthic and periphytic organisms, a source of food for organisms that feed on detritus, a population of organisms on which other organisms feed or produce eddy currents, and pockets of almost stationary water that provides flow var-iation and may diversify aquatic habi-tat. Sediment carried by the river tends to settle in these areas, pro-ducing a bottom habitat which may be different from that in most other areas. Some aquatic organisms prefer these currents, pockets of almost sta-tionary water, and/or bottom habitat and may only be found in the river areas having these characteristics.
(f) Rock Removal
Rock removal is normally accomplished by blasting with explosives.
127
ir
4
4
1. Operation Impacts
(a) Water Quality. The blasting of rocks in the main channel will cause the tem-porary resuspension of sediments. The amounts of materials and chemicals resuspended usually are not sufficient to cause significant and long-term changes in water quality. Suspended solids concentrations may initially increase, but downstream sedimentation usually occurs shortly after resuspen-sion. Resuspension of oxygen-demanding substances can cause a reduction in dis- solved oxygen concentrations, but because of sedimentation, the small quantities resuspended and reaeration, the impact is not significant. The im-pacts associated with resuspension of other materials,such as metals,are also insignificant.
(b) Aquatic Habitat. The blasting will have a limited impact on fish (COE, 1975). It can be expected to kill some fish in the immediate area of explosion. How-ever, fish normally do not inhabit the deeper, main channel where blasting is necessary because there is a limited amount of food available in comparison to that in the nearshore areas. In addition, research by the United States Fish and Wildlife Service has shown that minimal destruction of fish occurs in areas further than 50 feet from a blast of this type. Plankton and benthic organisms are relatively rare in the deeper, main channel where blasting oc-curs, and therefore, blasting will have little impact upon the aquatic community in general (COE, 1975).
Normally, when an obstruction such as a rock exists in a stream, it produces eddy currents, areas of almost statio-nary water, scouring downstream, and shoaling even further downstream. This diversifies habitat and may benefit some
128
aquatic organisms while being detri-mental to others. The removal of these rocks will eliminate the habitat they produce.
(g) Channelization
Actual channelization for navigation purposes can be comprised of several activities, viz., dredging, dikes, and revetment construction, rock removal, and channel straightening. The specific impacts of all but the last activity are fully discussed in their respective sections.
The following impact discussion is primarily drawn from channelization for drainage and flood control. There would be similar impacts for channelization of small rivers (i.e., channel straightening) for commercial and recreational navigation.
1. Construction and Operation Impacts
(a) Water Quality. Construction for chan-nelizational purposes will cause a sig-nificant increase in turbidity and oxy-gen demand. This will result in lower dissolved oxygen concentration. Down-stream of the construction site sedi-mentation will remove suspended solids and thereby cause water quality to recover. The distance downstream where water quality degradation will occur is dependent on the physical parameters of the river. Water quality impacts resul-ting from channelization may be long-term in nature and may result in related long term impacts to habitat. For example, changes in temperature due to loss of shading and changes in tur-bidity due to channel instability have been noted, and can result in definite long-term changes to the aquatic habitat.
It may also be noted that a secondary effect of channelization can be the changing land use of the area made pos-sible by the flood protection afforded
129

■
v
•
a
I
by a channel modification program. This changing land use can lead to a signifi-cant degradation of water quality.
See Dredging Impacts for a presentation in greater detail of the water quality impacts resulting from construction in a river and a discussion of associated impacts to biota resulting from the changes in water quality.
(b) Aquatic Habitat. Channelization usually alters the morphological parameters of a stream or small river, particularly channel sinuosity, gradient and bank vegetation. The biotic community within the body of water is closely connected with these parameters. For example, stream habitat diversity is directly correlated with the variability of water depth and velocity within a particular stream segment (Zimmer and Bachman, 1976). A reduction in their variability will cause a reduction in the diversity of the existing habitat.
Morris et al. (1968); Etnier (1972); and Griswold et al. (1978) report reduc-tions in benthic drift and changes in the aquatic invertebrate communities because of channelization. These changes include reductions in abundance, biomass, and/or diversity of macroinver-tebrates. Fisheries studies conducted in various parts of the country have indicated that channelization has had a negative impact on fishery resources (Henegar and Harmon, 1973). Bayless and Smith (1964); Elser (1968); Irizarry (1969); Congden (1971): Tarplee, Louder & Weber (1971); Trautman & Gartman (1974); Lund (1976); and Griswold et al. (1978) reported that channelization can reduce fish abundance in both cold and warm waters. Schneberger & Funk (1971) and Hynes (1974) found a les-sening of diversity in channelized reaches. Growth (Purkett, 1957; Han- sen, 1972; Amer et al., 1975) and
130
catchable fish biomass (White, 1973) can also be reduced. Physical alteration of habitat is the major cause of these impacts to fish and fish food orga-nisms. Water quality degradation is also a significant factor.
Duvel et al. (1976) found no long-term deleterious effects on water quality, attached algae, benthic fauna or forage fish populations. Stream channeli-zation, however, has a direct, delete-rious impact on trout population because of the elimination of suitable habitat.
The major source of detritus to the aquatic ecosystem is terrestrial in nature; thus, the destruction of aquatic biota in the channelized portion of the stream will not necessarily mean a reduction in detritus to downstream waters. The removal of bank vegetation, though, will reduce the amount of detritus in the aquatic ecosystem.
Tarplee et al. (1971) reported that channelized streams along the coastal region of North Carolina recovered with-in 15 years after channelization was completed. Fish and macroinvertebrate recolonization of channelized, unmiti-gated sections of small warm water streams can occur naturally within a year, but the aquatic community can be drastically modified (Griswold et al., 1978). Structures and other mitigating measures have been found to be effective in providing suitable habitat for fish and macroinvertebrates in channelized streams (Buckley et al., 1976; Iund, 1976).
2. Mitigation.
(a) Downstream turbidity increases can be minimized through such methods as discussed in Dredging Impacts.
131
.
*
(b) Whenever channelization occurs, the phy-sical characteristics of the original body of water (i.e., depth, width, flow rate and relief) can be maintained to the extent possible, or environmental conditions can be enhanced to minimize environmental impacts. Original or similar bed material type should be placed on the bottom of the channelized body of water whenever possible.
k (c) Structural and non-structural alterna-
tives should be analyzed to minimize the environmental impacts of accomplishing the desired goals of channelization.
(d) Channelization activities during non-breeding and non-migratory seasons should minimize impacts to reproduction of aquatic organisms.
(h) Navigation
The following discussion presents the impacts to water quality and aquatic biota from navigational use of waterways.
1. Impacts to Water Quality and Aquatic Habitat.
(a) Resuspension of Sediments. The passage of a boat or two causes a displacement of water which may result in the tempo- 1 1 rary resuspension of sediments. The propeller wash can also be significant in moving sediments (Ecological Consul-tants, 1978). Resuspension is dependent on such factors as the vessel size; speed, draft and direction of travel; the horsepower of the engine(s); the depth of the channel; the characteris- tics of the channel bottom materials; 1 and single versus multiple vessel passage (COE, 1976).
Larger boats and tows cause greater water turbulence and are closer to the channel bottom than smaller pleasure
I
132
crafts. This results in greater resus-pension of sediments. Faster moving vessels, those having greater drafts and those which have engines of greater horsepower will have the same effect.
Upstream traveling will cause greater turbulence than that created by vessels traveling with the natural flow. Resus-pension, therefore, will be greater.
The deeper a body of water is, the more distance there will be between the bot-tom of the vessel and the channel bot-tom; hence, the less resuspension there will be. The amount of turbulence at a given point is dependent on the distance the point is from the source of the tur-bulence. It tends to decrease as the distance from the source increases. The depth of the river is lowest during low-flow periods. The resuspension of sed-iments by a vessel will be greatest during these times. During high-flow periods, depths are greatest and resus-pension of sediments can be minute or non-existent.
Resuspension also depends on the size of the sediment particles and whether the bottom substrate is soft and unconsoli-dated or not. The passage of boats and tows over a bottom substrate which is soft, unconsolidated and composed of silt-size particles will cause much more resuspension of sediments than when they pass over a gravelly, sand bottom.
After passage of the navigational ves-sel, turbulence will decrease and resettling will ensue. Particles settle at the site of disturbance or downstream of their original position because of river flow. They may settle within the main channel along the banks or within the backwaters depending on the swift-ness of water and the size and weight of
133
*
*
i
4
particles. Additional vessels will hin-der settling and may cause resuspension of other particles.
The resuspension of sediments will reduce water quality. Turbidity and suspended solids concentration will increase. Turbulence may release such substances as pesticides, metals, methane, oil and grease and nutrients from the bottom deposits into the water column. Organic materials released into the water column will decrease water quality by increasing biochemical oxygen demand and chemical oxygen demand and by decreasing dissolved oxygen concentrations.
The St. Louis District of the United States Army Corps of Engineers conducted a study in the Illinois River during a period between medium and high river stages and found barge traffic to have very little effect on turbidity levels (COE, 1976).
The United States Army Waterways Experi-mental Station conducted a similar study in some areas on the Mississippi and Illinois rivers during a period of nor-mal pool conditions (Johnson, 1975). The study showed a significant temporary increase in suspended solids and turbid-ity after the passage of a tow. These increases were primarily observed in the main channel where depths ranged from 10 to 12 feet. No significant impacts existed where depths were 15 feet or greater. The period necessary for the level of turbidity and the concentration of suspended solids to return to ambient levels varied considerably. Recovery times were usually shorter than the three hour monitoring period following the passage of a tow. Complicating the conclusions is the fact that there were unexplainable wide variations in the
134
turbidity and suspended solids during the absence of tow passage.
In the same study by Johnson (1975), dissolved oxygen concentrations showed no distinct variation correlated with tow passage. In most cases, tow traffic did not reduce dissolved oxygen concen-trations in the main channel of the river. In some instances DO decreased slightly after passage of a tow. Stud-ies on the Illinois River have actually shown steady increases in dissolved oxy-gen concentrations above initial levels, which is attributed to the increase in turbulence by passing tows (COE, 1976). Starret (1971) reported temporary increases in turbidity of 200 Jackson Turbidity Units (JTU) in the Illinois River immediately following the passage of a barge. An observable turbidity trail can extend for several miles behind a vessel (COE, 1976).
A study was conducted by the Water Qual-ity Work Group of GREAT I to determine the effects of the first barge traffic of the season on the water quality of Lake Pepin in Minnesota (GREAT I, 1978). It showed that barge traffic causes resuspension of bottom sediments, even where water was 8.5 meters (28 feet) deep. After initial barge tow passage there was an increase in the concentrations of dissolved manganese, total manganese, total mercury, phenols, total phosphorus, suspended solids, total solids and total zinc; and there was a decrease in pH. The effects on water quality were only short-term because they disappeared within three to six hours after the initial barge tow. This occurrence is attributed to set-tling and dispersion of resuspended bot-tom material.
The increase in turbidity from navi-gational use of a waterway can affect
135

(b
the existing aquatic biota. One of the major impacts is the reduction of light penetration into the water column. This interferes with primary production and the photosynthetic production of oxy-gen. When turbidity is high and long-lasting, aquatic vegetation dies, decom-poses, and adds to the oxygen demand. The loss of primary production can pro-duce repercussions up the entire food chain. Turbidity has been noted to cause the flocculation of planktonic organisms (COE, 1976). It can also result in the abrasion and clogging of the respiratory organs of fish and other aquatic animals and may cause death. Associated reductions in dissolved oxy-gen may also hinder the life processes of aquatic animals and may result in death. Turbidity and the reduction of light penetration may visually impair feeding and reproduction of motile ani-mals. This is especially important to organisms, such as some species of fish, that depend on sight.
Suspended solids will utimately settle out of the water column, which may cause additional impacts to biota. Sedimen-tation may cover and destroy rooted vegetation, benthic communities and fish spawning sites.
Resuspended pollutants, such as heavy metals, pesticides and other materials, can be toxic to aquatic organisms or, in the case of nutrients, may stimulate algae production.
Wave Activity. Boats and tows produce waves which can accelerate erosion of shore areas including banks. This accounts for a portion of the increase in turbidity and the concentration of suspended solids experienced by a body of water because of navigational use. The majority of impact, though, is
136
restricted to shoreward areas. The con- tribution these waves make to natural erosion processes is a matter of dispute.
The height of waves generated by boats and tows is dependent on boat speed (COE, 1975) and hull configuration. As speed increases, the height of the gen- erated waves increases. Therefore, a fast-moving, small pleasure craft may create higher waves than a slowmoving, large towboat. In wide channels, pools and lakes, waves created by wind may be more significant than those from boats. Concerning hull design, a large inboard displacement type pleasure boat will create a very large bow wave that can be damaging in a narrow channel, yet a tug and log raft will create a scarcely noticeable wake. In general, a planing hull at high speed creates less wake than the same vessel or a displacement hull at low speeds.
The augmentation of turbidity levels and suspended solids concentrations by wave activity from boats and tows can produce greater impacts to biota, as discussed previously.
Wave action may adversely affect emer- gent and wetland vegetation. It can cause erosion of substrates, their physical dislodgement and death.
Shore-dwelling animals such as beaver and muskrat may be adversely impacted by wave wash. Their young would be most vulnerable in their bank dens. Erosion from wave action may also physically destroy lodges and dens. Herpetofauna, dependent on shorelines for breeding, may also be adversely affected.
(c) Waste Discharge. Commercial, industrial and recreational traffic on and along the nation's waterways presents a threat of pollution by waste discharges and
137
bilge pumping. Federal and state regu-lations prohibit the purposeful discharge of waste.
The wastes of concern are such items as kitchen wastes and sewage (Ecological Consultants, 1978). Bilge pumping may contribute petroleum products and a mul-titude of other associated wastes from operation of the vessel and its cargo. Toxic compounds may be present.
Another type of waste from a ship which may affect the environment is heat waste. Larger vessels have power plants for propulsion. The efficiency of such systems does not exceed 35%. Conse-quently, 65% of the energy from the fuel is disposed of as waste, of which much is waste heat. This heat is either released directly into the atmosphere or into the surrounding waters, depending upon the type of system. This may result in significant alteration of water temperatures (COE, 1972).
(d) Spills. Liquid and dry cargoes are carried on and along our nation's water-ways by boats and tows. The release of these substances into the waterways can have an adverse impact on water quality and aquatic biota. Spills have occurred in the past and are certain to occur in the future.
Spillage of biological oxygen-demanding compounds (such as grain or molasses) will usually not have a serious impact because they do not exert high oxygen demands over a short time period. Chem-ical oxygen-demanding substances, such as some chemicals, may have a serious impact because they exert high oxygen demands over a short time period and thereby drastically reduce dissolved oxygen concentrations available to biota. Spills of toxic substances such as petroleum products, fertilizer
I 4
•
(especially anhydrous ammonia), salt and other similar chemicals will usually have the most serious impacts (Ecological Consultants, 1978).
Petroleum has naturally seeped and entered into the waters of the world in significant amounts for eons. Man, though, has increased the entry rate by several orders of magnitude (Robert R. Nathan Associates and Coastal Zone Resources Corp., 1975).
Accidental oil spills can be spectacular events and can attract the most public attention, though they only contribute about 10% to the total amount of oil released into the marine environment. The remaining 90% results from normal operation of oil tankers and other navi-gable vessels, offshore oil drilling and pumping activities, refinery operations and oil-waste material disposal.
The impact of oil in a particular situa-tion depends on many factors, such as 1) the composition and amount of oil; 2) physiography, hydrography, and weather in the region of the spill; 3) biota characteristics and sensitivity; 4) season of the year; and 5) previous exposure to oil. The composition and amount of petroleum plays an important role in its overall impact to the marine environment and biota. Physiography, hydrography and weather determines its spread, trajectory and dispersion. Dif-ferent organisms have different responses to oil, which vary from no effect to death of the organisms. Sen-sitivity also varies according to the time of the year (spawning, migration, etc.). Certain life stages of an orga-nism may have different sensitivities (COE, 1976).
The impact of oil on the biotic com-munity of a region depends on the effect
139

of oil on the individual organisms and the changes that occur in species, popu-lations, communities, and ecosystems as a result of effects on individuals. The least understood and most difficult aspect of the problem is the effect on the higher trophic levels in the food chain. Uncertainty in the spatial and temporal distribution of the biota and uncertainty about community and ecosys-tem dynamics prevent quantitative assessment of the ultimate impacts of spilled oil in any particular region (COE, 1976).
The potential effects of petroleum on individual organisms may be categorized as follows (Moore et al., 1973):
1. immediate (acute) lethal toxicity.
2. sub-lethal disruption of cellular level processes, causing disrup-tion of behavioral patterns (Death may follow, but not immediately and usually indirectly, if at all.).
3. lethal and sub-lethal effects of coating organisms with oil, which does not interfere with organism activities such as respiration, feeding and locomotion.
4. incorporation of hydrocarbons in organism tissue, which may cause tainting, and/or accumulation of high boilingpoint polycyclic aro-matic hydrocarbons in the food chain.
5. alterations in habitats caused by deposition of oil on substrates such as rocks, sand and mud.
The following paragraphs present genera-lizations about the effects of petroleum products on marine and shoreline biota:
140

1. Crude oil damage to marine biota appears to be temporary on super-ficial study. Apparent symptoms tend to disappear in three to six months. Long-term effects have to be observed two or three years later in intertidal and benthic communities.
2. Although minor physical losses of commercially valuable marine plants and fishes may occur over the short-term, long-term impacts can be chronic and disastrous to the populations.
3. Impacts to a trophic level may ultimately be passed to higher levels where it may become more detrimental.
4. Physical contact of petroleum by marine mammals and birds can cause detrimental impacts. Marine bird populations may suffer huge mor-talities from primary and secon-dary complications. Chronic or toxic impacts can affect reproduc-tion by altering bird physiology and survival rates of young.
5. Non-lethal, long-term effects on marine biota are not adequately described and understood.
6. Polynuclear aromatic compounds are the most toxic. They are known to adversely affect the reproduction of marine invertebrates, as well as birds, and the metamorphosis of the larval stage of marine crustaceans.
7. Petroleum may disrupt the complex chemical sensory apparatus in many primitive organisms and thereby will adversely affect their existance.
141

8. Detergents, emulsifiers and sur-factants used as cleanup "cos-metics" after the occurrence of oil spills can also cause significant damage to marine life. Besides their immediate toxic effects, these compounds may result in long-term impacts from their decomposition products and from greater dispension of oil.
9. The effects of spilled oil vary because of the different biologi-cal sensitivities of various types of organisms. For example, gas-tropods are apparently much less subject to acute toxicity than crustaceans; and sessile orga-nisms, such as mussels, are highly subject to effects of coating, whereas fish are not because of their mobility (COE, 1976).
10. Oil reaching the beaches may make them uninhabitable for biota. This impact may be temporary if the amount of oil is not too great. Beach recovery can result from biological and chemical breakdown of the oil combined with wave action. Biota recovery usually takes much longer.
11. The initial effect of oil pollu-tion in an estuary or marsh is the killing of finfish and shellfish larval forms that concentrate here in the spring and summer. The death of marsh plants is a long-term impact. Destruction of the vegetation eliminates the estuary's or marsh's function as a sediment trap and the network of plant roots which holds the mud soil together. The ultimate impact is the rapid erosion of the marsh or estuary.
14.
4
142

The ultimate fate of all oil left in the sea is microbiological degradation. Degradation necessitates a severe oxygen requirement and a supply of nutrients such as nitrogen and phosphorus for the degrading bacteria.
Little information is available on the rate of decomposition, but it is known that no single microbial species com-pletely decomposes any petroleum. Bac-teria are highly specific, and several species are probably necessary to decom-pose the array of hydrocarbons present. Decomposition is a step process and dif-ferent species of bacteria and other microorganisms are probably required to carry the process through these steps (Zobell, 1969). The oxygen requirement of microbial oil decomposition is large,and in areas where previous pol-lution had depleted the oxygen content, oxidation would be slow. Depletion of the water's oxygen content by the decom-posing microorganisms may have harmful secondary ecological effects. Unfortu-nately, the fraction of petroleum most readily decomposed (normal paraffins) is the least toxic. The more toxic fraction is aromatic hydrocarbons, which are not dredged rapidly under natural conditions.
2. Winter Navigation Extension
(a) Impacts to Water Quality and Aquatic Habitats. Winter naviga t ion may increase bank erosion and water turbid-ity over that which occurs during other seasons. If brash or broken ice is pre-sent along the river bank, wave action caused by navigation may force ice frag-ments into the bank,resulting in a "gouging" action which will displace soil. If there is a solid ice cover over the river, other than the channel used for navigation, the force of water movement from the boat or tow would be
14'1
, •
totally under the ice. This would result in force vectors confined at the bank-ice cover interface. The impact of the force vectors would be highly varia-ble and will depend on the location of the vessel in relation to the bank and bottom configuration.
The impacts to biota resulting from tur-bidity increases are discussed in the preceding section on resuspension of sediments from navigation. Impacts may be greater because of the formation of ice on the hulls of boats and tows. This will increase the turbulence cre-ated by passage because of the larger size of the boat or tow, the reduction of distance between the hull and the river bottom and the uneven nature of the ice formation on the hull, and asso-ciated increases of flow resistence.
Impacts of increased erosion of banks are discussed in the preceding section on wave generation from navigation.
Winter navigation would cause naviga-tional impacts to occur all year long instead of restricting it to only three seasons. Without winter navigation, navigable waters may experience a period when the aquatic ecosystem is allowed to recover somewhat from navigational impacts from preceding seasons. It is valid to assume that the number of inci-dents of waste discharge and spills might increase, increasing the impacts to the ecosystem at least proportionally.
When navigating on a frozen river, phys-ical damage to barges and tows, such as punctured hulls and broken seams, is known to occur (COE, 1978). Therefore, winter navigation in colder parts of the nation would increase the probability of spills of cargoes which result in detri-mental impacts to water quality and aquatic biota. In addition, ice
144
coverage would hinder or make impossible clean-up operations.
During the winter months in the colder portions of the nation, cooler water temperatures cause a slower mctabolic rate, reduced nutritional necessities and a general lethargic condition (Ever-hart et al., 1975). The sluggish nature of fish would tend to make them more susceptible to mortality or injury because of their inability to escape the passing vessels and their propellers (COE, 1973).
Some species of fish, such as catfish, congregate in the main channel during cold weather periods. Ranthum (1974) reported catfish to congregate in the deep water areas of the main channel, utilizing these areas as winter sites. During their normal sluggish state, cat-fish could be very vulnerable to damage from navigational activities.
Winter navigation may cause the disper-sal of fish concentrated in the main channel area. Population dispersal could force them into less desirable winter habitat and disrupt population concentrations.
Navigation on a frozen river may add to the amount of flowing ice which will possibly contribute to ice jam formation resulting in rapidly fluctuating water levels. These fluctuations may cause temporary reductions in water flowing into shallow backwater areas. Fish pop-ulations stranded in these areas would be subject to possible winterkill.
(i) Deep-water Ports
The following paragraphs discuss the common types of deep water ports constructed and their associated impacts to water quality and marine life.
145
1. Artificial Island. Construction of artifi-cial islands will cause a temporary and local increase in turbidity. Impacts to biota from an increase in turbidity are discussed in a following subsection, Critical Issue!-Turbidity and Suspended Sediment.
Marine benthic organisms occupying the site of the proposed island and their associated habitat will be destroyed. It may be noted that significant shellfish areas may be destroyed by construction of an artificial island. The potential of the site for production of fin-fish may also be eliminated. In some cases, an artificial island will create suitable finfish habitat where none existed before and thereby will increase the population size. The facade of the island provides substrate, shel-ter and feeding areas when it is composed of rock with holes and irregular surfaces. In some cases, the habitat provided is unlike that of the surrounding areas (COE, 1975).
If dredged material is used for construction of the island, additional impacts resulting from such an activity will occur.
2. Monobuoy Systems. Monobuoys are floating-type structures which have little direct impact on the marine environment (COE, 1975). Anchorage only requires a very small area and therefore the impact to bottom habitat and the associated biota will not be significant. The buoy and anchorage will provide substrate to clinging organisms and finfish may be attracted to the area,but the affect on the marine community will be minimal (COE, 1972).
Temporary local increases in turbidity will result from anchorage of the monobuoy; however, such impacts should be insignificant.
3. Commodity Transport to the Shore. Unless the offshore facility is strictly a transshipping facility, a method of commodity transport from the facility to shore is necessary (COE, 1972). Dry goods are usually trans-ported to shore by a conveyor or trestle of some sort. Liquids (primarily petroleum) will usually be transported through a pipeline.
Trestles and conveyors necessitate structures to support the apparatus above the water surface. Pipelines above the water surface also require such structures.
146

Floating supports will have impacts similar to those dis-cussed for monobuoy systems. Non-floating supports, such as pilings, will destroy bottom habitat and benthic orga-nisms,but will provide additional substrate for coloni- zation by marine organisms. Finfish will be attracted to both types of support.
The construction of a submerged pipeline in open waters will cause the disruption and alteration of water quality. Impacts are similar for those described for dredging, although the problems are usually much less severe because of the smaller area involved and no exten-sive sediment removal is required. The primary impacts to water quality include increases in turbidity and BOD and a decrease in dissolved oxygen, but only in the immediate construction areas and for periods not significantly beyond the construction period.
Bottom habitat and benthic organisms will be directly destroyed or covered over. Highly motile orga-nisms will be displaced to adjacent areas. However, after the pipeline is constructed and covered with soil, marine organisms will recolonize the area.
The impacts to a bay-estuarine system are similar to those stated for open waters, though their magnitude will be much greater because there usually is a higher productivity and greater sensitivity in the bay-estuarine system. Water quality impacts will be more severe prima-rily because of the lower flushing rates found in bays and estuaries.
CRITICAL ISSUE/TURBIDITY AND SUSPENDED SEDIMENT
(a) Definition
Turbidity is a result of the presence of suspended material such as clay, silt, finely divided organic and inorganic matter, plankton, and other microscopic orga-nisms. Collectively these particles interfere with the transmission of light through a liquid medium. Confusion concerning turbidity is a result of the multiplicity of definitions, units of measure, and methods of measurement, many of which are not equivalent or interchangeable (Stern and Stickle, 1978). Differences in measurement are due to the type, shape, and size of the sediment particles, the organic content, and water characteristics (COE, 1975).
147
*
*
Numerous definitions, units of measure, and methods of measurement have been applied to turbidity and suspended material in aquatic environments. Because the concept of turbidity involves optical properties that cannot be cor-related with the weight/volume concentration of suspended material which directly affects an aquatic fauna, the word turbidity should be used only in a qualitative sense (COE, 1975; Stern and Stickle, 1978).
Gravimetric techniques probably represent a more accurate measurement of the effects of suspended solids on the aquatic fauna, while optical measurements may be pref-erable for photosynthetic or aesthetic purposes (Stern and Stickle, 1978).
(b) Origins
Turbidity and suspended material are the results of both natural processes and human activities. Land ero-sion, primarily as a result of agricultural activities, is the greatest cause of turbidity in most lakes, rivers, and estuaries in the United States, with about 500 million short tons of sediment carried into the sea each year (Stern and Stickle, 1978). The resuspension of bottom sediments as a result of wave action, currents, and winds is an important source of turbidity. Additional sources of turbidity include construction, bank erosion, dredging, biological sources (Plankton blooms, red tides, organic detritus and the foraging of aquatic animals), and the discharge and disposal of various wastes,such as dredged materials, industrial wastes, and sewage and sewage sludge.
(c) Impacts
1
ar
f
It is often difficult to assess the effects of tur-bidity and suspended material on aquatic organisms. Other conditions frequently affect aquatic organisms before and during the increase in turbidity and suspended solids, as illustrated by the complex interaction between solids, temperature, and dissolved oxygen on invertebrates and fishes. Laboratory experiments often do not duplicate natural conditions or reflect natural levels of toler-ance. Several investigators have demonstrated that sus-pensions of dredge material that affected organisms in the laboratory produced no detectable changes when encountered
148
in the same concentrations in nature. In other studies, higher concentrations of resuspended natural sediments were required to cause the same effects obtained with sus-pensions of processed mineral solids of known composition, particle size distribution, and organic matter content (Stern and Stickle, 1978).
In addition, most of the literature points out the importance of knowing the source of turbidity. Viewed in this regard, dredging-induced turbidity can be placed in perspective relative to other sources, such as sewage dis-posal, storm runoff, logging operations, road construc-tion, farming and mining. In fact, vessel-generated tur-bidity may be comparable to naturally occuring storm run-off in both magnitude and duration of effect. These remaining sources generally produce chronic turbidity rather than the discrete resuspensions of sediments from dredging operations. In addition, natural phenomena such as wind and waves cause large quantities of sediment to become suspended and remain so for long periods of time, mainly in shallow water. However, the chemical nature of wind-wave suspended sediments is different from dredged sediments, particularly in terms of their oxidation-reduction potential. Dredged sediments are typically more reduced and thus can cause oxygen reductions and influence metal transfer reactions. The abrasion and physical impacts caused by the two types of sediments, however, would be similar (COE, 1975).
Dredging-induced turbidity can be severe in the immed-iate area of operation, and some of the finest particles can be dispersed over considerable distances. However, within a few hours after cessation of dredging or disposal operations, turbidity generally declines to background levels. Therefore, it can usually not be stated that the effects of turbidity found in studies which used exposure times of several days, weeks, or months are the same as the effects of dredging-induced turbidity. Caution must be exercised to relate levels of turbidity and duration of exposure in studies to those that would be expected in the field (COE, 1975).
1. Water Quality. A number of reactions (sorp-tion, precipitation, flocculation, and aggregation) are of ecological importance. ' They function in the absorption,
149
0
transportation, and desorption of heavy and trace metals, pesticides, and nutrients in fresh and estuarine waters.
Metals in proper concentrations are important in the physiology of all living organisms, while excessive concentrations of such metals as mercury, arsenic, and lead can be toxic. The relationship between heavy metals and resuspended bed material is not fully known (Stern and Stickle, 1978). A sudden release of low levels of some trace metals into the water column upon addition of dredged material to sea water has been observed in labora-tory studies. This is followed by a subsequent removal of metals from solution, either gradually, as would often be found in slightly reducing environments, or immediately, under oxidizing environments. The initial release of trace metals is most likely due to the addition of inter-stitial waters, dissolution of the solid phase through complex formation, and release from the exchangeable phase (COE, 1975).
Under oxidizing conditions more copper, cadmium, lead and zinc will be released to the water column than under reducing conditions. However, more iron will be released to the water column under reducing conditions. The release of mercury is not significantly affected by either oxidizing or reducing conditions. At higher salin-ities more cadmium and zinc will be released to the water column under oxidizing conditions and more iron under reducing conditions. The release of lead, mercury, and zinc is not significantly affected by different salinity conditions either under oxidizing or reducing conditions.
2. Nutrients. Laboratory studies have also shown a release of nutrients (nitrogen, phosphate and silica) upon the addition of dredged material to the water column. These studies have shown a sudden release fol-lowed by a slight decrease in nutrient concentration. The highest release of nutrients occurs under reducing con-ditions with agitation. Slightly oxidizing conditions result in a middle level of nutrient release,while oxi-dizing conditions generally have releases at very low con-centration levels. Silty clay sediment releases compara-tively more nutrients than does coarser sediment, mainly due to the finer particle size and higher organic matter content of silty clays.
Nitrogenous compounds are known to be released upon the addition of water-sediment mixtures to the water
4
w
150
column. The amount and form of released compounds are controlled to a large extent by the oxygen concentration of the water mass. Under oxidizing conditions, the organic nitrogen as well as the ammonium ions are oxidized to nitrate and subsequently to nitrate ions. Under anae-robic conditions the Kjeldahl (soluble) nitrogen increases in the water column. Ammonia nitrogen was found to be released a maximum of ten times over ambient levels and organic nitrogen a maximum of five times.
Upon introduction to the water column, phosphate has been observed to be released in large quantities under reducing conditions, especially in organic-rich and sul-fide-rich sediments. The initial release of dissolved phosphate originates from the interstitial waters as well as from sediment with a top layer containing a high con-centration of phosphate. The greatest release of phos-phate occurs in oxygen-deficient waters (COE, 1975).
This release of nutrients can be both beneficial, e.g., by releasing valuable nutrients, and detrimental, e.g., by stimulating biological growth such as algal blooms and red tides (Stern and Stickle, 1978).
Another water quality parameter that is affected by turbidity and suspended material is dissolved oxygen. Most field monitoring studies adjacent to dredging opera-tions have revealed depressions of oxygen content of the receiving waters. These conditions were usually found only near the bottom near the point of discharge and were of short duration as a result of rapid mixing of dredging and disposal site water with the surrounding water (Stern and Stickle, 1978). Slotta et al. (1974) feel that oxy-gen depletion caused by dredging-induced suspended sedi-ment is not a problem under most estuarine conditions.
Pesticides are sorbed and desorbed by both or-ganic and inorganic suspended sediments, with the clay mineral content being one of the more important inorganic constituents (Stern and Stickle, 1978).
Another pollutant that can be released by dis-turbing the bottom sediments is sulfide (Slotta et al., 1974; Smith et al., 1976).
3. Primary Production. Numerous studies have examined the effects of turbidity and suspended material on the development of phytoplankton populations. The most
151

A
-I
'*
•
frequently cited negative aspect is the reduced photo-synthetic activity due to the interference of light pene-tration. In certain nutrient-limited environments, the addition of suspended material may stimulate photo-synthesis by increasing the available nutrients (Stern and Stickle, 1978), however, in the generally nutrient-rich coastal and freshwater environments of the south and southwest, this nutrient loading would cause additional water quality problems.
Zooplankton populations can be affected by dredging in several ways. Suspended sediments can cover eggs, reducing their viability, or impair the normal development of larvae, or interfere with feeding mecha-nisms. Several studies have shown that suspension feeders (most crustaceans) will ingest less food when the water contains too much suspended material which gets mixed in with their food.
Continuous long-term impairment of eggs, larvae or adult zooplankton or reduction of light penetration could result in reduced production in the locality affected. Short-term high levels of severe turbidity in the water column will generally have little impact on the overall population sizes (COE, 1975).
4. Selected Phyla of Invertebrates (Stern and Stickle, 1978). Relatively few studies relate animal responses to the actual weight per volume concentration of particles in suspension; rather, they correlate response with turbidity even though it is unlikely that the light absorbing and scattering properties of suspended particles directly affect animals. The effects of turbidity and suspended material on aquatic invertebrates have been studied in the field and in the laboratory using both natural and processed sediments. However, most of this research has concentrated on a relatively few commercially important species.
Among members of the phylum Coelenterata, the corals have been the most extensively studied. Large con-centrations of suspended material and increased turbidity are usually detrimental to coral reefs through the inter-ference of feeding activities of the coral polyps and the reduction of the light available to the symbiotic coral-line algae. Using ciliary action, some species of coral
152
are capable of removing suspended material from their sur-faces. In general, the tolerance to turbidity and sus-pended material is apparently quite variable with the reefs in some turbid waters differing ecologically and structurally from the ones in clearer water.
Many species of the phylum Mollusca, particularly the members of the class Bivalvia (clams, oysters, mus-sels) are filter feeders and play an important role in reducing turbidity by removing suspended materials from the water column. Because bivalves are more or less sta-tionary, they frequently respond to increased levels of turbidity and suspended sediment by tightly sealing their valves. Thus they may survive adverse conditions for several days by avoiding direct contact with the sur-rounding water.
As filter feeders, bivalves are susceptible to the mechanical and abrasive action of suspended sedi-ments. With increased concentrations of suspended solids there is frequently a reduction in pumping rate, clogging of the animal's filtering apparatus, and a subsequent reduction in growth rate. However, when the flow of tur-bid water is replaced by regular sea water, normal pumping rates usually resume.
The effects of turbidity-producing materials on the development and growth of bivalve eggs and larvae are usually directly related to the concentration. Although some clam eggs will develop normally in concentrations of clay, fuller's earth, and chalk up to 4mg/1, the per-centage developing normally decreases as the concentration increases.
Among members of the phylum Arthropoda, the most closely studied species have been those in the class Crustacea (crabs, lobsters, shrimp, barnacles). The effects of turbidity and suspended sediments on the species of crustaceans studied to date are highly varia-ble. For several species of adult copepods, suspensions of fuller's earth, silica sand, and natural sediments in combination with suspensions of phytoplankton caused reductions in feeding rates because the zooplanktons were unable to feed selectively. Suspended sediment concen-trations also reduced the ability to molt through various larval stages.
5. Fish. Turbidity and suspended material affects fish directly and indirectly.
153

Recent data, based upon weight/volume concen-trations of suspended solids from several closely moni-tored laboratory studies, are probably more indicative of the natural responses of adult fish to suspended solids. The results of these studies have indicated the fol-lowing: adult fishes as well as invertebrates are affected by a complex interaction between suspended solids, temperature, and dissolved oxygen; although the lethal concentration to which 10% of the individuals will be killed (LC10) is known, it is not possible to predict the magnitude of the LC20, LC50, etc.; a correlation exists between normal habitat and sensitivity to suspended solids; high suspended solids concentrations would be less harmful in winter than in summer, and fishes as a group are more sensitive to suspended solids than many of the invertebrates studied to date (Stern and Stickle, 1978).
The extent of interference is dependent upon the type of gills or filtering apparatus used. Plankton feed-ing fish characteristically have long, thin gill rakers which are easily clogged by sediment particles. Bottom-dwelling fish are more adapted to turbid conditions and do not possess gill modifications- However, most any type of gill can become covered with silt, impeding the passage of oxygen to the fish and preventing normal loss of waste material from the gill surface. Gill tissue may also become thickened from long exposure to high turbidity.
Lack of sufficient oxygen is the major result of the impairment of the flow of water across the gills of fish, and this can result in mortality. Lack of oxygen is less critical for bottom invertebrate filter feeders, but loss of efficiency in feeding can cause stress and perhaps mortality (COE, 1975).
Because bacteria can exist on suspended particles and because sediments are sometimes polluted from sewage outfalls, increased concentrations of sediment in close proximity to organisms increases the chance of disease or poisoning. This becomes apparent in various types of fin rot and fungus diseases on fish exposed to abnormally high turbidities. High turbidity can also interfere with the mucous coating which protects the skin of fishes from invasion of pathogens. Absorption of pollutants from the surfaces of suspended particles can result in stress and toxic poisoning. Sediments frequently contain high levels of heavy metals, pesticides or petroleum hydrocarbons.
154

Fish and other organisms can be negatively affected by too long an exposure to water highly turbid with polluted sed-iments (COE, 1975).
Sherk (1971, 1972) pointed out that the response of fishes may not be due to suspended solids concen-tration, but perhaps to the number of particles in sus-pension, their densities, size distribution, shape, and minerology; the presence of organic matter and its form; metallic oxide coatings; and the sorptive properties of the particles. These properties can be as important as actual turbidities.
Sherk et al. (1974) found that small estuarine fish were more susceptible to suspended solids than were larger fish of the same species. The authors speculated that the smaller gill openings of juveniles may have become clogged with sediment at the same time that their higher metabolic rate demanded more oxygen than adults required, resulting in the greater sensitivity of juveniles.
Perhaps the greatest impact on fishery resources attributable to turbidity and suspended sediment is decreased reproduction. Numerous studies have indicated that the release of suspended sediment and high turbidity levels adversely impact the spawning success and larva development of anadromous and indigenous fish species. The information on adult fish species is very academic, and does not reflect the actual conditions in the field. Under field conditions, species that cannot withstand high turbidity levels usually avoid such areas successfully. Furthermore, temporarily high sediment levels which cause fish kills under laboratory conditions are typically 10 to 20 times greater in concentration than those that occur over a significant area during maintenance dredging opera-tions. Fisheries studies conducted by Stickney (1972, funded by Savannah District) on the impacts of maintenance dredging on fish and shellfish in the Savannah River estuarine areas found that certain species of fish and shrimp naturally concentrated in the dredging areas to feed.
Other impact mechanisms are reduction in visi-bility and subsequent hindrance of schooling or predatory behavior (COE, 1975).
155
•
•
6. Bioaccumulation. Release of sediment associated heavy metals and their uptake into organism tissues has been found to be the exception rather than the rule. Results demonstrate there is little or no corre-lation between bulk analysis of sediments for heavy metals content and their environmental impact.
Oil and grease residues, like heavy metals, appear tightly bound to sediment particles, and there appears to be minimal uptake of the residues into organism tissues. Of the thousands of chemicals constituting the oil and grease fraction, very few can be considered to be significant threats to aquatic life (Hirsh et al., 1978).
Organisms that are known to accumulate certain elements are shown in Table 111-3. It should be noted that animals vary in their uptake potential and tolerance with species, age, reproductive condition and physiolo-gical condition. There is also great variation in uptake mechanisms and sensitivity to the various contaminants. For instance, copper (Cu) and zinc (Zn) are essential micro-nutrients Which are required at low levels and become toxic only when much higher concentrations are accumulated in the tissues. This is especially true of Cu in crustaceans, where it is essential to the oxygen-carrying capacity of the blood. Some metals, such as iron (Fe) and manganese (Mn) are not toxic even at very high tissue concentrations, and their bioaccumulation can- not be considered to have any ecological significance except in rare cases of extreme concentrations. Others, such as Cadmium (Cd) and Mercury (Hg), have no known micronutrient function, and although they may be found at low levels even in animals from pristine environments, their bio accumulation must be regarded as potentially hazardous. The chlorinated hydrocarbons similarly serve no useful function and must be viewed as potentially hazardous when bioaccumulated, even though very low levels may be tolerated by some life stages with no apparent ill effects (Peddicord & McFarland, 1978).
Since the ecological significance of a particular tissue concentration of a specific constituent in a given species can be determined in very few cases, bioaccumu-lation data must be interpreted on the basis of tissue concentrations of exposed animals relative to concen-trations in control animals of the same species. In using this approach, it is critical to recognize the possibility
156

Table 111-3
Bioaccumulation: Elements and Organisms
ELEMENT ACCUMULATOR ORGANISMS
Arsenic Brown algae; coelenterates
Boron Brown algae; sponges
Bromine Brown algae; sponges; coelenterates; echinoderms: molluscs; vertebrates
Chlorine Soft coelenterates
Copper Annelids; arthropods; most molluscs
Iron Bacteria; plankton
Iodine Diatoms; brown algae; sponges; coelenterates; marine annelids
Manganese Crustaceans
Sodium Soft coelenterates
Silicon Diatoms; some protozoa and sponges
Strontium Accumulated in preference to calcium by brown algae
Vanadium Some ascidians
Zinc Coelenterates
NOTE: All organisms accumulate carbon, hydrogen, nitrogen, phosphorous and sulfur.
SOURCE: COE (1975). After Bowen, H.J.M., 1966. Trace Elements in Biochemistry, Acad. press, N.Y.
157
that even the control animals before the test is begun could have undesirably high tissue burden, or conversely, that even the highest concentration found in the exposed animals at the end of the test might not be sufficient to cause any biological impact (Peddicord & McFarland, 1978).
SUMMARY
If it were entirely plausible to rank the various waterway activities according to significance and com-plexity of impact, such a ranking, with notation as to where in the preceding text they appear, would be as follows:
- Dam Construction and Operation.
- Dikes and Channelization.
- Dredged Material Disposal.
- Maintenance Dredging.
- General Navigation.
It may be noted with some assurance that the major long-term impact to both water quality and aquatic habitat results from the construction of dams and dikes and chan-nelization. The activities associated with dam con-struction involve clearing large areas, oftentimes forest-land, to permit location of batch plants, location of roadways to facilitate the movement of vehicles and the setting aside of certain areas as waste storage sites. It may be noted that although these activities are terres-trial in nature, they function as the primary source of sediment which is carried into the water body by surface runoff. The actual construction of dam, spillway, dike and downstream portals yields great amounts of sediment and subsequent turbidity, while the inundation of areas upstream creates greater aquatic habitat at the sacrifice of equally significant terrestrial habitat. While the impacts associated with individual activities may be miti-gated, the overall impact is significant and major.
Channelization has been shown to effect long-term physical changes in the water chemistry, such as increased temperature and turbidity, which may also efect long-term impacts to habitat.
158
Concerning dredging and subaqueous dredged disposal, although they represent a major, recurrent activity necessary to the preservation of open-channel navigation, their combined impacts to water quality generally are of a short-term duration and, with the exception of dredging in areas where extensive industrial dumping has occurred, account for relatively small amounts of resuspended toxic wastes. The impacts on aquatic habitat are well noted, and in many cases, the dredged or dredged material dis-posal area is able to recover and firmly reestablish it-self with the same or similar ecological community. The impacts may be long-term however, in those areas where dredging or disposal is so frequent that the area becomes disturbed too often to allow thorough recolonization. In addition, most maintenance dredging and disposal causes disruption to already fragile environments (marsh, estua-ries, and river mouths) which are important as nursery areas and migration routes for inland and offshore fisheries. The impacts associated with non-aqueous dis-posal of dredged material will be presented in the following section on terrestrial habitat impacts.
In general, the range of impacts to water quality include short-term increases in turbidity, suspended solids and dissolved solids and short-term decrease in dissolved oxygen. From such actions as channelization, longer term increases in turbidity and decreases in temperature may be anticipated. In turn, these short-term effects do not severely impact aquatic biota unless they persevere and, hence, significantly alter the aquatic hab-itat. Dam construction and channelization are such acti-vities that are phased over a considerable length of time and may have significant water quality impacts.
The range of waterways' impacts to aquatic biota are primarily short-term disruption and/or localized destruc-tion either at the construction or dredging site. Long-term impacts may result if rare or endangered species are present but undetected and if dredging and/or disposal activities are extremely frequent. The major impact from general waterways navigation typically results from cargo loss in the form of spillage. Spills, especially petro-leum and other organic chemicals, represent the major long-term impacts to water quality and aquatic organisms. Certain chemicals, notably PCB, certain heavy metals, and phenols have been documented to maintain their toxicity
159

•
4
over extremely long time periods and, furthermore, to accumulate in the tissues of aquatic organisms.
In short, with the exception of discrete activities such as dam construction and spillage, overall impacts to water quality and aquatic habitat do not appear to be major nor irreversible. Furthermore, mitigation is avail-able for many of the impacts associated with major con-struction, and contingency plans either have been or should be developed to enable quick and efficient reaction and cleanup of spillage.
I
160

B. TERRESTRIAL HABITAT IMPACTS
This section report identifies the impacts to terres-trial habitats associated with the construction, mainte-nance and operation of the national waterways system.
In the subsection, Overview of Terrestrial Habitats, a general discussion presents the types of terrestrial up-land and wetland habitats found along riverine and coastal waterways and indicates their nature, sensitivities and characteristics. This second subsection is a detailed presentation of the types of impacts associated with waterways activity and their significance in regard to the terrestrial ecosystem. This section includes the con-struction, operation (i.e., post-construction) and main-tenance impacts of dredged material disposal and dams. The third section adheres to the same type of format and presents "Other Waterways Impacts," including channe-lization, navigation, shore protection structures, flood protection structures and floodways.
A later subsection presents mitigation techniques whereby general impacts to the terrestrial ecosystem may be lessened. A discussion of "Alternative Uses of Dredged Material as Mitigation" follows and presents such measures as habitat development, surface mine reclamation and agri-cultural land enhancement through the use of dredged material.
The final subsection presents a summary of the various impacts presented above and discusses their significance in relation to the continued use and maintenance of the waterways system.
OVERVIEW OF TERRESTRIAL HABITATS
The following discussion presents the major habitat and ecological systems encountered in both the upland and wetland environments.
161
*
(a) Uplands
Historically there have been numerous attempts at developing a systematic classification of ecological areas which could serve to include both plants and animals. The approach utilized for the purpose of this report is that of biomes. This concept assumes that plant formations of a specific type function as the biotic units and that ter-restrial organisms are secondarily associated with these various plant-types. Each broad natural biotic unit is called a biome. Each biome is an ecological formation considered in terms of both plants and animals and identi-fied in terms of characteristic vegetation forms of its fully developed or "climax" state. It may be noted that in attaining the climax community, an ecological area may pass through many interim seral or non-climax community stages.
These major biomes, in turn, may be grouped to repre-sent six general community types: deserts, grasslands, shrublands forests,tundras, and arctic/alpine. The fol-lowing presents a synopsis of each of these types, a brief discussion of their general characteristics and an indi-cation of the general COE Division where such communities are the major habitat. No discussions of deserts or shrublands are presented as these types of habitat area are generally exclusive of navigable waters. Furthermore, tundras and arctic/alpine have been combined to simplify presentation since these forms are found primarily in Alaska.
1. Grasslands. Typical grassland areas all have in common a climate characterized by high rates of evapo-ration and periodic severe droughts, a rolling to flat terrain and animal life dominated by grazing and burrowing species. Grasslands notably have a complex root system often reaching many feet into the ground. Activities which destroy this root system are primarily responsible for greatly increased erosion and vanishing grassland communities.
Eastern grasslands are either cultivated or seral with the former being more rank and dense and usually requiring management to maintain, such as the mowing of hay, etc. Seral grasslands contain a mixture of intro-duced and native grasses, which typically tolerate low
162
soil fertility. These grasses are primarily found random-ly scattered within the eastern forest region corresponding to the North Central, New England, North Atlantic, Ohio River and South Atlantic Divisions.
Mixed prairies are typical of the Great Plains and are dominant throughtout the Missouri River and nor-thern Southwestern Divisions. The remainder of the North-western Division is characterized by arid to semi-arid desert grassland.
2. Forests. The forestlands of North America are primarily deciduous or coniferous, the type dependent upon elevation, temperature and rainfall. The following forest ecosystems are represented:
(a) Temperate Evergreen Forest. This type of forest is restricted to the warm maritime climate and is best represented along the Gulf coast, Florida Keys and Everglades area. The dominant species are the live oaks, magnolias, palms and bromeliads.
(b) Temperate Deciduous Forest. This is the major forest land of the eastern United States; however, it is actually composed of several forest types that intergrade into one another. The northern segment of the deciduous forest complex is the hemlock, white pine-northern hardwoods forest, which occupies the North Atlantic, Ohio River, southern North Central and northern South Atlantic Divisions. The beech-sugar maple forest, growing on relatively flat, glaciated soils, extends from southern Indiana and central Minnesota, east to western New York. The sugar maple-bass-wood forest extends south from Wisconsin to northern Missouri. South of this is the extensive central hardwood forest. This forest is marked by three areal types: the Appalachia forest, dominated by yellow pine and perhaps the most mag-nificent forest; xeric forests growing on southern slopes and drier mountains and dominated by the oak forest; and the western edge of the central forest in
163
the Ozarks and along the Prairie River Systems, dominated by oak and hickory. The southern pine forests of the coastal plains of the South Atlantic and Gulf states are included in this temperate habitat because they represent a seral and not a final stage of succession. Ultimate habitat here would be oak, hickory and magnolia.
(c) Northern Coniferous Forest. This type of forestland habitat is found through New England, northern New York, westward along southern Canada and southward through the Rocky and Sierra Mountains. Pines dominate about the Great Lakes with red spruce and Frazier fir domi-nating the coastal areas of the New England Division.
(d) Temperate Rain Forest. This is the major forest habitat of the North Paci-fic Division and is dominated by western hemlock, red cedar, and Douglas fir along the coastal reaches. Inland are found increased pine varieties and red-
1 woods. Also found are the aspens which, although deciduous are heavily depended upon by the wildlife of the Pacific Northwest.
3. Tundra/Arctic/Alpine. This habitat is found primarily north of the coniferous forest belt and, for the purposes of this study, extends primarily into Alaska. The tundra is characterized by low temperatures, a short growing season, low precipitation and the existence of a permafrost layer. It is due to this layer that the tundra habitat is among the most sensitive in the world. Disrup-tion to the tundra environment is particularly critical in that great periods of time are required for this habitat to recover, allowing lichen and moss species to reestablish themselves.
(b) Wetlands
Wetlands comprise an environment which exhibits char-acteristics of both aquatic and terrestrial habitats. The
164
impacts to wetlands from waterways activities are pre-sented in this report as it is felt that these activities affect terrestrial and wetland habitats in a similar manner.
Wetlands are essentially lentic in nature, corre-sponding to a still-water habitat (see previous section, Water Quality and Aquatic Habitat, for detailed discussion of lentic habitats). They are located primarily along the shallow margins of lakes and ponds and in low, poorly drained lands where water stands for several months of the year. Generally, wetland areas are saturated particularly early fall, the substrate may be exposed, a condition necessary for the germination of many wetland plants. The three major categories of wetlands are marshes, swamps, and bogs. A classification of wetlands is presented in Figures III-4a, b, c, d, and e. These figures indicate the various types of freshwater and saltwater (saline) wetlands and provides some insight as to their coastal or inland location.
1. Marsh. Marshes are wetlands in which the dominant vegetation consists of rushes, sedges, grasses, and, sometimes, cattails, essentially constituting a wet prairie or grassland. Marsh vegetation is restricted to plants that can tolerate submerged or waterlogged organic soil and that form firm mats or tussocks in the ooze. Marshes vary in depth considerably but the maximum allow-able depth for emergent vegetation is about 3 feet. Plant life is abundant and varied and irreplaceable habitat is provided for wildfowl (ducks and geese) and marsh mammals such as the muskrat.
Important freshwater, brackish and saline marshes are found along tidal rivers, sounds and deltas throughout the North Atlantic and South Atlantic Divisions and along the Great Lakes area of the North Central Division.
2. Swamp. Swamps are wooded wetlands often representing a successional step from marsh to mesic forestland.
Deepwater swamps occur extensively on the flood-plains of the larger southern river systems, especially in the Mississippi River drainage system and on the uplands of the coastal plain. They are dominated by baldcypress, pondcypress, tupelgum and swamp blackgrum, and sometimes
165
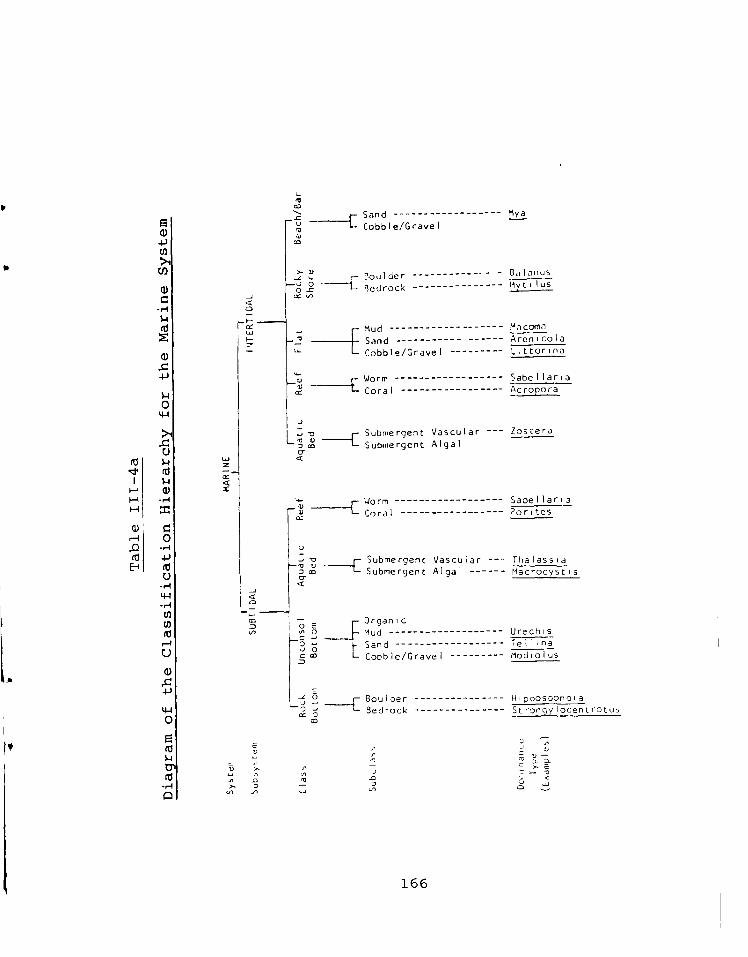
Table III-4a
ram of the Class
ific
atio
n Hie
rarchy for the Marine Syste
m
411
Submergent Vascular --- Zostera
Submergent Algal
I "2 L
CO
C Wcprm Coral cc
Saoellaria
Pori tes
Mya Sand ------
r-1 Cobble/Gravel
CO
>... 0.1 Balanus ...e ,.. r Boulder --u o
o _c I-- Bedrock Mytilus
a _
■ I— K W y [ Mud Macoma
■-- —2 Sand Arenicola = Cobble/Gravel littorina
,.._
--% F Worm Sabellaria
cc 1-- Coral Acropora
Ui
—
cc
Submergent Vascular --- Thalassia
Submergent Algal Macrocystis
— Organic
— Mud Urechis
Sand Tellina
— Cobble/Gravel Mocholus
Hipposooncila
Strongylocentrotus
I/
= n 13 '7' 2 -a _ ......
I)>, n , a ..,
_
_0 _ m
cr.
Y 7 CO
Q
O E 0
'Jo C M
o Li
cc o
✓ Boulder L Bedrock
-
166
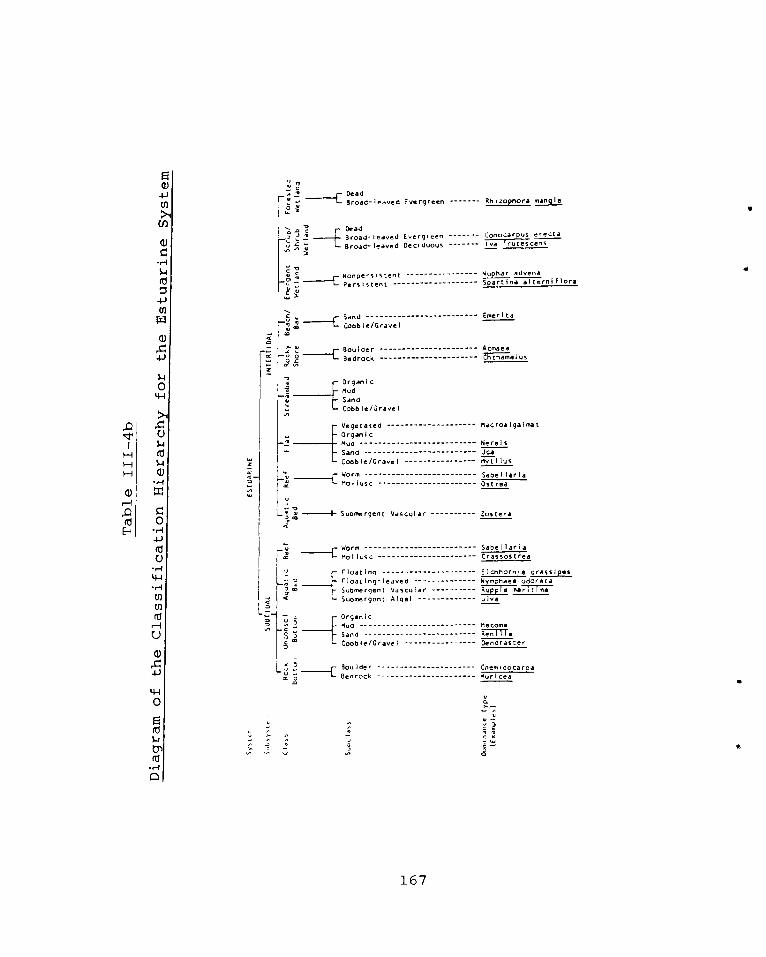
Table
III-
4b
4-) co
$-1
r=1 a)
4-)
0 44
C)
ro
x
4-)
44
En
C)
(1)
44 0
$4 tn
121
___,
INTE
RT
I DAL
'A
..
-
i i <
Dead Broad-leaved Evergreen Broad-leaved Deciduous
Nonpersistent
- -----C Pe rs I scent -- g
Sand Cobb le/Gravel
Boulder Bedrock F Or
Conocarpus erecta Iva frucescens
"d ye" Spartlna alternifiora
EmerIta
Acmaea Chthamalus
11 1
- -
- vs m'
7 [ Organic 1 Mud u Sand , Cobble/Gravel
,:-...
[ Vegetated Macroalgalmat
..4 Organic
.2 Mud Marais a. h Sand Oca —_—
Cobble/Gravel MVtilus
Worm -- Mollusc
o Suomergent Vascular as
r kt. --c tn-i7.5c
Sabel aria
Crassostrea
—floating Eichhornla crasslpei — Floating-leaved Nvmphaea odorata — Submergent Vascular ------
Submergent Algal Ulva
Sabellarla Ostrea
Zostera
3 5
Organic Mud Sand
•3 Cobble/Gravel
L - Boulder Bedrock CC 3
Macoma ReM-717. Dendraster
Cnemidocarpa muricea
1
CE "I .9 C 9 = a c
'1; 7 Fo'z Opee ad rod- leaved Evergreen Rhizophora ntalls
167
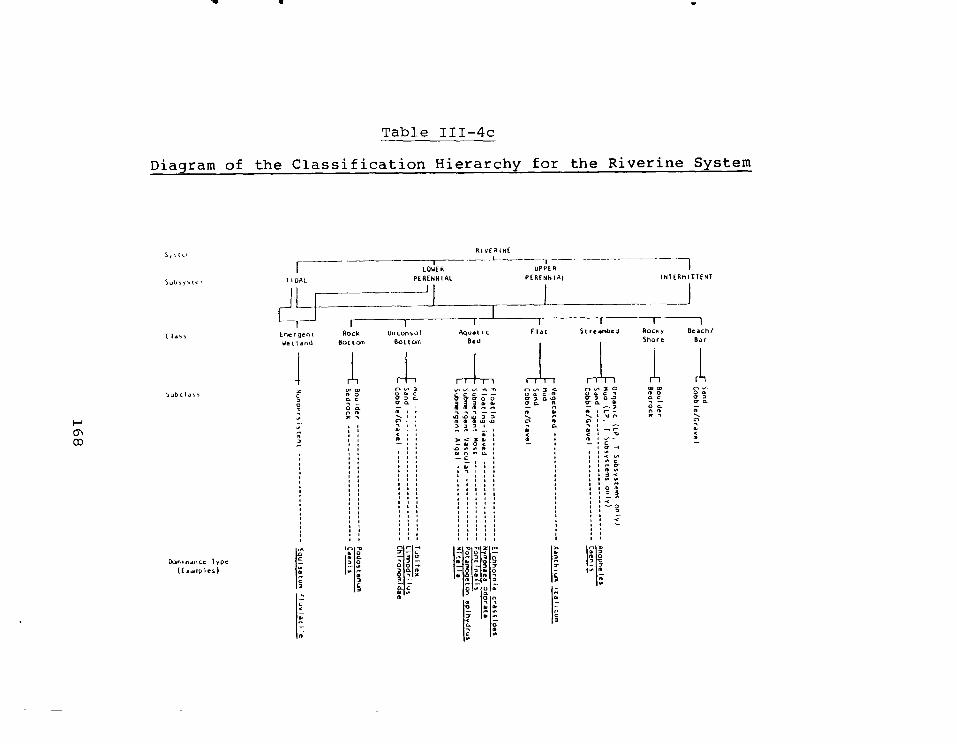
Subsysteo.
Class
a 0 0
C 0 2 0 12
0 f1 n
•
Cr -I
U 2 7 .
a I -
r , 3-0
o
S;
-0*
0 0 3
Dominance Type
lEkampIes)
11,,
,,,,ni
4 Z7-57176; rn -cr
wnly
luey
yr
3 a
..0%f 02
3 0 •
0 w
On
tt
1 3
E; :
Table III-4c
Diagram of the Classification Hierarchy for the Riverine System
RIVERINE F LOWER UPPER
I --1 I
TIDAL PERENNIAL PERENNIAL INTERMITTENT
i_J I 1 1 1 1 I
____...1 1 r 1 1 1 1 1 1
Emergent Rock Unconsol Aquatic Flat Streambed Rocky Beach/
Wetland Bottom Bottom Bed Shore Bar
ril I 1 I III I fl l I T—I-1fl I I ., .." . ...
ErS-FrEE eg-tE2 .. a c a — 0
n 4 a i 4 0
a 0.
0D „
o.
I 1 I 3
0 C
gg' .. 3
41 3 3
—40C
0
Goa-
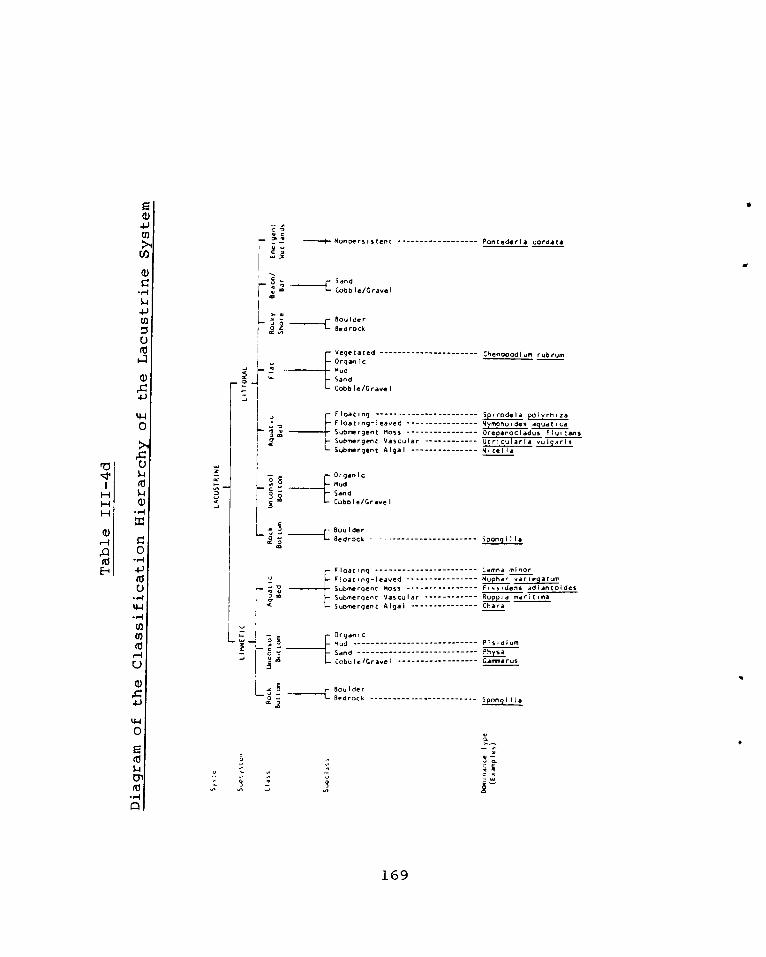
t he Lacustrine System
Table III-4d
4-1 0
4 ,
CD
0
(1:1
- '-I 4-1
ui
a) 4)
4-1 0
E
$.4
•-1
nonoersistent ;
Sand
Cobble/Gravel
-E Boulder
2 5, Bedrock
Pontederla cordata
Chenopodlum rub run
-Floating Spirodelaoli,yjhizao - Floating-leaved Nymphoides lautiLa
Submergent Moss Orepanocladus FluitanS - Submergent Vascular -- ------ UtricularIa vulgaris - Submergent Algal Mitella
7 [ Organic
, 8 ..C. _
Mud
Sand 9 a
1 S
Cobble/Gravel
L- -.'z.. ! 12 . 0
Float , r9 Lemna minor
- Floating-leaved '1'29211: vartegaturn
Supine rgent Moss Fissidens adlantoides
- Submergent Vascular Rupola cant ma
- Submergent Algal Chara
Organic
Mud
Sand
Cobble/Gravel
, Boulder
Bedrock
- -
12222122a
5: 3 — 8 u a
8
g
Plsidlum
F.L11.11 Gammarus
Spongilia
- Vegetated ---
- Organic
Mud
- Sand
- Cobble/Gravel
169

f the Palustr
ine Syste
m
Table III-4e
ram of the Classif
ication Hie
rarch
H
-1)
7
L C • M
u 7 a)
• C — "
2 w w
O
•
0 - m
w r
Lfl
Li
PA
LUS
TR
I NE
L o • 03
Q
• 1ff,
c,̀?
7 , A
A
- Dead - Need1 , -leaved Evergre , -n ri(oa mori,ina
- Bro.1,1-1 , ,ived Evergreen -- -- - Needle-ledved Deciduous --- rix(,dium distichium
- Broad - leaved Deciduous Acer rubrum
- Dead - Needle-leaved Evergreen --- Chamaecypar , s thyotcles
- Broad-leaved Evergreen ---- Leucothoe axillaris
- Needle-leaved Deciduous --- Larix laricina - Broad-leaved Deciduous Alnus rugosa
j- Nonpersistent Peltandra virginica L Persistent Typha latilolia
r Lichen Moss -
Eleocharis acicularis
- Floating Salvinia rotundifolia - Floating-leaved Brasenia schreberi
Submergent Moss Fissidens julianus - Submergent Vascular Ceratophyllum demersum
Submergent Algal Nitella
- Organic - Mud - Sand - Cobble/Gravel
_z F BOUidOr I- Bedrock
m 0
V 2
V V O a- • E 1,0) c X - w = 5
- Vegetated --- - Organic Mud
- Sand - Cobble/Gravel
Chironomus Gammarus
Cladonia Sphagnum
7
170

have few herbaceous plants, except epiphytes. Shallow-water swamps range from shrubby willows and alders to oaks and maples and are found throughout the continental United States.
An outstanding characteristic of shallow-waterswamps is the uneven elevation of the land, resul-ting in a series of depressions and rises created by fal-len logs and upturned roots. This allows for a marked differentiation of microclimates and associated biota.
Major swamp areas are located throughout the South Atlantic, Southern North Atlantic and Lower Missis-sippi Valley Divisions.
3. Bogs. Bogs are freshwater wetlands most com-mon in the northeastern and north central states. Bogs usually develop where drainage is blocked; all have cushionlike vegetation and all have an accumulation of peat. Most bogs, at some time, have a marginal, semi-floating mat of vegetation, usually sphagnum moss and heaths. Bogs, especially those associated with sphagnum moss, are highly acidic and create a uniquely specialized environment.
(c) Riparian Habitats
Riparian habitats are those areas located along the banks of a natural watercourse, lake or tidewater. Typi-cally this area may refer to the intertidal area delineated by the movement of high and low tides (McConnaughey, 1974). Depending upon the type of defini-tion referenced, the distinction between riparian and wet-land habitats becomes somewhat vague since most wetland areas ajoining waterbodies include riparian habitats as well. However, riparian habitats are not exclusive to wetlands areas and exist wherever water bodies are present.
For the purpose of this report, riparian habitats are collectively grouped as being impacted by waterways acti-vities in the same manner as wetlands. It may be noted, however, that the riparian habitats as defined by an intertidal or littoral area are further addressed in the preceding report, Water Quality and Aquatic Habitat Impacts.
171
DREDGED MATERIAL DISPOSAL IMPACTS
(a) Construction
This category of impacts arises from the deposition of dredged material which has been removed from a riverline environment as an act of waterways construction. It may be generated as construction waste material associated with the dredging of new waterway channels or exist as waste from other construction activities. The impacts of its disposal, however, are similar to those of maintenance dredged material disposal. Since the major portion of dredged material is generated from maintenance dredging, the impacts associated with such activity are fully dis-cussed in the following presentation of Maintenance Impacts.
(b) Maintenance
In order to maintain minimum depths necessary to allow navigation activity in our nation's rivers, ports and coastal waters, the COE is involved in an intensive dred-ging program. This program is directed at the removal of the over 350 million cubic yards of sediment that becomes deposited in the waterways annually. The following dis-cussion presents the impacts to the terrestrial environ-ment that result from the on-land deposition of this dredged material. These impacts include alteration of existing habitat, creation of new habitat, wildlife dis-placement loss, loss of water surface in wetlands area, toxicity of the dredged material and aesthetic alteration.
1. Alteration of Habitat.
(a) Uplands. The disposal of dredged material may permanently cover and destroy existing vegetation cover (COE, 1973). Breakage of plant stems and coverage of leaf surfaces such that photosynthesis may not occur essentially results in the destruction of such growth (COE, 1975). Although natural revegetation will occur with time, the extent and type of foliage may vary somewhat from the existing. The time required for natural revegetation is
172
dependent upon the composition of the dredged material, frequency of disposal activities and general fragility of the affected ecosystem.
If terrestrial animals use the vegeta-tion along the shoreline as a habitat for feeding or for cover, then a com-ponent of the wildlife community will be adversely affected by the destruction of shoreline vegetation due to dredged material disposal. The vegetation which is covered will no longer provide a suitable habitat for terrestrial ani-mals. This will result in a reduction in the numbers of terrestrial animals in the immediate area since these animals will move to adjacent areas with more suitable habitats However, animals will eventually be eliminated from the system due to competition for food and habitat (COE, 1975).
Deposition of dredged material along shorelines does not only destroy shore-line vegetation but it also alters the configuration of the shoreline. This is important, particularly for semiaquatic species which move back and forth from the land to the water. Amphibians and reptiles are examples of species which typically behave in this manner. An area of shoreline may be very suitable for this migration to and from the water due to its physical characteristics and accessibility. However, the deposition of dredged material may change the shoreline configuration such that it is no longer suitable or accessible for semi-aquatic faunal migrations.
It may be noted that the significance of habitat alteration is proportional to the uniqueness of such habitat. The overriding issue is the ratio of the area affected compared with the total area of similar physical, chemical, and biological constitution.
173

(b) Wetlands. Disposal of material on wet-lands usually results in more signifi-cant impacts to habitat due largely to the sensitivity of this ecosystem to change. The disposal of material may permanently cover and destroy wetland and intertidal mudflats, and will raise subaerial areas above their previous levels, with resultant changes in drainage, salt intrusion, water tables, etc. Wetlands and mudflat organisms and the birds and wildlife which feed on them may be lost or displaced. New ter-restrial habitats will be formed and, presumably, colonized by an assemblage of organisms appropriate to the situa-tion. Finally, the area and topography of the wetland or intertidal shoreline will be modified and made more or less extensive, with resultant changes in the contribution to the system made by the communities associated with these types of areas.
As benthic wetland organisms are covered with dredged material they will either migrate or succumb to smothering. Most will be unable to move with sufficient alacrity to avoid being smothered. The impact of this loss will be felt by waterfowl which feed upon these orga-nisms. The overall impact will be in proportion to the ratio of the affected area to the total of all such areas in the ecosystem.
The creation of new habitats may have positive effects on the ecosystem. In many cases, new bird nesting areas and/or wetlands may be created. This must, of course, be balanced against the destruction of feeding grounds in smothered wetland or tidal areas. Con-cerning tidal areas, it is possible that new habitats can be created that may not only maintain an existing tidal area but may enhance and increase this area. This relationship of land and tidal area might be made beneficial if dredge
174

material were used to create many small islands bordered by shallow tidal mud rather than to fill shoreline areas with straight line tidal borders.
A more detailed description of habitat development is presented in a subsequent subsection of this report Alternative Uses of Dredged Material as Mitigation.
2. Wildlife Displacement. For a detailed description concerning this type of impact, see the fol-lowing subsection on dams.
3. Loss of Water Surface in Wetlands. Disposal activities may result in subaerial areas being filled and becoming terrestrial in nature. Extensive modifications of the water surface of a wetlands area can have effects as far reaching as changing the weather. This, in turn, could affect the biology of the area in profound and nearly unpredictable ways. Less extensive loss of water surface could be expected to have impacts on wetland orga-nisms such as mollusks and crustaceans, as well as on resting areas for waterfowl and migratory birds. The loss of water surface (and volume) may also cause changes in salinity and temperature (COE, 1973).
4. Toxicity of Dredged Materials. Toxic effects of disposing dredged material can operate in two ways. One is through the biotoxicity of the dredged material to pioneering terrestrial vegetation, which would otherwise colonize the newly created land area. The other is by leaching back into the wetlands ecosystem in freshwater runoff, along the tidal margins of the dredged material bank, or in intruding water beneath the dredged material. These effects will be in the form of acute toxicity, long-term low-level toxicity, or in the phenomenon of biologi-cal magnification. The effects that toxic materials can have on the terrestrial habitat are considered below in terms of plant growth, erosion and biological magnification.
(a) Plant Growth. Toxicity which precludes the germination and/or growth of invading plant species in the new land area will result in the production of a desert situation. As a result, the functions of terrestrial vegetation as food for herbivores, as microhabitat for
175
a wide range of organic materials to the soil, will all be missing. The loss of any one of these factors could cause a distinct change in the species compo-sition of the area, including changes in productivity and in wildlife species. The loss of several or all of these functions will likely result in gross simplification of the system and in a near desert situation.
(b) Erosion. Either acute or low-level tox-icity to plants caused by erosion could result in problems for the wetland area. That is, a rapid return of the toxic materials to the system might result. Thus, the toxic materials, as inhibitors of normal plant colonization of the dredged material, may hasten the return of these same materials to the wetlands through acceleration erosion.
(c) Biological Magnification. The biolo-gical magnification of toxic materials in terrestrial vegetation is critical. This phenomenon is well documented for chlorinated hydrocarbon pesticides, which, absorbed to organic detritus in soil are taken up by detritus feeders, entering the food chain at that level. Pesticides and other persistent chlori-nated hydrocarbons (PCBs, for instance) in the dredged materials might be expected to operate in similar fashion once the material has been colonized by burrowing worms, mollusks, and other organisms (Wurster, 1969). The effects of these materials on terrestrial orga-nisms through their biologic magnifi-cation in food chains is difficult to assess, but abundant evidence is avail-able to indicate that top carnivore species might well be affected, probably in their reproductive success (Woodwell, 1967). A precise evaluation of these impacts is impossible without knowledge of pesticide concentration factors at each level of the food chain, initial
176
concentrations in the dredged material, and the stability of the pesticide in the system.
Heavy metals may also be a factor in biological magnification. Although gross pathological conditions from these substances are rarely observed in nature, long-term insidious effects of sublethal levels of toxicity may still adversely affect the biology of affected organisms (Halstead, 1970). Many of these substances readily enter food chains and are subject to the process of biological magnification as they are passed to higher tropic levels. As is so often the case, there is a general lack of information concerning the bio-activity of many of these substances in the amounts in which they may occur in the environment today (Halstead, 1970). It can only be suggested once again that when potentially toxic substances are detected in the dredged material, thorough studies should be undertaken to determine the movement, stability, and effects of these substances in the ecosystem.
5. Aesthetic Alteration. The deposition of dredged material upon uplands or wetland areas covers existing vegetation and results in noticeable visual degradation of the landscape. Both the qualitative and quantitative aspects of this degradation is contingent upon the site-specific assessment of the existing scenic resources prior to deposition.
Depending upon the location of the site and the degree of uniqueness or sensitivity associated with the habitat, visual impacts could be considered short term as, in time, these areas are able to revegetate and supplement the existing habitat. It may also be noteworthy to refer to instances whereby dredged material is used to create additional upland or wetland habitat. In this case, there is a trade-off that exists between habitat value, scenic beauty and, in some instances, recreational enhancement.
177
The alternative uses of dredged material as pre-sented in later subsection likewise reduce the aesthetic impacts over conventional disposal as the material is incorporated into existing, functional and beneficial use.
IMPACTS OF DAMS
(a) Construction
The terrestrial impacts associated with dams may be classified into two categories. The first category includes those impacts resulting from the actual construc-tion activities in the terrestrial environment. The second includes those impacts associated with operation of a dam, viz, inundation of terrestrial habitat upstream of the dam.
1. Elimination/Alteration of Habitat. Construc-tion of a dam requires roadways in order to transport equipment to the construction site. There is also a necessity for storage and work areas on land. The dam itself extends outward from the body of water and into the surrounding wetland and terrestrial environments.
2. Impacts to Wildlife
(a) Direct Destruction. During construction activities, wildlife will be killed. The majority of animals destroyed will be those which are either not capable of quick movement to adjacent areas, such as herpetofauna, or those that will seek refuge in burrows or clumps of vegeta-tion, and will either be run over by construction equipment or covered with fill material or materials used for con-struction of the land portion of the dam and its associated structures.
(b) Noise. At present, knowledge of the effects of noise on wildlife is very limited. Noise created by construction activities may reduce the value of adjacent wildlife habitat even in areas where vegetation is not removed. The motile wildlife in these abutting areas
178

may be displaced to other areas. Some organisms may become adapted to the noise and may move back into the area after initial acitivites, though no sig-nificant return of wildlife may occur until construction activities have ceased. With time, the wildlife popu-lation in the areas adjacent to the construction site may be restored.
(b) Operation Impacts
Dams are associated with locks and reservoirs. They cause upstream impoundment of waters and increased surface water elevations. An increase of surface water elevations will result in inundation of land areas that were not for-merly inundated. This inundation of areas upstream of the dam and adjacent to the river is the major operational impact of dams. It may be noted that the effects of inun-dation relating to depth of water may lessen with distance from the dam. This is because the water is typically deepest immediately upstream from the dam and becomes more shallow along the peripheries according to the size and shape of the floodplain.
1. Impacts to Vegetation from Inundation. Per-manent flooding will eventually kill less tolerant plant species (Solomon et al., 1975) thereby resulting in the the elimination of the existing vegetative community or major alteration in the density and diversity of such communities.
Plant community migration will occur based on flooding tolerance (Solomon et al., 1975). Three types of situations could result depending on geomorphic con-ditions. Communities will simply be displaced where the topographic gradient is gentle. Where the gradient is gentle near the river and suddenly steepens, the most flood-tolerant community will expand and the less tolerant one will be squeezed to a minimum. Where the new water level extends to a steep bank that is not inundated, the flood-intolerant community will be totally eliminated.
In the Illinois River Valley, it has been deter-mined that consistent low water levels which expose mud-flats for a 70 day period between mid-July and the end of
179

September are critical for moist soil plant production. Slight variations at low water levels during this time severely limit plant production. A greater decrease is evident if the water level fluctuations occur during the first month of growth (COE, 1977).
Slight variations in pool water levels can also provide a watering action for the emergent water-edge plant species, as well as a method for seed dispersal of these plants to substrates favorable for growth.
The effects of flooding on the plant are visible in the root system (the part of the plant under water) and in the stem and leaves above the flood water. There are both short and long-term responses which the plant under-goes in response to flooding. The major effect of flood-ing is to create an anaerobic environment in the proximity of the root system. In this respect, the principle diff-erence between saturated soils and a flooded condition is the path length to the root system through which oxygen must diffuse. The existing anaerobic environment inter-feres with normal root functions and creates a variety of stresses on the plant. These stresses affect most physio-logical activities such as water and nutrient uptake, xylem and phloem transport, photosynthesis, and transpiration (USFWS, 1977).
Flood tolerance adaptations fall into two broad categories: physical and metabolic. Both types have a similar purpose, i.e., to decrease the effects on the plant of an anaerobic environment in the rhizosphere pro-duced by high water levels. Usually the degrees of flood tolerance can be distinguished by comparing the number and rates at which flood avoidance mechanisms are employed by the species. The tolerance of roots to anaerobiosis is dependent upon a variety of metabolic and physical char-acteristics (Dubinina, 1961). Some physical processes can increase the oxygen content in the roots either by transport of oxygen from the stem or from other parts of the root system where oxygen is more available. Metabolic modifications to the anaerobic respiratory pathways can enable a plant to utilize less toxic end-products. In addition, these end-products also help decrease the oxygen debt of the root system by transporting the end-products to the upper portions of the plant (Garcia-Nove and Craw-ford, 1973). Metabolic and physical adaptations allow the root system to utilize both aerobic and anaerobic respi-ration at the same time and at different rates. The
180
relative importance of each type of respiration will depend on fluctuations in flood conditions.
Tolerant plants utilize combinations of metabolic and physical adaptations. The fewer mechanisms a plant has, the less tolerance in ability to withstand anaerobic conditions in comparison to plants which have more suita-ble adaptations.
Five factors appear critical in determining a plant's response to changes in water level. These are time of the year, flood frequency, flood duration, water depth, and siltation.
Time of Year. For most bottomland species it appears that flooding during the dormant season has few, if any, detrimental effects on tree growth or mortality (Hall and Smith, 1955). Flooding extended into the growing season can have a serious detrimental impact (Bell and Johnson, 1974). During the dormant period, tree roots have a very low oxygen requirement (Yellenosky, 1964) and exhibit little or no growth. However, during the active growth period, the oxygen requirements of the root system are much greater. The oxy-gen in the flood waters is quickly exhausted and anaerobic conditions persist.
Water temperature is also important. Cool water has a greater oxygen holding capacity in comparison to warm water (Broadfoot and Williston, 1973) and therefore provides more oxygen to roots. Water temperature is dependent on climatic conditions which vary seasonally.
(b) Flood Frequency. Conflicting reports exist as to the effect of flood fre-quency on growth rates. Johnson and Bell (1976a) reported no correlation between flood frequency and growth for trees greater than four centimeters in
(a)
181
diameter. Huffman (1977) found a cor-relation between the number of floods greater than five days long, the time of occurrence during the growing season, and the basal area of the species.
Understory vegetation has been found to be strongly influenced by flooding. As flood frequency decreases, herbaceous species diversity increases (Bell, 1974). Plant biomass and net primary production are linked to flood fre-quency. Net primary production and above-ground biomass have been reported by Johnson and Bell (1976b) to be greater within a floodplain area than in an upland zone and least in the tran-sition zone. They concluded that the high biomass estimates were due to faster growth rates of species in the floodplain zone. The high primary pro- duction rates were attributed to the abundant soil moisture in the flood-plain. Although flood frequency is an important factor in the establishment of trees (Bell, 1974), the total amount of reproduction in bottomland stands is more closely related to the successional state of the community (Hosner and Minckler, 1960).
(c) Flood Duration. Flooding for short periods (less than 1 month) in the beginning of the growing season is often damaging to trees. They show the following symptoms': leaf chlorosis, leaf wilt, premature leaf drop, and decreased growth rates (Hosner and Boyce, 1962). The amount of damage is related to the tolerance of the species. If the tree does not die before the end of the flood recovery is usually rapid (Hosner, 1960).
Long-term flooding results in much higher mortality than short-term flooding. A few bottomland species, such as swamp white oak and green ash,
182
have been reported to survive three years of continuous flooding (Green, 1947). However, most bottomland species cannot survive two years of continous flooding (Broadfoot and Williston, 1973).
(d) Water Depth. Flooding to depths of 15 to 25 cm have been shown to result in a greater decrease in plant growth in height than flooding less than five cen-timeters (Kennedy, 1970). If the water level is greater than a few centimeters above the soil surface, it has been reported that gas exchange through the lenticels will be blocked (Armstrong, 1968). This effect has been noted to be limited to herbaceous species, although Chrikova and Gutman (1972) found that lenticels are important in gas exchange for tree species under flood con-ditions. Depth of flood water is espe-cially critical for seedlings and her-baceous species since the water will often completely cover them. Seedlings exhibit various responses to such con-ditions. If the seedling has not leafed out before flooding, it will usually remain dormant until the flood water recedes. Leaves of seedlings covered by water quickly become chlorotic and usually drop off. If the seedling is not then killed by the flood, it can leaf out again after flooding ends (Hosner, 1958).
Concerning wetlands, changes in water levels can also affect vegetation estab-lished on soils which are temporarily or permanently inundated by changing the water pressure on the root system (COE, 1979).
(e) Siltation. Siltation can also affect plant survival. Flood waters deposit clay, silt and sand in low lying areas. Siltation increases dieback and reduces stem height and diameter growth (Ken-nedy, 1970). Some species are more
183
resistant to damage from siltation (Broadfoot, 1973a). In addition, high sediment loads, particularly if they are rich in organic matter or chemicals, can increase both biochemical oxygen demand and, hence, reduce oxygen concentrations in the flood water, which increases the stress on the vegetation.
Groundwater Levels. Impacts to the ter-restrial ecosystem may also affect areas adjacent to those which are inundated. Increased surface water elevation may cause groundwater levels to increase in these adjacent areas. This can alter soil moisture and thereby affect vege-tation. Adverse impacts may result to intolerant species and beneficial impacts to tolerant ones.
2. Impacts to Wildlife Habitat. The exact impact is dependent on the type of existing vegetation community, its tolerance to thc inundation and its value to wildlife. Some vegetation species are intolerant of the inundation and will die. Inundation can alter the character of the vegetative community, which may be detri-mental or beneficial to wildlife. In some cases it will completely eliminate the existing community. The loss of wildlife food and habitat is especially severe when the area inundated is valuable for these purposes is the only area of its kind available in the region, or provides a habitat for rare or endangered species.
Inundations and the covering of land surfaces by roadways and other structures will greatly reduce the area's value for providing wildlife burrows and trails. The greater width of the impounded body of water can also act as a barrier to wildlife movements.
It may be noted, however, that although there is a loss in terrestrial habitat, the impoundment of a water body and its associated rise in water elevation will pro-vide additional habitat for aquatic organisms, waterbirds, waterfowl and mammals, such as muskrat, beaver and ot-ters. In addition, large trees dead from inundation and left standing can provide an excellent habitat for wood-peckers, wood ducks and perching birds.
(g )
184
3. Impacts to Wildlife
(a) Selective Pressures on Populations. Wildlife have specific habitat require-ments for survival and completing their life cycles. When their habitats are altered or disturbed, impacts to their populations can result. When the hab-itat changes are detrimental to a given species there can be a decrease in the number of individuals representing that species. For example, Green (1960) reported lower populations of skunks, badgers, foxes, rabbits and other upland wildlife because of inception of the nine-foot channel on the Upper Missis-sippi River. Impacts to wildlife simi-lar to those for habitat have also been reported from construction of the nine-foot navigation channel in the Illinois Waterway (COE, 1977).
The Illinois River Valley provides food for wildlife as they migrate through the area in the spring and fall. The near extirpation of aquatic plants and severe reduction of marsh plants from the nine-foot channel project have adversely affected the migratory waterfowl popu-lations (COE, 1977). In some cases the impact may be sufficient to cause the elimination of the species from the affected area. Green (1960) reported that prairie chickens which utilized the bottomland meadows have vanished because of the elimination of such areas. When the habitat changes are beneficial to a given species, there can be an increase in the number of individuals repre-senting that species. In some cases the change may provide suitable habitat for a species not already present in the impacted area and may therefore allow the establishment of its population. Green (1960) found that due to impound-ment of waters and the rise in water levels, waterfowl have increased in both the numbers representing each species
185
and the number of species present along the Illinois River Valley.
(b) Wildlife Displacement. Wildlife which is not killed by construction activities will be displaced from the areas of impact. The displaced organisms will seek refuge in adjacent areas where suitable habitat is present. These areas will already have established wildlife populations and any additions to these populations may cause carrying capacities to be exceeded. The native wildlife is much more capable of sur-vival than the displaced animals because of their familiarity with the area. If displacement is permanent, competition for food, cover and predation will gen-erally result in the survival of native organisms and the death of those dis-placed from other areas. Gradual die-off may also result from reduced repro-duction caused by the created stress. Displaced animals are also more vulnera-ble to predation (COE, 1979).
If wildlife is able to re-inhabit impacted areas not too long after displacement, the stress on native organisms should be alleviated.
(c) Migration. In some areas the impound-ment created by damming a river may block the ancestral migration routes of wildlife, especially big game animals (United States Senate Select Committee on National Water Resources, 1960). It may cut them off from summer or winter grounds necessary for survival. Mating and reproduction may be hindered or starvation may result. An impoundment can cause drowning of animals when they attempt to cross it, especially when thin ice is present.
(d) Removal of Link in Food Chain. The presence of a dam and associated impoundment may also cause the removal
186

of a link in the food chain which is necessary to certain animals (COE, 1978). For example, in California wild- life such as the black bear and bald eagle depend upon the yearly migration of salmon for a critical portion of their yearly food supply. Though it has not yet been proved, and the matter awaits further study, this conclusion has been inferred by the California Department of Fish and Game (Arend, 1969).
(e) "Island Effect". In those instances where inundation has created small ter-restrial islands which were once con-tiguous land mass, populations of plants and animals may find themselves genetically isolated.
From a genetic standpoint, in order to survive, all species must maintain heal- thy populations. The gene pools of these populations must retain sufficient genetic variability to allow the species to adapt to changing environments. When only remnants of original population remain in a given area and they are relatively isolated from other such pop- ulations, they can be considered,in effect,as islands. Recent experimental and theoretical work on island ecology has demonstrated that extinction rates of species on islands are inversely related to island areas (COE, 1975). Thus in some cases, decreases in habitat area may not just affect a concomitant decrease in the population size of a particular species in that habitat, but may increase the possibility that the population will suffer a local extinc-tion. For example, a particular tract of woodland may have sufficient resources to maintain a population of seven pairs of Cooper's hawks. This may represent a minimally healthy population size for this species. If, however, a 20 % reduction in the size of this
187
habitat occurred as the result of a project, the Cooper's hawk might suffer a reduction in population size to five pairs. This might be an insufficient population size to remain viable, and the final result might be the local elimination of the Cooper's hawk from the area.
OTHER WATERWAYS IMPACTS
(a) Channelization Impacts
1. Construction
(a) Elimination/Alteration of Habitat. Channelization usually requires the removal of vegetation along the banks of the stream or river and in any other terrestrial areas where channels will be routed. It reduces the abundance and diversity of vegetation, sets back plant succession and affects its associated wildlife habitat. For many projects, removal of all vegetation occurs within 100 feet or so of the stream (COE, 1973). Channelization eliminates streamside habitat for small game, waterfowl and fur-bearing mammals (United States Congress, 1971). This is especially important when the habitat is the only one available for them. Prellwitz (1976) has reported that the abundance and diversity of small mammals are directly correlated with the amount of existing ground cover and the diver-sity of habitat along the stream bank. He also found that the diversity of birds and mammals and abundance of birds increased as streambank plant succession advanced. This trend continued until the mature wooland stage was reached.
Associated structures, roadways, and storage and work areas also require
188
removal of vegetation and wildlife hab-itat. In areas where soils have been heavily compacted as a result of the operation of construction equipment, revegetation, either natural or planted, may be prolonged or impossible.
(b) Impacts to Wildlife. The impacts to wildlife are similar to those discussed in the previous subsection on dams.
2. Operation. The purpose of channelization may be to minimize flooding, straighten river channels or cre-ate ox-bow lakes. Impacts to vegetation, wildlife habitat and wildlife caused by flood protection are discussed under Flood Protection Structures.
(b) Navigation Impacts
Navigation along the country's major waterways can affect the upland and wetland ecosystems in several ways. Impacts may result from noise, air pollution, wave action, cargo spillage, waste discharge, and various associated activities on shore.
1. Noise Impacts. At present, little is known of the impacts of noise on wildlife. Until such a time as additional data from field observations and associated laboratory research are available, impacts cannot be effectively and accurately predicted.
The noise of barge trains and towboats could possibly have little or no effect on wildlife because wild animals may easily habituate to chronic increases in fre-quency of "barge noise". However, there are no known data to substantiate this assertion. New tow boat engines are required to have anti-noise devices and should therefore have less effect. However, it is possible that increased noise from navigation would be deleterious to species requiring more secluded breeding or resting areas. Noise may cause non-use of the area by wildlife and, if so, result in the loss of productivity for that area. This is particularly valid in and near wetland areas as these areas are often prime nesting, staging and breeding grounds for waterfowl and other avian species.
189
2. Air Quality. It is doubtful the air pol-lution from navigational activities has a significant impact on the environment of the rivers (COE, 1976). Air pollution may pose a problem if the amount of pollutants contributed by navigation is coupled with that from increased industrialization along the shores arising as a result of increased waterways activity.
It is also conceivable that prolonged navi-gational activities near wetland areas during sensitive avian breeding and staging periods could impact these activities, resulting in their disruption.
Additional air quality impacts are discussed in a later section of this report, Air Quality Impacts of Waterways Navigation.
3. Impacts of Wave Action. Navigational activi-ties within a river create waves which migrate to the shore where they may cause erosion of the banks and wet-land areas. Erosion removes substrates and causes plant dislodgement, resulting in adverse impacts to aquatic, wetland and terrestrial vegetation and wildlife habitats.
Wave action can also deter the growth and devel-opment of intolerant vegetation in wetlands and along banks. Shoreline vegetation which is destroyed by wave action could possibly cause an interruption of the natural food chain (COE, 1976) or cause the elimination of valua-ble wildlife habitat with resultant impacts to wildlife.
Shore-dwelling animals such as beaver and muskrat may be adversely impacted by wave wash. Their young would be most vulnerable in their bank dens. Erosion from wave action may also physically destroy lodges and dens. Herpetofauna, dependent on shorelines for breeding, may also be adversely affected.
4. Winter Navigation Impacts. Winter navigation in climatic zones where temperatures drop and water sur-faces freeze over can cause additional bank erosion. If brash or broken ice is present along the river bank, wave action caused by navigation may force ice fragments into the bank resulting in a "gouging" action which will dis-place soil. If there is a solid ice cover over the river, other than the channel used for navigation, the force of water movement from the boat or tow would be totally under the ice. This would result in force vectors confined at
190
the bank-ice cover interface. The impact of the force vectors would be highly variable and would depend on the location of a vessel in relation to the bank and bottom configuration.
5. Cargo Spillage. Liquid and dry cargoes are transported on and along our nation's waterways by boats and tows. The release of these substances into the water-ways may have a detrimental effect on wetland vegetation and wildlife.
(a) Impacts on Vegetation. Spillage of biological oxygen-demanding compounds (such as grain or molasses) usually will not have a serious impact because they do not reduce oxygen concentrations over a short time period. Chemical oxygen-demanding substances, such as some chemicals, may have a serious impact because they reduce oxygen concentra-tions over a short time period and thereby subject inundated roots to anaerobic conditions. These conditions interfere with normal root functions and create a variety of stresses on the plant. These stresses affect most phys-iological activities such as water and nutrient uptake, xylem and phloem trans-port, photosynthesis, and transpiration (USFWS, 1977). The plants' response can vary from the slowing of growth to the dropping of leaves to the death of the plant. Spills of toxic substances such as petroleum products, fertilizer, salt, and other similar chemicals will usually have the most serious impacts (Ecologi-cal Consultants 1978).
(b) Impacts on Wildlife. Spilled cargo may also affect terrestrial animals. Wild-life associated with the river, such as muskrat, beaver and waterfowl, can be directly affected by the released sub-stances. Other terrestrial animals may ingest polluted waters or consume aquatic or other terrestrial plants and animals affected by the spilled sub-stances, causing impact at higher
191
trophic levels. The elimination of vegetation may also adversely affect the population of a herbivore and the elimi-nation of a prey may likewise affect the predator population.
6. Waste Discharge. Commercial, industrial and recreational traffic on and along the nation's waterways present a threat of pollution by waste discharges and bilge pumping. Federal and state regulations prohibit the purposeful discharge of waste.
The wastes of concern are such items as kitchen wastes and sewage (Ecological Consultants, 1978). Bilge pumping will contribute petroleum products and a multitude of other wastes from the operation of the vessels and transport of cargo. Toxic compounds may be present though the major concern may be the oxygen reductions associated with the wastes. The previous section, Cargo Spillage, presents the impacts of releases of these substances into the river.
7. Associated Activities on Shore. On-shore activities associated with navigation on the nation's waterways include construction of docks, warehouses and other facilities for the loading and unloading of cargo. The activities will cause additional removal of vegetation and wildlife habitat, noise, air pollution, cargo spillage and wildlife destruction and displacement. All of these impacts have been discussed in previous sections.
(c) Shore Protection Structures
1. Construction Impacts. Shore protection structures are primarily used for stabilizing the shore-line soils and preventing erosion. Construction of these structures usually requires the destruction of wetland and upland vegetation and their associated, intrinsic wildlife habitats along the river or channel periphery.
Off-shore structures, such as dikes and jetties, limit the terrestrial impacts to those resulting from the construction of associated on-land structures, roadways and storage and work areas.
192

Where on-shore structures such as revetments and riprap are used, any vegetation inhabiting the areas will be eliminated.
The impacts to wildlife are similar to those dis-cussed in the previous subsection, impacts of Dams.
2. Operation Impacts. Structures that protect the shore, such as dikes, revetments and jetties, reduce the impacts on the terrestrial environment caused by erosion.
However, shore protection structures often cause sedimentation along the shoreline. Sedimentation can cause destruction of wetland vegetation by smothering plants. It can cause the filling in of an area and there-by change a wetland into a more terrestrial environment. Vegetation intolerant of the changing conditions will be eliminated, and tolerant ones will benefit from an increase in space availability and lessened competition.
(d) Flood Protection Structures
1. Construction Impacts. Flood protection may be accomplished by the construction of such structures as dikes and levees and by channelization. The impacts on vegetation, habitat and wildlife from these structures or activities are similar to those previously addressed in the subsections on dams and channelization.
2. Operation Impacts. Flood protection devices reduce the extent and duration of flooding within the floodplain. Dikes, levees and channelization are used to fulfill these tasks. Flood protection may permanently alter the existing environment within the entire flood-plain or portions of it. The greatest impact will result from water level changes experienced by woody riparian and wetland communities. Some plants within the floodplain will no longer experience periods of very high soil moisture, inundation of the roots and anaerobic conditions caused by flooding. Others may be subject to fewer periods of flooding, less water elevations and lower flood water flows. Those species which require such conditions (i.e., greater flooding) to inhibit or permit less tol-erant species from competing with them will be adversely impacted by increased competition and the vegetation will
193
,41
eventually be dominated by the less flood-tolerant species. For those species which are tolerant of the change, little, if any, impact will be experienced. The newly formed environment, though, may afford conditions favorable to vegetation that was intolerant of previous flooding and, therefore, was never present within the floodplain.
In the case of a levee, the floodplain on the river side of the structure may experience higher water elevations due to containment by the structure. The impacts on vegetation resulting from increases in water elevation are the same as those discussed for inundation caused by operation of a dam.
Flood protection may cause the vegetative com-munity within the floodplain to change in species composi-tion, density and diversity. Klein, Daley, and Wedum (1975) suggested that flood protection by levels along the Mississippi River mainstream may change species composi-tion. Terpening et al. (1974) summarized the available data and showed that some specific sites have changed. Miller (1923) reported swamp cottonwood as a common tree whereas it is presently uncommon in the Mississippi floodplain.
Flood protection stimulates land-use changes and development within the floodplain and thereby causes addi-tional vegetation, wildlife habitat and wildlife to be destroyed.
(e) Floodways
When floodways are operated, small mammals will suffer some loss of life and destruction of habitat (COE, 1979). However, it has been determined that these losses are short-term because soon after the floodwaters have receded the floodplain typically recovers.
Birds indigenous to this area do not significantly suffer because of their migration to higher grounds adja-cent to the floodplain. They will return to their natural habitat shortly after the high water passes. Other dis-placed animals should also return following subsidence of floodwaters.
P
194
MITIGATION
Many of the impacts noted above from construction, maintenance and operation of the national waterway system are significant, resulting in great loss of terrestrial habitat and displacement or loss of wildlife species.
The following mitigation measures are suggested as tech niques or methodologies whereby the impacts of waterways activities may be reduced:
1. Where possible, vegetation which is removed or damaged beyond recovery should be replaced.
2. Landscaping along roadways and around building and other structures could replace removed vege-tation and provide wildlife habitat and vegetative blending.
3. The size of the impact area may be minimized by:
(a) Limiting construction and associated activities to required site.
(b) Storing supplies and equipment on site.
(c) Determining the maximum size area required and designating boundaries at the construction site.
4. Minimize activities in areas which provide valuable wildlife habitat.
5. Construction equipment should be used which works efficiently and effectively and which minimizes noise and air pollution.
6. Special field supervisors can be used to ensure compliance with mitigation requirements, to super-vise mitigation activities and to identify other situa-tions where mitigation would be valuable and effective.
7. When possible, trees which are dead or dying should be left in site to provide food, perching and nesting sites and shelter for wildlife.
195
8. Land-use management should be used to limit impacts from additional development along the river.
9. Wildlife habitat improvement practices should be incorporated in the planning stage. Practices may include:
(a) Selective tree clearing.
(b) Choosing revegetation species that A provide food and cover to wildlife.
(c) Planting vegetation in a fashion suitable as habitat for wildlife.
(d) Building structures which provide nesting. Building feeding areas and shelters for wildlife.
(e) Manipulating the terrestrial wildlife habitat in other areas to increase its quantity or value.
(f) Maintain, improve and increase wetland areas.
(g) Keeping water areas open in winter.
10. Develop a program for supplying additional wildlife foods, such as seed for birds and hay for deer, at feeding stations.
11. Develop or aid in the development of wild-life sanctuaries reasonably proximal to construction areas where displaced animals can seek refuge and suitable habitat.
12. Capture valuable wildlife and transport it to a sanctuary or other suitable habitat.
13. Scheduling construction activities to avoid migration or reproduction periods. This would mitigate short-term and long-term impacts to all species of wild-life, especially big game, waterfowl, anadromous fish and rare or endangered species.
14. Investigate the alternative disposal tech-niques for dredged material. The following subsection,
196
Alternative Uses of Dredged Material as Mitigation, dis-cusses several of these techniques
ALTERNATIVE USES OF DREDGED MATERIAL AS MITIGATION
Since 1824, the COE has been charged with the respon-sibility of construction and maintenance of the nation's navigable waterways. In some ways, this responsibility may be likened to attempting to keep a hedge trimmed. Each year the COE removes over 350 million cubic yards of dredged material from navigation channels. Much of this material finds its way back into these channels.
Until somewhat recently, many of the potential envi-ronmental impacts of dredged material disposal were inade-quately documented and, hence, disposal sites were often located in or along sensitive terrain. This material was often disposed of in open water, piled at sites along the coastline or was deposited on wetland areas, which were then considered waste areas. However, concurrent with the rising concern about destruction to wetlands and other terrestrial disposal sites and because of the question possible toxic contaminants present in the material, much emphasis has been placed upon alternatives to conventional disposal methods.
The following uses of dredged material are presented as alternatives to conventional terrestrial and wetlands disposal:
- Habitat Development.
- Landfill and Construction Material.
- Surface Mine Reclamation.
- Sanitary Landfill.
- Agricultural Land Enhancement.
The Waterways Experiment Station (WES) at Vicksburg has developed a wealth of information concerning these alternative uses. The following presentation serves as an introduction to these areas of interest and provides a brief synopsis of their efforts.
197
(a) Habitat Development
It may be stated that habitat development is the con-sequence of every dredged material disposal operation not specifically designed to prevent the invasion and use of a disposal site by plants and/or animals. However, because of their intrinsic value to man, certain plants and ani-mals may be identified by resource agencies as target spe-cies for management. Fundamental to this management, however, is a basic comprehension of how these target plants and animals interact with the physical, chemical and other biological features of their environments.
1. General Considerations. Both target and sup-port plant and/or animal populations must be identified. Animal species of direct interest to a habitat develop-ment/management plant are targets of that plan. They can be divided into three categories ccording to their com-mercial, recreational, or threatened or endangered status. Plant and animal species that are used by target animal populations for cover or food or other purposes are termed ecological support populations.
In most instances, a habitat development project will provide food (trophic support) or cover (physical or biological structure) critical to the completion of a tar-get animal's life history. A given project could provide both. Once the animal candidate for management has been selected, there are ecological considerations that require some level of evaluation for all life history stages:
(a) Short-term considerations: (1) food, water and cover for resting, repro-duction, and protection and (2) depen-dency on adjacent habitats and corridors for movement between habitats.
(b) Long-term considerations: (1) course and time frame of potential changes in soil/sediment and vegetational succes-sional patterns likely to influence the habitat's suitability for the target populations; (2) modification of soil/ sediment and vegetational conditions affected by animal use (such as over-grazing); and (3) ability of the habitat
198

and its animal populations to survive potentially frequent natural disturb-ances including seasonal precipitational and hydraulic extremes and less frequent potential perturbations, including severe storms.
In all systems, there is a dynamic balance that has developed through time between components and requires dealing with the ecosystem as a whole (Odum, 1969, Cope-land, 1970, Odum,1977). If habitat development is viewed as a controlled disturbance, it can be placed into an eco-system perspective using ideas developed by Rhoads et al. (in press) and Odum (1977). Rhoads et al. (in press) sum-marized the basic information needed to evaluate the potential success of controlled disturbances as: (a) available species must be related to their position in a successional sequence; (b) seasonal colonization and pro-ductive rates must be known; and (c) the tolerance of colonizing species for various degrees of disturbance must be known. With this information, the habitat development plan can be adapted to best fit the ecosystem and human needs, the socalled compromise system of Odum (1969). Although it is not advisable that all ecosystems be of the compromise type, a balance needs to be struck between preservation and exploitation.
2. Habitat Development and the Physical Sta-bility of Dredged Material. Since the habitat development alternative for dredged material may be selected to achieve any of several objectives, it is important to recognize that all of these objectives are not entirely compatible. While a major objective of habitat develop-ment may be to prevent the return of dredged material to the navigation channel by providing vegetative cover for erosion control, certain potential target animal popu-lations, including some shorebirds, may require completely barren habitats, highly susceptible to erosion (Landin, 1978). Other species, including waterfowl, may require an intermediate amount of vegetation (such as grasses and herbs), and still other species, such as herons, may require larger shrubs and trees. Among wetland habitats, the choices between a mudflat, sandbar, or marsh would affect animal use patterns and the availability of food and cover to animals, including raccoons, shorebirds, wading birds, waterfowl, and fish. The marsh would pro-vide protection for the small animals feeding within it and stabilization for the substrate against erosion, but
199
would provide a less available food resource to the shore and wading birds that probe the unvegetated flats for invertebrate foods. The management choice made for hab-itat development will affect other uses, including the frequency of maintenance dredging and reuse of the area for disposal.
3. Diversification of Habitat. It is widely believed by ecologists that the occurrence of a diversity of habitat types (increase in spatial diversity) increases the resource value of the entire area to a greater number of species than any one of the individual habitats would (MacArthur, 1960; Abele, 1974). The environmental planner could combine habitat types to produce a complex of
s greater value to the ecosystem than a monotonous expanse of similarly developed habitats. Multiple-use aspects of habitat development are also enhanced through the diver-sity of habitat types.
An approach to increasing habitat diversity would be to develop a series or succession of habitat types in the same place. This approach would use time as an inte-grator of habitat diversity as opposed to developing a variety of habitat types at once. For example, through successive disposal operations a soft-bottom habitat could be first turned into a grass bed, then a wetland, then an island, and finally upland mainland. Careful management would be required for this approach, with constant evalua-tion of progress toward the final goal and the relative resource value of each step in the sequence.
(b) Fill and Construction Material
The practical use of dredged material as construction media is essentially based upon the following considerations:
- availability of suitable material.
- engineering criteria.
- availability of transportation.
- logistics of sorting, grading, etc.
200
Although dredged material is available wherever dred-ging activities are occurring, not all material is suit-able. Silts and fine clays, such as those from harbor areas (i.e., Lower Mississippi River), may have little applicability for use as building material and may prove incapable of providing firm support strata for road foun-dations. Such material as is dredged in the South Pacific is most useful since its primary composition is limestone coral.
Much of the potential suitability of dredged material for these operations involve testing the material for the physical and engineering characteristics it possesses. Such properties as compaction, grain size, elasticity, chemical composition, etc are crucial to identifying its potential use for these purposes.
Further considerations for these uses involve the availability of transportation of these materials from the dredging site to a construction or fill site and the timing of the general availability of the dredged mate-rial. The potentiality of such use varies inversely with distance from a site due to transportation cost.
Costs are also crucial in determining the particular fraction of the material that represents potential use. If sorting and grading of material is to occur, costs and overall complexity of the operation may be expected to rise.
(c) Surface Mine Reclamation
As a consequence of recent public awareness of the adverse environmental impacts of surface mining, state and Federal laws now direct mine operators to submit a recla-mation plan when applying for a mine license and/or per-mit. However, there remain many abandoned surface mines which continue to be sources of erosion and acid runoff. Without proper reclamation, these lands remain unproduc-tive and aesthetically displeasing.
201

Various techniques have been developed to control acid mine drainage from surface mine spoils. The primary pur-pose of these techniques is to reduce air and water con-tact with the acid generating mine spoils. Methods which accomplish this are reducing slopes, thereby reducing run-off velocities and erosion, and establishing plants on the mine spoils. A balance must be struck between slope reduction and increased infiltration capacity. Attempts to establish vegetative cover on highly acidic mine spoils have usually resulted in low survival rates. The lack of vegetative cover on mine spoils will result in erosion and further exposure of acid generating pyrites (FeS2) to air and water.
In order to reduce adverse effects of mine spoils, placement of a topsoil or topsoil substitute suitable for vegetative growth such as dredged material, is recom-mended. Application of dredged material to surface mine spoils can accomplish the following:
1. Provide a cover that will reduce the infiltration of water and the diffusion of air to the pyrite material, thus reducing acid mine drainage.
2. Provide a suitable growing meduim for vege-tation, making the site environmentally beneficial and aesthetically pleasing.
(d) Sanitary Landfill
Sanitary landfilling is an engineering method for the land disposal of solid waste. In a sanitary landfill operation, solid waste is spread on the ground and com-pacted to the maximum density practical. At the end of each working day, all solid waste delivered to the site during the day is covered with compacted soil. This con-stitutes a solid waste cell. A sanitary landfill consists of one or more lifts of solid waste cells. If two or more lifts are placed, each lift is covered by an intermediate cover. All completed sanitary landfills are covered with a thick final layer of soil.
Governmental agencies responsible for the management of solid waste are experiencing difficulties in obtaining
202

suitable sites on which to operate environmentally sound solid waste disposal operations. A major portion of the solid waste generated in this country is ultimately placed on land in sanitary landfills. The location of a sanitary landfill is often constrained by cover material require-ments and availability and by site characteristics related to potential adverse environmental impact. Bartons (1977) reports that dredged material can satisfactorily perform the functions of a cover material, thereby making it pos-sible to locate sanitary landfills at sites previously considered unsuitable due to a lack of native cover soil.
(e) Agricultural Enhancement
An attractive alternative for disposing of dredged sediments is to use these materials beneficially to amend marginal soils for agricultural purposes. Marginal soils are not intensively farmed because of inherent limitations such as poor drainage, unsuitable grain size, and poor physical and chemical conditions. They may also be of low productivity because of high water tables or frequency of flooding. There are millions of acres of these marginal soils conveniently located near waterways.
Walsh and Malkasian (1978) have noted several areas where there is currently extensive interest in the agri-cultural use of dredged material. For example, about 500 acres of the Old Daniel Island Disposal Area in South Carolina have been successfully truck farmed for the past eight years. Presently, the Tulsa District has approxi-mately 2600 acres of dredged material containment areas leased for use as grazing land.
When dredged material is free of nuisance weeds and has the proper balance of nutrients, it is similar to pro-ductive agricultural soils and can be beneficial for increasing crop production when incorporated or mixed. By the addition of dredged material, the physical and chem-ical characteristics of a marginal soil can be altered to such an extent that water and nutrients become more avail-able for crop growth. In some cases, raising the ele-vation of the soil surface with a cover of dredged material may improve surface drainage and reduce flooding, thereby lengthening the growing season.
203
SUMMARY
Concerning the effects of waterways activities upon the terrestrial and wetland habitat, several major impact areas were noted to be significant. These were the impacts of inundation associated with dams, the impacts of dredged material disposal, and the navigation impacts of spills on wetlands areas.
The terrestrial impacts associated with the actual construction of a dam and related facilities were consid-ered to be minimal as the site area is small with respect to general overall surrounding areas and, perhaps most importantly, the construction activity is phased over a relatively short time period (i.e., two to five years), thereby generally resulting in impacts of a short-time nature. This statement may be applied to any of the gen-eral construction activities presented in this report. By far, the most major impact of dams is that associated with their operation or post-construction period whereby large upstream terrestrial and wetland areas are inundated with water. The impacts of inundation to the existing biota are well established in the literature and typically result in the loss of plant species and displacement/- migration and loss of habitat for terrestrial species. Those terrestrial species that are displaced usually face destruction as they are forced to reestablish themselves against indigenous species in an alien habitat where com-petition and stress are notably more significant. It may be noted that there are also beneficial impacts which involve the creation of additional aquatic and shoreline habitats.
The impacts associated with dredged material disposal typically involve the loss of less flora than is the case with dam-related inundation, hence, total range of impacts is relatively less. Usually, disposal sites use rela-tively little of the available habitat and thereby tend to cause minor loss of wildlife resources. There is however, a cumulative impact effect of disposal sites in combi-nation with each other and/or in combination with other intrusions. These cumulative effects tend to be more major and permanent and frequent result in near total dis-placement of original biotic communities. Disposal is perhaps most detrimental when the site chosen is a wetland or aquasi-wetland area. Executive Order 1990 addresses
204
the role of the Federal government and its agencies in protecting wetland areas by avoiding the long and short-term adverse impacts associated with the destruction or modification of wetlands wherever there is a practicable alternative. The concern for wetlands is due to the in-herent sensitivity of the wetlands ecosystem, the frequent presence of endangered and threatened species and that wetlands comprise a scarce and diminishing ecosystem, pri-marily avain and aquatic, within the area. There are how-ever, mitigation measures which may be used to compensate for these impacts. Good planning may allow for the selec-tion of sites that are not ecologically critical or the usage of the material in a way which may be more benefi-cial to the existing environment or create new habitats. This area of habitat development may ultimately provide the most advantageous technique for disposing of dredged material. It should be noted, however, that the selection of alternative disposal sites, i.e., sites that may not be ecologically critical, often involves some type of trade-off. Alternative sites may be located in an area already developed or more distant from the dredging area. A pro-ject sponsor is generally unwilling to condemn developed lands for use as disposal sites for a multitude of eco-nomic and social reasons and the use of more remote sites affects the cost, level, and frequency of maintenance. The avoidance of ecological critical areas may, therefore, require additional funds be set aside to either purchase developed lands or offset costs associated with increased distance to disposal areas. This is particularly true in light of continuing opposition by private and public interest groups to the location of disposal sites along coastal or floodplain areas. A practicable methodology for avoiding adverse environmental impacts would be the instigation of site-specific studies before, during and after establishment of disposal sites or disposal activi-ties. Studies beforehand would help to distinguish between suitable and inappropriate areas for disposal while studies during and after can lead to more accurate assessments of impacts and to measures to reduce significant impact.
Navigation, per se, gives rise to many impacts such as bank erosion, noise and air quality disturbances. How-ever, the most significant impact is associated with cargo spillage, especially in wetland areas. This is due to their ecological sensitivity and their provision of hab-itats for many rare and endangered species.
205
In short, both dam-related inundation and wetlands disposal of dredged material typically result in irrever-sible and irretrievable commitments of terrestrial resources. While alternative techniques and mitigation exist for the latter, dams present a massive impact to the terrestrial environment and are essentially without effective or significant mitigation.
206

C. AIR QUALITY IMPACTS
The intent of this section is to identify the air quality impacts associated with waterways navigation, that is, the activities involved with the construction, maintenance and operation of the waterways.
In most cases, the principal agent of exhaust emission associated with waterways operation, maintenance and, to some degree, constructiuon is the diesel engine-powered towboat. This vessel is used in combination to maneuver freighters and tow barges, and to operate in concert with specifically designed vessels to implement such main-tenance activities as dredging, dredged material disposal, etc.
Although steam-powered towboats became dominant around the time of the Civil War, freight movement remained some-what limited until the development of propeller towboats prior to World War I. In 1930 the diesel engine began exlipsing the steam engine as the primary propulsion for towboats. Since the introduction of the diesel engine and the subsequent development and improvement of existing waterways by the COE, total ton mileage has increased from nine billion in 1930 to 210 billion in 1970.
Generally speaking, vessel traffic in a waterway con-sists primarily of long-distance transit tows, originating and terminating long-distance tows, intra-port traffic, switcher boat fleeting operations for making and breaking tows, and operations associated with passing through lock facilities, if present. Additionally, recreation vessels, especially during the summer and fishing seasons, are present.
In assessing the impacts on air quality, specific quantitative estimates of regional pollutant burden will be avoided due in part to the paucity of technical infor-mation concerning emissions from vessels and, in part, to the lack of consistent, verifiable recording of naviga-tional air pollution on a regional basis.
207
The following subsection refers to and defines the major navigational air emissions and their effects upon the quality of the environment. Following this is a dis-cussion of the generalized primary and secondary impacts of navigational activity on air quality. A final sub-section summarizing this study follows this general impact discussion.
It may be noted that the terms ship, vessel, and motorship have been used somewhat interchangeably and may be casually defined as a waterborne, diesel-powered vehicle or towboat engaged in the construction, mainte-nance and/or operation of the United States waterways system.
POLLUTANTS AND EFFECTS
The air pollution resulting from the waterways activi-ties of construction, maintenance and operation primarily issues from diesel engines which are used, in most cases, to power the towboats and other related machinery such as dredges. Depending upon the geographical area of concern, ships, as a whole (commercial, Navy, Coast Guard, tugs, etc.), contribute relatively significantly to the overall concentrations of sulfur oxides (S0x), nitrogen oxides (NO), and particulate matter (TSP).
The following table (Table 111-5) illustrates the varying proportions of major pollutants that are released as a result of the combustion of diesel fuel versus gasoline.
Sulfur oxides are primarily emitted into the atmos-phere due to the heating and burning of fossil fuels such as coal and oil. In areas like London and New York, where large quantities of these fuels are used, sulfur oxides are a major air pollutant. The largest fraction of sulfur oxides is sulfur dioxide. This substance often further oxidizes to form sulfur trioxide, which combines with moisture in the air to form sulfuric acid mist. Both sul-fur dioxide and sulfur trioxide can damage vegetation and affect the health of humans and animals. Under conditions prevailing in areas where studies have been conducted, adverse health effects were noted when 24-hour average
2OR
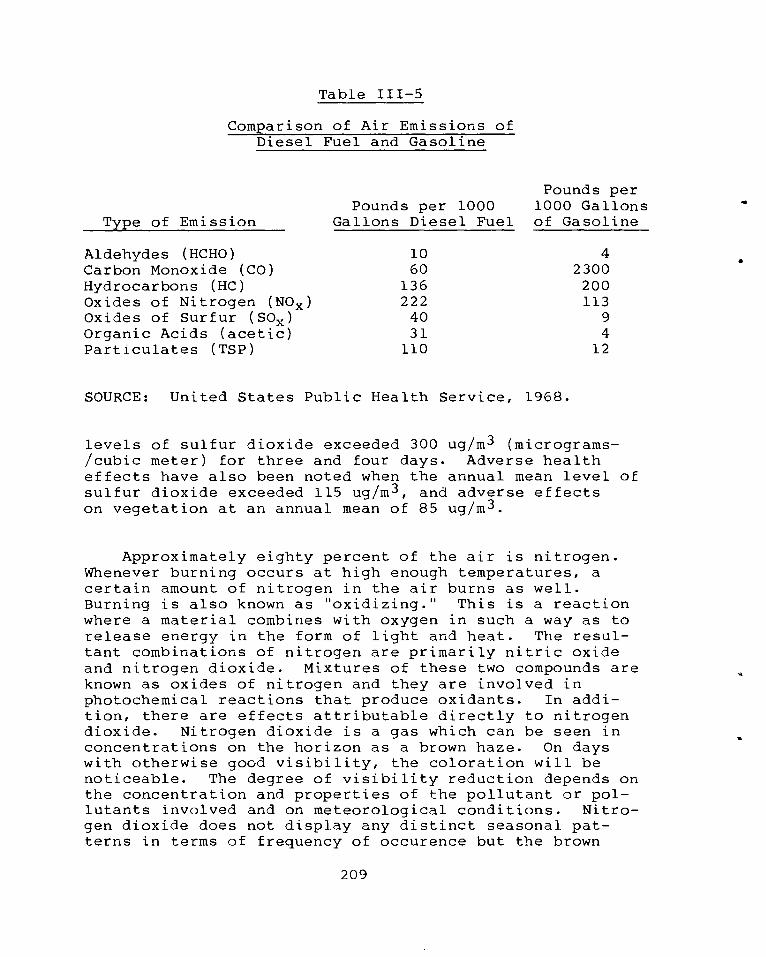
Table 111-5
Comparison of Air Emissions of Diesel Fuel and Gasoline
Type of Emission
Pounds per Pounds per 1000 1000 Gallons
Gallons Diesel Fuel of Gasoline
Aldehydes (HCHO) 10 4 Carbon Monoxide (CO) 60 2300 Hydrocarbons (HC) 136 200 Oxides of Nitrogen (N0 x ) 222 113 Oxides of Surfur (S0 x ) 40 9 Organic Acids (acetic) 31 4 Particulates (TSP) 110 12
SOURCE: United States Public Health Service, 1968.
levels of sulfur dioxide exceeded 300 ug/m 3 (micrograms-/cubic meter) for three and four days. Adverse health effects have also been noted when the annual mean level of sulfur dioxide exceeded 115 ug/m 3 , and adverse effects on vegetation at an annual mean of 85 ug/m 3 .
Approximately eighty percent of the air is nitrogen. Whenever burning occurs at high enough temperatures, a certain amount of nitrogen in the air burns as well. Burning is also known as "oxidizing." This is a reaction where a material combines with oxygen in such a way as to release energy in the form of light and heat. The resul-tant combinations of nitrogen are primarily nitric oxide and nitrogen dioxide. Mixtures of these two compounds are known as oxides of nitrogen and they are involved in photochemical reactions that produce oxidants. In addi-tion, there are effects attributable directly to nitrogen dioxide. Nitrogen dioxide is a gas which can be seen in concentrations on the horizon as a brown haze. On days with otherwise good visibility, the coloration will be noticeable. The degree of visibility reduction depends on the concentration and properties of the pollutant or pol-lutants involved and on meteorological conditions. Nitro-gen dioxide does not display any distinct seasonal pat-terns in terms of frequency of occurence but the brown
209

haze is most visible on the horizon on clear days when a temperature inversion traps the pollutants in the lower layers of the atmosphere. At higher concentrations, damage due to nitrogen dioxide has been observed in sensi-tive plants such as beans, tomatoes, and tobacco. Pul-monary changes have been caused in experimental animals by sustained exposures at higher levels of nitrogen dioxide. Concentrations of 470 ug/m 3 for four hours a day for six days cause structural changes in lung collagen of rabbits; concentrations of 940 ug/mi over various periods of time cause changes in the pulmonary systems of rats and mice.
Particulate matter comes primarily in the form of dust, mist, ash, smoke, and fumes. Smoke, composed of carbon and other products of incomplete combustion, is the most obvious form of particulate pollution associated with human activity. Open fires, incinerators, and fuel burning in vehicles and aircraft all produce particulate matter.
Existing methodologies available to assess the impacts of navigation on air quality are somewhat limited in that major emphasis has been duly directed toward the effects of gasoline-powered motor vehicles with internal com-bustion engines. It is well documented as to the extent that these vehicles contribute to the degradation of air quality in metropolitan areas.
Waterborne vessels, on the other hand, owing to their limited presence in terms of obvious port or river channel congestion and their primary means of propulsion being diesel engines, are relatively minor pollutors of the air.
Additionally, with the gas-powered internal combustion engine, major pollutants such as carbon monoxide (CO), hydrocarbons (HC), and nitrogen oxides (N0x ) have been identified, and numerous sophisticated techniques exist, for example, to predict local microscale concentrations of CO from motor vehicles. The major pollutants associated with the diesel mode engine are sulfur oxides (S0 x ), nitrogen oxides (N0 x ), and particulates (TSP). While the former two may be modeled on a regional basis, their interactive chemistry is complex, and accurate prediction
210
and impact assessment corresponds strongly with local meteorological conditions and secondary atmospheric reactions.
Ships' emission of CO becomes relatively insignificant when compared to the total transportation-induced pollu-tion. Motor vehicles are known to produce up to 85-95% of CO in urban areas.
PRIMARY IMPACTS
(a) Ship Emissions
The primary impacts of waterways navigation on air quality are those related to ships' emissions generated during the following activities:
1. Construction - including the placement of dikes and jetties, revetments and the construction of locks and dam facilities, levees, and break-walls.
2. Operation - including the movement and place-ment of tows, navigational assistance, and commercial transportation.
3. Maintenance - including dredging and dredged material disposal, primarily.
Air pollution emissions from ships are calculated based on the following variable criteria:
1. type of ships (size engine, horsepower).
2. number of ships.
3. type of fuel used (gas, diesel, percentage of sulfur).
4. estimated fuel consumption (per nautical mile, under various work loads and throttle settings).
Fuel oil is the primary fuel used in vessels powered by inboard engines, including steamships, motorships, and gas-turbine powered ships. Steamships are any ships that have steam turbines driven by an external combustion
211
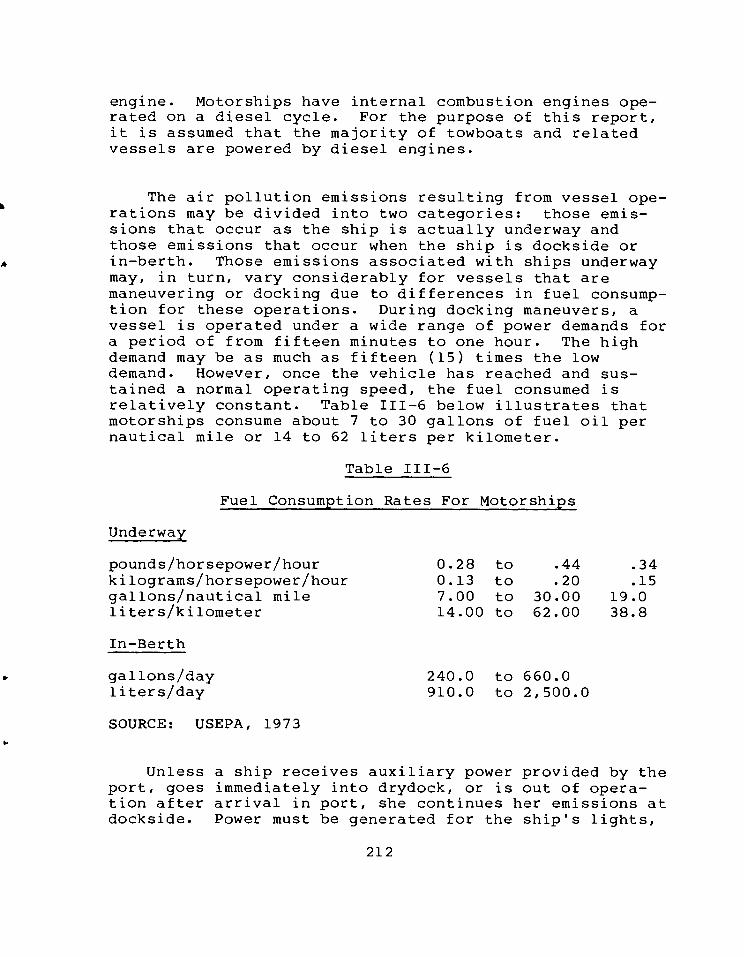
0.28 to .44 0.13 to .20 7.00 to 30.00 14.00 to 62.00
.34
.15 19.0 38.8
engine. Motorships have internal combustion engines ope-rated on a diesel cycle. For the purpose of this report, it is assumed that the majority of towboats and related vessels are powered by diesel engines.
The air pollution emissions resulting from vessel ope-rations may be divided into two categories: those emis-sions that occur as the ship is actually underway and those emissions that occur when the ship is dockside or in-berth. Those emissions associated with ships underway may, in turn, vary considerably for vessels that are maneuvering or docking due to differences in fuel consump-tion for these operations. During docking maneuvers, a vessel is operated under a wide range of power demands for a period of from fifteen minutes to one hour. The high demand may be as much as fifteen (15) times the low demand. However, once the vehicle has reached and sus-tained a normal operating speed, the fuel consumed is relatively constant. Table 111-6 below illustrates that motorships consume about 7 to 30 gallons of fuel oil per nautical mile or 14 to 62 liters per kilometer.
Table 111-6
Fuel Consumption Rates For Motorships
Underway
pounds/horsepower/hour kilograms/horsepower/hour gallons/nautical mile liters/kilometer
In-Berth
gallons/day 240.0 to 660.0 liters/day 910.0 to 2,500.0
SOURCE: USEPA, 1973
Unless a ship receives auxiliary power provided by the port, goes immediately into drydock, or is out of opera-tion after arrival in port, she continues her emissions at dockside. Power must be generated for the ship's lights,
212

1.5
1.4
2.0
43
50
16.5
heat, pumps, refrigeration, ventilation, etc. Auxiliary power for motorships is generally furnished by diesel-powered generators.
An emission factor is a statistical average, or a quantitative estimate, of the rate at which a pollutant is emitted as a result of a particular activity, divided by the level of that activity. Emission factors are esti-mated by a variety of techniques including measurement of typical sources, process material balances and engineering estimates. As such, they are not precise indicators of single source emissions, but rather more accurate when estimating emissions from an aggregation of sources. Based on fuel consumption rates and emission factors for dieseloil combustion, sample emission factors for ships are presented in Table 111-7 for the major pollutants.
Table 111-7
Emission Factors For Motorships
Underway In-Berth
kilograms/ pounds/ kilograms/
Pollutant
pounds/mile
Sulfur dioxide*
Nitrogen oxide
Particulate
kilometer
0.37
0.34
0.49
day day
19.5
22.7
7.5
*Weight of sulfur in diesel fuel has been assumed to be 0.5%
SOURCE: USEPA, 1973
Sample emission factors (grams/hour) for an average 400-HP diesel engine such as those commonly used in tow-boat operations are presented in Table 111-8.
213
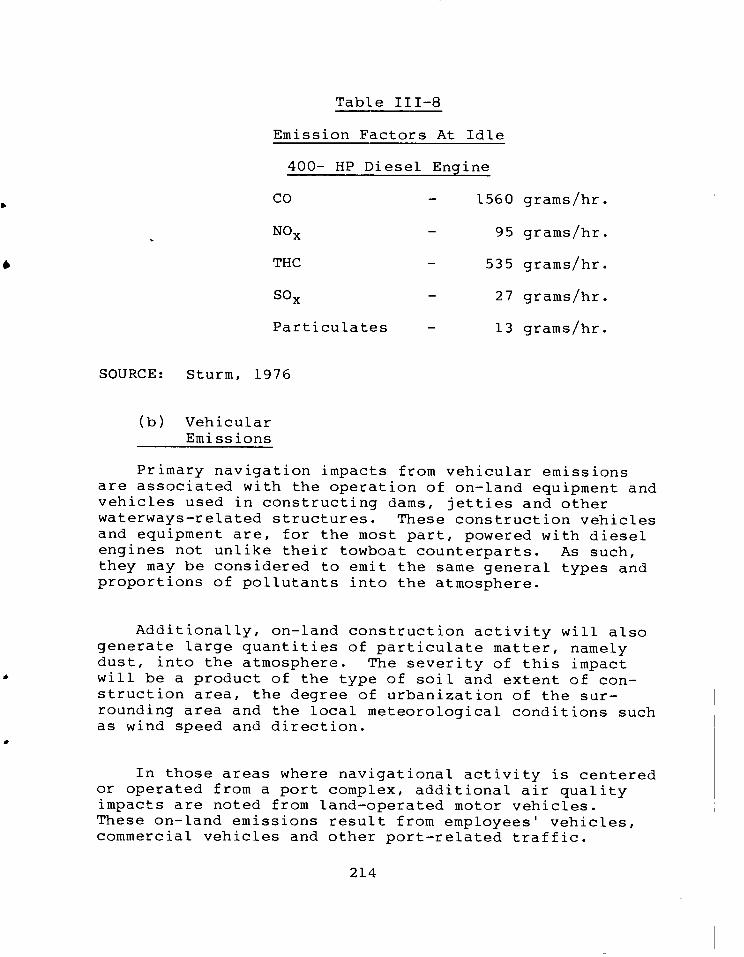
Table 111-8
Emission Factors At Idle
400- HP Diesel Engine
CO - 1560 grams/hr.
NOx - 95 grams/hr.
THC - 535 grams/hr.
SO, - 27 grams/hr.
Particulates - 13 grams/hr.
SOURCE: Sturm, 1976
(b) Vehicular Emissions
Primary navigation impacts from vehicular emissions are associated with the operation of on-land equipment and vehicles used in constructing dams, jetties and other waterways-related structures. These construction vehicles and equipment are, for the most part, powered with diesel engines not unlike their towboat counterparts. As such, they may be considered to emit the same general types and proportions of pollutants into the atmosphere.
Additionally, on-land construction activity will also generate large quantities of particulate matter, namely dust, into the atmosphere. The severity of this impact will be a product of the type of soil and extent of con-struction area, the degree of urbanization of the sur-rounding area and the local meteorological conditions such as wind speed and direction.
In those areas where navigational activity is centered or operated from a port complex, additional air quality impacts are noted from land-operated motor vehicles. These on-land emissions result from employees' vehicles, commercial vehicles and other port-related traffic.
214
A discussion of these impacts will be presented in the following subsection, Secondary Impacts.
SECONDARY IMPACTS
Secondary impacts of navigational activity on air quality are primarily those based on generation of on-land vehicular activity.
Waterways activity, such as port development and con-struction of other land-related facilities, tends to act as an impetus to the generation of increased motor vehicle operation. Whether these vehicles are driven by employees or comprise the construction force, they create added stress to the existing air quality.
The major pollutant associated with on-land motor vehicles is carbon monoxide (CO), an odorless, colorless gas produced by the incomplete combustion of organic material, in this case gasoline. As much as 85-95% of the CO emitted into the atmosphere originates from the opera-tion of motor vehicles. CO is known to affect the health of people exposed to high concentrations over periods of time. If exposure is high enough, dizziness, unconscious-ness, and even death can result.
This report will not attempt to evaluate the effects of portrelated motor vehicle operation on air quality as they may be considered insignificant in terms of overall volumes and operational periods.
The other major secondary impact is that associated with the disposal of dredge material. Dredging operations are the primary maintenance operation associated with maintaining a clear, debris free channel in our national waterways. Dredging has become even more crucial with the advent of the supertanker and the need to maintain chan-nels and port facilities to a depth sufficient to accommodate them.
215
Dredged material may contain a wide range of organic and inorganic compounds, complex synthetic chemicals and a full gamut of residential and industrial wastes which are often introduced into the waterbody untreated. Once this material has been dredged from the waterway bottoms and deposited in a land fill area, it represents a pathogenic potential and may give rise to sundry noxious odors.
While there are presently no standards which address the problem of odor from either a quantitative or qualita-tive standpoint, legal resources such as injunction and fines are often utilized.
From an air quality viewpoint, the potential hazard created by disposal sites is neither severe nor identi-fied, the major objection to disposal location being a product of societal and economically motivated avoidance.
OVERVIEW OF AIR QUALITY STANDARDS
The Environmental Protection Agency (EPA) established, as a minimum, national primary and secondary ambient air quality standards on April 30, 1971 (42 CFR 410). Primary standards define the level of air quality which, with an adequate margin of safety, protect the public health; whereas, secondary standards protect the public welfare. These standards which were established are presented in Table 111-9. The regulation provides that such standards are subject to revision and additional standards may be promulgated as the EPA administrator deems necessary to protect the public health and welfare.
POTENTIAL MITIGATION MEASURES
Although the air quality impacts associated with navi-gation are not significant when compared to other forms of transportation or stationary industrial sources of pollu-tion, there presently exist techniques whereby even these impacts may be lessened.
216

Table 111-9
National Ambient Air Quality Standards
Standard Primary Secondary
Parameter
Particulate Matter Annual geometric mean 24-hour maximum
75 ug/m 3 260 ug/m3
60 ug/m 3 150 ug/m3
Sulfur Oxides Annual arithmetic mean 80 ug/m 3 60 ug/m3 24-hour maximum 365 ug/m 3 260 ug/m 3 3-hour maximum -- 1,300 ug/m 3
Carbon Monoxide 8-hour maximum 1-hour maximum
10 mg/m 3 40 mg/m3
10 mg/m 3 40 mg/m3
Photochemical Oxidants 1-hour maximum 160 ug/m 3 160 ug/m 3
Hydrocarbons 3-hour maximum 100 ug/m 3 100 ug/m 3
Nitrogen Dioxide Annual arithmetic mean 100 ug/m3 100 ug/m 3
Lead Quarterly arithmetic mean 1.5 ug/m 3 1.5 ug/m 3
ug/m 3 = micrograms per cubic meter
mg/m3 = milligrams per cubic meter
SOURCE: E.P.A. 25 November, 1971. 40 CRF 50 36 FR 22389
217
Regular inspection of the diesel engine equipment cojoined with proper maintenance will ensure the maximum efficiency from the combustion of fuel. Moreover, periodic testing of the emissions effluent may provide additional information as to the degree of efficiency with which the engine is performing.
Concerning the major maintenance task of dredging and dredged material disposal, air quality impacts associated with odors could be minimized if aquatic dumping were utilized.
Concerning the construction impacts associated with the generation of particulate matter (dust), such tech-niques as phased clearing and watering of the exposed soil surfaces will minimize these effects.
SUMMARY
The preceding discussion has indicated the primary and secondary impacts of navigation on air quality and gen-erally presented a review of the National Ambient Air Quality Standards.
From an historical perspective, the navigational impacts on air quality have been treated cursorily and, to a large extent, this treatment has been somewhat justi-fied. The overall air pollution resulting from navigation is far less than other surface modes of transportation, such as trucks, and is also comparable to, or less than, railroad, depending upon such variables as terrain, etc. It may be stated, therefore, that air pollution from navi-gation activity, as a subset of overall transportation modes, is rather minor. A study of riverboat emissions in the St. Louis, Missouri region showed that waterways traf-fic, when compared to other transportation modes, yielded 3.1% of NOR , 0.47% of HC, 0.21% of CO, 5.9% of SOx and 2.2% of particulates (see Table III-10 below).
218
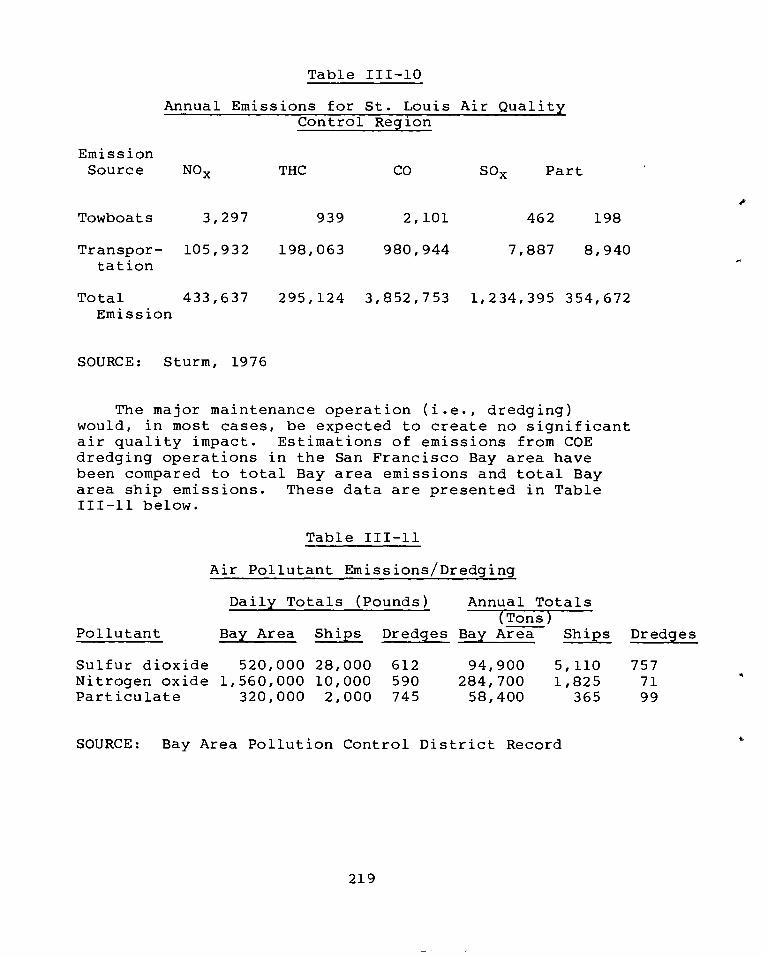
Table III-10
Annual Emissions for St. Louis Air Quality Control Region
Emission Source NO THC CO SO x Part
Towboats 3,297 939 2,101 462 198
Transpor- 105,932 198,063 980,944 7,887 8,940 tation
Total 433,637 295,124 3,852,753 1,234,395 354,672 Emission
SOURCE: Sturm, 1976
The major maintenance operation (i.e., dredging) would, in most cases, be expected to create no significant air quality impact. Estimations of emissions from COE dredging operations in the San Francisco Bay area have been compared to total Bay area emissions and total Bay area ship emissions. These data are presented in Table III-11 below.
Table III-11
Air Pollutant Emissions/Dredging
Daily Totals (Pounds) Annual Totals (Tons)
Pollutant Bay Area Ships Dredges Bay Area Ships Dredges
Sulfur dioxide 520,000 28,000 612 94,900 5,110 757 Nitrogen oxide 1,560,000 10,000 590 284,700 1,825 71 Particulate 320,000 2,000 745 58,400 365 99
SOURCE: Bay Area Pollution Control District Record
219
From inspection of the above table, dredging opera-tions resulted in the annual addition of 757 tons S0 x , 71 tons NOx , and 99 tons TSP or 0.79%, 0.02%, and 0.16%, respectively of the total annual Bay area emissions.
It would appear plausible for the future that for those geographical areas presently experiencing aggravated air quality conditions, the additional atmospheric pol-lutants introduced by navigation would receive greater interest. In areas such as San Francisco where meteoro-logical regimes are conducive to inversion, additional NO and HC from waterways activities in the presence of sunlight may increase smog and smog-related oxidants and acidrains.
220

D. NOISE IMPACTS
ENVIRONMENTAL CONCERNS
The development and use of inland waterways, in many instances, will be accompanied by the increased generation of noise. Assessing the negative impacts, if any, of increased noise levels requires the identification of ambient sound levels, assessment of activity related noise-level increases, and analysis of the impacts of the resultant noise levels on the neighboring populace and environment. While maximum acceptable noise levels are likely to be specified by state or local health, safety and welfare provisions; zoning ordinances; and other regu-lations, compliance with these codes does not imply the absence of negative impacts.
Noise levels likely to be generated during the devel-opment and use of inland waterways will not result in any physiological damage to or impairment of the auditory sen-ses of affected individuals. Any manifestations of increased noise levels will probably take the form of increased stress, emotional disturbance, or reduced effi-ciency. Other negative impacts, such as interference with speech communication, relaxation, or privacy, may result. The threshold for these impacts will vary greatly between individuals and will depend on the person's sensitivity and exposure patterns. Where such impacts are exper-ienced, they may be accompanied by a decrease in property values or decreased appreciation rates in relation to similar non-impacted properties.
The sole impact on the general environment identified with increased noise levels is the localized out-migration of wildlife from affected areas. Some species of wildlife may react to the continual or periodic presence of dis-turbing levels of noise by avoiding the general location of the sound's origin. Secondary impacts may result from the absence of species critical to certain food-chain interrelationships. Such impacts would have to be evalu-ated on a site-specific basis.
The Environmental Protection Agency (EPA) has identi-fied a level of protection for the general population which it believes provides an adequate margin of safety
221
against activity-interference. This level is expressed as the "day-night sound level" (Ldn) and is set at 55 dB(A) for the general out-of-doors environment. A 10 dB(A) pen-alty is incorporated in this level for noise generated during the night. The effects of increased noise levels depends to a great extent on the magnitude of the increase above ambient conditions. Generally, an increase in sound levels above ambient by less than 10dB(A) would be con-sidered a minor impact while larger increases would repre-sent a major impact. The 15 dB(A) point represents a five-fold increase in sound intensity over ambient conditions.
(a) Construction Noise Impacts
Impacts related to waterways construction activity noises are likely to be greater than noise impacts encoun-tered during any other phases of waterway facility devel-opment and use. The operation of heavy equipment such as graders, pile-drivers, and cranes, as well as the use of explosives to fracture rock masses will generate high levels of noise in the area surrounding the construction site. Additional noise impacts will result from truck traffic to and from the site. This effect will be felt along the entire route taken by trucks during construction operations.
Currently, heavy trucks emit approximately 90 dB(A) at a distance of 50 feet. Under Federal standards, new-truck noises were reduced to 83 dB(A) at 50 feet in 1978 and will be further reduced to 80 dB(A) at 50 feet in 1980. In the absence of attenuating topography or vegetation, noise from pre-1978 trucks would not drop below the EPA day-night sound level of 55 dB(A) for a distance of 3,200 feet from the source. Noise from trucks meeting the 1980 standards would fall to the same level at a distance of only 900 feet from the source.
The EPA has promulgated similar noise emission stand-ards for most types of heavy construction equipment. The use of newer equipment which meets these product standards will greatly reduce the area impacted by construction noise.
222

(b) Operation Noise Impacts
Noise impacts will vary with the nature of the water-way project being considered. Operation of flow control of impoundment facilities such as dikes, revetments, and levees will generally have no associated noise impacts. Waterways intended for the use of waterborne transport will produce periodic noise impacts in the form of boat and barge traffic. The principal noise impacts of lock and dam operations result from the use of pumps, gene-rators, motors and other machinery at the facility. All of the above impacts are generally minimal because of the amenability of the sources to noise control techniques.
Significant noise impacts are likely to be present at port facilities. Truck and railway traffic to and from the facility and loading/unloading operations results in periodic noise emissions both at the port facility and throughout the region served by the port. Such region-wide impacts must be weighed against the impacts which would result if alternate modes of material transportation were used.
(c) Maintenance Noise Impacts
The noise impacts resulting from the upkeep of ports, locks, dams, and other waterway facilities in general will be considerably lower than those associated with the ini-tial construction of the facility. Maintenance operations at such facilities will usually be of short duration and required only after extended periods of operation. Conse-quently, maintenance should have minimal noise impacts over the life of the facility.
Dredging operations required to maintain safe, navi-gable channels result in noise impacts dependent upon, among other factors, the type of dredges used. Hopper or suction dredges are considered to produce relatively low noise emission compared to other dredge types. Regardless of the dredge used, most noise emissions from dredging operations will be inaudible beyond 300 feet from the dredge site. Typical sound level ranges resulting from dredging operations are presented in Table 111-12.
223
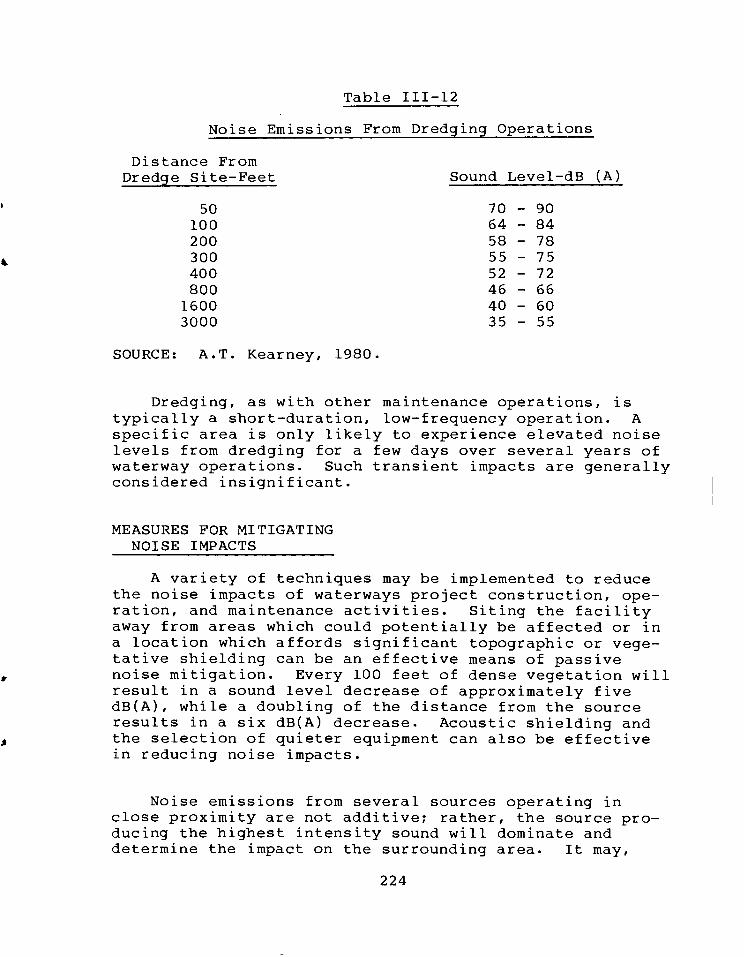
Table 111-12
Noise Emissions From Dredging Operations
Distance From Dredge Site-Feet Sound Level-dB (A)
50 70 - 90
100 64 - 84
200 58 - 78
300 55 - 75
400 52 - 72
800 46 - 66
1600 40 - 60
3000 35 - 55
SOURCE: A.T. Kearney, 1980.
Dredging, as with other maintenance operations, is typically a short-duration, low-frequency operation. A specific area is only likely to experience elevated noise levels from dredging for a few days over several years of waterway operations. Such transient impacts are generally considered insignificant.
MEASURES FOR MITIGATING NOISE IMPACTS
A variety of techniques may be implemented to reduce the noise impacts of waterways project construction, ope-ration, and maintenance activities. Siting the facility away from areas which could potentially be affected or in a location which affords significant topographic or vege-tative shielding can be an effective means of passive noise mitigation. Every 100 feet of dense vegetation will result in a sound level decrease of approximately five dB(A), while a doubling of the distance from the source results in a six dB(A) decrease. Acoustic shielding and the selection of quieter equipment can also be effective in reducing noise impacts.
Noise emissions from several sources operating in close proximity are not additive; rather, the source pro-ducing the highest intensity sound will dominate and determine the impact on the surrounding area. It may,
224
therefore, be possible to significantly reduce the noise impacts of a particular project by reducing the operating sound level emanating from a single piece of equipment.
The impacts of a given level of sound emission will Lary, depending on background conditions. Environments with low background sound levels will, in general, experi-ence higher negative impacts from a given noise-generating activity than an environment in which ambient sound levels are already high.
A,
225

E. SOCIOECONOMIC IMPACTS
INTRODUCTION
One of the main purposes of waterways projects is to enhance economic development. Hence, the construction, operation and maintenance of waterways projects can pro-duce significant socioeconomic impacts on surrounding com-munities and outlying areas. Various types of socio-economic impacts may be prominent, depending on the nature, size and location of the project. In addition, the impacts may affect an area from a small town to a multi-state region or to the nation as a whole.
The purpose of this section is to describe the socio-economic impacts associated with waterways projects. The impacts are presented according to their nature (primary or secondary impact), the kind of effect they produce (positive or negative), and the function occurring with respect to the type of project which causes these impacts (i.e., construction, operation, and maintenance). River navigation programs, ports, harbors, locks, dams, ter-minals and navigation channels are all examples of water-ways projects which can cause socioeconomic impacts. This section includes examples of socioeconomic impacts resulting from specific waterways projects.
Socioeconomic impacts cover a broad range of social and economic factors related to the development of a com-munity, region, or the nation. With respect to waterways, the major socioeconomic factors are population, employ-ment, personal income, property values, goods and ser-vices, community facilities, government revenues, trans-portation, recreation, aesthetics, and safety considera-tions. Though large in number and scope, when identified and analyzed individually, socioeconomic factors are actually highly interrelated. This section also identi-fies some of the more common interrelationships among individual factors.
The difference between "primary" impacts and "second-ary" impacts is important. A primary impact constitutes a direct consequence of waterways development. A secondary impact constitutes an indirect consequence, one which is
226
derived from one or more primary impacts. The distinction between primary and secondary impacts can be drawn through an analysis of the effects of a navigation channel project on local employment. The construction, operation and maintenance of a navigation channel requires the direct or primary employment of additional manpower beyond that which is originally employed in the area. As a result of this new employment, demand increases for local goods and services, which leads to additional secondary jobs in those industries supplying materials to the project, as well as consumer-related industries (e.g., food, clothing, housing, entertainment, local transportation).
The primary and secondary impacts of waterways pro-jects are identified within three areas, or spheres of activity:
- Construction.
- Operation.
- Maintenance.
Within each sphere, the socioeconomic impacts associ-ated with that activity can be positive or negative. Often, an impact will actually have both positive and neg-ative consequences. For example, population increase will lead to a demand for more local goods. Employment then increases, but the prices of these goods may increase as well.
CONSTRUCTION
The major impacts of waterways construction activities generally accrue to a limited area, local or regional, in scope and do not produce lasting or national repercus-sions. Within that area, however, the impacts of con-struction can be very significant, both during and shortly after the construction period.
(a) Primary Impacts
Of all the impacts associated with waterways develop-ment, the primary impacts of construction are generally the most recognizable.
227
The most significant and positive impact to accrue from waterway-related construction is the creation of jobs for the project. The increased supply of jobs will cause population increases through a migration of people into the area since many of the responsibilities require special skills which may not be sufficiently available through the local work force. Personal incomes expand, as do demands for local goods and services.
In many cases, these demands produce beneficial effects by creating more trade and investment in the local economy. For example, a recent assessment of the con-struction expenditures for the McClellan-Kerr Arkansas River Navigation Project showed that direct and indirect income effects totalled $1.9 billion from the t1.3 billion construction expenditures. About thirty-five percent of the output and fifty-two percent of the income impacts stayed in the waterway region (Antle, unpublished).
A study of the proposed Tennessee-Tombigbee waterway in Alabama and Mississippi estimated that 4,300 workers will be needed during the peak construction period, of which 3,400 will be locally hired workers (COE, 1976).
As employment increases due to the construction of a waterways project, population and per capita income within the region will rise accordingly. As a result, the demand for a wide variety of goods and services within the region will also rise. Employment increases have mixed conse-quenCes, however, as in the case of housing. The cost of home purchase or rental may increase in an area due to an increased market demand.
Other negative impacts can also arise as a result of waterways construction projects. The primary impacts arise particularly on the construction site itself. People and businesses may be displaced. In the case of dam construction, these residential and business displace-ments may be major and significant. Existing natural, cultural or historical attractions may be damaged or destroyed. Valuable farmland may also be destroyed. Tax
228

revenues at the site are often diminished due to construc-tion or government acquisition. Temporary disruptions of waterway and land-based traffic can also result from the construction activities.
The COE, St. Paul District, has recently completed an Environmental Impact Statement on the effects of the reha-bilitation of Locks and Dam No. 1 in Minnesota. While not centering specifically on the major socioeconomic factors associated with resource development (population, employ-ment, trade), the study is significant for identifying certain shortand long-term effects which are not generally included in related reports. Construction activities are expected to cause increased traffic congestion and hazards, as well as some interruption of tourism in the surrounding area. However, rehabilitation is expected to ultimately benefit recreation in that the delay time for locking operations will be decreased.
(b) Secondary Impacts
Waterways construction projects have a rippling or multiplier effect on a local economy. These secondary impacts usually take longer to develop than do primary impacts, but they can still be significant and long lasting.
The major secondary benefits of construction generally derive from the increased employment, population and per-sonal income associated with construction, per se. Secondary service industries arise accordingly. These service industries can be supportive in nature (i.e., su2- plying equipment and materials to the project) or consumer related (i.e., providing goods and services to the w.Drkers and their families).
This increase in number and size of related industries has a positive effect on local, state and federal tax revenues. Savings can also accrue to governments through reduced employment compensation, social services and wel-fare payments.
229

The positive impacts can be somewhat neutralized by corresponding negative impacts, particularly with respect to the effect of population and economic growth on the structure of the local community. A "boom town" phenome-non can develop in which public schools, transportation systems, utilities, health systems, recreational services and waste management facilities may become over-utilized, leading to the need for public investment for expansions or new facilities. Applying increased tax revenues to expand the existing structure may not fully solve this problem, since many of the new in-migrants may leave the area once the construction project is completed. If the community infrastructure has been expanded to accommodate the new population, the facilities may become under-utilized after construction is completed and construction workers and their families leave the area.
Other negative impacts arise. The community will have to adjust to a new and possibly more highly technical group of people. Economic and social values will be threatened, and the community leadership may change. Ongoing plans and development programs may have to be revised or possibly terminated due to the project and resulting population increases.
Growth, that occurs too fast will also produce an inflationary effect on the local economy as a result of increased demand for goods and services. Many local resi-dents, particularly the poor and those on fixed incomes, may find the increased costs difficult to bear.
OPERATION
Definite changes occur in the impacts of a waterways project once construction is completed and operation begins. The effects on the local economy are generally not as great or immediate. Regional factors increase in significance, especially with regard to the transportation industry and industrial development.
(a) Primary Impacts
The combined socioeconomic impacts of waterways project operations on the local area and the region are
230
generally positive. The "permanent" nature of this acti-vity will provide a sound foundation for growth in population, employment and personal income.
For example, the McClellan-Kerr project has resulted in approximately 59,000 new jobs. In addition, per capita income in the waterway counties increased from eighty-five percent to ninety percent of the national average between 1970 and 1975. Urban counties in the region now exceed national average per capita income (Antle, unpublished).
For the proposed Tennessee-Tombigbee Waterway, the Corps estimates that, as a direct or indirect result of project construction, approximately 3,400 new jobs will be created for craftsmen, foremen and kindred workers; about 5,000 new jobs will be created for operatives; and about 2,700 new jobs will be created for common laborers. It is expected that local hirees will constitute approximately eighty percent of the work force. In addition, about thirty-two percent of the new jobs will go to minorities, based on the Corps' Affirmative Action Program. Area eco-nomic redevelopment is expected to be one of the largest sources of benefits from the Tenn-Tom project, generating $15.4 to $16.8 million/year in benefits (COE, 1976a).
Other important primary impacts •include the costs of transporting bulk commodities (i.e., farm commodities and manufacturing commodities) which can be reduced on a local or regional basis due to waterways projects. The COE estimated in 1971 that about $8 per ton savings on inbound and outbound traffic were realized on the McClellan-Kerr project (Antle, unpublished). Also, land surrounding a waterway project can be converted to more productive uses in agriculture, manufacturing, business or recreation. Improvements in waterway navigation often can also result from waterway projects. These improvements, acting with other activities, encourage industrial development.
Hydroelectric power generation from waterways projects can provide a relatively inexpensive source of electricity to the region. For example, about 2,600 megawatt-hours are generated annually by the McClellan-Kerr project, saving nearly four million barrels of oil a year (Antle, unpublished).
231
Flood control can be an important primary benefit. Records kept since the McClellan-Kerr project was com-pleted showed that flood damages along the waterway have been reduced by more than $10 million per year. These benefits mainly are due to the upstream dams.
The negative impacts of operations will generally not change appreciably from those encountered in the con-struction stage, except with regard to transportation. Rail and trucking companies may lose business in the bulk commodities, although increased economic activity could increase their business for other goods. Increased traf-fic on the waterway could lead to congestion and changes in the surrounding environment if the traffic flow is not properly managed.
(b) Secondary Impacts
The secondary impacts of waterway operation are more varied and diversified than the primary impacts. The most significant factors are that employment and income increase in manufacturing and some transportation indus-tries through the opening or improvement of a navigation source. Industrial development also increases along the waterway in the form of support and consumer-related industries necessary for manufacturing and transpor-tation. Community development along the waterway will be enhanced through the increased development and employment opportunities, goods, services, residential development, and cultural community facilities engendered. Increased government revenues also result from these activities.
An important secondary socioeconomic impact is the use of reservoirs and waterways for recreation. In 1976, over 391 million persons visited public use facilities at COE projects. The COE currently manages more than ten million acres of land and water for recreation and other uses (COE, 1976b).
According to an IWR study, people visiting the McClel-lan Kerr project 'spent $9.62 and t9.54 per visitor-day in 1974 and 1975, respectively (IWR, 1977). Aggregate expen-ditures for recreation were estimated at t193 million in
232
1974 and $224 million in 1975. The aggregate value of recreation equipment owned by on-site recreationists in 1975 was estimated at over $427 million. Approximately 5,800 seasonal and permanent homes have located around the lakes and the waterway and they have an additional $11.5 million in recreational equipment. The value of these homes is approximately $146 million, according to Antle (1979).
The recreation benefits estimated as a result of the proposed Tennessee-Tombigbee Waterway are estimated by the COE to be $4.8 and $6.9 million per year for the initial project and the ultimate project, respectively (COE, 1962). Certain negative secondary impacts can also arise. For example, land development patterns may change, leading to greater urbanization in some areas. Most com-monly, land is removed from agricultural use to other pur-poses. While the new land use may be productive, the loss of agricultural land can be significant since agricultural production provides export commodities - and thus helps to offset the nation's balance of payments deficits.
Established local land use plans and development pro-grams may be disrupted due to waterways projects and attendant economic development. In addition, the possi-bility may exist for marginal economic decline of inland communities due to emigration closer to the waterway project.
The local activities and rate structures of rail and trucking industries may be temporarily disrupted as a result of the new waterway project, but long-term negative impacts are seldom expected. However, economic develop-ment along one waterway project in some cases may impede development along other waterway projects. Demands will rise for community facilities and services, although the community might already have built an infrastructure during the construction period sufficient to accommodate the demands.
In a research study titled "Population Change, Migra-tion and Displacement Along the McClellan-Kerr River Navi-gation System" in Oklahoma and Arkansas, the Department of Sociology at the University of Missouri identified and
233
analyzed the impacts of a navigation system and its reser-voirs upon population change, especially migration. The study found that the waterway had a major positive impact on population growth and economic progress in the region, although other supplementary factors were also important. The important related factors included community leader-ship, transportation systems, available labor pool, and proximity to markets and metropolitan areas. The navi-gation system also caused negative impacts, particularly the displacement of residents in the project areas. The projects also generally benefited the in-migrants more than the local populace, due to migrants' more highly competitive qualifications for jobs.
The COE, Memphis District, is currently studying the environmental impacts of navigation along the White River to Batesville, Arkansas. This study is important for its attention to the many direct and indirect factors related to the improvement and operation of a navigation channel. Improvement is expected to stimulate growth in water related industry along the channel directly, and in all sectors of the region and the nation indirectly. Losses are expected in overland transportation, however, in the form of potential revenue, employment, and income in rail and trucking.
The Vicksburg District COE has completed a detailed project report on the effects of port development in Mad-ison Parish, Louisiana. Beyond its identification of the more common impacts associated with waterway development of employment, trade, etc., the study concentrates on the demand which will be created for more and better public services and facilities, including police and fire protec-tion, hospitals, transportation, water, waste disposal, libraries, recreational facilities, and schools. The report notes, however, that expanding such services and facilities often places higher tax burdens on the general public, including those who may not significantly benefit from port development.
MAINTENANCE
Of the areas identified as producing socioeconomic impacts, maintenance activities may be considered signifi- cant in that unless adequate maintenance is utilized, the
234
ultimate benefits of the project may not be realized. Some of the major primary impacts of maintenance are the same as those which accrue through construction and opera-tions, such as increased population, employment, and income. However, while the increases in population, employment and per capita income of maintenance are small in comparison with those accruing in the other areas, waterway safety, greater efficiency of use, improved vis-ual appearance, and greater recreation potential are defi-nite positive primary impacts of maintenance activities. Furthermore, these types of benefits are only partially accounted for in the construction and operation stages. In short, with adequate maintenance, a project can be uti-lized, leading to the employment, income and tax revenues that were the reason for project development.
Several significant secondary benefits also accrue through waterways maintenance. Proper maintenance will extend the life and usefulness of the project and will ensure that both transportation and recreation users derive benefit from its operation. Moreover, adequate maintenance ensures that the project will conform with local, state and federal codes, laws and plans. This will help to ensure that the waterway project will remain an attractive and effective local and regional asset.
The most significant negative impacts of maintenance activities involve dredging and dredged material dis-posal. This disposal of dredged material can remove land areas from productive uses (e.g., agriculture, recreation, commercial business). Tax revenues from the productive use of the land can also be lost.
Maintenance activities can also have short-term impacts on the use of a waterway and its surrounding area. This can cause disruptions in agricultural, com-mercial, and recreational activities. Maintenance will also increase harbor use and other user charges.
MITIGATING MEASURES FOR ADVERSE IMPACTS
Waterways development produces positive benefits for an area. Increased income, employment, population and tax
235

revenues are very attractive incentives to local and state officials. They also encourage the development and expan-sion of local industry. Often, these positive factors appear so advantageous that the negative impacts are ignored or not given proper consideration. Yet the conse-quences of underutilization of local labor supply, over-extension of public facilities, insufficient safety meas-ures, conflicts between in-migrants and local residents, and the displacement of people from the site can be so severe as to modify or even negate the benefits. Con-flicts also arise among user groups and between economic development and environmental groups. Thus, it becomes incumbent upon all levels of leadership, and particularly local leadership, to assess the effects that a waterway will have on a community and region and develop appro-priate strategies for adjustments.
After a waterways project is completed, it is incum-bent on federal, regional, state and local planning orga-nizations and governments to continue to work together in order to mitigate negative impacts and to attain higher levels of benefits with the existing waterways facilities.
Various possibilities emerge. The community may establish a development corporation or investment corpora-tion with the function of developing the resources and programs to insure that its best interests are protected. Such programs may include vocational training programs to prepare the local labor force for technical functions related to project development. They may include safety and health codes which will provide a bulwark against the problems of an expanded population, haphazard housing and industrial development, insufficient water supply, inade-quate sewage systems, and sprawling transportation networks.
A community, particularly a rural community, may even wish to divest responsibility for its welfare to a higher authority, such as a regional planning commission or state government. The community must still remain actively involved in the development process, however, to see that its interests, rather than those outside the area, are maintained.
236
Whatever direction a community takes in planning for its future in conjunction with a waterway, it will not be able to avoid the negative consequences completely. What local leadership will have to do is analyze the com-munity's assets and liabilities and attempt to incorporate the new or improved waterways project into the existing physical and institutional framework.
SUMMARY
Socioeconomic factors are extremely important in studies on waterways development in the United States. As population increases, transportation costs escalate and resources diminish, the need to ensure that development is in the best interests of the greatest number of people also increases. As Harry Ashmore, a historian and former Little Rock newspaper editor, once viewed the McClellan-Kerr project, "The fickle Arkansas, which scourged the countryside with floods and shrank to a trickle in seasons at drought, now runs bank for the year around, controlled by locks and dams that open up navigation back into what used to be Indian country and lace the great valley with clear lakes. The quality of life has visibly improved...." (Ashmore, 1976).
237
F. CULTURAL RESOURCES AND AESTHETIC IMPACTS
Significant potential exists for both positive and negative impacts on American cultural, historic, and aes-thetic resources as a result of waterways projects. The value of these resources and the impact of changes on them cannot be readily quantified; however, their protection and preservation is, in spite of their intangible nature, of lasting and real significance for these resources embody the heritage of the American people and the beauty of the American landscape.
CULTURAL AND HISTORIC IMPACTS
The National Historic Preservation Act of 1966, Execu-tive Order 11593 and the Archeological and Historic Preservation Act of 1974 have laid the groundwork for pro-tecting and preserving American cultural and historic resources.
In complying with the regulations promulgated under the National Historic Preservation Act of 1966, the COE must consider, for each undertaking, the impacts of the project on any historic properties listed in or eligible for listing in the National Register. Properties which are judged to be significant in American history, archi-tecture, archaeology, or culture, including districts, sites, buildings, structures and objects of state and local importance, may the eligible for listing in the National Register. These properties must "possess integ-rity of location, design setting, materials, workmanship, feeling and association" or meet one of the following criteria (36 CFR, Section 800.10).
1. Be associated with events that have made a 1 significant contribution to the patterns of our history.
2. Be associated with the lives of persons sig- 1 nificant in our past.
3. Embody the distinctive characteristics of a type, period, or method of construction, or that represent the work of a master, or that possess high artistic values,
238
or that represent a significant and distinguishable entity whose components may lack individual distinction.
4. Have yielded, or may be likely to yield, in-formation important in prehistory and history.
Several types of properties having historical signifi-cance may be impacted by waterways projects. These will range from prehistoric shell and humus middens (e.g., pre-historic fossil diggings) to sunken shipwrecks. A classi-fication of properties can be constructed by examining the periods of history over which they were deposited.
The Archeological and Historic Preservation Act of 1974 provides for the preservation of historical and archeological data (including relics and specimens) which otherwise could be lost or destroyed as the result of: (1) flooding, the building of access roads, the erection of workmen's communities, the relocation of highways and railroads, and other alterations of the terrain caused by the construction of a dam by any agency or (2) any alter-ation of the terrain caused as a result of any Federal construction project or Federally licensed activity or program.
The COE and any other Federal agency must notify the Secretary of the Interior before constructing or issuing a license to construct a dam, identifying the site of the proposed dam and the approximate area to he flooded or otherwise changed. If a Federal construction project or Federally licensed activity could result in the destruc-tion of significant scientific, prehistorical, historical or archeological material, then the Department of the Interior or the cognizant Federal agency may take appro-priate actions. They may conduct preliminary surveys and take steps to recover, protect and preserve the material.
The Department of the Interior can survey any Fed-erally financed construction site and recover, protect and preserve any material deemed to be archeologically or historically significant.
239
It is generally thought that mankind arrived in America in large numbers around 15,000 B.C. during the post-Wisconsin deglaciation period. Prehistoric proper-ties from before this period will usually be limited to shell middens and fossils. From 15,000 B.C. to 6000 B.C., the Paleo-Indian Period, American inhabitants are believei to have been nomadic hunters who followed the migrations of large animals such as the mammoth. Artifacts from this culture are widely distributed across the United States. By the end of this period, the people became more sedentary, established settlements...and began making crude tools.
By 2000 B.C., the end of the Meso-Indian Period, the transition to a sedentary, more complex culture was com-pleted. Artifacts from the Neo-Indian Period, 2000 B.C. to 1600 A.D., include clay pots, non-utilitarian articles, lithic tools, burial mounds with associated death-cult objects, and other articles indicating a developed complex culture.
Intense European colonization of America began about 1600 A.D. Many forts, settlements, and encampments were established along major rivers. The rapid influx of set-tlers forced native Americans to gradually abandon their villages and move westward. It is estimated that villages of American Indians along the shores of large rivers and lakes numbered in the tens of thousands.
As the immigration to America continued, new settle-ments sprang up along the rivers. Riverboats became a dominant method of transporting goods and people among these settlements. By the time of the Civil War, it is estimated that several thousand steamboats were plying the major rivers of the country. Over 500 steamboat wrecks have been identified in the waters of the lower Mississippi alone.
Properties built in recent times, such as bridges, missionaries, churches, houses, plantations, abandoned towns, and settlements, may also be of historical impor-tance as determined by the criteria presented earlier. Cemeteries, even if not included on the National Register, wherever possible should be spared any damaging impacts because of their religious significance as well as the
240
historical worth of the information contained on tomb-stones. Many states and localities have ordinances specifically protecting cemeteries.
In some instances, waterways projects can result in positive impacts on historic properties. Historical sur-veys conducted in connection with the construction of new facilities or maintenance of existing facilities may result in the unearthing or discovery of historic resources which might otherwise have gone unnoticed. This can occur when a project is planned in an area where no detailed historical survey has previously been conducted, and such a survey is deemed appropriate by responsible authorities. Perhaps more significant is the protection afforded existing historic properties by flood-control projects. Natural fluctuations in river and lake levels over the years have destroyed countless historic proper-ties and sites. Flood-control projects of the COE protect many historic properties from such damage and destruction.
The regulations developed under the National Historic Preservation Act identify five criteria for determining if a proposed project will have an adverse effect on a property listed in or eligible for listing in the National Register. Identification of any of the following would result in a determination of adverse effect:
1. Destruction or alteration of all or part of the property.
2. Isolation from or alteration of the property's surrounding environment.
3. Introduction of visual, audible, or atmos-pheric elements that are out of character with the property or alter its setting.
4. Neglect of a property resulting in its deterioration or destruction.
5. Transfer of a property without adequate con-ditions or restrictions regarding preservation, maintenance, or use.
241

Construction activities and dredge material disposal are the principal waterways project activities likely to physically damage historic properties. Clearing, grading, re-definition of local lineaments, and other construction activities generally destroy existing historic properties or preclude future excavations at the construction site. Land disposal of dredge materials may also preclude fur-ther excavations depending on the depth of materials placed at a site.
Almost any waterways project has the potential to introduce visual or audible elements which could be judged to be out of character with a historic property in the immediate area. Such determinations, as well as the ade-quacy of any mitigating measures, must be assessed on a case-by-case basis for the project under consideration.
Under the National Historic Preservation Act, the National Register must be consulted to determine if a registered historic property is located in the vicinity of any proposed waterways project. The potential impact on any identified National Register property must be assessed and reported to the State Historic Preservation Officer. The State Historic Preservation Officer and the National Advisory Council on Historic Preservation have the author-ity to block a project if the resulting impact is judged unacceptable.
If no National Register properties are identified at the site, the State Historic Preservation Officer may, if no detailed historic survey of the site has been con-ducted, order such a survey. This is usually required only when significant potential exists for historic properties to be located at the site by virtue of the area's known historical significance, geological features, or other relevant characteristics. Should a potentially historic property be unearthed during a project, actions at that site must cease and the State Historic Preser-vation Officer notified.
Two basic methods exist for mitigating a project's impact on a historic site: alteration of the project or removal of the historic property. Where the historic properties in question consist of artifacts, fossils, or
242
middens and the site itself has little historic value, it may be possible to reach an agreement with the State His-torical Preservation Officer and other concerned parties whereby the properties will be salvaged from the site prior to its use for the intended project. In the case of small structures, such as houses or covered bridges, it may be possible to have the property moved to a new site, where the property would be more accessible to the public, thereby freeing the original site for the intended project.
AESTHETIC IMPACTS
Aesthetics, the appreciation of things of beauty, can include both naturally-occurring and man-made features. To preserve naturally-occurring aesthetic resources, the Federal government has identified areas such as national forests, parks, and seashores; wild and scenic rivers; and natural landmarks for protection. Waterway development in such areas would be greatly restricted or prohibited alto-gether. Where not regulated by specific codes, waterway activities should, to the extent possible, be sited and planned to harmonize with the natural environment and not detract from scenic natural features.
Flood-control projects such as impoundments, levees, and dikes, which tend to blend well with the natural envi-ronment may be considered to have a positive aesthetic impact. Levees tend, however, to lower the natural wild or scenic impression of a flowing water body. Artifical waterways or canals, because of their man-made appearance, are not usually considered aesthetically pleasing. Where an undisturbed natural environment is altered by such waterway activities, some degree of negative aesthetic impact is usually incurred. Larger structures such as dams and locks are sometimes considered aesthetically pleasing by virtue of their magnitude, symmetry, and engi-neering complexity. Ports and loading/unloading facili-ties, on the other hand, are generally associated with negative aesthetic impacts by virtue of their noise, traf-fic, and utilitarian appearance.
Reactions to the sight of waterway traffic, such as boats and barges, will differ according to individual preferences. Many people enjoy the sight of river trans-ports while a person exposed to such traffic on a contin-ual basis may develop a dislike for the appearance of
243

"technology intruding on nature." The use of waterways for pleasure boating is, in places, negatively impacted by levees which obliterate the view of local topography from the river.
Many negative aesthetic impacts can be minimized or eliminated through thoughtful architectural and engi-neering design and the use of complementary landscaping. Site selection and facility development should be con-ducted with the aim of preserving and enhancing the beauty of America's waterways.
244
G. ENVIRONMENTAL IMPACTS OF DIFFERENT TRANSPORTATION MODES
The purpose of this section is to identify, describe, and compare the environmental and social impacts of rail-road and pipeline transportation with water transpor-tation. The analysis is primarily qualitative in nature.
This section is organized first by mode of transporta-tion. That is, there are separate elements dealing with both railroad and pipeline transportation. Within these two major modes, the discussion is broken down by phase of implementation (i.e., there is a discussion of construc-tion, operations, and maintenance for each mode). Within each phase of implementation for each mode, there is a discussion of impacts on the terrestrial environment, the aquatic environment, air quality, noise, social and eco-nomic issues, and the cultural and aesthetic environ-ments. The discussion includes a description of the is-sues and a comparison of impacts with those of water transportation.
RAILROADS
(a) Construction
1. General. The impacts of the construction of railroads have been largely realized in the United States. The basic railroad network is in place and has not been expanded significantly since the turn of the century. In fact, the railroad network has experienced substantial shrinkage. Such construction as occurs is associated with relatively short spurs to new industrial parks and branch lines to serve specific resource exploi- tation projects. The most significant example of the lat-ter is the project being undertaken jointly by the Chicago and Northwestern Transportation Company and the Burlington Northern Railroad Company to extend a line into the Powder River Basin in Wyoming to transport coal. This new line is approximately one hundred miles long.
The concerns raised about the environmental impacts of construction of new railroad facilities are often oriented more toward the economic activities which these new railroads facilitate, rather than toward the railroads themselves. The environmental issues raised
245
regarding the Powder River Basin Project are more con-cerned with the large scale exploitation of coal in this virgin territory than with the railroad, per se.
2. Terrestrial Impacts. The impacts on the ter-restrial environment of railroad construction can be quite significant. Such impacts can include large-scale earth movement and land use changes. Depending upon the type of terrain being traversed, major construction activities are sometimes required to simply cover a few miles. Since the technology of railroad operations requires very slight grades, it is often necessary to move large quantities of earth, thus removing vegetative cover, to either fill depressions on the right-of-way or to remove or tunnel through obstructions.
It is sometimes also necessary to add large quan-tities of foreign material to wetlands that the railroad is intended to cross. Constructed or in-place railroad beds can act as barriers to wildlife or livestock movement and can cause trailing or increased use of vegetated areas adjoining the railroad facilities. Construction activi-ties can remove wildlife habitat and vegetation and can result in the death or injury of some wildlife. The mag-nitude of this impact will depend on the importance of the specific area for wildlife and livestock forage. Basic-ally, all these activities convert existing land forms and land uses into a new form suitable for only one purpose.
The construction of waterways projects can have similar effects in terms of earth movement due to con-struction. Near the waterway, land use may change from agricultural or undisturbed use to commercial or indus-trial use. The development of dams and pools will also change land use patterns. Construction activities, such as road construction, will remove vegetation and wildlife habitat. During construction, some wildlife will be killed. Channel dredging will result in spoil disposal on land, possibly destroying vegetative cover.
3. Aquatic Environmental Impacts. The impacts of railroad construction on the aquatic environment are relatively slight. The most significant impacts occur when it is necessary to bridge or fill bodies of water. This can restrict or modify water movement patterns and can destroy aquatic flora and fauna. Some impacts can occur elsewhere in the aquatic environment due to the dis-posal of waste materials at construction sites which find
246
their way into streams. In addition to the damage or destruction to existing aquatic habitats, such fills can modify circulation patterns within bodies of water with secondary effects on water quality and aquatic organisms.
Compared to the construction impacts associated with water transportation, the impacts of railroad con-struction on aquatic resources are slight. Railroad routes generally seek to avoid bodies of water (particu-larly floodplains) and have flexibility in the planning stage that is not available to water transportation. Water transportation, on the other hand, must follow existing bodies of water closely and the modification to these bodies of water to make them suitable for navigation can be major and permanent. Not all these changes are necessarily negative, however. Pooling of a stream may create permanent lakes that are more desirable than the baseline condition and may provide net additions of aquatic habitat.
4. Air Quality Impacts. Railroad construction can have major temporary localized impacts on air resources. These impacts can result from the creation of large quantities of dust during blasting and excavation as well as the operation of construction equipment. The emissions from construction equipment can also have signi-ficant local air quality impacts. This equipment can gen-erate the following pollutants: particulates, hydro-carbons, carbon monoxide, and nitrogen oxides. However, no permanent adverse air quality impacts should occur due to railroad construction.
The impacts of water right-of-way construction on air resources are essentially the same as those of rail-road construction. Whether or not they would be quanti-tatively greater in any particular situation depends on the nature and magnitude of the project.
5. Noise Impacts. The construction of railroads is typically a very noisy activity. Historically, much of this construction has taken place in rural areas and has had relatively small impacts except on construction workers, local residents, wildlife and livestock. These impacts are usually temporary in nature. However, much contemporary railroad construction includes the construc-tion of new classification yards closer to urban areas with the consequent greater likelihood of disturbance. When blasting is required, the noise impacts can be severe.
247
One aspect of water transportation construction projects which could be noisier than railroad construction is the extensive use of pilings. Pilings are used in railroad construction, but not in every project and in lesser quantities. In other respects, the noise impacts of construction for the two modes are similar.
For both railroad and waterways construction pro-grams, the noise emissions from heavy trucks will be approximately 80-90 dB(A) at a distance of 50 feet. In the absence of attenuating topography and vegetation, noise from trucks emitting 80 dB(A) (the 1980 federal standard for heavy trucks) would fall to 55 dB(A) 900 feet from the source. Federal noise standards have been pro-mulgated for most types of construction equipment, thus reducing noise emissions and their effects.
6. Social and Economic Impacts. Social and eco-nomic impacts or railroad construction are generally viewed as negative and can have the most significant envi-ronmental impacts. This is because the construction acti-vities typically result in a large infusion of expendi-tures into local economies for short periods of time. This is termed a "boom town" effect and typically results in major dislocations. Favorable impacts are the employ-ment and income generated by these activities. Although these could be favorable impacts in the national income accounts, they still may not be considered favorable local impacts, since much of the construction labor, particu-larly in skilled categories, must be recruited outside of the local economy. Historically, railroad construction camps have been viewed rather notoriously as undesirable settlements to be gotten rid of as quickly as possible.
The social and economic impacts of construction for water transportation are similar to those of railroad construction, but are generally less perceptible. This is because the construction of water projects takes place over an extended period of time with less shock effect.
7. Cultural, Historic and Aesthetic Impacts. The construction of railroad facilities today is unlikely to have major cultural, historic, and aesthetic impacts. This stems primarily from the fact that relatively little new construction is taking place. The Eastern Powder River Coal Project has the largest new railroad construc-tion program that is in progress. Although Class I rail-roads laid 952,000 tons of new rail in 1977, most of this
248
was for track replacement and additional tracks along existing roadbeds. Secondly, railroad construction does not require a great deal of land, assuming most construc-tion will take place on existing rights-of-way and little additional grading will be required. Third, such con-struction often occurs in areas that are relatively poor in cultural and aesthetic resources. Finally, railroad construction offers flexibility in planning stages to avoid such resources when they have been identified.
Construction for water transportation on the other hand has less flexibility in routing around such resources. Such impacts are most serious when large areas are to be permanently inundated. Mitigation measures are typically taken.
The types of material or property that may be impacted by either railroad or waterways construction pro-jects varies widely. They range from prehistoric shell and humus middens to articles from our recent past. Properties built in recent times, such as bridges, churches, and abandoned towns, may be of historical impor-tance based on criteria set forth in the National Historic Preservation Act of 1966 and Executive Order 11593. Ceme-teries should also be spared from construction activities because of their religious significance as well as the historical worth of the information contained on the tombstones.
In some cases, both railroad and waterway con-struction projects can result in positive impacts on his-torical properties and articles. Historical surveys con-ducted in connection with the construction of new facili-ties may result in the unearthing or discovery of historic resources which might otherwise have gone unnoticed. This can occur when a project is planned in an area where no detailed historical survey has previously been conducted and such a survey is deemed appropriate by responsible authorities.
Both railroad and waterways construction projects have the potential to introduce visual or audible elements which could be judged by local residents to be out of character with a historic property in the immediate area. Such determinations, and mitigating measures to be taken, must be assessed on a case-by-case basis. The two basic mitigating measures available are alteration of the project and removal of the historic property.
249
The aesthetic features of both railroad and waterway construction projects are generally viewed as negative because of their noise, traffic, and utilitarian appearance.
(b) Railroad Operations
1. General. Railroad operations in the United States comprise a complex and rejuvenating industry. Total freight revenues were $20.3 billion in 1978, marking a performance record and a 7.6 percent increase over the prior year. There were 27,772 locomotive units in service on Class I railroads at the end of 1978, including a net addition of 105 units during that year. Freight cars in service at the end of 1978 totalled 1,652,774, a 0.8 per-cent decline from 1977, although total freight handling capacity actually increased during the period.
The railroad network consists of 312,770 total miles of track in the United States (as of 1976), in-cluding multiple main track, yard tracks and sidings owned by both line-haul and switching and terminal companies. This network has declined steadily from 386,085 miles in 1939. In 1978, freight train miles of all Class I rail-roads totalled 433 million, an average of 6.2 train-miles per day for each of the 191,975 miles of track that are operated in freight service.
More concern about the secondary impacts of rail-road operations typically have been raised than direct concern about railroad operations. That is, the social and economic activities associated with railroad opera-tions often are viewed as having more serious impacts than the railroad operations themselves. This is particularly true of railroads associated with mining activities, which result in major disruptions of the environment. However, to the extent that such economic activities would not oc-cur without the existence of a railroad, such adverse impacts may be attributed to railroad operations.
Another major cause of concern regarding the environmental impacts of railroad operations is the safety record of the industry. A railroad accident can have serious consequences for the environment which may far exceed the immediate significance of the accident itself. Much depends upon the commodities being carried and the environment in which the accident occurs.
250
The impacts of such accidents tend to cut across all classifications (e.g., air pollution, water pollution, economic damage, community disruption).
2. Terrestrial Impacts. Routine railroad opera-tions have variable impacts on the terrestrial environment. As mentioned previously under construction impacts, railroad beds can be barriers to wildlife or livestock movement. Roadbeds can also cause trailing or increased use of vegetated areas adjoining the right-of way. In addition, railroad equipment operations fre-quently start fires in the roadbed which spread to adjacent lands.
Accidents and spills comprise the most signifi-cant terrestrial impacts from railroad operations. For example, in 1975 there were more than 1,000 fatalities resulting from railroad grade crossing accidents.
Train accidents are defined, as of 1978, as those arising from the movement or operation of trains resulting in more than S2,300 in damage to track and equipment. Such accidents must be reported to the Federal Railroad Administration (FRA). From 1975 to 1976, reported train accidents increased 27 percent from 8,401 to 10,248. How-ever, from 1976 to 1977, train accidents remained fairly constant. Prior to 1975, train accidents had gradually increased on an annual basis since 1966.
Unintentional releases of hazardous materials are classified into three types of incidents:
(a) Leaks.
(b) Releases resulting from train accidents.
(c) Major accidents involving a violent rupture or release of toxic commodities.
The Hazardous Materials Control Act of 1970 requires reporting of all these types of incidents to the Materials Transportation Bureau (MTB). Reported rail hazardous material incidents increased from 346 in 1971 to 1,654 in 1977 - an increase of 378 %. The MTB has noted, however, that this increase is at least partially attri-butable to increasing awareness of reporting requirements.
251
For the period 1975-1977, railroad accidents involving trains carrying hazardous material represented about 7.5 percent of total accidents. Accidents involving a release of hazardous substances comprised about one per-cent of all accidents in this period.
A study was conducted in 1978 to determine whe-ther trains carrying hazardous materials were involved in accidents more or less frequently than other trains. Based on a one-day data sample from five railroads, it appears that 32.4 % of all trains carry hazardous mate-rials. Due to the substantial difference between this sample and the percentage of accidents involving trains carrying hazardous materials (32.4 % vs. 7.5 %) accident data from four railroads known to report accurately were examined. Records from these railroads showed that 5.8 % of their reported accidents involved trains carrying hazardous materials. It was thus concluded that trains carrying hazardous substances are involved in accidents less frequently than other trains.
Major hazardous materials accidents, defined as accidents investigated by the National Transportation Safety Board (NTSB), generally result in damages exceeding $500,000 and/or fatalities. A total of 44 fatalities and 1,025 injuries resulted from major accidents and either MTB-reported incidents or FRA-reported train accidents in 1978.
In comparison with railroads, waterways opera-tions have a variety of impacts on the terrestrial envi-ronment. Dams will increase surface water elevations, which results in inundation of land area. This can lead to impacts on vegetation such as elimination of an existing vegetative community, plant community migration and flooding effects on plant systems. Elimination of wildlife habitat and livestock grazing areas can also occur.
In some species wildlife population loss can result due to loss of habitat or food. On the other hand, in some cases changes in water level may provide suitable habitat for some species not already established in the impacted area. Wildlife population also may shift due to the operation of dams.
Navigation on the waterways also can cause ter-restrial environmental impacts. Noise from barge trains
252

and towboats may affect wildlife, although little informa-tion is available on this subject. Air pollution from waterways traffic probably has little or no effect on neighboring wildlife although it is conceivable that pro-longed navigational activities near wetland areas during sensitive avian breeding and staging periods could impact these activities, resulting in their disruption.
Wave action from navigational activities can cause erosion of banks and wetland areas. Shoreline vege-tation could be dislodged or destroyed, possibly causing an interruption of the natural food chain. Shore-dwelling animals and their habitat could be adversely affected.
Cargo spillage and waste discharge from boats and tows can have toxic effects on vegetation and wildlife adjacent to the waterway. In addition, on-shore activi-ties associated with navigation (e.g., docks, unloading facilities, warehouses) can cause additional removal of vegetation and wildlife habitat. Shore protection struc-tures (e.g., dikes, revetments, jetties) and flood protec-tion structures (e.g., dikes, levees, channelization) can lead to sedimentation or change water levels. This can result in losses to shoreline vegetation and wildlife habitat.
3. Aquatic Environmental Impacts. Railroad ope-rations affect the aquatic environment through the dis-charge of wastewater to lakes and streams. Wastewater is generated by the following activities:
(a) Over-the-road hauling of passengers and freight.
(b) Switching operations - makeup of trains.
(c) Track repair and maintenance.
(d) Locomotive repair and maintenance.
- fueling and sanding. - washing. - running maintenance. - heavy diesel repair. - painting.
(e) Car maintenance and repair.
253
(f) Car cleaning.
- box cars. - tank cars.
(g) Passenger terminals.
The most significant wastewater-producing activities are cleaning operations such as locomotive fueling, washing, and heavy diesel repairs; covered hopper cleaning; and tank car cleaning. The largest volume sources are heavy diesel repair complexes (up to 500,000 gallons per day at one installation in 1973) and tank car cleaning (up to 25,00) gallons per day). The tank car cleaning operations generate the most variable and difficult-to-treat wastes.
Oily wastes and suspended solids are present in practically all railroad operation wastewater. Other constituents include oxygen-demanding substances, acids, alkalies, metals, cyanides, phenols, ammonia, and dis-solved solids. Tank car cleaning can generate a large number of organic and inorganic pollutants.
Treatment systems available to treat these wastes include gravity oil separation, emulsion-breaking, coagu-lation, air flotation, biological treatment, clarifi-cation, filtration, and carbon adsorption. Metals reduc-tion/precipitation and cyanide destruction may be required in specific cases.
In 1974, the United States Environmental Protec-tion Agency (EPA) developed proposed standards for waste-water treatment from railroad operations. These standards were never formally promulgated, however, probably reflecting a relatively low priority assigned to these wastes compared to wastes generated by other industries.
Compared to railroad operations, waterways opera-tions can have a variety of major impacts on the aquatic environment. The activities that cause these impacts are as follows:
(a) Dredging.
(b) Dredged material disposal.
(c) Other activities.
254
1. navigation (including spills and accidents).
2. locks and dams. 3. reservoirs. 4. dikes. 5. revetments. 6. sills. 7. jetties. 8. cleaning and snagging. 9. rock removal.
10. channelization.
Dredging operations cause a variety of negative impacts to water quality and the aquatic ecosystem, which include:
(a) Changed habitat in dredged area.
(b) Removal of benthic organisms and shellfish beds.
(c) Increased levels of turbidity and suspended solids.
(d) Release of heavy metals, nutrients and other pollutants from resuspended material.
(e) Biological uptake of released pollutants.
(f) Covering of benthic organisms by sediment.
(g) Aesthetic disruption.
Dredged material disposal in open water can have similar effects, as follows:
(a) Alteration of water quality (e.g., tur-bidity, suspended solids, nutrients).
(b) Release of sediment-bound toxicants.
(c) Covering of benthic organisms.
(d) Generation of fluid mud.
(e) Changes in bottom topography.
255
Spills and accidents along the waterways can have deva-stating effects, depending on the quantities and hazardous characteristics of the spill. For example, on February 2, 1976, about 261,000 gallons of No. 6 fuel oil were spilled from the Barge STC-1001 into the lower Chesapeake Bay. Spills of negligible quantities up to this order of magni-tude and beyond must be reported to the Coast Guard.
Routine navigation impacts water quality and the aquatic environment through the resuspension of sediments, wave activity, waste discharge (i.e., kitchen wastes, sew-age, bilge pumping, although federal and state regulations prohibit the purposeful discharge of waste), thermal pol-lution, and winter operations (e.g., increased bank ero-sion and water turbidity, ice damage).
Lock and dam operation can reduce flow velocity and turbulence, thus reducing suspended solids concen-tration in the river water and increasing bottom depos-its. Lower velocity and turbulence also contribute to lower dissolved oxygen concentrations and water tempera-ture stratification. Dams can increase the growth of planktonic algae and the volume of aquatic habitat. Water discharge over a dam causes beneficial reaeration due to turbulence and surface exposure. Reservoirs, dikes, revetments, sills and jetties generally have similar impacts as locks and dams. Clearing and snagging and rock removal operations generally exhibit minor short-term impacts. Channelization impacts are similar to dredging impacts.
4. Air Quality Impacts. The major impact of normal train operations on air quality is the emission of exhaust gases and particulates from locomotive exhaust to the atmosphere. Diesel locomotives typically emit hydro-carbons, carbon monoxide, nitrogen oxides, sulfur oxides, and aldehydes to the atmosphere. To a lesser degree, sta-tionary sources, such as repair shop boiler and painting operations, will also generate air pollutants. Support facilities along waterways will similarly generate air pollutants from boilers and painting operations.
According to a 1972 EPA study, railroad emissions contribute an insignificant amount of air pollutants com-pared to other mobile sources of pollution. A comparison of emissions from railroad and marine engines, taken from EPA's 1972 study, is shown in Table 111-13. On the basis of grams emitted per brake horsepower-hour, railroad
256

diesels generate relatively less hydrocarbons but rela-tively greater carbon monoxide than marine diesels. Nitrogen oxides and aldehydes generation were similar for railroad and marine diesels.
Table 111-13
Pollutant
Air Pollution Generation Factors For Railroad and Marine Diesel Engines
Composite Factor for Composite Factor for Railroad Engine 500-4000 HP Marine
g/bhp-hr Engine, g/bhp-hr
Hydrocarbons 2.48 3.42 Carbon Monoxide 3.29 2.30 Nitrogen Oxides 9.36 9.65 Aldehydes 0.144 0.159
SOURCE: Exhaust Emissions from Uncontrolled Vehicles and Related Equipment Using Internal Combustion Engines. United States Environmental Protection Agency. October 1972.
Total air emissions from railroad engines, how-ever, will be significantly greater than emissions from marine engines since railroads consume larger quantities of fuel and move freight a shorter distance per gallon of fuel than waterways operations. According to the Depart-ment of Transportation's 1979 report, Freight Transpor-tation Energy Use, railroads used a fuel equivalent of 538 trillion BTU in 1972 compared with only 48 trillion BTU for waterways. The report also shows that barges moved one ton of freight 514 miles per gallon of fuel in 1972 while railroads moved one ton of freight only 202 miles per gallon of fuel. Thus, overall air emissions from railroad operations are much higher than for barge operations.
Adverse impacts on air quality can also occur due to railroad accidents (e.g., leakage of chlorine or ammonia from tank cars). Such impacts tend to be severe, quite localized, short-term in nature. Often, they result in the temporary evacuation of local populations in the vicinity of such accidents. As fumes and gases dissipate into the atmosphere, the impacts wear off and the danger passes. To the extent that railroad transportation
257

results in more releases of such substances into the atmosphere than water transportation, then railroads will have a more adverse impact in this area.
5. Noise Impacts. The principal sources of railroad yard noise and their average noise levels are presented in Table 14. The most significant source of railroad noise is from retarders, which are track mounted braking devices used to control the velocity of free-rolling freight cars in switching and hump yards.
EPA recently promulgated noise emission regula-tions for the sources listed in Table 111-14. EPA esti-mates that between 6.5 and 10 million people are currently exposed to noise which has been identified as potentially harmful to public health and welfare resulting from rail-road operations and other ambient noise sources in the vicinity of railyards. EPA further estimates that compli-ance with their noise regulations, at an annualized cost of $24.3 million per year, will result in approximately a 10-15 % reduction in impact of both extent and severity.
The normal operation of moving trains also causes significant noise levels. Such trains are also now covered by EPA noise regulations.
Since many important railroad routes pass through major urban areas, these noise impacts tend to be experi-enced by a large percent of the population. Compared to water transportation, railroad operations generally cause more noise disturbance. Water transportation tends to occur in more isolated areas from population centers and therefore is not as disturbing. Waterways produce peri-odic noise in the form of boat and barge traffic. The principal noises generated by lock and dam operation are from pumps, generators, motors and other machinery at the facility. Since these sources are amenable to noise con-trol techniques, their impacts are expected to be mini-mal. More significant noise impacts are present at port facilities such as loading/unloading operations.
6. Social and Economic Impacts. The major eco-nomic impacts of railroad transportation operations are the employment and wages generated by the companies. In 1978, Class I line-haul railroads employed 491,251 people who earned a total wage compensation of $9.58 billion (AAR, 1979).
258
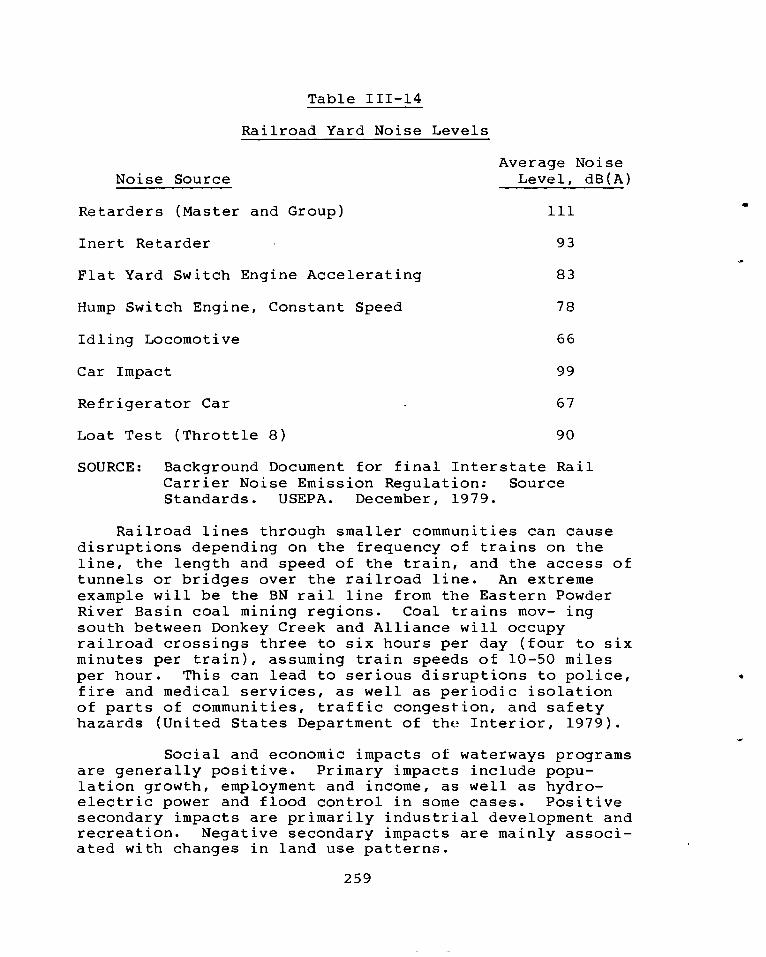
Table 111-14
Railroad Yard Noise Levels
Average Noise Noise Source Level, dB(A)
Retarders (Master and Group) 111
Inert Retarder 93
Flat Yard Switch Engine Accelerating 83
Hump Switch Engine, Constant Speed 78
Idling Locomotive 66
Car Impact 99
Refrigerator Car 67
Loat Test (Throttle 8) 90
SOURCE: Background Document for final Interstate Rail Carrier Noise Emission Regulation: Source Standards. USEPA. December, 1979.
Railroad lines through smaller communities can cause disruptions depending on the frequency of trains on the line, the length and speed of the train, and the access of tunnels or bridges over the railroad line. An extreme example will be the BN rail line from the Eastern Powder River Basin coal mining regions. Coal trains mov- ing south between Donkey Creek and Alliance will occupy railroad crossings three to six hours per day (four to six minutes per train), assuming train speeds of 10-50 miles per hour. This can lead to serious disruptions to police, fire and medical services, as well as periodic isolation of parts of communities, traffic congestion, and safety hazards (United States Department of the Interior, 1979).
Social and economic impacts of waterways programs are generally positive. Primary impacts include popu-lation growth, employment and income, as well as hydro-electric power and flood control in some cases. Positive secondary impacts are primarily industrial development and recreation. Negative secondary impacts are mainly associ-ated with changes in land use patterns.
259

7. Cultural, Historic and Aesthetic Impacts. Railroad operations tend to occur in areas that are relatively sparse in cultural assets. However, railroad operations do occur in many areas that are considered aesthetically valuable. To the extent that railroad ope-rations are viewed as intruding upon the natural environ-ment, then railroad operations may be considered to have an adverse impact on aesthetic values in some areas. To compare the impacts of railroad operations and water transportation operations in this area is very difficult.
Typically, these impacts are very localized, and one mode is not an alternative for the other in the area involved. Aesthetic reactions to the sight of either railroad operations or waterway traffic will differ according to individual preferences.
(c) Railroad Maintenance
1. General. To the extent that railroad maintenance activities present a tradeoff with certain types of railroad operations, railroad maintenance activi-ties may have favorable impacts on the environment. For example, maintenance activities which reduce the likeli-hood of an accident or which allow trains to operate at more optimum speeds may result in the reduction of adverse impacts due to accidents and increased efficiency of ope-ration resulting in less air pollution and energy savings.
2. Terrestrial Impacts. Railroad maintenance activities may have some limited impacts on the terres-trial environment. The major impact is the consumption of material resources. This would include the use of rock for ballast for the right-of-way. It would also include the consumption of trees for ties and steel for rails and other components. Raw materials for concrete to build culverts, bridges and concrete ties will be consumed. Construction activities can result in the loss of some wildlife habitat and vegetative cover. Some animals may be killed by maintenance/construction vehicles. An addi-tional maintenance impact involves the spraying of herbi-cide along the railroad right-of-way which adversely affects the biota living in that area.
The impacts of water transportation right-of-way maintenance on the terrestrial environment are more
260
severe. Dredged material disposal can cause the elimi-nation or alteration of habitat, creation of new upland and wetland habitats, wildlife loss, loss of water surface in wetlands, release of toxicants from the dredged material and aesthetic alteration.
3. Aquatic Environment Impacts. Railroad main-tenance activities can have a variety of impacts on the aquatic environment. The physical maintenance of the right-of-way itself is unlikely to have significant impacts on the aquatic environment. However, a signifi-cant impact on the aquatic environment can occur as a result of weed control activities. It is a common prac-tice to use herbicides to control weeds along the right-of-way. This is necessary in order to maintain a safe operating environment for the railroad. Weed control improves visibility and reduces the likelihood of fires. However, depending upon the herbicides used, significant impacts on the aquatic environment can occur as the herbi-cides find their way into streams.
A favorable impact of railroad maintenance acti-vities on the aquatic environment is the reduction of accidents and the consequent spills of toxic materials into the aquatic environment. Water pollution from main-tenance activities at rail yards was covered earlier in this section.
Maintenance activities for water transportation systems have direct and more significant impacts on the aquatic environment. The most significant impacts result from dredging, which causes temporary degradations of water quality. Disposal of dredged material in open water also causes adverse impacts, such as alterations to water quality, covering of benthic organisms, generation of fluid mud, and changes in bottom topography.
4. Air Quality Impacts. Railroad maintenance activities are likely to generate gaseous and particulate emissions into the atmosphere, as discussed in the section on railroad operations. Such emissions have an adverse impact on these activities. However, a favorable impact results from reduction of accidents and the associated release of toxic substances and gases into the atmosphere.
It is not obvious that railroad maintenance acti-vities have more or less impacts on air quality than com-parable activities for water transportation. On one hand,
261
more total resources are expended in railroad maintenance activities. However, the activities themselves are sub-stantially different and do not generate the same quan-tities of emissions. Comparisons are also difficult unless one can compare segments of railroad and water transportation rights-of-way by traffic composition, cli-mate, and traffic densities.
5. Noise Impacts. Railroad maintenance activi-ties cause noise impacts. To the extent that much of these activities occur in rural areas, such noise impacts are not considered to be disturbing. Likewise, noise emissions from waterways activities are not deemed signi-ficant. Noise from dredging operations (70-90dB(A)50 feet from the site) are essentially inaudible (35-55 B(A)3000 feet from the site.
6. Social and Economic Impacts. Railroad main-tenance activities are generally considered to have favor-able social and economic impacts in terms of the employ-ment generated by these activities. A major beneficial impact is the improvement in the safety of the rail mode of transportation. Railroad accidents have been directly linked to the condition of equipment and railroad rights-of-way. Since maintenance activities are oriented to keeping railroad equipment and rights-of-way in safe ope-rating condition, such activities may be deemed to have a direct favorable impact through the reduction of accidents and their consequent adverse impacts.
7. Cultural and Aesthetic Impacts. Railroad maintenance activities have insignificant cultural and aesthetic impacts. Typically, once an activity has been completed, there is little evidence of its having occurred. If anything, the improved appearance of the right-of-way and improved efficiency of operations might create positive cultural aesthetic impacts.
The major cultural and aesthetic impact of water transportation maintenance arises in the disposal of dredged materials. If such disposal adversely impacts these kinds of resources, the dredging may either not occur or be done at greater cost to avoid the impact. Dredged material disposal on land could conceivably damage historic properties or preclude excavations at histori-cally significant sites if there were insufficient planning.
262
The social and economic impacts of waterways maintenance activities are not considered to be significant.
(d) Summary
Construction impacts from railroads are not considered significant since little new construction activity is underway except for work along existing rights-of-way. Railroad construction will have generally positive social and economic impacts and adverse terrestrial impacts. A larger incidence of waterways construction activity is expected, which will also have positive social and eco-nomic impacts, but adverse aquatic and terrestrial envi-ronmental impacts.
The operational impacts of railroads are the most significant compared to conatruction and maintenance. Economic impacts are positive but terrestrial impacts from leaks, spills and accidents are strongly negative. Simi-larly, waterways operations exhibit positive primary and secondary socioeconomic impacts, but have negative terres-trial and aquatic environmental impacts due to leaks, spills and accidents.
Maintenance activities from railroads have less of an impact than waterways maintenance, mainly because of dredging and dredged spoil disposal activities associated with waterways.
PIPELINE TRANSPORTATION
(a) Pipeline Construction
1. General. Some major environmental controver-sies have surrounded proposed pipeline construction in recent years. One of the biggest controversies involved the Trans Alaska pipeline, which is now carrying crude oil across Alaska. However, there have been, and there are now, many pipeline construction projects which are less controversial but for which environmental impact state-ments are being prepared. Environmental planning is im-portant because the severity of the impacts and intensity of the controversies depend to a great extent on the
263
specific routing of the proposed pipeline. In general, the construction impacts of this mode of transportation are probably the most serious compared to operation and maintenance impacts. This section covers the construction impacts due to pipelines, per se, as well as supporting pumping, storage and handling facilities.
2. Terrestrial Impacts. Pipeline construction often requires significant disruption of the terrestrial environment. Pipelines may be located either above-ground or below-ground, but most pipelines are buried. Also, pipelines are often required to cross extremely difficult terrain and fragile environmental areas. As a conse-quence, the excavation associated with the pipeline con-struction can sometimes have significant impacts. Native trees along a pipeline right-of-way must be removed, and, in most cases, no seedlings would be permitted to grow along the right-of-way for the duration of the project. Where rights-of-way cross agricultural land, crops would be removed, and recultivation could not take place until after the construction phase. Trenching operations on agricultural land could surface some mineral-bearing layers, thus increasing the fertility and productivity of the soil. This effect could be offset, however, by the surfacing of less fertile layers of soil such as clay.
Construction operations on pipelines and related facilities could destroy some wildlife habitat. Also, some animals are likely to be killed by construction equipment. Above-ground pipelines present a physical bar-rier to wildlife and livestock, inhibiting migration habits and access to grazing land.
The most important terrestrial impacts associated with waterways were discussed earlier in this section. Waterways construction projects generally are expected to exhibit impacts that are similar in significance to pipe-line projects. Land use changes due to dams and locks, plus dredged material disposal, are the most significant terrestrial impacts.
3. Aquatic Environmental Impacts. Pipeline con-struction typically has minor impacts on the aquatic envi-ronment except when lines must be routed across bodies of water. Then, impacts can be significant. Often in such cases it will be necessary to construct a special bridge for the pipeline or to bury the pipeline under the bed of the river resulting in temporary disturbances to water
264
quality and the aquatic environment. However, such impacts on the aquatic environment are generally minor compared to the typical impacts associated with construc-tion of water transportation right-of-way (i.e., dredging, channelization, lock and dam construction).
4. Air Quality Impacts. The impacts of pipeline construction on air resources take two forms. First of all, the emissions from the construction equipment and fugitive dust generation can create minor impacts on local air resources. A more significant air quality impact is the open burning of trees and brush which are gathered into heaps during the clearing process. Since these fires can create temporary local adverse air quality impacts, some states and localities have passed regulations and ordinances prohibiting open burning. These air quality impacts are likely to be about the same as those associ-ated with the construction of water transportation rights-of-way.
5. Noise Impacts. Pipeline and related facili-ties construction create noise from construction equip-ment. However, since this construction mainly takes place well away from populated areas, the disturbance is usually minor. In addition, EPA has promulgated noise emission control regulations covering various types of construction equipment (e.g., air compressors, heavy trucks). On the whole, pipeline construction noise is probably less dis-turbing than noise generated by water construction.
6. Social and Economic Impacts. The social and economic impacts of pipeline construction can be quite significant. A major positive impact is the generation of employment and income. However, major projects such as the Trans Alaska pipeline can create major dislocations to the local economy and changes in land value. These dis-locations can take the form of distortions of local wage patterns and the creation of undesirable service indus-tries. Disruption to farm activities can take place dur-ing pipeline construction. This could prevent the farmer from raising a crop on or adjacent to the affected property for the duration of the construction period. However, it is expected that farmers would be compensated for crops that are destroyed or damaged during the con-struction period and for crops which cannot be planted during construction activities.
265

Traffic disruption is expected along roadways and railroad crossings. At major crossings, bore and casement methods of construction would be used. At minor road crossings, open trenches would be dug, but traffic flow could continue without rerouting with traffic passing over steel plates covering half the road width. Depending upon the location and magnitude of the project, the social and economic impacts of pipeline construction are probably comparable to those of waterway construction, except that waterway construction probably creates fewer dislocations.
7. Cultural and Aesthetic Impacts. Pipeline construction can have adverse cultural and aesthetic impacts depending primarily upon the routing. Typically, in the event of a controversy about a cultural or aes-thetic resource, the pipeline will either be rerouted or mitigating measures taken. The greater flexibility in route selection for pipeline transportation probably results in fewer adverse cultural and aesthetic impacts than does the construction of waterway transportation rights-of-way.
(b) Pipeline Operation and Maintenance
1. General. Normally, the operation and main-tenance of pipelines and their supporting facilities have very little impact on the environment. This is particu-larly true when the commodity being shipped is a fluid and can be piped directly. When a slurry is being piped the operations impact is likely to be greater. For example, coal slurried through a pipeline will require coal-water separation at the terminal point with subsequent treatment and disposal of the waste water (or recycling).
2. Accidents, Leaks and Spills. The most signi-ficant impacts associated with pipeline operation and maintenance are associated with accidents, leaks and spills which are caused by the following:
(a) Equipment rupturing line.
(b) Internal and external corrosion.
(c) Incorrect operation by carrier personnel.
266
(d) Defective pipe seam.
(e) Failure of previously damaged pipe.
(f) Malfunction of control or relief equipment.
(g) Defective girth weld.
(h) Vandalism.
(i) Valve malfunction.
(j) Threads stripped or broken.
(k) Cold weather.
(1) Pump or appurtenance facilities.
(m) Natural events.
(n) Tank or appurtenance facilities.
(o) Miscellaneous.
A summary of liquid pipeline accidents for the period 1974-1977 is provided in Table 111-15. Accidents over the period were 209-256/ year. Three to ten deaths and five to nineteen injuries per year were associated with these accidents. Total property damage varied between $1.631-$ .197 million in 1974-1976, but rose to $43.9 million in 1977. In 1974-1977, a cumulative total of 1.096 million barrels of liquid commodities were lost through pipeline accidents.
Exhibits III-1 through 111-5 at the end of this section compare the sources of oil and other substance losses from pipelines, vessels, land vehicles, non-transportation-related facilities, marine facilities, land facilities and other sources for the years 1973, 1974, 1975, 1976 and 1978. Data for 1977 were unavailable.
Losses from pipelines comprised 7.6-36.0 % of the total annual oil and other substances discharge volume over the period covered. In comparison, vessels accounted for 25.0-44.6 % of the loss while marine facilities caused 0.9-36.4 %. Rail operations accounted for 0.8-4.6 % of the oil and other substances lost.
267
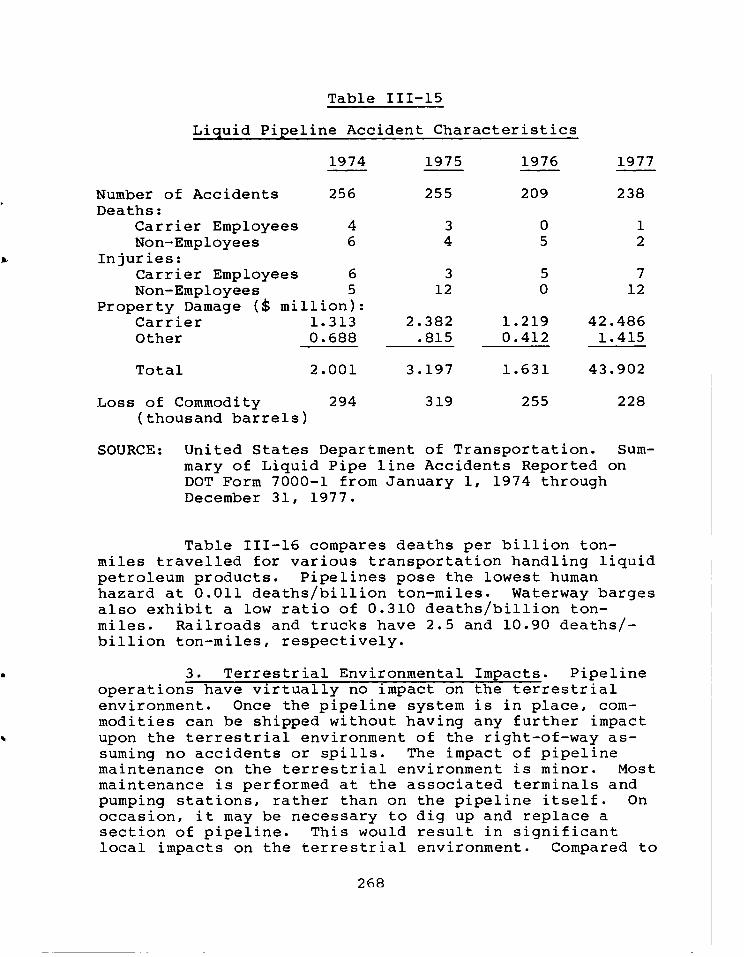
255 228 319
Table 111-15
Liquid Pipeline Accident Characteristics
1974 1975 1976 1977
Number of Accidents 256 255 209 238 Deaths:
Carrier Employees 4 3 0 1 Non-Employees 6 4 5 2
Injuries: Carrier Employees 6 3 5 7 Non-Employees 5 12 0 12
Property Damage ($ million): Carrier 1.313 2.382 1.219 42.486 Other 0.688 .815 0.412 1.415
Total 2.001 3.197 1.631 43.902
Loss of Commodity 294 (thousand barrels)
SOURCE: United States Department of Transportation. Sum-mary of Liquid Pipe line Accidents Reported on DOT Form 7000-1 from January 1, 1974 through December 31, 1977.
Table 111-16 compares deaths per billion ton-miles travelled for various transportation handling liquid petroleum products. Pipelines pose the lowest human hazard at 0.011 deaths/billion ton-miles. Waterway barges also exhibit a low ratio of 0.310 deaths/billion ton-miles. Railroads and trucks have 2.5 and 10.90 deaths/- billion ton-miles, respectively.
3. Terrestrial Environmental Impacts. Pipeline operations have virtually no impact on the terrestrial environment. Once the pipeline system is in place, com-modities can be shipped without having any further impact upon the terrestrial environment of the right-of-way as-suming no accidents or spills. The impact of pipeline maintenance on the terrestrial environment is minor. Most maintenance is performed at the associated terminals and pumping stations, rather than on the pipeline itself. On occasion, it may be necessary to dig up and replace a section of pipeline. This would result in significant local impacts on the terrestrial environment. Compared to
268
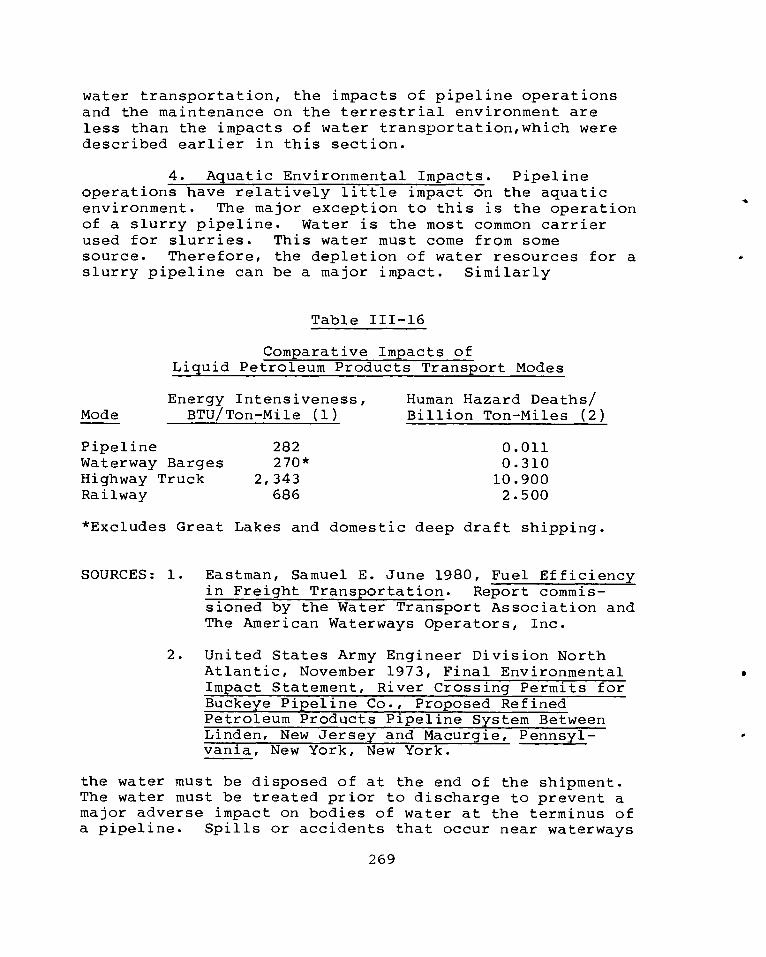
water transportation, the impacts of pipeline operations and the maintenance on the terrestrial environment are less than the impacts of water transportation,which were described earlier in this section.
4. Aquatic Environmental Impacts. Pipeline operations have relatively little impact on the aquatic environment. The major exception to this is the operation of a slurry pipeline. Water is the most common carrier used for slurries. This water must come from some source. Therefore, the depletion of water resources for a slurry pipeline can be a major impact. Similarly
Table 111-16
Comparative Impacts of Liquid Petroleum Products Transport Modes
Energy Intensiveness, Human Hazard Deaths/ BTU/Ton-Mile (1) Billion Ton-Miles (2) Mode
Pipeline 282 0.011 Waterway Barges 270* 0.310 Highway Truck 2,343 10.900 Railway 686 2.500
*Excludes Great Lakes and domestic deep draft shipping.
SOURCES: 1. Eastman, Samuel E. June 1980, Fuel Efficiency in Freight Transportation. Report commis-sioned by the Water Transport Association and The American Waterways Operators, Inc.
2. United States Army Engineer Division North Atlantic, November 1973, Final Environmental Impact Statement, River Crossing Permits for Buckeye Pipeline Co., Proposed Refined Petroleum Products Pipeline System Between Linden, New Jersey and Macurgie, Pennsyl-vania, New York, New York.
the water must be disposed of at the end of the shipment. The water must be treated prior to discharge to prevent a major adverse impact on bodies of water at the terminus of a pipeline. Spills or accidents that occur near waterways
269
can destroy flora and fauna in the aquatic environment. Nevertheless, compared to water transportation, the impacts of pipeline transportation operations and the maintenance on the aquatic environment are minimal.
5. Air Quality Impacts. The normal operation of a pipeline has minimal impacts on air quality. A major issue was recently raised with regard to a proposed pipe-line originating at Long Beach, California for the ship-ment of Alaskan crude oil. The terminal operations, unloading crude oil from tankers, would have had adverse impacts on air resources in the area. This was attributed to the pipeline project, since the unloading would not occur without the pipeline. In that sense, some secondary adverse impacts of pipeline operations on air resources may occur. However, normal pipeline operations contain all vapors, fumes, and undesirable substances, preventing them from escaping to the atmosphere.
There are occasional accidents regarding pipeline transportation which result in release of gases into the atmosphere. However, the accidents are infrequent and are usually easily contained. Neither water transportation nor pipeline operations have significant effects on air quality, assuming accidents are avoided.
6. Noise Impacts. The operation of a pipeline transportation system generates virtually no noise. By comparison to water transportation, pipeline transpor-tation is very quiet.
The maintenance of pipeline transportation systems can generate some noise, particularly when it is necessary to modify or replace a section of pipeline. Nevertheless, pipeline operation and maintenance activi-ties generate relatively less noise than waterway trans-portation maintenance activities, which were described previously in this section.
7. Social and Economic Impacts. The operation and maintenance of pipeline transportation systems has very few social and economic impacts. Relatively little labor is required to operate a pipeline system, and there-fore little employment is created. A comparison of energy usage for various modes was shown previously in Table 111-16. Pipelines use the least energy, about 450 BTU/ton-mile. Barges and railroads are approximately equal at 680 and 670 BTU/ton-mile, respectively.
270
8. Cultural and Aesthetic Impacts. Once a pipe-line is in place, the cultural and aesthetic impacts of its operation and maintenance are nil. The impacts of pipeline operations on cultural and aesthetic resources are comparatively less than those of water transportation.
(c) Summary
The most significant impacts of pipeline construction involve terrestrial environmental and land use impacts. Waterways construction, on the other hand, can have signi-ficant effects on both the terrestrial and aquatic envi-ronment. Spills and accidents comprise major operational impacts for both pipelines and waterways activities. Pipelines use relatively less energy than barges or rail locomotives.
The impacts of pipeline maintenance on the terrestrial environment are minor. Most maintenance is performed at the associated terminals and pumping stations, rather than on the pipeline itself. On occasion, it may be necessary to dig up and replace a section of pipeline. This would result in significant local impacts on the terrestrial environment.
271
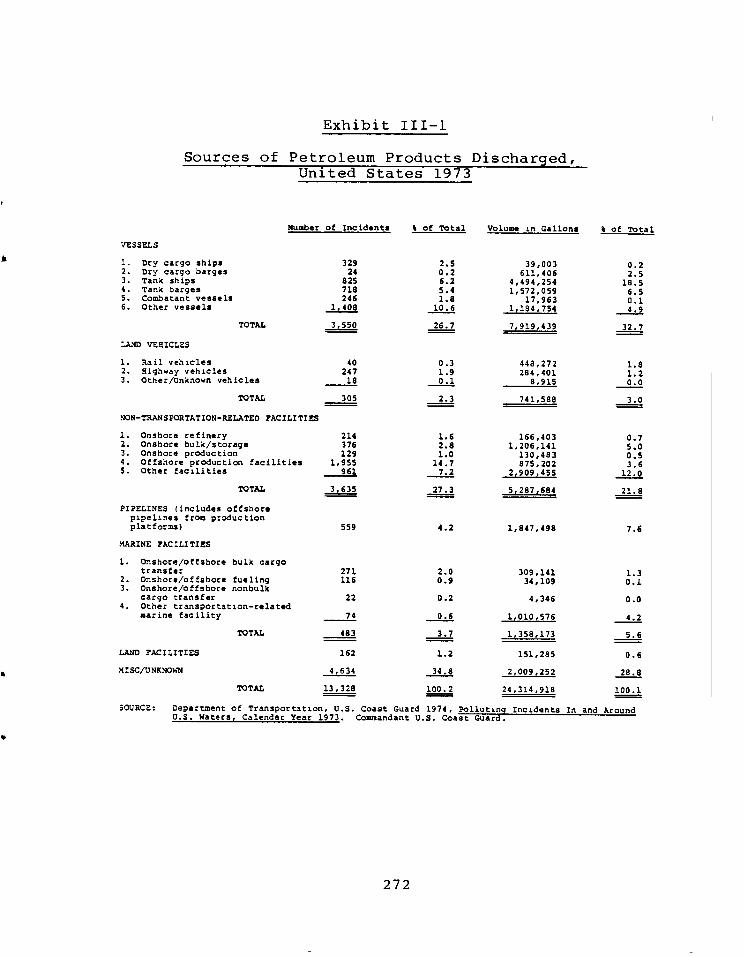
Exhibit III-1
Sources of Petroleum Products Discharged, United States 1973
Number of Incidents % of Total Volume in Gallons I of Total
VESSELS
1. Dry cargo ships 329 2.5 39,003 0.2 2. Dry cargo barges 24 0.2 611,406 2.5 3. Tank ships 825 6.2 4,494,254 18.5 4. Tank barges 718 5.4 1,572,059 6.5 5. Combatant vessels 246 1.8 17,963 0.1 6. Other vessels 1,408 10.6 1 184 754
--2.- 4.9
TOTAL 3,550 26.7 7,919,439 32.7
LAND VEHICLES
1. Rail vehicles 40 0.3 448,272 1.8 2. Highway vehicles 247 1.9 284,401 1.2 3. Other/Unknown vehicles 18 0.1 8,915 0.0
TOTAL 305 2.3 741,588 3.0
NON-TRANSPORTATION-RELATED FACILITIES
1. Onshore refinery 214 1.6 166,403 0.7 2. Onshore bulk/storage 376 2.8 1,206,141 5.0 3. Onshore production 129 1.0 130,483 0.5 4. Offshore production facilities 1,955 14.7 875,202 3.6 5. Other facilities 961 7.2 2,909,455 12.0
TOTAL 3,635 27.3 5,287,684 21.8
PIPELINES (includes offshore pipelines from production platforms) 559 4.2 1,847,498 7.6
MARINE FACILITIES
1. Onshore/offshore bulk cargo transfer 271 2.0 309,141 1.3
2. Onshore/offshore fueling 116 0.9 34,109 0.1 3. Onshore/offshore nonbulk
cargo transfer 22 0.2 4,346 0.0 4. Other transportation-related
marine facility 74 0.6 1,010,576 4.2
TOTAL 483 3.7 1,358,173 5.6
LAND FACILITIES 162 1.2 151,285 0.6
M/SC/UNKNOSiN 4,634 : 34.8 2 009 252
--:-..- 28.8
TOTAL 13,328 100.2 24,314,918 100.1
SOURCE:
Department of Transportation, U.S. Coast Guard 1974, Polluting Incidents In and Around U.S. Waters, Calendar Year 1973. Commandant U.S. Coast Guard.
272

Exhibit 111-2
Sources of Petroleum Products Discharged, United States 1974
Number of Incidents 8 of Total Volume in Gallons % of Total
VESSELS
1. Dry cargo ships 346 2.0 89,717 1.0 2. Dry cargo barges 31 0.0 1,270 0.0 3. Tank ships 973 7.0 1,434,168 8.0 4. Tank barges 833 6.0 2,468,724 15.0 5. Combatant vessels 278 2.0 39,552 0.0 6. Other vessels 1,265 9.0 253,007
----- 1.0
TOTAL 3,726 26.0 4,286,438 25.0
LAND VEHICLES ,
1. Rail vehicles 51 0.0 453,964 3.0 2. Highway vehicles 294 2.0 313,943 2.0 3. Other/Unknown vehicles 28 0.0 --17r-611, 0.0
TOTAL 373 2.0 7 855 480 5.0
---___ -.-t.- NON-TRANSPORTATION-RELATED FACILITIES
1. Onshore refinery 155 1.0 772,634 5.0 2. Onshore bulk/storage 281 2.1 1,011,543 6.0 3. Onshore production 383 3.0 877,010 5.0 4. Offshore production facilities 2,006 14.0 153,771 1.0 5. Other facilities 819 6.0 653,148 4.0
TOTAL 3,644 26.0 3 468 106 --t-__r 20.0
PIPELINES 557 4.0 6,305,039 36.0
MARINE FACILITIES
1. Onshore/offshore bulk cargo transfer 367 4.0 1,286,289 8.0
2. Onshore/offshore fueling 93 1.0 35,946 0.0 3. Onshore/offshore nonbulk
cargo transfer 41 0.0 6,569 0.0 4. Other transportation-related
marine facility 98 1.0 3,538
----- 0.0
TOTAL 599 6.0 1,332,342 8.0
LAND FACILITIES 200 1.0 235,209 1.0
MISC/UNKNOWN 4,867 -r- 35.0 603,626 4.0
TOTAL 13,966 _f_ 100.0 16,916,308 100.0
SOURCE: Department of Transportation, U.S. Coast Guard 1975, Polluting Incidents In and Around U.S. Waters, Calendar Year 1974. Commandant U.S. Coast Guard.
273
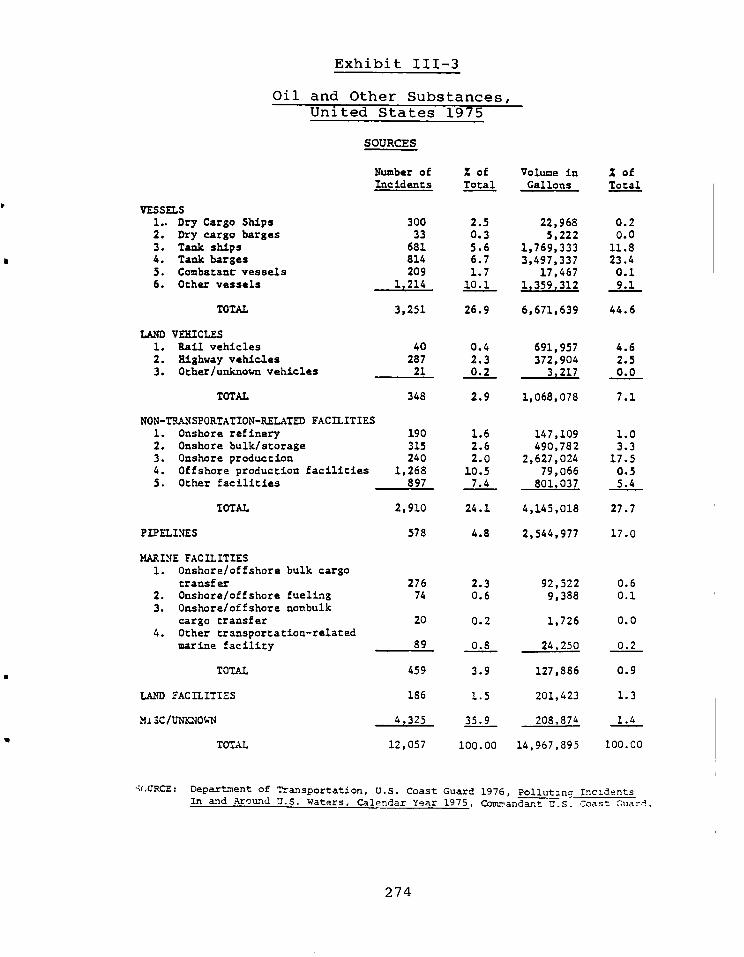
Exhibit 111-3
Oil and Other Substances, United States 1975
SOURCES
Number of Z of Volume in I of Incidents Total Gallons Total
VESSELS 1.. Dry Cargo Ships 300 2.5 22,968 0.2 2. Dry cargo barges 33 0.3 5,222 0.0 3. Tank ships 681 5.6 1,769,333 11.8 4. Tank barges 814 6.7 3,497,337 23.4 5. Combatant vessels 209 1.7 17,467 0.1 6. Other vessels 1,214 10.1 1,359,312 9.1
TOTAL 3,251 26.9 6,671,639 44.6
LAND VEHICLES 1. Rail vehicles 40 0.4 691,957 4.6 2. Highway vehicles 287 2.3 372,904 2.5 3. Other/unknown vehicles 21 0.2 3,217 0.0
TOTAL 348 2.9 1,068,078 7.1
NON-TRANSPORTATION-RELATED FACILITIES 1. Onshore refinery 190 1.6 147,109 1.0 2. Onshore bulk/storage 315 2.6 490,782 3.3 3. Onshore production 240 2.0 2,627,024 17.5 4. Offshore production facilities 1,268 10.5 79,066 0.5 5. Other facilities 897 7.4 801,037 5.4
TOTAL 2,910 24.1 4,145,018 27.7
PIPELINES 578 4.8 2,544,977 17.0
MARINE FACILITIES 1. Onshore/offshore bulk cargo
transfer 276 2.3 92,522 0.6 2. Onshore/offshore fueling 74 0.6 9,388 0.1 3. Onshore/offshore nonbulk
cargo transfer 20 0.2 1,726 0.0 4. Other transportation-related
marine facility 89 0.8 24,250 0.2
TOTAL 459 3.9 127,886 0.9
LAND FACILITIES 186 1.5 201,423 1.3
MISC/UNKNOWN 4,325 35.9 208,874 1.4
TOTAL 12,057 100.00 14,967,895 100.00
URCE: Department of Transportation, U.S. Coast Guard 1976, Polluting Incidents In and Around U.S. Waters, Calendar Year 1975, Comrandant U.S. Coast Guard.
274

Exhibit 111-4
Sources of Petroleum Products Discharged, United States 1976
Number of % of Volume in % of
VESSELS
Incidents Total Gallons Total -
1. Dry Cargo Ships 41 0.3 11,679 0.0 2. Dry cargo barges 324 2.6 24,840 0.1 3. Tank ships 623 4.9 8,930,029 26.4 4. Tank barges 976 7.7 1,953,442 5.8 5. Combatant vessels 179 1.4 26,987 0.1 6. Other vessels 1,153 9.1 245,013 0.7
- - - TOTAL 3,296 26.0 11,191,990 33.1
LAND VEHICLES 1. Rail vehicles 82 0.6 269,440 0.8 2.. Highway vehicles 335 2.6 323,391 1.0 3. Other/unknown vehicles 47 0.4 20,968 0.1 - - -
TOTAL 464 3.6 613,799 1.9
NON-TRANSPORTATION-RELATED FACILITIES
1. Onshore refinery 101 0.8 211,614 0.6 2. Onshore bulk/storage 365 2.9 5,873,932 17.4 3. Onshore production 242 1.9 349,053 1.0 4. Offshore produCtion facilities 1,358 10.7 274,732 0.8 5. Other facilities 1,055 8.3 9,759,869 28.8
- - _
TOTAL 3,121 24.6 16,469,200 48.0
PIPELINES 653 5.2 4,530,094 13.4
MARINE FACILITIES 1. Onshore/offshore bulk cargo
transfer 321 2.5 333,712 1.0 2. Onshore/offshore fueling 88 0.7 21,708 0.1 3. Onshore/offshore nonbulk
cargo transfer 23 0.2 15,643 0.0 4. Other transportation related
marine facility
128 1.0 5,787 0.0 - - -
TOTAL 560 4.4 376,850 1.1
LAND FACILITIES 182 1.4 442,730 1.3
MISC/UNKNOWN 4,379 34.6 227,167 0.7
- _ -
TOTAL 12,655 100.0 33,851,830 100.0
SOURCE: Department of Transportation, U.S. Coast Guard 1977, Polluting Incidents In and Around U.S. Waters, Cal- endar Year 1976, Commandant U.S. Coast Guard.
275
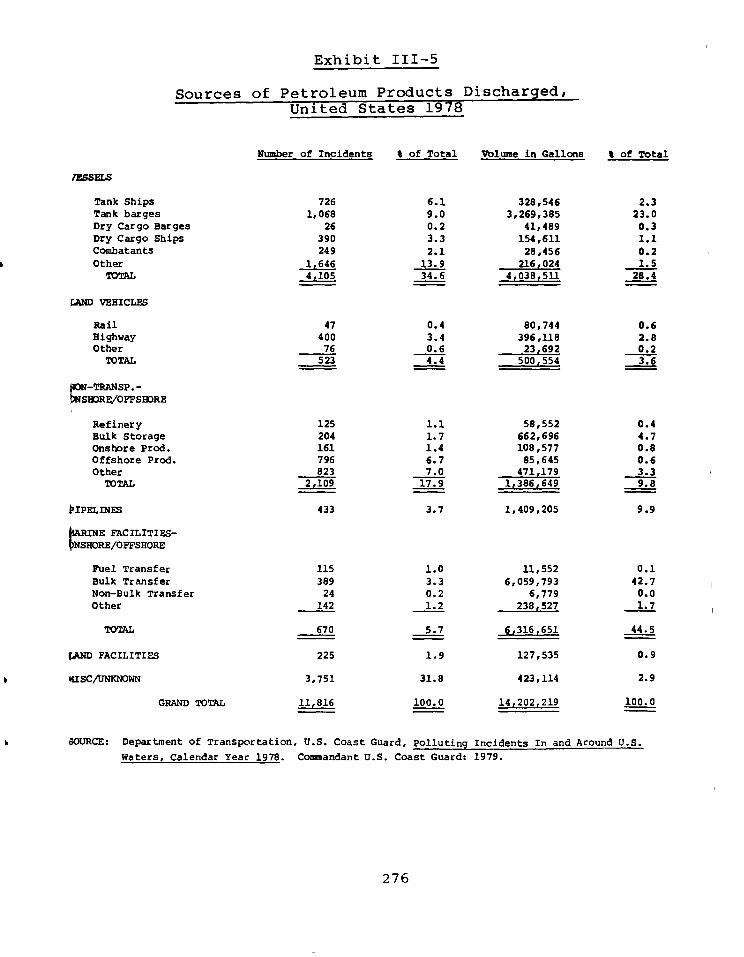
0.6 2.8 0.2 3.6
0.4 4.7 0.8 0.6 3.3 9.8
9.9
Exhibit 111-5
Sources of Petroleum Products Discharged, United States 1978
Number of Incidents % of Total Volume in Gallons of Total
IESSELS
Tank Ships 726 6.1 328,546 2.3 Tank barges 1,068 9.0 3,269,385 23.0 Dry Cargo Barges 26 0.2 41,489 0.3 Dry Cargo Ships 390 3.3 154,611 1.1 Combatants 249 2.1 28,456 0.2 Other 1,646 13.9 216,024 L-_- 1.5
TOTAL 4,105 34.6 4,038,511 28.4
LAND VEHICLES
Rail 47 0.4 Highway 400 3.4 Other 76 0.6
TOTAL 523 4.4
pON-TRANSP.- ONSHORE/OFFSHORE
80,744 396,118 23 692
500,554
Refinery 125 1.1 58,552 Bulk Storage 204 1.7 662,696 Onshore Prod. 161 1.4 108,577 Offshore Prod. 796 6.7 85,645 Other 823 7.0 471,179 --__-_-__
TOTAL 2,109 L-__ 17.9 1L 386 L 649 --------
PIPELINES 433 3.7 1,409,205
OARINE FACILITIES - *SHORE/OFFSHORE
Fuel Transfer 115 1.0 11,552 0.1 Bulk Transfer 389 3.3 6,059,793 42.7 Non-Bulk Transfer 24 0.2 6,779 0.0 Other 142 1.2 238,527 _-_-.1....- 1.7
TOTAL 670 5.7 6,316,651 44.5
!AND FACILITIES
KISC/UNKNOWN
GRAND TOTAL
SOURCE: Department of Transportation, U.S. Coast Guard, Polluting Incidents In and Around U.S.
Waters, Calendar Year 1978. Commandant U.S. Coast Guard: 1979.
225 1.9 127,535 0.9
3,751 31.8 423,114 2.9
11,816 100.0 14,202,219 100.0
276

NWS
..09' Stud Waterwavs national
Vw- FINAL REPORT
ANALYSIS OF ENVIRONMENTAL ASPECTS OF WATERWAYS NAVIGATION
APPENDIX
PREPARED FOR
U.S. ARMY CORPS OF ENGINEERS INSTITUTE FOR WATER RESOURCES
WATER RESOURCES SUPPORT CENTER KINGMAN BUILDING
FORT BELVOIR, VA 22060
UNDER CONTRACT NUMBER DACW 72-79-C-0003
AUGUST 1981
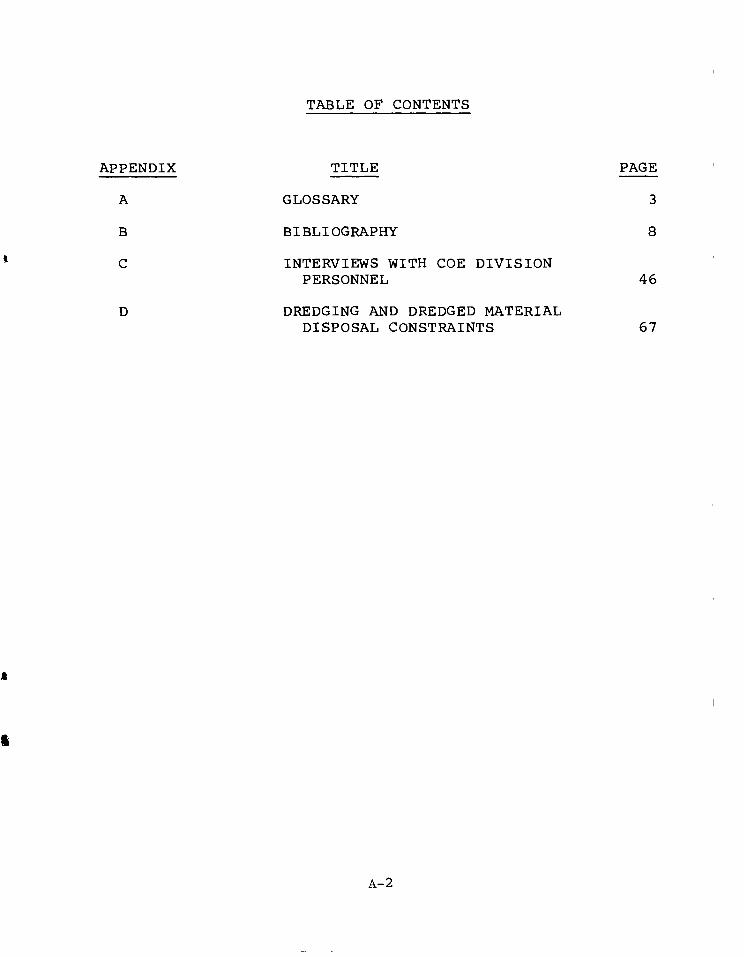
TABLE OF CONTENTS
APPENDIX TITLE PAGE
A GLOSSARY 3
B BIBLIOGRAPHY 8
C INTERVIEWS WITH COE DIVISION PERSONNEL 46
D DREDGING AND DREDGED MATERIAL DISPOSAL CONSTRAINTS 67
A-2
APPENDIX A
GLOSSARY
A-3

•
APPENDIX A
GLOSSARY
Aerobic: Requiring the presence of oxygen.
Agitation dredging: A process used in areas marked by swift currents whereby dredging is accomplished by disrupting bottom sediment which, in turn, is carried away by the currents.
Anadromous: Those fish, such as salmon and shad, that ascend freshwater streams to spawn.
Anaerobic condition: The absence of oxygen.
Annelid: Multisegmented wormlike animal of the phylum Annelida.
Avian: Pertaining to Aves, a class of animals composed of the birds.
Bathymetry (bathymetric): The science of measuring ocean depths in order to determine sea floor, topography.
Benthic organisms: Bottom dwelling aquatic organisms.
Bight: A long, gradual bend or recess in the coastline which forms a large, open receding bay.
Bioaccumulation: The uptake and incorporation of material into an organism as a result of its normal phsyiological processes.
Bioassay: A method for qualitatively determining the concentration of a substance by its effect on the growth of a suitable organism under controlled conditions.
Biome: A complex biotic community covering a large geographic area characterized by the distinctive lifeforms of major climax species.
BOD: Biochemical oxygen demand.
Chlorosis: A disease or mineral deficiency condition of green plants and seen as yellowing of green parts of plant.
A-4

Climax community: A mature relatively stable biotic community representing the culmination of ecological succession.
COD: Chemical oxygen demand.
Coelenterate: Member of the family Coelenterata including the sponges and jellyfish.
Copepod: A free-living Crustacean.
CZMA: Coastal Zone Managment Act.
Decibel (dB): The unit of measure for sound pressure, hence, intensity. Often used with A range weighting which corresponds to the human hearing range and written, dB(A).
Demersal: Living near or at the bottom of the sea.
Diatom: The common name for a silicon-containing algae.
DO: Dissolve oxygen.
Echinoderm: A member of the phylum Echinodermata composed of exclusively marine coelomate animals distinguished from all others by an internal skeleton composed of calcite plates (e.g., starfish, sea cucumber).
EIS (Environmental Impact Statement): A statement required under NEPA which asseses the ecological, social, economic and aesthetic effects of a project or action upon the environment. Included in such a statement is a quantified assessment of the area before the project or action, a quantified assessment of the impacts anticipated from the action, a review of feasible alternatives to the action, a discussion of mitigating measures, a discussion of the short-term benefits versus long-term effects and a discussion of those resources irretrievably lost by such action.
Epifauna: Surface dwelling aquatic organisms.
Epiphytic organism: A nonparasitic plant deriving moisture and nutrients from the air.
Estuary: A semi-enclosed coastal body of water which has a free connection with the open sea and within which sea water is measurably diluted with freshwater.
A-5
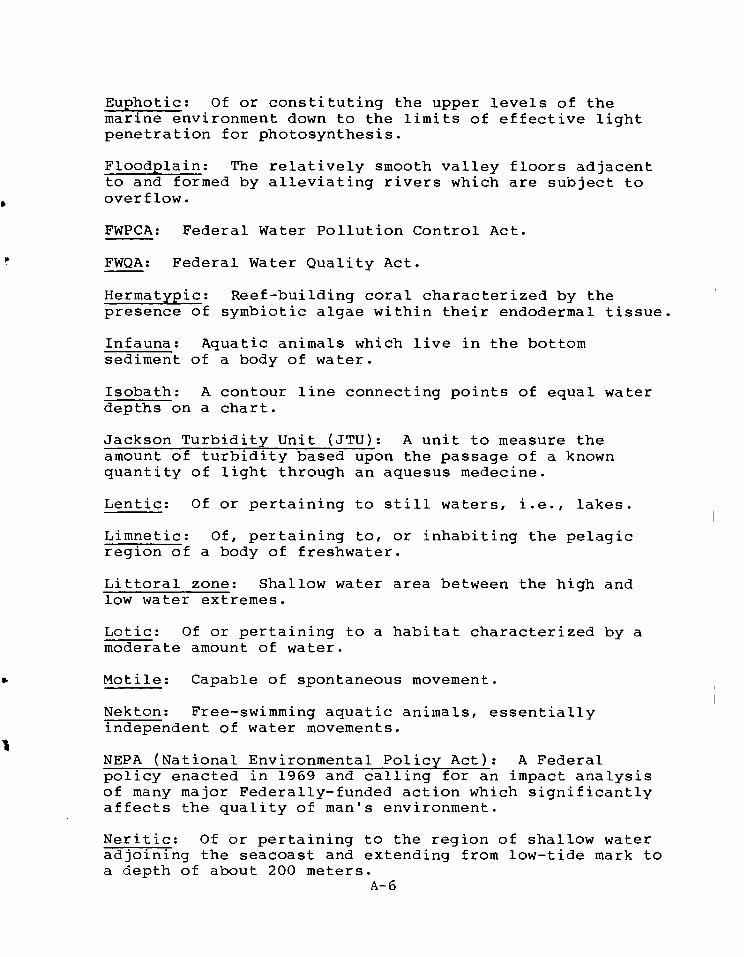
Euphotic: Of or constituting the upper levels of the marine environment down to the limits of effective light penetration for photosynthesis.
Floodplain: The relatively smooth valley floors adjacent to and formed by alleviating rivers which are subject to overflow.
FWPCA: Federal Water Pollution Control Act.
FWQA: Federal Water Quality Act.
Hermatypic: Reef-building coral characterized by the presence of symbiotic algae within their endodermal tissue.
Infauna: Aquatic animals which live in the bottom sediment of a body of water.
Isobath: A contour line connecting points of equal water depths on a chart.
Jackson Turbidity Unit (JTU): A unit to measure the amount of turbidity based upon the passage of a known quantity of light through an aquesus medecine.
Lentic: Of or pertaining to still waters, i.e., lakes.
Limnetic: Of, pertaining to, or inhabiting the pelagic region of a body of freshwater.
Littoral zone: Shallow water area between the high and low water extremes.
Lotic: Of or pertaining to a habitat characterized by a moderate amount of water.
* Motile: Capable of spontaneous movement.
Nekton: Free-swimming aquatic animals, essentially independent of water movements.
i NEPA (National Environmental Policy Act): A Federal policy enacted in 1969 and calling for an impact analysis of many major Federally-funded action which significantly affects the quality of man's environment.
Neritic: Of or pertaining to the region of shallow water adjoining the seacoast and extending from low-tide mark to a depth of about 200 meters.
A-6

Neuston: Minute organisms that float or swim on surface waters.
NPDES: National Pollution Discharge Elimination System.
Oxidation: A chemical reaction that increases the oxygen content of a compound and, hence, that compound loses electrons.
Pelagic organisms: Midwater, aquatic organisms, i.e., ones which never touch the bottom strata.
Periphytic: Pertaining to sessile biotal components of freshwater ecosystems.
Phytobenthos: Bottom dwelling plant-life.
Phytoplankton: Planktonic plant life.
Profundal: The region occurring below the limnetic zone and extending to the bottom in lakes deep enough to develop temperature stratification.
RCRA: Resource Conservation and Recovery Act.
Reduction: A chemical reaction that decreases the oxygen content of a compound and, hence, that compound gains electrons.
Segment: A term used by the United States Army Corps of Engineers (COE) to denote a specific portion of the National Waterways System. All navigable waterways within this system are segmented and monitored by District COE Offices.
Sessile: Permanently attached to the substrate.
Trophic: Pertaining to, or functioning in, nutrition.
Xeric: Of or pertaining to a habitat having a low or inadequate supply of moisture.
A- 7
APPENDIX B
BIBLIOGRAPHY
A-8
APPENDIX B
WATER QUALITY/AQUATTC HABITAT
Arner, D.H., H.R. Robinette, J.E. Frasier, and M. Gray, 1975. Effects of Channel Modification on the Luxapalila River. In, Symposium on stream channel modification, R.V. Corning, R.F. Raleigh, G.D. Schuster, Sr., and A. Wood (eds.) Harrisburg, Virginia
Barnard, W.D. (1978) Prediction and Control of Dredged Material Dispersion Around Dredging and Open-Water Pipeline Disposal Operations. Corps of Engineers Waterways Experiment Station Technical Report DS-78-13.
Bartos, M.J., Jr. (1977) Use of Dredged Material in Solid Waste Management. Corps of Engineers Waterways Experiment Station, Vicksburg, Mississippi Technical Report D-77-11.
Basco, D.R., W.A. Dunlap, A.H. Bouma (1974) Assessment of the Factors Controlling the Long-Term Fate of Dredged Material Deposited in Unconfined Subaqueous Disposal Areas. Corps of Engineers Waterways Experiment Station. Vicksburg, Mississippi Technical Report D-74-8.
Bayless, J. and W.B. Smith, 1964. The Effects of Channelization Upon the Fish Population of Lotic Waters in Eastern North Carolina. Proc. Ann. Conf. S.E. Assoc. Game and Fish Comm.
Bell, Milo C., 1973. Fisheries Handbook of Engineering Requirements and Biological Criteria. United States Army Division, North Pacific, Fisheries Engineering Program.
Bella, David A., 1975. Strategic Approach To Estuarine Environmental Management. Journal of Waterways, Harbors and Coastal Engineering Division, February 1975.
Biggs, R.B. (1970) Gross Physical and Biological Effects of Overboard Spoil Disposal. Natural Resource Institute, University of Maryland, Special Report No. 3, United States Department of the Interior, Washington, D.C.
A-9

Bohlen, W.F. & J.M. Tramontano (1977) An Investigation of the Impact of Dredging Operations on Suspended Material Transport in the Lower Thames River Estuary. Universtiy of Connecticut, Groton, Connecticut
Bokuniewicz, H.J., et al. (1977) Field Study of the Effects of Storms on the Stability and Fate of Dredged Material in Subaqueous Disposal Areas. Corps of Engineers Waterways Experiment Station, Vicksburg, Mississippi Technical Report D-77-22.
Buck, D.H., 1956. Effects of Turbidity on Fish & Fishing. Twenty-First North American Wildlife Conference Transactions: 249-261.
Brown, C.L. & R. Clark (1968) Observations on Dredging and Dissolved Oxygen in a Tidal Waterway. Water Res. Research 4 (6) 1381-1384.
Bulkley, Bachmann, Carlander, Fierstine, King, Menzell, Witten and Zimmer, 1976. Warmwaters stream alteration in Iowa: extent, effects on habitat, fish and fish food and evaluation of stream improvement structures. Summary report, United States Fish and Wildlife Service, FWS/OBS - 76/16.
Burks, S.A. & R.M. Engler (1978) Water Quality Impacts of Aquatic Dredged Material Disposal (Laboratory Investigations) Corps of Engineers Waterways Experiment Station, Vicksburg, Mississippi Technical Report DS-78-4.
California Department of Fish and Game, January, 1972, At the Crossroads, a Report on California's Endangered --
and Rare Fish and Wildlife, (Sacramento, California).
Chamberlain, E.B., Jr. 1948. Ecological factors influencing the growth and management of certain waterfowl food plants on Back Bay National Wildlife Refuge. Transactions of the North American Wildlife Conference 13: 347-355.
Chen, K.Y., J.L. Mang, B. Eichenberger, R.E. Hoeppel (1978) Confined Disposal Area Effluent and Leachate Control (Lab and Field Investigations). Corps of Engineer Waterways Experiment Station Vicksburg, Mississippi Technical Report DS-78-7.
A-10
Claflin, T.O. (1976) Resuspension of Sediments Due to Hydraulic Dredging, Silt Screen, Polymers. Mimeographed Report to St. Paul District. United States Army Corps of Engineers, St. Paul, Minnesota. 12pp.
Colbert, Billy K., et. al., "Environmental Inventory and Assessment of Navigation Pools 24, 25, and 26, Upper Mississippi and Lower Illinois Rivers--An Aquatic Analysis," TR Y-75-2, USAEWES, Vicksburg, Mississippi December 1975.
Congdon, J.C., 1971. Fish populations of channelized and unchannelized sections of the Chariton River, Missouri. Stream dhannelization - A symposium. In E. Shenneberger and J.L. Funk (eds.). North Central Division, American Fish. Soc. Special Pub. No. 2.
Conner, W.G. et al. (1979) Disposal of Dredged Material Within the New York District Volume I Present Practices and Candidate Alternatives. MTR-7808.
Corps of Engineers, St. Louis District, 1976. Revised Drafted Supplement Environmental Statement - Volume I Text: Sections One Through Eight and Section Ten, Locks and Dam No. 26 (Replacement), Upper Mississippi River Basin.
Corps of Engineers, 1975. Final Environmental Statement Operation and Maintenance of a Nine-Foot Channel in the Illinois Waterway.
Corps of Engineers, St. Louis District, 1974. Final Environmental Statement - Locks and Dam No. 26 (Replacement), Upper Mississippi River Basin.
Corps of Engineers, St. Louis District, 1975. Draft Environmental Statement - Volume II Physical and Cultural Appendices, Lock and Dam No. 26 (Replacement), Upper Mississippi River Basin.
Corps of Engineers (1975) Final Composite Environmental Statement Maintenance Dredging Existing Navigation Projects San Francisco Bay Region, California. San Francisco District.
Corps of Engineers, (1976) Dredge Disposal Study, San Francisco Bay and Estuary. Appendix C. San Francisco District.
A-11
Corps of Engineers District, San Francisco (1977). Dredge Disposal Study, San Francisco Bay and Estuary; Appendix E, Material Release. San Francisco, California.
Corps of Engineers Office, Chief of Engineers, Department of the Army, CE, "Engineering and Design--Nitrogen Supersaturation," Engineering Technical Letter No. 1110-2-239, 15 Sep 1978, Washington, D.C. 20315.
Corps of Engineers, Water Quality Criteria 1972, prepared by the National Academy of Sciences, National Academy of Engineering Committee on Water Quality, for the EPA, Washington, D.C., July 22, 1972.
Corps of Engineers, Chicago District, 1975. Final Environmental Statement - Operation and Maintenance of a Nine-Foot Channel in the Illinois Waterway.
Corps of Engineers, Pittsburgh District, 1975. Final Environmental Statement on the Operation and Maintenance of the Navigation System - Monongahela River.
Corps of Engineers, Huntington District, 1975. Final Environmental Impact Statement - Kanawha River Navigation System Fayette, Kanawha, Putnam & Mason Counties, West Virginia.
Corps of Engineers, Nashville District, 1975. Open Channel Maintenance - Tennessee River and Tributaries.
Corps of Engineers, Nashville District, 1975. Operation, Maintenance and Management of Water Resource Development Projects, Cumberland River.
Corps of Engineers, Portland District, 1975. Columbia and Lower Willamette River Environmental Statement.
Corps of Engineers, 1976. Final Environmental Impact Statement Mississippi River Between The Ohio and Missouri Rivers Regulating Works.
Corps of Engineers, 1976. Final Environmental Impact Statement, McNary. Walla Walla, Washington.
Corps of Engineers, 1977. Fish & Wildlife Habitat Changes Resulting From Construction of a Nine-Foot Navigation Channel in the Illinois Waterway.
A-12
Corps of Engineers Office, Chief of Engineers, Department of the Army, CE, "Hydraulic Design--Navigation Locks," Engineering Manual EM 11102-21604, April 1945, Washington, D.C. 20315.
Corps of Engineers, Ohio River Division, Draft Environmental Impact Statement 1978. Ohio River Navigation Project, Operation and Maintenance.
Corps of Engineers, Portant District, 1974. Environmental Impact Statement - Matilla - The Dalles, Construct, Operation, Management.
Corps of Engineers, 1974. Draft Environmental Statement - Operation and Maintenance of a Nine-Foot Channel in the Illinois Waterway.
Corps of Engineers, 1979. Identify, Document and Evaluate the Effect of Waterway Structure Operational Procedures on Environmental Quality, Draft.
Corps of Engineers, Sacramento District, 1977. Study of the Effects of a Submerged Sill in Carquinez Strait on Suspended Sediment Concentrations.
Corps of Engineers, Institute of Water Resources, 1972. United States Deepwater Port Study - The Environmental and Ecological Aspects of Deepwater Ports.
Corps of Engineers, Lower Mississippi Valley Division and Galveston, New Orleans, and Mobile Districts; 1975. Report on Gulf Coast Deep Water Port Facilities - Texas, Louisiana, Mississippi, Alabama and Florida. Appendix F Environmental Assessment, Volume IV - Environmental Impact.
Corps of Engineers, Rock Island District, 1978. Environmental & Social Considerations of Mississippi River, Year-Round Navigation Program.
Corps of Engineers, North Central Division. Phase I Report, Mississippi River Year-Round Navigation.
Corps of Engineers (1972) Specifications for Dam and Appurtenances, Phase No. 1, Bloomington Lake. Baltimore District, Baltimore, Maryland, Sections 2-13, November 9, 1972.
A-13
Cronin, W.B. et al. (1976) Investigations of Dredging Operations Brewerton Cut-off Angle - Patapsco River Mouth Disposal Site. Chesapeake Bay Institute, Baltimore, Maryland.
Daley, Richard H., 1977. Biologioal Issues and Concerns on the Mississippi River Mainstream From Cairo, Illinois to Saverton, Missouri. Prepared for the Upper Mississippi River Basin Commission.
Danek, L.J. et al. (1977) Aquatic Disposal Field Investigations, Ashtabula River Disposal Site, Ohio; Appendix B: Investigation of the Hydraulic Regime and Physical Nature of Bottom Sedimentation Technical Report D-77-42. Corps of Engineers Waterways Experiment Station, Vicksburg, Mississippi
deBree, S.E.M. (1977) The Loading of Hopper Dredgers. Ports and Dredging and Oil Report, No. 92 pp. 4-8.
Duvel, W.A. Jr., R.D. Volkmar, W.L. Specht and F.W. Johnson, 1976. Environmental Impact of Stream Channelization Water Resources Bulletin Volume 12, No. 14, 799-812.
Ebel, Wesley J., "Supersaturation of Nitrogen in the Columbia River; and its Effect on Salmon and Steelhead Trout," United States Fish and Wildlife Fishery Bulletin 68, Washington, D.C. 1969.
Ecological Consultants, Inc., 1978. Evaluation of the Navigation Effects on the Biological Components of the Upper Mississippi River Aquatic Ecosystem. Prelim-inary Draft prepared for the Upper Mississippi River Basin Commission.
Elser, A.A., 1968. Fish Populations in Relation to Major Habitat Zones and Channel Alteration. Trans. Amer. Fish Soc. 97 (4): 389-397.
Environmental Laboratory, 0. Beeman, A.P. Benkendorf (1978) Land Use of Dredged Material Containment Areas: Productive Use Examples. Corps of Engineers Waterways Experiment Station, Vicksburg, Mississippi Misc. Paper D-78-4.
A-14
Environmental Protection Agency (1973) Methods for Identifying and Evaluating the Nature and Extent of Nonpoint Sources of Pollutants. Office of Air & Water Programs, Washington, D.C., EPA-430/9-73-014.
United States Environmental Protection Agency, 1972. Report of the Committee on Water Quality Criteria. Reprinted from Report of the National Technical Advisory Committee to the Secretary of the Interior, Federal Water Pollution Control Administration, 1968.
United States Environmental Protection Agency, 1973. Proposed criteria for water quality, Volume 1, Washington, D.C.
EPA, National Water Quality Inventory, 1975 Report to Congress, Washington, D.C., EPA-440/9-75-014.
EPA, National Water Quality Inventory, 1976 Report to Congress, Washington, D.C., EPA-440/9-79-024.
EPA, National Water Quality Inventory, 1977 Report to Congress, Washington, D.C., EPA-440/4-78-001.
Estes, E.L. and R.J. Scrudato (1977) Aquatic Disposal Field Investigations, Galveston, Texas, Offshore Disposal Site; Appendix A: Investigation of the Hydraulic Regime and Physical Nature of Sedimentation. Technical Report D-77-20. Corps of Engineers Waterways Experiment Station, Vicksburg, Mississippi
Etneir, D.A., 1972. The effect of annual rechanneling on a stream fish population. Trans. Amer. Fish. Soc. 101(2): 372-375.
Evans, Willis A., 1976. Fish Migration and Fish Passage - A Practical Guide to Solving Fish Passage Problems. U.S.D.A. Forest Service - Region 5.
Fujihara, M.P. and F.P. Hungate, 1971. Chondruccus Columnaris Disease of Fishes: Influence of Columbia River Fish Ladders. J. Fish Res. Bd. Canada. 28:533-536.
Goodwin, H.A. and E.P. Dendon, March, 1971, "Status of Endangered Species Program", Transaction of the Thirty-Sixth North American Wildlife and Natural Resources Conference (Wildlife Management Institute, Washington, D.C.) pp. 331-343.
A-15
Gordon, R.B. (1974) Dispersion of Dredge Spoil Dumped Near-Shore Waters. Estuarine and Coastal Marine Science Volume 2, pp. 349-358.
Graf, W.H. (1971) Hydraulics of Sediment Transport. McGraw-Hill, New York.
Great I Water Quality Work Group (1978a ). A Pilot Study on Effects of Hydraulic Dredging and Disposal on Water Quality of the Upper Mississippi River.
Great I (1978b). Effects of Clamshell (Mechanical) Dredging and Disposal on Water Quality of the Upper Mississippi River Water Quality Work Group. St. Paul District, Corps of Engineers.
Great I (1979) Water Quality Work Group Report.
Green, William E., 1960. Ecological Changes on the Upper Mississippi River Wildlife & Fish Refuge Since Inception of the Nine-Foot Channel. United States Fish and Wildlife Service.
Griswold, Edwards, Woods and Weber, 1978. Some effects of stream channelization on fish populations, macro-invertebrates, and fishing in Ohio and Indiana. United States Fish and Wildlife Service, FWS/0BS-77/46.
Gustafson, J.R. (1972) Beneficial Effects of Dredging Turbidity. World Dredging and Marine Construction 8 _ (13) 44-45, 47-48, 50-52, 72.
Hanson, D.R., 1971. Stream Channelization Effects on Fishes and Bottom Fauna in the Little Sioux River, Iowa. Stream Channelization - A symposium, In E. Shenneberger and J.L. Funk (eds.). North Central Div. Amer. Fish. Soc. Special Pub. No.2.
Henegar, D.L. and K.W. Harmon, 1973. A review of references to channelization and its environmental impact. In: Stream channelization - A symposium, E. Shenneberger and J.L. Funk, Editors. North Central Division American Fish. Society, Spec. Publ. No. 2.
Herbich, J.B. (1975) Coastal and Deep Ocean Dredging. Gulf Pub. Company, Houston, Texas. 622 pp.
A-16

Hirsch, N.D., L.H. DiSalvo, R. Peddicord (1978) Effects of Dredging and Disposal on Aquatic Organisms. Corps of Engineers Waterways Experiment Station. Technical Report DS-78-5.
Holler, A.G., Jr., 1970. Reaeration of discharge through hydraulic structures. Corps of Engineers, Ohio River Division, Cincinnati, Ohio.
Holliday, B.W. (1978) Processes Affecting the Fate of Dredged Material. Corps of Engineers Waterways Experiment Station, Vicksburg, Mississippi Technical Report DS-78-2.
Hough, J.L. (1958) Geology of the Great Lakes. University of Illinois Press, Urbana.
Huston, J.W. (1970) Hydraulic Dredging, Theoretical & Applied. Cornell Maritime Press, Cambridge, Maryland.
Huston, J.W. & W.C. Huston (1976). Techniques for Reducing Turbidity Associated With Present Dredging Procedures and Operations. Corps of Engineers Waterways Experiment Station, Vicksburg, Mississippi Contract Report D-76-4.
Hynes, H.B.N., 1974. The biology of polluted waters. University of Toronto Press.
Hynes, H.B.N., 1976. The ecology of running waters. University of Toronto Press.
Ippen, A.T. (1966) Estuaries and Coastline Hydrodynamics. McGraw-Hill, New York.
Irizarry, R.A., 1969. The effects of stream alteration in Idaho. Idaho Fish and Game Department, Boise. Job Completion Rep., Project F55-R-2.
JBF (1974) The Collection of Data on the Turbidity Assoc. with Sand & Gravel Mining and a Comparison to Predictions Using a Dispersion Model. JBF Scientific Corp., Wilmington, Massachusetts.
A-17

Johnson, J.H., 1975. Effects of Tow Traffic on the Resuspension of Sediments and Dissolved Oxygen Concentrations in the Illinois and Upper Mississippi Rivers Under Normal Pool Conditions. (Preliminary Working Draft). Corps of Engineers Waterways Experiment Station.
Krone, R.B. (1972) A Field Study of Flocculation as a Factor in Estuarial Shoaling Processes. Technical Bull. No. 19. Comm. on Tidal Hydraulics, Corps of Engineers, Vicksburg, Mississippi.
Lauff, G.H., ed. (1967) Estuaries Publication No. 83. American Association for the Advancement of Science, Washington, D.C.
Lee, G.F. (1977) Corps of Engineers Criteria Project on Upper Mississippi River (Grey Cloud Slough Dredging Operation). Mimeographed report to the Corps of Engineers WES. Institute for Environmental Sciences, University of Texas at Dallas, 54 pp.
Low, J.B., and F.C. Bellrose, 1944. The seed and vegetative yield of waterfowl food plants in the Illinois River Valley. Journal of Wildlife Management 8(1): 7-22.
Ludwick, J.C. (1972) Migration of Tidal Sand Waves in Chesapeake Bay Entrance, in Shelf Sediment Transport: Process and Pattern. Swift, D.F.P., et al. eds., Dowden, Hutchinson, and Ross, Stroudsburg, Pennsylvania
Lund, J.A., 1976. Evaluation of stream channelization and mitigation on the fishery resources of the St. Regis River, Montana. Office of Biological Services, United States Fish and Wildlife Service, Washington, D.C., Publication No. FWS/OBS-76/06.
Lunz, J.D., R.J. Diaz, R.A. Cole (1978). Upland and Wetland Habitat Development With Dredged Material: Ecological Considerations. Corps of Engineers Waterways Experiment Station, Vicksburg, Mississippi Technical Report DS-78-15.
Maurer, D.L. et al. (1978). Vertical Migration of Benthos in Simulated Dredged Material Overburdens, Vol.I: Marine Benthos. Corps of Engineers Waterways Experiment Station, Vicksburg, Mississippi Technical Report D-78-35.
A-18

,
May, E.B. (1973). Environmental effects of hydraulic dredging in estuaries. Alabama Mar. Res. Bull. No.9: 1-85.
McConnaughy, Ph.D. Introduction to Marine Biology. The C.V. Mosby Company Saint Louis, Misssouri 1974.
Minnesota Pollution Control Agency (1975). Investigation of the U.S.C.E. Dredging Operations on the Mississippi River at Grey Cloud Island - September 10, 1975. Division of Water Quality, Section of Surface and Groundwaters, MPCA, Rose v ille, Minnesota 10 pp.
Moherek, A.J. (1978). Flume Experiments on Sand, Silt, and Clay Mixtures from the Offshore Dredged Material Disposal Site, Galveston, Texas. Technical Report D-78-34. Corps of Engineers Waterways Experiment Station, Vicksburg, Mississippi.
Mohr, A.W. (1974). Development and Future of Dredging. J. Waterways Harbors and Coastal Eng. Div. ASCE. WW2, pp. 69-83.
Montgomery, R.L., A.W. Ford, M.E. Poindexter, M.J. Bartos (1978) Guidelines for Dredged Material Disposal Area Reuse Management. Corps of Engineers Waterways Experiment Station, Vicksburg, Mississippi Technical Report DS-78-12.
Morris, L.A., R.N. Langemeier, T.R. Russel, and A. Witt, 1968. Effects of main stem impoundments and channelization upon the limnology of the Missouri River, Nebraska. Trans. Amer. Fish. Soc. 97 (4): 380-388.
National Commission on Water Quality, Staff Report. . United States Government Printing Service, April 1976.
National Estuarine Pollution Study, United States Government Printing Service, 1969.
I Nichols, M.M., G.S. Thompson, R.W. Faas (1978). A Field
Study of Fluid Mud Dredged Material: Its Physical Nature and Dispersal. Corps of Engineers Waterway Experiment Station, Vicksburg, Mississippi Technical Report D-78-40.
Odum, Eugene P., Fundamentals of Ecology, W.B. Saunders Company, 3rd Edition. 1971.
A-19
Oertel, G.F.,II (1974) Report on the Hydrologic and Sedimentologic Study of the Offshore Disposal Area, Savannah, Georgia. Contract Report. Corps of Engineers District, Savannah, Georgia.
Ofuji, I. & N. Ishimatsu (1976) Anti-Turbidity Overflow System for Hopper Dredge. Proc. of WODCON VII: Dredging, Environ. Effects & Technology. pp. 207-233.
Peddicord, R.K. & V.A. McFarland (1978). Effects of Suspended Dredged Material on Aquatic Animals. Corps of Engineers Waterways Experiment Station, Vicksburg, Mississippi Technical Report D-78-29.
Peddicord, R.K., V.A. McFarland, D.P. Belfiori, and T.E. Byrd (1975). Effects of Suspended Solids on San Francisco Bay Organisms. Report to Corps of Engineers District, San Francisco, Dredge Disposal Study Appendix G, 158 pp.
Permanent International Association of Navigation Congresses (PIANC) Annex to Bulletin No. 27 (Vol 11/1977). Final Report of the In-national Commission for the study of Environmental Effects of Dredging and Disposal of Dredged Materials.
Pequegnat, W.E. (1978). An Assessment of the Potential Impact of Dredged Material Disposal in the Open Ocean. Technical Report D-78-2. Corps of Engineers Waterways Experiment Station, Vicksburg, Mississippi
Pollack, J.W. (1968). The Effect of Chemical Flocculants on Dredging Overflows from the Hopper Dredge MARKHAM. Dredging Water Quality Problems in Great Lakes, Volume 7, Appendix C3, pp. 1-73.
Postma, H. (1967). Sediment Transport and Sedimentation in the Estuarine Environment, in Estuaries. G.H. Lauff, ed., Pub. No. 83, American Association for the Advancement of Science, Washington, D.C.
Pritchard, D.W. (1967). What is an Estuary: Physical Viewpoint in Estuaries ed. by G.H. Lauff, Publication No. 83, American Association for the Advancement of Science, Washington, D.C.
Purkett, C.A., Jr., 1957. Growth of the fishes in the Salt River, Missouri. Trans. Amer. Fish. Soc. 87:116-131.
A-20

Ranthum, R.G., 1974. Effect of commercial fishing on winter congregation of catfish in Pool 7 of the Mississippi River. Prepared for the National Oceanic and Atmospheric Administration, National Marine Fisheries Service, NTIS No. COM-75-10458.
Reid, G.K. and Wood, R.D. Ecology of Inland Waters and Estuaries. D. VanNostrand Company, New York, 2nd. Edition, 1976.
Robel, K.J., 1961. Water depth and turbidity in relation to growth of sago pondweed. Journal of Wildlife Mangement 25(4): 436-438.
Robert R. Nathan Associates and Coastal Zone Resources Corp., 1975. The Coastal Plains Deepwater Terminal Study, Volume 1. Prepared for the Coastal Plains Regional Commission.
Robison, R.R., D.D. Fillis, and S.L. White (1973). Special Report on Control of Turbidity During Construction of Teton Dam and Power and Pumping Plant. United States Department of Interior, Bureau of Reclamation, Washington, D.C.
Saila, S.B., et al. (1972). Dredged Spoil Disposal in Rhode Island Sound. Mar. Exp. Sta., School of Oceanography, Technical Report No. 2, University of Rhode Island, Kingston, Rhode Island.
Schneberger, E. and J.L. Funk, ed., 1971. Stream channelization: A symposium. N.C. Div., Am. Fish. Soc., Spec. Publ. 2.
Sherk, J.A., Jr. (1971). The Effects of Suspended & Deposited Sediments on Estuarine Organisms - Literature Summary and Research Needs, Contribution No. 443. Natural Resources Institute, University of Maryland, College Park, Maryland.
Sherk, J.A., Jr. (1972). Current Status of the Knowledge of the Biological Effects of Suspended & Deposited Sediments in Chesapeake Bay. Ches. Science, Suppl. 13: S137-S144.
Sherk, J.A., J.M. O'Conner, D.A. Newman et al. (1974). Effects of Suspended & Deposited Sediments on Estuarine Organisms, Phase II, Ref. No. 74-20. Nat. Res. Inst., Solomons, Maryland.
A-2 1
Slotta, L.S. et al. (1974). An Examination of Some Physical and Biological Impacts of Dredging in Estuaries. PB240-742.
Smith, Hugh A., Jr., 1974. Spillway Redesign Abates Gas Supersaturation in Columbia River. Reprinted from Civil Engineering - ASCE, September 1974.
Smith, H.K. (1978). An Introduction to Habitat Development on Dredged Material. Corps of Engineers Waterways Experiment Station, Vicksburg, Mississippi Technical Report DS-78-19.
Smith, J.M., J.B. Phipps, E.D. Schermcr, and D.F. Samuelson (1976). Impact of Dredging on Water Quality in Grays Harbor, Washington. In: Proc. of Specialty Conf. on Dredging and Its Environmental Effects. Mobile, Alabama (January 26-28, 1976). Pub. by ASCE pp. 512-528.
Soots, R.F., Jr. and M.C. Landin (1978). Development and Management of Avian Habitat on Dredged Material Islands. Corps of Engineers Waterways Experiment Station, Vicksburg, Mississippi Technical Report DS-78-18.
Starret, W.C., 1971. A Survey of the Mussels (Unionacea) of the Illinois River: A Polluted Stream. Illinois Nat. Surv. Bull. 30 Art.5.
Starret, W.C., 1972. Man and the Illinois River. In: River Ecology and Man. R.T. Oglesbey, C.A. Carlson and J.A. McCann (EOS.), Acad. Press.
Stern, E.M. & W.B. Stickle (1978). Effects of Turbidity & Suspended Material in Aquatic Environments - Literature Review. Corps of Engineers Waterways Experiment Station. Vicksburg, Mississippi Technical Report D-78-21.
Sternberg, R.W., et al. (1977). Aquatic Disposal Field Investigations, Columbia River Disposal Site, Oregon: Appendix A: Investigation of the Hydraulic Regime & Physical Nature of Bottom Sedimentation. Technical Report D-77-30. Corps of Engineers Waterways Experiment Station, Vicksburg, Mississippi
A -2 2
..
O
Sustar, J.F., T.H. Wakeman, R.M. Ecker (1976). Sediment-Water Interaction During Dredging Operation. In: Proc. of Specialty Conf. on Dredging and its Environmental Effects. Mobile, Alabama (January 26-28, 1976). Pub. by ASCE. 1040 + pp.
Swift, D.F.P., D.B. Duane, and D.A. Pilkey (1972). Shelf Sediment Transport: Process and Pattern. Dowden, Hutchinson, and Ross. Stroudsburg, Pennsylvania.
Talbot, Lee M., 1966. "The World's Most Endangered Species", The Call of the Vanishing Wild, feature stories from the Christian Science Monitor (The Christian Science Publishing Society).
Tarplee, W.H., Jr., D.E. Louder, and A.J. Weber, 1971. Evaluation of the effects of channelization on fish populations in North Carolina's coastal plain streams. North Carolina Wildlife Resource Comm., Raleigh.
Thorn, M.F.C. (1975). Loading and Consolidation of Dredged Silt in a Trailing Suction Hopper Dredger. First International Symposium on Dredging Technology. pp. B1-1 to B1-14.
Trautman, M.B. and D.K. Gartman, 1974. Re-evaluation of the effects of manmade modifications on Gordon Creek between 1887 and 1973 and especially as regards its fish fauna. Ohio J. Sci. 74(3).
United States Water Resource Council, The Nations Water Resources, Part IV, Water Supply and Water Quality Considerations, Washington, D.C., April 1978.
Water Quality Analysis and Environmental Impact Assessment . of PL 92-500, 1976.
Westley, R.E., et al. (1975). Evaluation of Effects of Channel Maintenance Dredging and Disposal of the Marine Environmental in Southern Puget Sound, Washington. Washington Department of Fisheries, Management and Research Division, Olympia.
Wright, T.D. (1978). Aquatic Dredged Material Disposal Impacts. Corps of Engineers Waterways Experiment Station, Vicksburg, Mississippi Technical Report DS-78-1.
A-2 3
Yagi, T. et al. (1975). Effect of Operating Conditions of Hydraulic Dredges on Dredging Capacity and Turbidity. (Translation from Japanese) No. 228, September 1975, Port & Harbor Research Institute, Ministry of Transport, Yokosuka, Japan.
Yagi, T., T. Koiwa, S. Muyazaki (1976). "Turbidity Caused by Dredging," in Dredging: Environmental Effects & Technology. Proc. World Dredging Conf. VII, San Francisco, July 10-12, 1976. pp 1079-1109.
Zimmer, D.W. and R.W. Bachman, 1978. Channelization and invertebrate drift in some Iowa streams. AWRA paper No. 77111 of the Water Resources Bulletin Volume 14, No. 4.
A-24
TERRESTRIAL HABITAT
Abele, L. G. 1974. Species diversity of decapod crustaceans in marine habitats. Ecology. 55:156-161.
Adams, D. D., D. A. Darby, and R. J. Young. 1978. Habitat development field investigations, Windmill Point marsh development site, James River, Virginia; Appendix F: Environmental impacts of marsh development with dredged material: Sediment and water quality. Technical Report D-77-23, Vols I and II. United States Army Engineer Waterways Experiment Station, CE, Vicksburg, Mississippi
Allen, H. H., E. J. Clairain, Jr., R. J. Diaz, A. W. Ford, L. J. Hunt, and B. R. Wells. 1978. Habitat development field investigations, Bolivar Peninsula marsh and upland habitat Galveston Bay, Texas; Summary report. Technical Report D-7815. United States Army Engineer Waterways Experiment Station, CE, Vicksburg, Mississippi
Arend, P.H., 1972. The impact of the Dos Rios Dam on the Wildlife Ecology of the Eel River, California. In: The Effects of Middle Fork Eel River'Development on Wildlife Resources. California Department of Fish and Game.
Armstrong, W. 1968. Oxygen diffusion from the roots of woody species. Physiol Plant. 21:539-543.
Bartos, M. J., Jr., "Use of Dredged Material in Solid Waste Management, " Technical Report D-77-11, September 1977. United States Army Engineer Waterways Experiment Station, CE, Vicksburg, Mississippi
Bell, D. T.; 1979. Studies on the Ecology of a Streamside Forest: Composition and Distribution of Vegetation Beneath The Tree Canopy. Bull. Toor. Bot. Club 101:14-20
Bell, D. T., and F. L. Johnson; 1974. Flood-caused Tree Mortality Around Illinois Reservoirs. Trans. In. State Acad. Sci. 67 (1): 28-37.
Broadfoot, W. M.; 1973. Watertable Depth and Growth of Young Cottonwood. USDA Forestry Service Resource Note SO-168.
A-25

Broadfoot, W. M., and H. L. Williston; 1973. Flooding Effects on Southern Forests. Journal of Forestry 71 (9):584-587.
Burks, S. A. and R. M. Engler. 1978. Water quality impacts of aquatic dredged material disposal (laboratory investigations). Technical Report DS-78-4. United States Army Engineer Waterways Experiment Station, CE, Vicksburg, Mississippi
■
California Department of Fish and Game, January, 1972, At the Crossroads, a Report on California's Endangered and Rare Fish and Wildlife, (Sacramento, Calif.).
Cammen, L. M. 1976. Abundance and production of macroinvertebrates from natural and artificially established salt marshes in North Carolina. American Mid. Natur. 96:487-493.
Chrikova, T.V. and T.S. Gutman; 1972. Physiological Role of Branch Lenticles in Willow and Poplar Under Conditions of Root Anaerobiosis. Fiziol. Rast. 19:362-385.
Clairain, E. J., Jr., R. A. Cole, R. J. Diaz, A. W. Ford, R. T. Huffman, L. J. Hunt, and B. R. Wells. 1978. Habitat development field investigations, Miller Sands marsh and upland habitat development site, Columbia River, Oregon; Summary report. Technical Report D077-38. United States Army Engineer Waterways Experiment Station, CE, Vicksburg, Mississippi.
Corps of Engineers, Analyzing the Environmental Impacts of Water Projects, United States Army Engineer Institute for Water Resources, NTIS, United States Department of Commerce, Virginia, 1973.
Corps of Engineers, 1974. Draft Environmental Statement - Operation and Maintenance of a nine-foot channel in the Illinois Waterway from the junction of the Calumet-Sag channel and the Chicago sanitary and ship canal to the Lagrange Lock and dam. Chicago District.
Corps of Engineers, 1975. Environmental Assessment of the Mississippi River and Tributaries Project. Prepared by Rychman, Edgerley, Tomlinson and Associates, Inc.
A-2 6

Corps of Engineers, 1977. Fish and Wildlife habitat changes resulting from the construction of a nine-foot navigation channel in the Illinois Waterway from Lagrange Lock and Dam upstream to Lockport Lock and Dam. Chicago District.
Corps of Engineers, 1979. Identify, document and evaluate the effect of waterway structure operational procedures on environmental quality-draft. Environmental and Water Quality Operational Studies Research Program.
Corps of Engineers, 1973. Analyzing the environmental impacts of water projects. Institute of Water Resources.
Corps of Engineers, 1976. Revised Draft Supplement Environmental Statement, Volume 1, Locks and Dam No. 26 (Replacement) Upper Mississippi River Basin Mississippi River-Alton, Illinois, Missouri and Illinois. St. Louis District.
California Department of Fish and Game, January, 1972, At the Crossroads, a Report on California's Endangered and Rare Fish and Wildlife, (Sacramento, California).
Cammen, L. M. 1976. Abundance and production of macroinvertebrates from natural and artificially established salt marshes in North Carolina. American Midi. Natur. 96:487-493.
Chrikova, T.V. and T. S. Gutman; 1972. Physiological Role of Branch Lenticles in Willow and Poplar Under Conditions of Root Anaerobiosis. Fiziol. Rast. 19:362-385
Clairain, E. J., Jr., R. A. Cole, R. J. Diaz, A. W. Ford, R. T. Huffman, L. J. Hunt, and B. R. Wells. 1978. Habitat development field investigations, Miller Sands marsh and upland habitat development site, Columbia River, Oregon; Summary report. Technical Report D-77-38. United States Army Engineer Waterways Experiment Station, CE, Vicksburg, Mississippi
COE, Analyzing the Environmental Impacts of Water Projects, United States Army Engineer Institute for Water Resources, NTIS, United States Department of Commerce, Virginia, 1973.
A-2 7

COE, 1974. Draft Environmental Statement - Operation and Maintenance of a nine-foot channel in the Illinois Waterway from the junction of the Calumet-Sag channel and the Chicago sanitary and ship canal to the Lagrange lock and dam. Chicago District.
COE, 1975. Environmental Assessment of the Mississippi River and Tributaries Project. Prepared by Rychman, Edgerley, Tomlinson and Associates, Inc.
COE, 1977. Fish and wildlife habitat changes resulting from the construction of a nine-foot navigation channel in the Illinois Waterway from Lagrange Lock and Dam upstream to Lockport Look and Dam. Chicago District
COE, 1979. Identify, document and evaluate the effect of waterway structure operational procedures on environmental quality-draft. Environmental and Water Quality Operational Studies Research Program.
COE, 1973. Analyzing the environmental impacts of water projects. Institute of Water Resources.
COE, 1976. Revised Draft Supplement Environmental Statement, Volume 1, Locks and Dam No. 26 (Replacement) Upper Mississippi River Basin Mississippi River-Alton, Illinois, Missouri and Illinois. St. Louis District.
Corps of Engineers, Allegheny River, Pennsylvania, Final Environmental Statement, Operation and Maintenance of the Navigation System, Pittsburgh District, October 1975.
Cole, R. A. 1978. Habitat development field investiga- tions, milk Sound marsh development site, Atlantic Intracoastal Waterway, Georgia; Summary report. Technical Report D-78-26. United States Army Engineer Waterways Experiment Station, CE, Vicksburg, Mississippi
Copeland, B. J. 1970. Estuarine classification and responses to disturbance. Trans. American Fish. Soc. 99:826-835.
Council on Environmental Quality, Our Nation's Wetlands, An Interagency Task Force Report, Government Printing Office, Washington, D.C., 1978.
A-28
Darnell, R. M. 1967. Organic detritus in relation to the estuarine ecosystem. Pages 376-381 in G. H. Lauff, ed. Estuaries, American Assoc. Adv. Sci. Pub. 83. Washington, D.C.
Dubinina, I. M., 1961. Metabolism of roots under various levels of aeration. Fiziol. Rast. 8(4):395-406.
Gambrell, R. P., V. R. Collard, C. N. Reddy and W. H. Patrick, Jr. 1977. Trace and toxic metal uptake by marsh plants as affected by Eh, pH, and salinity. Technical Report D-77-40. United States Army Engineer Waterways Experiment Station, CE, Vicksburg, Mississippi
Garcia-Novo, F., and R. M. M. Crawford; 1973. Soil aeration, nitrate reduction and flooding tolerance in higher plants. New Phytol. 72:1031-1039.
Goodwin, H. A. and E. P. Denson, March, 1971, "Status of Endangered Species Program", Transactions of the Thirty-Sixth North American Wildlife and Natural Resources Conference (Wildlife Management Institute, Wash., D.C.) pp. 331-343.
Grassle, J. F. and H. L. Sanders. 1973. Life histories and the role of disturbance. Deep-Sea Res. 20:643-659.
Green, W. E.; 1947. Effect of water impoundment on tree mortality and growth. Journal of Forestry 45:118-120.
Green, W. E.; 1960. Ecological changes on the Upper Mississippi River Wildlife and Fish Refuge since inception of the 9 foot channel. United States Department of the Interior, Fish and Wildlife Service.
Gupta, S. C. et al., "The Agricultural Value of Dredged Material," Technical Report D-73-36, Jul. 1978, United States Army Engineer Waterways Experiment Station, CE, Vicksburg, Mississippi.
Haines, E. B. 1977. The origins of detritus in Georgia salt marsh estuaries. Oikes. 29:254-260.
Hall, T. F., and G. E. Smith; 1955. Effects of flooding on woody plants, West Sandy Dewatering Project, Kentucky Reservoir. Journal of Forestry 53:281-285.
A-29

Halstead, B. W., Toxicity of Marine Organisms Caused by Pollutants", FAO Technical Conference on Marine Pollution, Rome, Italy, 1970.
Hirsch, N.D., I. H. DiSalvo, and R. K. Peddicord. 1978. Effects of dredging and disposal on aquatic organisms. Technical Report DS-78-5. United States Army Engineer Waterways Experiment Station, CE, Vicksburg, Mississippi
Hoeppel, R. E., T. E. Myers, and R. M. Engler. 1978. Physical and chemical characterization of dredged material influents and effluents in confined land disposal areas. Technical Report D-78-24. United States Army Engineer Waterways Experiment Station, CE, Vicksburg, Mississippi
Hosner, J. F., and S. G. Boyce; 1962. Tolerance to water saturated soil of various bottomland hardwoods. Forestry Science 8(2):180-186.
Hosner, J. F.; 1960. Relative tolerance to complete inundation of fourteen bottomland tree species. Forest Science 6(3): 246-251.
Hosner, J. F. 1958. The effects of complete inundation upon seedlings of six bottomland tree species. Ecology 39(2); 371-373.
Hosner, J. F., and L. S. Minckler; 1960. Hardwood reproduction in the river bottoms of southern Illinois. Forestry Science 6(1):67-77.
Huffman, R. T.; 1977. The relation of flood duration pattern to the community diversity of coastal plain forests within the Ouachita River basin of southern Arkansas. Ecology.
Johnson, F. L. and D. T. Bell; 1976a. Tree Growth and mortality in the streamside forest. Castanea 41(1): 34-41.
Johnson, F. L. and D. T. Bell; 1976 b. Plant biomass and net primary production along a flood-frequency gradient in the streamside forest. Castanea. 41(2): 156-165.
A-30

Kaplan, E. H., R. R. Welker, and M. G. Kraus. 1974. Some effects of dredging on populations of macrobenthic organisms. Fish. Bull. 72: 445-484.
Kennedy, H. E.; 1970. Growth of newly planted water tupelo seedlings after flooding and siltation. Forestry Science 16: 250-256.
Klein, W. M., R. H. Daley and J. Wedum; 1975. Environmental inventory and assessment of navigation pools 24, 25 and 26, Upper Mississippi and Lower Illinois Rivers: A vegetational study. Final report of the Missouri Botanical Garden (7-75-1) to the United States Army Engineer Waterways Experiment Station.
Landin, M. C. 1978. National perspective of colonial waterbirds nesting on dredged material island. In Proc. 43rd North American Wildlife and Natural Resources Conference, March 1978. Phoenix, Arizona.
Lunz, John D. Upland and Wetland Habitat Development with Dredged Material: Ecological Considerations, United States Waterways Experimental Station, Vicksburg, Mississippi, NTIS, 1978.
Lunz, J. D., T. Zeigler, R. T. Huffman, B. R. Wells, R. J. Diaz, E. J. Clairain, Jr., and L. J. Hunt. 1978. Habitat development field investigations, Windmill Point marsh development site, James River, Virginia; Summary report. Technical Report D-77-23. United States Army Engineer Waterways Experiment Station, CE, Vicksburg, Mississippi
MacArthur, R. 1960. On the relative abundance of species. American Natural. 94:25-36.
McCall, P.L. 1977. Community patterns and adaptive strategies of the infaunal benthos of Long Island Sound. J. Mar. Res. 35:221-266.
Miller, R. B.; 1923. First report on a forestry survey of Illinois. Illinois Nat. Hist. Survey Bull. 14:291-377.
Odum, Eugene P., Fundamentals of Ecology, W. B. Saunders Company, 3rd Edition, 1971.
A-3 1
Odum, E. P. 1969. The strategy of ecosystem develop-ment. Science. 164:262-270.
Odum, E. P. 1977. The emergence of ecology as a new integrative discipline. Science. 195:1289-1293.
Odum, E. P. and A. A. de la Cruz. 1967. Particulate organic detritus in a Georgia salt marsh-estuarine ecosystem. Pages 383-388 in G. H. Lauff, ed. Estuaries. American Assoc. Adv. Sci. Pub. 83. Washington, D.C.
Prellwitz, D.M., 1976. Effects of stream channelization on terrestrial wildlife and their habitats in the Buena Vista Marsh, Wisconsin. Prepared for United States Fish and Wildlife Service, FWS/OBS - 76/25.
Reimold, R. J., J. L. Gallagher, R. A. Linthurst, and W. J. Pfeiffer. 1975. Detritus production in coastal Georgia salt marshes. Pages 217-288 in L. E. Cronin, ed. Estuarine research. Academic Press New York.
Rhoads, D. C., P. L. McCall, and J. Yingst. In press. Disturbance and production on the estuarine seafloor. American Scientist.
Sanders, H. L. 1969. Benthic marine diversity and the stability time hypothesis. Pages 71-81 in Diversity and stability in ecological systems. BNL-50175, Brookhaven National Lab., Upton, New York
Smith, Robert Leo, Ecology and Field Biology, Harper and Row Publishers, New York, New York, 2nd Edition, 1974.
Solomon, R. C., et at.; 1975. Environmental inventory and assessment of navigation pools 24, 25, and 26, Upper Mississippi and Lower Illinois Rivers summary report. TRY-75-1, USAEWES.
Talbot, Lee M., 1966. "The World's Most Endangered Species", The Call of the Vanishing Wild, feature stories from the Christian Science Monitor (The Christian Science Publishing Society).
A-32
Terpening, V.A., L. J. Hunt, D. K. Evans, S.J. Bleiweiss and R.C. Zoanetti; 1974. A survey of the fauna and flora occurring in the Mississippi River floodplain between St. Louis, Missouri and Cairo, Illinois. Final report (Y-74-1) to the United States Army Engineer, Waterways Experiment Station.
United States Congress, House of Representatives, Sub-committee on Conservation and Natural Resources, Committee on Government Operations; 1971. Hearings on stream channelization. 92 Congress, 1st Session.
United States Department of Argiculture, "Restoring Surface-Mined Land," Miscellaneous Publication No. 1082, Jun 1973, Washington, D.C.
United States Environmental Protection Agency, "Erosion and Sediment Control, Surface Mining," EPA-625/3-76-006, October 1976, Washington D.C.
United States Environmental Protection Agency, "Processes, Procedures, and Methods to Control Pollution from Mining Activities," EPA-430/ 9-73-011, Oct 1973, Washington, D.C.
United States Fish and Wildlife Service, 1977. Impact of Water Level Changes on Woody Riparian and Wetland Commities, Vol. 1: Plant and Soil Responses to Flooding. Prepared for National Stream Alteration Team, Office of Biological Services, FWS, United States Department of Interior.
United States Senate, Select Committee on National Water Resources, 1960. Fish and Wildlife and Water Resources, Committee Print No. 18 (Washington, D.C.).
Virginia Institute of Marine Science. 1978. Habitat development field investigations, Windmill Point marsh development site, James River, Virginia; Appendix D: Environmental impacts of marsh development with dredged material: Botany, soils, aquatic biology, and wildlife. Technical Report D-77-23. United States Army Engineer Waterways Experiment Station, CE, Vicksburg, Mississippi
A-33
Walsh, M.R. and Malkasian, M.D., "Productive Land Use of Dredged Material Containment Areas: Planning and Implementation Considerations," Technical Report DS-78-20, December 1978, United States Army Engineer Waterways Experiment Station, CE, Vicksburg, Mississippi
Woodwell, G. M., "Toxic Substances and Ecological Cycles", Scientific American, v. 216, 1967, pp. 24-31.
Wurster, C., "DDT Reduces Photosynthesis by Marine Phytoplankton," Science, v. 159, 1968, pp. 1474-1475.
Yellenosky, G.; 1964. Tolerance of trees to deficiencies of soil aeration. Int. Shade Tree Con. Proc. 40:127-148
A-3 4

AIR QUALITY
Charemisinoff, P.N. and Young, R.A., Pollution Engineering Practice Handbook, Ann Harbor Science Publishers, Inc., Ann Arbor, Michigan, 1976.
Corps of Engineers, "Operation, Maintenance and Dredged Material Disposal of Green Bay Harbor, Wisconsin." Draft Environmental Impact Statement, United States Army Corps of Engineers, Chicago District, Chicago, Illinois, 1977.
Corps of Engineers "Operation and Maintenance at Sheboygan Harbor, Wisconsin." Draft Environmental Impact Statement, United States Army Corps of Engineers, Chicago District, Chicago, Illinois, 1979.
Corps of Engineers, "Confined Disposal Facilities, Dredging of the Federal Navigation Channels, Les Cheneaux Islands, Michigan." Draft Environmental Impact Statement, United States Army Corps of Engineers, Detroit District, Detroit, Michigan, 1977.
Corps of Engineers, "Confined Disposal Facilities for Bolles Harbor, Michigan." Final Environmental Impact Statement, United States Army Corps of Engineers, Detroit District, Detroit, Michigan, 1978.
Corps of Engineers, "Power Plant Discharge Structure, Delta Stabilization Dike, & On-land Taconite Tailings Disposal, Reserve Mining Company, Silver Bay, Minnesota." Final Environmental Impact Statement, United States Army Corps of Engineers, St. Paul District, St. Paul, Minnesota, 1977.
Corps of Engineers, "Ohio River Navigation Project, Operation and Maintenance." Draft Environmental Impact Statement, United States Army Corps of Engineers, Ohio River, Louisville, Huntington, Pittsburgh, Nashville District, 1978.
Corps of Engineers, "Report on Gulf Coast Deep Water Port Facilities, Texas, Louisiana, Mississippi, Alabama and Florida," Appendix F, Volume I, United States Army Corps of Engineers.
A-35
Corps of Engineers, "Report on Gulf Coast Deep Water Port Facilities, Texas, Louisiana, Mississippi, Alabama and Florida," Appendix F, Volume II, United States Army Corps of Engineers.
Corps of Engineers, "Report on Gulf Coast Deep Water Port Facilities, Texas, Louisiana, Mississippi, Alabama and Florida," Appendix F, Volume III, United States Army Corps of Engineers.
Corps of Engineers, "Gulf Intracoastal Waterway; Petit Anse, Tigre and Carlin Bayous; and Bayou Grosse Tete, Louisiana." Final Environmental Impact Statement, United States Army Corps of Engineers, New Orleans District, New Orleans, Louisiana, 1976.
Corps of Engineers, "Trinity River Project," Volume II, United States Army Corps of Engineers, Fort Worth District, Fort Worth, Texas.
Corps of Engineers, "Mississippi River Between the Ohio and Missouri Rivers Regulating Works." Final Environmental Impact Statement, United States Army Corps of Engineers, St. Louis District, St. Louis, Missouri, 1976.
Corps of Engineers, "Operation and Maintenance Work on Three Navigation Projects in the Lake Borgne Vicinity, Louisiana." Final Environmental Impact Statement, United States Army Corps of Engineers, New Orleans District, New Orleans, Louisiana, 1976.
Corps of Engineers, "McNary Project/Columbia River, Washington and Oregon." Final Environmental Impact Statement, United States Army Corps of Engineers, Walla Walla District, Walla Walla, Washington, 1976.
Corps of Engineers, "Umatilla - The Dalles." Final Environmental Impact Statement, United States Army Corps of Engineers, Portland District, Portland, Oregon, 1974.
Corps of Engineers, "Lower Snake River Fish and Wildlife Compensation." Final Environmental Impact Statement, United States Army Corps of Engineers, Walla Walla District, Walla Walla, Washington, 1976.
A-36
Corps of Engineers, "Maintenance Dredging/Existing Navigation Project/San Francisco Bay Region, California." Final Environmental Impact Statement, United States Army Corps of Engineers, San Francisco District, San Francisco, California, Volume I, 1975.
Corps of Engineers, "Oahu Waterborne Commerce/Proposed Barbers Point Harbor, Oahu, Hawaii." Final Environmental Impact Statement, United States Army Corps of Engineers, Honolulu District, Honolulu, Hawaii, 1976.
Corps of Engineers, "Honolulu Harbor." Final Environmental Impact Statement, United States Army Corps of Engineers, Honolulu District, Honolulu, Hawaii, 1976.
EPA, "Factors Affecting Coal Substitution for Ocher Fossil Fuels in Electric Power Production and Industrial Uses," Congressional Research Service, United States Government Printing Office, Washington, D.C. 1975.
EPA, "State Implementation Plan Emission Regulations for Sulfur Oxides: Fuel Combustion," 2nd Edition, United States E.P.A., Research Triangle Park, North Carolina, 1977.
EPA, "Attainment Status Designations," Federal Register, Volume 43, No. 43, (Title 40, Chapter 1, Subchapter C, Part 81, Section 107, Subpart C), United States Government Printing Office, Washington, D.C., 1978.
Staff of Research and Education Association, "Pollution Control Technology," Research and Education Association, New York, New York, 1974.
A- 37
SOCIOECONOMICS
Antle, Lloyd G., Is the McClellan-Kerr Arkansas River Navi-gation Project Completed? Unpublished paper.
Antle, Lloyd G., Recreation at the McClellan-Kerr Arkansas River Navigation System, Water Resources Bulletin, American Water Resources Association, October, 1979.
Ashmore, Harry S., This is Arkansas, The Center Magazine, November/December, 1976.
Badger, Daniel D., Dean F. Schreiner, and Ronald W. Presley. Analysis of Expenditures for Outdoor Recrea-tion at the McClellan-Kerr Arkansas River Navigation System, United States Army Engineer Institute for Water Resources, IWR Contract Report 77-4, 1977.
Tennessee-Tombigbee Waterway. Supplement to the Project Design Memorandum, Restudy of Project Costs and Benefits, Economic Reanalysis Summary, Mobile Dis-trict, Corps of Engineers, February, 1976.
United States Army Corps of Engineers, Civil Works Research-Resource Management System (RRMS), Recreation Research Management Branch, Office Chief of Engineers, 1976.
A-38
ENVIRONMENTAL IMPACTS OF DIFFERENT TRANSPORTATION MODES
Draft Development Document for Proposed Effluent Limita-tions Guidelines and New Source Performance Standards for the Railroad Segment of the Transportation Industry Point Source Category. United States Environmental Protection Agency. April 1974.
Environmental Impact Statement for Final Instate Rail Carrier Noise Emission Regulation: Source Standards. United States Environmental Protection Agency. December 1979.
Environmental Impact Statement. Zachary-Fort Lauderdale Pipeline Construction and Conversion Project. Federal Power Commission, Bureau of Natural Gas. April 1976.
Exhaust Emissions from Uncontrolled Vehicles and Related Equipment Using Internal Combustion Engines. Final Report Part I: Locomotive Diesel Engines and Marine Counter-parts. United States Environmental Protection Agency. October 1972.
Final Environmental Impact Statement. Eastern Powder River Coal. United States Department of Interior. March 28, 1979.
Hirst, Eric. Transportation Energy Conservation: Oppor-tunities and Policy Issues. Testimony Submitted to United States House of Representatives Subcommittee on Conserva-tion and Natural Resources. July, 1973.
Interindustry Task Force on Rail Transportation of Hazard-ous Materials. Systems Safety Analysis Subcommittee. Phase I Report. December 1978.
United States Department of Transportation. Summary of Liquid Pipeline Accidents Reported on DOT Form 7000-1. Various years.
United States Department of Transportation. United States Coast Guard. Polluting Incidents In and Around United States Waters. Various years.
A-39

United States Army Engineer Division, North Atlantic, November 1973. Final Environmental Impact Statement. River Crossing Permits for Buckeye Pipeline Co. Proposed Refined Petroleum Products Pipeline System Between Linden, New Jersey and Macurgie, Pennsylvania.
Yearbook of Railroad Facts. 1979 Edition, Association of American Railroads (AAR). .
A-40

RECOMMENDATIONS FOR FURTHER INVESTIGATIONS
Brannon, J.M. (1978) Evaluation of Dredged Material Pollution Potential. Technical Report DS-78-6 United States Army Engineer Waterways Experiment Station.
• Daley, Richard H., 1977. Biological Issues and Concerns
on the Mississippi River Mainstream From Cairo, Illinois to Saverton, Missouri. Prepared for the Upper Mississippi River Basin Commission. Missouri Botanical Garden Report.
ERT/Ecological Consultants, Inc., 1978. Evaluation of the Navigation Effects on the Biological Components of the Upper Mississippi River Aquatic Ecosystem. Preliminary Draft prepared for the Upper Mississippi River Basin Commission, Fort Snelling, Twin Cities, Minnesota.
GREAT I (1978a). A Pilot Study on Effects of Hydraulic Dredging and Disposal on Water Quality of the Upper Mississippi River. Water Quality Work Group, St. Paul, Minnesota.
GREAT I (1978b). A Study to Determine Effects of the First Barge Traffic of the Season on Lake Pepin Water Quality. Water Quality Work Group, St. Paul, Minnesota.
GREAT I (1979). Water Quality Work Group Report.
Hitchcock, H. (1977). Analytical Review of Research Reports on Social Impacts of Water Resources Develop-ment Projects. IWR Contract Report 77-3. Institute for Water Resources, Fort Belvoir, Virginia 22060.
A-41

DREDGING AND DREDGED MATERIAL DISPOSAL CONSTRAINTS
Arthur D. Little, Inc. (1974a). The National Dredging Study. Part II Future Requirements and Procedures, Chapter II: Environmental Regulations.
Arthur D. Little, Inc. (1974b). The National Dredging Study. Part II Future Requirements and Procedures, Appendix B: Dredging Requirements in Major Coastal Ports.
Corps of Engineers (1971a). Final Environmental Statement - Mississippi River - Between the Ohio and Missouri Regulating Works. United States Army Engineer District, St. Louis.
Corps of Engineers (1971b). Environmental Statement Tennessee Tombigbee Waterway Alabama and Mississippi Navigation. Mobile District.
Corps of Engineers (1974) Draft Environmental Statement, Operation and Maintenance of a Nine Foot Channel in the Illinois Waterway from the Junction of the Calumet-Sag Channel and the Chicago Sanitary and Ship Canal to the Lagrange Lock and Dam, Chicago District, September, 1974.
Corps of Engineers (1975a). Final Environmental Statement on the Operation and Maintenance of the Navigation System, Allegheny River, Pennsylvania (Mile 0 to Mile 72) Pittsburgh District. October, 1975.
Corps of Engineers (1957b). Final Environmental Impact Statement Kanawha River Navigation System. Fayette, Kanawha, Putnam and Mason Counties, West Virginia. Huntington District.
Corps of Engineers (1975c). Final Environmental Impact Statement Operation, Maintenance and Management of Water Resource Development Projects for Mile 0 through Mile 381 Cumberland River, Tennessee and Kentucky. Nashville District.
Corps of Engineers (1975d). First Supplemental Environmental Report Continuing Environmental Studies Tennessee-Tombigbee Waterway Volumes I, II, and VIII. Mobile District.
A-42
Corps of Engineers (1975e). Final Environmental Statement Harbor Maintenance Dredging in the State of Hawaii. Honolulu District.
Corps of Engineers (1976a). Revised Draft Supplement Environmental Statement Volume I, Lock and Dam No. 26 (Replacement, Upper Mississippi River Basin, United States Army Engineer District, St. Louis.
Corps of Engineers (1976b). Final Supplement to Final Environmental Statement, Mississippi River, Baton Rouge to the Gulf of Mexico. United States Army Engineer District, New Orleans. January 1976.
Corps of Engineers (1976c). Final Environmental Statement, Atlantic Intracoastal Waterway (Port Royal Sound, South Carolina to Cumberland Sound, Florida). Savannah District.
Corps of Engineers (1976d). Final Environmental Statement, Operation and Maintenance of Navigation Project, Savannah River below Augusta, including the New Savannah Bluff Lock and Dam, Georgia and South Carolina. Savannah District.
Corps of Engineers (1976e). Final Environmental Statement Proposed Barbers Point Harbor, Oahu, Hawaii. Honolulu District.
Corps of Engineers (1976f). Final Environmental Statement Honolulu Harbor. Honolulu District.
Corps of Engineers (1977). Second Supplemental Environmental Report Continuing Environmental Studies Tennessee-Tombigbee Waterway Volume I. Mobile District.
Corps of Engineers (1978a). Draft Environmental Impact Statement, Ohio River Navigation Project, Operation and Maintenance. Ohio River Division, December, 1978.
Corps of Engineers (1978b). Draft Environmental Statement on Ohio River, Pennsylvania to Kentucky (Mile 0 to Mile 438), Commercial Sand and Gravel Dredging Opera-tions. Pittsburgh District.
A -4 3
Corps of Engineers (1978c). Draft Environmental Statement on Allegheny River (Mile 0 to Mile 72), Commercial Sand and Gravel Dredging Operations. Pittsburgh District.
Corps of Engineers (1979). Mississippi Sound and Adjacent Areas Dredged Material Disposal Study (Stage 1) Recon-naissance Report with Appendices. Mobile District.
Goeggel, G. B. and E. Guinther (1978). Phase III Environmental Surveys of Deep Ocean Dredged Spoil Disposal Sites in Hawaii. United States Army Corps of Engineers. Honolulu District.
GREAT I (1979). Draft Final Report of Dredging Requirements Group. September 19, 1979. St. Paul District, United States Army Corps of Engineers.
GREAT I (1979b). Sediment and Erosion Work Group Draft Appendix May, 1979. St. Paul District, United States Army Corps of Engineers.
GREAT I (1979c). Draft, Material and Equipment Naval Work Group Appendix, April, 1979. St. Paul District, United States Army Corps of Engineers.
GREAT II (1978). Preliminary Feasibility Report. Rock Island District, United States Army Corps of Engineers.
GREAT III (1979). Great River Resource Management Study, Preliminary Reconnaissance Report, Mississippi River (Saverton, Missouri to Cairo, Illinois). United States Army Engineer District, St. Louis, June, 1979.
Neilsen, D.N., C.R. Fremling, R.N. Vose and R. McConville (1978) Phase I Study of the Weaver Belvidere Area, Upper Mississippi River. United States Fish and Wildlife Service, St. Paul, Minnesota. .
Office of Coastal Zone Management (1979a). Draft Environmental Impact Statement and Proposed Coastal Management Program for the Territory of Guam, Volume 1 and 2. NOAA, Department of Commerce, Washington, D.C. and Bureau of Planning, Government of Guam.
A-44

Office of Coastal Zone Management (1979b). Final Environmental Statement Proposed Coastal Zone Manage-ment Program for the Virgin Islands. NOAA, Department of Commerce, Washington, D.C.
Pequegnat, W.E. (1978). An Assessment of the Potential Impact of Dredged Material Disposal in the Open Ocean. Technical Report D-78-2. Corps of Engineers Waterways Experiment Station, Vicksburg, Mississippi.
United States Department of Commerce and Florida Department of Environmental Regulations (undated) Final Environmental Statement Apalachicola River and Bay Estuaries Sanctuary.
University of Michigan (1960). Resistance of Barge Tows. Department of Naval Architecture and Marine Engineering.
A-45
APPENDIX C
INTERVIEWS WITH COE DIVISION PERSONNEL
A-46
Name
Larry Daggett
Tom Pokrefke
James Foster
Jack Shows
David McGaw
Phil Roark
Peter Cook
Michael Smith
Roger Patton
Louis Cohen
J. E. Glover
N. R. Oswalt
E.B. Pickett
Jackson H. Ables, Jr.
Telephone
601/636-3111 X225
601/636-3111 X265
601/636-3111 X262
601/636-3111 X263
202/466-4000
202/466-4000
202/466-4000
703/836-6210
201/678-1960
201/678-1960
FTS 542-3338
FTS 542-3895
FTS 542-3368
FTS 542-2471
R. Andrew Blelloch Louis Berger
Brook Crossan Louis Berger
201/678-1960
201/678-1960
Meeting at Waterways Experiment Station (WES) on 9 July 1979
List of Attendees Waterway Experimental Station
Organization
WESHP3, Math Modeling Group
WESHR, Potamology Branch
WESHR, River Reg Branch
WESHR, Navigation Branch
Louis Berger
Louis Berger
Louis Berger
A.T. Kearney, Inc.
Louis Berger
Louis Berger
Waterways Division
WESHS, Spillways & Channel Branch
WESHI, (Hydr Eng Info Ctr, Sec 32 Prog)
WESHS, Locks & Conduits
A-4 7

Meeting at Waterways Experiment Station (WES) on 9 July 1979
List of Attendees Waterway Experimental Station
Name Organization Telephone
Anatoly Hochstein Louis Berger 201/678-1960
Edward Davie USA COE, IWR 202/325-7141
Walt Gallaher USAEWES/EL FTS 542-3549 X354
Tom Patin USAEWES/EL FTS 542-3444
Howard E. Olson USA IWR 202/325-0477
A-48

COE Division Interview - North Atlantic Division (NAD) on 17-18 July 1979
List of Attendees North Atlantic Division
NAME ORGANIZATION TELEPHONE
Louis Cohen Louis Berger & Assoc. 201/678-1960
Brook Crossan Louis Berger & Assoc. 201/678-1960
Roger Patton Louis Berger & Assoc. 201/678-1960
David McGaw Louis Berger & Assoc. 202/466-4000
Ivan Zabaloieff, Louis Berger & Assoc. 201/678-1960
Victor Churchward A.T. Kearney 312/782-2868
Leonard T. Crook L. Crook & Assoc. 313/761-8987
Howard E. Olson IWR/NWS 202/325-0477
Thomas R. Doron BERH/NWS 202/325-7191
Thomas E. Odle BERH/NWS 202/325-7193
Bruce A. Bergmann New York District 212/264-1060
Bob Will New York District 212/264-4662
Bob Schmidt Philadelphia District 215/597-8054
Wendell Waites Philadelphia District 215/597-9436
Roy E. Denmark, Jr. Philadelphia District 215/597-4833
George A. Sauls Philadelphia District 215/597-4810
Elliot E. Whitehurst Norfolk District 804/441-3616
Thomas N. Yancey Jr. Norfolk District 804/441-3775
Arthur Lee Baltimore District 301/962-2530
Steve Wilson Baltimore District 301/962-2530
A-49

COE Division Interview - North Atlantic Division (NAD) on 17-18 July 1979
List of Attendees North Atlantic Division
NAME ORGANIZATION TELEPHONE
Owen D. Belcher South Atlantic Division 404/221-4327
Tony Kaicher North Atlantic Division 212/264-7088
Lenny Ratushewitz North Atlantic Division 212/264-7088
Art Remling North Atlantic Division 212/264-7814
Bruce Beechley North Atlantic Division
John Sammit New York District 264-9020
A-50

Other Contacts
Mike Ludwig NOAA - NMFS Biological Laboratory Milford, Connecticut
Joe Hedek EPA 26 Federal Plaza New York, New York 10007
Paul Dyer NYS Department of Environmental Conservation Hudson River Fisheries Specialist
Dick Ugen US FWS Newton Corners, Massachusetts Endangenod Species Office
Bill Dovel Shortnose Sturgeon Experts
A- 51
COE Division Interview at Lower Mississippi Valley Division
Division (LMVD) on 10-11 July 1979
List of Attendees Lower Mississippi Valley Division
Bill Curtis Chief, Operations Branch, LMVD 636-1311
Rixie Hardy Chief, Navigation Branch, NOD 636-1311
Red Buchhold Chief, Navigation Branch, SLD 636-1311
Jackie Bourn Chief, Dredging Section, VXD 636-1311
George Flowers Licensed River Pilot
Jimmy Graham Chief, Channel Improvement, LMVD 636-1311
Jim Tuttle Chief, Potamology Research, LMVD 636-1311
Malcom Dove Hydrology and Hydraulics Br., LMVD
Henry Reed Technical Engineering Br., LMVD
Fred Bayley Chief, Planning Division, LMVD
Dusty Rhodes Plan Formulation Branch, LMVD
Anson Eickhorst Chief, Economics Section, SLD
Tom Holland Chief, Environmental Br., LMVD
Jessie McDonald Economics Branch, LMVD
636-1311
636-1311
636-1311
636-1311
636-1311
636-1311
636-1311
A- 52

TECHNICAL SESSION III
MULTI-PURPOSE & ENVIRONMENTAL MEETING WITH ENGINEERING DIVISION
NAME ASSOCIATION TELEPHONE NO.
David McGaw Louis Berger (202)466-4000
Brook Crossan Louis Berger (201)678-1960
Malcolm Dove LMVD (601)636-1311 Ext. 5916
James Tattle Pota. BR., LMVD (601)636-1311 Ext. 5911
Henry G. Reed Tech. Engr. BR: LMVD (601)636-1311 Ext. 5927
Edward H. Davies United States Army COE, IWR (202)325-7141
Max S. Lamb
Jimmie Graham
Phil Roark
Peter Cook
United States Army COE, (601)636-1311 LMUD Ext. 5905
United States Army COE, (601)636-1311 LMUD Ext. 5904
Louis Berger (202)466-4000
Louis Berger (202)466-4000
A-53

COE Division Interview at South West Division (SWD) on 19-20 July 1979
List of Attendees Southwest Division
NAME
Kissell, Larry
Davies, Edward H.
Roark, Phil
Patton, Roger
Bax, Larry
James, Bill
Mallette, Frank
ADDRESS
1200 Main Street Dallas, Texas 75202
Kingman Bldg. Ft. Belvoir, Virginia 22060
1730 Rhode Island Ave. NW Washington, D.C. 20036
100 Halstead Street E. Orange, New Jersey
1200 Main Street Dallas, Texas 75202
1200 Main Street Dallas, Texas 75202
819 Taylor Street Ft. Worth, Texas 76102
ORGANIZATION/ PHONE NO.
Corps of Engineers, SWDPL-E 214/767-2317 (FTS 729)
Corps of Engineers, IWR 202/325-7141
Louis Berger & Assoc.
Louis Berger & Assoc. 201/678-1960
Corps of Engineers, SWDPL-214/767-2320 (FTS 729)
Corps of Engineers, SWDED-214/767-2358 (FTS 729)
Corps of Engineers, FWD
COE Division Interview at South West Division (SWD) on 19-20 July 1979
NAME
Sartor, Jerrell
Hutchinson, Al
Walker, John
Revis, Paul N
McNeil, Jerry
Hobson, Ivan L.
Bell, Richard A.
Jones, Derwood
List of Attendees Southwest Division
ADDRESS
1200 Main Street Dallas, Texas 75202
1200 Main Street Dallas, Texas 75202
Box 61 Tulsa, Oklahoma 74121
P.O. Box 867 Little Rock, Arizona 72022
1200 Main Street Dallas, Texas 75202
1200 Main Street Dallas, Texas 75202
1200 Main Street Dallas, Texas 75202
1200 Main Street Dallas, Texas 75202
ORGANIZATION/ PHONE NO.
Corps of Engineers, SWPDL
Corps of Engineers SWDCO
Corps of Engineers, TD
Corps of Engineers, LRD 501/378-5730 (FTS 540)
Corps of Engineers, SWDCO 214/767-2439 (FTS 729)
Corps of Engineers, SWDPL 214/767-2315 (FTS 729)
Corps of Engineers, SWDPL 214/767-2322 (FTS 729)
Corps of Engineers, SWDPL-214/767-2303 (FTS 729)

1200 Main Street Dallas, Texas 75202
Galveston, Texas
Galveston, Texas
COE Division Interview at South West Division (SWD) on 19-20 July 1979
List of Attendees Southwest Division
NAME
Hanchey, Randy
Churchwood, Victor
Schimdgall, Tasso
New, Noah
Brunt, Dewey
Lewandoski, Charles
Banks, Larry
ORGANIZATION/ PHONE NO.
Kingman Bldg. Corps of Engineers, IWR Ft. Belvoir, Virginia 22060 202/325-71
100 S. Wacker Chicago, Illinois 60606
Corps of Engineers, SWDED-214/767-2359 (FTS 729)
Corps of Engineers, SWGED-527-6314
Corps of Engineers, SWGED-527-6314
P.O. Box 867 Corps of Engineers, LRD Little Rock, Arizona 72022 501/378-5753 (FTS 540)
Archologist Dallas
ADDRESS
A. T. Kearny 312/782-2868

List of Attendees Ohio River Division
COE Division Interview at Ohio River Division (ORD) on 2-3 August 1979
NAME ORGANIZATION TELEPHONE
Alan Chandler ORDPD-N 513/684-3806
David McGraw Louis Berger & Assoc. 202/466-4000
Anatoly Hochstein Louis Berger & Assoc. 201/678-1960
Roger Patton Louis Berger & Assoc. 201/678-1960
Victor Churchward A.T. Kearney, Inc. 312/782-2868
Frank B. Mallette BERH/NWS 202/325-7197
Thomas R. Doran BERH/NWS 202/325-7191
Jimmy Bates ORNED 615/251-5738
William Andrew ORNED-P 615/251-7191
Thomas Scott ORPED-P 412/644-6935
Jeremiah Parsons ORDPD-R FTS/684-3077
Herb Wise ORPED-PR FTS/722-6935
Bob Hann ORDPD-N 513/684-3806
Hildon M. Davis ORNOP-W 615/251-5607
Roger L. Hayes ORDCO-W 513/684-3058
James A. Wheeler ORHOP-L FTS/924-5705
Richard A. Schwab ORLPD-F FTS/352-5796
David A. Beatty ORLED-H 502/582-5648
Phil Hasselwander ORLED-D 502/582-6279
John Morton ORLOP-W 502/582-5613
A- 57
List of Attendees Ohio River Division
COE Division Interview at Ohio River Division (ORD) on 2-3 August 1979
NAME ORGANIZATION TELEPHONE
Gene P. Allsmiller ORLOP-W 502/582-5613
Steve Vierling ORLPD-F 502/582-5796
Dave Weelly ORHPD-N 304/529-5635
Ron Keeney OHRPD-N 304/529-5766
Jim Eveman OHRPD-N 304/529-5766
Allan Elberfeld ORHPD-N 304/529-5635
John H. Parke, Jr. ORDPD-F 513/684-3045
Al Rogalla ORPOP-W 722-6864
A-58
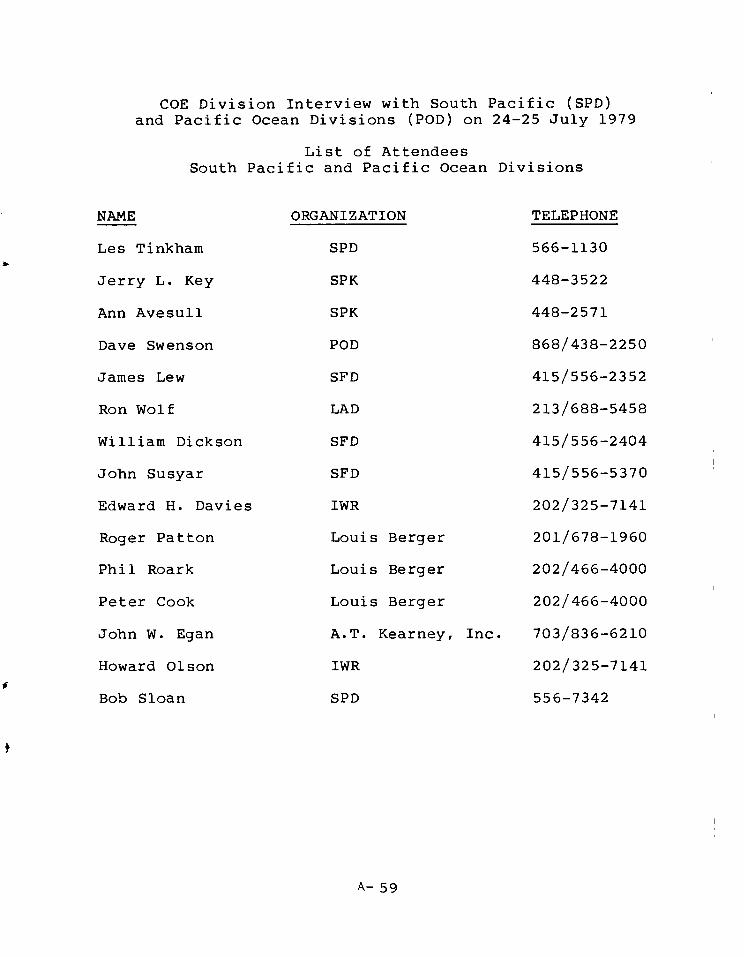
COE Division Interview with South Pacific (SPD) and Pacific Ocean Divisions (POD) on 24-25 July 1979
List of Attendees South Pacific and Pacific Ocean Divisions
NAME ORGANIZATION TELEPHONE
Les Tinkham SPD 566-1130
Jerry L. Key SPK 448-3522
Ann Avesull SPK 448-2571
Dave Swenson POD 868/438-2250
James Lew SFD 415/556-2352
Ron Wolf LAD 213/688-5458
William Dickson SFD 415/556-2404
John Susyar SFD 415/556-5370
Edward H. Davies IWR 202/325-7141
Roger Patton Louis Berger 201/678-1960
Phil Roark Louis Berger 202/466-4000
Peter Cook Louis Berger 202/466-4000
John W. Egan A.T. Kearney, Inc. 703/836-6210
Howard Olson IWR 202/325-7141
Bob Sloan SPD 556-7342
A- 59
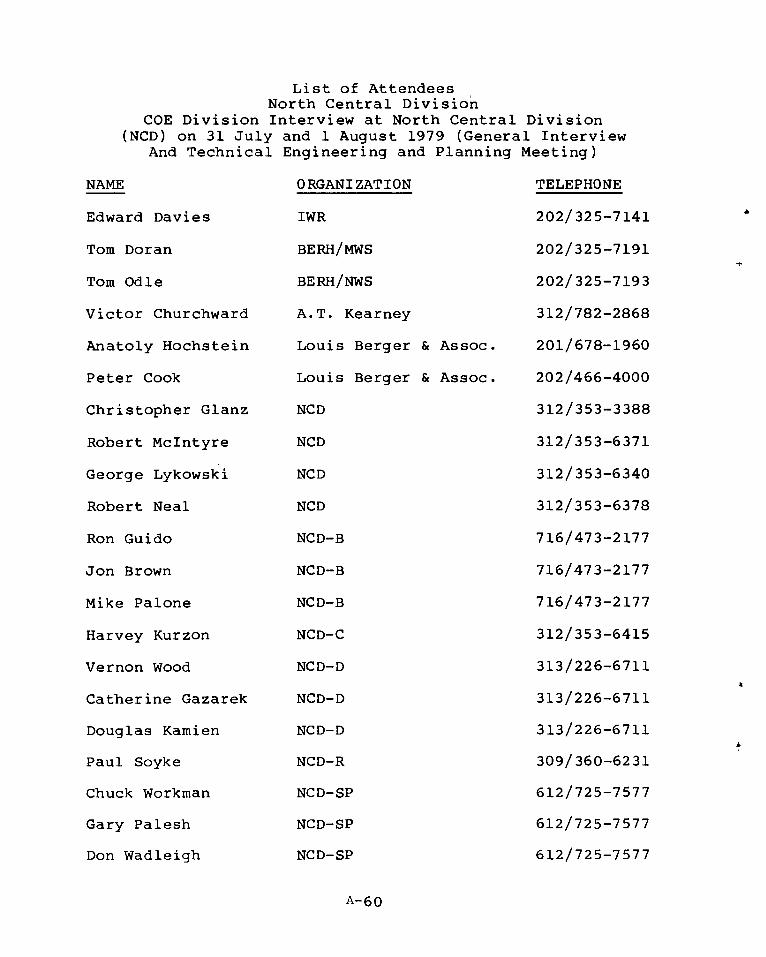
List of Attendees , North Central Division
COE Division Interview at North Central Division (NCD) on 31 July and 1 August 1979 (General Interview
And Technical Engineering and Planning Meeting)
NAME ORGANIZATION TELEPHONE
Edward Davies IWR 202/325-7141
Tom Doran BERH/MWS 202/325-7191
Tom Odle BERH/NWS 202/325-7193
Victor Churchward A.T. Kearney 312/782-2868
Anatoly Hochstein Louis Berger & Assoc. 201/678-1960
Peter Cook Louis Berger & Assoc. 202/466-4000
Christopher Glanz NCD 312/353-3388
Robert McIntyre NCD 312/353-6371
George Lykowski NCD 312/353-6340
Robert Neal NCD 312/353-6378
Ron Guido NCD-B 716/473-2177
Jon Brown NCD-B 716/473-2177
Mike Palone NCD-B 716/473-2177
Harvey Kurzon NCD-C 312/353-6415
Vernon Wood NCD-D 313/226-6711
Catherine Gazarek NCD-D 313/226-6711
Douglas Kamien NCD-D 313/226-6711
Paul Soyke NCD-R 309/360-6231
Chuck Workman NCD-SP 612/725-7577
Gary Palesh NCD-SP 612/725-7577
Don Wadleigh NCD-SP 612/725-7577
A-60
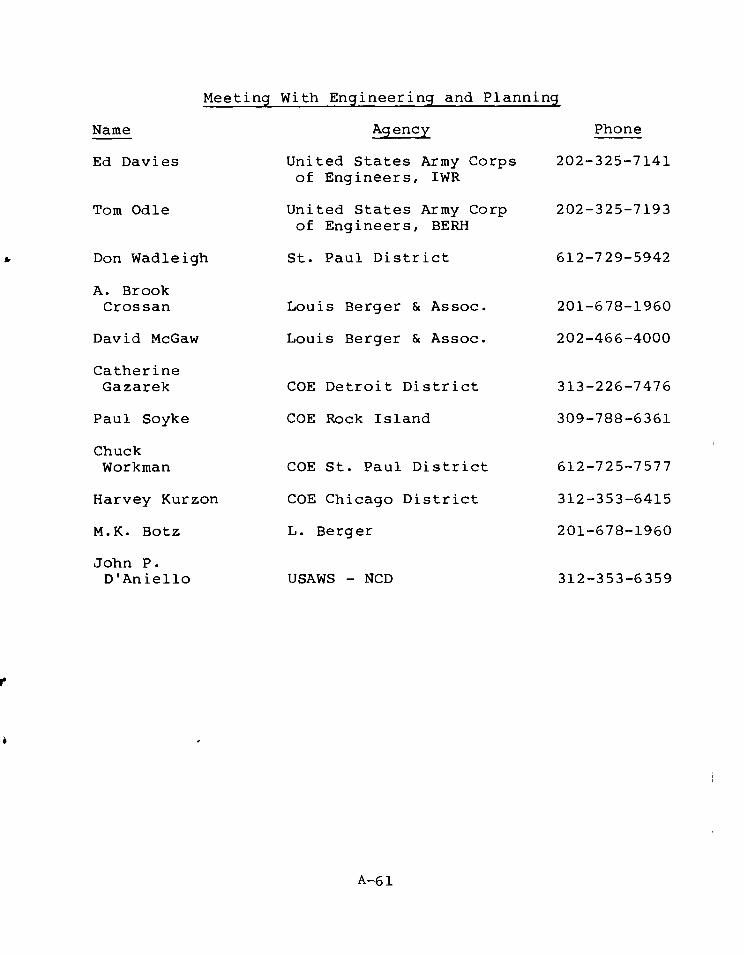
Meeting With Engineering and Planning
Name Agency Phone
Ed Davies United States Army Corps 202-325-7141 of Engineers, IWR
Tom Odle United States Army Corp 202-325-7193 of Engineers, BERH
Don Wadleigh St. Paul District 612-729-5942
A. Brook Crossan Louis Berger & Assoc. 201-678-1960
David McGaw Louis Berger & Assoc. 202-466-4000
Catherine Gazarek COE Detroit District 313-226-7476
Paul Soyke COE Rock Island 309-788-6361
Chuck Workman COE St. Paul District 612-725-7577
Harvey Kurzon COE Chicago District 312-353-6415
M.K. Botz L. Berger 201-678-1960
John P. D'Aniello USAWS - NCD 312-353-6359
A-6 1

List of Attendees North Pacific Division
COE Division Interview at North Pacific Division (NPD) on 26-27 July 1979
ATTENDEES ORGANIZATION TELEPHONE
Steve Montfort NPDPL-EC 503/221-3830
Howard E. Olson IWR/NWS 202/325-0477
Frank B. Mallette BERH/NWS 202/325-7179
Gail J. Gronewald NPDPL-PL 503/221-3822
John G. Oliver NPDEN-TE 503/221-3859
Bob Hopman NPDOP-NP 503/221-3778
Charles D. Galloway NPPND-WM 503/221-6987
Arthur R. Gerlach NPDPL-ER 503/221-3832
Gordon Hoare NPDPL-PF 503/221-3825
Sam Murray NPDPL-EC 503/221-3831
Ken Boire NPPL-5 503/221-6093
Dan Winslow NPPL-5 503/221-6094
Roger Patton Louis Berger 201/678-1960
John W. Egan A.T. Kearney, Inc. 703/836-6210
M. K. Botz Louis Berger 202/466-4000
Phil Roark Louis Berger 202/466-4000
M. J. Griffith NPSEN-NC FTS 399-3653
Pete Patterson
A-62
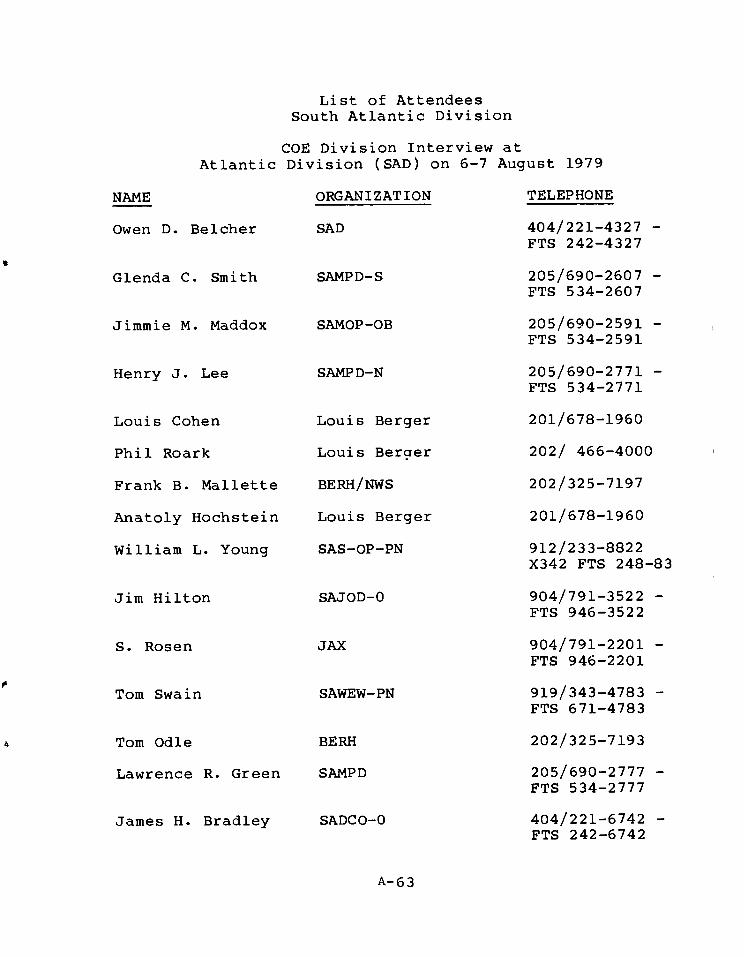
List of Attendees South Atlantic Division
COE Division Interview at Atlantic Division (SAD) on 6-7 August 1979
ORGANIZATION TELEPHONE NAME
Owen D. Belcher SAD 404/221-4327 - FTS 242-4327
Glenda C. Smith SAMPD-S 205/690-2607 - FTS 534-2607
Jimmie M. Maddox SAMOP-OB 205/690-2591 - FTS 534-2591
Henry J. Lee SAMPD-N 205/690-2771 - FTS 534-2771
Louis Cohen Louis Berger 201/678-1960
Phil Roark Louis Berger 202/ 466-4000
Frank B. Mallette BERH/NWS 202/325-7197
Anatoly Hochstein Louis Berger 201/678-1960
William L. Young SAS-OP-PN 912/233-8822 X342 FTS 248-83
Jim Hilton SAJOD-0 904/791-3522 - FTS 946-3522
S. Rosen JAX 904/791-2201 - FTS 946-2201
Tom Swain SAWEW-PN 919/343-4783 - FTS 671-4783
Tom Odle BERH 202/325-7193
Lawrence R. Green SAMPD 205/690-2777 - FTS 534-2777
James H. Bradley SADC0-0 404/221-6742 - FTS 242-6742
A-63

SAMPD-S 205/690-2607 FTS 534-2607
Henry K. Jackson, Sr.
List of Attendees South Atlantic Division
COE Division Interview at Atlantic Division (SAD) on 6-7 August 1979
NAME ORGANIZATION TELEPHONE
Roger H. Gerth SAMOP-ON 205/690-2591 - FTS 534-2591
Bill Hearrean SAMPD-S
Willis E. Ruland SAMDL
Larry Casbeer SACEN-PS
205/690-2607 FTS 534-2607
205/690-2619 FTS 534-2619
803/724-4374 FTS 677-4374
A,- 64
List of Participants MRD - NWS Meeting, August 9, 1970
COE Division Interview with Missouri River Division (MRD) on 8 August 1979
NAME TELEPHONE NO. ORGANIZATION
Ron Roberts (402)221-7275 MRD
David Billman (402)221-7279 MRD
Chuck Abraham (402)221-7354 MRD
Roger Patton (201)678-1960 Louis Berger & As so.
Andrew Blelloch (201)678-1960 Louis Berger & As so.
Duane Sveum (402)221-7355 MRD
Bob Pletka (402)221-7289 MRD
Harve Wiethop (402)221-7308 MRD
Clarence Bueltel (402)2211 7325 MRD
David Gjesdahl (402)221-7277 MRb
Bill Drake (402)221-7276 MRD
Gus Karabatsos (402)221-7265 MRD
Frank Mallette (202)325-7197 BERH
Timothy Regan (703)836-6210 A.T. Kearney
Howard Christian (402)221-4020 MR0
Tom Burke (816)374-3341 MRK
Howard Olsen (202)325-0477 IWR
Edward Davies (202)325-7141 IWR
A- 65
List of Attendees New England Division
COE Division Interview at New England Division (NED) on 14 August 1979
NAME ORGANIZATION TELEPHONE
Tom Odle BERH-EVA 202/325-7193
Edward H. Davies IWR 202/325-7141
Robert Adler NED-IAB 617/894-2400
Gib Chase NED-IAB 617/894-2400
Mark Habel NED-WCB 617/894-2400 X660
Jack Barry NED-IAB, ESAS 617/894-2400 X537
Dick Gochlert NED PL-C 617/894-2400 X556
Carter Laing NEDOD-N 617/894-2400 X351
Dick Reardon NED-ENG. DIV 617/894-2400
1 X311
Ken Jackson NED Regulatory DIV. 617/894-2400 X372
Roger Patton Louis Berger & Assoc. 201/678-1960
David McGaw Louis Berger & Assoc. 202/466-4000
Tim Regan A.T. Kearny 703/836-6210
Steve Andon NED-CDB 617/894-2400 X55
Fran Donovan NEDOP 617/894-2400
Julie Handroff NEDOP 617/894-2400
A.- 66

APPENDIX D
DREDGING AND DREDGED MATERIAL DISPOSAL CONSTRAINTS
A-67
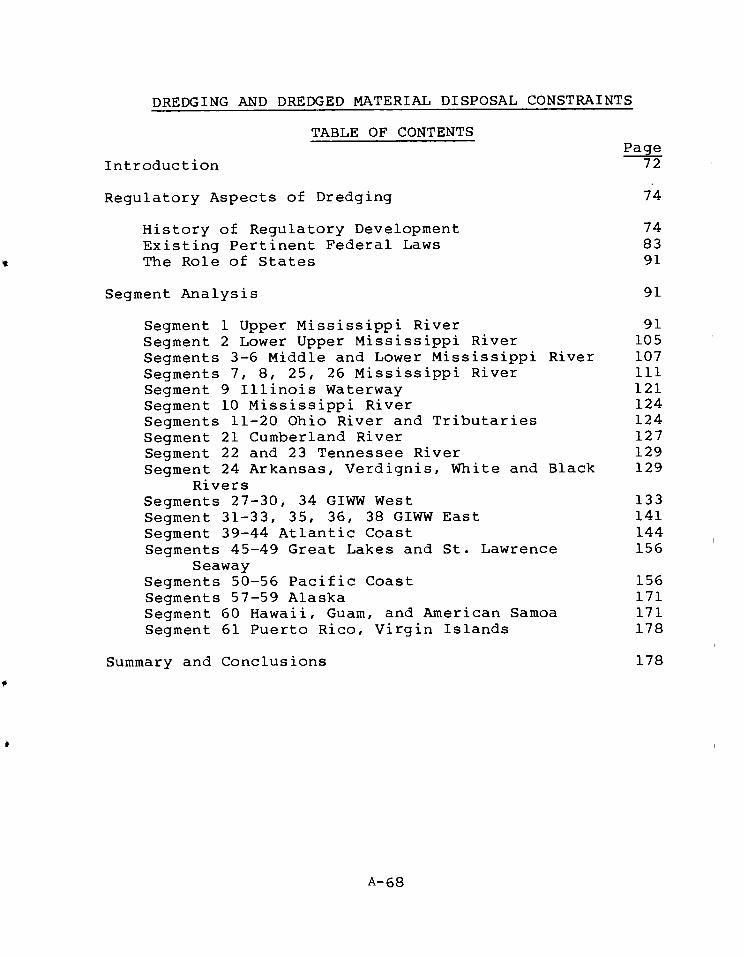
DREDGING AND DREDGED MATERIAL DISPOSAL CONSTRAINTS
TABLE OF CONTENTS
Introduction Page
72
Regulatory Aspects of Dredging 74
History of Regulatory Development 74 Existing Pertinent Federal Laws 83 The Role of States 91
Segment Analysis 91
Segment 1 Upper Mississippi River 91 Segment 2 Lower Upper Mississippi River 105 Segments 3-6 Middle and Lower Mississippi River 107 Segments 7, 8, 25, 26 Mississippi River 111 Segment 9 Illinois Waterway 121 Segment 10 Mississippi River 124 Segments 11-20 Ohio River and Tributaries 124 Segment 21 Cumberland River 127 Segment 22 and 23 Tennessee River 129 Segment 24 Arkansas, Verdignis, White and Black 129
Rivers Segments 27-30, 34 GIWW West 133 Segment 31-33, 35, 36, 38 GIWW East 141 Segment 39-44 Atlantic Coast 144 Segments 45-49 Great Lakes and St. Lawrence 156
Seaway Segments 50-56 Pacific Coast 156 Segments 57-59 Alaska 171 Segment 60 Hawaii, Guam, and American Samoa 171 Segment 61 Puerto Rico, Virgin Islands 178
Summary and Conclusions 178
A- 68
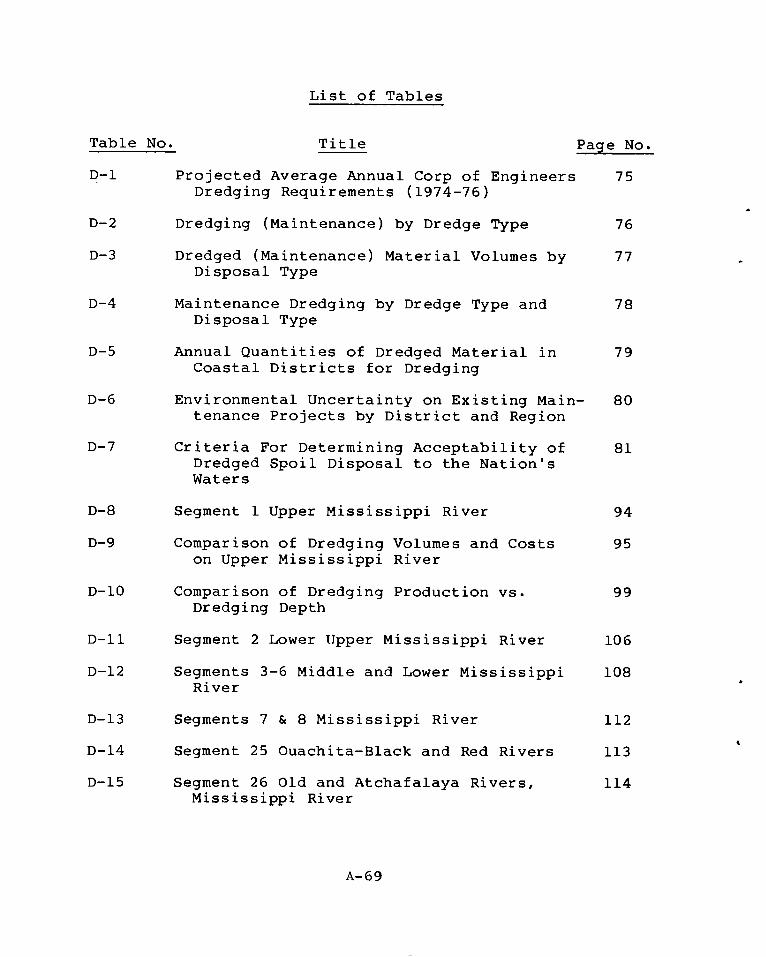
Table No.
D-1
List of Tables
Title Page No.
Projected Average Annual Corp of Engineers 75 Dredging Requirements (1974-76)
D-2 Dredging (Maintenance) by Dredge Type 76
D-3 Dredged (Maintenance) Material Volumes by 77 Disposal Type
D-4 Maintenance Dredging by Dredge Type and 78 Disposal Type
D-5 Annual Quantities of Dredged Material in 79 Coastal Districts for Dredging
D-6 Environmental Uncertainty on Existing Main- 80 tenance Projects by District and Region
D-7 Criteria For Determining Acceptability of 81 Dredged Spoil Disposal to the Nation's Waters
D-8 Segment 1 Upper Mississippi River 94
D-9 Comparison of Dredging Volumes and Costs 95 on Upper Mississippi River
D-10 Comparison of Dredging Production vs. 99 Dredging Depth
D-11 Segment 2 Lower Upper Mississippi River 106
D-12 Segments 3-6 Middle and Lower Mississippi 108 River
D-13 Segments 7 & 8 Mississippi River 112
D-14 Segment 25 Ouachita-Black and Red Rivers 113
D-15 Segment 26 Old and Atchafalaya Rivers, 114 Mississippi River
A-69
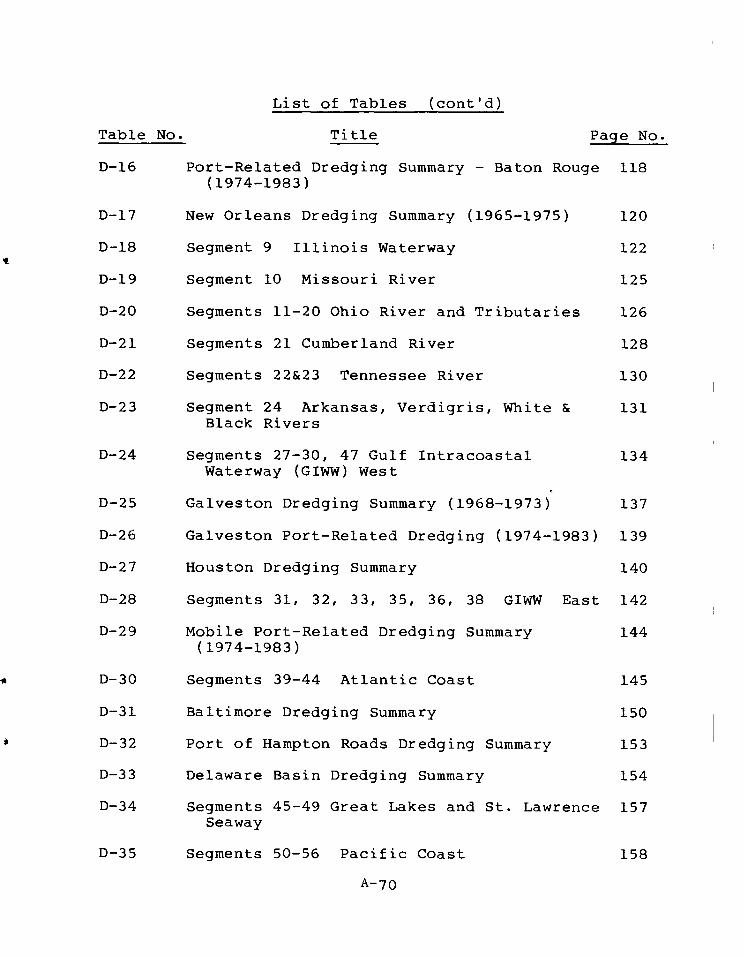
Table No.
List of Tables (cont'd)
Title Page No.
D-16 Port-Related Dredging Summary - Baton Rouge 118 (1974-1983)
D-17 New Orleans Dredging Summary (1965-1975) 120
D-18 Segment 9 Illinois Waterway 122
D-19 Segment 10 Missouri River 125
D-20 Segments 11-20 Ohio River and Tributaries 126
D-21 Segments 21 Cumberland River 128
D-22 Segments 22&23 Tennessee River 130
D-23 Segment 24 Arkansas, Verdigris, White & 131 Black Rivers
D-24 Segments 27-30, 47 Gulf Intracoastal Waterway (GIWW) West
D-25 Galveston Dredging Summary (1968-1973) 137
D-26 Galveston Port-Related Dredging (1974-1983) 139
D-27 Houston Dredging Summary 140
D-28 Segments 31, 32, 33, 35, 36, 38 GIWW East 142
D-29 Mobile Port-Related Dredging Summary 144 (1974-1983)
D-30 Segments 39-44 Atlantic Coast 145
D-31 Baltimore Dredging Summary 150
D-32 Port of Hampton Roads Dredging Summary 153
D-33 Delaware Basin Dredging Summary 154
D-34 Segments 45-49 Great Lakes and St. Lawrence 157 Seaway
D-35 Segments 50-56 Pacific Coast 158
A-70
134
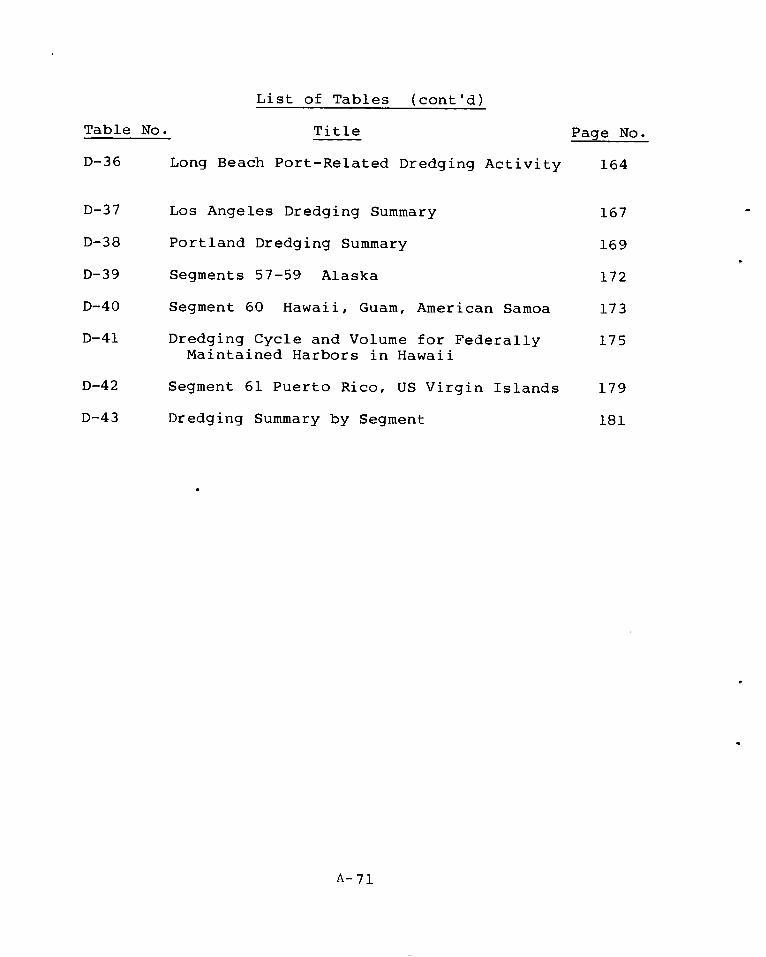
List of Tables (cont'd)
Table No. Title Page No.
D-36 Long Beach Port-Related Dredging Activity 164
D-37 Los Angeles Dredging Summary 167
D-38 Portland Dredging Summary 169
D-39 Segments 57-59 Alaska 172
D-40 Segment 60 Hawaii, Guam, American Samoa 173
D-41 Dredging Cycle and Volume for Federally 175 Maintained Harbors in Hawaii
D-42 Segment 61 Puerto Rico, US Virgin Islands 179
D-43 Dredging Summary by Segment 181
A-71

APPENDIX D
DREDGING AND DREDGED MATERIAL DISPOSAL CONSTRAINTS
INTRODUCTION
Dredging and dredged material disposal are two environ-mental issues that are important on almost every waterway segment. As such, they have been singled out for segment-specific discussion and analysis in this appendicized study. The generic discussions of the environmental impacts associated with dredging and dredged material disposal have been addressed in previous sections, namely: Water Quality and Aquatic Habitat Impacts and Terrestrial Habitat Impacts.
Dredging volumes are shown by district in Table D-1. The amounts range from 6,000 cubic yards per year in the Omaha District to over 145,000,000 in the New Orleans District. Nearly 70% of the dredging is maintenanance dredging, with only 30% of the dredging being new work. In 21 of the 35 districts more than 85% of the dredging is maintenance. Nearly 80% of the new work dreding took place in 4 districts (New Orleans, Jacksonville, Galveston, and Mobile).
Table D-2, compiled from the NWS Inventory, summarizes volumes and costs of maintenance dreding by dredge type. The two most common dredges, curtterhead and hopper, account for nearly 75% of the maintenance dredging. These two dredges plus the clamshell are used on nearly 85% of the projects. The operating characteristics and environmental impacts associated with the operation of these three types of dredges were addressed in some detail in the previous section, Water Quality and Aquatic Habitat Impacts.
Table D-3, also compiled from the NWS Inventory, summarizes the volumes and costs of maintenance dredging by disposal type. The most commonly used is open water disposal, which accounts for one-third of the material disposed and is the disposal type on 37% of the projects. Agitation dredging is the least expensive and beach nourishment the most expensive.
A- 72
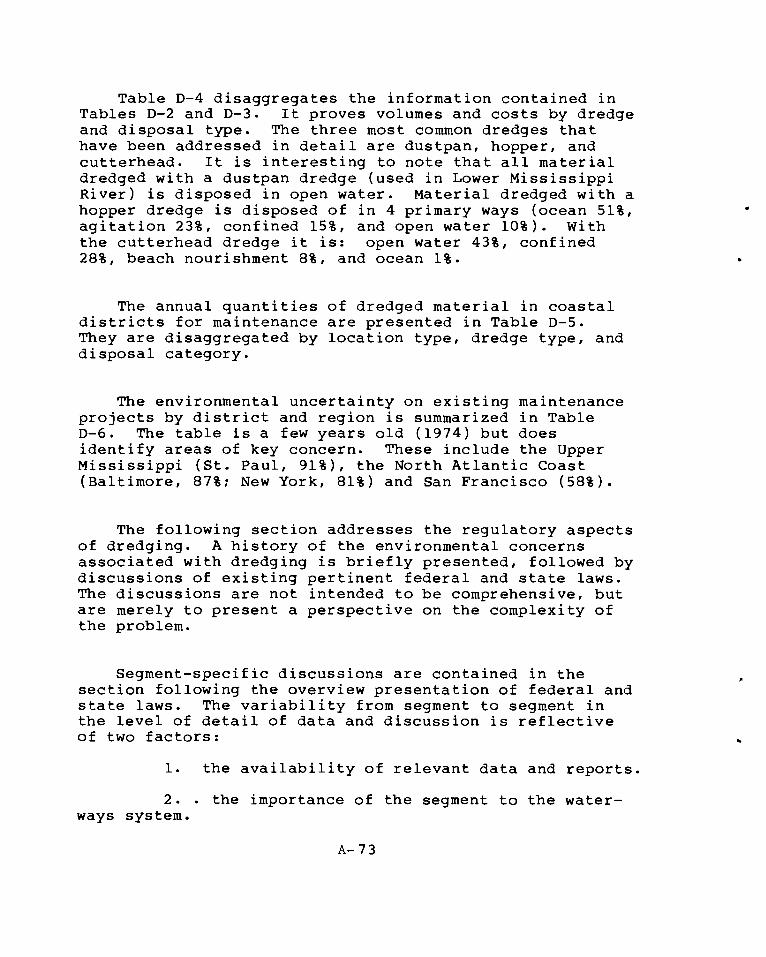
Table D-4 disaggregates the information contained in Tables D-2 and D-3. It proves volumes and costs by dredge and disposal type. The three most common dredges that have been addressed in detail are dustpan, hopper, and cutterhead. It is interesting to note that all material dredged with a dustpan dredge (used in Lower Mississippi River) is disposed in open water. Material dredged with a hopper dredge is disposed of in 4 primary ways (ocean 51%, agitation 23%, confined 15%, and open water 10%). With the cutterhead dredge it is: open water 43%, confined 28%, beach nourishment 8%, and ocean 1%.
The annual quantities of dredged material in coastal districts for maintenance are presented in Table D-5. They are disaggregated by location type, dredge type, and disposal category.
The environmental uncertainty on existing maintenance projects by district and region is summarized in Table D-6. The table is a few years old (1974) but does identify areas of key concern. These include the Upper Mississippi (St. Paul, 91%), the North Atlantic Coast (Baltimore, 87%; New York, 81%) and San Francisco (58%).
The following section addresses the regulatory aspects of dredging. A history of the environmental concerns associated with dredging is briefly presented, followed by discussions of existing pertinent federal and state laws. The discussions are not intended to be comprehensive, but are merely to present a perspective on the complexity of the problem.
Segment-specific discussions are contained in the section following the overview presentation of federal and state laws. The variability from segment to segment in the level of detail of data and discussion is reflective of two factors:
1. the availability of relevant data and reports.
2. . the importance of the segment to the water-ways system.
A-73

Information from the National Dredging Study (ADL 1974 a & b) concerning dredging in key ports is also included.
REGULATORY ASPECTS OF DREDGING
(a) History of Regulatory Development (ADL, 1974a)
In the late 1960's, it was discovered that the dredge spoil being dumped in open water in the Great Lakes con-tained high levels of organics and heavy metals. At that time, the environmental movement was gaining momentum, and the news caused a national outcry (supported in scientific circles) against dredging. The Environmental Protection Agency (admittedly) hastily issued the so-called "Jensen Memorandum" suggesting one possible approach to determin-ing the pollution content of dredged material, based on data from the Great Lakes. This memorandum was not intended to be an EPA regulation. However, in the absence of anything else, it was adopted by the EPA and by many state and local agencies.
Essentially, the Jensen Memorandum suggested a chem-ical and biological definition (see Table D-7) in terms of parts per million of certain constituents of polluted dredged material to be determined by the chemical analysis of the sediments. It did not consider the natural occur-rence of "pollutants" that came off the dredged material when it was dumped, and thus entered the water column, or the quality and biology of the receiving water. Nor did it consider the differences between fresh and salt water, or the estuarine environment versus deep ocean waters.
The criteria outlined in the Jensen Memorandum became known as the Jensen, or Great Lakes, Criteria and environ-mental regulatory agencies began subjecting samples of dredge material to the stringent criteria. In 1972 the Carps of Engineers Waterways Experiment Station estimated that 31% of average annual volume in COE maintenance projects was polluted according to the Great Lakes Criteria. Regulations were formulated which restricted the dumping of any material in open water that exceeded the Great Lakes Criteria. The theory behind such moves was that the pollutant constituents in the material were
A-74

Table D-1
Projected Average Annual Corps of Engineers
Dredging Requirements (1974-76)*
TOTAL MAINTENANCE NEW WORK M/NW (Cu Yds.) E's
DISTRICT
Alaska 458,000 192,000 - 266,000 42/58 Los Angeles 3,298,000 1,880,000 1,418,000 57/43 Portland 16,433,000 15,283,000 1,150,000 93/07 Sacramento 3,035,000 2,155,000 880,000 71/29 San Francisco 10,063,000 7,346,000 2,717,000 73/27 Seattle 3,786,000 3,483,000 303,000 92/08 Pacific Ocean 438,000 0 438,000 0/100
Jacksonville (G) 12,807,000 3,586,000 9,221,000 28/72 Galveston 70,364,000 53,477,000 16,887,000 76/24 Mobile 35,602,000 25,277,000 10,325,000 71/29 New Orleans 145,610,000 84,454,000 61,156,000 58/42
Huntington 716,000 630,000 86,000 88/12 Kansas City 2,108,000 1,813,000 295,000 86/14 Little Rock 2,570,000 2,570,000 0 100/0 Louisville 2,571,000 2,210,000 361,000 86/14 Memphis 29,311,000 29,018,000 293,000 99/1 Nashville 990,000 396,000 594,000 40/60 Omaha 6,000 6,000 0 100/0 Pittsburgh 134,000 125,000 9,000 93/07 Rock Island 1,250,000 1,250,000 0 100/0 St. Louis 7,862,000 7,862,000 0 100/0 St. Paul 2,280,000 2,189,000 91,000 96/04 Tulsa 1,000,000 1,000,000 0 100/0 Vicksburg 14,830,000 10,974,000 3,856,000 74/26
Buffalo 3,932,000 3,617,000 315,000 92/08 Chicago 1,893,000 1,723,000 170,000 91/09 Detroit 3,217,000 3,217,000 0 100/0
Jacksonville (E) 15,298,000 3,519,000 11,779,000 21/77 Baltimore 1,674,000 1,540,000 134,000 92/08 Charleston 10,510,000 8,933,000 1,577,000 85/15 New England 2,397,000 1,270,000 1,127,000 53/47 New York 12,561,000 5,527,000 7,034,000 44/56 Norfolk 4,421,000 4,288,000 133,000 97/03 Philadelphia 10,048,000 9,445,000 603,000 94/06 Savannah 8,991,000 3,991,000 0 100/0 Wilmington 13,270,000 5 , 972 , 000 7 , 298 , 000 45/55
455,734,000 315,218,000 140,516,000 69% 31%
*Presented n Pequegnat et al. (1978) Table compiled by Dr. R. T. Saucier, Dredged material Researcn Program, Wa-terways Experiment Station, from data presented in the National Dredging Study by A.D. Little (1974). The figures snown represent an average of the figures for dredging requirements projected for 1974, 1975, and 1976 by A. 0 Little. Actual value probably falls between 350 and 455 million cu yd annually.
A-75

Table D-2
Dredging (Maintenance) by Dredge Type
AVERAGE AVERAGE AVERAGE ANNUAL % OF 1978 VOLUME NUMBER
VOLUME* TOTAL COST PER PROJECT OF DREDGE (000) cu.yd. VOLUME $/cu.yd (000) cu.yd PROJECTS
Dragline 6,596 2.3 0.8 3,298 2
Dipper 140 -- 4.1 35 4
Dustpan 23,257 8.2 0.53 401 58
Clamshell 3,220 1.1 2.5 43 75
Hopper 93,550 33.0 0.75 737 127
Plain 2,967 1.1 1.1 297 10 Suction
Cutterhead 117,736 41.5 0.83 359 328
Side 478 0.2 2.2 44 11 Casting
Other 35,759 12.6 0.77 2,104 17
Total 283,703 100.0 0.80 449 632
*Last 3 to 5 years
SOURCE: NWS Inventory
A-76
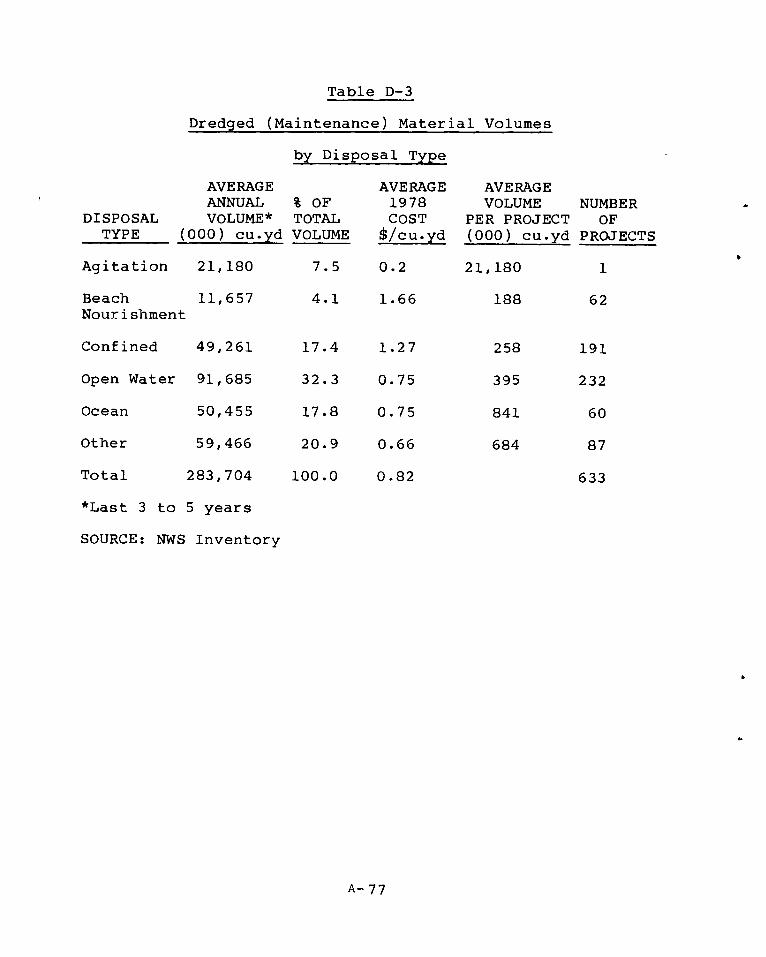
Agitation 21,180 7.5 0.2 21,180 1
Table D-3
Dredged (Maintenance) Material Volumes
by Disposal Type
AVERAGE AVERAGE AVERAGE ANNUAL % OF 1978 VOLUME NUMBER
DISPOSAL VOLUME* TOTAL COST PER PROJECT OF TYPE (000) cu.yd VOLUME t/cu.yd (000) cu.yd PROJECTS
Beach 11,657 4.1 1.66 188 62 Nourishment
Confined 49,261 17.4 1.27 258 191
Open Water 91,685 32.3 0.75 395 232
Ocean 50,455 17.8 0.75 841 60
Other 59,466 20.9 0.66 684 87
Total 283,704 100.0 0.82 633
*Last 3 to 5 years
SOURCE: NWS Inventory
A- 77
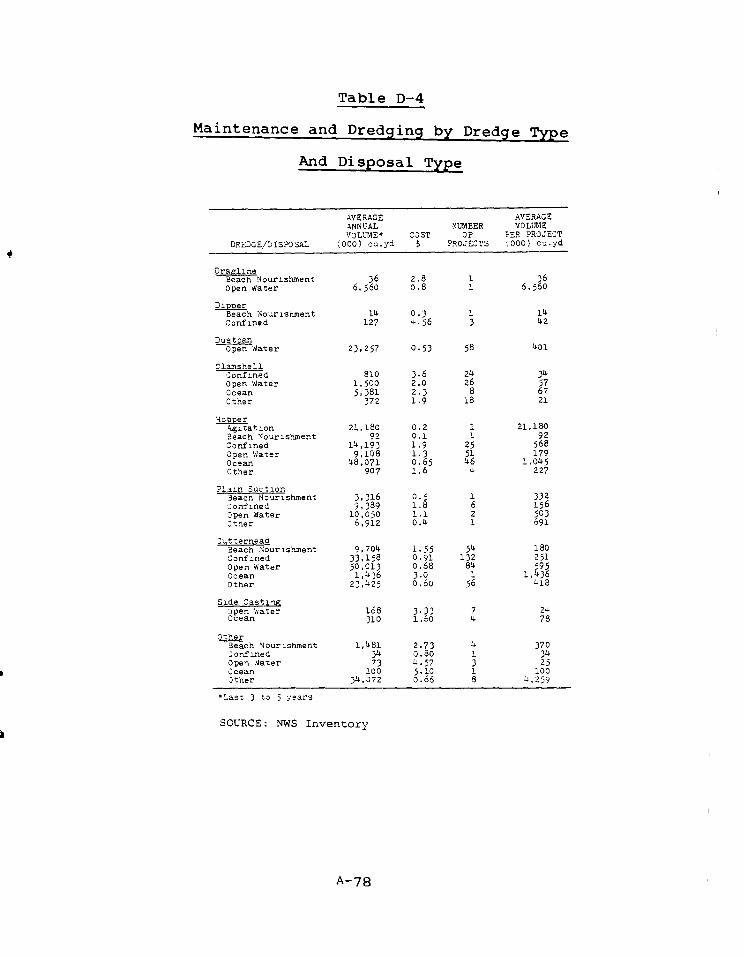
1 1
36 6,560
3,316 9,389 10,050 6,912
Plain Suction Beach Nourishment Confined Open Water Other
0.5 1 332
1.8 6 156
1.1 2 503
0.4 1 691
1.55 0.91 0.68 3.0 0.60
9,704 33, 1 58
50,013 1, 4 36
23, 425
C'.,tternead Beach Nourishment Confined Open Water Ocean Other
54 180 132 251 84 595 1 1,436
56 418
24 78
Side Casting
q:2,1sater 168 3.33 7 310 1.60
Table D-4
Maintenance and Dredging by Dredge Type
And Disposal Type
AVERAGE ANNUAL VOLUME.
DREDGE/DISPOSAL (000) cu.yd
AVERAGE NUMBER VOLUME
COST OF PER PROJECT PROJECTS (000) cu.yd
Dragline Beach Nourishment Open dater
Dipper Beach Nourishment Confined
Dustpan Open Water
Clamshell Confined Open Water Ocean Other
Hopper Agitation Beach Nourishment Confined Open Water Ocean Other
36 2.8 6, 5 60 0.8
14 0.3 1 14
127 4.56 3 42
23,257 0.53 58 401
810 3.6 24 34
1,500 2.0 26 57
5,381 2.3 8 67
372 1.9 la 21
21,180 0.2 1 21,180
92 0.1 1 92
14,193 1.9 25 568
9,108 1.3 51 179
48,071 0.65 46 1,045
907 1.6 4 227
Other Beach Nourishment Confined Open Water Ocean Other
1,481 2.73 4 370
34 0.80 1 34
73 4.57 3 25
100 5.10 1 100
34,072 0.66 8 4,259
*Last 3 t3 5 years
SOURCE: NWS Inventory
A- 78
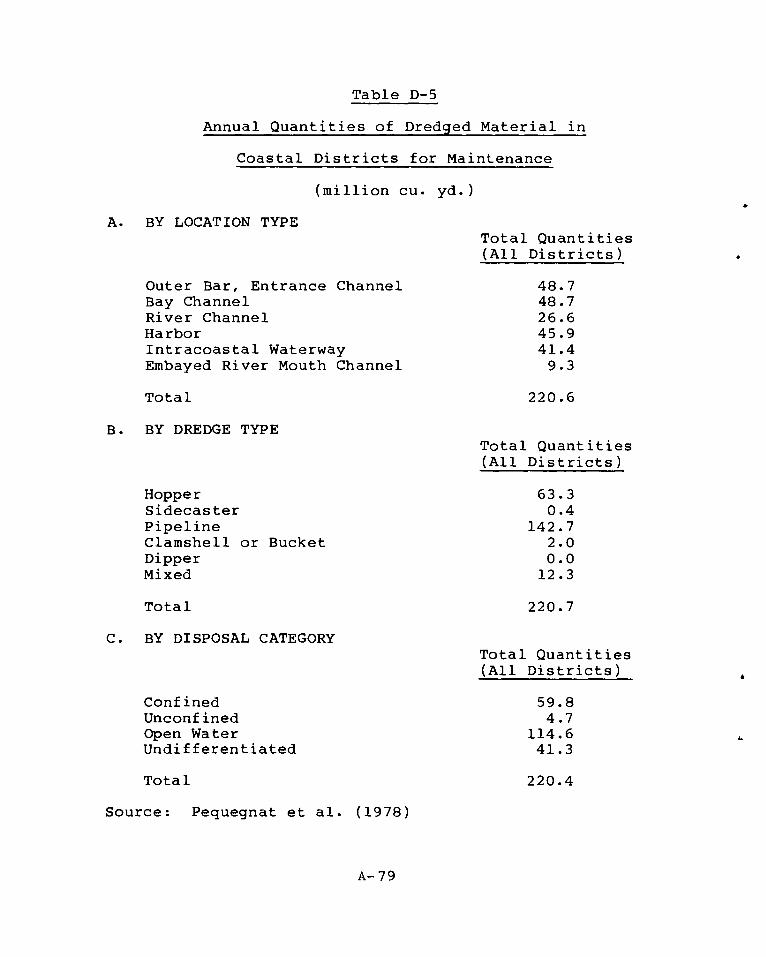
Confined Unconfined Open Water Undifferentiated
59.8 4.7
114.6 41.3
Table D-5
Annual Quantities of Dredged Material in
Coastal Districts for Maintenance
(million cu. yd.)
A. BY LOCATION TYPE Total Quantities (All Districts)
Outer Bar, Entrance Channel 48.7 Bay Channel 48.7 River Channel 26.6 Harbor 45.9 Intracoastal Waterway 41.4 Embayed River Mouth Channel 9.3
Total 220.6
B. BY DREDGE TYPE Total Quantities (All Districts)
Hopper 63.3 Sidecaster 0.4 Pipeline 142.7 Clamshell or Bucket 2.0 Dipper 0.0 Mixed 12.3
Total 220.7
C. BY DISPOSAL CATEGORY Total Quantities (All Districts)
Total 220.4
Source: Pequegnat et al. (1978)
A- 79
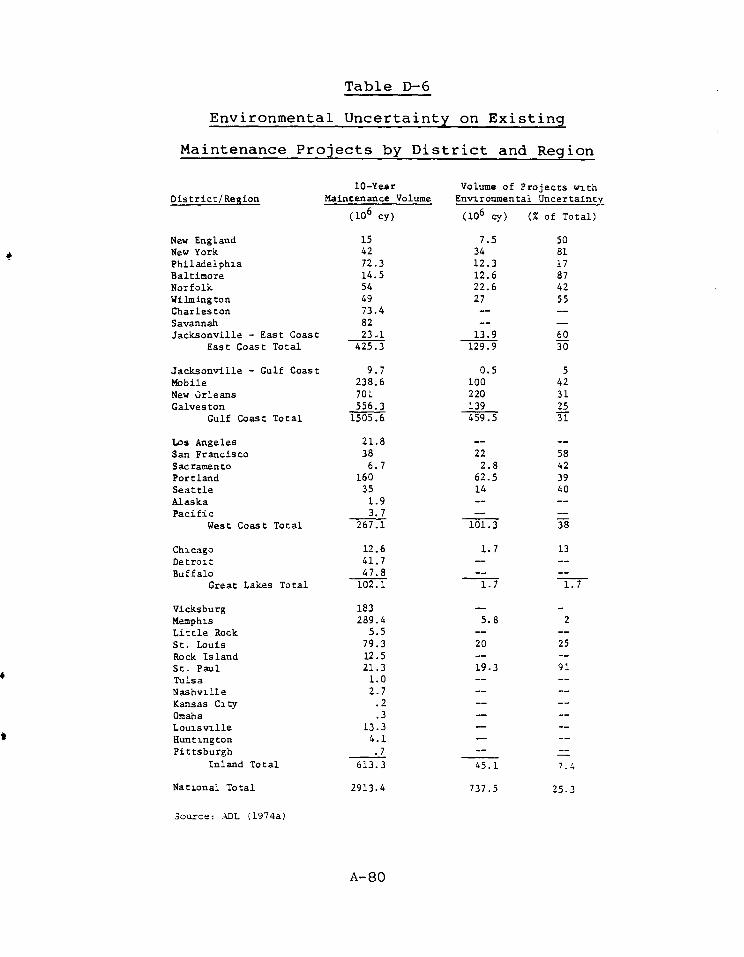
Table D-6
Environmental Uncertainty on Existing
Maintenance Projects by District and Region
District/Region 10-Year Volume of Projects with
Maintenance Volume Environmental Uncertainty
(106 cy) (106 cy) (% of Total)
New England 15 7.5 50 New York 42 34 81 Philadelphia 72.3 12.3 17 Baltimore 14.5 12.6 87 Norfolk 54 22.6 42 Wilmington 49 27 55 Charleston 73.4 -- -- Savannah 82 -- -- Jacksonville - East Coast 23.1 13.9 60
East Coast Total 425.3 129.9 30
Jacksonville - Gulf Coast 9.7 0.5 5 Mobile 238.6 100 42 New Orleans 701. 220 31 Galveston 556.3 139 25
Gulf Coast Total 1505.6 459.5 31
Los Angeles 21.8 -- -- San Francisco 38 22 58 Sacramento 6.7 2.8 42 Portland 160 62.5 39 Seattle 35 14 40 Alaska 1.9 -- -- Pacific 3.7 -- ".=
West Coast Total 267.1 101.3 38
Chicago Detroit Buffalo
Great Lakes Total
12.6 1.7 13
41.7 -- --
47.8 -- =__
102.1 1.7 IT
Vicksburg 183 -- Memphis 289.4 5.8 2 Little Rock 5.5 -- -- St. Louis 79.3 20 25 Rock Island 12.5 -- -- St. Paul 21.3 19.3 91 Tulsa 1.0 -- -- Nashville 2.7 -- -- Kansas City .2 -- -- Omaha .3 -- -- Louisville 13.3 -- -- Huntington 4.1 -- -- Pittsburgh .7 -- -- --
Inland Total 613.3 45.1 7.4
National Total 2913.4
Source: ADL (1974a)
737.5 25.3
A- 80
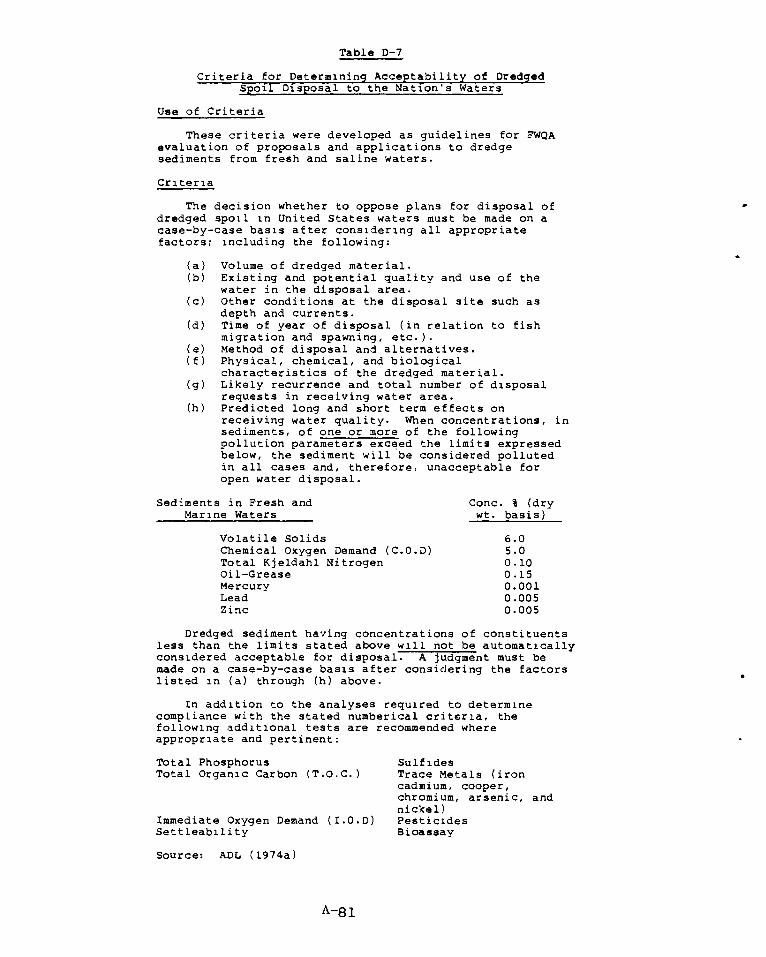
Table D-7
Criteria for Determining Acceptability of Dredged Spoil Disposal to the Nation's Waters
Use of Criteria
These criteria were developed as guidelines for FWQA evaluation of proposals and applications to dredge sediments from fresh and saline waters.
Criteria
The decision whether to oppose plans for disposal of dredged spoil in United States waters must be made on a case-by-case basis after considering all appropriate factors: including the following:
(a) Volume of dredged material. (b) Existing and potential quality and use of the
water in the disposal area. (c) Other conditions at the disposal site such as
depth and currents. (d) Time of year of disposal (in relation to fish
migration and spawning, etc.). (e) Method of disposal and alternatives. (f) Physical, chemical, and biological
characteristics of the dredged material. (g) Likely recurrence and total number of disposal
requests in receiving water area. (h) Predicted long and short term effects on
receiving water quality. When concentrations, in sediments, of one or more of the following pollution parameters exceed the limits expressed below, the sediment will be considered polluted in all cases and, therefore, unacceptable for open water disposal.
Sediments in Fresh and Conc. % (dry Marine Waters wt. basis)
Volatile Solids 6.0 Chemical Oxygen Demand (C.O.D) 5.0 Total Kjeldahl Nitrogen 0.10 Oil-Grease 0.15 Mercury 0.001 Lead 0.005 Zinc 0.005
Dredged sediment having concentrations of constituents less than the limits stated above will not be automatically considered acceptable for disposal. A judgment must be made on a case-by-case basis after considering the factors listed in (a) through (h) above.
In addition to the analyses required to determine compliance with the stated numberical criteria, the following additional tests are recommended where appropriate and pertinent:
Total Phosphorus Total Organic Carbon (T.O.C.)
Immediate Oxygen Demand (I.O.D) Settleability
Source: ADL (1974a)
Sulfides Trace Metals (iron cadmium, cooper, chromium, arsenic, and nickel) Pesticides Bioassay
A-81
released into the water column as the material settled to the bottom, aggravating an already severe national water pollution problem. The available alternatives to open dumping were either confining the material behind dikes (and in some cases,special treatment for the runoff water) or hauling the material out to the deep ocean (100 fathoms). The costs estimated by the COE for these pro-cedures were staggering for some locations. Costs in-volved both acquisition of land for disposal areas (scarce and expensive in most developed port areas) and increased transportation (pumping through long pipelines or hauling in barges or hopper dredges) to new disposal sites.
As a result, dredging became a more expensive opera-tion in many parts of the country; projects were delayed while disposal areas were acquired ( a cost that is usual-ly borne by the local sponsor of the federal dredging, ex-cept for the Great Lakes where Public Law 91-611 author-izes the use of federal funds for disposal areas); appli-cations for permits were filed; and environmental impact statements were prepared. For example, dredging in the Great Lakes was virtually stopped by the ban on open water disposal while plans for disposal areas were worked out. In San Francisco Bay (another area hard hit by environ-mental regulation), costs of alternatives to open water dumping of dredged material from the Mare Island project increased project costs three to ten times (San Francisco District estimates).
Because the enforcement of environmental regulations is in the hands of state agencies in non-federal waters, the effects have been different from state to state. In those parts of the country where environmental concern is high and the economy is not heavily dependent on ship-borne commerce, dredging has been affected the most. In-cluded here are California (particularly the San Francisco Bay area), Florida, the Chesapeake Bay region, North Carolina, New England, and the Great Lakes (where there has been extensive publicity given to the ecological health of the lakes). However, on the Gulf Coast (save Florida), dredging is an accepted way of life, and there is great political pressure for economic development. Consequently, the effect of the disposal problem has not been as severe. In still other areas (those without dense concentrations of industry and population), the dredged material tends to be relatively clean and deemed unpollut-ed by the Great Lakes Criteria.
A-8 2
From the beginning, the advocates of dredging have contended that there was little scientific information on which to base such severe regulations. It was also argued that the Great Lakes Criteria were not applicable to all projects in all parts of the country. The 1973 Water Quality Bill passed by the Congress reflected these opin-ions and instructed EPA, in conjunction with the Corps of Engineers and other Federal agencies, to promulgate more definitive guidelines for dredged material disposal. As a result, Ocean Dumping Guidelines were issued in to all waters seaward of the baseline of the territorial sea (for practical purposes, the coastline). The Inland Guidelines cover all water inland of the coastline, including lakes, rivers, bays, and estuaries. The present status of these and other regulations is discussed in the following sections.
(b) Existing Pertinent Federal Laws
1. FWPCA (PL 92-500; 33 U.S.C. 1344). The dis- charge of pollutants from point sources into the waters of the United States is prohibited by Section 301 of the Federal Water Pollution Control Act Amendments of 1972 (FWPCA) unless the discharge is in compliance with Sec-tions 402 and 404 of the Act. Section 402 establishes The National Pollutant Discharge Elimination System (NPDES), which is administered by the Administrator of the Environ-mental Protection Agency (EPA). This authority has been delegated to the states in most instances. Permits could be required for certain dredging operations (e.g., over-flows from hopper dredges) and dredged material disposal operations (e.g., overflows from diked disposal areas).
Under Section 404 of the FWPCA, the COE specifies disposal sites based on the application of Guidelines developed by the Administrator of EPA in conjunction with the Secretary of the Army acting through the Chief of Engineers. In any case where such Guidelines alone would prohibit the specification of a disposal site, the COE may still specify a site through the additional application of the economic impact of the site on navigation and anchor-age. The Administrator may deny or restrict the specifi-cation or use of any disposal when he determines, after the opportunity for hearing and consultation with the COE, that a discharge will have an unacceptable adverse effect on municipal water supplies, shellfish beds and fishery
A-83

areas (including spawning and breeding areas), wildlife, or recreational areas.
These Guidelines are still in a state of flux. EPA has proposed Guidelines which revise and clarify the September 5, 1975 interim final Guidelines regarding dis-charge of dredged or fill material into waters of the U.S. in order to:
(a) reflect the 1977 Amendments of Section 404 of the Clean Water Act,
(b) correct inadequacies in the interim final Guidelines by filling gaps in explanations of unacceptable adverse impacts on aquatic and wetland ecosys-tems and by requiring documentation of compliance with the Guidelines, and
(c) produce a final rule-making document.
The existing interim final Guidelines will remain in effect until the effective date of these revised Guide-lines. Comments on the revised Guidelines were being received until November 19, 1979.
It should be noted that assuming these Guidelines are adopted, drastically different elutriate, bioassay, and bioaccumulation studies will be required for inland open water disposal as opposed to ocean dumping.
2. Section 103 of the Marine Protection, Re-search and Sanctuaries Act of 1972 (PL 92-532; 33 U.S.C. 1413). The Marine Protection, Research and Sanctuaries Act of 1972 (commonly referred to as the "Ocean Dumping Act") contains provisions that resemble the permitting approach taken by the FWPCA. Specifically, Section 103 of the Act is similar to Section 404 of the FWPCA in that it creates a separate permit program to be administered by the Secretary of the Army, acting through the Chief of Engineers, for the authorization of the transportation of dredged material in ocean water for the purpose of dis-posal at designated disposal sites. The Act requires the COE to make the same evaluation that is required of the Administrator for the ocean dumping of other materials, using the ocean dumping criteria developed by the Adminis-trator. The Act also requires the COE to utilize, to the maximum extent feasible, ocean dumping sites that have
A -8 4

been designated by the Administrator, EPA. It should be noted that the Ocean Dumping Criteria will be opened for comment prior to revision in the near future.
If the EPA criteria prohibit ocean dumping, the Act requires the COE to make an independent determination as to the need for the proposed dumping based upon an evaluation of the potential effect that would occur to navigation, economic and industrial development, and foreign and domestic commerce of the United States if a permit were denied. An independent determination as to other proposed methods of disposal of dredged material and appropriate locations for ocean dumping must also be made by the COE in the review of applications for ocean dumping.
No permit may be issued to dump dredged material in the oceans if the dumping does not comply with the EPA criteria unless the Secretary of the Army seeks a waiver of the criteria from the Administrator after certifying that there is no economically feasible method or site available other than the proposed dump site under consid-eration. The Act requires the Administrator to grant this waiver unless he finds that the proposed dumping will re-sult in an unacceptable adverse impact on municipal water supplies, shellfish beds, wildlife, fisheries, or recrea-tional areas.
This Act has implications only for coastal COE Districts. The dredging volumes for the coastal Districts were presented in Table D-6.
Section 302 of the Ocean Dumping Act authorizes the Secretary of Commerce to issue regulations to control activities within areas of the ocean waters or Great Lakes which have been designated as marine sanctuaries.
3. River and Harbor Act of 1899 (33 U.S.C. 401 et seq.). The River and Harbor Act of 1899 was enacted to protect navigation and the navigable capacity of the nation's waters. Permitting authorities under the 1899 Act are found in:
(a) Section 9, which prohibits the con- struction of any dam or dike across any navigable* water in the absence of Congressional consent and approval;
A-85

(b) Section 10, which prohibits the unauth-orized obstruction or alteration of any navigable* water;
(c) Section 11, under which the Corps may estabish guidelines for defining the offshore limits of structures and fills insofar as they impact on navigation interests; and
(d) Section 13, which prohibits the unauth-orized discharge of refuse into navig-able waters. (The permitting authority under this section has been superseded by that provided by EPA under Sections 402 and 405 of the FWPCA.)
Of particular relevance to this study is Section 10 of the 1899 Act. Under this section, the construction of any structure in or over any navigable water of the United States, the excavation from or depositing of mater-ial in such waters, D-18 or the accomplishment of any other work affecting the course, location, condition or capacity of such waters is unlawful unless the work has been recommended by the Chief of Engineers and authorized by the Secretary of the Army. The instrument of authoriz-ation is designated a permit, general permit, or letter of permission. The authority of the Secretary of the Army to prevent obstructions to navigation in the navigable waters of the United States was extended to artificial islands and fixed structures located on the outer continental shelf by Section 4(f) of the Outer Continental Shelf Lands Act of 1953, 43 U.S.C. 1333(f).
4. The Fish and Wildlife Coordination Act (PL 85-624; 16 U.S.C. 661 et seq.). This Act amended the Act of March 10, 1934 to provide that fish and wildlife con-servation shall receive equal consideration with other project purposes and be coordinated with other features of water resource development programs. Adverse effects
* "Navigable waters of the United States," as defined in 33 C.F.R. 329, are the traditional waters where per-mits are required under Sections 9 and 10 of the River and Harbor Act of 1899. "Waters of the United States," on the other hand, are defined in 33 C.F.R. 323.2(a).
A- 86

on fish and wildlife resources and opportunities for im-provement of those resources shall be examined along with other purposes which might be served by water resource development. The COE may recommend project modifications and acquisition of lands for fish and wildlife conserva-tion purposes. Section 2(a) of the Act defines the area of interest to include impoundment, diversion, channel deepening, or any modification of a stream or other body of water. All pre-authorization and post-authorization planning or project development, without exception, must be coordinated with the Fish and Wildlife Service of the Department of the Interior; The National Marine Fisheries Service of the Department of Commerce, as appropriate; and the agency administering the fish and wildlife resources of the state wherein construction is contemplated.
5. The Coastal Zone Management Act (CZMA) of 1972 as Amended (PL 92-583; 16 U.S.C. 1451 35 et seq).
(a) General. This Act declared a national interest in the effective management, beneficial use, protection and develop-ment of the coastal zone. It indicates that the primary responsibility for planning and regulation of land and water uses rests with the state and local governments. The Act states that Congress finds that the key to more effective protection and use of the land and water resources of the coastal zone is to encourage the state to exer-cise their full authority over lands and waters in the coastal zone. The Secretary of Commerce is authorized to award federal grants to assist the states in developing and administering land and water use management programs for the coastal zone giving full con-sideration to ecological, cultural, historic and aesthetic values as well as to the need for economic develop-ment. Federal agencies with activities directly affecting the coastal zone or development projects within that zone must assure that those activities or projects are consistent, to the maximum extent practicable, with the approved state program.
A-87
(b) Policy Regarding COE Role Under PL 92-583. Civil works activities under-taken subsequent to approval of a state's Coastal Zone Management (CZM) plan will be consistent with the plan to the maximum extent practicable.
Permit applications for activities regulated by Corps authorities must include a certification that the action contemplated is consistent with the approved state CZM plan.
Technical assistance requested by the states to assist their implementation of the national policy for coastal zone management will be provided to the extent practicable.
6. National Environmental Policy Act of 1969 (42 U.S.C. 4321 et seq.). The Act declares the national policy to encourage a productive and enjoyable harmony between man and his environment. Section 102 of that Act directs that "to the fullest extent possible: (1) The policies, regulations, and public laws of the United States shall be interpreted and administered in accordance with the policies set forth in this Act, and (2) All agencies of the Federal Government shall ... insure that presently unquantified environmental amenities and values may be given appropriate consideration in decision making along with economic and technical considerations...." Detailed environmental impact statements are required if a proposed major federal action would significantly affect the quality of the human environment.
7. The Resource Conservation and Recovery Act (RCRA) of 1976 (PL 94-580; 42 U.S.C. 6901 et seq.). The Act applies to nearly all nonagricultural, solid, and liquid wastes which are not subject to Section 402 permits. A major aspect of the Act is its two-stage regu-latory program for hazardous wastes. Under Subtitle C of the Act, EPA must first establish criteria for determining the characteristics of hazardous wastes and then establish regulations, as may be necessary to protect human health and the environment, applicable to hazardous waste gener-ators, transporters, and owners and operators of treat-ment, storage, and disposal facilities. Section 6004 of RCRA requires that federal agencies that generate solid
A -8 8
wastes or that permit waste disposal must insure compli-ance with the Act. Although unresolved at this point, it is conceivable that land disposal of dredged material would be subject to RCRA. Should this material be classi-fied as "hazardous waste," it would further be subject to the comprehensive Subtitle C regulatory program.
8. The Endangered Species Act of 1973 (PL 93-205) as Amended (PL 95-632; 16 U.S.C. 1531 et seq.). The Act states that the policy of Congress is that all federal departments and agencies shall seek to conserve endangered species and threatened species and shall utilize their authorities in furtherance of the purposes of this Act. The purposes of this Act are to provide a means whereby the ecosystems upon which endangered species and threatened species depend may be conserved and to pro-vide a program for the conservation of such endangered species and threatened species. Section 7 states that each federal agency shall, in consultation with and with the assistance of the Secretary of Interior/Commerce, in-sure that any action authorized, if any, or carried out does not jeopardize the continued existence, destruction or adverse modification of habitat.. .determined by the Secretary (Interior/Commerce)...to be critical unless an exception has been granted by the Endangered Species Com-mittee. Additional guidelines for protection of marine mammals are established in PL 92-522 (ER 1105-2-129).
9. The National Historic Preservation Act of 1966 as Amended (16 U.S.C. 470 et seq.). The Act requires that agencies consider potential impacts on significant historical or archaeological resources. Implementation of this Act has great impacts in some areas. For example, it is estimated that along the Arkansas River there are archaeological sites every few hundred yards which were villages of Indian tribes who have roamed the area for the past 15,000 years. They influence the location of sites for dredged material disposal.
10. Safe Drinking Water Act (42 U.S.C. 1401 et seq.). Under Section 1424(e) of the Act, the Adminis-trator, EPA, may identify certain drinking water aquifers, the pollution of which would create a significant hazard to public health. Once identified, most new underground injection wells would be barred. Accordingly, well injec-tion would not be a feasible alternative pursuant to the EPA's criteria for the need for ocean dumping (40 C.F.R.
A-89
277.15(e)(2)). Notwithstanding the injection prohibi-tion, the Safe Drinking Water Act is relevant to dredge disposal activities to the extent it indirectly leads to the identification of important water supplies, the pro-tection of which may warrant particular attention.
11. Section 150 of the Water Resources Develop-ment Act of 1976. This Section authorized the Secretary of the Army, acting through the Chief of Engineers, to plan and establish wetlands areas as part of water re-sources development projects. Field elements should use their current knowledge in coordination with all affected interests to implement this section where appropriate in accordance with the following:
(a) Wetlands created must be primarily the result of dredged material.
(b) All costs of establishing wetlands in this manner, including easements and rights-of-way, should be borne by the United States as additional project costs and will normally be established on lands already in public ownership or subject to navigational servitude.
(d) No more than $400,000 in additional project costs will be incurred for project construction or maintenance dredging cycles. The federal cost limitations established by Section 201 of the 1965 Flood Control Act, as amended or continuing authority projects, will include this additional cost.
(e) The benefits of establishing the wet-land will be considered equal to the cost, up to $400,000.
(f) There should be reasonable evidence that wetland areas to be established will not be substantially altered or destroyed by natural or man-made causes.
A-90
(c) The Role of States
State authority with respect to dredge and fill opera-tions has been expanded as a result of the Clean Water Act of 1977 (PL 95-217; 33 U.S.C. 1251 et seq.). Under this Act, states may administer their own permit programs for the discharge of dredge or fill material into nontidal navigable waters. After EPA approval of a state program, the COE is to transfer its permit activities to the responsible state agency.
Other enforcement and permit activities have been passed on to the states - most notably the NPDES program. Additionally, there are state and local regulations per-taining to wetlands, water quality, solid waste disposal, land use planning and zoning.
SEGMENT-SPECIFIC ANALYSIS
Information in the following sections is based upon interviews conducted at each COE division office, follow-up telephone calls, and an extensive literature survey of reports. The environmental issues relating to dredging and dredged material are complex and often not well documented.
(a) Segment 1 - Upper Mississippi River
1. General. This segment comes under the juris-diction of three COE districts, St. Paul (head of naviga-tion to Guttenberg, Iowa), Rock Island (Guttenberg to Lock and Dam 22), and St. Louis (Lock and Dam 22 to the mouth of the Illinois River).
Dredging information is summarized in Table D-8. Dredging quantities and costs extracted from the dredging inventory for each district are compared in Table D-9.
The major volume of the dredging in the St. Paul and Rock Island District is done by the 20" cutterhead dredge, Wm. A. Thompson (GREAT I, 1979 a). Supplementary dredging is done by the 4 cubic yard clamshell dredge, Hauser. Dredging in the St. Louis District is done primarily with a cutterhead dredge.
A-91
The costs shown in Table D-9 are not directly comparable as the St. Paul District operates the dredge. St. Paul calculates its costs by dividing the net cost of operating the dredge by the dredge volume, whereas Rock Island pays a standard time charge for use of the dredge.
Disposal in the St. Paul District is believed to be almost entirely upland although the inventory indi-cates some beach nourishment. In the Rock Island Dis-trict, beach nourishment is the principal means of dispos-al, whereas all disposal in the St. Louis District is open water.
2. Environmental Considerations
(a) Dredging Methods. The major environ- mental concern is the disposal of dredged material. Thus, the impetus for changing dredging technology is to reduce the quantity of the dredged material which is discussed below as a method of satisfying environmental constraints.
(b) Disposal of Dredged Material. The disposal of dredged material is a matter of considerable environmental concern, particularly in the St. Paul and Rock Island Districts. It is a major item of study for the GREAT (Great River Environmental Action Team). The states of Minnesota and Wisconsin require upland disposal. In addition, Minnesota has imposed strict effluent water quality for the disposal sites. Iowa encourages beach nourish-ment as a means of increasing and main-taining recreational beaches along the river. Illinois and Missouri apparent-ly continue to allow open dumping of dredged material in the river in the St. Louis District.
Dredging plans should be part of the output of the aforementioned GREAT studies which are not complete. GREAT
A- 92
I (covering the St. Paul District*) issued the "1979 Interim Guidelines and Evaluation for Channel Maintenance Dredging and Material Placement" on 24 April 1979. These guidelines contain a list of recommended material placement sites and procedures for site approval prior to dredging.
3. Methods of Satisfying Environmental Con- straints.
There are three strategies being adopted to satisfy environmental constraints on dredging:
(a) reduce the flow of sediment to the river and hence the need for dredging;
(b) reduce the volume of dredging by reduc-ing the dredging depth and channel width;
(c) develop environmentally acceptable methods of disposal of dredge material.
These strategies are discussed individually below.
(a) Reduction of Sediment. The sediments are carried to the main stream from its tributaries. Not only are they de-posited in the main channel, but they tend to deposit at the openings to slack water areas (e.g., ox-bow lakes) blocking them and resulting in their degradation as wildlife habitats. Therefore, this strategy is favored both as a means of enhancing wildlife habitat and to reduce dredging.
* GREAT II covers the Rock Island District. GREAT III covers the St. Louis District.
A-93
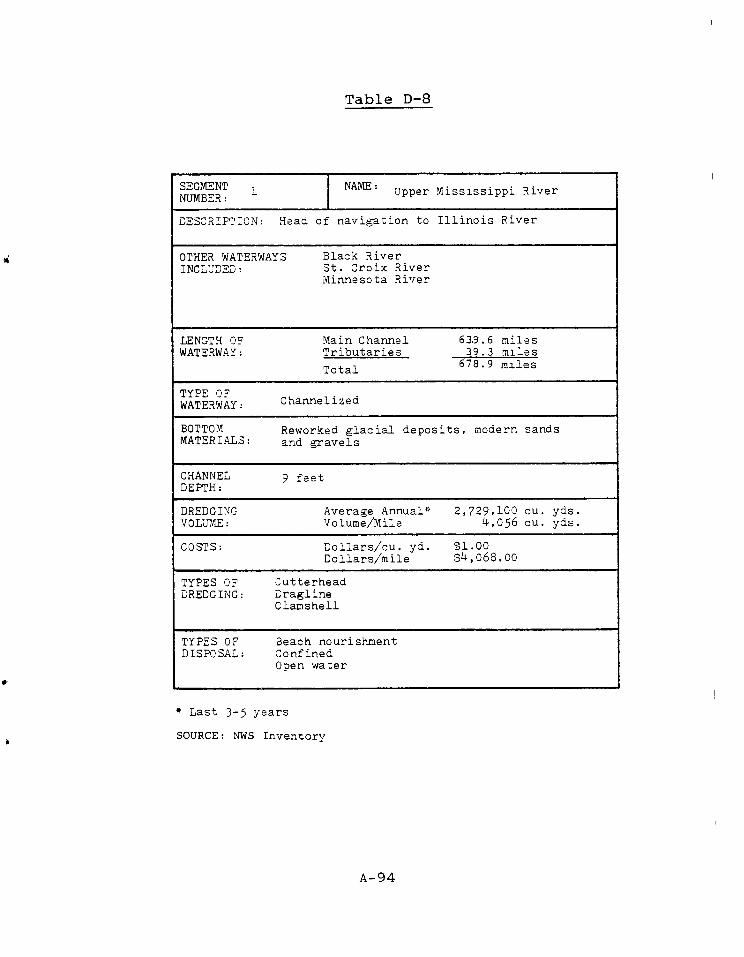
NAME: Jpper Mississippi River
DESCRIPTION: Head of navigation to Illinois River
OTHER WATERWAYS INCLUDED:
Black River St. Croix River Minnesota River
TYPE OF WATERWAY: Channelized
BOTTOM MATERIALS:
Reworked glacial deposits, modern sands and gravels
DREDGING Average Annual* 2,729,100 cu. yds. VOLUME: Volume/Mile 4,056 Cu. yds.
COSTS: Dollars/cu. yd. $1.00 Dollars/mile $4,068.00
TYPES OF Cutterhead DREDGING: Dragline
Clamshell
LENGTH OF WATERWAY:
639.6 miles 39.3 miles
678.9 miles
Main Channel Tributaries
Total
9 feet CHANNEL DEPTH:
1 SEGMENT NUMBER:
TYPES OF DISPOSAL:
Beach nourishment Confined Open water
Table D-8
* Last 3-5 years
SOURCE: NWS Inventory
A-94

Table D-9
Comparison of Dredging Volumes and Costs on Upper Mississippi River
St. Paul Rock Island St. Louis
Average Annual Volume Dredged Material cubic yards (c.y.) 583,200 685,300 1,460,600 .
Average volume/mile, c.y. 2,098 2,191 17,812
Average cost/c.y. $ 2.62 $ 0.67 $ 0.15
Average cost/mile t5,500.00 $1,467.00 t9,134.00
SOURCE: GREAT I, 1979a
A-95

Recent studies (GREAT I, 1979 b; GREAT II, 1978) indicate that the two major sources of sediment are agricultural runoff f9r the finer sediments and streambank erosion for the coarser sediments. Land treatment to reduce erosion is technically feasible, but does not appear to be economically viable (GREAT I, 1979 b). For example, the application of such treatment of 70% of the target land in the St. Paul District would involve a capital cost of $147 million while reducing the sediment load by approximately 25%. Also, it is unclear how such treatment would be enforced on private land. Streambank erosion control on the Chippewa River, a major contributor of sediment to Mississippi, has been recommended but not implemented at this time (GREAT I, 1979 b).
Other alternative measures to reduce sedimentation in the main channel in-clude the construction of sediment traps, the construction of low dams and control structures on tributaries and diversions of tributaries to backwaters of the main stream (GREAT I, 1979 b).
All these alternatives have been evalu-ated for the Chippewa River. A sedi-ment trap of 313,800 cubic yards was dredged in the Chippewa River in May 1965 (GREAT I, 1979 a). It was not therefore favorably viewed as reduce the volume of dredge material to be disposed of as the sediment trap itself has to be dredged.
The construction of low dams on tribu-taries would provide both flood control and a temporary reduction in sediment transport to the mainstream. However, the pools formed by the dams would silt up after a number of years, allowing sediment to be carried again to the mainstream.
A-96
Diversion of tributaries to backwaters would provide temporary relief of sedi- mentation of the main channel. It would, however, increase the degrada-tion of these backwaters which are im-portant wildlife habitats and interfere with recreational boating on the lower beaches of these tributaries. It would, therefore, not appear to be ac-ceptable to local interests.
In summary, though there are possibili- ties for erosion control and other measures to reduce sediment transport to main channel, it is expected that the impact of these measures will not be significant by the year 2000.
(b) Reducing Dredging Depths and Channel Widths. A policy of reducing channel widths and depths has been adopted with apparent success by the St. Paul and Rock Island Districts, but not by the St. Louis District. Under old mainten-ance procedures, in order to maintain a nine-foot channel, dredging was normal- ly performed to a depth of 13 feet (GREAT I, 1979 a). The channel was widened beyond the authorized channel width by additional advance dredging as equipment and funding allowed. This reduced the risk of an inadequate chan- nel when dredging equipment was not available. Advance dredging is con-sidered to be very efficient with large cutterhead dredges since once they are mobilized and set up at a dredging location, they are able to dredge the additional volume required with only a small increase in dredging time.
Under the GREAT program, each dredging site was evaluated, and, based on the frequency of dredging and other param-eters, the dredging depth was determin-ed. Between 1975-1978, 23%, 53% and 24% of the dredging based on volume was accomplished to 13, 12 and 11 foot
A-97

depths, respectively. This resulted in an overall reduction of 940,350 cubic yards or 23.7% of the main channel maintenance based on initial dredging requirements at each site.
The dredging frequency increased by 77.1% at 15 sites with a corresponding dredging quantity decrease of 19.6%. At these sites, dredging would be re-quired three out of four years for reduced depth dredging versus dredging two out of five years for 13 foot dredging. A dredging equipment analy- sis indicates that this is economically viable with existing equipment.
At 18 other sites, frequency decreased 9.9% with a dredging quantity decrease of 67.5%. At these sites, there was a very significant decrease in dredging quantity without any corresponding increase in dredging effort or cost.
Record during the period of reduced depth dredging did not indicate an increase in the number of channel closures though there is a greater risk, particularly with an 11 foot dredging depth.
Reduced dredging depth results in a reduced dredging cut (bank height), which in turn results in loss of, dredging efficiency. This is illus-trated in Table D-10 for the 20" cut-terhead dredge and the clamshell dredge.
The data indicate that the cost of dredging 12 feet is the same as the cost of dredging to 11 feet with the cutterhead. The frequency of dredging to 12 feet could increase 22% without increasing the cost, as compared to dredging to 13 feet. With the clam-shell dredge, frequency of dredging
A-98
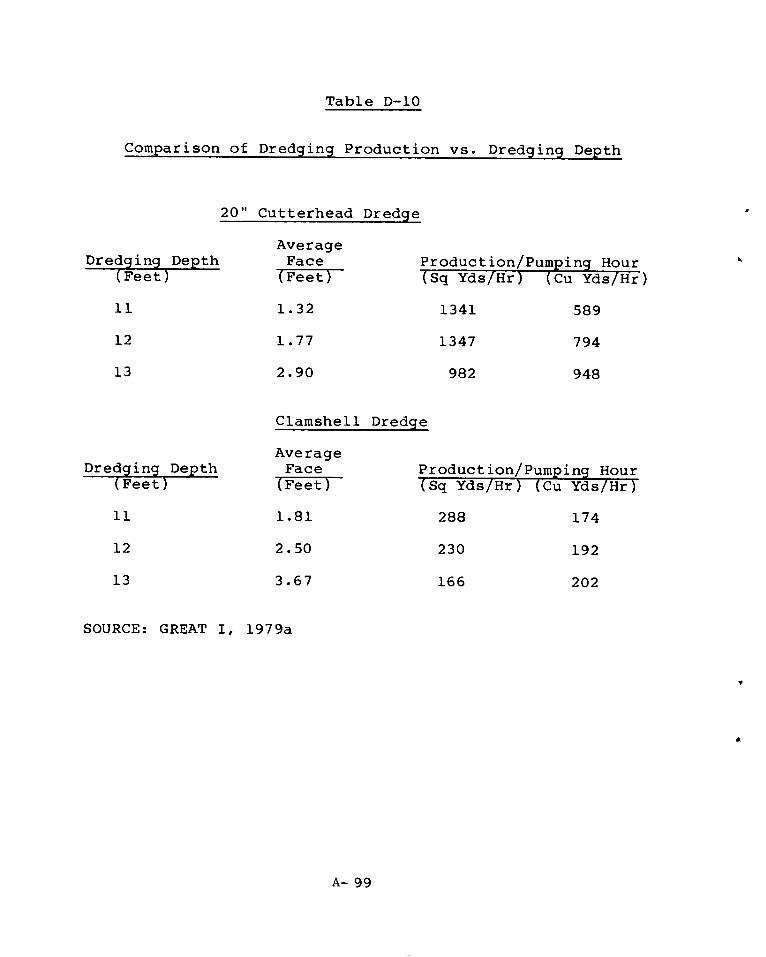
589
794
948
Table D-10
Comparison of Dredging Production vs. Dredging Depth
20" Cutterhead Dredge
Dredging Depth (Feet)
Average Face
(Feet) Production/Pumping Hour (Sq Yds[Hr) (Cu Yds/Hr)
11 1.32 1341
12 1.77 1347
13 2.90 982
Clamshell Dredge
Dredging Depth (Feet)
Average Face
(Feet) Production/Pumping Hour (Sq Yds/Hr) (Cu Yds/Hr)
11 1.81 288 174
12 2.50 230 192
13 3.67 166 202
SOURCE: GREAT I, 1979a
A-- 99
could increase 28% with 13 foot dredg-ing and 52% with 11 foot dredging with-out increasing dredging cost.
The cutterhead dredge, the more fre-quently used dredge on the Upper Mis-sissippi, was designed for 3-4 foot dredging cuts. It is to be presumed that a new dredge specifically designed for shallow cuts would be more efficient.
A university of Michigan (1960) study shows that the reduction of a 300 foot channel depth from 13.5 feet to 11 feet reduces tow speed 13.7%, or to maintain constant speed, increases energy con-sumption 23.8%. On the average, the St. Paul District dredged 5.7% of its channel annually and has to dredge 28.5% of the channel at least once. There are insufficient data to assess the long-term impact of reduced depth on the efficiency of operation of barge tows or on energy consumption.
Reduced depth does affect tow handling characteristics and this should, and is likely to be, taken into account when determining dredging depths where the safety of the motor vessel or its cargo are endangered by rigid structures forming the channel boundaries.
Reduction of channel widths has been studied in the St. Paul District. This was based both on theoretical calcula-tions and the opinions of a panel of experienced river pilots. The result-ing recommendations were field tested in the 1977-1978 season. After adjust-ing the 1960-1974 quantities for the 1975 low control pool and an average 1 foot reduction in the annual dredging quantity, the resulting reduction in annual dreding quantity would be 171,000 cubic yards of 11%.
A-100
Another means of reducing dredging quantities is to delay the initiation of dredging. Prior to the GREAT program, the COE scheduled or undertook channel maintenance when the depth reaches 11 feet as channel closures had occurred when the channel depth had been allowed to reduce to 10 feet. There has been concern that channel conditions may stabilize at 11 feet, and initiating dredging at that depth may be unproductive. Therefore, with the exception of areas which experience rapid shoaling, the COE has modified its criteria to program maintenance dredging when the depth reached 10.5 feet. The degree of success of this practice has not yet been quantified.
Therefore, in summary, there are a number of different strategies for reducing dredging volumes while main-taining adequate service on the chan-nel. Of these, selectively reducing dredging depth and width of the channel has been the most successful. It may be noted, however, tht the practice has received only one year's actual test and that the remainder of the apparent success is based upon theoretical cal-culations., There is also the real possibility that the position of the test year in the hydrologic cycle may have been fortuitous. In short, this practice should receive further long-term testing to fully evaluate its success for reducing dredging volumes. The impact of delaying dredging has not yet been quantified.
Dredged Material Disposal. Under the GREAT II program, a Dredged Material Use Work Group has been set up to determine beneficial uses for dredged material disposal as one of their prime tasks. For the purposes of this analysis, dredged material disposal
A-101

will be divided into two classes: current acceptable disposal methods and potential disposal options under investigation.
As previously discussed, the primary methods of disposal currently used are upland disposal in the St. Paul District, beach nourishment (or beach creation) in the Rock Island District, and open water disposal in the St. Louis District. Upland disposal removes thc material from the river environment thus avoiding environmental impact to the river but possibly intro-duces adverse environmental impacts at the upland disposal sites. However, it requires costly and energy consuming transport of dredge material over relatively long distances and the provision of suitable sites and may present a problem in meeting water quality standards for the effluent.
Beach nourishment, which essentially is the creation and maintenance of recrea-tion beaches may be classified as a beneficial use of dredge material. The State of Iowa has favored this type of disposal. No substantial environmental problems are identified in the litera-ture, but there is insufficient exper-ience to determine that this will be an environmentally satisfactory method of disposal in the long term.
The environmental acceptability of open water disposal is dependent on the degree of pollution of the sediment, the nature of the sediment, the benthic ecosystem, the river regime, and the interpretation of the Clean Water Act and other environmental regulations. The GREAT III program will address these problems. However, this program has only reached the stage of prelimin-ary problem identification and, there-fore, the eventual acceptability of
A-102

open water disposal in the St. Louis District has not been defined.
A number of alternative potential disposal options are under investiga-tion under the GREAT I and II programs. These include fill for development pur-poses and road construction, fine aggregate for asphalt and concrete and ice control in winter. Insofar as many of these uses are substitutes for materials from commercial sand and gravel operations, there is an institu-tional problem in placing the COE in competition with private industry. Further, the point of discard may be too far from the dredging site for the economic transport of dredge material, and as the timing of demand will not be in phase with the availability of material, storage areas will be required, having the same impacts as disposal sites (GREAT I, 1979 a).
It has been proposed to use dredged material to close three channels in the Weaver Belvedere area to create a fish and wildlife habitat (Neilsen et al., 1978).
4. Possible Future Environmental Constraints. This segment and adjoining segments in the St. Louis District are under intense environmental study under the GREAT program. Not only will this program lead to the formulation and implementation of environmentally based constraints on dredging, but it will define a program of further study which may lead to significant modifications in these constraints as experience and knowledge of envi-ronmental concerns and environmental practice develop.
The most significant impact of the GREAT program is that it has put the engineers responsible for mainten-ance of the river channel, members of environmental bodies, representatives of recreational interests, and other concerned groups in communication. While environ-mental constraints have at times significantly increased the cost and difficulty of dredging, such as upland dis-posal and strict requirements for water quality, on a few
A-103
occasions they appear to have led to solutions that de-crease cost of dredging by decreasing the volume of dredg-ed material. The selective delay of dredging to 10.5 feet thus avoiding unnecessary dredging where shoaling stabil-ized between 10.5 and 11 feet actually reduced the costs of channel maintenance in one area. The effect on naviga-tion reliability, however, may be negative. This is an area where further study beyond the scope of this project is warranted.
Another point to consider is that the existing available dredging equipment is not designed for and often not well adapted to economic dredging with the new methods dictated by environmental constraints. For example, the most important dredge on this segment is a 20" cutterhead which operates most efficiently when taking a 3 foot cut. Under the reduced depth dredging program, cuts have been considerably reduced. There are alternative designs of dredgers which could operate efficiently with these reduced cuts (GREAT I, 1979 c). Further, the COE is required by Congress to allow private industry to compete for dredging work. It is difficult to predict how private industry will react to these environmental constraints, but they will have strong economic incentives to cut costs and their ability to develop innovative approaches should not be underestimated.
Possible changes in environmental constraints are more likely to be concerned with the disposal of dredge material than with the dredging itself. The following changes in disposal constraints are possible:
(a) The adoption of uniform regulations on dredge material disposal by the states, either relaxing or increasing constraints.
(b) The application of strict water quality standards on disposal site effluent.
(c) Increase or decrease in the difficulty of location and use of dredge disposal sites, possibly increasing the distance between the point of dredging and the point of disposal.
(d) Increase or decrease in the demand for dredge material to create and maintain
A-104
recreational beaches (beach nour-ishment) (GREAT II, 1978).
(e) Application of modified guidelines for beach nourishment (GREAT II, 1978).
(f) Encouragement of other beneficial uses of dredge material such as fill, aggregate, and possibly marsh land and wildlife habitat creation. There is reference to the use of dredge material as fill or aggregate in the literature (GREAT II, 1978).
Resumption of open water disposal under environmental controls to be defined.
The following dredging constraints are possible:
(a) Standards on turbidity in the vicinity of dredging operations requiring measures to contain turbidity.
(b) Changes in standards for depth or dredging, width of channel, or initia-tion of dredging, based on environment-al considerations (GREAT I, 1979 a).
(b) Segment 2 - Lower Upper Mississippi River
As there is no reported channel maintenance dredging in this segment, environment constraints are not consider-ed. There is reference to two private companies dredging for commercial sand between river miles 201.3 and 202.6 (COE, 1976).
(g)
A description of the segment is included in Table D-11.
A-105
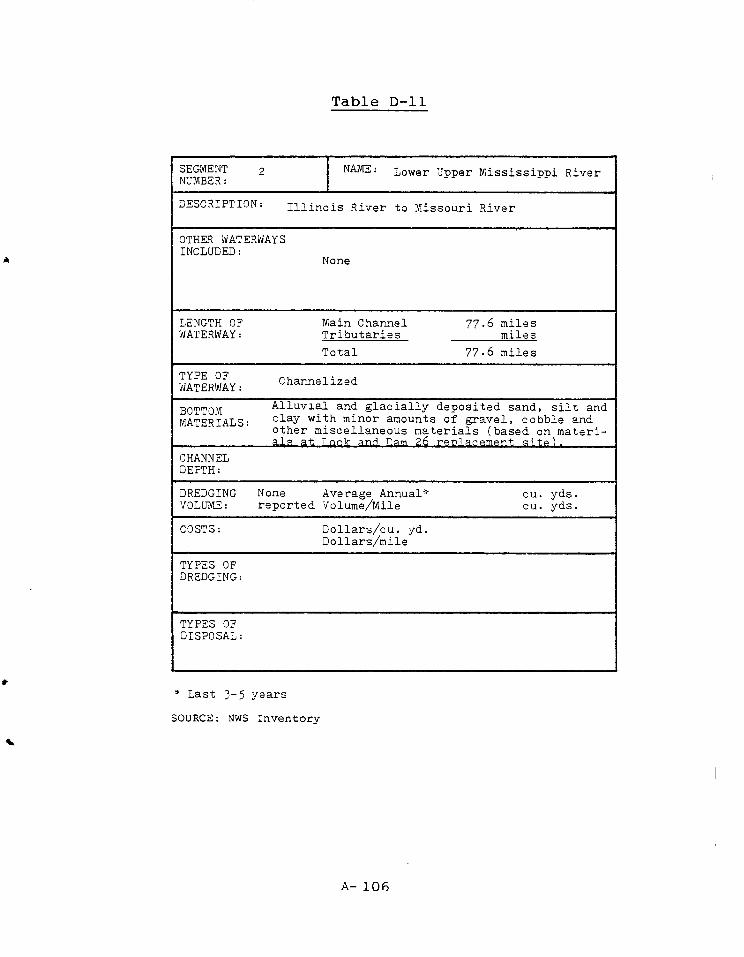
Table D-11
SEGMENT 2 NAME: Lower Upper Mississippi River NUMBER:
DESCRIPTION: Illinois River to Missouri River
OTHER WATERWAYS INCLUDED:
None
LENGTH OF Main Channel 77.6 miles WATERWAY: Tributaries miles
Total 77.6 miles
TYPE OF WATERWAY: Channelized
BOTTOM Alluvial and glacially deposited sand, silt and MATERIALS: clay with minor amounts of gravel, cobble and
other miscellaneous materials (based on materi-als at Tonk and_ 7qm 26 renlarempnt sitpl.
CHANNEL DEPTH:
DREDGING None Average Annual* cu. yds. VOLUME: reported Volume/Mile cu. yds.
COSTS: Dollars/cu. yd. Dollars/mile
TYPES OF DREDGING:
TYPES OF DISPOSAL:
* Last 3 - 5 years
SOURCE: NWS Inventory
A- 106
(c) Segments 3 - 6 - Middle and Lower Mississippi River
1. General. A description of the segments with associated dredging information may be found in Table D-12.
Except for a small stretch above Lock 27, the entire river is free flowing. Though dredging quantities are large, they are small when compared to the total amount of sediment transported by the river. For example, it is estimated that the annual volume dredged between the mouth of the Missouri and or low water conditions and the rapidly with which river stages rise and fall.
It is reported (GREAT III, 1979) that there has been a reduction in the suspended sediment load from the Missouri River, a major source, by over one-half in the last 20 years. This is attributed to reservoir regula-tions, bank stabilization, and land management. Many river training works have been built on these segments during recent years in an uncompleted program of river training. Volumes of dredged materials are reported to have decreased in recent years. This was attributed to a combination of factors including river training, natural variations in flow hydrographs and less emphasis on dredg-ing for the sake of dredging. For example, in the Vicks-burg District, historically, 20-25 sites were dredged annually, whereas only four-five sites have been dredged in recent years.
All dredging in the free flowing main channel is currently done with COE dustpan dredges. These dredges were developed specifically for the Mississippi River and are only used on the Mississippi and its tributaries.
All disposal has been in open water, whether along the channel, along the shore, or concentrated to create artificial islands. Upland disposal would present major problems in that there is a floodway on either side of the river separated from developed areas by levees. Upland disposal would have to be behind these levees which can be many miles from the river banks.
A-107
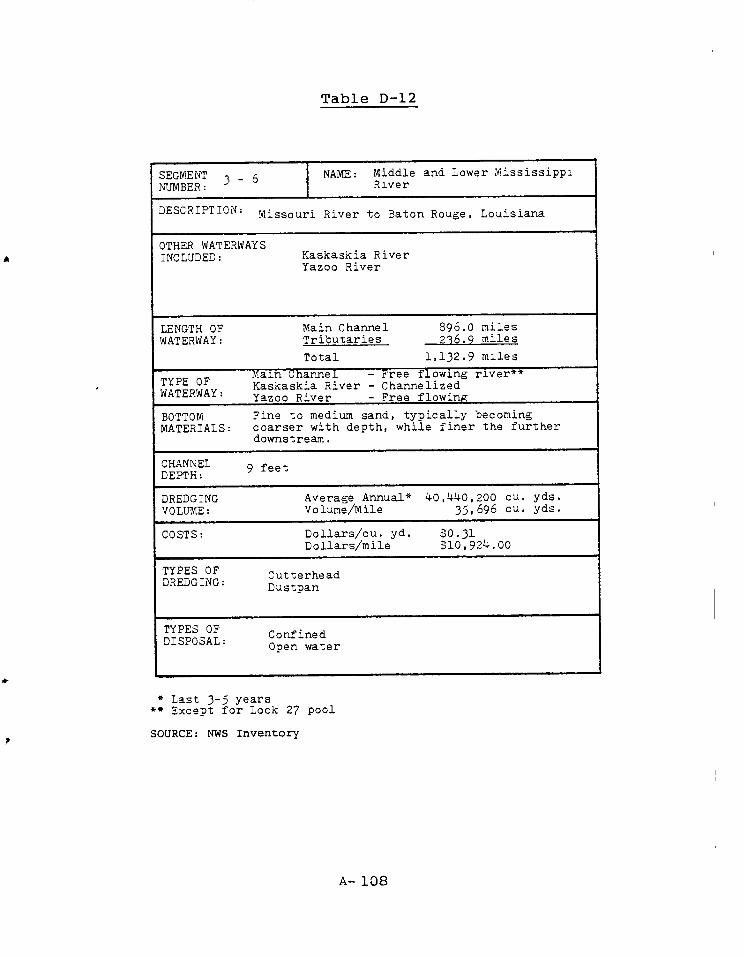
Table D-12
SEGMENT 3 - 6 NAME: Middle and Lower Mississippi NUMBER: River
DESCRIPTION: Missouri River to Baton Rouge, Louisiana
OTHER WATERWAYS INCLUDED: Kaskaskia River
Yazoo River
LENGTH OF Main Channel 896.0 miles WATERWAY: Tributaries 236.9 miles
Total 1,132.9 miles
Main Channel - Free flowing river** TYPE OF Kaskaskia River - Channelized WATERWAY: Yazoo River - Free flowing .
BOTTOM Fine to medium sand, typically becoming MATERIALS: coarser with depth, while finer the further
downstream.
CHANNEL 9 feet DEPTH:
DREDGING Average Annual* 40,440,200 cu. yds. VOLUME: Volume/Mile 35,696 cu. yds.
COSTS: Dollars/cu. yd. $0.31 Dollars/mile $10,924.00
TYPES OF Cutterhead DREDGING: Dustpan
TYPES OF Confined DISPOSAL: Open water
* Last 3 - 5 years ** Except for Lock 27 pool
SOURCE: NWS Inventory
A- 108
2. The Extent that Environmental Considerations Act as a Constraint on Dredging
(a) Dredging Methods. There are at present no constraints on the methods of dredg-ing based on environmental constraints.
(b) Disposal of Dredge Material. Current- ly, environmental considerations are not a constraint on the disposal of dredge material. However, the enaction of environmental regulations and the consequent concern of the COE with the problems of dredge material disposal are spurs to reduce quantities wherever possible.
3. Possible Future Environmental Constraints. Increasing concern with environmental problems associated , with dredging and the threat of legal action to curtail dredging was a major spur to the setting-up of the GREAT III program covering these segments down to the mouth of the Ohio River.
The major concern, as identified by the GREAT III Preliminary Reconnaissance Report (GREAT III, 1979), is that decisions on the placement locations of dredged material may be affected by the impacts to the other river resources such as fish and wildlife habiatats and recrea-tional, industrial development, and cultural sites. Loca-tion is further limited by dredge plant capacity volume of material displaced, and placement technology for benefic-ial uses of dredged material for commercial, industrial or recreational purposes. The legality of any proposed beneficial use of dredged material must also be determined.
Furthermore, it is pointed out that while some adverse impacts of dredging may be reduced by implementa-tion of recommendations presented in the reports of the recently completed Dredged Material Research Program directed by the U.S. Army Waterways Experiment Station, Vicksburg, Mississippi, all real and perceived adverse impacts to the other river resources will not be eliminated.
Future EPA regulations with regard to the Clean Water Act Amendments could result in requirements for
A-109
bioassay tests both at the dredging site and disposal site. Though available information does indicate that the river sediments contain a high level of pollutants, and the continual flushing actions of floods are likely to prevent significant accumulations of pollutants in the channel, some samples are likely to fail a bioassay. This could either result in delays in dredging at a particular site, risking closure of the river, or requirements for upland disposal at a higher cost.
However, experience elsewhere would indicate that it is possible that existing threats of increased environ-mental constraints and their possible enaction may spur technological and operational solutions which would actually decrease the overall costs of dredging. In par-ticular, they could spur measures to decrease dredging quantities while maintaining reliability of navigation, replacement of obsolete equipment, and beneficial uses of dredge material.
Further concern has been expressed at the envi-ronmental impacts of river training works. The GREAT III Preliminary Reconnaissance Report (GREAT III, 1979) states:
Channel regulating structures (i.e., dikes and revetments) in the Middle Mississippi River have resulted in alteration of valu-able fish and wildlife habitat by modifica-tion of water surface, changes in water velocities, changes in bed scouring and sedimentation patterns, and alteration of riparian habitat.
As a result, the GREAT III program plans to:
(a) Determine the effects of existing chan-nel regulating structures of fish and wildlife.
(b) Identify habitat enhancement features * of various structural modifications.
A study of the modification of regulating struc-tures is proposed in which a dike field(s) will be select-ed for modification and study. Proposed modification of regulating structures shall include notching by removal of existing rock in patterns or other changes in design. Physical and biological data shall be acquired efore and after dike modification.
A-110
Whether the outcome of these studies could lead to significant modification of the structure so as to alter dredging practices in the future is obviously not established. However, the main emphasis on modification of regulating structures to date has been on notching, which does not impact channel dredging.
(d) Segments 7, 8, 25, 26 - Missis-sippi River
1. General. This section of the river is the deep draft access to the Ports of New Orleans and Baton Rouge. Dredging, especially below New Orleans, is on a much larger scale than above Baton Rouge. Hopper dredges are widely in addition to the dustpan dredges. The main channel below New Orleans is the only waterway segment reporting agitation dredging (COE, 1976 b). Channel and dredging information are summarized in Tables D-13, D-14, and D-15.
In the river channel, maintenance dredging is carried out at nine crossings. In addition, a section west of the river centerline in Baton Rouge, known as Baton Rouge Front, is regularly dredged. Both dustpan and hopper dredges are used at these locations and disposal is in open water mainly at the side of the channel. There are reports that delays in dredging lead to reduced chan-nel depth. However, ships are reported to be able to negotiate the channel fully laden with some loss of steerage.
The other major sections are the Southwest and South Passes to the Gulf. In 1976 it was reported (COE, 1976 b) that channels in the Southwest Pass had shoaled at an unprecedented rate during the past three years neces-sitating frequent, prolonged and diversified dredging ac-tivities to reestablish safe navigation channels. Dredged material from the Southwest Pass is disposed of three ways: diked disposal areas; confined on marshland (a small amount); and in open water in the River and the East and West Bays. Dredged material from the South Pass is placed on either side of the channel to restore the narrow banks.
A-111

Table D-13
SEGMENT 7 and 8 NAME: Mississippi River NUMBER:
DESCRIPTION: Baton Rouge (mile 253) to Mouth of Passes and MRGO
OTHER WATERWAYS Various channels in New Orleans and INCLUDED: vicinity
LENGTH OF Main Channel 231.9 miles WATERWAY: Tributaries 97.1 miles
Total 329.0 miles
TYPE OF Free flowing river, with locks on some side WATERWAY: channels
BOTTOM MATERIALS: Sand and silt
CHANNEL Main Channel - 40 feet DEPTH: Other Channels - 12 to 36 feet
DREDGING Average Annual* 53,434,300 cu. yds. VOLUME: Volume/Mile 162,414 cu. yds.
COSTS: Dollars/cu. yd. $0.42 Dollars/mile $68,714.00
TYPES OF Hopper DREDGING: Clamshell
Cutterhead Dustpan
TYPES OF Open water DISPOSAL: Agitation
Confined Ocean
* Last 3-5 years
SOURCE: NWS Inventory
A- 112
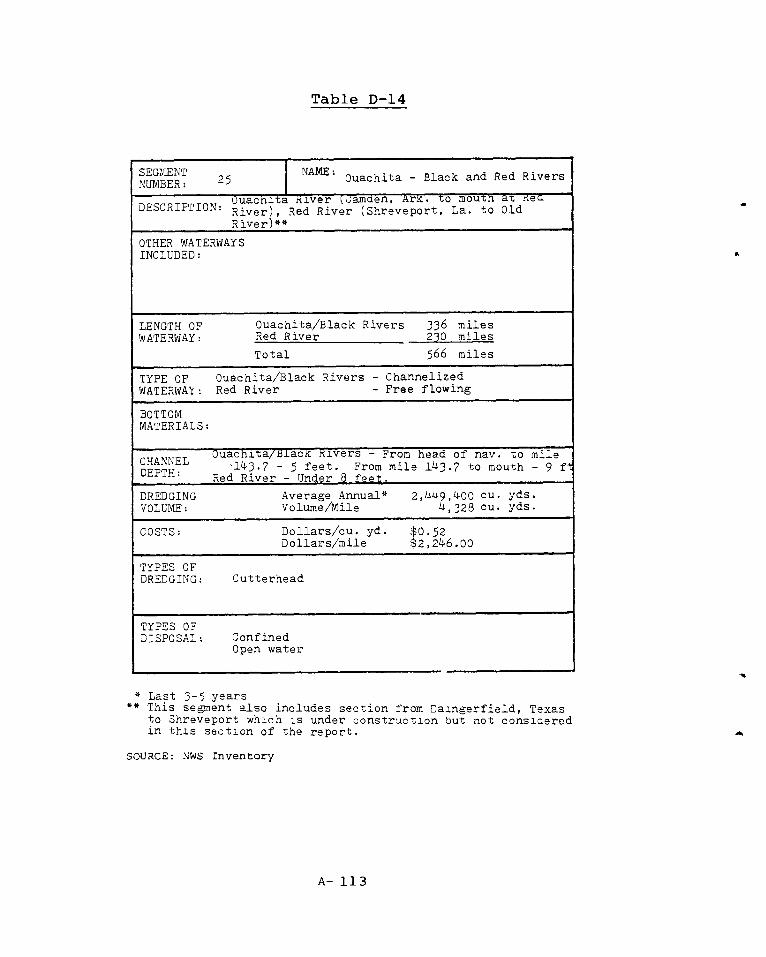
Table D-14
SEGMENT NAME: NUMBER: 25
Ouachita - Black and Red Rivers
Ouachita River (Gamden, Ark. to moutn at Rea DESCRIPTION: . River), Red River (Shreveport, La. to Old
River)**
OTHER WATERWAYS INCLUDED:
LENGTH OF Ouachita/Black Rivers 336 miles WATERWAY: Red River 230 miles
Total 566 miles
TYPE OF Ouachita/Black Rivers - Channelized WATERWAY: Red River - Free flowing
BOTTOM MATERIALS:
Ouachita/Black Rivers - From head of nav, to mile CHANNEL - 143.7 - 5 feet. From mile 143.7 to mouth - 9 ft DEPTH: Red River - Under 8 feet.
DREDGING Average Annual* 2,449,400 cu. yds. VOLUME: Volume/Mile 4,328 cu. yds.
COSTS: Dollars/cu. yd. $0.52 Dollars/mile $2,246.00
TYPES OF DREDGING: Cutterhead
TYPES OF DISPOSAL: Confined
Open water
* Last 3 - 5 years ** This segment also includes section from Daingerfield, Texas
to Shreveport which is under construction but not considered in this section of the report.
SOURCE: YWS Inventory
A- 113

SEGMENT NUMBER:
NAME: Old and Atchafalaya Rivers, Mississippi River 26
L'ESCRIPTION: Red River to Gulf
OTHER WATERWAYS INCLUDED: Berwick Lock
TYPE OF WATERWAY:
Channelized
BOTTOM MATERIALS:
Main cnannel from Red River to Morgan City - 12 ft. CHANNEL DEPTH: Main channel from Morgan City to Gulf
- 20 ft. Berwick Lock - 5 ft.
DREDGING VOLUME:
Average Annual* Volume/Mile
5,221,900 cu. yds. 31,083 cu. yds.
Dollars/cu. yd.. Dollars/mile
$0.27 $8,392.00
COSTS:
TYPES OF DREDGING: Cutterhead
TYPES OF DISPOSAL: Confined
Open water
LENGTH OF WATERWAY:
160.0 miles 8.0 miles
168.0 miles
Main Channel Tributaries
Total
Table D-15
* Last 3-5 years
SOURCE: NWS Inventory
A- 114
2. The Extent that Environmental Considerations Act as a Constraint on Dredging. The main constraint re-ported is the requirement for bioassay tests under the Ocean Dumping Act for dredging in the passes. This is time consuming, expensive and results in delays in dredg-ing when either the material at the dredging site or at the disposal site fails the test. It was reported that fines (fine sediment particles) which were not necessarily polluted were the cause of the problem. Though it was reported that lack of dredging in the main river had been delayed to the point of reducing draft below the authoriz-ed depth, this is not reported to be due to environmental constraints.
3. Methods of Satisfying Environmental Constraints. It is possible that the bioassay test will be replaced by other criteria for allowing dredging and selecting dredging sites that more accurately reflect environmental impacts. It is, of course, not clear whether such criteria would be more or less restrictive on dredging.
Alternatively, diked disposal sites for dredged material may have to be used more frequently. This is likely to lead to a shortage of sites and greater trans-portation distances, increasing the cost of dredging.
4. Possible Future Changes in Environmental Constraints. The most likely future change is that the Clean Water Act will be interpreted to require the same constraints on river disposal as on ocean dumping. This would require bioassay tests and could effectively prevent open water disposal. On land, disposal will not only increase costs, but will present considerable difficulties in finding suitable sites and having them funded under the required cost sharing arrangements.
Further environmental regulations related to dredging are currently administered by federal agencies. It is proposed to hand over regulating powers to state agencies and it is not known how they will act. However, it must be pointed out that these sections of the river lie entirely within the State of Louisiana whose economy is heavily dependent on the Ports of New Orleans and Baton Rouge. The State is therefore unlikely to take action which threatens these ports without a sound basis.
A-115

5. Port of Baton Rouge (ADL, 1974 b). Baton Rouge is located on the Mississippi River, approximately 100 river miles above the Port of New Orleans. Predomin-antly a manufacturing center, Baton Rouge has more than 150 industrial plants with about two out of every three local workers being employed by the petrochemical industry. Exxon's Baton Rouge -Eacility is the largest oil refinery in the world, with a capacity of 434,000 barrels/ day. The stretch of river from Baton Rouge to New Orleans is under various stages of industrial development and is referred to as the "petrochemical gold coast", hosting many established companies with riverside shipping facilities.
The COE is responsible for maintaining the project depth to within 100 feet of the docks. In the vicinity of Baton Rouge, the COE does a minimum of dredg-ing because the flow of the river is successful in keeping the navigable channel deeper than 40 feet. The COE is also responsible for a turning basin which lies close to the Exxon docks, and little, if any, dredging has been needed to maintain it at the project depth.
Due to both the rapid current of the river and the location of marine facilities on the channel-side bank, the volume of nonfederally sponsored maintenance dredging has been relatively minor. Due to unusually high river conditions in 1973, the Port Commission contracted for approximately 80,000 cubic yards of material to be removed from beneath and behind the west bank docks. This maintenance represents the first dredging required by the Commission in 20 years, and local authorities foresee no need for a periodic maintenance program.
Private sector maintenance dredging estimates were not available for each of the several marine facili-ties. However, almost without exception, the location of an industrial facility on the channel, or deep side, of the river is in itself enough to insure that little or no annual maintenance dredging will be required on outside berths. In the Baton Rouge-New Orleans segment of the river, most of the industrial facilities are located on the channel side where the flow of the river maintains a minimum river depth of 36 to 40 feet at dockside.
In most industrial facilities, what annual main-tenance dredging is required is usually confined to inside berths. This was confirmed by Exxon, which has had to
A-116

perform maintenance dredging only twice, once in 1945 and once in 1968. Average material removed was less than 100,000 cubic yards. On the other hand, Exxon annually contracts for removal of approximately 60,000-80,000 cubic yards of material from its inside berths. Dredged material is disposed of in mid-channel at a location designated by the COE.
Other facilities which are known to require some annual dredging are owned by Kaiser, Dow Chemical, Gulf States Utilities, and Shell Chemical. The annual volume of maintenance dredging along the Mississippi River within a 50-mile radius of Baton Rouge is estimated to be 1.5 million cubic yards per year. However, dredging work has grown only marginally over the last ten years, at about 3-5% per year.
Such dredging results in a combination sand/silt material, which is generally deposited in mid-channel dis-posal areas designated by the COE. No major disposal problems have arisen within the Baton Rouge area. Pipe-line dredges service Baton Rouge and employ either cutter or jet-type heads, depending on the situation, with 8, 10, and 12-inch dredges commonly used and a 16-inch dredge used only occasionally.
Projected future non-Federal dredging require-ments for a 50 mile radius around Baton Rouge are sum-marized in Table D-16.
Disposal areas in the segment between Baton Rouge and New Orleans are very limited. The adjacent land is high and either very productive farmland or valuable for industrial development, which is proceding rapidly. Con-sequently, the dredged material is not needed for fill,and purchasing land for disposal areas is very costly.
6. Port of New Orleans (ADL, 1974 b). The Port of New Orleans is on both banks of the Mississippi River from Mile 127 AHP to the mouth of the passes; the Inner Harbor Navigation Canal (IH NC) is 5.5 miles long; the Mississippi River-Gulf Outlet (MRGO) is 7 miles from its junction with the Inner Harbor Navigation Canal to Bayou Bienvenue; and Harvey Canal is 5.5 miles long.
The Port of New Orleans is a complex conglomerate of public and private facilities lining the Mississippi
A-117
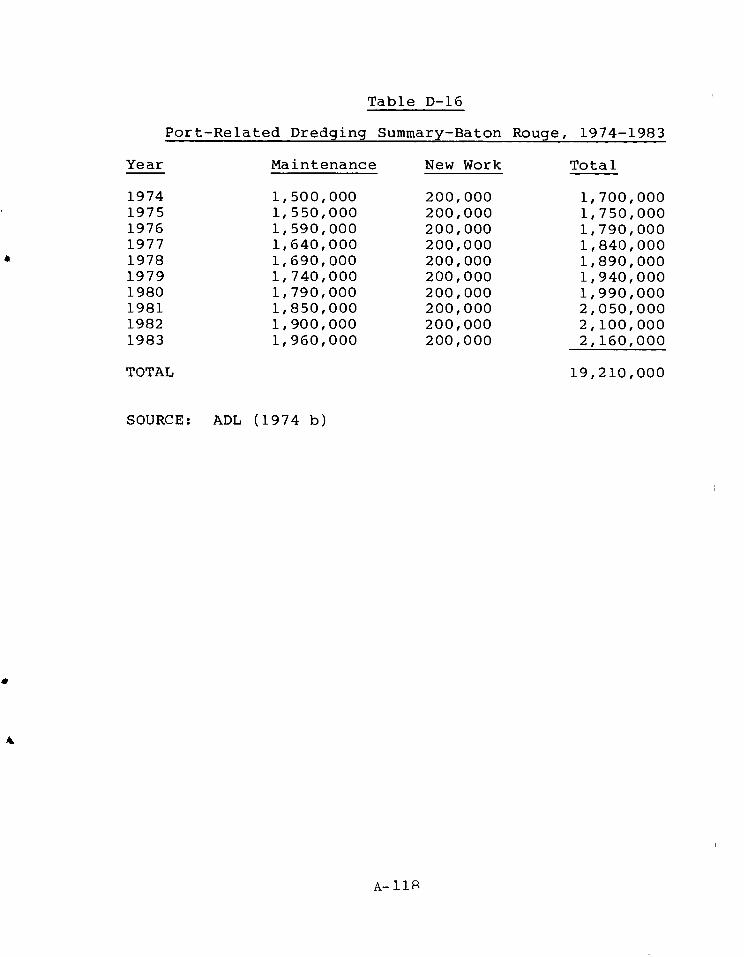
Table D-16
Port-Related Dredging Summary-Baton Rouge, 1974-1983
Year Maintenance New Work Total
1974 1,500,000 200,000 1975 1,550,000 200,000 1976 1,590,000 200,000 1977 1,640,000 200,000 1978 1,690,000 200,000 1979 1,740,000 200,000 1980 1,790,000 200,000 1981 1,850,000 200,000 1982 1,900,000 200,000 1983 1,960,000 200,000
TOTAL
1,700,000 1,750,000 1,790,000 1,840,000 1,890,000 1,940,000 1,990,000 2,050,000 2,100,000 2,160,000
19,210,000
SOURCE: ADL (1974 b)
A- 118

River and a number of adjoining canals. It encompasses Jefferson, Orleans, and St. Bernard parishes (counties). Jurisdiction over the Port is exercised by the Dock Board, which owns or controls almost all public facilities in the Port.
Table D-17 is a listing of the principal dredging projects including maintenance carried out by the Dock Board during fiscal years 1965-1973. As of 1974 the Board did not own any dredging equipment. The 1965 and 1966 figures reflect dredging performed by two 18-inch dredges owned at that time by the Port. Subsequently, those dredges were transferred to private industry.
The Dock Board is responsible for dredging 100 feet from the face of the wharves. Beyond that point, maintenance of project depths is the responsibility of the COE. The Board dredges to meet federal project depths. In actual practice, dredging is to a depth necessary for ship dockings. Dredging in the Port of New Orleans is essentially maintenance oriented. The dredging required within any given time frame is a function of silt burden in the river, total water flow, and back water or eddy-induced deposits.
In fiscal years 1970-1972, new dredging of the mooring areas at Berths 2 through 6 was performed in the tidewater area to remove shoaling in the IH NC immediately north of the MRGO. This dredging was in conjunction with the building of the France Road Terminal Container-Ship Berth Facilities. Some 681,000 cubic yards of highly organic material was removed at a cost of t290,000 (at an estimated cost per yard of 43 cents). Material was dis-posed of at a nearby land disposal site. Hydraulic cut-terhead and pipeline equipment was used. Dredging at France Road Terminal was done in conjunction with the COE maintenance project.
Maintenance dredging at both the Mississippi River and tidewater area (IH NC) is performed to provide sufficient wharfside water depth to enable vessels to dock. Hydraulic cutterhead and pipeline equipment is currently used. The disposal practice for the river gen-erally is to redeposit the material in open flowing water and let the current carry it out. The same practice is used for the canal by pumping material out to the center of the river, but no maintenance dredging of the tidewater area has been required in recent years. Future dredging
A-119

S.
Table D-17
New Orleans Dredging Summary, 1965-1975
New Work
Volume* Unit Cost Type Spoil Year Project (cubic Yards) Cost* (cubic yards) Dredge Disposal
1970 (France 227,000 $ 96,000 $0.425 Hydraulic Ind. fill 1971 Road Term. 390,000 167,000 0.425 Hydraulic Ind. fill 1972 Berths 1-6) 64 000 27,000 0.425 Hydraulic Ind. fill
TOTAL 681,000 $ 290,000 $0.425
Maintenance
Volume Unit Cost Type Spoil Year (cubic Yards) Cost (cubic yards) Dredge Disposal
1965 1,204,500 $ 348,955 $0.29 Hydraulic (Redeposited 1966 1,170,200 390,959 0.33 Hydraulic in river) 1967 1,555,000 390,420 0.25 Hydraulic
I. 1968 2,000,000 448,440 0.22 Hydraulic n 1969 2,150,000 492,579 0.23 Hydraulic " 1970 2,000,000 460,510 0.25 Hydraulic .. 1971 2,500,000 632,757 0.25 Hydraulic ., 1972 2,200,000 552,817 0.25 Hydraulic II 1973 3,900 000 1,006,586 0.25 Hydraulic
TOTAL 18,770,500 $4,724,000
*Allocated to each year from total of 681,000 cubic yards, $290,000
SOURCE: ADL (1974 b)
$0.26

in the canal may require disposal sites, which are dwindl-ing in number, thus causing a constraint in dredging activity.
The Port experiences a high siltation rate,which is a direct result of known river burden (approximately 800,000 tons of silt pass through the Port on an average day and there is a 15% bed movement). Such a siltation rate makes the redeposit of dredged material into the river environmentally acceptable. Because flood control projects up-river constrain the natural removal of silt over the years, dredging requirements have been increas-ing. Maintenance dredging between fiscal year 1965 and 1972 averaged 1.85 million cubic yards and $465,000 per year, at an average unit cost of 26 per cubic yard. The unit cost for these same years ranged from 230 to 330, the quantity ranged from 1.2 to 2.5 million, and the total cost ranged from $349,000 to $633,000. In fiscal year 1973, the Port dredged almost 4 million cubic yards at a unit cost of 250, amounting to an expenditure of just over $1 million. The 1973 data are an extreme case due to flood conditions.
(e) Segment 9 - Illinois Waterway
1. General. The Illinois River system includes both the channelized Illinois and Des Plaines River as well as the Chicago Sanitary and Ship Canal and the Calumet-Sag Channel and Calumet River. The primary pur-pose of constructing the canals was to carry sanitary and industrial waste from the Greater Chicago area away from Lake Michigan, effectively reversing the natural flow of rivers in Chicago. Dredging information concerning the rivers is summarized in Table D-18.
The major means of dredging is with cutterhead dredges, with some clamshell dredging. The major sites for dredging are the deposit banks at bends in the river, downstream of locks, and alluvial deposits at tributary confluences. Records over the last ten years indicate that dredging has been concentrated in certain stretches of the waterway, and 22 sites are located in the Chicago District section above Mile 80 (COE, 1974).
Material disposal sites are located along the length of the waterway on land. However, most of these
A-121
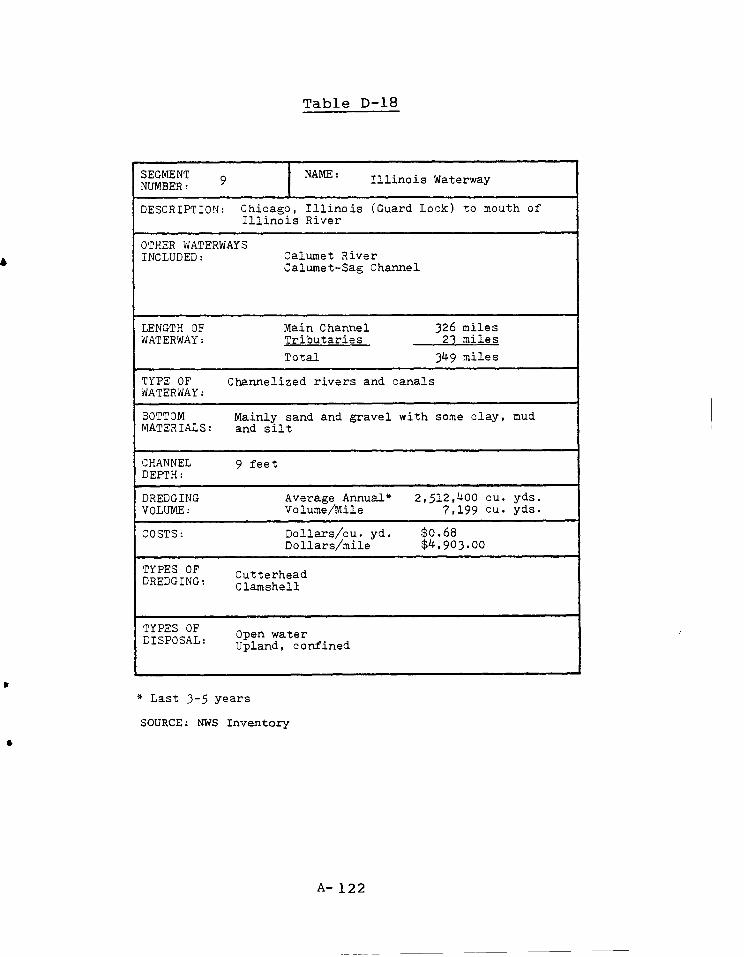
DESCRIPTION: Chicago, Illinois (Guard Lock) to mouth of Illinois River
9 SEGMENT NUMBER:
OTHER WATERWAYS INCLUDED: Calumet River
Calumet-Sag Channel
TYPE OF WATERWAY:
Channelized rivers and canals
BOTTOM Mainly sand and gravel with some clay, mud MATERIALS: and silt
DREDGING VOLUME:
Average Annual* Volume/Mile
2,512,400 cu. yds. 7,199 cu. yds.
Dollars/cu. yd. Dollars/mile
$0.68 $4,903.00
COSTS:
TYPES OF DREDGING: Cutterhead
Clamshell
TYPES OF DISPOSAL: Open water
Upland, confined
Illinois Waterway NAME:
LENGTH OF WATERWAY:
Main Channel Tributaries
Total
326 miles 23 miles
349 miles
CHANNEL DEPTH:
9 feet
Table D-18
* Last 3 - 5 years
SOURCE: NWS Inventory
A- 122

sites have not been used for many years; many are over-grown with relatively mature vegetation and some have been developed. The practice is to dispose of material at the site nearest the dredging operation. In 1976 it was reported (COE, 1976) that material is sometimes deposited in or near the river shoreline. Below Mile 80, in the St. Louis District, open water disposal is reported.
2. The Extent that Environmental Considerations Act as a Constraint on Dredging. The extent to which en-vironmental considerations act as constraints on dredging is unclear. It is acknowledged they have required upland disposal in the Chicago District in diked confinement areas. There would be problems in meeting Illinois water quality regulations due to high levels of suspended solids, zinc, and lead in the effluent from disposed sites (COE, 1974). Waivers are currently being granted.
3. Methods of Satisfying Environmental Con-straints. The following alternative methods of dredge disposal are indicated in the Chicago District, Illinois Waterway Maintenance Environmental Impact Statement (COE, 1974): deposition of material on the river side of the levee; swamp filling; slough filling; farmland disposal; island or shoreline building, remote or central placement; and open water disposal. While the advantages of each are discussed both in general and on a site-specific basis, there is no indication of a preferred method of satisfying environmental constraints.
There is no reference to methods of reducing dredging quantities by reduced depth of cut, discrete reductions of channel dimensions, or selected delays in the commencement of maintenance dredging such as are practiced in the Upper Mississippi.
4. Possible Future Changes in Environmental Constraints. Future changes could include strict enforce-ment of stringent water quality regulations by the State of Illinois or their relaxation. Regulations could in-clude requirements which effectively resulted in the remote disposal of dredge material.
It is more likely that environmental constraints will be developed which will allow the disposal of dredge material in an environmentally satisfactory, if not bene-ficial way in the vicinity of the dredging sites.
A-123
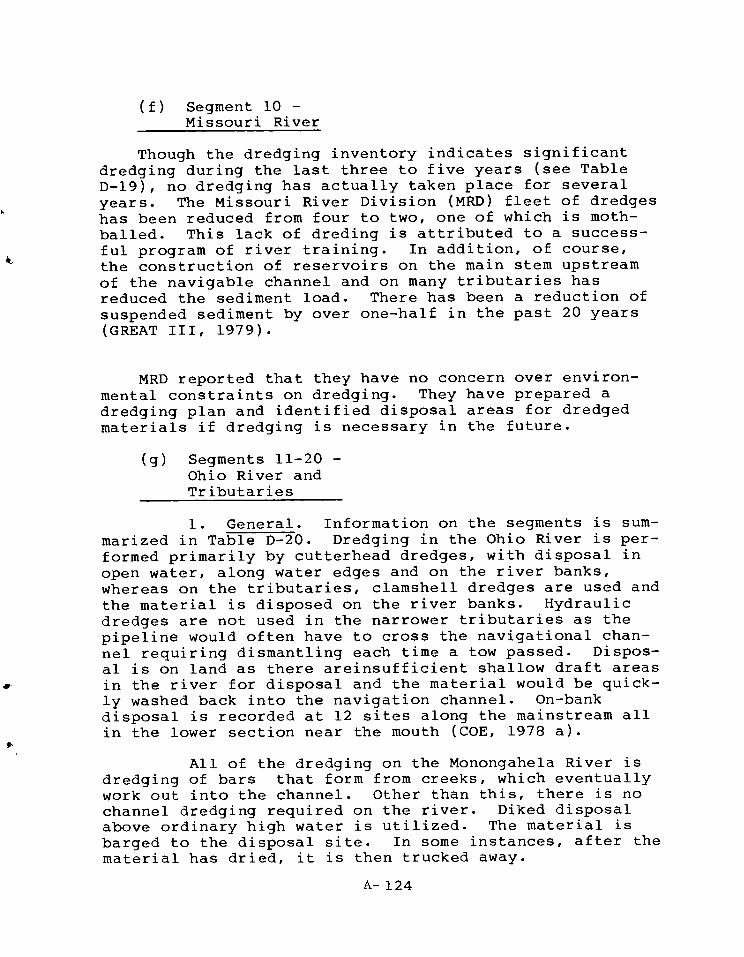
(f) Segment 10 - Missouri River
Though the dredging inventory indicates significant dredging during the last three to five years (see Table D-19), no dredging has actually taken place for several years. The Missouri River Division (MRD) fleet of dredges has been reduced from four to two, one of which is moth-balled. This lack of dreding is attributed to a success-ful program of river training. In addition, of course, the construction of reservoirs on the main stem upstream of the navigable channel and on many tributaries has reduced the sediment load. There has been a reduction of suspended sediment by over one-half in the past 20 years (GREAT III, 1979).
MRD reported that they have no concern over environ-mental constraints on dredging. They have prepared a dredging plan and identified disposal areas for dredged materials if dredging is necessary in the future.
(g) Segments 11-20 - Ohio River and Tributaries
1. General. Information on the segments is sum-marized in Table D-20. Dredging in the Ohio River is per-formed primarily by cutterhead dredges, with disposal in open water, along water edges and on the river banks, whereas on the tributaries, clamshell dredges are used and the material is disposed on the river banks. Hydraulic dredges are not used in the narrower tributaries as the pipeline would often have to cross the navigational chan-nel requiring dismantling each time a tow passed. Dispos-al is on land as there areinsufficient shallow draft areas in the river for disposal and the material would be quick-ly washed back into the navigation channel. On-bank disposal is recorded at 12 sites along the mainstream all in the lower section near the mouth (COE, 1978 a).
All of the dredging on the Monongahela River is dredging of bars that form from creeks, which eventually work out into the channel. Other than this, there is no channel dredging required on the river. Diked disposal above ordinary high water is utilized. The material is barged to the disposal site. In some instances, after the material has dried, it is then trucked away.
A-124
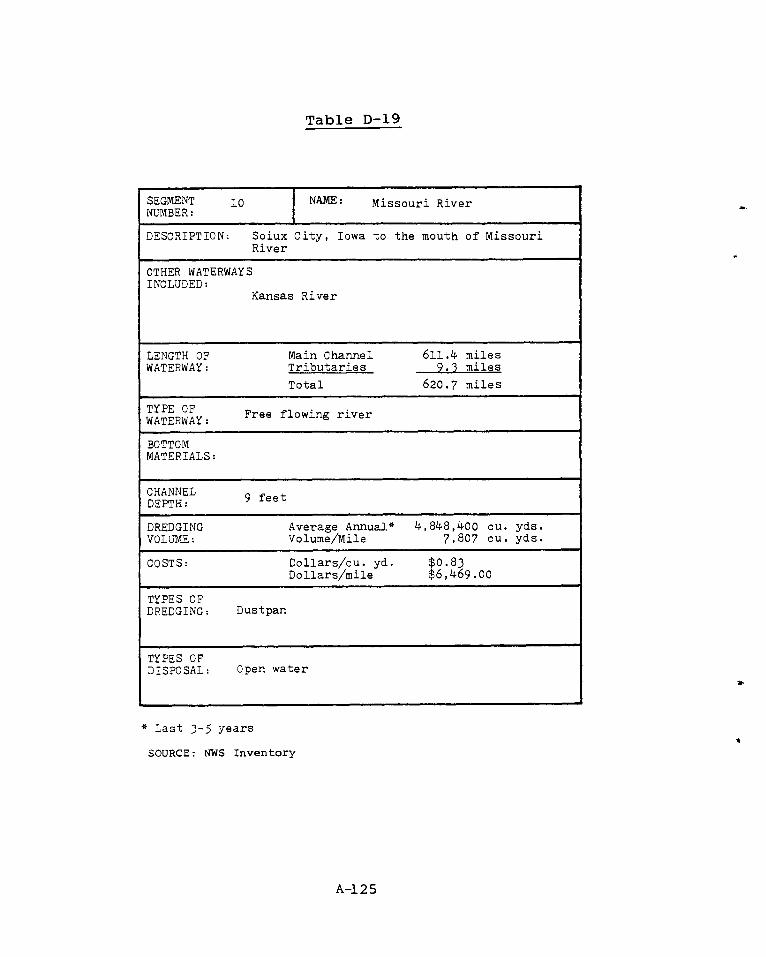
LENGTH OF WATERWAY:
Main Channel Tributaries
Total
611.4 miles 9.3 miles
620.7 miles
CHANNEL DEPTH: 9 feet
Table D-19
10 NAME: Missouri River SEGMENT NUMBER:
DESCRIPTION: Soiux City, Iowa to the mouth of Missouri River
OTHER WATERWAYS INCLUDED:
Kansas River
TYPE OF WATERWAY: Free flowing river
BOTTOM MATERIALS:
DREDGING VOLUME:
Average Annual* Volume/Mile
4,848,400 cu. yds. 7,807 Cu. yds.
COSTS: Dollars/cu. yd. Dollars/mile
$0.83 $6,469.00
TYPES OF DREDGING: Dustpan
TYPES OF DISPOSAL: Open water
* Last 3 - 5 years
SOURCE: WS Inventory
A-125
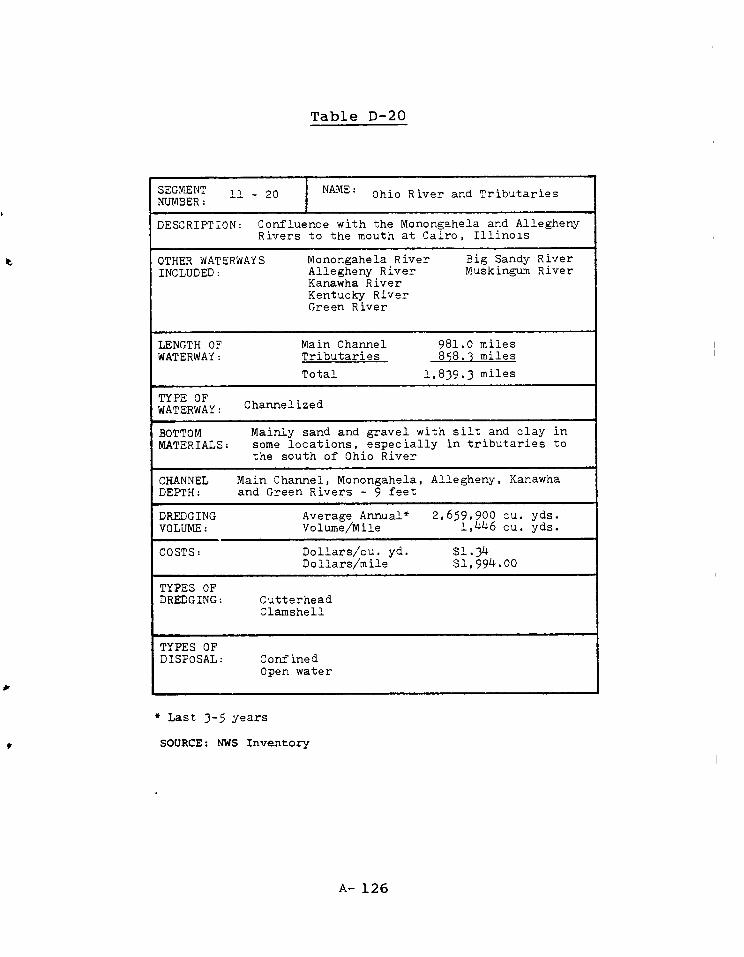
Table D-20
SEGMENT 11 - 20 NAME: Ohio River and Tributaries NUMBER:
DESCRIPTION: Confluence with the Monongahela and Allegheny Rivers to the mouth at Cairo, Illinois
OTHER WATERWAYS Monongahela River Big Sandy River INCLUDED: Allegheny River Muskingum River
Kanawha River Kentucky River Green River
LENGTH OF Main Channel 981.0 miles WATERWAY: Tributaries 858.3 miles
Total 1,839.3 miles
TYPE OF WATERWAY: Channelized
BOTTOM Mainly sand and gravel with silt and clay in MATERIALS: some locations, especially in tributaries to
the south of Ohio River
CHANNEL Main Channel, Monongahela, Allegheny, Kanawha DEPTH: and Green Rivers - 9 feet
DREDGING Average Annual* 2,659,900 cu. yds. VOLUME: Volume/Mile 1,446 cu. yds.
COSTS: Dollars/cu. yd. $1.34 Dollars/mile $1,994.00
TYPES OF DREDGING: Cutterhead
Clamshell
TYPES OF DISPOSAL: Confined
Open water
* Last 3 - 5 years
SOURCE: NWS Inventory
A— 126
2. Methods of Satisfying Environmental Con-straints. A private dredging contractor on the Kanawha River is using dredged material as a source of commercial sand and gravel. Although there are difficulties for ex-panding this method of disposal, a considerably greater quantity could be used in this way (COE, 1975 b). How-ever, neither the Draft Environmental Statements for com-mercial sand and gravel dredging operations on the Ohio River (COE, 1978 b) nor on the Allegheny River (COE, 1978 c) offer maintenance dredging as an alternative source of sand and gravel.
Land disposal, island and shoreline building and remote disposal of dredged material are considered as al-ternatives for dredged material disposal (COE, 1975 a; COE, 1978 a).
3. Possible Future Changes in Environmental Con-straints. There is no reference to future changes in en-vironmental constraints,but the following are possible:
(a) Application of bioassay tests or other equivalent tests on dredging sites or open water disposal sites, delaying dredging and limiting disposal options.
(b) Increased restrictions on open water disposal.
(c) Strict application of water quality standards limiting open water disposal and requiring treatment of effluent from diked disposal sites.
(d) Pressure to limit dredging quantities and to find beneficial uses for dredged material.
(h) Segment 21 - - Cumberland River
1. General. Dredging is reported at 16 sites along the river (COE, 1975 c). Maintenance dredging is usually performed at an average of three different sites per year. However, the need for dredging is becoming greater due to the increasing rate of siltation and the age of the reservoir. Dredging information is summarized in Table D-21.
A-127
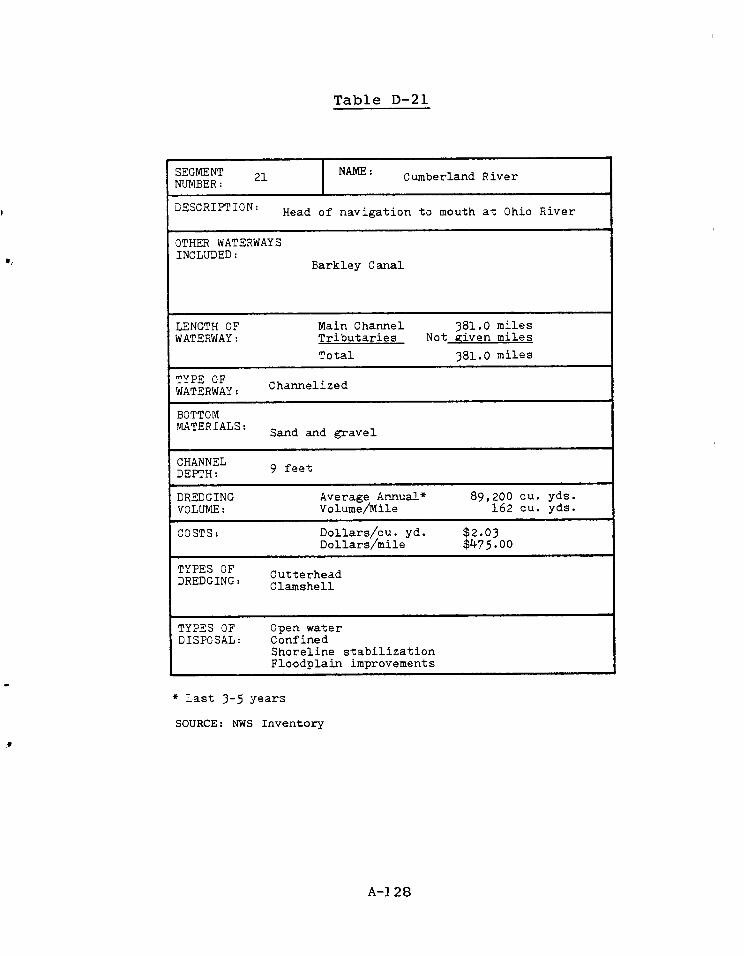
CHANNEL DEPTH: 9 feet
Table D-21
21 NAME: Cumberland River SEGMENT NUMBER:
DESCRIPTION: Head of navigation to mouth at Ohio River
OTHER WATERWAYS INCLUDED:
Barkley Canal
LENGTH OF WATERWAY:
Main Channel 381.0 miles Tributaries Not given miles
Total 381.0 miles
TYPE OF WATERWAY: Channelized
BOTTOM MATERIALS: Sand and gravel
DREDGING Average Annual* 89,200 Cu. yds. VOLUME: Volume/Mile 162 Cu. yds.
COSTS: Dollars/cu. yd. $2.03 Dollars/mile $475.00
TYPES OF DREDGING: Cutterhead
Clamshell
TYPES OF DISPOSAL:
Open water Confined Shoreline stabilization Floodplain improvements
* Last 3-5 years
SOURCE: NWS Inventory
f
A-128
Open water disposal is indicated at eight sites. Disposal on land or islands is reported at four points and is carried out within diked areas. Disposal at other points is along the shore or by islands.
Some dredged material is used for shoreline stabilization and floodplain improvements (COE, 1975 c).
2. The Extent that Environmental Considerations Act as a Constraint on Dredging. There is no indication that environmental considerations act as a constraint on dredging.
3. Possible Future Changes in Environmental Con-straints. See previous section, (g) 3.
(i) Segments 22 & 23 - Tennessee River
1. General. Dredging is reported at 15 sites and is proposed at a further four sites. Of the 15 sites, disposal at 7 sites is open water; behind islands at six (presumably in open water); and on land and on an island at one each. Disposal on land and on islands is in diked disposal areas. Dredging is carried out at two or three sites each year. Further information is summarized in Table D-22.
2. The Extent that Environmental Considerations Act as a Constraint on Dredging. There is no indication that environmental considerations act as a constraint on dredging.
3. Possible Future Changes in Environmental Constraints. See section (g) 3.
(j) Segment 24 - Arkansas, Verdigris, White and Black Rivers
1. General. Information on dredging in these rivers is summarized in Table D-23.
2. The Extent that Environmental Considerations Act as a Constraint on Dredging. The existence of numerous archaelogical sites along the Arkansas River is
A-129
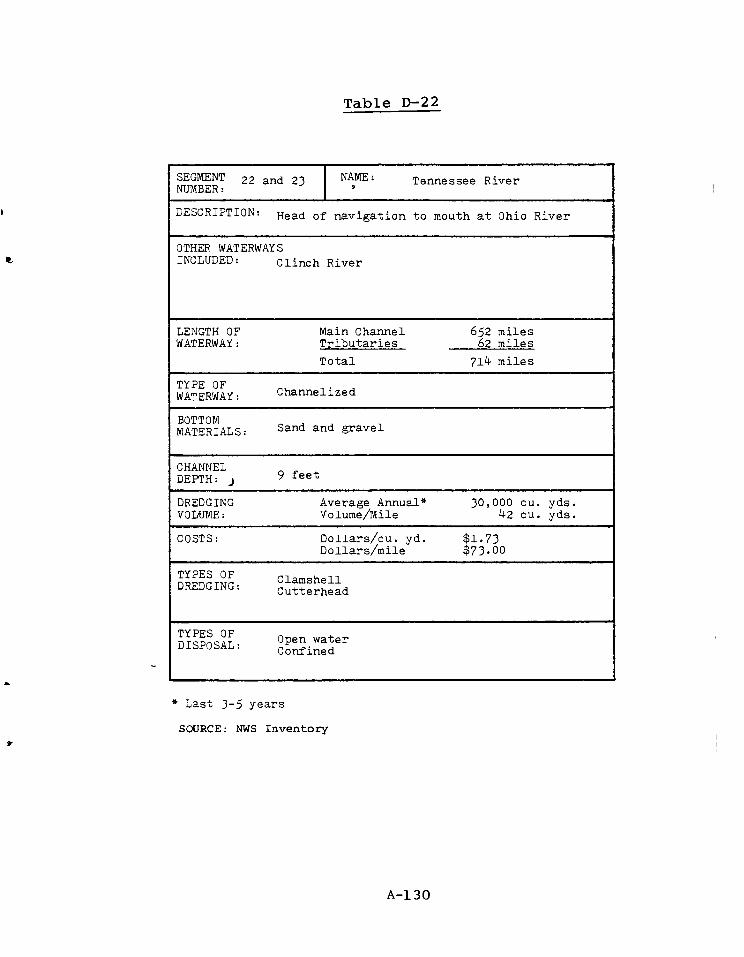
Table D-22
SEGMENT 22 and 23 NAME: Tennessee River NUMBER:
DESCRIPTION: Head of navigation to mouth at Ohio River
OTHER WATERWAYS INCLUDED: Clinch River
LENGTH OF Main Channel 652 miles WATERWAY: Tributaries 62 miles
Total 714 miles
TYPE OF WATERWAY: Channelized
BOTTOM MATERIALS: Sand and gravel
CHANNEL DEPTH: 9 feet j
DREDGING Average Annual* 30,000 cu. yds. VOLUME: Volume/Mile 42 cu. yds.
COSTS: Dollars/cu. yd. $1.73 Dollars/mile $73.00
TYPES OF Clamshell DREDGING: Cutterhead
TYPES OF Open water DISPOSAL: Confined
* Last 3-5 years
SOURCE: NWS Inventory
A-130

Table D-23
SEGMENT 24 NAME: Arkansas, Verdigris, White NUMBER: and Black Rivers
DESCRIPTION: Heads of navigation (Catoosa, Oklahoma and Newport, Ark.) to mouth at Mississippi.
OTHER WATERWAYS INCLUDED:
LENGTH OF Arkansas-Verdigris Rivers 437.8 miles WATERWAY: White and Black Rivers 264.8 miles
Total 702.6 miles
TYPE OF Arkansas-Verdigris Rivers - Channelized WATERWAY: White and Black Rivers - Free flowing
BOTTOM MATERIALS:
CHANNEL Arkansas-Verdigris Rivers - 9 feet DEPTH: White and Black Rivers - 5 feet
DREDGING Average Annual* 3,294,200 cu. yds. VOLUME: Volume/Mile 4,686 cu. yds.
COSTS: Dollars/cu. yd. $0.73 Dollars/mile $3,442.00
TYPES OF DREDGING: Cutterhead
TYPES OF DISPOSAL: Beach nouris hment
Confined
* Last 3 - 5 years
SOURCE: NWS Inventory
A-1 31
reported as a possible constraint on dredging. Under PL 93-291, the Department of Interior is directed to perform environmental assessments, but they have not done so. The COE has continued to issue dredging permits, leaving them-selves liable to court action.
All dredge disposal sites along the Arkansas River have to be approved by the Fish and Wildlife Service. There are several game refuges along the river which conflict with dredge disposal sites. One noted en-dangered species, the Bald Eagle, rests along the Arkansas River. The extent that this acts as a constraint on dredging is not described.
There are problems in locating disposal sites on dikes along the White River.
3. Possible Future Changes in Environmental Con-straints. The strict application of PL 93-291 could result in considerable delays in dredging and additional costs. These could be:
(a) delays while the presence of archaeo-logical artifacts is investigated at a particular dredging or disposal site.
(b) additional costs for special dredge material disposal procedures to save archaeological artifacts.
(c) additional costs for studies to locate archaeological sites and develop alter-native dredging and dredged material disposal techniques.
A recent COE directive has required the Corps to undertake environmental assessments of archaeological sites. It is estimated that 40 additional professional staff will be required, presumably for the whole SWD at an annual cost of $8 million. To date, there have apparently been no investigations, similar to those in Segment 1, of innovative techniques to reduce quantities of dredged material.
A -1 32
(k) Segments 27-30, 34 - GIWW West
1. General. A description of the waterways and associated dredging information may be found in Table D-24. Dredging along the, Gulf Intercoastal Waterway (GIWW) is with cutterhead and clamshell dredges with dredged material placed on land on either side of the canal (COE, 1976 c). Hopper dredges are used for harbor approaches and channels with open water and ocean disposal is used as well as confined disposal. Open water disposal is reported as declining with the increasing use of inland sites requiring longer haul distances. Both diked and undiked upland disposal areas are used.
It would appear that the main locations of sedi-ment deposition on the GIWW is at the junction of waterways.
2. The Extent that Environmental Consideration as a Constraint on Dredging. It is reported that the GIWW cannot be expanded to its authorized depth and width due to environmental constraints on dredging and problems of cost sharing. With regard to cost sharing, Louisiana has no interest in funding a project which will largely benefit Texas ports.
Bald Eagles, an endangered species, are reported to be present and a potential constraint in the vicinity of Morgan City. Sunken ships, presumably of historic interest, are reported to be a constraint at the mouth of the Trinity River. The mouth of the Trinity River also has over 250 archaeological sites, which correspond to the limits of the habitat of the Rangia Tribe. This was a prime source of food for this Indian tribe, which built their civilization around it. This implies the same con-straint under PL 93-291 as described for the Arkansas River, Segment 24.
Locating dredged material disposal areas for the GIWW in Texas is also reported as a constraint. Dredged material in the Corpus Christi area is chemically pol-luted; it has to be isolated and run off prevented.
No maintenance dredging has been done on the Baton Rouge Morgan City bypass between Port Allen and the Bayou Sorrel lock since the channel was completed in 1961, though it is in need of dredging (COE, 1976 c). This,
A-133

Table D-24
SEGMENT 27-30 , 34 NAME: Gulf Intracoastal Waterway NUMBER: (GTWW) West
DESCRIPTION: New Orleans, Louisiana to Brownsville, Texas
OTHER WATERWAYS Baton Rouge - Morgan City Bypass INCLUDED: Houston Ship Canal
Vermillion River Calcasieu River and Pass Various channels along route
LENGTH OF Main Channel miles WATERWAY: Tributaries miles
Total 1,686 miles
TYPE OF WATERWAY: Canal, harbor approaches
BOTTOM MATERIALS:
CHANNEL GIWW - 12 feet DEPTH: Other waterways - various
DREDGING Average Annual* 61,608,400 cu. yds. VOLUME: Volume/Mile 36,541 cu. yds.
COSTS: Dollars/cu. yd. $0.43 Dollars/mile $15,880
TYPES OF Hopper DREDGING: Cutterhead
Clamshell
TYPES OF DISPOSAL: Confined
Open water Ocean dumping
* Last 3-5 years
SOURCE: NWS Inventory
A-134
however, is apparently due to lack of funds and not envi-ronmental constraints. The section for the first one and one-half miles below the Bayou Sorrel lock has to be dredged annually, and material from the section is used for the maintenance and enlargement of the adjacent East Atchafalaya Basin Floodway protection levee.
3. Methods of Satisfying Environmental Con-straints. The following possible methods of satisfying environmental constraints are referred to in the Final Environmental Statement for the Louisiana Section of the GIWW (COE, 1976 c).
(a) Semi-controlled placement to rejuvenate deteriorating marshes. This would re-quire proper placement to be beneficial.
(b) Confined placement in severely damaged wetlands and upland areas.
(c) Casting and stacking using mechanical dredges. This method reduces the water content of the dredged material such that it can be built up to reduce the disposal area required and so that it may be placed on existing ridges and upland areas.
(d) Dredged material disposal on easement lands. It should be recognized that many landowners desire to have dredged material placed upon their easement lands. Such placement increases the ground elevation and adds soil nutri-ents, both of which may result in im-proved forage and crop productivity. In addition, building sites may be created by placement of dredged material.
In addition, Pequegnat et al. (1978) recommended three areas for deep ocean disposal of dredged material. These are an area in the northeast Gulf around De Soto Canyon, an area over and adjacent to the Mississippi Trough and an area in the northwest Gulf somewhat north-west of Alaminos Canyon. Each of these areas covers ap-proximately 9,000 km. The remainder of the upper contin-ental slope of the northern Gulf between the outside of
A-135
the three favorable areas has both neutral and poor dis-posal areas, depending upon the proximity of the coral and algal covered hard banks (e.g. West Flower Garden Bank), the royal red shrimp grounds, or the potential tilefish fishery.
4. Possible Future Changes in Environmental Con-ditions. The only specific possible change is the strict enforcement of PL 93-291 in the Texan waterways, relative to archaeological features. The possible impacts of this are described in Section K 3.
5. Port of Galveston (ADL, 1974 b). Approxi-mately 300,000 cubic yards of maintenance dredging have been undertaken each year in the Galveston Harbor area. The only major new works were a Seabee berth and a barge marshalling area completed in 1971 by Galveston Wharves, which removed 505,000 cubic yards of material. These historical dredging data for the port are itemized in Table D-25. The total volume of dredging from 1963 through 1973 was 3,840,000 cubic yards.
The cost of maintenance dredging has varied be-tween 40 and 70 per cubic yard since 1963. Due to the variability of the maintenance jobs, no clear pattern of growth in maintenance dredging costs can be established from the Galveston data. The one major new work under-taken in 1971 for the Wharves cost 43 per cubic yard.
The COE keeps two hopper dredges in the Galveston area for maintaining the various channels under its jurisdiction. In the opinion of the Galveston Wharves, the COE has adequately maintained the project depths, and there have been no ships prevented from using the port due to siltation.
The environmental impact of dredging falls within the jurisdiction of the COE and the Texas Fish and Wild-life Department. Galveston, like other ports, has a work-ing relationship with the COE in their dredging activities because they use the same disposal areas and often the same dredge. Thus, the COE and the Port tend to work together in solving dredging and disposal problems, and the COE has not prevented the Port from undertaking any dredging projects. On the other hand, Texas ports are largely exempt from regulation by the State Fish and Wildlife Department. The Texas constitution defines ports
A-136
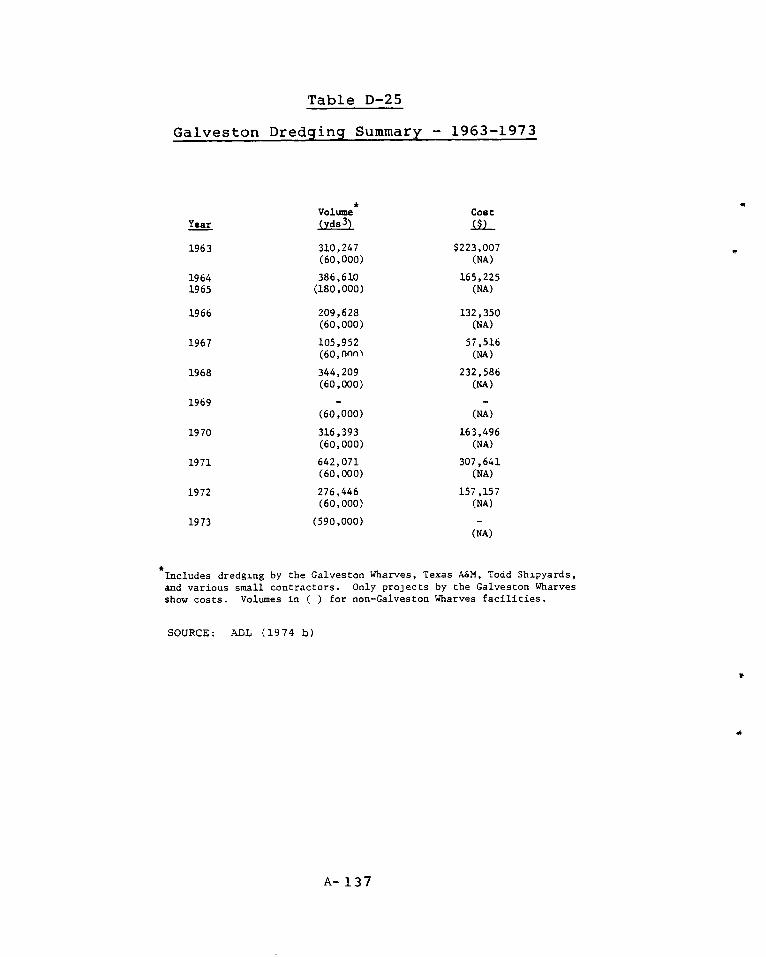
Table D-25
Galveston Dredging Summary - 1963-1973
Volume Coat Year (Yds 3) ($)
1963 310,247 $223,007 (60,000) (NA)
1964 386,610 165,225 1965 (180,000) (NA)
1966 209,628 132,350 (60,000)
1967 105,952 57,516 (60,non) (NA)
1968 344,209 232,586 (60,000) (NA)
1969 - (60,000) (NA)
1970 316,393 163,496 (60,000) (NA)
1971 642,071 307,641 (60,000) (NA)
1972 276,446 157,157 (60,000) (NA)
1973 (590,000) (NA)
* Includes dredging by the Galveston Wharves, Texas A&M, Todd Shipyards, and various small contractors. Only projects by the Galveston Wharves show costs. Volumes in ( ) for non-Galveston Wharves facilities.
SOURCE: ADL (1974 b)
A-137

as being in the primary public interest, as distinct from marinas, housing developments, and private industry. Thus, the state agency cannot prevent the Port from under-taking dredging projects it deems necessary.
Projected dredging volumes are shown in Table D-26.
6. Port of Houston. The Port of Houston, stretching about 25 miles along the Houston Ship Channel, is located at the top of Galveston Bay, 32 miles from the 36-foot contour line in the Gulf of Mexico.
Table D-27 summarizes the estimates of non-federal, port-related dredging activity in the Houston Ship Channel and the upper Galveston Bay, including Bayport and Barbous Cut. The dredging is estimated at 29 million cubic yards for the 1962-1973 period. Of the total, 22.9 million cubic yards was new work and 6.1 mil-lion cubic yards was maintenance. The Port of Houston Authority accounted for the largest volume in the period: over 17 million cubic yards. About 11 million cubic yards were new work at the new Bayport Terminal.
Maintenance dredging requirements in the Port area have been relatively small. The Port of Houston Authority, for example, has its 39 wharves dredged every two to five years. Many of the plants along the Channel will have their slips swept every few years by the dredge contracted by the Corps to maintain the channel.
Dredging projects along the channel have been able to use onland disposal sites close to the project. The cost of such dredging has increased from about 30 to about 50 per cubic yard over the last ten years.
About 80% of the dredged material has gone onto 5,000 acres of Port Authority-owned marsh areas and high land near the project. There have been no major environ-mental objections to these practices, but the disposal areas are now almost full. Dredging projects that must now use spoil disposal locations three miles from the project have costs of about t1.00 per cubic yard.
The availability of dredged material disposal locations will be an increasingly important problem for the Port. The Port Authority has made recent attempts to buy additional land for disposal, but the available properties are extremely expensive.
A-138

Prolect/Purpose Volume
(cubic yards) Type Dredge
Spoil Likelihood Disposal of Location Initiation Year Cost
$ 500,000
unknown
unknown
240,00 / year
190,000,000
6,000,000/ Year
58,000/ year
300,000/ year
270,000,000 Total
8,000,000/ Year
2,640,000
800,000 Cutter
Cutter
Cutter
Cutter
Cutter
Cutter
Galveston 100% Island
F/elican 80% Island
Pelican 100% Island
Pelican 100%
Offshore 20%
Offshore 20%
Table D-26
Galveston Port-Related Dredging, 1974-1983
1974 Port Industrial Road Barge Basin
1974 Todd Shipyard - new drydock
Non-Port of Galveston maintenance
Regular Annual Dock Maintenance
70 Foot Deep Channel Into Galveston Harbor
Maintain 100 Foot Deep Channel
1974-83
1974-83
1976-1980
1978-1983
Total Identified Maintenance Work - 4,296,000 yds 3
(excluding deep draft channel) Total Identified New Work - 4,240,000 yds 3
(excluding deep draft channel)
SOURCE: ADL (1974 b)

Table D-27
Houston1 Dredging Summary
Port Related Non-Port Related 3
1962-73 1974-83 1962-73 1974-83
New Work2
22,900,000 23,200,000 8,000,000 6,120,000
Maint. 6,100,000 11,800,000
TOTAL 29,000,000 35,000,000
'Houston includes the Houston Ship Channel and upper Galveston Bay. 2"New Work" includes 11,200,000 and 8,750,000 cubic yard projects in 1972-73 and 1974-85 respectively by the Port of Houston- Authority for its Bayport Ship Channel and Turning Basin and associated ship berths.
3.Non-Port" is primarily housing, marinas and pipeline crossings.
SOURCE: ADL (1974 b)
A-140

(1) Segments 31, 32, 33, 35, 36, 38 - GIWW East
1. General. It is very apparent that dredging and dredged material disposal problems exist, as witnessed by a major study on the disposal of dredged material in the area (COE, 1979). This reconnaissance report defines the environmental constraints on dredging, but only de-fines them in generic terms, such as damage to shrimp breeding grounds or requirements for deep channels for economic development.
Some information related to dredging is sum-marized in Table D-28.
2. The Extent that Environmental Considerations Act as a Constraint on Dredging. The largest volume of dredging in Alabama is done along the GIWW and at sea ports. There is increased pressure to dispose in upland sites, but again, local sponsors are in a difficult situa-tion. Another problem is that heavy metals remain in site in open water but tend to leach out at upland sites.
In Florida, dredging has not been allowed this year on the Apalachicola, Chattahoochee and Flint Rivers (ACF) because Florida law requires local acceptance. Localities in Florida on the ACF do not benefit from the waterway and therefore have not accepted 404 evaluations. The localities have attempted to negotiate, but the COE is not authorized to enter into such negotiations. A ques-tion was raised, by this example, as to what extent was federal authority relinquished under the Clean Water Act, which allowed local interests to deteimine their own standards of water needs.
An estuarine sanctuary is planned for the mouth of the Apalachicola River. It is explicitly stated in the environmental impact statement (United States Department of Commerce, et al., undated) that "Allowed Uses" includes the following:
Maintenance dredging of existing channels in-cludes dredging by the Corps of Engineers to Congressionally ordered depths and dimensions. No new State regulatory requirements shall be im-posed upon such maintenance dredging because of
A-141
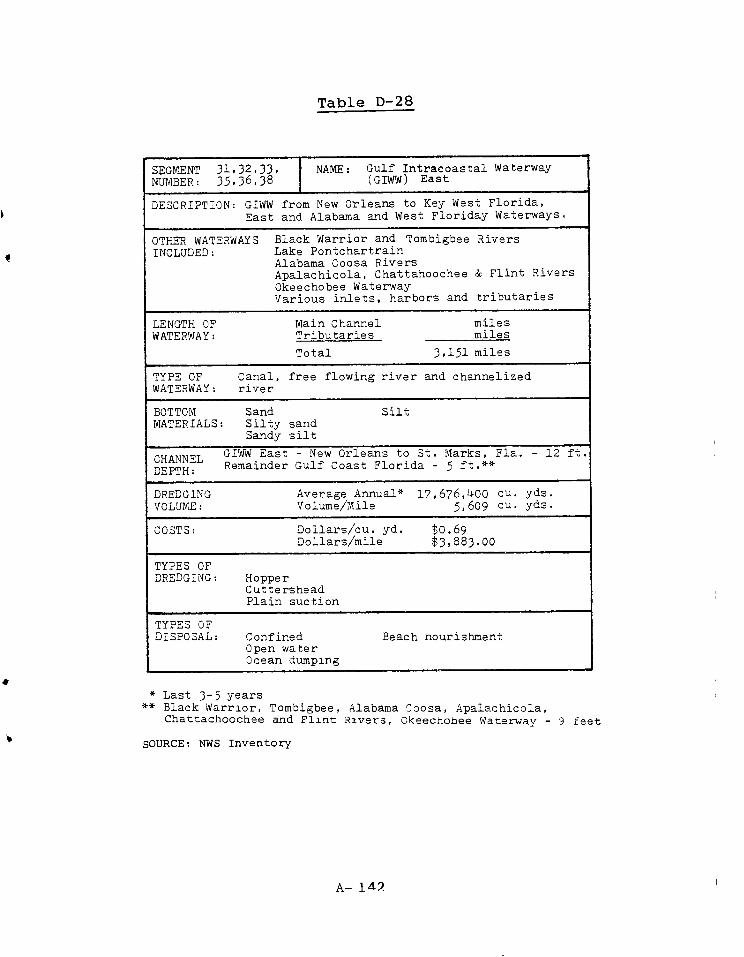
Table D-28
SEGMENT 31,32,33, NAME: Gulf Intracoastal Waterway NUMBER: 35,36,38 (GIWW) East
DESCRIPTION: GIWW from New Orleans to Key West Florida, East and Alabama and West Floriday Waterways.
OTHER WATERWAYS Black Warrior and Tombigbee Rivers INCLUDED: Lake Pontchartrain
Alabama Coosa Rivers Apalachicola, Chattahoochee & Flint Rivers Okeechobee Waterway Various inlets, harbors and tributaries
LENGTH OF Main Channel miles WATERWAY: Tributaries miles
Total 3,151 miles
TYPE OF Canal, free flowing river and channelized WATERWAY: river
BOTTOM Sand Silt MATERIALS: Silty sand
Sandy silt
CHANNEL GIWW East - New Orleans to St. Marks, Fla. - 12 ft.
DEPTH: Remainder Gulf Coast Florida - 5 ft.**
DREDGING Average Annual* 17,676,400 cu. yds. VOLUME: Volume/Mile 5,609 cu. yds.
COSTS: Dollars/cu. yd. $0.69 Dollars/mile $3,883.00
TYPES OF DREDGING: Hopper
Cuttershead Plain suction
TYPES OF DISPOSAL: Confined Beach nourishment
Open water Ocean dumping
* Last 3 - 5 years ** Black Warrior, Tombigbee, Alabama Coosa, Apalachicola,
Chattachoochee and Flint Rivers, Okeechobee waterway - 9 feet
SOURCE: NWS Inventory
A- 14-2

achievement of status as an estuarine sanctuary, and State regulatory permit reviews shall con-tinue to be applied in a manner consistent with applicable Federal law, whereas "Prohibited Activities" include:
Incorporation of new public works projects that require dredging or additional filling within the official Florida water resource development pro-gram, which is annually presented and recommended to Congress pursuant to Chapter 373, Florida Statutes. The temporary exclusion of such pro-jects affecting the bay shall terminate upon adoption of a long term disposal plan expected to be completed within one year of the establishment of the estuarine sanctuary. The omission of such dredging and filling public works projects from the official Florida program does not preclude the submission of recommendation of such public works by other persons or public agencies to the Congress, nor Congressional authorization of such projects.
The State of Florida has also agreed to take priority action on pending COE maintenance dredg-ing applications.
3. Port of Mobile. The Port of Mobile is locat-ed approximately midway in the crescent formed by the Gulf of Mexico between the ports of Galveston and Tampa. The closest ports on either side of Mobile are Pensacola, Florida, to the east, and Pascagoula, Mississippi, to the west, neither of which handles tonnages similar to those of Mobile.
The Port of Mobile is the gateway to 14 inland docks within Alabama, where the COE is responsible for approximately 2,000 miles of navigable waterways---more than in any other state.
In 1972, approximately one million cubic yards of material were removed (versus a pre-contract estimate of 800,000 cubic yards) at a cost of $560,000 for a unit cost of 56 cents per cubic yard. The dredged material (which was predominately sand from up-river) was disposed of on a site located across the river from the State Docks in an area known as Polecat Bay (ACL, 1974 b).
A-143

Projected dredging volumes are shown in Table D-29.
Table D-29
Mobile Port-Related Dredging Summary, 1974-1983 (cubic yards)
t Year
1974 1975 1976 1977 1978 1979 1980 1981 1982 1983
TOTAL
Maintenance
340,000 340,000 350,000 400,000 410,000 410,000 470,000 470,000 480,000 530,000
New Work
600,000 3,800,000 3,400,000 200,000 200,000 2,200,000 2,200,000 200,000 200,000 200,000
Total
940,000 4,140,000 3,750,000
600,000 610,000
2,610,000 2,670,000
670,000 680,000 730,000
17,400,000
i.
SOURCE: ADL (1974 b)
(m) Segments 39-44 - Atlantic Coast
1. General. These segments contain a wide var-iety of waterways, including major harbor estuaries such as Chesapeake and Delaware Bays, the Atlantic Intracoastal Waterway (AIWW), numerous navigable rivers and two inland barge canals. As such, all the major types of dredging and dredge material disposal are used, and all the major environmental problems and concerns exist.
Dredging information is summarized in Table D-30.
2. The Extent that Environmental Considerations Act as a Constraint on Dredging. Environmental con-straints on dredging are recorded as being of major con-cern along the entire Atlantic Coast. The New England Division reported that dredging almost ceased entirely in the early to mid 1970's but that due to economic and poi-itical pressures had recently picked up. The major har-bors of the area are also the older industrial centers.
A-144

Table D-30
SEGMENT NAME: Atlantic Coast from Key West NUMBER: 39 - 44 to St. Croix River, Maine
DESCRIPTION:
OTHER WATERWAYS Atlantic Intracoastal Waterway & tributaries INCLUDED: Chesapeake Bay and tributaries
Delaware Bay and River Hudson River New York State Barge Canal Lake Champlain and Champlain Canal Various harbor irlPts and approaches
LENGTH OF Main Channel miles WATERWAY:** Tributaries miles
Total 6,386 miles
TYPE OF Canal/coastal waterway, inland canal, lake, free WATERWAY: flowing river, channelized river, estuarine
BOTTOM MATERIALS: Various
CHANNEL Various DEPTH:
DREDGING Average Annual* 36,687,200 cu. yds. VOLUME:** Volume/Mile 5,616 cu. yds.
COSTS:** Dollars/cu. yd. $1.84 Dollars/mile $10,159.00 ---
TYPES OF DREDGING: Hopper Clamshell Dipper
Cutterhead Orange Peel Sidecasting Plain Suction
TYPES OF DISPOSAL: Beach nourishment Marsh
Confined Open water Ocean dumping
* Last 3 - 5 years ** Excluding New England Division
SOURCE: WS Inventory
A- 145
As a result, much dredged material in key channels is heavily contaminated by the industrial and domestic wastes of the past century.
Along the AIWW in Florida, beach erosion is a major problem. Good quality sand material is returned to the beaches. Polluted material requires upland sites. Ocean dumping, which must be at least six miles out to sea in order to clear the reefs in most areas, is being con-sidered. Florida standards require turbidities of less than 50 JTU with a 150 meter mixing zone and no long-term changes of bottom topography for dredge disposal operation.
Charleston Harbor has had its dredge material disposal site taken over by birds, apparently a common occurrence, and now the Fish and Wildlife Service wants it to be protected.
It is reported that the Carolinas have an unusu-ally high amount of naturally occurring mercury in dredge material, though it is not indicated whether this has constrained disposal.
Lack of adequate disposal sites is reported as a problem on the Delaware between Philadelphia and Trenton. Dredging in the Delaware River is also constrained by shad migrations.
It is reported that dredging of the Chesapeake and Delaware Canal to its authorized depth of 35 feet is delayed for approval of side casting dredging.
Most dredged material from New York Harbor, which is 90% of the material dredged within the New York District, is currently disposed of in a site known as the "Mud Dump" in New York Bight. Major environmental con-cerns over the continuing contamination of New York Bight with dredged and other potentially toxic and hazardous materials has led the New York District to commission a study (O'Connor et. al., 1979) to determine alternative disposal practices.
3. Methods of Satisfying Environmental Con-straints. The only feasible alternative to the current methods of disposal for the Savannah District AIWW section discussed in the Final Environmental Statement (COE, 1976) is the creation of intertidal islands by placement of
A- 146
dredged material on the subtidal zone. This method of disposal is being investigated near the Kings Bay Military Ocean Terminal. For this section, both dike disposal and upland disposal are rejected as unfeasible: diked dis-posal because it destroys wetland, and upland disposal both because of the distance to suitable sites and the need to lay pipelines across wetlands.
The only alternative discussed for the Savannah River (COE, 1967 d) disposal is diked areas. These are not considered feasible as they involve the destruction of bottomland hardwoods and adjacent wetland areas.
The New York Study (O'Connor et al., 1979) con-siders deep ocean disposal, _offshore island containment, ocean disposal with other waste materials, ocean spread-ing, containerized ocean disposal, filling mines, produc-tion of construction materials, and incineration as "not currently reasonable". Others are defined as "possible in special cases" including selective dredging, Long Island Sound disposal, river/harbor disposal, protected water containment, beach nourishment, enhancement of the envi-ronment, wetlands disposal, sanitary landfill cover and disposal in abandoned piers. If there were flexibility in channel realignment in New York Harbor, dredging volumes could be reduced.
Disposal in Long Island Sound depends on the agreement of the involved local bodies. River/harbor disposal and protected water containment has limited pos-sibilities. The problem with beach nourishment is that the dredged material must be similar to the beach sand. In the case of New York, where much of the dredged mater-ial is silt, this application is limited. Enhancement of the environment, including habitat creation, landscape reclamation and artificial island creation, as well as wetlands disposal offer limited opportunities. In the case of wetlands creation or disposal, the contaminated nature of much of the dredged material imposes problems and risks. Sanitary landfill cover and disposal in aban-doned piers appear to be limited in their application. Alternatives considered to be possible in special cases and feasible for large volumes of material include open dumping in shallow ocean sites, filling subaqueous borrow pits and confined on-land disposal.
The Norfolk District has located a 6,000 acre upland site which will eventually be covered to a depth of
A-147
27 feet. It will require dredged material to be trans-ported 10 miles through a 20 inch pipe with a 16 inch effluent return. The site is currently wooded and will be cleared in stages.
In New England, it is reported that impacts from dredged material disposal are mitigated by capping heavily polluted material with clean or less polluted dredge material.
Pequegnat et al. (1978) made the following recom-mendations concerning deep ocean disposal:
Northeast Coast - The problem of disposal of dredged material in this sector is compounded by the great width of the continental shelf and the presence of very productive banks and basins. It is recommended that the entire continental slope region beyond the 300-m isobath can be considered appropriate for disposal of dredged material. Although it is not anticipated that serious bio-logical consequences would actually develop from disposing material in the larger canyons, it would be unwise to dispose in those canyons on the outer flank of Georges Bank that incise the 100-m isobath.
Middle Atlantic Bight - There is an alternating series of favorable and unfavorable disposal areas stretching along the precipitous shelf-slope junction and upper slope from the southern boundary of the present 106-mile industrial site, just south of Hudson Canyon, to Cape Hatteras. Although it is not considered essential for environmental preservation, it is recommended that no disposal take place in those large
•
canyons whose heads incise the continental shelf, viz., Wilmington, Baltimore, Washington, and Norfolk Canyons.
South Atlantic Bight - In this bight, there are large stretches of the Florida-Hatteras slope that are favorable for deep ocean disposal of dredged material. Except for certain hard bank areas that are located off the southern aspect of Cape Lookout and Cape Fear, the shallow limit of the favorable areas can run along the shelf-slope
A-148
junction around the 100-m isobath. In the vicin-ity of the hard banks, which are favored sports fishing grounds, the shallow limit should be shifted seaward to the 200-m isobath.
4. Possible Future Changes in Environmental Constraints. It is clear that the environmental con-straints have not been finally defined in many areas. In particular, the toxicity of contaminated material and the potential for resuspension of hazardous material are not at all clear. For example, it is reported that in New England the passing of bioassay tests is based on the leniency of the regulating agency.
5. Baltimore Harbor (ADL, 1974 b). The Port of Baltimore is located inland on the Chesapeake Bay with outlets to the sea through the lower Bay to the south and through the upper Bay and the Chesapeake and Delaware (C & D) Canal to the north. The total distance from the Atlantic Ocean to the port through the lower Chesapeake is 172 miles. The distance to the sea through the C & D Canal is about 125 miles.
Non-federal port-related dredging activity in the Baltimore Harbor areas in the last 12 years (prior to 1974) has consisted of five projects of more than one mil-lion cubic yards, plus a number of smaller projects. A review of dredging permits issued by the Maryland Port Administration has identified 3,626,000 cubic yards of new work dredging in the 1962 through 1973 period. There is estimated to have been an additional 80,000 cubic yards per year of miscellaneous new work for which volumes were not reported. The total estimated volume of new work for the period was 14.6 million cubic yards.
Our survey identified 3,988,000 cubic yards of maintenance dredging during the 12-year period. The esti-mated unidentified volume was 600,000 cubic yards, for a total of about 4.6 million cubic yards of maintenance dredging. Table D-31 is a summary of the identified vol-umes for the Baltimore area during the 1962-73 period.
The cost of dredging has increased from around $1.00 per cubic yard in the early 1960's to the present $1.25 to $1.50 per cubic yard for new work and $5.00 to $6.00 for maintenance. The increasing lack of nearby dredge disposal areas will have a significant impact on future dredging costs.
A-149

New Work
Maintenance
Environmental concerns have become of major importance to dredging in the harbor area. No projects have been identified which were not undertaken because of environmental constraints. However, presently there are no approved open-water disposal areas, and all dredging projects in the area that need such disposal have been delayed.
Table D-31
Baltimore Dredging Summary
Port Related1 Non-Port Related
2
1962-73 1974-83 1962-73 1974-83.
14,600,000 23,000,000 30,000,000 28,300,000
4,600,000 6,900,000 --
or "Port Related" dredging, Baltimore Harbor extends north along the Chesapeake Bay to North Point and south to Vodkin Point at the Potapsco River.
"Non-Port Related" volumes for 1973 total 2,247,000 cubic yards, includ-ing 1,723,000 cubic yards for housing developments, marinas, and recrea-tion areas. For the 1962-73 period, a yearly average of 2,500,000 cubic yards was assumed. For the 1974-1983 period, a 2,400,000 cubic yard per year volume was assumed, reflecting tighter environmental controls, plus 4,300,000 cubic yards for the Hart-Miller Disposal Area. The volumes are intended to include the Maryland portion of the Chesa- peake Bay plus the Baltimore Harbor. Less than 30% of the volume is dredged in the immediate harbor area.
3Increases in New Work in the 1974-83 period reflect the deepening of the Baltimore Channel to 50 feet and the resulting associated dredging by firms in the area.
Source: ADL (1974b)
2
A-150

The State of Maryland has forced the COE to stop using the Kent Island spoil disposal location. For the COE to carry out even routine maintenance dredging, it must have disposal areas approved by the State. A permit application has been filed by Maryland with the COE for the construction of a diked disposal area called the Hart and Miller Islands Disposal Area (H-M). Three years after approval, the site should be available. But in the inter-im, a minimum of two million cubic yards will be generated by the COE maintenance dredging of the harbor and chan-nels. The present situation (1974) is a stalemate, with the COE dredging halted until a State-approved disposal site is available; and Baltimore Harbor is increasingly in need of dredging to the 42-foot project depth. The silta-tion rate in the harbor area is currently about 6 inches per year.
The port is presently (1974) experiencing some reduced usage of facilities because the dock areas cannot be kept at their approved depths. Some ship diversions from Baltimore have been reported due to the reduced depths. The COE and private firms have been unable to perform the necessary dredging due to the lack of disposal areas.
A survey of major port operators identified new dredging projects likely to be undertaken during the 1974-1983 period, which amounted to 21,205,000 cubic yards (Table D-31). An additional 1,800,000 cubic yards was estimated though not identified by the survey. The total port-related new work is estimated to be 23,000,000 cubic yards. The major new projects during the period are new dock areas and new refinery locations. If the COE re-ceives authorization from the Office of Management and Budget to dredge a one-lane, 50-foot channel, associated dredging by such firms as Bethlehem, Exxon, and the B & 0 would not begin until about 1980. The Maryland Port Administration's facilities will not use the deeper chan-nel, because they are primarily oriented to container ships and towers without the deeper drafts.
6. Hampton Roads Ports (ADL, 1974 b). Geograph-ically, the port of Hampton Roads is split into two major components, Newport News and Norfolk, with the greater part of the port-related activity occurring at the latter location. Norfolk, along with the cities of Portsmouth and Chesapeake is located near the mouth of the Elizabeth River. Five miles north, across the mouth of the James
A-151
River, is the smaller port at Newport News. The entire complex is located at the extreme southern end of Chesapeake Bay, near its juncture with the Atlantic Ocean. The Chesapeake Bay Bridge Tunnel and the Hampton Roads Bridge Tunnel, which cross the Bay at a depth of 65 feet below mean low water, effectively establish a lower limit for channel maintenance at approximately 58 feet. Thus, Hampton Roads will not be the immediate site for a deepwater port.
Table D-32 shows that a total of some 12 million cubic yards of dredged material, including hydraulic fill, was moved in the port of Hampton Roads during the last ten years. This averages some 1.1 million cubic yards per year. The average unit cost for dredging during this time amounted to about $1.50 per cubic yard. As most disposal takes place at the COE's Craney Island disposal area, the cost of work varies widely. It usually depends on the proximity of a given job to Craney Island. Maintenance work at Newport News averages $1.90 per cubic yard, where-as new work at the Norfolk International Terminal, direct-ly across from Craney Island, has been as low as 67 per cubic yard.
It is expected that the volume of material moved from 1974 to 1983 will roughly approximate the volume moved during the previous ten-year period and will amount to some 11.5 million cubic yards. This future work will include expansion of existing terminal facilities.
7. Delaware River Ports (ADL, 1974 b). The ports of the Delaware Basin, sometimes referred to as Ameriport, include facilities in the States of Delaware, New Jersey and Pennsylvania along the banks of some 80 river miles in the Delaware Valley.
As shown in the summary Table D-33, a total of some 38 million cubic yards of dredged material (including hydraulic fill) was moved under non-federal contract over the last 11 years in the Delaware Basin. This averages to some 3.4 million cubic yards per year. The average unit cost for dredging during this time was probably around $1.00 per cubic yard, although this figure does not accur-ately reflect the steady increase in cost that has taken place.
A-I 52
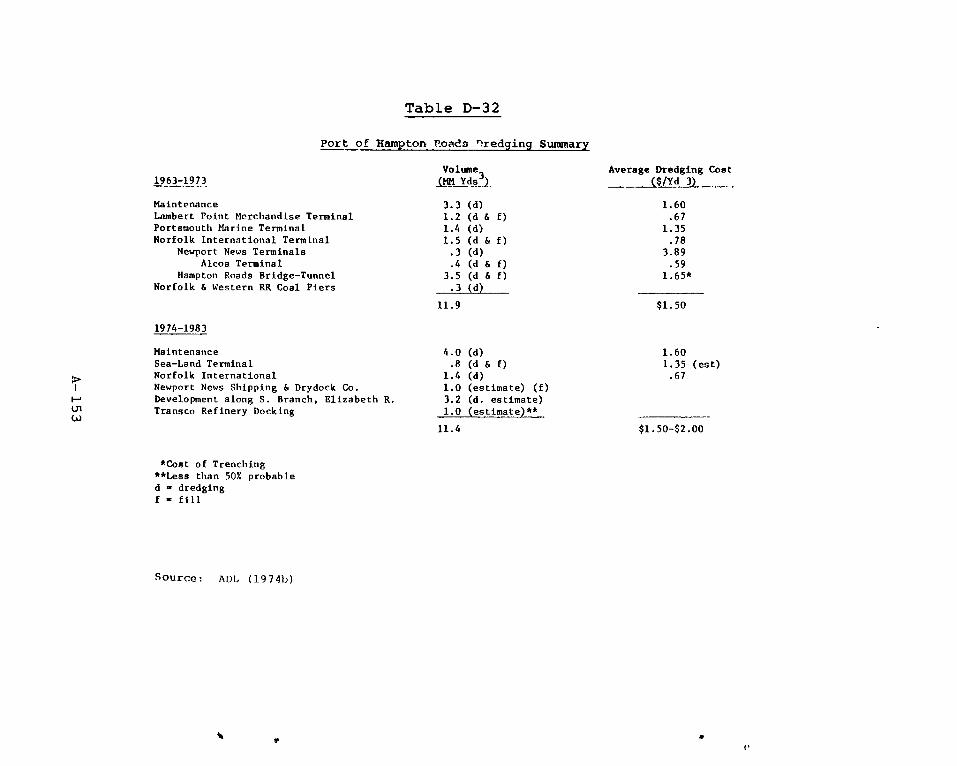
Table D-32
Port of Hampton Roadn nredging Summary
Volume (MM Yds 3)
Average Dredging Cost 1$/Yd 3) 1963-1973
Maintenance 3.3 (d) 1.60 Lambert Point Merchandise Terminal 1.2 (d F. f) .67 Portsmouth Marine Terminal 1.4 (d) 1.35 Norfolk International Terminal 1.5 (d & f) .78
Newport News Terminals .3 (d) 3.89 Alcoa Terminal .4 (d & f) .59
Hampton Roads Bridge-Tunnel 3.5 (d & f) 1.65* Norfolk & Western RR Coal Piers .3 (4)
11.9 $1.50
19 74-198 3
Maintenance 4.0 (d) 1.60 Sea-Land Terminal .8 (d F. f) 1.35 (est)
9 Norfolk International 1.4 (d) .67 1 Newport News Shipping & Drydock Co. 1.0 (estimate) (f)
1--. Development along S. Branch, Elizabeth R. 3.2 (d. estimate) o Transco Refinery Docking 1.0 (estimate)** (.•.)
11.4 $1.50-$2.00
*Cost of Trenching **Less than 50% probable d = dredging f = fill
Source: ADL (1974b)

41$
Average Dredging Cost ($/Yd 3)
$1.14
0.96 1.00 0.72 1.00 0.40
37.6 $1.00
33.0 (d) .15 (f) .12 (d) .12 (d) .18 (d) .2 (d) .18 (d)
2.5 (f) .8 (d)
3.5 (d) .5 (d)
2.0 1.0 (d & f)
& f)*
Table D-33
Delaware River Basin Dredging Summary
Volume, 1963-73 (KM Yds')
Maintenance 26.0 (d) Penn's Landing 1.8 (d & f) Beckett St. Terminal .3 (d) Tioga Marine Terminal 1.6 (d & f) Packer Avenue Marine Terminal .8 (d & f) Eddystone Plant Piers (Phila. Electric) .6 (d & f) Wilmington Marine Terminal 3.0 (d & f) Philadelphia Airport 6.0 (f)
1974-1983
Continued & New Maintenance Sun Oil Company Pier U.S. Steel Slip Penn Central Ore Pier (Phila.) L.C.A. Tanker & Barge Pier Broadway Terminal Misc. Pier Facilities Penns Landing Sun Ship & Drydock Shell Oil Co. Refinery Mobil Oil Co. Refinery Expansion Tenneco LNG Terminal Reading - Port Richmond Container Term. Tioga Marine Terminal
44.57 $1.00-$2.50
d - dredging f - fill * - less than 50% probable
Source: ADL (1974b)

It is expected that the volume of material to be moved between 1974 and 1983 will exceed 40 million cubic yards. This figure may be attributed to a combination of growth in maintenance requirements and new work on energy-related facilities, such as the proposed Shell refinery in Logan Township, New Jersey. It is generally felt that environmental constraints, particularly on the Jersey side, have greatly reduced the amount of new work perform-ed over the last five years and that this influence passed its maximum around 1972-73. Thus, an average of some 3.5 million cubic yards of material may be moved annually over the next decade.
The great concentration of facilities in the Philadelphia Harbor area requires the removal of at least 500,000 cubic yards of material from this vicinity annual-ly. Maintenance requirements in the harbor area are ex-tremely site-specific and depend primarily on the degree of proximity of a facility to the main channel as well as the general design of nearby piers. In general, marginal wharfs located near the main channel, such as those at the Philadelphia Port Corporation Tioga and Packer Avenue ex-tension marine terminals, are well scoured and have re-quired only one maintenance job each since the late 1960's. In contrast, finger piers, such as those operated by the South Jersey Port Corporation, which are recessed from the main channel, tend to accumulate some 3 feet of sedimemt per year, and must be dredged once every 18 months to two years. The great majority of harbor facili-ties in Philadelphia are of the finger pier type.
Other areas requiring major maintenance efforts include the Marcus Hook range, where it is estimated that primarily petroleum-related facilities require some 250,000 cubic yards of dredging annually, and the Mifflin range just south of Philadelphia, where about 200,000 cubic yards accumulate. The Getty Oil Company, which privately maintains the Bulkhead Shoals Channel and turn-ing basin as the approach to its Delaware City refinery, possesses an unusually heavy maintenance dredging burden, which is estimated to be some 700,000 cubic yards every 18 months. Getty owns and utilizes its own diked disposal areas.
Disposal of the consistently poor-quality mater-ial obtained during maintenance work in the Delaware usually takes place at one of the twenty-odd diked dis-posal areas nearest the dredging operation. These areas
A-155

are scattered at fairly regular intervals along the banks of the river between Trenton and Delaware City, Delaware.
As mentioned previously, maintenance dredging costs have escalated significantly in the recent past. This increase in terms of unit costs may be documented as follows: 1963, 95 per cubic yard; 1966, 97 per cubic yard; 1971, $1.34 per cubic yard; and 1973, $2.15 to $2.19 per cubic yard. The cost increases are attributed to labor requirements and environmental constraints.
(n) Segments 45-49 - Great Lakes and St. Lawrence Seaway
1. General. The Great Lakes are an extension of Ocean Navigation via the St. Lawrence Seaway. As such, their dredging problems are better associated with those of the coastal estuaries and harbors with the important exception that the lakes themselves are far more limited as a sink for dredged material. Dredging information is summarized in Table D-34.
2. The Extent that Environmental Considerations Act as a Constraint on Dredging. All dredged material disposed in the Great Lakes is in dike disposal areas. In Michigan the timing of dredging is controlled by the State to minimize the impact on fishing spawning. The Detroit River has not been dredged since 1969 due to the lack of an acceptable disposal site. It was also indicated that the average annual capacity of both the federal and private hopper fleet had been reduced as a result of environmental constraints.
• (o) Segments 50-56 - Pacific Coast
1. General. These segments are harbors and sea-ways providing access to inland harbors with the exception of the Columbia-Snake River above Portland, Oregon, the Willamette River and three short waterways in Oregon. Since no dredging is reported on the Columbia-Snake River, the significant problem of dredging relates to access for ocean going ships. Dredging information is summarized in Table D-35.
A-1 56
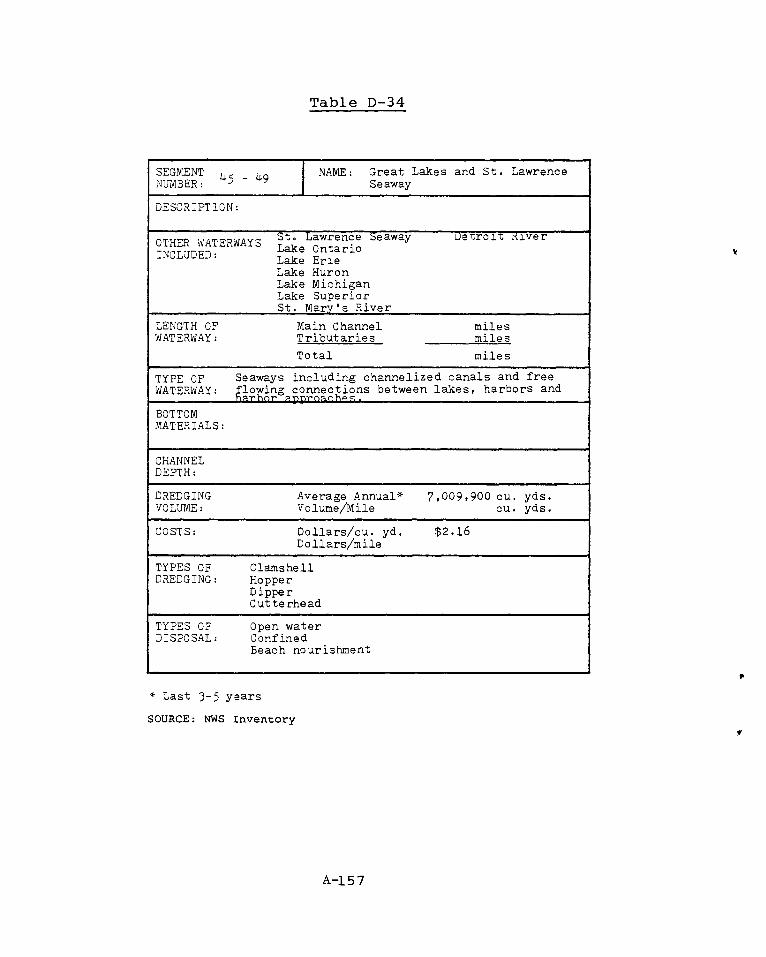
Table D-34
SEGMENT 4 5 - NAME: Great Lakes and St. Lawrence 49 NUMBER: Seaway
DESCRIPTION:
, OTHER WATERWAYS St. Lawrence Seaway Detroit River
Lake Ontario INCLUDED: Lake Erie Lake Huron Lake Michigan Lake Superior St. Mary's River
LENGTH OF Main Channel miles WATERWAY: Tributaries miles
Total miles
TYPE OF Seaways including channelized canals and free WATERWAY: flowing connections between lakes, harbors and
harbor 1;).prnar, hPs.
BOTTOM MATERIALS:
CHANNEL DEPTH:
DREDGING Average Annual* 7,009,900 cu. yds. VOLUME: Volume/Mile cu. yds.
COSTS: Dollars/cu. yd. $2.16 Dollars/mile
TYPES OF Clamshell DREDGING: Hopper
Dipper Cutterhead
TYPES OF Open water DISPOSAL: Confined
Beach nourishment
* Last 3-5 years
SOURCE: NWS Inventory
A-157

Table D-35
SEGMENT 50 - 56 NAME: Pacific Coast NUMBER:
DESCRIPTION: Canadian border at Blaine, Washington to Mexican border at San Ysidro, California
OTHER WATERWAYS INCLUDED: Puget Sound
Columbia, Snake and Williamette Rivers Sacramento, San Joaquin Rivers San Francisco Bay
LENGTH OF Main Channel miles WATERWAY: Tributaries miles
Total miles
TYPE OF Free flowing and channelized rivers, ship canal, WATERWAY: major and minor harbors
BOTTOM MATERIALS:
CHANNEL DEPTH:
DREDGING Average Annual* 43,300,700 cu. yds. VOLUME: Volume/Mile cu. yds.
COSTS: Dollars/cu. yd. $2.98 Dollars/mile
TYPES OF Dragline Cutterhead DREDGING: Hopper
Plain Suction Clamshell
TYPES OF Confined DISPOSAL: Open water
Beach nourishment Ocean dumping
* Last 3-5 years
SOURCE: NWS Inventory
A-15R
San Francisco Bar San Francisco Bay 100 Fathom Line Land Disposal
1,000,000 cu. yds. 5,067,000 cu. yds. 400,000 cu. yds. 477,000 cu. yds.
2. The Extent that Environmental Considerations Act as a Constraint on Dredging. Dredging and the dis-posal of dredged material are described as a major problem for Oregon and Washington, most especially on the Columbia River below Portland, Oregon. It is reported that cur-rently confined disposal on the lower Columbia River is found to be cheaper than to haul material to ocean dis-posal sites. Upland disposal sites are preferred by the states that have jurisdiction over disposal.
In the San Francisco Bay, problems of finding suitable dredged material disposal sites commenced in the early 1970's and have since become worse (COE, 1975 e). As upland disposal sites require local cost sharing, the passing of Proposition 13 has increased difficulties of locating them.
A Composite Environmental Statement on main-tenance dredging in San Francisco was completed in 1975 (COE, 1975 c). This covered 20 specific federal navi-gation projects. An analysis of this document indicates the quantities and types of disposal as follows:
Average Annual Quantity
TOTAL 6,944,000 cu. yds.
In addition, permits are issued for about 3.5 million cubic yards of private dredging for which disposal sites are not indicated.
The material disposal at the shallow ocean dis-posal site on the San Francisco Bar is clean sand from the adjacent channel. The "100 Fathom Site" at the 100 fathom contour is used for the disposal of contaminated material. It should be noted that Portland District cannot economic-ally justify a disposal site in 50 fathoms of water. Furthermore, a site at 250 fathoms cannot be considered both because of economics and because of time constraints on hopper dredges. There is a study underway to determine a disposal site.
A- 159

3. Methods of Satisfying Environmental Con-straints. The San Francisco Bay composite environmental statement (COE, 1975 c) considers the following disposal alternatives as feasible:
(a) bay disposal.
(b) ocean disposal.
(c) land disposal.
(d) delta island reclamation.
(e) marshland development.
Pequegnat et al. (1978) made the following recom-mendations with regard to deep ocean disposal:
Southern California Bight - In this bight, the mainland shelf and basin slope are furrowed by over 30 submarine canyons. The principal source of dredged material is the Los Angeles Harbor complex with lesser amounts from San Diego Har-bor, Port Hueneme, and other small embayments such as Newport Harbor. Disposal sites can be found within a few kilometers of shore throughout the bight. If submarine canyons are to be util-ized for disposal, it seems essential that such a decision be made only after careful study on a case by case basis. Recommended disposal areas are on the seaward face of the Coronado Escarp-ment and along the San Pedro Escarpment.
Northern California Shelf - The area recommended here for deep ocean disposal of dredged material lies about 10 km west of the Farallon Islands be-ginning on the 200-m isobath and, on the north-south axis, running between the North Traffic Shipping Lane (inbound) and the Main Traffic Shipping Lane (outbound) to the south. This area is essentially bounded by Pt. Reyes to the north and Pigeon Pt. to the south, with the proviso to avoid the shipping lanes.
The Northwest Shelf - There are several important harbors of moderate size in this sector. Recom-mended disposal areas for each are:
A- 160

(a) Humboldt Bay. The continental shelf off Humboldt Bay is about 21 km wide. Because of the importance of the demersal fishes in this area, it is advised that a site should not be established shoreward of the 300-m isobath.
(b) Coos Bay. The continental shelf is about 32 km wide at Coos Bay. It is recommended that material scheduled for ocean disposal not be dumped inside of the 500-m isobath.
(c) Grays Harbor. The continental shelf off Grays Harbor is about 46 km wide. Again, because of the important demersal fishes in this area, it is not advisable to establish a deep ocean site inside of the 500-m isobath.
However, an approved open water dis-posal site exists in Grays Harbor near Pt. Chehalis. In addition, an open ocean site between 40 and 50 isobaths may be acceptable to State and Federal agencies (Grays Harbor Ocean Disposal Study, 1980). Disposal in the ocean is presently not required as the bar chan-nel is self-maintaining due to jetties on both sides of the entrance. Ocean disposal is presently being evaluated for proposed widening and deepening of the 300-foot deep-draft channel.
(d) Pugent Sound/Strait of Juan de Fuca Complex. There are numerous acceptable deepwater areas for disposal sites in the Pugent Sound and Whidbey Basins (depths of 280-m) and the adjacent Strait of Juan de Fuca. The State of Washington, in conjunction with Federal agenies, including the Environmental Protection Agency and the Seattle Dis-trict of the Corps of Engineers, has established 13 open water disposal sites in Pugent Sound and the Straits
A-161
of Juan de Fuca. Use of the sites re-quires approval by both the State and Federal authorities with users making application through the Department of the Army's Section 10 procedures. The site locations are based on expected need, water depth, currents, existing bottom condition, biological community, and ease of surveillance.
Although extensive mixing of waters occurs over sills supplying dissolved oxygen to subsurface waters of most of the Sound, there are places where oxygen levels reach very low levels in summer. Dabor Bay is a noted area to avoid.
4. Port of Long Beach (ADL, 1974 b). Located in the eastern half of San Pedro Bay, south of the City of Los Angeles, the Port of Long Beach is 62 years old. The harbor is protected from the ocean by an extensive break-water system, over eight miles in length, built by the COE. The breakwater guards not only the City and Port of Long Beach, but the Port of Los Angeles as well. For all practical purposes, the Port of Long Beach is entirely man-made, having been created by dredging channels first on the shore front and later offshore. This process has provided considerable fill material with which to con-struct many of the piers presently in use.
Approximately 40.3 million cubic yards of mater-ial have been dredged from the channel and basin areas of the Port of Long Beach since 1962, to be used as pier fill material, for an average moved volume of about 3.4 million cubic yards per year. Because of the short distances in-volved, cost of dredging, and the large volumes handled, yardage costs were relatively low - about 25 to 35 per cubic yard. During the same period, maintenance work or minor deepening projects have been negligible in volume, totaling approximately 200,000 yards over the ten-year period.
Since 1965, a significant amount of activity in-volving dredging has been carried out in the waters directly off the City of Long Beach, immediately to the east of the Port itself. This work included the dredging of the Queen Mary Dock Site and the filling in of the
A-162
former Rainbow Pier area. The work was carried out by the City of Long Beach under private contract. In addition, four drilling islands were constructed by oil companies under private contract a short distance offshore from the city. Precise estimates regarding the total amount of fill moved in connection with these three projects were not determined, but it is estimated to be about 14 million cubic yards.
Table D-36 summarizes past and future dredging in the Long Beach area.
Because the harbor is well protected by a large seaward breakwater, and because no freshwater streams of any consequence empty into the harbor area, maintenance requirements in the Port of Long Beach are negligible, amounting to only 18,000 yards during the 1962-1973 period.
For the 1974-1983 period, maximum expected new work will approximate 76 million yards, which is nearly twice that of the preceding period. As before, dredging activity will be directly related to construction of new harbor facilities, so that dredged material will be used as fill for new land and not merely disposed of at sea or in designated spoil areas. Most of the work contemplated depends on the outcome of model basin tests now being con-ducted by the COE in Vicksburg, Mississippi, and on future development plans of the Port of Los Angeles, which directly adjoins the Port of Long Beach on the west.
Beyond 1983, the Port of Long Beach has proposed additional development projects involving about 45 million cubic yards of fill obtained from outside the harbor area. These projects would all but fill the available area within the Port of Long Beach as defined by property boundaries and the main breakwater.
Officials at the Port of Long Beach view environ-mental constraints as the most serious governing factor to future expansion over the next 10 years. Unlike other ports, where spoil disposal practices constitute a serious constraint on dredging activity, the quality of material dredged from the Long Beach harbor is suitable for fill purposes. On the other hand, future expansion of the port for economic reasons can be viewed as modifying the shore-line, and this is of major consideration to environmental-ists as well as coming under the purview of "Proposition
A-163

Cost/yds3
Spoil Type Disposal Dredge Location
Volume Cost (MM yds 3 ) (MM $)
$ .32 Cutter/ Inside diked Suction area
1966 Rainbow Pier fill- 9 City of Long Beach
Table D-36
Long Beach Port-Related Dredging Activity
Year
PAST WORK
1962-65
Project/Purpose
Extension of Piers 30 $9.8 J&F with fill obtained from Outer Harbor
$0.25, excl. Cutter/ Inside rock mob/demob; suction dike forming $0.33 total pier perimeter
1967-67 Deepen water for Bulk 0.180 0.215 incl. $1.20, incl. Pier G - dredging 6 mob-demob. mob-demob. rock work
Cutter/ Inside harbor suction area, east of
Pier G - future fill area (Pier J)
1970-71 Expand Piers G&J with 10.3 fill obtained from Main Channel, Middle Harbor, East & SE Basins
4.4 $0.37 incl. Cutter/ Inside rock dike mob-demob/ suction forming pier $0.43 total perimeter
1969 General maintenance 0.018 0.065 3.62 Clamshell Fill area east (only maintenance of Pier G done in Port during period 1962-1973)
1969 Queen Mary Dock Site 1.1 $ .64 by City of Long Beach - fill obtained from Bay area off City.
Cutter/ Inside rock suction dike
Source: ADL (1974b)

Spoil Type Disposal Dredge Location Year Cost/yds 3
Volume Cost (MM yds 3) (MM $) Project/Purpose
$ .70 Cutter/ Inside rock Suction dikes
1966-68 Construct 4 Drilling 4 Islands east of Port Area-Privately Financed
4.00 240K
15 0.50
Bucket/ scow
Cutter/ Suction
Cutter/ Suction
South of pre-sent Pier J (future fill area)
Behind rock dike forming pier perimeter
As above
.,.. C, I ,
Table D-36 (Continued)
1962-73 New work, mainten- nil ance for U.S. Navy
FUTURE WORK
1974 Maintenance Dredging
"Project I": 1976-79 Southward Extension 31
of Pier J with fill obtained from Channel and Basin areas
"Project II": 1979-83 West arm of new South- 28
west Basin (depending on expansion of adjoin- ing Port of Los Angeles)- fill from both inside and outside Harbor area.
0.06
So irce : ADL (1974h)
3
20". Delays caused by various review procedures and the necessity for extensive testing of port models will almost certainly increase future construction costs, which in turn forces he Port to revise downward its expansion plans.
However, even with the above difficulties, it is quite likely that a significant amount of dredging and fill work will be done in the Port of Long Beach over the next ten years.
5. Port of Los Angeles (ADL, 1974 b). Located in the westernmost portion of San Pedro Bay, and bounded on the east by the Port of Long Beach, the Port of Los Angeles had its beginnings before the turn of the century. Like Long Beach, the Port of Los Angeles is essentially man-made, created by building protecting jetties and breakwaters and by dredging channels first from the shorefront and later offshore. Much of the material obtained from dredging projects has been used to construct the piers and structures presently in use.
With the exception of one major job during the 1962-1973 period, all port-related dredging has been car-ried out entirely under contract to the Port of Los Angeles and has been done by private contractors.
The only major job (Table D-37) done during the past decade was the deepening of the Fairway from the entrance to the Harbor to a bulkloading facility in the southwest portion of the Harbor. Also included was the excavation of a 51-foot turning basin. While dredging itself was done by a private contractor working for the Port of Los Angeles, the COE built the Cabrillo Beach groin to contain the spoil dredged from the project.
Maintenance dredging in the Port of Los Angeles has averaged less than 10,000 cubic yards annually; during the period 1962-1973, maintenance work and small projects together have aggregated only about 350,000 yards. In addition to the four other minor projects shown in Table D-37, the Port of Los Angeles has also participated in the improvement of the Cabrillo Beach area, including con-struction of a small-boat launching ramp and a modest beach nourishment program.
6. Port of Portland (ADL, 1974 b). The Port of Portland Marine Facilities is located approximately 100
A-1 EA
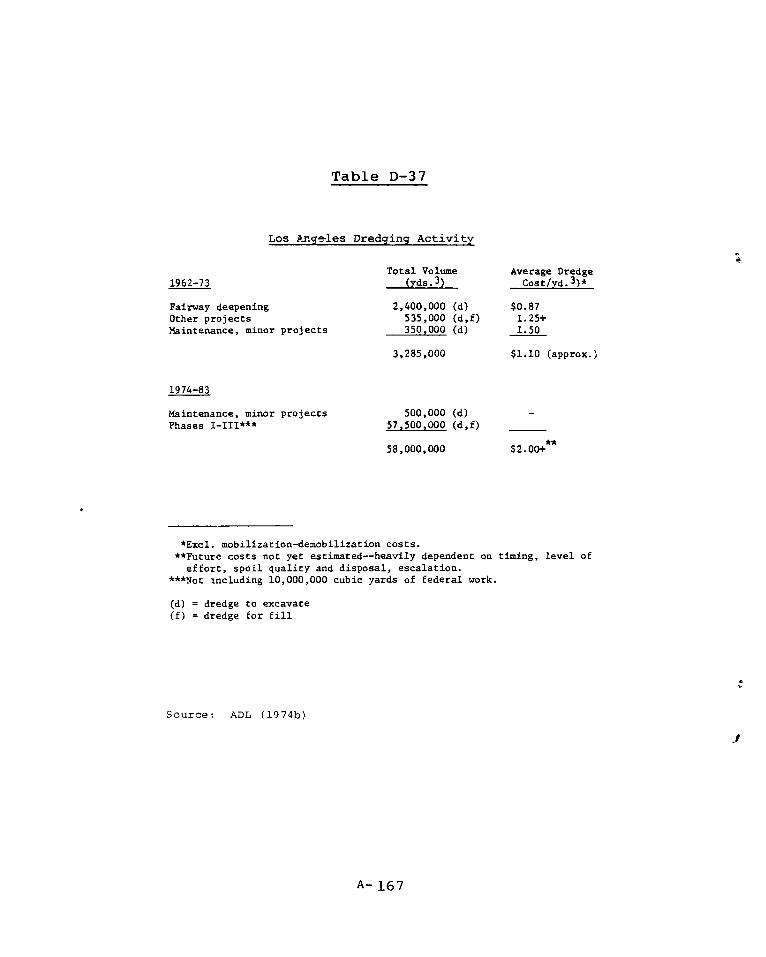
Maintenance, minor projects Phases I-III***
500,000 (d) 57,500,000 (d,f)
58,000,000 **
$2.00+
Table D-37
1962-73
Los Angeles Dredging Activity
Total Volume (yds. 3)
Average Dredge Cost/yd. 3 )*
Fairway deepening Other projects Maintenance, minor projects
2,400,000 (d) 535,000 (d,f) 350,000 (d)
3,285,000
$0.87 1.25+ 1.50
$1.10 (approx.)
1974-83
*Excl. mobilization-demobilization costs. **Future costs not yet estimated--heavily dependent on timing, level of
effort, spoil quality and disposal, escalation. ***Not including 10,000,000 cubic yards of federal work.
(d) = dredge to excavate (f) = dredge for fill
Source: ADL (1974b)
A- 167

miles from the Columbia River mouth, at the confluence of the Columbia and Willamette Rivers. Because of the need for improved navigation between the sea and the developing commercial and industrial center in the City of Portland, the Port of Portland Commission was created in 1891. As a result of local efforts, and the continued improvement of the various modes of transportation between Portland and the hinterland, the City of Portland became the major pop-ulation center for Oregon.
As indicated in Table D-38, approximately 33 mil-lion cubic yards of dredged material (including fill) were moved in the port area of Portland during the last ten years. This averages some 3.3 million yards per year. However, 90% of this annual volume (3.0 million) was moved by dredging equipment operated by the Port Authority on Port of Portland projects. Private dredging contractors moved a total of about 3.2 million over the past ten years, or an average of 300,000 yards per year.
Average cost of dredging by private contractors has been about $1.00 per cubic yard. Costs during the past several years on some projects have been higher.
It is expected that the volume of dredged mater-ial to be moved between 1974 and 1983 will decline rela-tive to the past ten years. Aggregate volume is estimated to total roughly 21 million cubic yards, or a 40% reduc-tion. This level of activity would represent an average annual volume of 2.0 million yards. The anticipated volume of dredging work within the port district is ex-pected to maintain its historical ratio between Port Authority dredging and private contractor dredging. For the 1974-1983 period, expected volume to be moved by private contractors will approximate 200,000 cubic yards per year at a cost of between $1.50 to $2.00 per cubic yard, depending not only on cost escalations but even more importantly, disposal site locations.
Most of the non-channel maintenance dredging activity in the Portland Inner Harbor area is typically handled by clamshell or bucket dredging equipment. The Port Authority has one bucket dredge, which they use in-frequently on the Port Authority's own docks. In general, approximately 80% of all non-channel maintenance dredging conducted within the Inner Harbor area is done by contract to private dredgers, with only 20% of the maintenance. dredging conducted by the Port Authority's own equipment.
A- 16R

Table D-38
1963-1973
Portland Dredging Summary
Volume (Yds.?)
Average Dredge Cost/Yd.*
Maintenance 1,000,000 (d) $ .80 Rivergate - Public ** 20,000,000 (f) .50 Rivergate - Private 500,000 (d) 1.00 Dock Commission 600,000 (d&f) .90 Swan Is. Port Center 3,000,000 (f) .50 Terminals #1, 4, and 6' 900,000 (d)
.50 500,000 (f) New Airport Exp. 5,000,000 (f) .50 Misc. Port Authority Projects 500,000 (d) .50 Misc. Private Projects 700,000 (d) 1.00
Estimated Total 33,300,000 $ .55
Portland Port Authority Dredge 30,100,000 .50 Private Dredging Contractors 3,200,000 1.00
1974-1983
Maintenance 1,100,000 $1.00 - $1.50 20% Port Authority 80 Private dredging Co.'s
Rivergate 18,000,000 (d&f) $ .50 - 0.75 100% Port Authority
Other (not specified) 1,500,000 (d&f) 1.00 - 2.00 35% Port Authority 65% Private dredging Co.'s
Estimated Total
Portland Port Authority Dredge Private Dredging Contractors
20,600,000
18,700,000 $ .65 - 1.00
1,900,000 1.50 - 2.00
*Excluding Mob/DeMob. costs **Started in 1965, complete in 1980
***Future costs dependent upon Port Authority equipment use, cost escalation and spoil disposal requirements.
(d) = dredge to excavate (f) = dredge to fill
Source: ADL (1974b)
A-169

Non-channel maintenance dredging in the Inner Harbor area has averaged about 100,000 yards per year.
The most serious constraint on future work in the Columbia and Willamette Rivers over the next ten years is disposal sites. The COE has several disposal sites within the Columbia River, along the river banks, and several miles offshore for bar dredging activity. Dredged sedi-ments are not polluted in the Columbia River, but rather are clean sand. Consequently, no dredged material dispos-al problem exists. However, there is a restriction on most dredging activities during parts of the year because of annual salmon and steelhead runs.
A problem on the Columbia and Willamette Rivers is that dredged material disposal areas are becoming ex-hausted near dredging areas. Over the past 20 years, the COE has built beaches over practically the entire length of the lower Columbia River with the dredged sands. The trend seems to be now to put dredged material further in-land. These areas are not easy to reach without powerful pumping capacity. Dredge Oregon, used by the COE, has the ability to pump about three miles with attached booster pumps.
Given the trend toward more remote disposal sites, the application of boosters to pipeline dredging is a near certainty. This will have the effect of increasing the overall dredging costs per yard by 35% to 45%. Furthermore, barges may increasingly be used to deliver material to a predetermined site for spoil disposal.
The Lower Willamette River (Inner Harbor) has a slightly different problem than exists on the Columbia. Dredged materials are basically clays and silt. A signif-icant portion of these sediments drops out in the Portland area as the Willamette widens and the river velocity slows, compared to the narrower width and much higher velocities further upstream.
The Port of Portland is responsible by the 40-foot project agreement to provide the COE with mainten-ance disposal sites along the Lower Willamette River. In the past, arrangements have been made with private land owners or port-owned land has been used. The present maintenance disposal site is adequate for the next five years, assuming an average of 500,000 cubic yards of COE maintenance per year. There is no easily identified site
A-170
available to be used following the fill of the presently used spoil site. The Port Authority is studying this problem. Very little in-water disposal occurs in the Willamette River. A primary concern of Portland citizens is turbidity caused by dredging and its affect on fish runs along the Willamette. The end of the easily reach-able disposal sites is at hand within the Portland port area.
(p) Segments 57-59 - Alaska
Information on dredging volumes and costs is summariz-ed in Table D-39. Disposal of dredged material is cur-rently either open water Or confined. Deep ocean disposal of dredged material from Valdez and Anchorage in the Gulf of Alaska is not considered feasible (Pequegnat et. al., 1978). Consider the fact that it is about 260 km from Anchorage to the entrance of Cook Inlet before the depth increases to 180 m. Also, navigation in Cook Inlet, especially with barges, is very difficult because of a large tidal range, unpredictable currents, and boulder strewn shoals.
(q) Segment 60 - Hawaii, Guam, American Samoa
Dredging information for this segment is summarized in Table D-40.
1. Hawaii
(a) Maintenance Dredging. In the past, maintenance dredging has frequently utilized federally owned and operated hydraulic suction hopper dredges. Hydraulic cutterhead suction dredges and barge-mounted cranes have also been utilized to some extent, but are mainly limited to new work dredging and main-tenance around piers and wharves, respectively (COE, 1975 e).
Ocean dumping is the primary method of dredge spoil disposal for USACOE harbor
A-171
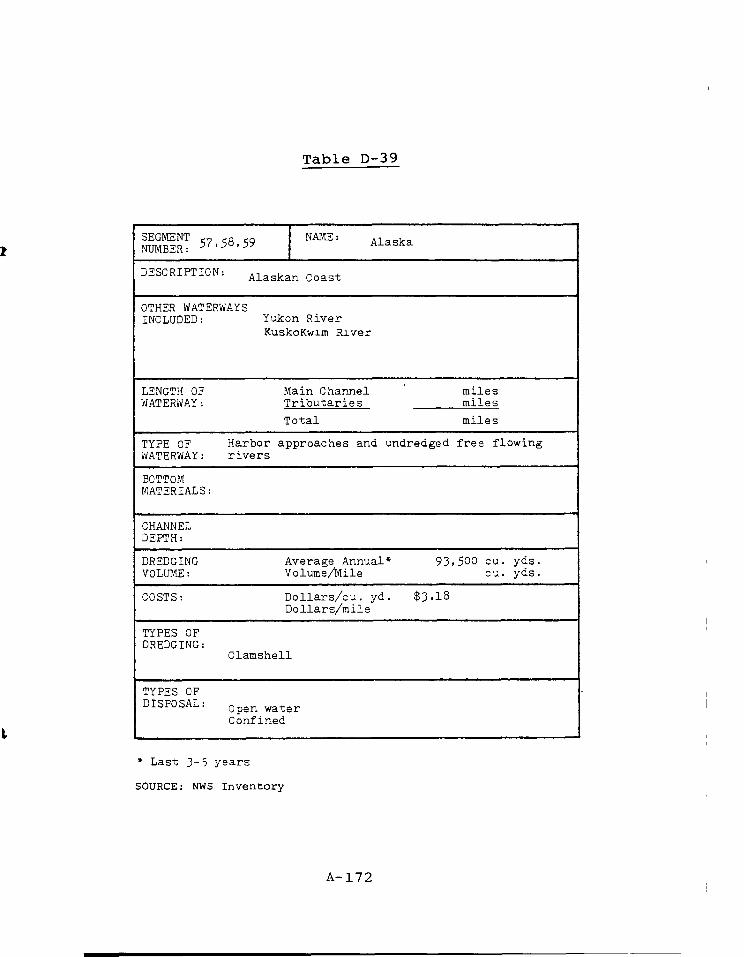
Table D-39
SEGMENT 57,58,59 NAME: Alaska NUMBER:
DESCRIPTION: Alaskan Coast
OTHER WATERWAYS INCLUDED: Yukon River
KuskoKwim River
LENGTH OF Main Channel miles WATERWAY: Tributaries miles
Total miles
TYPE OF Harbor approaches and undredged free flowing WATERWAY: rivers
BOTTOM MATERIALS:
CHANNEL DEPTH:
DREDGING Average Annual* 93,500 cu. yds. VOLUME: Volume/Mile Cu. yds.
COSTS: Dollars/cu. yd. $3.18 Dollars/mile
TYPES OF DREDGING:
Clamshell
TYPES OF DISPOSAL: Open water
Confined
* Last 3 - 5 years
SOURCE: NWS Inventory
A- 172

Table D-40
SEGMENT 60 NAME: West Pacific Ocean NUMBER:
DESCRIPTION:
OTHER WATERWAYS INCLUDED: Hawaii
Guam American Sumoa
LENGTH OF Main Channel miles WATERWAY: Tributaries miles
Total miles
TYPE OF WATERWAY: Harbor approaches
BOTTOM MATERIALS:
CHANNEL DEPTH:
DREDGING Average Annual* 151,800 cu. yds. VOLUME: Volume/Mile Cu. yds.
COSTS: Dollars/cu. yd. $1.36 Dollars/mile
TYPES OF Clamshell DREDGING: Dragline
Hopper Plain suction
TYPES OF DISPOSAL: Confined
Ocean dumping
* Last 3 - 5 years
SOURCE: NWS Inventory
A-173
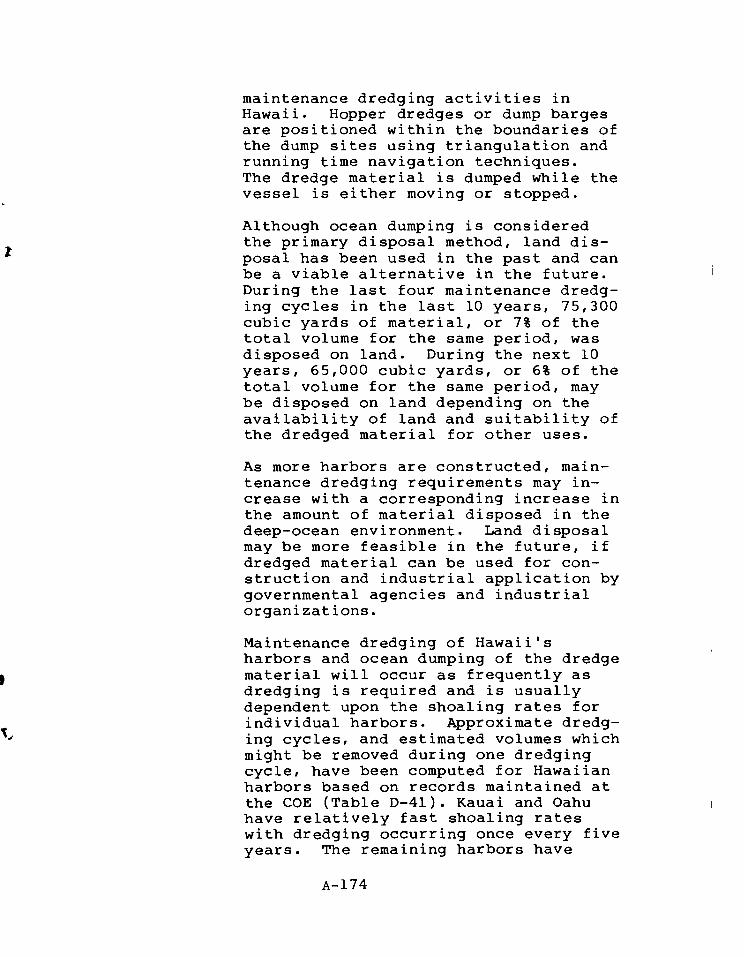
1
maintenance dredging activities in Hawaii. Hopper dredges or dump barges are positioned within the boundaries of the dump sites using triangulation and running time navigation techniques. The dredge material is dumped while the vessel is either moving or stopped.
Although ocean dumping is considered the primary disposal method, land dis-posal has been used in the past and can be a viable alternative in the future. During the last four maintenance dredg-ing cycles in the last 10 years, 75,300 cubic yards of material, or 7% of the total volume for the same period, was disposed on land. During the next 10 years, 65,000 cubic yards, or 6% of the total volume for the same period, may be disposed on land depending on the availability of land and suitability of the dredged material for other uses.
As more harbors are constructed, main-tenance dredging requirements may in-crease with a corresponding increase in the amount of material disposed in the deep-ocean environment. Land disposal may be more feasible in the future, if dredged material can be used for con-struction and industrial application by governmental agencies and industrial organizations.
Maintenance dredging of Hawaii's harbors and ocean dumping of the dredge material will occur as frequently as dredging is required and is usually dependent upon the shoaling rates for individual harbors. Approximate dredg-ing cycles, and estimated volumes which might be removed during one dredging cycle, have been computed for Hawaiian harbors based on records maintained at the COE (Table D-41). Kauai and Oahu have relatively fast shoaling rates with dredging occurring once every five years. The remaining harbors have
A-174
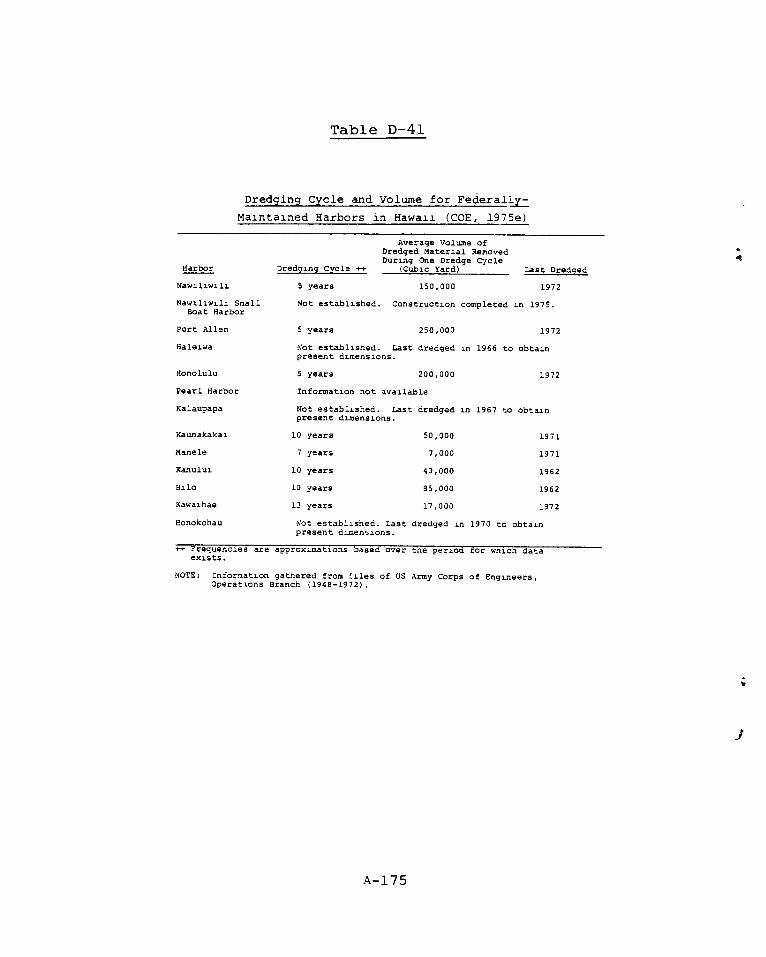
Table D-41
Dredging Cycle and Volume for Federally-
Maintained Harbors in Hawaii (COE, 1975e)
Average Volume of Dredged Material Removed During One Dredge Cycle
Harbor Dredging Cycle ++ (Cubic Yard) Last Dredged
Nawiliwili 5 years 150,000 1972
Nawiliwili Small Not established. Construction completed in 1975. Boat Harbor
Port Allen 5 years 250,000 1972
Haleiwa Not established. Last dredged in 1966 to obtain present dimensions.
Honolulu 5 years 200,000 1972
Pearl Harbor Information not available
Kalaupapa Not established. Last dredged in 1967 to obtain present dimensions.
Kaunakakai 10 years 50,000 1971
Manele 7 years 7,000 1971
Kahului 10 years 40,000 1962
Hilo 10 years 85,000 1962
Kawaihae 13 years 17,000 1972
Honokohau Not established. Last dredged in 1970 to obtain present dimensions.
++ Frequencies are approximations based over the period for which data exists.
NOTE: Information gathered from !Iles of US Army Corps of Engineers, Operations Branch (1948-1972).
A-175

dredging cycles varying between 7-13 years three harbors have no record because they were recently constructed. As seen on Table 40, two harbors have exceeded the computed dredge cycle time limit. This only indicates that bathy-metric surveys have not located any shoal area within the authorized fed-eral harbor boundaries and suggests a slow shoaling rate. Dredged volumes for any one particular job vary widely, ranging from 7,000 - 250,000 cubic yards of material.
Past records for the last four dredging cycles within a 10 year period indicate that approximately 1,049,000 cubic yards of material have been removed from Hawaii's harbors. In the next 10 years, an estimated 988,000 cubic yards of material will be removed from Hawaii's harbors by maintenance dredg-ing. New maintenance dredging require-ments will be additive to the projected figures, and the estimates do not re-flect United States Navy, local govern-ment and private interest's dredging activities.
Cost estimates based on records for the last four maintenance dredging cycles within the past 10 years for all Hawai-ian harbors indicate that approximately 1,048,000 cubic yards of dredged mater-ial were removed at a total cost of $1,215,978 (total cost includes mobil-ization/demobilization, engineering, etc.). The cost of removing the mater-ial averaged approximately $2.14 per cubic yard (calculated by averaging individual costs for each dredging operation). In the next 10 years, 988,000 cubic yards of material will be removed for an estimated total cost of $1,856,720. The estimated cost of re-moving the material averaged $3.65 a cubic yard (average cost per cubic yard was calculated by averaging cost/ cubic yard for each individual dredging job).
A-176
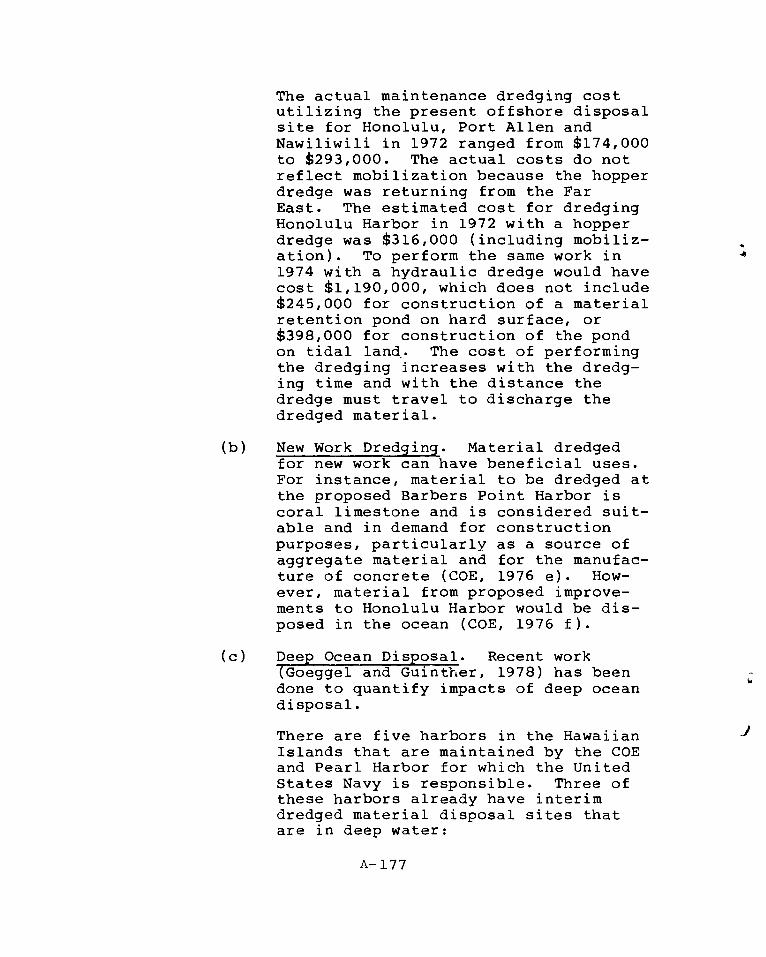
The actual maintenance dredging cost utilizing the present offshore disposal site for Honolulu, Port Allen and Nawiliwili in 1972 ranged from $174,000 to $293,000. The actual costs do not reflect mobilization because the hopper dredge was returning from the Far East. The estimated cost for dredging Honolulu Harbor in 1972 with a hopper dredge was $316,000 (including mobiliz-ation). To perform the same work in 1974 with a hydraulic dredge would have cost $1,190,000, which does not include $245,000 for construction of a material retention pond on hard surface, or $398,000 for construction of the pond on tidal land. The cost of performing the dredging increases with the dredg- ing time and with the distance the dredge must travel to discharge the dredged material.
(b) New Work Dredging. Material dredged for new work can have beneficial uses. For instance, material to be dredged at the proposed Barbers Point Harbor is coral limestone and is considered suit-able and in demand for construction purposes, particularly as a source of aggregate material and for the manufac-ture of concrete (COE, 1976 e). How-ever, material from proposed improve-ments to Honolulu Harbor would be dis-posed in the ocean (COE, 1976 f).
(c) Deep Ocean Disposal. Recent work (Goeggel and Guinther, 1978) has been done to quantify impacts of deep ocean disposal.
There are five harbors in the Hawaiian Islands that are maintained by the COE and Pearl Harbor for which the United States Navy is responsible. Three of these harbors already have interim dredged material disposal sites that are in deep water:
A-177

- Honolulu Harbor in 460 m. - Nauwukuwuku Harbor in 1000 m. - Port Allen in 1540 m.
All of these are interim dredged mater-ial sites (Pequegnat et al., 1978).
2. Guam. The Guam CZM Study (Office of Coastal Zone Management, 1979 a) did not address dredging and dredged material disposal.
(r) Segment 61 - Puerto Rico, Virgin Islands
Information concerning dredging in the Caribbean is summarized in Table D-42.
Dredging in the Virgin Islands has been noted as an environmental concern (Office of Coastal Zone Management, 1979b). Dredging of sand and other materials to create artificial landfill and marina sites, improve navigation and provide construction aggregate has occurred in near-shore areas on a large scale and altered and destroyed natural cycles and ecosystems, such as mangrove areas, saltponds and beaches.
The most notable activities of this type are: the filling and dredging of Krause Lagoon, St. Croix, and Mosquite (Lindberg) Bay, St. Thomas; the piecemeal con-struction activities at the Mangrove Lagoon, St. Thomas; the stripping of sand on the east of St. Croix. dredging in Christiansted Harbor; and the alteration of the Mandahl Saltpond, St. Thomas.
Four harbors were evaluated by Pequegnat et al. (1978). Only the material from San Juan Harbor has been disposed of in the deep ocean in 260-300 m of water off the north coast of Puerto Rico.
SUMMARY AND CONCLUSIONS
Dredging and dredged material disposal have identifiable environmental impacts: however, the impacts are not always quantifiable especially in terms to make
A-178
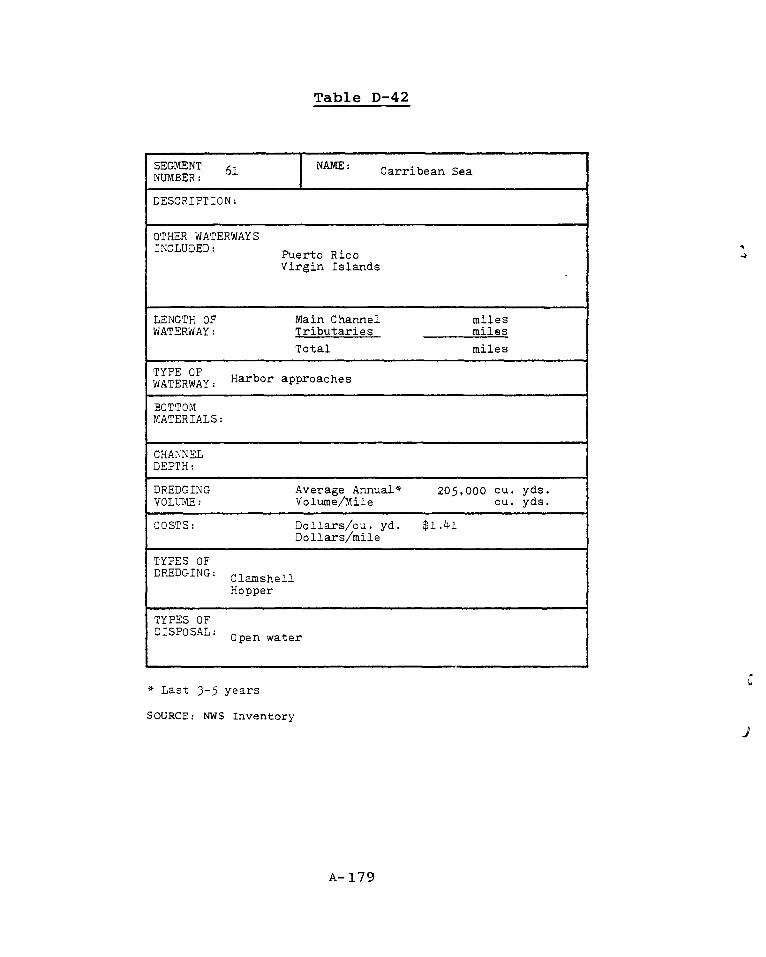
Table D-42
SEGMENT 61 NAME: Carribean Sea NUMBER:
DESCRIPTION:
OTHER WATERWAYS INCLUDED: Puerto Rico
Virgin Islands
LENGTH OF Main Channel miles WATERWAY: Tributaries miles
Total miles
TYPE OF WATERWAY: Harbor approaches
BOTTOM MATERIALS:
CHANNEL DEPTH:
DREDGING Average Annual* 205,000 cu. yds. VOLUME: Volume/Mile cu. yds.
COSTS: Dollars/cu. yd. $1.41 Dollars/mile
TYPES OF DREDGING: Clamshell
Hopper
TYPES OF DISPOSAL: Open water
* Last 3 - 5 years
SOURCE: NWS Inventory
A- 179

ii
meaningful comparisons to background conditions and natur-al fluctuations in various parameters.
Table D-43 summarizes the segment data, presenting quantities and costs of dredging. In addition, the pre-dominant type, or types, of dredges and material disposal are shown. Quite clearly, cutterheads predominate on in-land waterways while hopper dredges predominate on harbor approaches. An exception is the free-flowing Lower Mis-sissippi and Missouri Rivers which are served by dustpan dredges.
In addition, the final two columns in Table D-43 show the relative importance of dredging to waterway mainten-ance and relative level of environmental concern. It is to be noted that all these judgments are relative and that the implied unimportance of dredging for some seg-ments does not indicate that dredging is not required to maintain channel dimension, but only that it is less crit-ical than in other segments for which it is clearly shown as important. Again, a low level environmental concern does not indicate that environmental regulations are not enforced, only that impact is less than in segments shown to have a high concern.
Caution must be applied in interpreting the figures in Table D-43 as a number of anomalies have been discovered in the NWS Inventory on which they are based. In par-ticular, it is not clear that districts have used the same bases for reporting, and figures from different districts are probably not strictly comparable. They do, however, show the relative magnitude of dredging between different segments so as to indicate key areas of concern.
The areas of most critical concern appear to be the main stem of the Mississippi from Minneapolis to the Gulf of Mexico, the approaches to the major ports, and the Great Lakes. Of the inland waterways, the Upper Missis-sippi has been subject to the most intensive investigation under the GREAT program.
There are a great number of existing federal and state laws that affect the ability to dredge and dispose of the
A-180
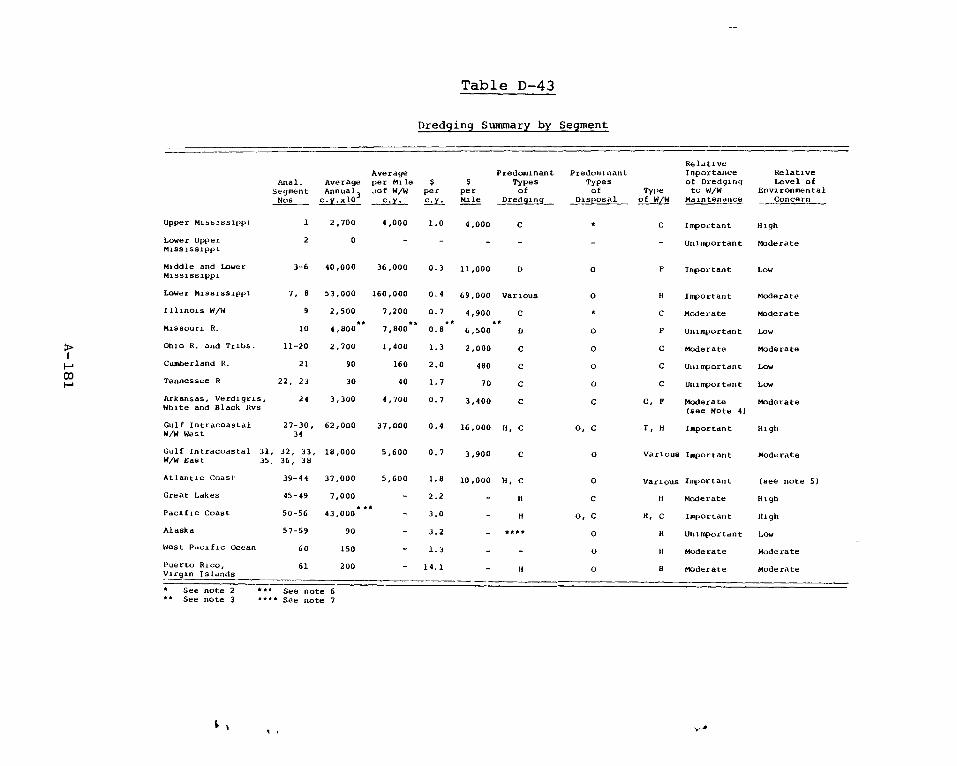
Upper Mississippi 1 2,700 4,000 1.0 Important High 4,000
2 0 Lower Upper Mississippi
Unimportant Moderate
Low 11,000 Middle and Lower 3-6 40,000 36,000 0.3 Mississippi
F Important
;
Table D-43
Dredging Summary by Segment
Relative
Average Predominant Predominant Importance Relative Anal. Average per Mile $ $ Types Types of Dredging Level of Segment Annual 3 .of W/W per per of of Type to W/W Environmental Nos c.y.x10 c.y. c.y. Mile Dredging Disposal of W/W Maintenance Concern
Lower Mississippi 7, 8 53,000 160,000 0.4 69,000 Various 0 H Important Moderate
Illinois W/W 9 2,500 7,200 0.7 4,900 C . C Moderate Moderate ** ** ** **
Missouri R. 10 4,800 7,800 0.8 6,500 D 0 F Unimportant Low
Ohio R. and Tribs. 11-20 2,700 1,400 1.3 2,000 C 0 C Moderate Moderate
Cumberland R. 21 90 160 2.0 480 C 0 C Unimportant Low
Tennessee R 22, 23 30 40 1.7 70 C o C Unimportant Low
Arkansas, Verdigris, 24 3,300 4,700 0.7 3,400 C C C, F Moderate Moderate White and Black Rvs (see Note 4)
Gulf Intracoastal 27-30, 62,000 37,000 0.4 16,000 H, C 0, C I, H Important High W/W West 34
Gulf Intracoastal 31, 32, 33, 18,000 5,600 0.7 3,900 C 0 Various Important Moderate W/W East 35, 36, 38
Atlantic Coast 39-44 37,000 5,600 1.8 10,000 li, C 0 Various Important (see note 5)
Great Lakes 45-49 7,000 - 2.2 - H C H Moderate High ***
Pacific Coast 50-56 43,000 - 3.0 - H 0, C H, C Important High
Alaska 57-59 90 - 3.2 _ **** 0 H Unimportant Low
West Pacific Ocean 60 150 - 1.3 - - 0 H Moderate Moderate
Puerto Rico, 61 200 - 14.1 - H 0 H moderate Moderate Virgin Islands
* See note 2 *** See note 6 ** See note 3 **** See note 7
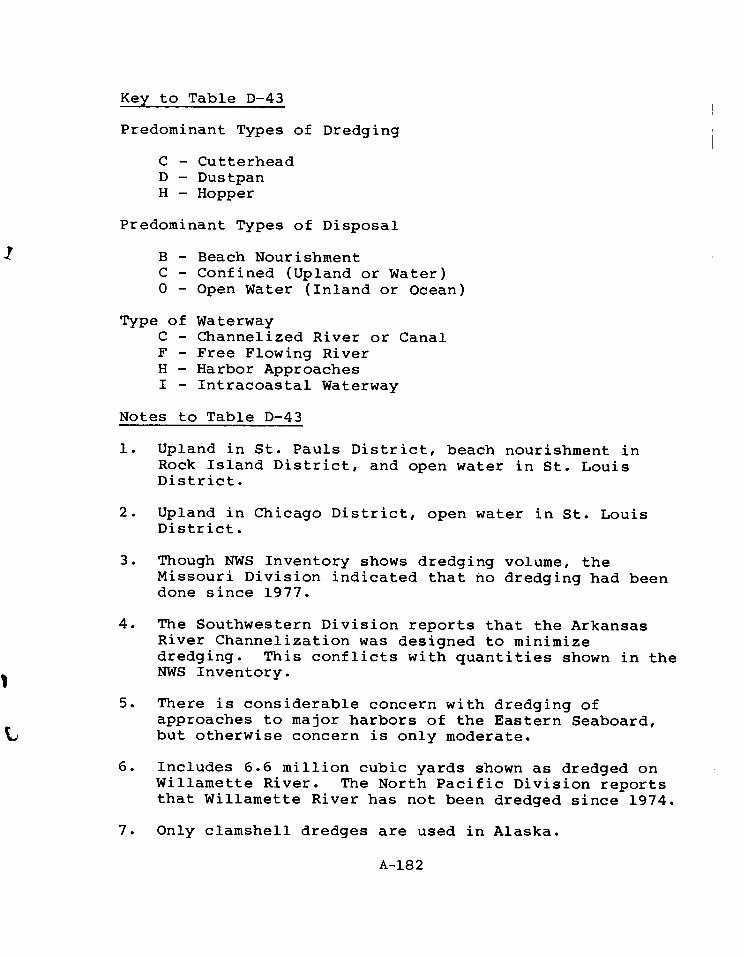
Key to Table D-43
Predominant Types of Dredging
C - Cutterhead D - Dustpan H - Hopper
Predominant Types of Disposal
B - Beach Nourishment C - Confined (Upland or Water) O - Open Water (Inland or Ocean)
Type of Waterway C - Channelized River or Canal F - Free Flowing River H - Harbor Approaches I - Intracoastal Waterway
Notes to Table D-43
1. Upland in St. Pauls District, beach nourishment in Rock Island District, and open water in St. Louis District.
2. Upland in Chicago District, open water in St. Louis District.
3. Though NWS Inventory shows dredging volume, the Missouri Division indicated that no dredging had been done since 1977.
4. The Southwestern Division reports that the Arkansas River Channelization was designed to minimize dredging. This conflicts with quantities shown in the NWS Inventory.
5. There is considerable concern with dredging of approaches to major harbors of the Eastern Seaboard, but otherwise concern is only moderate.
6. Includes 6.6 million cubic yards shown as dredged on Willamette River. The North Pacific Division reports that Willamette River has not been dredged since 1974.
7. Only clamshell dredges are used in Alaska.
A-182
material. The specific implications of the various laws and the variability of their enforcement from region to region and state to state are beyond the scope of this study.
The major sources of data on environmental problems for particular segments are in various Environmental Impact Statements (EISs) prepared for maintenance dredg-ing. However, these documents suffer from two general weaknesses: first, they do not address technical aspects of dredging as they relate to environmental considera-tions; and second, they do not discuss all alternative methods of either reducing dredge material quantities, or of disposal, which could logically be considered.
On the technical side, they often discuss methods of dredging generically rather than specifically. They do not discuss depth of cut, shoaling patterns, or the needs for pre-maintenance dredging. Only in the GREAT I study were any of these issues addressed. Because of this detail, it was possible to propose innovative engineering techniques to reduce the amount of material to be dredg-ed. Also, due to insufficient data, it is not possible to say to what degree these or other techniques could be used on other segments to reduce dredging volumes. However, it is important to note that, at least in one segment, dredg-ing costs did not go up with increased environmental re-strictions. The cost per cubic yard did go up, but dredg-ing volumes were reduced with only marginal impacts to waterway traffic.
Among the alternative methods of disposal of dredge material only a few are discussed in the EISs and it is not clear whether the others have been left out by over-sight or because they are totally impractical. In addi-tion, there is seldom reference to the work of the Dredged Material Research Program, either directly or indirectly.
..01
Another major problem in assessing environmental con-straints is the variability of available data between seg-ments in regard to quantity, type, detail and method of reporting the data in the NWS Inventory. It is unclear in either instructions to districts for reporting or in the Inventory itself whether dredge material quantities stated
A-183
are gross or credited. In reporting, the districts had the opportunity of selecting virtually every type of dredge used in the United States, yet 12% of the dredging volume is inexplicably accounted for by "other" types of dredges. It is well known that most disposal in the St. Paul District is to diked upland sites, yet the inventory shows disposal to "other" rather than confined sites.
A-184