EA 366FW to Gowen Field
127
FINAL ENVIRONMENTAL ASSESSMENT FOR T H E PROPOSED TEMPORARY RELOCATION OF THE 366TH FIGHTER WING Prepared by Mountain Home Air Force Base Air Combat Command For Idaho Air National Guard FEBRUARY 18, 2015
-
Upload
124th-fighter-wing -
Category
Government & Nonprofit
-
view
5.138 -
download
0
Transcript of EA 366FW to Gowen Field

FINAL ENVIRONMENTAL ASSESSMENT FOR T H E PROPOSED TEMPORARY RELOCATION OF THE 366TH FIGHTER WING
Prepared by
Mountain Home Air Force Base
Air Combat Command
For
Idaho Air National Guard
FEBRUARY 18, 2015

Intentionally Left Blank
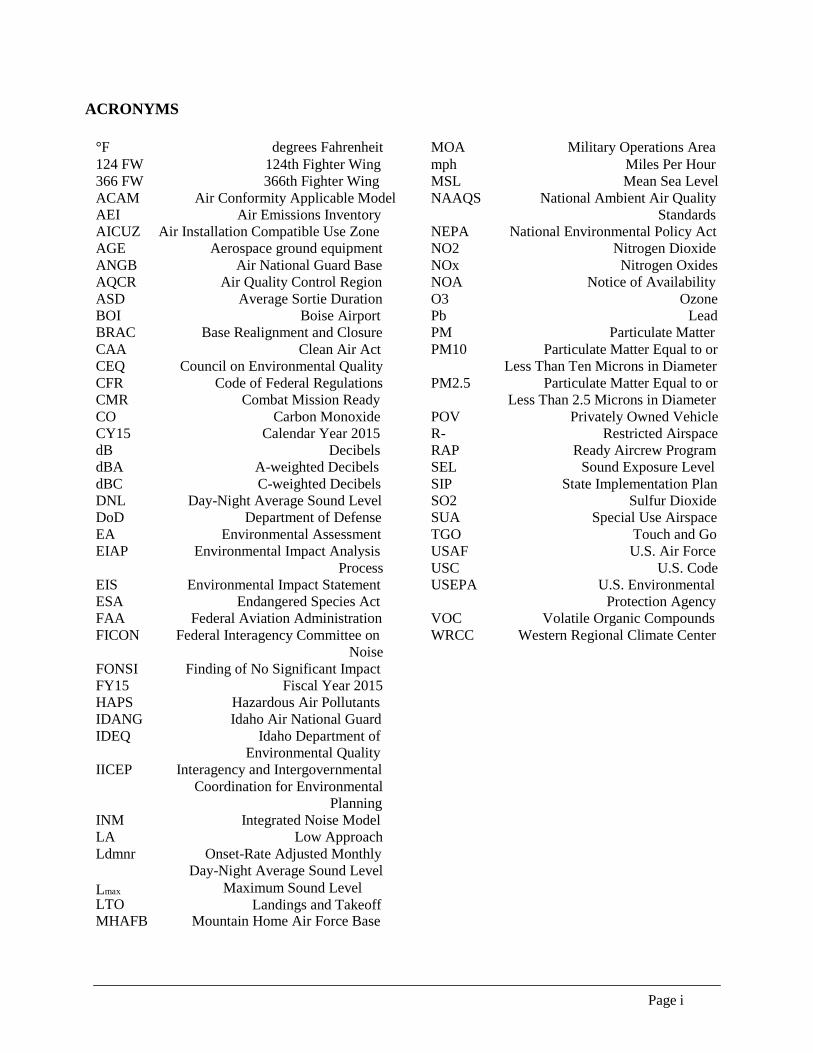
ACRONYMS
°F degrees Fahrenheit MOA Military Operations Area 124 FW 124th Fighter Wing mph Miles Per Hour 366 FW 366th Fighter Wing MSL Mean Sea Level ACAM Air Conformity Applicable Model NAAQS National Ambient Air Quality AEI Air Emissions Inventory Standards AICUZ Air Installation Compatible Use Zone NEPA National Environmental Policy Act AGE Aerospace ground equipment NO2 Nitrogen Dioxide ANGB Air National Guard Base NOx Nitrogen Oxides AQCR Air Quality Control Region NOA Notice of Availability ASD Average Sortie Duration O3 Ozone BOI Boise Airport Pb Lead BRAC Base Realignment and Closure PM Particulate Matter CAA Clean Air Act PM10 Particulate Matter Equal to or CEQ Council on Environmental Quality Less Than Ten Microns in Diameter CFR Code of Federal Regulations PM2.5 Particulate Matter Equal to or CMR Combat Mission Ready Less Than 2.5 Microns in Diameter CO Carbon Monoxide POV Privately Owned Vehicle CY15 Calendar Year 2015 R- Restricted Airspace dB Decibels RAP Ready Aircrew Program dBA A-weighted Decibels SEL Sound Exposure Level dBC C-weighted Decibels SIP State Implementation Plan DNL Day-Night Average Sound Level SO2 Sulfur Dioxide DoD Department of Defense SUA Special Use Airspace EA Environmental Assessment TGO Touch and Go EIAP Environmental Impact Analysis USAF U.S. Air Force
Process USC U.S. Code EIS Environmental Impact Statement USEPA U.S. Environmental ESA Endangered Species Act Protection Agency FAA Federal Aviation Administration VOC Volatile Organic Compounds FICON Federal Interagency Committee on WRCC Western Regional Climate Center
Noise FONSI Finding of No Significant Impact FY15 Fiscal Year 2015 HAPS Hazardous Air Pollutants IDANG Idaho Air National Guard IDEQ Idaho Department of
Environmental Quality IICEP Interagency and Intergovernmental
Coordination for Environmental Planning INM Integrated Noise Model LA Low Approach Ldmnr Onset-Rate Adjusted Monthly
Day-Night Average Sound Level Lmax LTO
Maximum Sound Level Landings and Takeoff
MHAFB Mountain Home Air Force Base
Page i

FINDING OF NO SIGNIFICANT IMPACT
Temporary Relocation of the 366th Fighter Wing
Pursuant to provisions of the National Environmental Policy Act (NEPA), Title 42 United States Code (USC) Sections 4321 to 4347, implemented by Council on Environmental Quality (CEQ) Regulations, Title 40, Code of Federal Regulations (CFR) §1500-1508, and 32 CFR §989, Environmental Impact Analysis Process, the U.S. Air Force (Air Force) assessed the potential environmental consequences associated with temporarily relocation of the 366th Fighter Wing (366 FW) aircraft and support personnel during calendar year 2015.
The Proposed Action is to relocate up to 54 F-15E/SG aircraft, associated support equipment and personnel for 120 days during CY15. Under this action, 366 FW would fly an appropriate number of sorties in relation to the number of aircraft relocated under this action to meet the overall RAP (Ready Aircrew Program) requirement. A portion of the sorties required during the Mountain Home Air Force Base (MHAFB) runway repairs may be flown at a different location under the authority of a different NEPA document and/or AICUZ (Air Installations Compatible Use Zones) capacity. While temporarily relocated, 366 FW would use existing facilities with no required modifications, construction, or demolition.
The Environmental Assessment (EA), incorporated by reference into this finding, analyzes the potential environmental consequences of activities associated with temporary relocation of the 366 FW and provides any environmental protection measures necessary to avoid or reduce adverse environmental impacts.
The EA considers all potential impacts of the temporary relocation. The EA also considers cumulative environmental impacts with other projects associated with all alternatives.
PREFERRED ALTERNATIVE
Preferred Alternative would temporarily relocate 366 FW aircraft to Gowen Field Air National Guard Base (ANGB). This Alternative would include the relocation of up to 54 F-15E aircraft, associated support equipment, and personnel for 120 days during CY15. While deployed to Gowen Field ANGB, the 366 FW would utilize existing facilities of the ID ANG, no modifications, demolition, or constructed would be conducted.
The 366 FW operations at Gowen Field ANGB would consist of landings and takeoff (an LTO cycle includes taxiing between the hangar and runway, taking off, climbing out of the local pattern, descending from the local pattern, and touch down) and touch and go’s (TGO). A touch and go includes taxiing between hangar and runway, taking off, climbing out of local pattern, descending, touch down, and take off to repeat pattern. Operationally, implementation of this Alternative Action would include up to 450 sorties flown by the 366 FW out of Gowen Field ANGB during a 120 day period; these training sorties would depart from and return to Gowen Field ANGB. Departing flights would require 100% afterburner (AB) use to minimize flight safety risks. When temperatures are above 32°F, afterburners provide an increase in thrust for F-15E aircraft during takeoff flight operations would be conducted in existing military operational airspace in the region including Restricted Areas R-3203 and R-3202. Training would not occur over the city of Boise. For this Alternative, the 366 FW would fly an average of 10 sorties per day with average sortie duration (ASD) of 1.5 hours. During the temporary relocation period, it is anticipated that the 190th Fighter Squadron (190 FS) of the 124th Fighter Wing (124 FW) would maintain existing A-10 operations of approximately 12 sorties per day.
Page ii

The Air Force performed extensive noise analysis to develop this alternative so that it meets the selection standard requiring no significant noise impacts on the community. As part of this analysis, 366 FW identified several adjustments to their typical flight profiles to avoid noise impacts on sensitive areas of the community. The number of sorties analyzed, runway utilization, flight tracks, and profiles were varied to achieve < 3 dB change at noise sensitive receptors within the Preferred Alternative. Specific elements of this alternative include:
• Runway 10R tracks modified to turn south sooner than previously modeled (just beyond the runway threshold)
• Departure Runway Utilization changed to 20% Runway 10R and 80% Runway 28L • 1/3 of all F-15E operations were modeled with F100-PW-220 engine (training of the Royal
Singapore Air Force) and 2/3 were modeled with F100-PW-229 engine (389 FS and 391 FS). • For F-15Es with 229 engine, departures modeled with 15 degree climb angle at 400ft AGL when
AB turns off to 5,000ft MSL
After accounting for these changes in the flight profile, the Air Force identified that a maximum of 450 sorties with afterburner takeoffs would not cause significant noise impacts on the community.
The Preferred Alternative would allow up to 54 F-15E aircraft to relocate to Gowen Field ANGB and fly up to 450 sorties without having a significant impact on the human environment. Since only a portion of the FY15 RAP sortie requirements could be met during the 120 days, MHAFB would be required to fly remaining sorties at additional locations meeting both existing AICUZ and NEPA capacity.
The Preferred Alternative, with a maximum of 450 sorties at 100% AB, would meet the purpose and need and satisfies all selection standards. Additionally, the Preferred Alternative will have no significant impact on air pollution, air space, or safety regarding the community.
ALTERNATIVE B: NO-ACTION ALTERNATIVE
The No-Action Alternative provides the existing baseline environment to which the potential impacts of the action for each alternative will be compared. Under this alternative, the 366 FW would not temporarily relocate. As a result, the 366 FW would be unable to conduct flight training activities due to the comprehensive airfield reconstruction project scheduled for implementation at MHAFB and would be unable to meet its mission readiness requirements. However, because Council on Environmental Quality regulations stipulate that the No-Action Alternative be analyzed to assess any environmental consequences that may occur if the Proposed Action is not implemented, the No-Action Alternative will be carried forward for analysis in the EA.
SUMMARY OF FINDINGS
The Air National Guard has concluded that no significant adverse effects would result to the following resources as a result of the Preferred Alternative: biological resources, cultural resources, occupational health and safety, airspace management, noise, air quality, environmental justice, infrastructure and utilities, and hazardous materials management. No significant adverse cumulative impacts would result from activities associated with the adoption of the Preferred Alternative when considered with past, present, or reasonably foreseeable future projects. In addition, the EA concluded that the Preferred Alternative would not have significant adverse effects water resources, earth resources, land use, socioeconomics, or transportation.
Page iii

PREFERRED ALTERNATIVE
Preferred Alternative: Temporarily relocate up to 54 F- I 5E aircraft to Gowen Field Air National Guard Base, Boise. Idaho and conduct 450 maximum number of flying operations.
FINDING OF NO SIGNIFICANT IMPACT
Based on my review of the facts and analyses contained in the attached EA, conducted under the provisions of NEPA, CEQ Regulations, and 32 CFR Part 989. I conclude that the Temporary Relocation of the 366 FW to Gowen Field during CY 15 where they wi ll conduct a maximum of 450 sorties would not have a significant environmental impact, either by itself or cumulatively with other projects at any alternative basing location. Accordingly, an Environmental Impact Statement is not required. The signing of this Finding of No Significant Impact completes the environmental impact analysis process.
DATE: Cj /f~{.S ~E~L:A7A Chief, Asset Management Division
Page iv

CONTENTS
ACRONYMS ................................................................................................................................................ i
FINDING OF NO SIGNIFICANT IMPACT ............................................................................................... ii
CONTENTS ................................................................................................................................................. 1
TABLES ................................................................................................................................................... 3
FIGURES ................................................................................................................................................. 3
SECTION 1.0 PURPOSE OF AND NEED FOR THE PROPOSED ACTION .......................................... 4
1.1 INTRODUCTION .............................................................................................................................. 4
1.2 PURPOSE AND NEED FOR THE ACTION .................................................................................... 4
1.3 INTERAGENCYAND INTERGOVERNMENTAL COORDINATIONAND CONSULTATIONS 5
1.4 PUBLIC AND AGENCY REVIEW OF EA ...................................................................................... 5
1.5 BACKGROUND ON GOWEN FIELD ANGB ................................................................................. 5
SECTION 2.0 DESCRIPTION OF PROPOSED ACTION AND ALTERNATIVES ................................ 6
2.1 PROPOSED ACTION ........................................................................................................................ 6
2.1.1 Training Operations ..................................................................................................................... 6
2.2 SELECTION STANDARDS ............................................................................................................. 7
2.3 PREFERRED ALTERNATIVE: GOWEN FIELD ANGB, ID ......................................................... 7
2.4 ALTERNATIVE B: NO-ACTION ALTERNATIVE ........................................................................ 8
2.5 ALTERNATIVES ELIMINATED FROM FURTHER CONSIDERATION .................................... 8
2.5.1 Alternative C: 50% Afterburner / 50% Military Power Takeoff ................................................. 8
2.5.2 Alternative D: 100% Military Power Takeoff ............................................................................. 9
2.5.3 Alternative E: 2200 sorties, 100% Afterburner Takeoff ............................................................. 9
2.6 SUMMARY ....................................................................................................................................... 9
SECTION 3.0 AFFECTED ENVIRONMENT ......................................................................................... 10
3.1 AIR QUALITY ................................................................................................................................ 10
3.1.1 Regulatory Requirements .......................................................................................................... 10
3.1.2 Existing Conditions ................................................................................................................... 12
3.2 NOISE .............................................................................................................................................. 14
3.2.1 Definition of Resource .............................................................................................................. 14
3.2.2 Existing Conditions ................................................................................................................... 16
Page 1

3.3 SAFETY ........................................................................................................................................... 20
3.4 RESOURCES NOT AFFECTED ..................................................................................................... 21
SECTION 4.0 ENVIRONMENTAL CONSEQUENCES ........................................................................ 24
4.1 AIR QUALITY ................................................................................................................................ 24
4.1.1 Approach to Analysis ................................................................................................................ 24
4.1.2 Impacts ...................................................................................................................................... 24
4.2 NOISE .............................................................................................................................................. 26
4.2.1 Approach to Analysis ................................................................................................................ 26
4.2.2 Impacts ...................................................................................................................................... 26
4.3 SAFETY ........................................................................................................................................... 33
4.3.1 Approach to Analysis ................................................................................................................ 33
4.3.2 Impacts ..................................................................................................................................... 34
SECTION 5.0 CUMULATIVE IMPACTS............................................................................................... 34
SECTION 6.0 REFERENCES .................................................................................................................. 35
SECTION 7.0 LIST OF PREPARERS ..................................................................................................... 37
APPENDIX A IICEP DISTRIBUTION LIST/CORESPONDANCE ....................................................... 38
APPENDIX B AIR QUALITY CALCULATIONS .................................................................................. 80
APPENDIX C DETAILS OF NOISE ANALYSIS ................................................................................. 102
APPENDIX D F-15 SAFETY HISTORY................................................................................................ 112
APPENDIX E A-10 SAFETY HISTORY ............................................................................................... 117
Page 2

TABLES
Table 1 De Minimis Levels for Conformity Determination ............................................................................. 11 Table 2. National Standards and Ada County Calendar Year 2013 Statistics .................................................. 13 Table 3. 2011 Annual Emissions for Ada County ............................................................................................ 13 Table 4. 2009 Air Emissions for 124 FW of the IDANG ................................................................................. 13 Table 5. Land Use Analysis under Baseline Conditions .................................................................................. 20 Table 6. Estimated Increase in Mobile Source Emissions Associated with the Preferred Alternative ............ 25 Table 7. Proposed F-15 Flight Operations at Boise International Airport for the Preferred Alternative ......... 27 Table 8. Land Use Analysis for Preferred Alternative and Comparison with Baseline ................................... 33
FIGURES
Figure 1. Typical A-weighted Sound Levels of Common Sounds ................................................................... 15 Figure 2. Aircraft DNL Contours and Land Use for Baseline Scenario ........................................................... 18 Figure 3. Aircraft DNL Gradients for Baseline Scenario ................................................................................. 19 Figure 4. Aircraft DNL Contours and Land Use for Preferred Alternative ...................................................... 29 Figure 5. Aircraft DNL Gradients for Preferred Alternative ............................................................................ 30 Figure 6. Comparison of 65 dB and 75 dB DNL Contours of Baseline and Preferred Alternative ................. 31 Figure 7. Areas of 3 dB DNL Increase within the 65 dB DNL Contour for the Preferred Alternative ............ 32
Page 3

SECTION 1.0 PURPOSE OF AND NEED FOR THE PROPOSED ACTION
1.1 INTRODUCTION
The 366th Fighter Wing (366 FW), Mountain Home AFB (MHAFB) is located in southwestern Idaho approximately 50 miles southeast of Boise and 8 miles southwest of the City of Mountain Home. MHAFB supports three squadrons of F-15E/SG aircraft. The 366 FW has recently approved a comprehensive airfield reconstruction project at MHAFB. In order to continue required training and operational activities during this planned runway construction project, MHAFB is considering temporarily relocating 366 FW aircraft to a compatible installation in order to support the Fiscal Year (FY) 15 Ready Aircrew Program (RAP) Combat Military Ready (CMR) training requirements. This temporary relocation of the 366 FW would include the relocation of up to54 F-15E/SG aircraft, associated support equipment, and personnel for 120 days during calendar year (CY) 2015.
In accordance with the National Environmental Policy Act of 1969 (NEPA), the USAF is preparing this environmental assessment (EA) to evaluate the feasibility and potential environmental impacts associated with temporary relocation of the 366 FW for 120 days during CY15.
NEPA requires consideration of environmental issues in federal agency planning and decision making. Under NEPA, federal agencies must prepare an EA or environmental impact statement (EIS) for any major federal action, except those actions that are determined to be “categorically excluded” from further analysis. An EA is a concise public document that provides sufficient analysis for determining whether the potential environmental impacts of a Proposed Action are significant, resulting in the preparation of an EIS; or if not significant, resulting in the preparation of a Finding of No Significant Impact (FONSI), and where applicable, a Finding of No Practicable Alternative (FONPA). This EA was prepared in accordance with NEPA (42 United States Code [USC] 4321-4317), implemented through the Council on Environmental Quality (CEQ) regulation of 1978 (40 Code of Federal Regulations [CFR] § 1500-1508), and 32 CFR §989 Environmental Impact Analysis Process (EIAP).
1.2 PURPOSE AND NEED FOR THE ACTION
The purpose of this action is to relocate up to 54 F-15E aircraft from MHAFB to ensure that aircraft are available for combat operations and training during runway repairs at MHAFB. Additionally, this relocation is intended to limit government spending on Temporary Duty costs and time away from home for Airmen by conducting as many training sorties as possible from a local airfield that does not require extensive travel away from MHAFB. Within this NEPA analysis, 366 FW intends to operate an appropriate number of local sorties relative to the number of aircraft temporarily relocated. Any remaining required training sorties necessary to comply with the FY15 RAP and CMR programs during this timeframe would be conducted at other locations and do not fall within the scope of this environmental assessment.
The need for this action is driven by the fact that the MHAFB airfield will be unavailable for operations for approximately 120 days due to a comprehensive airfield improvement and reconstruction program. If the aircraft are not moved from MHAFB, they will be unavailable for combat operations and training use; this represents an unacceptable risk for the United States Air Force (USAF) and Department of Defense (DoD).
Page 4

1.3 INTERAGENCYAND INTERGOVERNMENTAL COORDINATIONAND CONSULTATIONS
Federal, state, and local agencies with the jurisdiction of the Proposed Action that could be affected by the alternative actions were notified and consulted during the development of this EA. Two responses have been received to date. The Idaho State Historic Preservation Office responded that they currently have no concerns with the Proposed Action.
The U.S. Fish and Wildlife Services (Service) responded, encouraging the 124th Fighter Wing (124 FW) at Gowen Field Air National Guard Base (ANGB) to avoid or minimize potential impacts on Endangered Species Act (ESA) listed species slickspot peppergrass (Lepidium papilliferum), bald eagles (Haliaeetus leucocephalus), golden eagles (Aquila chrysaetos), and migratory birds. The Service’s comments have been addressed. (See Appendix A)
Appendix A contains the list of agencies consulted during this analysis and copies of correspondence, responses, and concurrences.
1.4 PUBLIC AND AGENCY REVIEW OF EA
A Notice of Availability (NOA) of the Draft EA and FONSI was published in the newspapers of record (listed below), announcing the availability of the EA for review on or about 8 December 2014. The NOA invited the public to review and comment on the Draft EA.
The NOA was published in the following newspapers: The Idaho Statesman, Boise, ID and The Mountain Home News, Mountain Home, ID
Copies of the Draft EA and FONSI were also made available for review at the following locations:
Mountain Home Public Library 790 N 10th E Street
Mountain Home, ID 83647
Boise Public Library 715 S. Capitol Blvd Boise ID 83702 (208) 384-4450 1.5 BACKGROUND ON GOWEN FIELD ANGB
This Environmental Assessment contains alternatives proposing the relocation of aircraft to Boise’s Gowen Field ANGB. A brief history on Gowen Field ANGB is included below for reference.
In 1940, the City of Boise had its new Boise Air Terminal (BOI) certified as a property important to national defense so that it could be selected as an Army Air Corps base site (NGB 2000). In 1941 the base mission was to train crews in the operation of medium-range bomber and reconnaissance aircraft. In 1942, the mission changed to heavy bombardment groups and the base began training B-17 “Flying Fortress” pilots (Hart 1991). The base converted from B-17s to B-24s in 1943 (Hart 1991). In 1946, F-51 propeller aircraft (NGB 2000) were flown by the Idaho Air National Guard (IDANG), and in 1953 the installation converted
Page 5
to the F-86A Sabre jet (NGB 2000). In 1956, Gowen Field ANGB became home to the F-89 jet interceptors (NGB 2000) and in 1964, the F-102 Delta Daggers. A new mission of aerial reconnaissance brought the RF-4C Phantom to the base in 1975. In 1991, the first F-4G aircraft arrived at Gowen Field ANGB, and the 124 FW operated the only F-4G school in the USAF. As F-4 fighter aircraft were being phased out of the U.S. military in the mid-1990s, they were replaced with A- 10 Thunderbolt close air support and C-130 Hercules transport aircraft at Gowen Field ANGB (Global Security 2002). Based on Base Realignment and Closure (BRAC) Commission Recommendations, the installation lost the C-130 mission in 2008 but gained additional A-10 aircraft.
The 124 FW of the IDANG is located at the Gowen Field ANGB on the south side of BOI, and is situated in the southern portion of the City of Boise, Ada County, Idaho. The IDANG property comprises an approximately 354-acre military installation along the southern half of BOI, and operates as a joint civilian/military facility adjacent to the Idaho Army National Guard. The land on which the Gowen Field ANGB is located is owned by the City of Boise and is secured for military use through a lease agreement with the City and the Federal government. Since October 2013, the IDANG has been operating at Gowen Field ANGB with the Civil Air Patrol as its only tenant.
SECTION 2.0 DESCRIPTION OF PROPOSED ACTION AND ALTERNATIVES
2.1 PROPOSED ACTION
The Proposed Action is to relocate up to 54 F-15E aircraft, associated support equipment and personnel for 120 days during CY15. Under this action, 366 FW would fly an appropriate number of sorties in relation to the number of aircraft relocated under this action to meet the overall RAP requirement. A portion of the sorties required during the MHAFB runway repairs may be flown at a different location under the authority of a different NEPA document and/or Air Installations Compatible Use Zones (AICUZ) capacity. While temporarily relocated, 366 FW would use existing facilities with no required modifications, construction, or demolition.
2.1.1 Training Operations
Operations conducted under this action would include landings and takeoff (an LTO cycle includes taxiing between the hangar and runway, taking off, climbing out of the local pattern, descending from the local pattern, and touch down) and touch and go’s (TGO). A TGO includes taxiing between hangar and runway, taking off, climbing out of local pattern, descending, and touch down, take off, repeating the pattern. Operationally, implementation of the Proposed Action would maximize training sorties and parking space for aircraft at an airfield that meets the established selection standards. A sortie is a single military aircraft flight from initial takeoff through final landing, and includes everything that might be conducted during that flying mission. Training sorties would depart Monday through Friday. Departing flights would require 100% afterburner use to ensure adequate aircraft performance and to minimize flight safety risks. When temperatures are above 32°F afterburner provides an increase in thrust for the F-15 aircraft during takeoff. Additionally, required flight operations would depart between 0730 and 2100 hours in existing military operational airspace in the region. Flights would return before 2400 hours. Average sortie durations of these operations would be approximately 1.5 hours.
Page 6

2.2 SELECTION STANDARDS
NEPA and CEQ regulations mandate the consideration of reasonable alternatives to the proposed action. “Reasonable alternatives” are those that also could be utilized to meet the purpose of and need for the proposed action. In addition, selection standards may be used to narrow the range of viable alternatives. Per 32 CFR §989, the USAF EIAP regulations, selection standards are used to identify alternatives for meeting the purpose and need for the USAF action. The selection standards for this action are:
• Airfield less than 50 nautical miles from Mountain Home AFB • Airfield containing a runway not less than 9,000 feet • Adequate ramp space to park 54 F-15E aircraft • Available facilities for operations, maintenance, and support functions • Adequate security for USAF fighter aircraft • Avoids significant noise impacts on the local community • Avoids unnecessary flight safety risks
366 FW examined a wide range of potential alternatives to satisfy the purpose and need. In total, five alternatives were considered. However, three did not meet all of the selection standards listed above and were not carried forward for further analysis. The two remaining alternatives were analyzed for environmental impacts.
2.3 PREFERRED ALTERNATIVE: GOWEN FIELD ANGB, ID
Preferred Alternative would temporarily relocate 366 FW aircraft to Gowen Field ANGB. This Alternative would include the relocation of up to 54 F-15E aircraft, associated support equipment, and personnel for 120 days during CY15. While deployed to Gowen Field ANGB, the 366 FW would utilize existing facilities of the ID ANG, no modifications, demolition, or constructed would be conducted.
Operationally, implementation of this Alternative Action would include up to 450 sorties flown by the 366 FW out of Gowen Field ANGB during a 120 day period; these training sorties would depart from and return to Gowen Field ANGB. Departing flights would require 100% afterburner use to minimize flight safety risks. When temperatures are above 32°F afterburner provides an increase in thrust for F-15E aircraft during takeoff. Flight operations would be conducted in existing military operational airspace in the region including Restricted Areas R- 3203 and R-3202. Training would not occur over the city of Boise. For this Alternative, the 366 FW would fly an average of 10 sorties per day with average sortie duration (ASD) of 1.5 hours. During the temporary relocation period, it is anticipated that the 190th Fighter Squadron of the 124 FW would maintain existing A-10 operations of approximately 12 sorties per day.
The Air National Guard performed extensive noise analysis to develop this alternative so that it meets the selection standard requiring no significant noise impacts on the community. As part of this analysis, 366 FW identified several adjustments to their typical flight profiles to avoid noise impacts on sensitive areas of the community. The number of sorties analyzed, runway utilization, flight tracks, and profiles were varied to achieve < 3 dB change at noise sensitive receptors. Specific elements of this alternative include:
• Runway 10R departure tracks modified to turn south sooner than previously modeled (just past the runway threshold)
• Departure Runway Utilization changed to 20% Runway 10R and 80% Runway 28L • 1/3 of all F-15E operations were modeled with F100-PW-220 engine (training of the Royal
Singapore Air Force) and 2/3 were modeled with F100-PW-229 engine (389 FS and 391 FS).
Page 7

• For F-15Es with 229 engine, departures modeled with 15 degree climb angle at 400ft AGL when AB turns off to 5,000ft MSL
After accounting for these changes in the flight profile, the Air Force identified that a maximum of 450 sorties with afterburner takeoffs would not cause significant noise impacts on the community.
The Preferred Alternative would allow up to 54 F-15E aircraft to relocate to Gowen Field ANGB and fly up to 450 sorties without having a significant impact on the human environment. Since only a portion of the FY15 RAP sortie requirements could be met during the 120 days, MHAFB would be required to fly remaining sorties at additional locations meeting both existing AICUZ and NEPA capacity.
The Preferred Alternative, with a maximum of 450 sorties at 100% AB, would meet the Purpose and Need and satisfies all selection standards.
2.4 ALTERNATIVE B: NO-ACTION ALTERNATIVE
The No-Action Alternative provides the existing baseline environment to which the potential impacts of the action for each alternative will be compared. Under this alternative, the 366 FW would not temporarily relocate. As a result, the 366 FW would be unable to conduct flight training activities due to the comprehensive airfield reconstruction project scheduled for implementation at MHAFB and would be unable to meet its mission readiness requirements.
However, because CEQ regulations stipulate that the No-Action Alternative be analyzed to assess any environmental consequences that may occur if the Proposed Action is not implemented, the No-Action Alternative will be carried forward for analysis in the EA.
2.5 ALTERNATIVES ELIMINATED FROM FURTHER CONSIDERATION
The following alternatives were initially considered but eliminated from further analysis because they either did not meet the Purpose and Need of the project or they did not meet the required Selection Standards. The Air Force went to great lengths to identify alternatives that would limit potential impacts on the local community. However, many of the alternatives identified as part of this effort is associated with unacceptable flight safety risks or do not meet the Purpose and Need of the action.
2.5.1 Alternative C: 50% Afterburner / 50% Military Power Takeoff
This Alternative would include the following changes made to achieve no significant impacts at noise sensitive receptors:
• Runway 10R tracks modified to turn south sooner than previously modeled (just beyond the runway threshold)
• Departure Runway Utilization changed to 20% Runway 10R and 80% Runway 28L for Afterburner takeoff profiles, and 100% Runway 10R for MIL takeoff profiles. This results in approximately half of the takeoffs being performed without afterburner.
• For F-15E aircraft with 229 engine, 15 degree climb angle from 400ft AGL to 5,000ft MSL • 770 sorties would be the maximum allowed
Alternative C was developed to meet the purpose and need of the Proposed Action, increase the available number of sorties, and limit noise impacts on the local community. This alternative would not have a
Page 8

significant impact at noise sensitive receptors. Aircraft performance data indicate that takeoff without afterburner should only be performed when temperatures are below 32° F. This alternative does not meet the Selection Standard that specifies that alternatives cannot present unacceptable safety risks. Because of the increased safety risk associated with military power takeoffs due to aircraft performance requirements, Alternatives C was eliminated from further consideration.
2.5.2 Alternative D: 100% Military Power Takeoff
This Alternative would include the following changes made to achieve no significant impacts at noise sensitive receptors:
• Runway 10R tracks modified to turn south sooner than previously modeled (just beyond the runway threshold)
• Departure Runway Utilization changed to 100% Runway 10R • For F-15E aircraft with 229 engine, 15 degree climb angle from 400ft AGL to 5,000ft MSL • No takeoffs would be performed with afterburner • 1450 sorties would be the maximum allowed
Alternative D was developed to meet the Purpose and Need of the Proposed Action, increase the available number of sorties, and limit noise impacts on the local community. This alternative would not have a significant impact at noise sensitive receptors. Aircraft performance data indicate that takeoff without afterburner should only be performed when temperatures are below 32° F. This alternative does not meet the Selection Standard that specifies that alternatives cannot present unacceptable safety risks. Because of the increased safety risk associated with military power takeoffs due to aircraft performance requirements, Alternative D was eliminated from further consideration.
2.5.3 Alternative E: 2200 sorties, 100% Afterburner Takeoff
This alternative would allow 366 FW to fly all necessary training requirements from the local area during the relocation. It meets the Purpose and Need of relocating up to 54 aircraft, and has the added benefit that it requires no additional travel for training purposes other than routine travel for normally scheduled training and exercises. It meets all selection criteria except that it would impose a significant noise impact on the local community. A greater than 3dB change would be imposed on noise sensitive receptors as part of this alternative. Additionally, the 65 DNL contour would extend well into the residential areas located to the north of the arrival end of Runway 10R. Even though this alternative is the most operationally beneficial option, it was eliminated from further consideration because of the potential noise impacts that it could cause on the community.
2.6 SUMMARY
The Air National Guard has worked diligently with the Air Force to provide reasonable alternatives that meet the operational requirements of 366 FW while limiting potential impacts on the Boise community. Selection Standards were carefully developed to support the Purpose and Need of this action. Many alternatives were developed in an effort to provide a wide range of options to the decision maker for this action. However, three of the alternatives did not meet all of the identified Selection Standards and were eliminated from further consideration. The two remaining alternatives were carried forward for further analysis in this environmental assessment.
Page 9

SECTION 3.0 AFFECTED ENVIRONMENT
This chapter is to describe the current conditions of the environmental resources, either man- made or natural, that would be affected by implementing the Proposed Action or Alternatives.
Per guidelines established by the NEPA, CEQ regulations, 32 CFR §989 EIAP, the description of the affected environments and the associated impact analyses in this EA focus on only those aspects of the environment potentially subject to impacts.
Based on the scope of the Proposed Action, issues were identified through a preliminary screening process. The following resources would not be affected by the Preferred Alternative and are not discussed in detail in this EA: Airspace Management, Hazardous Materials/Waste, Biological/Natural Resources, Cultural Resources, Socioeconomics, and Other NEPA Considerations.
3.1 AIR QUALITY
This section describes applicable regulatory requirements, types and sources of air quality pollutants and current air quality conditions for Preferred Alternative and Alternative B at Gowen Field ANGB.
3.1.1 Regulatory Requirements
The 1970 Clean Air Act (CAA) and the 1990 Amendments to the CAA regulate air pollution emissions from stationary (such as generators and boilers) and mobile sources (such as aircraft and motor vehicles). Under the CAA, the U.S. Environmental Protection Agency (USEPA) established National Ambient Air Quality Standards (NAAQS) to protect public health and welfare and to regulate emissions of hazardous air pollutants (HAPs). Primary standards set limits to protect public health, including “sensitive” populations such as children and the elderly. Secondary standards set limits to protect public welfare, including protection from decreased visibility, damage to animals, crops, vegetation, and buildings. Areas that are in violation of the NAAQS are designated nonattainment or in maintenance for attainment of criteria pollutants.
There are six criteria pollutants found under the NAAQS: ozone (O3), carbon monoxide (CO), nitrogen dioxide (NO2), sulfur dioxide (SO2), particulate matter (PM) [which includes particulate matter with an aerodynamic diameter less than or equal to 10 micrometers (PM10) and less than or equal to 2.5 micrometers (PM2.5)], and Lead (Pb); ozone precursors include volatile organic compounds (VOCs) and nitrogen oxides (NOx). This EA evaluates five of the six criteria pollutants. Lead, as well as hazardous and toxic air pollutants, is not included in this analysis because they are primarily generated by stationary industrial activities, not by mobile sources such as aircraft.
Established under the CAA (Section 176(c)(4)), the General Conformity Rule requires federal agencies to ensure that their actions conform to applicable implementation plans for the achievement and maintenance of the NAAQS for criteria pollutants. To achieve conformity, a federal action must not contribute to new violations of standards for ambient air quality, increase the frequency or severity of existing violations, or delay timely attainment of standards in the area of concern (for example, a state or a smaller air quality region). Federal agencies prepare written Conformity Determinations for federal actions that are in or affect NAAQS nonattainment areas or maintenance areas when the total direct or indirect emissions of nonattainment pollutants (or their precursors in the case of ozone) exceed specified thresholds as listed in Table 1.
Page 10

Table 1 De Minimis Levels for Conformity Determination Pollutant
Area Type
Tons Per Year
Ozone (VOC or NOx)
Serious nonattainment 50
Severe nonattainment 25
Extreme nonattainment 10
Other areas outside an ozone transport region
100
Ozone (NOx)
Marginal and moderate nonattainment inside an ozone transport region
100
Maintenance 100
Ozone (VOC)
Marginal and moderate nonattainment inside an ozone transport region
50
Maintenance within an ozone transport region
50
Maintenance outside an ozone transport region
100
Carbon monoxide, SO2 and NO2 All nonattainment & maintenance 100
PM-10
Serious nonattainment 70
Moderate nonattainment and maintenance 100
PM2.5 Direct emissions, SO2, NOx (unless determined not to be a significant precursor), VOC or ammonia (if determined to be significant precursors)
All nonattainment & maintenance
100
Lead (Pb) All nonattainment & maintenance 25
Source: USEPA 2014c
In 1996, the District of Columbia Court of Appeals issued a decision that required the EPA to regulate all aerospace ground equipment (AGE) as a mobile source. That year, a memorandum was issued by the Chief of the Air Force Legal Services Agency stating that AGE would therefore be considered mobile sources at all military installations. A review of the Idaho Department of Environmental Quality (IDEQ) regulations indicated that they do not specifically address whether AGE is classified as stationary or mobile sources. Therefore, in this environmental assessment, all AGE is considered to be mobile sources in accordance with USAF guidance.
Page 11
3.1.2 Existing Conditions
Climate
Average temperatures in the City of Boise generally range from the lower 30s (degrees Fahrenheit [ºF]) in the winter months to mid-70s (ºF) in the summer months. Temperatures vary greatly between seasons. The average maximum temperature in the month of January is 37.0 ºF, while the average maximum in July is 90.8ºF. Diurnal temperature variations are greatest in the summer, with a 32ºF difference between the average high and low temperature in July (WRCC 2014a).
Average annual precipitation for Boise is 11.69 inches (includes depth of melted snowfall). More precipitation falls in the winter months, with a peak monthly average of 1.41 inches in December. Summers are rather dry, with the lowest monthly average precipitation of 0.26 inch occurring in July. Snow is not uncommon from late fall through early spring. The average annual snowfall in Boise is 20.1 inches, with a peak monthly average of 6.3 inches in January (WRCC 2014b).
The Boise area is a fairly breezy location. For each month of the year, the average wind speed is at least 6.7 miles per hour (mph) and the annual average wind speed is 7.7 mph. Spring tends to bring stronger winds, although the windiest months, March and April, exhibit an average speed of only 8.9 mph (WRCC 2014c). The prevailing wind direction is from the southeast in the fall and winter and from the northwest in the spring and summer. However, local topography and the passage of storm fronts can greatly influence wind speed and direction on a short-term basis (WRCC, 2014d).
Local Air Quality
Gowen Field ANGB is located in northern Ada County. All of Ada County, according to 40 CFR 81.87, is designated as part of the Metropolitan Boise Intrastate Air Quality Control Region (AQCR) 64. A review of federally published attainment status reports for northern Ada County, which encompasses the project site and is within AQCR 64, indicated that northern Ada County was designated as an area of concern for O3 and PM2.5. At present, Northern Ada County is a limited maintenance area for CO and PM10. Ada County is an attainment area, or meets national standards, for all other criteria pollutants (IDEQ 2014).
The USEPA Air Quality Statistics Report displays an area’s maximum air pollution values for all six criteria pollutants. The values shown are the highest reported measured values during the year by all monitoring sites in the county. Table 2 shows that in 2013, based on the Air Quality Statistics Report, Ada County as a whole meets all national standards for criteria pollutants (USEPA 2014b). Table 3 summarizes the 2011 emission total for Ada County (USEPA 2014a).
Page 12

Table 2. National Standards and Ada County Calendar Year 2013 Statistics
Pollutant Averaging
Time
National Standards1 Air Quality Statistics
Primary Secondary Ada County2
O3
8-hour
0.075 ppm Same as primary
0.071 ppm
CO
8-hour 9 ppm - 1.4 ppm 1-hour 35 ppm - 3 ppm
NO2
Annual
53 ppb
Same as primary
-
1-hour 100 ppb - 39 ppb
SO2 1-hour 75 ppb - 11 ppb 3-hour - 0.5 ppm -
P M
PM 10 24-hour
150 µg/m3
150 µg/m3
99 µg/m3
PM 2.5
Annual 12 µg/m3 12 µg/m3 - 24-hour 35 µg/m3 35 µg/m3 12 µg/m3
Source: 1 USEPA 2012; 2 USEPA 2014b
Table 3. 2011 Annual Emissions for Ada County ANNUAL EMISSIONS (TONS)
Location VOC CO NOx SO2 PM10 PM2.5 Ada County 25,337 74,383 12,069 589 23,041 4,687
Total 42,076 118,262 20,090 2,558 50,887 9,632 Source: USEPA 2014a.
Emissions at the 124 FW Installation
Air emissions that result from activity associated with the 124 FW of the IDANG originate from both stationary and mobile sources. Stationary sources include aircraft engine testing, boilers, internal combustion engines, fuel storage and transfer sources, and various operational sources, including woodworking, painting operations, and chemical use. Mobile sources include on- and off-road vehicles and equipment, AGE, and aircraft operations. At the time of the 2009 Air Emissions Inventory (AEI), F-15E aircraft from Klamath Falls, Oregon were temporarily located at Gowen Field ANGB for six months. Table 4 summarizes 2009 annual emissions associated with operation of the 124 FW (IDANG 2010).
Table 4. 2009 Air Emissions for 124 FW of the IDANG ANNUAL EMISSIONS (TONS PER YEAR)
VOC CO NOx SOx PM10 PM2.5
Stationary (Permitted) Sources 6.8 3.3 3.6 0.0 1.1 1.1 Mobile Sources (except F-15E) 25.3 79.4 15.8 1.2 1.6 1.5
F-15E Mobile Sources1 7.7 33.6 12.7 0.6 0.3 0.3 Total 39.8 116. 32.1 1.9 3.0 2.9
1 Emissions from F-15E aircraft operations temporarily located at Gowen in 2009
Page 13

3.2 NOISE
3.2.1 Definition of Resource
Sound is a physical phenomenon consisting of minute vibrations that travel through a medium, such as air or water, and are sensed by the ear. Sound is all around us and noise is defined as unwanted or annoying sound that interferes with or disrupts normal human activities. Although exposure to very high sound levels for very long periods of time can cause hearing loss, the principal human response to aircraft noise is annoyance. The response of different individuals to similar noise events is diverse and is influenced by the type of noise, perceived importance of the noise, its appropriateness in the setting, time of day, type of activity during which the noise occurs, and sensitivity of the individual.
Noise and sound are expressed in decibels (dB), which are logarithmic units. A sound level of 0 dB is approximately the threshold of human hearing and is barely audible under extremely quiet listening conditions. Normal speech has a sound level of approximately 60 dB; sound levels above 120 dB begin to be felt inside the human ear as discomfort. Sound levels between 130 to 140 dB are felt as pain (Berglund and Lindvall 1995). The minimum change in the sound level of individual events that an average human ear can detect is about 3 dB. Typically, a person perceives a doubling (or halving) of the sound’s loudness when there is a 10 dB change in sound level.
All sounds have a spectral content, meaning their magnitude or level changes with frequency, where frequency is measured in cycles per second or hertz (Hz). To mimic the human ear’s non- linear sensitivity and perception of different frequencies of sound, the spectral content is weighted. For example, environmental noise measurements are usually on an “A-weighted” (dBA) scale that filters out very low and very high frequencies to replicate human sensitivity. Figure 1 shows typical A-weighted sound levels of common events. It is common to add the “A” to the measurement unit to identify that the measurement was made with this filtering process. For low frequency noise, “C-weighting” (dBC) is typically applied for impulsive sounds such as sonic booms and ordnance detonation.
In accordance with DoD guidelines and standard practice for environmental impact analysis documents, this noise analysis utilizes the following A-weighted noise descriptors or metrics which are defined below: Day-Night Average Sound Level (DNL), Sound Exposure Level (SEL) and Maximum Sound Level (Lmax).
Page 14

Figure 1. Typical A-weighted Sound Levels of Common Sounds Sources: Harris 1979, FICAN 1997.
Noise Metrics
Maximum Sound Level (Lmax) – the highest A-weighted, sound level measured during a single event in which the sound level changes value with time, e.g., an aircraft overflight.
Sound Exposure Level (SEL) – a composite metric for a single event that represents both the amplitude of a sound and its duration. Noise events such as aircraft overflights have two main characteristics: a sound level that changes throughout the event and the duration during which the event is heard. The SEL metric provides a measure of the net impact of the entire acoustic event, but it does not directly represent the sound level heard at any given time. The SEL is useful for comparing different noise events, e.g., different aircraft types or operations, whose duration or amplitude may be different.
Day-Night Average Sound Level (DNL) – a composite metric that accounts for all noise events in a 24-hour period, and takes into consideration the increased human sensitivity to noise at night by applying a 10-dB penalty to nighttime events occurring between 10:00 p.m. and 7:00 a.m. The Federal Interagency Committee on Aviation Noise (FICAN, formerly FICON) recommends and the USAF and Federal Aviation Page 15

Administration (FAA) have adopted the Day-Night Average Sound Level (DNL) for assessing environmental impacts from aircraft operations (FICON 1992). For this analysis, DNL is based on annual average daily aircraft operations, i.e., annual operations divided by 365 days. Noise exposure is presented in terms of contours, i.e., lines of equal value, of DNL. DNL contours of 65 to 85 dB are presented in 5-dB increments. Aircraft DNL is also depicted in terms of colored gradual shading with ‘cool’ (blue) color representing the ambient noise level of 45 dB and the ‘hot’ (red) color representing DNL greater than or equal to 85 dB.
In airport noise analyses, DNL contours are used to help determine compatibility of aircraft operations with local land use activities. DNL from flight operations typically exceeding ambient background noise occur beneath main approach and departure corridors, near local air traffic patterns around the airfield, and in areas immediately adjacent to parking ramps and aircraft staging areas. As aircraft take off and gain altitude, their contribution to the DNL environment diminishes.
Noise in the Airfield Environment
Aircraft Operations. Analyses of aircraft noise exposure and compatible land use around airports are normally accomplished with computer-based programs (models). DOD facilities typically utilize the suite of programs known as NOISEMAP (U.S. Air Force [USAF] 1992; Czech 2014; Wasmer and Maunsell 2013a; Wasmer and Maunsell 2013b) while civilian airport typically use the Federal Aviation Administration’s (FAA) Integrated Noise Model (INM) program (FAA 2007). Both programs and their inputs are further described in Appendix C.
Modeling is utilized for aircraft noise exposure analyses because true measurements over a year is not feasible and because proposed aircraft activity cannot be measured today. Modeling is most accurate for assessing change in noise exposure. NOISEMAP and INM are semi-empirical meaning their noise propagation algorithms draw on an extensive database of measured aircraft noise levels. NOISEMAP, with its core NMAP program, version 7.3, was used to analyze the military A-10 and H-60 aircraft operations at BOI while INM 7.0a was used to analyze civilian aircraft operations (FAA 2007).
Other Airfield Noise. Although noise resulting from aircraft flight operations represents the greatest contribution to the overall noise environment near the airfield, other noise sources (e.g., highway traffic) may also influence total ambient noise levels. Other activities that may generate substantial amounts of noise at an airport include engine preflight run-ups and aircraft maintenance activities, industrial operations, and construction activities.
3.2.2 Existing Conditions
Regional Setting
The noise environment of communities surrounding Gowen Field ANGB is characteristic of a suburban medium-density environment, settings that typically experience noise associated with vehicles on local highways or light industrial activities. These communities likely experience the following typical ranges of outdoor DNL levels: Normal Suburban Residential, 53 to 57 DNL and Urban Residential, 58-62 (FICON 1992). Areas adjacent to Gowen Field ANGB support a mix of residential, commercial and light industrial land use, in addition to transportation (highways). These land uses typically generate noise levels of low magnitude and aircraft activity is the dominant noise producer in the vicinity of Gowen Field ANGB. Some additional noise can result from day-to-day activities associated with operations, maintenance, and industrial functions at Gowen Field ANGB and other commercial activities around the airport. Page 16

These noise sources include the operation of AGE and other transportation-related noise associated with vehicular traffic. However, this noise is generally localized in industrial areas on or near the airfield. Noise resulting from aircraft operations remains the dominant noise source in the airfield region.
Gowen Field ANGB Existing Noise Levels
Under baseline conditions, Gowen Field ANGB supports military and civil aviation activity. Overall, BOI supports an average of approximately 182,000 flight operations per year, an average of about 500 operations per day (Oregon Air National Guard 2009) as detailed in Appendix C.
Figure 2 shows the DNL contours for annual average daily aircraft operations for the Baseline scenario and land use in the vicinity of the airport. The area inside of the Baseline 65 DNL contour (outermost contour) stays mostly on airport property, but does extend approximately 800ft into industrial zoning just north of the beginning of Runway 28R, and extends into the residential area approximately 1,300ft to the north of the beginning of Runway 10L.
The land use data in Figure 2 (and in throughout this document) is based on Ada County’s zoning dataset. Each parcel in the Ada County zoning dataset is assigned a broad district type. According to the city’s planning department, these district types reflect existing land use given the fact that the use must comply with the zone. The district types for three zoning abbreviations in the Ada County zoning dataset were unable to be identified. These unidentified zones are located southeast of the airport and are exposed to DNL less than 65 dB. The unidentified zone’s district types are listed as “Unknown” in the figures.
Acknowledging aircraft noise does not stop at the 65 dB DNL, DOD uses DNL gradient depictions to supplement the typical DNL contour presentation as mentioned in section 3.2.1. Figure 3 shows the DNL gradient for the Baseline scenario. DNL ‘fans’ out from the airfield parallel to the runways; the gradient is shown to 45 dB DNL which extends an average of 1.5 miles from the airfield.
Page 17

Figure 2. Aircraft DNL Contours and Land Use for Baseline Scenario
Page 18

Figure 3. Aircraft DNL Gradients for Baseline Scenario
Page 19

The land use analysis in the vicinity of Gowen Field ANGB for each set of DNL contour ranges is shown in Table 5. Most of the area of each contour range falls within the airport property.
The airport boundary includes both Boise International Airport and Gowen Field. Only one acre within the 75-79 DNL contour range falls outside of the airport property, and all of the 80-84 and 85+ DNL contour areas are within the airport property. The 70-74 dB DNL contour extends off airport property to encompass a total area of 18 acres, approximately 9 of which are within residential zoning. The 65-69 dB DNL contour contains approximately 30 acres of residential land use, most of which lays directly north of the beginning of Runway 10L. The population data is based on 2010 census block data within the analyzed residential land use areas. Of the 200 people that are exposed to greater than 65 dB, 89% fall inside of the 65-69 DNL band.
Table 5. Land Use Analysis under Baseline Conditions Data
Land Use Category
Off-Airport Data within DNL Band
65-69
70-74
75-79
80-84
85+ Total (65+)
Acreage Commercial/Office 7.1 0.7 0.5 - - 8.3 Industrial 77.8 0.2 - - - 78.0 Open Land 28.4 7.9 0.4 - - 36.7 Residential 30.4 9.2 0.1 - - 39.7 Total Off-Airport 143.7 18.0 1.0 - - 162.7 On-Airport 662.3 258.3 174.4 229.6 11.5 1,336.1 GRAND TOTAL 806.0 276.3 175.4 229.6 11.5 1,498.8
Population 178 22 - - - 200
Other potential sensitive receptors in the vicinity of BOI include Hillcrest Elementary, Owyhee Elementary, Hawthorne Elementary, White Pine Elementary, and Timberline High School. These five schools are shown within each of the maps. Saint Alphonsus Regional Medical Center, Nazarene Overland Church, and Columbia Heights Baptist Church are sensitive receptors that are outside of each of the map extents. All school, medical, and religious sensitive receptors in the vicinity of Gowen Field ANGB are exposed to less than 65 dB DNL.
3.3 SAFETY
Safety. The Boise Air Terminal Airport is a joint use facility, supporting both the 124 FW and the City of Boise. The City of Boise has primary crash response responsibility on the airport, but the military fire department also response, all required equipment is available. The 124 FW facilities have, or are programmed to have, all required fire annunciation and suppression systems in place, and hangars are equipped with automatic fire suppression capability.
Aircraft Mishaps. The primary concern with regard to military training aviation is the potential for aircraft mishaps (i.e., crashes) to occur. Aircraft mishaps are classified as A, B, C, or D. Not all aircraft mishaps result in public safety concerns. However, crashes have the potential to affect the public. This EA analyses “Destroyed” aircraft and the “Destroyed Rate” over the lifetime of the F-15 and A-10 aircrafts. The analysis is based on historical data on mishaps at all installations, and under all conditions of flight. The military services calculate destroyed rates per 100,000 flying hours for each type of aircraft in the inventory. F-15 aircraft have flown more than 6,200,000 hours since 1972. A-10 aircraft have flown over 5,2000,000 hours
Page 20
since 1972. The lifetime aircraft destroyed rate for F-15’s and A-10’s is the same; 1.98 per 100,000 flight-hours. Combat losses are excluded from these mishap statistics (see Appendix D and E).
3.4 RESOURCES NOT AFFECTED
Preferred Alternative, issues with minimal or no impacts were identified through a preliminary screening process. The following describes those resource areas not carried forward for a detailed analysis, along with the rationale for their elimination. Regardless of the alternative selected, the following resources would not be affected by the Preferred Alternative and are not discussed in detail in this EA:
Land Use. Residential areas north of Gowen Field ANGB would experience a slight increase in noise levels upon implementation of the Preferred Alternative. The remaining surrounding areas expected to be exposed to an increase in noise levels support primarily open space, agricultural activities, and industrial and commercial use. In addition, implementation of the Preferred Alternative would not require any changes to existing land use or zoning.
No long-term activities are associated with the Preferred Alternative. After approximately 120 days, all temporarily relocated aircraft and personnel associated with the 366 FW would return to MHAFB, Idaho. Therefore, no long-term impacts to land use would occur under the Preferred Alternative.
Geological Resources. Implementation of the Preferred Alternative would not include any construction, demolition or renovation activities. In addition, the 366 FW would utilize existing buildings, and facilities at Gowen Field ANGB. Therefore, the Preferred Alternative would have no impacts on geology and soils.
Water Resources. Implementation of the Preferred Alternative would not include any construction, demolition, or renovation activities. In addition, the 366 FW would utilize existing buildings and facilities at Gowen Field ANGB and would not create any new impermeable surfaces. Runoff from existing facilities would be incorporated into the installation’s existing storm drainage system, which is capable of accommodating such flows (IDANG 2007). Therefore, the Preferred Alternative would not have significant impacts with regard to surface water, groundwater, floodplains, or wetlands.
Biological Resources. Implementation of the Preferred Alternative would not include any construction, demolition or renovation activities because the 366 FW would utilize existing buildings, and facilities at Gowen Field ANGB. In addition, previous analyses of biological resources at the Gowen Field ANGB, including consultation with the U.S. Fish and Wildlife Service and a review of data provided by the Idaho Conservation Data Center, have indicated that the Preferred Alternative is unlikely to disturb sensitive species or modify sensitive species habitat (IDANG 2007). Sensitive species include ESA listed species (slickspot peppergrass), bald and golden eagles, and migratory birds. Therefore, the Preferred Alternative would have no impacts to biological resources.
Transportation and Circulation. Implementation of the Preferred Alternative would not include any construction, demolition, or demolition activities at Gowen Field ANGB. It is anticipated that up to 50 truckloads would be required to transport required equipment associated with the 366 FW’s temporary relocation to and from Gowen Field ANGB. However, this truck traffic would only make up a small portion of the total existing traffic volume in the region. Further, increases in traffic volumes associated with truck delivery activity and the other vehicular activity (i.e., associated with MHAFB personnel transported daily) would be temporary. In addition, the 366 FW would utilize existing buildings and facilities at Gowen Field
Page 21

ANGB, including adequate parking facilities and roadways (IDANG 2007). Therefore, impacts to transportation and circulation would be short-term and less than significant.
Visual Resources. Implementation of the Preferred Alternative would not include any construction, demolition, or renovation activities. In addition, the 366 FW would utilize existing buildings and facilities at Gowen Field ANGB. Therefore, implementation of the Preferred Alternative would result in no impacts to regional visual resources.
Cultural Resources. Implementation of the Preferred Alternative would not include any construction, demolition, or renovation activities. As previously indicated, the 366 FW would utilize existing buildings and facilities at Gowen Field ANGB. Therefore, implementation of the Preferred Alternative would have no impact to cultural resources.
Socioeconomics. The Preferred Alternative would include the daily temporary relocation of MHAFB personnel for 120 days during CY15. Economic activity associated with this temporary relocation would provide short-term economic benefits to the local economy; therefore, impacts to regional or local socioeconomic characteristics would be beneficial, but not significant.
Environmental Justice.
Minority and Low-Income Populations. Implementation of the Preferred Alternative would not include any construction, demolition, or renovation activities. In addition, the 366 FW would utilize existing buildings and facilities at Gowen Field ANGB. Further, since no significant, adverse environmental impacts associated with the Preferred Alternative would occur, no populations (minority, low-income, or otherwise) would be disproportionately impacted and no significant impact with regard to environmental justice would result.
Protection of Children. No on-site housing or facilities for children currently exist in areas associated with the 124 FW installation. Because children would not have access to the temporary relocation site, implementation of the Preferred Alternative would not result in increased environmental health risks or safety risks to children. Thus, no significant impacts to children would occur.
Hazardous Material and Wastes. Although the temporary relocation of the 366 FW would result in an overall increase in the quantity of hazardous materials and waste at Gowen Field ANGB, the 366 FW would utilize existing buildings and facilities at Gowen Field ANGB, including hazardous materials and wastes storage and accumulation sites (IDANG 2007). All hazardous materials and/or waste would be disposed of by the 366 FW in accordance with established protocol. Therefore, implementation of the Preferred Alternative would not result in any significant impacts to hazardous materials and wastes.
Airspace Management. Implementation of the Preferred Alternative would include flying operations conducted by the 366 FW during a 120 day period; these training sorties would be flown out of BOI and a majority of flight operations would be conducted in existing military airspace including Restricted Areas R-3203 and R-3202. All operations conducted at BOI would be handled by the airport’s existing Air Traffic Control Tower. During the temporary relocation period, it is anticipated that the 190 FS of the 124 WG would maintain existing A-10 operations of approximately 12 sorties per day. No changes to airspace configuration or management procedures would be required. Therefore, increased operations associated with the Preferred Alternative would not have a significant impact to airspace management.
For a description of these resource areas, refer to the Final Environmental Assessment for Implementation of Base Realignment and Closure Final Recommendation for the 124 FW (IDANG 2007). Page 22

Page 23

SECTION 4.0 ENVIRONMENTAL CONSEQUENCES
Environmental impacts that would result from implementation of the Alternative A (Preferred Alternative), temporary relocation of the 366 FW to Gowen Field ANGB, are evaluated in this section. Analyses are presented by resource area, as presented in Section 3.0, Affected Environment.
4.1 AIR QUALITY
4.1.1 Approach to Analysis
The 1990 Amendments to the CAA require that Federal agency activities conform to the State Implementation Plan (SIP) with respect to achieving and maintaining attainment of NAAQS and addressing air quality impacts. The USEPA General Conformity Rule requires that a conformity analysis be performed which demonstrates that a Preferred Alternative would not: 1) cause or contribute to any new violation of any NAAQS in the area; 2) interfere with provisions in the SIP for maintenance or attainment of any NAAQS; 3) increase the frequency or severity of any existing violation of any NAAQS; or 4) delay timely attainment of any NAAQS, any interim emission reduction goals or other milestones included in the SIP. A conformity review must be performed when a Federal action is anticipated to generate air pollutants in a region that has been designated a nonattainment or maintenance area for one or more NAAQS. Nonattainment areas are geographic regions where air quality fails to meet the NAAQS. Maintenance areas are regions where NAAQS were exceeded in the past, and are subject to restrictions specified in a SIP-approved maintenance plan to preserve and maintain the regained attainment status. Provisions in the General Conformity Rule allow for exemptions from performing a conformity determination if the total net increase in emissions of individual nonattainment or maintenance area pollutants resulting from the Preferred Alternative fall below significant (de minimis) threshold values.
4.1.2 Impacts
Preferred Alternative
Pollutant emissions associated with implementation of the Preferred Alternative at Gowen Field ANGB would include emissions from the temporary relocation of the 366 FW aircraft operations from Elmore County, Idaho to Gowen Field ANGB at BOI in Ada County, Idaho. The duration of increased emissions due to aircraft operations associated with 366 FW aircraft would be limited to 120 days. Northern Ada County was previously a nonattainment area for CO and PM10, but was re-designated as an attainment area for CO in 2002 and for PM10 in 2003.
Therefore, northern Ada County is currently designated as a maintenance area for CO and PM10 (IDEQ 2014). Northern Ada County is designated as an attainment area and is in compliance with all other NAAQS.
Construction Emissions
Implementation of the Preferred Alternative would not require any construction at Gowen Field ANGB because facilities are available there to temporarily house maintenance and administrative operations associated with the 366 FW aircraft inventory. Therefore, no dust or combustion emissions associated with construction activities would occur.
Page 24

Operational Emissions
Implementation of the Preferred Alternative would result in a short-term increase in mobile source emissions due to aircraft operations and personnel levels at Gowen Field ANGB. There would be no long-term operational emissions associated with the Preferred Alternative, as the duration of the Preferred Alternative would be limited to 120 days.
Personnel and facilities associated with the 124 FW would be supporting flying operations of the 366 FW, for a 120 day period in addition to supporting the normal 190 FS operations. Current flying operations include LTO, TGO, and low approach (LA) operations. The 366 FW operations would consist of LTOs and TGOs. An LTO cycle includes taxiing between the hangar and runway, taking off, climbing out of the local pattern, descending from the local pattern (approach), and touch down.
Air Conformity Applicability Model (ACAM) was used to evaluate emissions of criteria pollutants associated with the proposed temporary relocation of 366 FW aircraft at Gowen Field ANGB due to Ada County’s designation as a maintenance area for CO and PM10. The anticipated emissions resulting from the proposed operation of aircraft conducting LTOs and increase in vehicular traffic are described in the ACAM data located in Appendix B (Solution 2014). Table 6 shows the estimated increase in mobile source emissions associated with the Preferred Alternative. Mobile emissions from privately owned vehicles (POVs) in ACAM account for a full year. The mobile emissions from POVs in Table 6 take into account the 120 day period for the Preferred Alternative.
Table 6. Estimated Increase in Mobile Source Emissions Associated with the Preferred Alternative
Emissions (tons/year) VOC CO NOx SOx PM10 PM2.5
Projected Mobile Emissions from 366 FW Aircraft Operations
0.78 4.6 2.8 0.056 0.47 0.43
Projected Mobile Emissions from 366 FW POVs*
0.61 11.2 0.51 0.0079 0.024 0.011
Projected Increase Over Existing Mobile Emissions
+1.39 +15.8 +3.3 +0.064 +0.49 +0.44
de minimis threshold n/a 100 n/a n/a 100 n/a
Ada County is a maintenance area for CO and PM10; however, the projected total net increases in CO and PM10 would not exceed de minimis thresholds and therefore a General Conformity determination is not required. If this alternative were selected, there would be no significant impacts with regard to local or regional air quality.
Alternative B: No Action Alternative
Under the No-Action Alternative, the 366 FW would not conduct aircraft operations at the Gowen Field ANGB while the 366 FW runways are unavailable for use for a 120 day period during the runway repair project at MHAFB Idaho. Therefore, air quality conditions in the Boise area would remain as described in Section 3.1, Air Quality. If this alternative were selected, there would be no impacts with regard to local or regional air quality.
Page 25

4.2 NOISE
4.2.1 Approach to Analysis
Noise impact analyses typically evaluate potential changes to existing noise environments that would result from implementation of a Proposed Action. Potential changes in the noise environment can be beneficial (i.e., if they reduce the number of sensitive receptors exposed to unacceptable noise levels), negligible (i.e., if the total area exposed to unacceptable noise levels is essentially unchanged), or adverse (i.e., if they result in increased exposure to unacceptable noise levels). An increase in noise levels resulting from introduction of a new noise source can create an impact on the surrounding environment. Noise associated with a Proposed Action is modeled and compared with the existing noise setting to determine the magnitude of potential impacts.
A significant noise impact would occur if analysis shows that the Proposed Action would cause noise-sensitive areas to experience increased noise exposure of at least 3 dB DNL and they would be exposed to DNL of at least 65 dB under the proposed conditions.
As mentioned in Chapter 3, NOISEMAP and INM were utilized for this analysis. The information in Appendix C summarizes the noise model and its input parameters relative to this work.
For this project, the Baseline scenario is the same as the No Action Alternative.
4.2.2 Impacts
Preferred Alternative
The Preferred Alternative would temporarily relocate the three squadrons of 366 FW aircraft to Gowen Field ANGB. This Alternative would include the relocation of up to 54 F-15E/SG aircraft, associated support equipment, and personnel for 120 days during CY15. Of the 120 days, 79 would be counted as flying days. Operationally, implementation of this Alternative Action would include up to 450 sorties flown by the 366 FW out of Gowen Field during a 120 day period, and all departing flights would require use of afterburner on airport property to minimize flight safety risks. The three squadrons within the 366 FW consist of the 389 FS, 391 FS, and the Royal Singapore Air Force (RSAF). The 389 FS and 391 FS F-15s are modeled with the F100-PW-229 engine, and the RSAF F-15s are modeled with the F100-PW-220 engine.
As shown in Table 7, proposed 389 FS and 391 FS F-15E flight operations would amount to 671 and RSAF F-15SG flight operations would amount to 319 for a total of 990 flight operations. Of the total F-15 flight operations, only 2% would be during the DNL nighttime period and would only consist of straight-in arrivals. The 990 F-15 flight operations would be added to the nearly 181,000 flight operations from the Baseline scenario. No F-35 operations are included in the proposed scenario.
Page 26
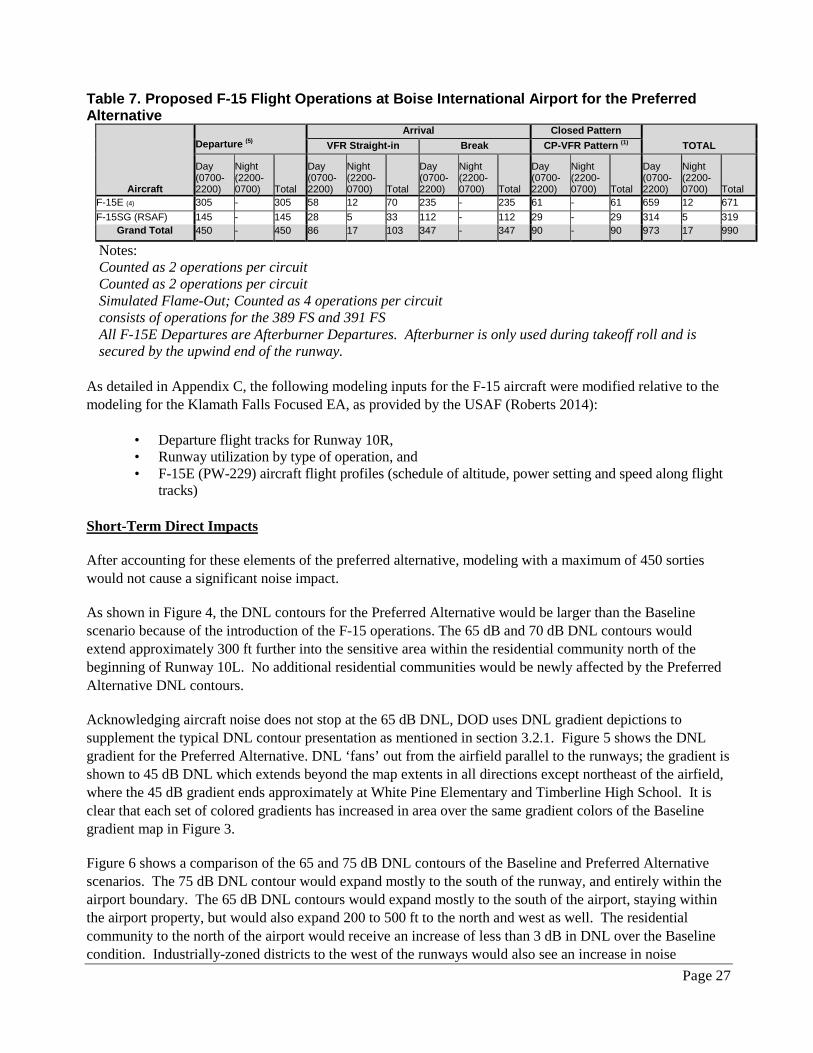
Table 7. Proposed F-15 Flight Operations at Boise International Airport for the Preferred Alternative
Aircraft
Departure (5)
Arrival Closed Pattern TOTAL VFR Straight-in Break CP-VFR Pattern (1)
Day (0700- 2200)
Night (2200- 0700) Total
Day (0700- 2200)
Night (2200- 0700) Total
Day (0700- 2200)
Night (2200- 0700) Total
Day (0700- 2200)
Night (2200- 0700) Total
Day (0700- 2200)
Night (2200- 0700) Total
F-15E (4) 305 - 305 58 12 70 235 - 235 61 - 61 659 12 671 F-15SG (RSAF) 145 - 145 28 5 33 112 - 112 29 - 29 314 5 319
Grand Total 450 - 450 86 17 103 347 - 347 90 - 90 973 17 990 Notes: Counted as 2 operations per circuit Counted as 2 operations per circuit Simulated Flame-Out; Counted as 4 operations per circuit consists of operations for the 389 FS and 391 FS All F-15E Departures are Afterburner Departures. Afterburner is only used during takeoff roll and is secured by the upwind end of the runway.
As detailed in Appendix C, the following modeling inputs for the F-15 aircraft were modified relative to the modeling for the Klamath Falls Focused EA, as provided by the USAF (Roberts 2014):
• Departure flight tracks for Runway 10R, • Runway utilization by type of operation, and • F-15E (PW-229) aircraft flight profiles (schedule of altitude, power setting and speed along flight
tracks)
Short-Term Direct Impacts
After accounting for these elements of the preferred alternative, modeling with a maximum of 450 sorties would not cause a significant noise impact.
As shown in Figure 4, the DNL contours for the Preferred Alternative would be larger than the Baseline scenario because of the introduction of the F-15 operations. The 65 dB and 70 dB DNL contours would extend approximately 300 ft further into the sensitive area within the residential community north of the beginning of Runway 10L. No additional residential communities would be newly affected by the Preferred Alternative DNL contours.
Acknowledging aircraft noise does not stop at the 65 dB DNL, DOD uses DNL gradient depictions to supplement the typical DNL contour presentation as mentioned in section 3.2.1. Figure 5 shows the DNL gradient for the Preferred Alternative. DNL ‘fans’ out from the airfield parallel to the runways; the gradient is shown to 45 dB DNL which extends beyond the map extents in all directions except northeast of the airfield, where the 45 dB gradient ends approximately at White Pine Elementary and Timberline High School. It is clear that each set of colored gradients has increased in area over the same gradient colors of the Baseline gradient map in Figure 3.
Figure 6 shows a comparison of the 65 and 75 dB DNL contours of the Baseline and Preferred Alternative scenarios. The 75 dB DNL contour would expand mostly to the south of the runway, and entirely within the airport boundary. The 65 dB DNL contours would expand mostly to the south of the airport, staying within the airport property, but would also expand 200 to 500 ft to the north and west as well. The residential community to the north of the airport would receive an increase of less than 3 dB in DNL over the Baseline condition. Industrially-zoned districts to the west of the runways would also see an increase in noise Page 27

exposure of between 2 and 5 dB, but those areas are not noise sensitive. The cause for the increase in noise exposure would be the proposed F-15 activity.
Figure 7 shows the Preferred Alternative 65 dB DNL contour and green area is the 3 dB or greater increase from the Baseline to the Preferred Alternative. The areas in green within the Preferred Alternative 65 dB DNL contour represent areas of potentially significant impact.
There are no residential zoning districts that are within the green area of 3 dB or greater within the Preferred Alternative 65 dB DNL contour. The inset area in the upper right corner of the map shows that the green significant impact area approaches the southern boundary of the residential community with the interstate, but does not cover any of the houses. A second inset area in the lower left corner of the map shows that the green significant impact area approaches the western boundary of the community next to the interstate off-ramp, but remains within the interstate boundary. Thus there would be no significant noise impacts with the implementation of the Preferred Alternative.
Page 28

Figure 4. Aircraft DNL Contours and Land Use for Preferred Alternative
Page 29

Figure 5. Aircraft DNL Gradients for Preferred Alternative
Page 30

Figure 6. Comparison of 65 dB and 75 dB DNL Contours of Baseline and Preferred Alternative
Page 31

Figure 7. Areas of 3 dB DNL Increase within the 65 dB DNL Contour for the Preferred Alternative
Page 32

Table 8 shows the land use analysis for the Preferred Alternative. Relative to Baseline, the Preferred Alternative would result in an increase in less than 1 acre of residential area exposed to 75-79 dB DNL, an increase of 6 acres of residential area exposed to 70-74 dB DNL, and an increase in 19 residential acres exposed to 65-69 dB DNL. The Preferred Alternative would result in approximately 28 people newly exposed to 70-74 dB DNL, and approximately 192 people newly exposed to 65-69 dB DNL. The number of off-airport acres for each of the DNL ranges has approximately doubled over the Baseline. Most of this acreage is zoned for industrial or open space. The airport boundary includes both Boise International Airport and Gowen Field. Similar to the Baseline, there is no area within the 80-84 and 85+ DNL contours that fall outside of the airport property.
No other types of sensitive receptors (e.g., schools, hospitals, places of worship, etc.) would be newly introduced to 65-69 or 70-74 dB DNL.
Table 8. Land Use Analysis for Preferred Alternative and Comparison with Baseline
Data Land Use Category
Off-Airport Data within DNL Band Increase within DNL Band
65-69 70-74 75-79 80-84 85+ Total (65+) 65-69 70-74 75-79 80-84 85+ Total (65+)
Acr
eage
Commercial/Office 14.6 4.4 0.5 - - 19.5 7.5 3.7 - - - 11.2 Industrial 156.0 3.6 - - - 159.6 78.2 3.4 - - - 81.6 Open Land 28.0 17.5 1.3 - - 46.8 (0.4) 9.6 0.9 - - 10.1 Residential 49.5 15.1 0.6 - - 65.2 19.1 5.9 0.5 - - 25.5 Total Off-Airport 248.1 40.6 2.4 - - 291.1 104.4 22.6 1.4 - - 128.4 On-Airport 787.6 326.0 214.0 223.7 107.7 1,659.0 125.3 67.7 39.6 (5.9) 96.2 322.9 GRAND TOTAL 1,035.7 366.6 216.4 223.7 107.7 1,950.1 229.7 90.3 41.0 (5.9) 96.2 451.3
Population 370 50 - - - 420 192 28 - - - 220
No long- term activities are associated with the Preferred Alternative. After 120 days, all aircraft and personnel associated with the 366 FW would return to MHAFB, Idaho and noise levels in the vicinity of BOI would return to Baseline conditions. Therefore, no long-term direct noise impacts would occur under the Preferred Alternative.
No-Action Alternative
No changes to existing noise conditions, as described in Section 3.2, would occur if the No- Action Alternative were selected. Therefore, no significant impacts to noise would result from implementation of the No-Action Alternative.
4.3 SAFETY
4.3.1 Approach to Analysis
The Air Force Safety Center (http://www.afsec.af.mil/aviationsafetydivision/aircraftstatistics.asp) and 366 FW Safety Office maintains flight safety data for all aircraft in the AF inventory. This data was accessed for the current proposed action. Additionally, in 2012 the AF completed an Environmental Impact Statement (EIS) for the Training Basing of the F-35 which was also used during this analysis.
Page 33

4.3.2 Impacts
Preferred Alternative
Safety. The 366 FW would conduct day-to-day operations and maintenance activities in accordance with applicable safety regulations, published Air Force Technical Orders, and standards prescribed by Air Force Occupational Safety and Health requirements. In addition, the 366 FW would have access to adequate fire suppression and security features and would operate under the IDANG’s existing Bird Aircraft Strike Hazard program (BASH). Therefore, implementation of the Preferred Alternative would not result in any significant impacts to safety.
The 366 FW would use the existing airspace, including Military Operation Airspace, restricted airspace, and Military Training Routes under the same procedures as currently exist. This would not result in any increase in safety risks associated with aircraft mishaps or any increase in the risks of occurrence of those mishaps.
Alternative B: No Action Alternative
Under the No-Action Alternative, the 366 FW would not conduct aircraft operations at the Gowen Field ANGB while the 366 FW runways are unavailable for use for 120 day period during the runway repair project at MHAFB Idaho. Therefore, safety would remain as currently exist and there would be no impacts with regard to safety concerns.
SECTION 5.0 CUMULATIVE IMPACTS
Cumulative impacts on environmental resources result from incremental impacts of the Preferred Alternative when combined with other past, present, and projects in the reasonably foreseeable future in an affected area. Cumulative impacts can result from minor but collectively substantial actions undertaken over a period of time by various agencies (Federal, state, or local) or private persons. In accordance with the NEPA, a discussion of cumulative impacts resulting from Preferred Alternatives, under construction, recently completed, or anticipated to be implemented in the near future is required.
For the Proposed Action, due primarily to the temporary and short-term nature of the relocation (i.e., 120 days), cumulative impacts would be considered the same as impacts resulting from implementation of the Preferred Alternative. For an analysis of Preferred Alternative’s impacts, please see Section 3.0, Affected Environment, and Section 4.0, Environmental Consequences
Page 34

SECTION 6.0 REFERENCES
Berglund & Lindvall eds.1995. Community Noise, Jannes Snabbtryck, Stockholm, Sweden. City of Boise. 2004. Boise Airport 14 CFR Part 150 Study Update: Updated Noise
Exposure Maps and Noise Compatibility Program. July.
Czech, J.J. and K.J. Plotkin. 1998. “NMAP 7.0 User’s Manual. Wyle Research Report WR 98- 13,” Wyle, November.
Czech J.J. 2014. “Draft NMAP 7.3 User’s Manual. Wyle Technical Note TN 14-13”, Wyle Laboratories Inc., August.
FAA 2007. Integrated Noise Model (INM) 7.0 User’s Manual. Washington, DC: Office of Environment and Energy.
FICAN 1997. “Effects of Aviation Noise on Awakenings from Sleep,” June.
FICON 1992. “Federal Agency Review of Selected Airport Noise Analysis Issues,” August. Harris 1979. Handbook of Noise Control, McGraw-Hill Book Co.
Idaho Air National Guard (IDANG). 2007. Final Environmental Assessment for Implementation of Base Realignment and Closure Final Recommendation for the 124th Wing. Idaho Air National Guard, 124th Wing, Gowen Field, Boise, Idaho.
IDANG. 2004. Final 2002 Air Emissions Inventory, Idaho Air National Guard, Gowen Field, Boise, Idaho.
IDANG. 2010. Final 2009 Air Emissions Inventory, 124th Fighter Wing, Idaho Air National Guard, Boise, Idaho.
Idaho Department of Environmental Quality (IDEQ). 2014. Air Quality Division. Attainment versus Nonattainment. Available at https://www.deq.idaho.gov/air- quality/monitoring/attainment-versus-nonattainment.aspx. Accessed: September 2014.
Oregon Air National Guard. 2009. Final Focused Environmental Assessment for Proposed Temporary Relocation of the 173rd Fighter Wing to Gowen Field Air National Guard Base. Oregon Air National Guard. Klamath Falls, Oregon.
Roberts 2014. Personal communication. October 22, 2014.
Solution Environmental, Inc. (2014). Air Conformity Applicability Model (Version 5.0) [Software]. Available at http://www.aqhelp.com/
U.S. Air Force. 1992. Air Force Procedure for Predicting Noise Around Airbases – Noise Exposure Model Technical Report, (Report AL-TR-1992-0059). May. Washington, DC.
USAF 2012. Final F-35A Training Basing Environmental Impact Statement, Vol I
USAF 2011. Elmendorf F-22 Plus-Up EA – TBD – AFCEC to complete.
Page 35

U.S. Environmental Protection Agency (USEPA). 2011. USEPA Office of Air Quality Planning and Standards, 2011 National Emissions Inventory. Available at: http://www.epa.gov/air/emissions/where.htm. Accessed: September 2014.
Wasmer Consulting 2013a. “BaseOps 7.358 User’s Guide,” Fred Wasmer and Fiona Maunsell, Wasmer Consulting.
Wasmer Consulting 2013b. “NMPlot 4.967 User’s Guide,” Fred Wasmer and Fiona Maunsell, Wasmer Consulting.
Western Regional Climate Center (WRCC). 2014a. Period of Record Monthly Climate Summary for Boise WSFO Airport, Idaho. Period of Record: 1940 to 2010. Available at: http://www.wrcc.dri.edu/climatedata/comparative/, Accessed: September 2014.
WRCC. 2014b. Period of Record Monthly Average Snowfall for Boise WSFO Airport, Idaho.
Period of Record: 1948 to 2010. Available at: http://www.wrcc.dri.edu/htmlfiles/id/id.sno.html, Accessed: September 2014.
WRCC. 2014c. Average Wind Speeds by State. Period of Record: 1996 to 2006. Availableat: http://www.wrcc.dri.edu/htmlfiles/westwind.final.html, Accessed: September 2014.
WRCC. 2014d. Average Wind Direction by State. Period of Record: 1992 to 2002. Available at: http://www.wrcc.dri.edu/htmlfiles/westwinddir.html, Accessed: September 2014.
Page 36

SECTION 7.0 LIST OF PREPARERS
This report was prepared for, and under the direction of, the Air National Guard by Mountain Home Air Force Base. Members of the professional staff are listed below:
Ms. Paula Jo Brown, Project Manager M.S. Environmental Science Mr. Eddie Jackson, EIAP Program Manager Ms. Lisa Lowe, Air Manager B.S. Biology M.S. Chemistry M.S. Chemical Engineering Ms. Sheri L. Robertson, EIAP Program Manager M.A. Anthropology Mr. Carl Rudeen, Natural Resources Program Manager B.S. Wildlife Resources B.S. Rangeland Ecology and Management M.S. Geographic Information Science Mr. Joseph Czech, Noise (Wyle Laboratories, Inc.) B.S. Aerospace Engineering Mr. Ben Manning, Noise (Wyle Laboratories, Inc.) B.S. Mechanical Engineering M.S. Mechanical Engineering
Page 37

APPENDIX A IICEP DISTRIBUTION LIST/CORESPONDANCE
Page 38

Ada County Development Services 200 West Front Street Boise ID 83702 (208) 287-7900 Mr. Kevin Booe, Director Boise Public Library 715 S. Capitol Blvd Boise ID 83702 (208) 384-4450 City of Boise Planning and Zoning 1501 N. Capitol Blvd Boise ID 83702 (208) 384-3853 Ms. Mary DeWalt Ada Community Library Director 10664 West Victory Road Boise ID 83709 (208) 362-0181 Mr. Eugene Greene, Jr., Chairperson Confederated Tribes of the Warm Springs Reservation of Oregon P.O. Box C Warm Springs OR 97761 Mr. Ted Howard, Cultural Resources Director Shoshone-Paiute Tribes Duck Valley Reservation P.O. Box 219 Owyhee NV 89832 Idaho Department of Fish and Game, SW Region 3101 S. Powerline Road Nampa ID 83686 (208) 465-8465 IDEQ, Directors Office 1410 N. Hilton Boise ID 83706 (208) 373-0204 Mr. Greg Martinez U.S. Army Corps of Engineers Boise Office 720 Park Blvd. Ste 255 Boise, Id. 83712 (204) 345-2064 Ms. Cayla Morgan Federal Aviation Administration Seattle Airport District Office 1601 Lind Avenue, S.W. Renton WA 98055-4056 (425) 227-2653 Mr. Travis Pitkin Curations and Compliance Officer 210 Main Street Boise ID 83702 (208) 334-3847
Ms. Christina Reichgott U.S. Environmental Protection Agency Region 10 ETPA – 088, 1200 Sixth Avenue Seattle WA 98101 (206) 553-1601 Mr. Mark Robertson U.S. Fish and Wildlife Service, Idaho State Office. 1387 S. Vinnell Way, Room 368 Boise ID 83709 (208) 378-5287 Ms. Charlotte Roderique Chairperson Burns Paiute Tribe 100 Pasigo Street Burns OR 9772 Ms. Jill Singer, City of Boise, Boise Airport 3201 Airport Way, Suite 1000 Boise ID 83705 (208) 383-3110 Mr. Nathan Small Chairman Shoshone-Bannock Tribes P.O. Box 306 Fort Hall ID 83203 Mr. Tildon Smart, Chairman Paiute-Shoshone Tribes of Fort McDermitt P.O. Box 457 McDermitt NV 89421 Ms. Sue Sullivan IDOT, Development Division 3311 W. State Street Boise ID 83707-1129 (208) 334-820
Page 39

Page 40

Page 41

Page 42

Page 43

Page 44


Page 57

Page 58

Page 59
Comment Response Matrix Temporary Relocation of the 366 FW – Scoping (Nov 2014)
# Location Type of
Comment Comment Reviewer Response
Page Line Section S, C, A
1 n/a n/a n/a n/a The Service recommends that the ANG develops project design features for all action alternatives that avoid or minimize the potential effects of the proposed temporary relocation of the 366 FW at the Boise Municipal Airport and its associated airspace on any listed, proposed, or candidate species.
S. Robertson, 366 CES/CEIE
H. Caye, 124 CES/CEV
Proposed action would remain within the existing BOI noise contours; however, there would be an increase in the number of military aircraft departures/arrivals at Gowen Field. No change to military training locations would occur as part of the proposed action; however, there would be an increase in the number of F-15s travelling through the airspace from Gowen Field to the military training location. . We expect there to be no potential impacts to any listed, proposed, or candidate species due to the proposed 366 FW temporary relocation.
2 n/a n/a n/a n/a The Service recommends that the 366 FW military training activities include project design features for all action alternatives that avoid or minimize the potential impacts to slickspot peppergrass in the Boise Municipal
S. Robertson, 366 CES/CEIE
H. Caye, 124 CES/CEV
Proposed action would remain within the existing BOI noise contours. No change to

Page 60
Comment Response Matrix Temporary Relocation of the 366 FW – Scoping (Nov 2014)
# Location Type of
Comment Comment Reviewer Response
Page Line Section S, C, A
Airport area as well as continue to comply with the 2012 MHAFB INRMP when training in facilities and airspace for the MHAFB.
military training locations would occur as part of the proposed action. There would be no potential impacts to slickspot peppergrass due to the proposed 366 FW temporary relocation. The FW would continue to comply with all aspects of the 2012 MHAFB INRMP.
3 n/a n/a n/a n/a We encourage the AF to continue to work closely with the IDFG to identify and implement conservation measures for greater sage-grouse local populations, including conservation measures to address potential effects of aircraft noise associated to comply with the proposed temporary relocation of the 366 FW at the Boise Municipal Airport.
S. Robertson, 366 CES/CEIE
H. Caye, 124 CES/CEV
Proposed action would remain within the existing BOI noise contours; however, there would be an increase in the number of military aircraft flights at Gowen Field.. No change to military training locations would occur as part of the proposed action; however, there would be an increase in the number of F-15s travelling through the airspace from Gowen Field to the military training location.. The 366 FW would

Page 61
Comment Response Matrix Temporary Relocation of the 366 FW – Scoping (Nov 2014)
# Location Type of
Comment Comment Reviewer Response
Page Line Section S, C, A
continue to work closely with the IDFG regarding GSG. We expect there to be negligible/ no potential impacts to GSG due to the proposed 366 FW temporary relocation.
4 n/a n/a n/a n/a The Service encourages the AF to continue their use of best management practices to minimize potential effects of the military training on bald and golden eagles and migratory birds as described in existing BASH plans and applicable existing INRMPs, including the MHAFB INRMP.
S. Robertson, 366 CES/CEIE
H. Caye, 124 CES/CEV
The 366 FW would use best management practice to minimize potential effects of military training on migratory birds. Additionally, Standard Operating Procedures protective of migratory birds are incorporated into 366th INRMP and will be utilized during the temporary relocation to Gowen Field.
5 n/a n/a n/a n/a Dear Colonel Marsano - I am writing in support of the F-15's possibly coming to Gowen Field AFB for training while the Mountain Home air strip is being resurfaced. I believe anything we can do, especially locally, to be supportive of our armed forces is prudent and I whole heartedly support it. Additionally, it helps those service men and also helps the local economy. I believe the resultant increase in noise will be a minimal distraction, and rather should send shivers of pride through Boise that we have such a resource so close by.
S. Robertson, 366 CES/CEIE
H. Caye, 124 CES/CEV
Comment received

Page 62
Comment Response Matrix Temporary Relocation of the 366 FW – Scoping (Nov 2014)
# Location Type of
Comment Comment Reviewer Response
Page Line Section S, C, A
Thank you for the opportunity to comment. Respectfully, Janie W. Potter (email)
6 n/a n/a n/a n/a Dear Sirs: Until moving to Boise, I have lived for years near either Eielson AFB or Fairchild AFB and know what afterburner takeoffs sound like. Your Mountain Home runway is 13510 feet long compared to BOI at 9736. You will have to use maximum thrust afterburner takeoffs just in case a pilot needs to abort a takeoff and still have room to stop on the remaining runway. Your relocation to another air force base would provide the 3774 feet of runway that BOI lacks to make an emergency aborted takeoff. You are not providing or intentionally not disclosing relevant information in your TV announcements. I believe that the relocation to Boise has already been decided and that you are only going through the motions to make it look like other alternatives are really being considered. Have you made F15 relocation TV announcements at these other possible sites? If you have please identify them. Environmental impact studies in Florida have shown that the F-15 fighter has led to noise complaints from local communities in the USA. It seems likely that you will create a broad swathe of local political turmoil in Boise if you relocate them here. Mayor Dave Bieter will get a continual ear full when these aircraft are relocated here. Most people in Boise won't complain until after you move them and they experience a couple of afterburner takeoffs. If you do relocate these F15's here, are you planning on compensating or even buying out nearby homeowners who will be affected by the noise? A reasonable alternative would be to relocate your F15's to Nellis AFB or any runway that is isolated enough that the afterburners don't rattle the doors and
S. Robertson, 366 CES/CEIE
H. Caye, 124 CES/CEV
Alternate locations are being considered. All proposed locations comply with the National Environmental Process Act (NEPA).
If the proposed action moves forward, temporary relocation would not occur during the winter months.

Page 63
Comment Response Matrix Temporary Relocation of the 366 FW – Scoping (Nov 2014)
# Location Type of
Comment Comment Reviewer Response
Page Line Section S, C, A
windows and wake up infants like they do when they have taken off from BOI to the southeast. I live on Warm Springs Mesa. In the winter with denser cold air, your noise pollution will be even worse that the occasional take off or low passes that your F15's have generated in the past at BOI when taking off or climbing using afterburners. Robert Collins (email)
7 n/a n/a n/a n/a Colonel Marsano, My wife and I would like to voice our support for the temporary operation of F-15s from Mt. Home AFB at Gowen Field. Although they are a little noisier than the wonderful A-10s we have based here in Boise, we love the sound of Jet Noise and all they represent from the US Air Force! Best wishes and thank you for all you do to protect our great nation. Sincerely, Mark and Joan Peterson (email)
S. Robertson, 366 CES/CEIE
H. Caye, 124 CES/CEV
Comment received
8 n/a n/a n/a n/a Dear Col. Marsano, I just saw the story on the web about the runway repair at MHAFB. I live 2 miles from the east end of the runway (as the crow flies) near the Simplot Sports Complex. My family and I would like to see the F-15s in full burner, max climb, at night. Thank you for your service. Tracy Whittington USAF (ret) (email)
S. Robertson, 366 CES/CEIE
H. Caye, 124 CES/CEV
Comment received
9 n/a n/a n/a n/a Col Marsano, I am excited about the possibility of Mountain Home AFB's F-15 being temporarily stationed at Gowen Field. I think it would be great to have the F-15s in Boise. I do believe that most of the Boise and surrounding communities would agree. So count me in as an affirmative for the F-15s at Gowen Field. Thank you, Jeff Dinicola (email)
S. Robertson, 366 CES/CEIE
H. Caye, 124 CES/CEV
Comment received

Page 64
Comment Response Matrix Temporary Relocation of the 366 FW – Scoping (Nov 2014)
# Location Type of
Comment Comment Reviewer Response
Page Line Section S, C, A
10 n/a n/a n/a n/a Hello Colonel Marsano Please allow my husband and me to express our support for bringing the F-15s to Gowen Field. We live by the airport, so we would be highly impacted by their flights in our area. However, to us, this sounds like freedom, and we respect and support the military and the training of pilots. Our son-in-law was an Air Force pilot, fighting in Afghanistan. If you are keeping a tally, please allow us two "yes" votes! Thank you Donna and Mike Monroe (email)
S. Robertson, 366 CES/CEIE
H. Caye, 124 CES/CEV
Comment received
11 n/a n/a n/a n/a Col. Marsano Let me preface my remarks with a thank you to you and all those serving in the military. I'd like to voice my objection to bringing jets to Boise for training. My objection is based on noise and air pollution caused by the jets. I do not live near the airport, in fact, I live across the valley. So I am not in the direct take-off and landing path, however the noise level is significant enough that we are bothered by the noise in the house which is well insulated and has double glass windows throughout. When I attended a program the air Force put on last year they exhibited noise level comparisons between jets and other noise emitters. They compared the noise emitted from a jet to that of a jack hammer. During the remodeling of the Boise Airport I'm sure many jack hammers were used to break up concrete. I never heard any jack hammers or other sounds coming from the airport. If fact, there is no other sound in the valley that is so permeating. If there were it would be covered by noise ordinances the city has. With Mtn Home Air Base only 40 miles away it doesn't make sense to bring additional pollution to the valley where are air quality is terrible according to the EPA. Obviously the Mayor and other politicians
S. Robertson, 366 CES/CEIE
H. Caye, 124 CES/CEV
The Air National Guard performed extensive noise analysis to develop this alternative so that it meets the selection standard requiring no significant noise impacts on the community. As part of this analysis, 366 FW identified several adjustments to their typical flight profiles to avoid noise impacts on sensitive areas of the community. Modified take-off operations are identified in the EA, page 5. If the Preferred Alternative is chosen, the move would temporary. Members
Page 65
Comment Response Matrix Temporary Relocation of the 366 FW – Scoping (Nov 2014)
# Location Type of
Comment Comment Reviewer Response
Page Line Section S, C, A
say they want the jets here because of jobs. They fail to mention that most of the people wouldn’t lose their jobs and could work in Mtn Home, which is now only 30 minutes away with the 80 mile per hr speed limit. That's less than most commuters spend getting into Boise. If quality of life for the majority of residents in Boise is of any importance to the military, you should recognize that the City has grown way beyond the boundaries when Gowen field was “way out of town " and the planes made significant less noise than today's jet. To sit on the patio or work in the garden which should be relaxing time is often anything but with the noise of the jets. Thank you for your time Bill and Edie Morse (email)
will remain stationed at MHAFB. They will commute during the temporary relocation.
12 Letter 1
n/a n/a n/a See attached S. Robertson, 366 CES/CEIE
H. Caye, 124 CES/CEV
The Air National Guard performed extensive noise analysis to develop this alternative so that it meets the selection standard requiring no significant noise impacts on the community. As part of this analysis, 366 FW identified several adjustments to their typical flight profiles to avoid noise impacts on sensitive areas of the community. Modified take-off operations are

Page 66
Comment Response Matrix Temporary Relocation of the 366 FW – Scoping (Nov 2014)
# Location Type of
Comment Comment Reviewer Response
Page Line Section S, C, A
identified in the EA, page 5. Night-flights nor weekend flights would occur during the relocation.
13 Letter 2
n/a n/a n/a S. Robertson, 366 CES/CEIE
H. Caye, 124 CES/CEV
The Air National Guard performed extensive noise analysis to develop this alternative so that it meets the selection standard requiring no significant noise impacts on the community. As part of this analysis, 366 FW identified several adjustments to their typical flight profiles to avoid noise impacts on sensitive areas of the community. Modified take-off operations are identified in the EA, page 5. Night flights nor weekend flights would occur during the relocation.
14 Letter 3
n/a n/a n/a S. Robertson, 366 CES/CEIE
The Air National Guard performed extensive noise

Page 67
Comment Response Matrix Temporary Relocation of the 366 FW – Scoping (Nov 2014)
# Location Type of
Comment Comment Reviewer Response
Page Line Section S, C, A
H. Caye, 124 CES/CEV analysis to develop this alternative so that it meets the selection standard requiring no significant noise impacts on the community. As part of this analysis, 366 FW identified several adjustments to their typical flight profiles to avoid noise impacts on sensitive areas of the community. Modified take-off operations are identified in the EA, page 5. Air analysis was conducted during the EA process. Analysis resulted in no increase in air quality due to the proposed relocation of MHAFB 54 F15's. See Section 3.1 Air Quality.
15 Letter 4
n/a n/a n/a See attached S. Robertson, 366 CES/CEIE
H. Caye, 124 CES/CEV
Comment received
16 Letter 5
n/a n/a n/a See attached S. Robertson, 366 CES/CEIE
Alternate locations are being considered. All proposed locations

Page 68
Comment Response Matrix Temporary Relocation of the 366 FW – Scoping (Nov 2014)
# Location Type of
Comment Comment Reviewer Response
Page Line Section S, C, A
H. Caye, 124 CES/CEV comply with the National Environmental Process Act (NEPA).
17 Letter 6
n/a n/a n/a See attached S. Robertson, 366 CES/CEIE
H. Caye, 124 CES/CEV
The Air National Guard performed extensive noise analysis to develop this alternative so that it meets the selection standard requiring no significant noise impacts on the community. As part of this analysis, 366 FW identified several adjustments to their typical flight profiles to avoid noise impacts on sensitive areas of the community. Modified take-off operations are identified in the EA, page 5. Number of sorties a day could be up to 30 per day. Flying operations would only occur during the day. No weekend flying would occur.

Page 69
Comment Response Matrix Temporary Relocation of the 366 FW – Scoping (Nov 2014)
# Location Type of
Comment Comment Reviewer Response
Page Line Section S, C, A
18 Letter 7
n/a n/a n/a See attached S. Robertson, 366 CES/CEIE
H. Caye, 124 CES/CEV
Comment received
19 Letter 8
n/a n/a n/a See attached S. Robertson, 366 CES/CEIE
H. Caye, 124 CES/CEV
The Air National Guard performed extensive noise analysis to develop this alternative so that it meets the selection standard requiring no significant noise impacts on the community. As part of this analysis, 366 FW identified several adjustments to their typical flight profiles to avoid noise impacts on sensitive areas of the community. Modified take-off operations are identified in the EA, page 5. Air analysis was conducted during the EA process. Analysis resulted in no increase in air quality due to the proposed relocation of MHAFB 54 F15's. See Section 3.1 Air Quality.

Page 70
To add additional rows, place cursor in the bottom right cell and hit << Tab>>. Comment Types: C=Critical; S= Substantive; A=Administrative (See definitions below)
DEFINITIONS Critical – Comments identifying deficiencies that, if not addressed, would cause the EIAP document to be legally insufficient. Substantive – Comments identifying an item in the document that appears to be, or is potentially, incorrect, misleading, or confusing. Substantive comments may also identify a future requirement (e.g. consultation, public release, FONPA requirements) which may not currently be critical, but could become critical before completion of the project (e.g. completion of consultation is not required for a preliminary draft EA, but would be needed before signing a FONSI in most cases). Administrative – Comments identifying minor inconsistencies between different sections or errors in typography and grammar.


APPENDIX B AIR QUALITY CALCULATIONS
Page 80

AIR CONFORMITY APPLICABILITY MODEL REPORT RECORD OF CONFORMITY ANALYSIS (ROCA)
1. General Information: The Air Force’s Air Conformity Applicability Model (ACAM) was used to perform an analysis to assess the potential air quality impact/s associated with the action in accordance with the Air Force Instruction 32-7040, Air Quality Compliance And Resource Management; the Environmental Impact Analysis Process (EIAP, 32 CFR 989); and the General Conformity Rule (GCR, 40 CFR 93 Subpart B). This report provides a summary of the ACAM analysis. a. Action Location: Base: GOWEN FIELD ANGB County(s): Ada Regulatory Area(s): Boise-Northern Ada County, ID b. Action Title: Relocation of the 366th Fighter Wing c. Project Number/s (if applicable): d. Projected Action Start Date: 5 / 2015 e. Action Description: The 366th Fighter Wing (366 FW), Mountain Home Air Force Base (MHAFB) Idaho, has recently approved a
comprehensive airfield construction project at MHAFB, Idaho. In order to continue training and operational activities during this planned runway construction project, MHAFB has proposed to temporarily relocate the 366 FW currently operating at MHAFB to Gowen Field Air National Guard Base (ANGB). Gowen Field is located on the south side of the Boise Municipal Airport (BOI) in Boise, Idaho. This temporary relocation of 54 F-15E aircraft, associated support equipment, and 1500 personnel beginning 27 April 2015 to 21 Aug 2015. Personnel would be transported daily to and from home station. While relocated to Gowen Field ANGB, the 366 FW would utilized existing facilities. Operationally, the implementation of the Proposed Action would include a total of 2,200 sorties, departing from and returning to BOI with flight operations conducted in military operation airspace. Flight operations would occur during day light hours, Monday thru Friday.
A review of regional installations and airfields capable of providing an appropriate alternative site location for
the Proposed Action was conducted; however, no regional alternative sites were identified that could provide adequate and vacant airfield facility space. Therefore, only the no-Action Alternative will be carried forward for anaylsis in the Environmental Assessment.
f. Point of Contact: Name: Lisa Lowe Title: GS-11 / Physical Scientist Organization: 366 CES/CEIE Email: [email protected] Phone Number: 208-828-6667 2. Analysis: Total combined direct and indirect emissions associated with the action were estimated through ACAM on a calendar-year basis for the “worst-case” and “steady state” (net gain/loss upon action fully implemented) emissions. General Conformity under the Clean Air Act, Section 1.76 has been evaluated for the action described above according to the requirements of 40 CFR 93, Subpart B. Based on the analysis, the requirements of this rule are: _____ applicable __X__ not applicable

AIR CONFORMITY APPLICABILITY MODEL REPORT RECORD OF CONFORMITY ANALYSIS (ROCA)
Conformity Analysis Summary:
2015 Pollutant Action Emissions (ton/yr) GENERAL CONFORMITY
Threshold (ton/yr) Exceedance (Yes or No) Boise-Northern Ada County, ID VOC 5.545 NOx 13.472 CO 55.624 100 No SOx 0.313 PM 10 2.183 100 No PM 2.5 1.954 Pb 0.000 NH3 0.283 All estimated emissions associated with this action are below the conformity threshold values established at 40
CFR 93.153 (b); Therefore, the requirements of the General Conformity Rule are not applicable.
XLisa B. LoweGS-11 / Physical Scientist
DETAIL AIR CONFORMITY APPLICABILITY MODEL REPORT
1. General Information
- Action Location
Base: GOWEN FIELD ANGB
County(s): Ada
Regulatory Area(s): Boise-Northern Ada County, ID
- Action Title: Relocation of the 366th Fighter Wing
- Project Number/s (if applicable):
- Projected Action Start Date: 5 / 2015
- Action Purpose and Need:
The purpose of the Proposed Action is to facilitate continued mission execution by the 366 FW, its primary
objective being the training of air-to-air combat pilots and serving the nation in times of peace and war.
- Action Description:
The 366th Fighter Wing (366 FW), Mountain Home Air Force Base (MHAFB) Idaho, has recently approved a
comprehensive airfield construction project at MHAFB, Idaho. In order to continue training and operational
activities during this planned runway construction project, MHAFB has proposed to temporarily relocate the
366 FW currently operating at MHAFB to Gowen Field Air National Guard Base (ANGB). Gowen Field is
located on the south side of the Boise Municipal Airport (BOI) in Boise, Idaho. This temporary relocation of 54
F-15E aircraft, associated support equipment, and 1500 personnel beginning 27 April 2015 to 21 Aug 2015.
Personnel would be transported daily to and from home station. While relocated to Gowen Field ANGB, the
366 FW would utilized existing facilities. Operationally, the implementation of the Proposed Action would
include a total of 2,200 sorties, departing from and returning to BOI with flight operations conducted in military
operation airspace. Flight operations would occur during day light hours, Monday thru Friday.
The 366 FW would transport mobile aircraft arresting systems, airfield sweeper, AGE, Deployed Debrief
Facilities, and various general support equiment and vehicles. It is anticipated that this equipment would require
approcimatley 50 truckloads for transportation. The 366 FW does not propose construction of any new facilities
or demolition to support this action.
A review of regional installations and airfields capable of providing an appropriate alternative site location for
the Proposed Action was conducted; however, no regional alternative sites were identified that could provide
adequate and vacant airfield facility space. Therefore, only the no-Action Alternative will be carried forward for
anaylsis in the Environmental Assessment.
- Point of Contact
Name: Lisa Lowe
Title: GS-11 / Physical Scientist
Organization: 366 CES/CEIE
Email: [email protected]
Phone Number: 208-828-6667
- Activity List:
Activity Type Activity Title
2. Aircraft 18 F-15E aircraft with Engine Type F100-PW-220
3. Aircraft 24 F-15E aircraft with Engine Type F100-PW-229
4. Aircraft 12 F-15SG aircraft with Engine Type F110-GE-129
5. Personnel 1,500 Personnel

DETAIL AIR CONFORMITY APPLICABILITY MODEL REPORT
2. Aircraft
2.1 General Information & Timeline Assumptions
- Add or Remove Activity from Baseline? Add
- Activity Location
County: Ada
Regulatory Area(s): Boise-Northern Ada County, ID; Boise-Northern Ada County, ID
- Activity Title: 18 F-15E aircraft with Engine Type F100-PW-220
- Activity Description:
18 F-15E aircraft with Engine Type F100-PW-220 would fly approximately 733 sorties from 27 April to 21
August 2015.
- Activity Start Date
Start Month: 5
Start Year: 2015
- Activity End Date
Indefinite: No
End Month: 8
End Year: 2015
- Activity Emissions:
Pollutant Total Emissions (TONs) Pollutant Total Emissions (TONs)
VOC 2.099932 PM 2.5 0.689867
SOx 0.088555 Pb 0.000000
NOx 4.188418 NH3 0.000000
CO 9.616609
PM 10 0.756109
2.2 Aircraft & Engines
2.2.1 Aircraft & Engines Assumptions
- Aircraft & Engine
Aircraft Designation: F-15E
Engine Model: F100-PW-220
Primary Function: Combat
Number of Engines: 2
- Aircraft & Engine Surrogate
Is Aircraft & Engine a Surrogate? No
Original Aircraft Name:
Original Engine Name:
2.2.2 Aircraft & Engines Emission Factor(s)
- Aircraft & Engine Emissions Factors (lb/1000lb fuel)
Fuel Flow VOC SOx NOx CO PM 10 PM 2.5 CO2e
Idle 1084.00 7.94 1.06 4.61 35.30 2.06 1.85 3252.46
Approach 3837.00 5.12 1.06 12.53 1.92 2.63 2.37 3252.46

DETAIL AIR CONFORMITY APPLICABILITY MODEL REPORT
Intermediate 5770.00 2.89 1.06 22.18 0.86 2.06 1.85 3252.46
Military 9679.00 1.79 1.06 29.32 0.86 1.33 1.20 3252.46
After Burn 41682.00 1.53 1.06 8.37 11.99 1.15 1.04 3252.46
2.3 Flight Operations
2.3.1 Flight Operations Assumptions
- Flight Operations
Number of Aircraft: 18
Number of Annual LTOs (Landing and Take-off) cycles: 41
Number of Annual TGOs (Touch-and-Go) cycles: 0
- Default Settings Used: Yes
- Flight Operations TIMs (Time In Mode)
Taxi/Idle Out (mins): 18.5 (default)
Takeoff (mins): 0.4 (default)
Climb Out (mins): 0.8 (default)
Approach (mins): 3.5 (default)
Taxi/Idle In (mins): 11.3 (default)
- Trim Test
Idle (mins): 12 (default)
Approach (mins): 27 (default)
Intermediate (mins): 9 (default)
Military (mins): 9 (default)
AfterBurn (mins): 3 (default)
2.3.2 Flight Operations Formula(s)
- Aircraft Emissions per Mode for LTOs per Year
AEMPOL = (TIM / 60) * (FC / 1000) * EF * NE * NA * LTO / 2000
AEMPOL: Aircraft Emissions per Pollutant & Mode (TONs)
TIM: Time in Mode (min)
60: Conversion Factor minutes to hours
FC: Fuel Flow Rate (lb/hr)
1000: Conversion Factor pounds to 1000pounds
EF: Emission Factor (lb/1000lb fuel)
NE: Number of Engines
NA: Number of Aircraft
LTO: Number of Landing and Take-off Cycles
2000: Conversion Factor pounds to TONs
- Aircraft Emissions for LTOs per Year
AELTO = AEMIDLE_IN + AEMIDLE_OUT + AEMAPPROACH + AEMCLIMBOUT + AEMTAKEOFF
AELTO: Aircraft Emissions (TONs)
AEMIDLE_IN: Aircraft Emissions for Idle-In Mode (TONs)
AEMIDLE_OUT: Aircraft Emissions for Idle-Out Mode (TONs)
AEMAPPROACH: Aircraft Emissions for Approach Mode (TONs)
AEMCLIMBOUT: Aircraft Emissions for Climb-Out Mode (TONs)
AEMTAKEOFF: Aircraft Emissions for Take-Off Mode (TONs)

DETAIL AIR CONFORMITY APPLICABILITY MODEL REPORT
- Aircraft Emissions per Mode for TGOs per Year
AEMPOL = (TIM / 60) * (FC / 1000) * EF * NE * NA * TGO / 2000
AEMPOL: Aircraft Emissions per Pollutant & Mode (TONs)
TIM: Time in Mode (min)
60: Conversion Factor minutes to hours
FC: Fuel Flow Rate (lb/hr)
1000: Conversion Factor pounds to 1000pounds
EF: Emission Factor (lb/1000lb fuel)
NE: Number of Engines
NA: Number of Aircraft
TGO: Number of Touch-and-Go Cycles
2000: Conversion Factor pounds to TONs
- Aircraft Emissions for TGOs per Year
AETGO = AEMAPPROACH + AEMCLIMBOUT + AEMTAKEOFF
AETGO: Aircraft Emissions (TONs)
AEMAPPROACH: Aircraft Emissions for Approach Mode (TONs)
AEMCLIMBOUT: Aircraft Emissions for Climb-Out Mode (TONs)
AEMTAKEOFF: Aircraft Emissions for Take-Off Mode (TONs)
- Aircraft Emissions per Mode for Trim per Year
AEPSPOL = (TD / 60) * (FC / 1000) * EF * NE * NA * NTT / 2000
AEPSPOL: Aircraft Emissions per Pollutant & Power Setting (TONs)
TD: Test Duration (min)
60: Conversion Factor minutes to hours
FC: Fuel Flow Rate (lb/hr)
1000: Conversion Factor pounds to 1000pounds
EF: Emission Factor (lb/1000lb fuel)
NE: Number of Engines
NA: Number of Aircraft
NTT: Number of Trim Test
2000: Conversion Factor pounds to TONs
- Aircraft Emissions for Trim per Year
AETRIM = AEPSIDLE + AEPSAPPROACH + AEPSINTERMEDIATE + AEPSMILITARY + AEPSAFTERBURN
AETRIM: Aircraft Emissions (TONs)
AEPSIDLE: Aircraft Emissions for Idle Power Setting (TONs)
AEPSAPPROACH: Aircraft Emissions for Approach Power Setting (TONs)
AEPSINTERMEDIATE: Aircraft Emissions for Intermediate Power Setting (TONs)
AEPSMILITARY: Aircraft Emissions for Military Power Setting (TONs)
AEPSAFTERBURN: Aircraft Emissions for After Burner Power Setting (TONs)
2.4 Auxiliary Power Unit (APU)
2.4.1 Auxiliary Power Unit (APU) Assumptions
- Default Settings Used: Yes
- Auxiliary Power Unit (APU) (default)
Number of APU
per Aircraft
Operation Hours
for Each LTO
Exempt
Source?
Designation Manufacturer

DETAIL AIR CONFORMITY APPLICABILITY MODEL REPORT
2.4.2 Auxiliary Power Unit (APU) Emission Factor(s)
- Auxiliary Power Unit (APU) Emission Factor (lb/hr)
Designation Fuel Flow VOC SOx NOx CO PM 10 PM 2.5 CO2e
2.4.3 Auxiliary Power Unit (APU) Formula(s)
- Auxiliary Power Unit (APU) Emissions per Year
APUPOL = APU * OH * LTO * NA * EFPOL / 2000
APUPOL: Auxiliary Power Unit (APU) Emissions per Pollutant (TONs)
APU: Number of Auxiliary Power Units
OH: Operation Hours for Each LTO (hour)
LTO: Number of LTOs
NA: Number of Aircraft
EFPOL: Emission Factor for Pollutant (lb/hr)
2000: Conversion Factor pounds to tons
2.5 Aircraft Engine Test Cell
2.5.1 Aircraft Engine Test Cell Assumptions
- Engine Test Cell
Total Number of Aircraft Engines Tested Annually: 36
- Default Settings Used: Yes
- Annual Run-ups / Test Durations
Annual Run-ups (Per Aircraft Engine): 1 (default)
Idle Duration (mins): 12 (default)
Approach Duration (mins): 27 (default)
Intermediate Duration (mins): 9 (default)
Military Duration (mins): 9 (default)
After Burner Duration (mins): 3 (default)
2.5.2 Aircraft Engine Test Cell Emission Factor(s)
- See Aircraft & Engines Emission Factor(s)
2.5.3 Aircraft Engine Test Cell Formula(s)
- Aircraft Engine Test Cell Emissions per Pollutant & Power Setting (TONs)
TestCellPSPOL = (TD / 60) * (FC / 1000) * EF * NE * ARU / 2000
TestCellPSPOL: Aircraft Engine Test Cell Emissions per Pollutant & Power Setting (TONs)
TD: Test Duration (min)
60: Conversion Factor minutes to hours
FC: Fuel Flow Rate (lb/hr)
1000: Conversion Factor pounds to 1000pounds
EF: Emission Factor (lb/1000lb fuel)
NE: Total Number of Engines
ARU: Annual Run-ups (Per Aircraft Engine)
2000: Conversion Factor pounds to TONs

DETAIL AIR CONFORMITY APPLICABILITY MODEL REPORT
- Aircraft Engine Test Cell Emissions per Year
TestCell = TestCellPSIDLE + TestCellPSAPPROACH + TestCellPSINTERMEDIATE + TestCellPSMILITARY +
TestCellPSAFTERBURN
TestCell: Aircraft Engine Test Cell Emissions (TONs)
TestCellPSIDLE: Aircraft Engine Test Cell Emissions for Idle Power Setting (TONs)
TestCellPSAPPROACH: Aircraft Engine Test Cell Emissions for Approach Power Setting (TONs)
TestCellPSINTERMEDIATE: Aircraft Engine Test Cell Emissions for Intermediate Power Setting (TONs)
TestCellPSMILITARY: Aircraft Engine Test Cell Emissions for Military Power Setting (TONs)
TestCellPSAFTERBURN: Aircraft Engine Test Cell Emissions for After Burner Power Setting (TONs)
2.6 Aerospace Ground Equipment (AGE)
2.6.1 Aerospace Ground Equipment (AGE) Assumptions
- Default Settings Used: Yes
- AGE Usage
Number of Annual LTO (Landing and Take-off) cycles for AGE: 41
- Aerospace Ground Equipment (AGE) (default)
Total Number of
AGE
Operation Hours
for Each LTO
Exempt
Source?
AGE Type Designation
18 2 No Air Compressor MC-11
1 1 No Air Compressor MC-1A - 20hp
1 0.5 No Air Conditioner MA-3
18 1 No Bomb Lift MJ-1B
18 0.33 No Generator Set A/M32A-86D
18 0.5 No Heater H1
18 0.5 No Hydraulic Test Stand MJ-2/TTU-228 - 130hp
18 8 No Light Cart NF-2
18 0.33 No Start Cart A/M32A-60A
2.6.2 Aerospace Ground Equipment (AGE) Emission Factor(s)
- Aerospace Ground Equipment (AGE) Emission Factor (lb/hr)
Designation Fuel Flow VOC SOx NOx CO PM 10 PM 2.5 CO2e
MC-11 1.8 0.276 0.004 0.177 12.262 0.109 0.100 34.8
MC-1A - 20hp 1.2 0.177 0.008 0.496 0.234 0.109 0.105 27.0
MA-3 3.8 0.011 0.027 0.497 0.133 0.109 0.105 86.1
MJ-1B 0.0 3.040 0.219 4.780 3.040 0.800 0.776 141.2
A/M32A-86D 6.5 0.294 0.046 6.102 0.457 0.091 0.089 147.0
H1 0.4 0.100 0.011 0.160 0.180 0.006 0.006 8.9
MJ-2/TTU-228 - 130hp 7.4 0.195 0.053 3.396 0.794 0.089 0.086 168.8
NF-2 0.0 0.010 0.043 0.110 0.080 0.010 0.010 22.1
A/M32A-60A 0.0 0.270 0.306 1.820 5.480 0.211 0.205 221.1
2.6.3 Aerospace Ground Equipment (AGE) Formula(s)
- Aerospace Ground Equipment (AGE) Emissions per Year
AGEPOL = AGE * OH * LTO * EFPOL / 2000
AGEPOL: Aerospace Ground Equipment (AGE) Emissions per Pollutant (TONs)
AGE: Total Number of Aerospace Ground Equipment

DETAIL AIR CONFORMITY APPLICABILITY MODEL REPORT
OH: Operation Hours for Each LTO (hour)
LTO: Number of LTOs
EFPOL: Emission Factor for Pollutant (lb/hr)
2000: Conversion Factor pounds to tons
3. Aircraft
3.1 General Information & Timeline Assumptions
- Add or Remove Activity from Baseline? Add
- Activity Location
County: Ada
Regulatory Area(s): Boise-Northern Ada County, ID; Boise-Northern Ada County, ID
- Activity Title: 24 F-15E aircraft with Engine Type F100-PW-229
- Activity Description:
24 F-15E aircraft with Engine Type F100-PW-229 would fly approximately 978 sorties over from 27 April to
21 August 2015.
- Activity Start Date
Start Month: 5
Start Year: 2015
- Activity End Date
Indefinite: No
End Month: 8
End Year: 2015
- Activity Emissions:
Pollutant Total Emissions (TONs) Pollutant Total Emissions (TONs)
VOC 1.043600 PM 2.5 0.815295
SOx 0.117875 Pb 0.000000
NOx 5.054979 NH3 0.000000
CO 8.058122
PM 10 0.892480
3.2 Aircraft & Engines
3.2.1 Aircraft & Engines Assumptions
- Aircraft & Engine
Aircraft Designation: F-15E
Engine Model: F100-PW-229
Primary Function: Combat
Number of Engines: 2
- Aircraft & Engine Surrogate
Is Aircraft & Engine a Surrogate? No
Original Aircraft Name:
Original Engine Name:

DETAIL AIR CONFORMITY APPLICABILITY MODEL REPORT
3.2.2 Aircraft & Engines Emission Factor(s)
- Aircraft & Engine Emissions Factors (lb/1000lb fuel)
Fuel Flow VOC SOx NOx CO PM 10 PM 2.5 CO2e
Idle 1087.00 0.45 1.06 3.80 10.17 2.06 1.85 3252.46
Approach 3098.00 0.24 1.06 15.08 1.17 2.63 2.37 3252.46
Intermediate 5838.00 0.35 1.06 17.54 0.15 2.06 1.85 3252.46
Military 11490.00 0.31 1.06 29.29 0.33 1.33 1.20 3252.46
After Burn 20793.00 5.26 1.06 14.30 21.51 1.15 1.04 3252.46
3.3 Flight Operations
3.3.1 Flight Operations Assumptions
- Flight Operations
Number of Aircraft: 24
Number of Annual LTOs (Landing and Take-off) cycles: 41
Number of Annual TGOs (Touch-and-Go) cycles: 0
- Default Settings Used: Yes
- Flight Operations TIMs (Time In Mode)
Taxi/Idle Out (mins): 18.5 (default)
Takeoff (mins): 0.4 (default)
Climb Out (mins): 0.8 (default)
Approach (mins): 3.5 (default)
Taxi/Idle In (mins): 11.3 (default)
- Trim Test
Idle (mins): 12 (default)
Approach (mins): 27 (default)
Intermediate (mins): 9 (default)
Military (mins): 9 (default)
AfterBurn (mins): 3 (default)
3.3.2 Flight Operations Formula(s)
- Aircraft Emissions per Mode for LTOs per Year
AEMPOL = (TIM / 60) * (FC / 1000) * EF * NE * NA * LTO / 2000
AEMPOL: Aircraft Emissions per Pollutant & Mode (TONs)
TIM: Time in Mode (min)
60: Conversion Factor minutes to hours
FC: Fuel Flow Rate (lb/hr)
1000: Conversion Factor pounds to 1000pounds
EF: Emission Factor (lb/1000lb fuel)
NE: Number of Engines
NA: Number of Aircraft
LTO: Number of Landing and Take-off Cycles
2000: Conversion Factor pounds to TONs
- Aircraft Emissions for LTOs per Year
AELTO = AEMIDLE_IN + AEMIDLE_OUT + AEMAPPROACH + AEMCLIMBOUT + AEMTAKEOFF
AELTO: Aircraft Emissions (TONs)

DETAIL AIR CONFORMITY APPLICABILITY MODEL REPORT
AEMIDLE_IN: Aircraft Emissions for Idle-In Mode (TONs)
AEMIDLE_OUT: Aircraft Emissions for Idle-Out Mode (TONs)
AEMAPPROACH: Aircraft Emissions for Approach Mode (TONs)
AEMCLIMBOUT: Aircraft Emissions for Climb-Out Mode (TONs)
AEMTAKEOFF: Aircraft Emissions for Take-Off Mode (TONs)
- Aircraft Emissions per Mode for TGOs per Year
AEMPOL = (TIM / 60) * (FC / 1000) * EF * NE * NA * TGO / 2000
AEMPOL: Aircraft Emissions per Pollutant & Mode (TONs)
TIM: Time in Mode (min)
60: Conversion Factor minutes to hours
FC: Fuel Flow Rate (lb/hr)
1000: Conversion Factor pounds to 1000pounds
EF: Emission Factor (lb/1000lb fuel)
NE: Number of Engines
NA: Number of Aircraft
TGO: Number of Touch-and-Go Cycles
2000: Conversion Factor pounds to TONs
- Aircraft Emissions for TGOs per Year
AETGO = AEMAPPROACH + AEMCLIMBOUT + AEMTAKEOFF
AETGO: Aircraft Emissions (TONs)
AEMAPPROACH: Aircraft Emissions for Approach Mode (TONs)
AEMCLIMBOUT: Aircraft Emissions for Climb-Out Mode (TONs)
AEMTAKEOFF: Aircraft Emissions for Take-Off Mode (TONs)
- Aircraft Emissions per Mode for Trim per Year
AEPSPOL = (TD / 60) * (FC / 1000) * EF * NE * NA * NTT / 2000
AEPSPOL: Aircraft Emissions per Pollutant & Power Setting (TONs)
TD: Test Duration (min)
60: Conversion Factor minutes to hours
FC: Fuel Flow Rate (lb/hr)
1000: Conversion Factor pounds to 1000pounds
EF: Emission Factor (lb/1000lb fuel)
NE: Number of Engines
NA: Number of Aircraft
NTT: Number of Trim Test
2000: Conversion Factor pounds to TONs
- Aircraft Emissions for Trim per Year
AETRIM = AEPSIDLE + AEPSAPPROACH + AEPSINTERMEDIATE + AEPSMILITARY + AEPSAFTERBURN
AETRIM: Aircraft Emissions (TONs)
AEPSIDLE: Aircraft Emissions for Idle Power Setting (TONs)
AEPSAPPROACH: Aircraft Emissions for Approach Power Setting (TONs)
AEPSINTERMEDIATE: Aircraft Emissions for Intermediate Power Setting (TONs)
AEPSMILITARY: Aircraft Emissions for Military Power Setting (TONs)
AEPSAFTERBURN: Aircraft Emissions for After Burner Power Setting (TONs)
3.4 Auxiliary Power Unit (APU)
3.4.1 Auxiliary Power Unit (APU) Assumptions

DETAIL AIR CONFORMITY APPLICABILITY MODEL REPORT
- Default Settings Used: Yes
- Auxiliary Power Unit (APU) (default)
Number of APU
per Aircraft
Operation Hours
for Each LTO
Exempt
Source?
Designation Manufacturer
3.4.2 Auxiliary Power Unit (APU) Emission Factor(s)
- Auxiliary Power Unit (APU) Emission Factor (lb/hr)
Designation Fuel Flow VOC SOx NOx CO PM 10 PM 2.5 CO2e
3.4.3 Auxiliary Power Unit (APU) Formula(s)
- Auxiliary Power Unit (APU) Emissions per Year
APUPOL = APU * OH * LTO * NA * EFPOL / 2000
APUPOL: Auxiliary Power Unit (APU) Emissions per Pollutant (TONs)
APU: Number of Auxiliary Power Units
OH: Operation Hours for Each LTO (hour)
LTO: Number of LTOs
NA: Number of Aircraft
EFPOL: Emission Factor for Pollutant (lb/hr)
2000: Conversion Factor pounds to tons
3.5 Aircraft Engine Test Cell
3.5.1 Aircraft Engine Test Cell Assumptions
- Engine Test Cell
Total Number of Aircraft Engines Tested Annually: 40
- Default Settings Used: No
- Annual Run-ups / Test Durations
Annual Run-ups (Per Aircraft Engine): 1
Idle Duration (mins): 12
Approach Duration (mins): 27
Intermediate Duration (mins): 9
Military Duration (mins): 9
After Burner Duration (mins): 3
3.5.2 Aircraft Engine Test Cell Emission Factor(s)
- See Aircraft & Engines Emission Factor(s)
3.5.3 Aircraft Engine Test Cell Formula(s)
- Aircraft Engine Test Cell Emissions per Pollutant & Power Setting (TONs)
TestCellPSPOL = (TD / 60) * (FC / 1000) * EF * NE * ARU / 2000
TestCellPSPOL: Aircraft Engine Test Cell Emissions per Pollutant & Power Setting (TONs)
TD: Test Duration (min)
60: Conversion Factor minutes to hours

DETAIL AIR CONFORMITY APPLICABILITY MODEL REPORT
FC: Fuel Flow Rate (lb/hr)
1000: Conversion Factor pounds to 1000pounds
EF: Emission Factor (lb/1000lb fuel)
NE: Total Number of Engines
ARU: Annual Run-ups (Per Aircraft Engine)
2000: Conversion Factor pounds to TONs
- Aircraft Engine Test Cell Emissions per Year
TestCell = TestCellPSIDLE + TestCellPSAPPROACH + TestCellPSINTERMEDIATE + TestCellPSMILITARY +
TestCellPSAFTERBURN
TestCell: Aircraft Engine Test Cell Emissions (TONs)
TestCellPSIDLE: Aircraft Engine Test Cell Emissions for Idle Power Setting (TONs)
TestCellPSAPPROACH: Aircraft Engine Test Cell Emissions for Approach Power Setting (TONs)
TestCellPSINTERMEDIATE: Aircraft Engine Test Cell Emissions for Intermediate Power Setting (TONs)
TestCellPSMILITARY: Aircraft Engine Test Cell Emissions for Military Power Setting (TONs)
TestCellPSAFTERBURN: Aircraft Engine Test Cell Emissions for After Burner Power Setting (TONs)
3.6 Aerospace Ground Equipment (AGE)
3.6.1 Aerospace Ground Equipment (AGE) Assumptions
- Default Settings Used: Yes
- AGE Usage
Number of Annual LTO (Landing and Take-off) cycles for AGE: 41
- Aerospace Ground Equipment (AGE) (default)
Total Number of
AGE
Operation Hours
for Each LTO
Exempt
Source?
AGE Type Designation
24 2 No Air Compressor MC-11
24 1 No Bomb Lift MJ-1B
24 0.33 No Generator Set A/M32A-86D
24 0.5 No Heater H1
24 0.5 No Hydraulic Test Stand MJ-2/TTU-228 - 130hp
24 8 No Light Cart NF-2
24 0.33 No Start Cart A/M32A-60A
3.6.2 Aerospace Ground Equipment (AGE) Emission Factor(s)
- Aerospace Ground Equipment (AGE) Emission Factor (lb/hr)
Designation Fuel Flow VOC SOx NOx CO PM 10 PM 2.5 CO2e
MC-11 1.8 0.276 0.004 0.177 12.262 0.109 0.100 34.8
MJ-1B 0.0 3.040 0.219 4.780 3.040 0.800 0.776 141.2
A/M32A-86D 6.5 0.294 0.046 6.102 0.457 0.091 0.089 147.0
H1 0.4 0.100 0.011 0.160 0.180 0.006 0.006 8.9
MJ-2/TTU-228 - 130hp 7.4 0.195 0.053 3.396 0.794 0.089 0.086 168.8
NF-2 0.0 0.010 0.043 0.110 0.080 0.010 0.010 22.1
A/M32A-60A 0.0 0.270 0.306 1.820 5.480 0.211 0.205 221.1
3.6.3 Aerospace Ground Equipment (AGE) Formula(s)
- Aerospace Ground Equipment (AGE) Emissions per Year
AGEPOL = AGE * OH * LTO * EFPOL / 2000

DETAIL AIR CONFORMITY APPLICABILITY MODEL REPORT
AGEPOL: Aerospace Ground Equipment (AGE) Emissions per Pollutant (TONs)
AGE: Total Number of Aerospace Ground Equipment
OH: Operation Hours for Each LTO (hour)
LTO: Number of LTOs
EFPOL: Emission Factor for Pollutant (lb/hr)
2000: Conversion Factor pounds to tons
4. Aircraft
4.1 General Information & Timeline Assumptions
- Add or Remove Activity from Baseline? Add
- Activity Location
County: Ada
Regulatory Area(s): Boise-Northern Ada County, ID; Boise-Northern Ada County, ID
- Activity Title: 12 F-15SG aircraft with Engine Type F110-GE-129
- Activity Description:
12 F-15SG aircraft with Engine Type F110-GE-129 would fly approximately 489 sorties from 27 April to 21
August 2015.
- Activity Start Date
Start Month: 5
Start Year: 2015
- Activity End Date
Indefinite: No
End Month: 8
End Year: 2015
- Activity Emissions:
Pollutant Total Emissions (TONs) Pollutant Total Emissions (TONs)
VOC 0.566706 PM 2.5 0.416338
SOx 0.082632 Pb 0.000000
NOx 2.695556 NH3 0.000000
CO 4.355248
PM 10 0.463218
4.2 Aircraft & Engines
4.2.1 Aircraft & Engines Assumptions
- Aircraft & Engine
Aircraft Designation: F-15E
Engine Model: F100-PW-229
Primary Function: Combat
Number of Engines: 2
- Aircraft & Engine Surrogate
Is Aircraft & Engine a Surrogate? No

DETAIL AIR CONFORMITY APPLICABILITY MODEL REPORT
Original Aircraft Name:
Original Engine Name:
4.2.2 Aircraft & Engines Emission Factor(s)
- Aircraft & Engine Emissions Factors (lb/1000lb fuel)
Fuel Flow VOC SOx NOx CO PM 10 PM 2.5 CO2e
Idle 1087.00 0.45 1.06 3.80 10.17 2.06 1.85 3252.46
Approach 3098.00 0.24 1.06 15.08 1.17 2.63 2.37 3252.46
Intermediate 5838.00 0.35 1.06 17.54 0.15 2.06 1.85 3252.46
Military 11490.00 0.31 1.06 29.29 0.33 1.33 1.20 3252.46
After Burn 20793.00 5.26 1.06 14.30 21.51 1.15 1.04 3252.46
4.3 Flight Operations
4.3.1 Flight Operations Assumptions
- Flight Operations
Number of Aircraft: 12
Number of Annual LTOs (Landing and Take-off) cycles: 41
Number of Annual TGOs (Touch-and-Go) cycles: 0
- Default Settings Used: Yes
- Flight Operations TIMs (Time In Mode)
Taxi/Idle Out (mins): 18.5 (default)
Takeoff (mins): 0.4 (default)
Climb Out (mins): 0.8 (default)
Approach (mins): 3.5 (default)
Taxi/Idle In (mins): 11.3 (default)
- Trim Test
Idle (mins): 12 (default)
Approach (mins): 27 (default)
Intermediate (mins): 9 (default)
Military (mins): 9 (default)
AfterBurn (mins): 3 (default)
4.3.2 Flight Operations Formula(s)
- Aircraft Emissions per Mode for LTOs per Year
AEMPOL = (TIM / 60) * (FC / 1000) * EF * NE * NA * LTO / 2000
AEMPOL: Aircraft Emissions per Pollutant & Mode (TONs)
TIM: Time in Mode (min)
60: Conversion Factor minutes to hours
FC: Fuel Flow Rate (lb/hr)
1000: Conversion Factor pounds to 1000pounds
EF: Emission Factor (lb/1000lb fuel)
NE: Number of Engines
NA: Number of Aircraft
LTO: Number of Landing and Take-off Cycles
2000: Conversion Factor pounds to TONs
- Aircraft Emissions for LTOs per Year

DETAIL AIR CONFORMITY APPLICABILITY MODEL REPORT
AELTO = AEMIDLE_IN + AEMIDLE_OUT + AEMAPPROACH + AEMCLIMBOUT + AEMTAKEOFF
AELTO: Aircraft Emissions (TONs)
AEMIDLE_IN: Aircraft Emissions for Idle-In Mode (TONs)
AEMIDLE_OUT: Aircraft Emissions for Idle-Out Mode (TONs)
AEMAPPROACH: Aircraft Emissions for Approach Mode (TONs)
AEMCLIMBOUT: Aircraft Emissions for Climb-Out Mode (TONs)
AEMTAKEOFF: Aircraft Emissions for Take-Off Mode (TONs)
- Aircraft Emissions per Mode for TGOs per Year
AEMPOL = (TIM / 60) * (FC / 1000) * EF * NE * NA * TGO / 2000
AEMPOL: Aircraft Emissions per Pollutant & Mode (TONs)
TIM: Time in Mode (min)
60: Conversion Factor minutes to hours
FC: Fuel Flow Rate (lb/hr)
1000: Conversion Factor pounds to 1000pounds
EF: Emission Factor (lb/1000lb fuel)
NE: Number of Engines
NA: Number of Aircraft
TGO: Number of Touch-and-Go Cycles
2000: Conversion Factor pounds to TONs
- Aircraft Emissions for TGOs per Year
AETGO = AEMAPPROACH + AEMCLIMBOUT + AEMTAKEOFF
AETGO: Aircraft Emissions (TONs)
AEMAPPROACH: Aircraft Emissions for Approach Mode (TONs)
AEMCLIMBOUT: Aircraft Emissions for Climb-Out Mode (TONs)
AEMTAKEOFF: Aircraft Emissions for Take-Off Mode (TONs)
- Aircraft Emissions per Mode for Trim per Year
AEPSPOL = (TD / 60) * (FC / 1000) * EF * NE * NA * NTT / 2000
AEPSPOL: Aircraft Emissions per Pollutant & Power Setting (TONs)
TD: Test Duration (min)
60: Conversion Factor minutes to hours
FC: Fuel Flow Rate (lb/hr)
1000: Conversion Factor pounds to 1000pounds
EF: Emission Factor (lb/1000lb fuel)
NE: Number of Engines
NA: Number of Aircraft
NTT: Number of Trim Test
2000: Conversion Factor pounds to TONs
- Aircraft Emissions for Trim per Year
AETRIM = AEPSIDLE + AEPSAPPROACH + AEPSINTERMEDIATE + AEPSMILITARY + AEPSAFTERBURN
AETRIM: Aircraft Emissions (TONs)
AEPSIDLE: Aircraft Emissions for Idle Power Setting (TONs)
AEPSAPPROACH: Aircraft Emissions for Approach Power Setting (TONs)
AEPSINTERMEDIATE: Aircraft Emissions for Intermediate Power Setting (TONs)
AEPSMILITARY: Aircraft Emissions for Military Power Setting (TONs)
AEPSAFTERBURN: Aircraft Emissions for After Burner Power Setting (TONs)

DETAIL AIR CONFORMITY APPLICABILITY MODEL REPORT
4.4 Auxiliary Power Unit (APU)
4.4.1 Auxiliary Power Unit (APU) Assumptions
- Default Settings Used: Yes
- Auxiliary Power Unit (APU) (default)
Number of APU
per Aircraft
Operation Hours
for Each LTO
Exempt
Source?
Designation Manufacturer
1 1 No T-62T-40-8
4.4.2 Auxiliary Power Unit (APU) Emission Factor(s)
- Auxiliary Power Unit (APU) Emission Factor (lb/hr)
Designation Fuel Flow VOC SOx NOx CO PM 10 PM 2.5 CO2e
T-62T-40-8 272.6 0.493 0.289 1.216 3.759 0.131 0.037 910.8
4.4.3 Auxiliary Power Unit (APU) Formula(s)
- Auxiliary Power Unit (APU) Emissions per Year
APUPOL = APU * OH * LTO * NA * EFPOL / 2000
APUPOL: Auxiliary Power Unit (APU) Emissions per Pollutant (TONs)
APU: Number of Auxiliary Power Units
OH: Operation Hours for Each LTO (hour)
LTO: Number of LTOs
NA: Number of Aircraft
EFPOL: Emission Factor for Pollutant (lb/hr)
2000: Conversion Factor pounds to tons
4.5 Aircraft Engine Test Cell
4.5.1 Aircraft Engine Test Cell Assumptions
- Engine Test Cell
Total Number of Aircraft Engines Tested Annually: 24
- Default Settings Used: Yes
- Annual Run-ups / Test Durations
Annual Run-ups (Per Aircraft Engine): 1 (default)
Idle Duration (mins): 12 (default)
Approach Duration (mins): 27 (default)
Intermediate Duration (mins): 9 (default)
Military Duration (mins): 9 (default)
After Burner Duration (mins): 3 (default)
4.5.2 Aircraft Engine Test Cell Emission Factor(s)
- See Aircraft & Engines Emission Factor(s)
4.5.3 Aircraft Engine Test Cell Formula(s)
- Aircraft Engine Test Cell Emissions per Pollutant & Power Setting (TONs)
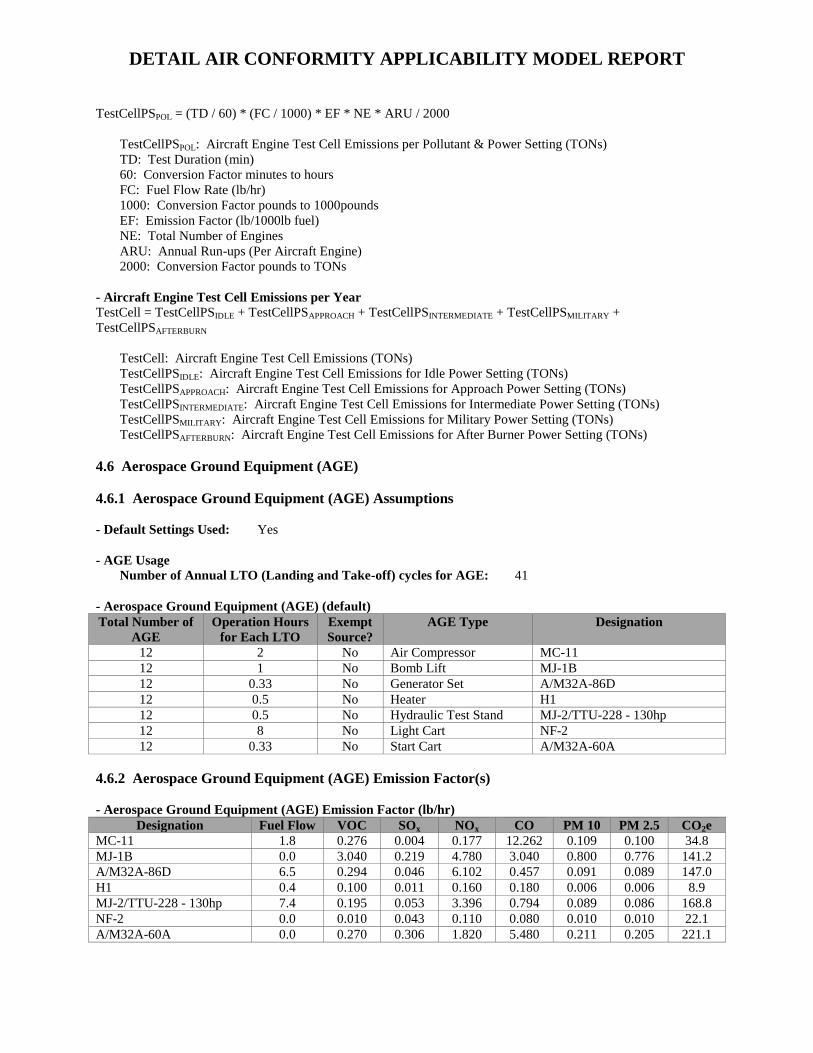
DETAIL AIR CONFORMITY APPLICABILITY MODEL REPORT
TestCellPSPOL = (TD / 60) * (FC / 1000) * EF * NE * ARU / 2000
TestCellPSPOL: Aircraft Engine Test Cell Emissions per Pollutant & Power Setting (TONs)
TD: Test Duration (min)
60: Conversion Factor minutes to hours
FC: Fuel Flow Rate (lb/hr)
1000: Conversion Factor pounds to 1000pounds
EF: Emission Factor (lb/1000lb fuel)
NE: Total Number of Engines
ARU: Annual Run-ups (Per Aircraft Engine)
2000: Conversion Factor pounds to TONs
- Aircraft Engine Test Cell Emissions per Year
TestCell = TestCellPSIDLE + TestCellPSAPPROACH + TestCellPSINTERMEDIATE + TestCellPSMILITARY +
TestCellPSAFTERBURN
TestCell: Aircraft Engine Test Cell Emissions (TONs)
TestCellPSIDLE: Aircraft Engine Test Cell Emissions for Idle Power Setting (TONs)
TestCellPSAPPROACH: Aircraft Engine Test Cell Emissions for Approach Power Setting (TONs)
TestCellPSINTERMEDIATE: Aircraft Engine Test Cell Emissions for Intermediate Power Setting (TONs)
TestCellPSMILITARY: Aircraft Engine Test Cell Emissions for Military Power Setting (TONs)
TestCellPSAFTERBURN: Aircraft Engine Test Cell Emissions for After Burner Power Setting (TONs)
4.6 Aerospace Ground Equipment (AGE)
4.6.1 Aerospace Ground Equipment (AGE) Assumptions
- Default Settings Used: Yes
- AGE Usage
Number of Annual LTO (Landing and Take-off) cycles for AGE: 41
- Aerospace Ground Equipment (AGE) (default)
Total Number of
AGE
Operation Hours
for Each LTO
Exempt
Source?
AGE Type Designation
12 2 No Air Compressor MC-11
12 1 No Bomb Lift MJ-1B
12 0.33 No Generator Set A/M32A-86D
12 0.5 No Heater H1
12 0.5 No Hydraulic Test Stand MJ-2/TTU-228 - 130hp
12 8 No Light Cart NF-2
12 0.33 No Start Cart A/M32A-60A
4.6.2 Aerospace Ground Equipment (AGE) Emission Factor(s)
- Aerospace Ground Equipment (AGE) Emission Factor (lb/hr)
Designation Fuel Flow VOC SOx NOx CO PM 10 PM 2.5 CO2e
MC-11 1.8 0.276 0.004 0.177 12.262 0.109 0.100 34.8
MJ-1B 0.0 3.040 0.219 4.780 3.040 0.800 0.776 141.2
A/M32A-86D 6.5 0.294 0.046 6.102 0.457 0.091 0.089 147.0
H1 0.4 0.100 0.011 0.160 0.180 0.006 0.006 8.9
MJ-2/TTU-228 - 130hp 7.4 0.195 0.053 3.396 0.794 0.089 0.086 168.8
NF-2 0.0 0.010 0.043 0.110 0.080 0.010 0.010 22.1
A/M32A-60A 0.0 0.270 0.306 1.820 5.480 0.211 0.205 221.1

DETAIL AIR CONFORMITY APPLICABILITY MODEL REPORT
4.6.3 Aerospace Ground Equipment (AGE) Formula(s)
- Aerospace Ground Equipment (AGE) Emissions per Year
AGEPOL = AGE * OH * LTO * EFPOL / 2000
AGEPOL: Aerospace Ground Equipment (AGE) Emissions per Pollutant (TONs)
AGE: Total Number of Aerospace Ground Equipment
OH: Operation Hours for Each LTO (hour)
LTO: Number of LTOs
EFPOL: Emission Factor for Pollutant (lb/hr)
2000: Conversion Factor pounds to tons
5. Personnel
5.1 General Information & Timeline Assumptions
- Add or Remove Activity from Baseline? Add
- Activity Location
County: Ada
Regulatory Area(s): Boise-Northern Ada County, ID; Boise-Northern Ada County, ID
- Activity Title: 1,500 Personnel
- Activity Description:
- Activity Start Date
Start Month: 5
Start Year: 2015
- Activity End Date
Indefinite: No
End Month: 8
End Year: 2015
- Activity Emissions:
Pollutant Total Emissions (TONs) Pollutant Total Emissions (TONs)
VOC 1.834720 PM 2.5 0.032706
SOx 0.023697 Pb 0.000000
NOx 1.532812 NH3 0.282831
CO 33.594178
PM 10 0.071325
5.2 Personnel Assumptions
- Number of Personnel
Active Duty Personnel: 1500
Civilian Personnel: 0
Support Contractor Personnel: 0
Air National Guard (ANG) Personnel: 0
Reserve Personnel: 0

DETAIL AIR CONFORMITY APPLICABILITY MODEL REPORT
- Default Settings Used: No
- Average Personnel Round Trip Commute (mile): 20
- Personnel Work Schedule
Active Duty Personnel: 5 Days Per Week
Civilian Personnel: 5 Days Per Week
Support Contractor Personnel: 5 Days Per Week
Air National Guard (ANG) Personnel: 5 Days Per Week
Reserve Personnel: 4 Days Per Month
5.3 Personnel On Road Vehicle Mixture
- On Road Vehicle Mixture (%)
LDGV LDGT HDGV LDDV LDDT HDDV MC
POVs 37.55 60.32 0 0.03 0.2 0 1.9
GOVs 54.49 37.73 4.67 0 0 3.11 0
5.4 Personnel Emission Factor(s)
- On Road Vehicle Emission Factors (grams/mile)
VOC SOx NOx CO PM 10 PM 2.5 Pb NH3 CO2
LDGV 00.4750 00.0068 00.3770 10.8200 00.0248 00.0113 00.1017 00368.0
LDGT 00.7130 00.0095 00.6200 12.4300 00.0249 00.0113 00.1017 00516.2
HDGV 00.6310 00.0165 01.0910 08.8700 00.0432 00.0275 00.0451 00904.8
LDDV 00.1110 00.0029 00.1370 00.7480 00.0447 00.0295 00.0068 00314.1
LDDT 00.3450 00.0056 00.3830 00.6140 00.0533 00.0375 00.0068 00598.6
HDDV 00.3090 00.0116 02.4520 00.7240 00.0970 00.0707 00.0270 01243.4
MC 02.0000 00.0033 01.2800 15.1400 00.0372 00.0207 00.0113 00177.4
5.5 Personnel Formula(s)
- Personnel Vehicle Miles Travel for Work Days per Year
VMTP = NP * WD * AC
VMTP: Personnel Vehicle Miles Travel (miles/year)
NP: Number of Personnel
WD: Work Days per Year
AC: Average Commute (miles)
- Total Vehicle Miles Travel per Year
VMTTotal = VMTAD + VMTC + VMTSC + VMTANG + VMTAFRC
VMTTotal: Total Vehicle Miles Travel (miles)
VMTAD: Active Duty Personnel Vehicle Miles Travel (miles)
VMTC: Civilian Personnel Vehicle Miles Travel (miles)
VMTSC: Support Contractor Personnel Vehicle Miles Travel (miles)
VMTANG: Air National Guard Personnel Vehicle Miles Travel (miles)
VMTAFRC: Reserve Personnel Vehicle Miles Travel (miles)
- Vehicle Emissions per Year
VPOL = (VMTTotal * 0.002205 * EFPOL * VM) / 2000
VPOL: Vehicle Emissions (TONs)

DETAIL AIR CONFORMITY APPLICABILITY MODEL REPORT
VMTTotal: Total Vehicle Miles Travel (miles)
0.002205: Conversion Factor grams to pounds
EFPOL: Emission Factor for Pollutant (grams/mile)
VM: Personnel On Road Vehicle Mixture (%)
2000: Conversion Factor pounds to tons

APPENDIX C DETAILS OF NOISE ANALYSIS
Page 102

APPENDIX C DETAILS OF NOISE ANALYSIS
NOISEMAP, through its BASEOPS program, allows entry of runway coordinates, airfield information, flight tracks, flight profiles (e.g., engine thrust settings, altitudes, and speeds) along each flight track for each aircraft, numbers of flight operations, run-up coordinates, run-up profiles, and run-up operations.
Table C-1 lists the modeling parameters used for this noise analysis. NOISEMAP’s (and INM’s) output comprises a regularly spaced “grid” file containing DNL values. The NMPLOT program uses the grid file to plot contours of equal DNL which can then be overlaid onto maps to depict current noise exposure levels in the BOI airfield environment. For the plotting of DNL contours, a grid point spacing of 500 feet was utilized.
NOISEMAP’s ability to account for the effects of sound propagation includes two different ground impedance conditions: “soft ground” (e.g., grass-covered ground) with a flow resistivity of 200 kPa-s/m2 or “hard ground” (e.g., between asphalt and water) with a flow resistivity of 1,000,000 kPa-s/m2. This study considered all areas in and around Gowen Field as soft ground for modeling purposes, consistent with the previous EA. INM does not have the ability to account for impedance effects. INM was run with elevation enabled. The modeling for this project does not include the effect of shielding of on-base buildings.
The weather data is identical to that used in the 2009 EA (Oregon Air National Guard 2009).
Table C-1. Noise Modeling Parameters
Baseline Scenario
The Baseline operations at BOI have a mix of civil operations and military A-10 and H-60 operations. H-60
Software Analysis Vers ion
NMAP F-15, A-10, H-60 Aircraft 7.2
INM All other Aircraft (Fixed Wing and Helo)
7.0a
Param eter Des cription
Receiver Grid Spacing 500 ft in x and y
Metric DNL (dBA)
Bas is Annual Average Daily Operations (AAD) Topography
Elevation Data Source 1/3 arc-second NED
Elevation (ELV) and Impedance (IMP) Grid spacing (NMAP only) 250 ft in x and y
Flow Resistivity of Ground (s oft) NMAP only 200 kPa-s /m 2
Flow Resistivity of Water (hard) NMAP only 1,000,000 kPa-s /m 2
Modeled Weather (Oregon Air National Guard 2009)
Temperature 62.6 °F
Relative Humidity 41%
Barom etric Pres sure 29.92 inHg
Page 103

operations were modeled with NOISEMAP’s SK-70 aircraft as a surrogate as this is the closest type to the H- 60 in its database. The operations, runway utilization, and flight track utilization for the civil and military aircraft is identical to the modeling in the 2009 NEM Baseline Scenario from the 2009 EA (Oregon Air National Guard 2009). Table C-2 presents the annual Baseline operations at BOI. There are 169,510 annual civil operations at BOI, 7,510 annual military A-10 operations, and 4,800 annual military H-60 operations.
Table C-2. Annual Flight Operations at Gowen Field ANGB for Baseline Scenario
Category Group Aircraft
Modeled Aircraft
Type Engine
Departure Arrival Closed Pattern (1) TOTALDay
(0700- 2200)
Night (2200- 0700)
Total
Day (0700- 2200)
Night (2200- 0700)
Total
Day (0700- 2200)
Night (2200- 0700)
Total
Day (0700- 2200)
Night (2200- 0700)
Total
Civil
Heavy Jet Airbus A30 A300B4- 203 CF6-50C2 842 - 842 590 253 843 - - - 1,432 253 1,685
Large Jet
Airbus A319-131 A319-131
V2522-A5 Engines 1,141 327 1,468 1,086 382 1,468 - - - 2,227 709 2,936
Airbus A320-232 A320-232
V2527-A5 Engines - - - - - - - - - - - -
Boeing FE 727EM2 JT8D-15 274 - 274 41 233 274 - - - 315 233 548 Boeing 73 737N17 JT8D-17 N 183 37 220 160 60 220 - - - 343 97 440 Boeing 737-300 737300
CFM56- 3B-2 5,397 473 5,870 4,670 1,200 5,870 - - - 10,067 1,673 11,740
Boeing 737-500 737500
CFM56- 3B-1 1,468 - 1,468 1,174 293 1,467 - - - 2,642 293 2,935
Boeing 737-700 737700
CFM56- 7B 1,349 118 1,467 1,168 300 1,468 - - - 2,517 418 2,935
Boeing 737-800 737800
CFM56- 7B26 881 - 881 440 440 880 - - - 1,321 440 1,761
Boeing 75 757RR RB211-535 674 - 674 404 270 674 - - - 1,078 270 1,348 Bombardi er Challenge r 600
CL600
ALF502L 48 - 48 48 - 48 - - - 96 - 96Bombardi er Challenge r 601
CL601
CF34-3A 9,771 2,155 11,926 10,189 1,736 11,925 - - - 19,960 3,891 23,851McDonnel DC95HW JT8D17 w/ 316 - 316 316 - 316 - - - 632 - 632 McDonnel Douglas MD-83
MD83JT8D-219 587 - 587 587 - 587 - - - 1,174 - 1,174
Business Jet
Dassault F FAL20 CF700-2D- 809 96 905 809 96 905 - - - 1,618 192 1,810 LEAR 25 (Stage 2) LEAR25 CJ610-8 306 - 306 306 - 306 - - - 612 - 612Gulfstrea m GII (Stage 2)
GII SPEY 511-8 80 - 80 40 40 80 - - - 120 40 160
Gulfstream GIII SPEY 511 32 - 32 32 - 32 - - - 64 - 64 Cessna Ci CNA500 JT15D-4 969 - 969 937 31 968 - - - 1,906 31 1,937 Cessna Ci CIT3 TFE731-3- 134 - 134 134 - 134 - - - 268 - 268
Cessna Citation X
CNA750
Rolls Royce Allison AE3007C 159 - 159 159 - 159 - - - 318 - 318
Gulfstrea m GIV-SP
GIV TAY 611- 8 45 32 77 76 - 76 - - - 121 32 153
IAI Astra 1125 IA1125
TFE731- 3A 86 - 86 86 - 86 - - - 172 - 172
LEAR 36 LEAR35 TFE731-2 2,163 599 2,762 2,592 170 2,762 - - - 4,755 769 5,524 Hawker Beechcraf t 400
MU3001JT15D-4 1,064 96 1,160 1,048 112 1,160 - - - 2,112 208 2,320
Turboprop
Cessna 44 CNA441 TPE331-8 4,971 459 5,430 4,551 879 5,430 - - - 9,522 1,338 10,860 Bombardi er DASH 8-300
DHC830PW123 5,870 - 5,870 5,870 - 5,870 - - - 11,740 - 11,740
Prop
Beechcraft BEC58P TS10-520- 14,307 2,092 16,399 14,508 1,892 16,400 588 81 669 29,403 4,065 33,468 1985 1- ENG VP PROP
GASEPV19,682 474 20,156 19,331 825 20,156 4,335 144 4,479 43,348 1,443 44,791
Helo Augusta A A109 1,212 404 1,616 1,212 404 1,616 - - - 2,424 808 3,232
Military
Fighter Jet
F-15E PW F-15E PW-229 - - - - - - - - - - - - F-15SG (R F-15E - - - - - - - - - - - -
Attack Jet A-10A A-10A 2,253 1,502 3,755 2,253 1,502 3,755 - - - 4,506 3,004 7,510
HeloSikorsky S-70 (UH- 60A)
UH-60A1,800 600 2,400 1,800 600 2,400 - - - 3,600 1,200 4,800
Civil 74,820 7,362 82,182 72,564 9,616 82,180 4,923 225 5,148 152,307 17,203 169,510 Military 4,053 2,102 6,155 4,053 2,102 6,155 - - - 8,106 4,204 12,310
Grand Total 78,873 9,464 88,337 76,617 11,718 88,335 4,923 225 5,148 160,413 21,407 181,820 Notes: (1) Counted as 2 operations per circuit
Page 104

Table C-3 lists the average daily runway utilization for the civil aircraft. All civilian operation types are primarily headed in the northwest direction (“10” direction), especially during DNL nighttime hours (2200- 0700). As for left/right utilization, Runways 10L and 28L are utilized more than 10R and 28R for daytime (0700-2200) and nighttime (2200-0700) arrivals, and daytime departures. For nighttime departures, Runway 28R is utilized more than 28L. For closed patterns, 90% of pattern operations utilize Runway 10R over 10L. Runway 28L is used for 90% of the patterns in to the northeast (“28” direction) versus Runway 28R.
Table C-3.
a) Average Daily Directional Utilization for Civil Aircraft at Gowen Field ANGB
Operation Type Direction
Day (0700- 2200)
Night (2200- 0700)
Departure10 54% 71% 28 46% 29%
Arrival10 52% 68% 28 48% 32%
Closed Pattern10 51% 78% 28 49% 22%
b) Average Daily Left/Right Runway Utilization for Civil Aircraft at Gowen Field ANGB
Operation Type Direction Runway ID
Day (0700- 2200)
Night (2200- 0700)
Departure
1010L 59% 82%
10R 41% 18% 28
28L 51% 33% 28R 49% 67%
Arrival
1010L 57% 55%
10R 43% 45% 28
28L 53% 57% 28R 47% 43%
Closed Pattern
1010L 10% 10%
10R 90% 90% 28
28L 90% 90% 28R 10% 10%
Table C-4 lists the average daily directional utilization and left/right utilization for the military aircraft. The A- 10 utilizes Runways 10L, 10R, and 28L and primarily uses Runway 10R for departures and 28L for arrivals. The H-60 only uses Runways 10R and 28L, and primarily uses Runway 10R for both arrivals and departures.
Modeled flight tracks, flight track utilization and flight profiles (altitude, power and speed schedules on each flight track) for the Baseline scenario would be identical to the modeling in the 2009 NEM Baseline from the 2009 EA.
Page 105
Table C-4.
a) Average Daily Directional Utilization for Military Aircraft at Gowen Field ANGB
Operation Type Direction
A-10 H-60 Proposed F-15 Day
(0700- 2200)
Night (2200- 0700)
Day (0700- 2200)
Night (2200- 0700)
Day (0700- 2200)
Night (2200- 0700)
Departure 10 92% 92% 71% 71% 20% 20% 28 8% 8% 29% 29% 80% 80%
Arrival 10 40% 40% 58% 58% 45% 45% 28 60% 60% 42% 42% 55% 55%
Closed Pattern
10 - - - - 45% 45% 28 - - - - 55% 55%
b) Average Daily Left/Right Runway Utilization for Military Aircraft at Gowen Field ANGB
Operation Type Direction Runway ID
A-10A H-60 (modeled as SK-70/UH-60A) Proposed F-15
Day (0700- 2200)
Night (2200- 0700)
Day (0700- 2200)
Night (2200- 0700)
Day (0700- 2200)
Night (2200- 0700)
Departure10 10L 41% 41% - - - -
10R 59% 59% 100% 100% 100% 100% 28
28L 100% 100% 100% 100% 100% 100% 28R 0% 0% - - - -
Arrival10 10L 60% 60% - - - -
10R 40% 40% 100% 100% 100% 100% 28
28L 100% 100% 100% 100% 100% 100% 28R 0% 0% - - - -
Closed Pattern
10 10L - - - - 0% 0% 10R - - - - 100% 100%
2828L - - - - 100% 100% 28R - - - - 0% 0%
Preferred Alternative
Table C-7 details the flight operations for the Preferred Alternative. Civil aircraft at Gowen Field ANGB would be modeled identically as the Baseline Scenario and would account for approximately 170,000 annual flight operations. Military A-10A and H-60 operations would also be the same as under the Baseline Scenario and would total approximately 12,000 operations per year (one sortie represents at least one arrival and one departure operation). By comparison, there would be 990 operations (from the 450 sorties) for the proposed F- 15 aircraft during the relocation. Of those 990 operations, 450 would be arrivals (23% of these would be straight-in and 77% would be breaks or pitch-outs), 450 would be Afterburner departures1, and 90 are VFR Closed Patterns.
1 Afterburner would only be used within the airport boundary, during takeoff roll and initial climbout. Page 106

Table C-7. Annual Flight Operations at Gowen Field ANGB Airport for Preferred Alternative
Category Group Aircraft
Modeled Aircraft
Type Engine
Departure Arrival Closed Pattern (1) TOTAL
Day (0700- 2200)
Night (2200- 0700)
Total
Day (0700- 2200)
Night (2200- 0700)
Total
Day (0700- 2200)
Night (2200- 0700) Total
Day (0700- 2200)
Night (2200- 0700)
Total
Civil
Heavy Jet Airbus A30 A300B4- 203 CF6-50C2 842 - 842 590 253 843 - - - 1,432 253 1,685
Large Jet
Airbus A319-131 A319-131
V2522-A5 Engines 1,141 327 1,468 1,086 382 1,468 - - - 2,227 709 2,936
Airbus A320-232 A320-232
V2527-A5 Engines - - - - - - - - - - - -
Boeing FE 727EM2 JT8D-15 274 - 274 41 233 274 - - - 315 233 548 Boeing 73 737N17 JT8D-17 N 183 37 220 160 60 220 - - - 343 97 440 Boeing 737-300 737300
CFM56- 3B-2 5,397 473 5,870 4,670 1,200 5,870 - - - 10,067 1,673 11,740
Boeing 737-500 737500
CFM56- 3B-1 1,468 - 1,468 1,174 293 1,467 - - - 2,642 293 2,935
Boeing 737-700 737700
CFM56- 7B 1,349 118 1,467 1,168 300 1,468 - - - 2,517 418 2,935
Boeing 737-800 737800
CFM56- 7B26 881 - 881 440 440 880 - - - 1,321 440 1,761
Boeing 75 757RR RB211-535 674 - 674 404 270 674 - - - 1,078 270 1,348 Bombardi er Challenge r 600
CL600
ALF502L 48 - 48 48 - 48 - - - 96 - 96Bombardi er Challenge r 601
CL601
CF34-3A 9,771 2,155 11,926 10,189 1,736 11,925 - - - 19,960 3,891 23,851McDonnel DC95HW JT8D17 w/ 316 - 316 316 - 316 - - - 632 - 632 McDonnel Douglas MD-83
MD83JT8D-219 587 - 587 587 - 587 - - - 1,174 - 1,174
Business Jet
Dassault F FAL20 CF700-2D- 809 96 905 809 96 905 - - - 1,618 192 1,810 LEAR 25 (Stage 2) LEAR25 CJ610-8 306 - 306 306 - 306 - - - 612 - 612Gulfstrea m GII (Stage 2)
GII SPEY 511-8 80 - 80 40 40 80 - - - 120 40 160
Gulfstream GIII SPEY 511 32 - 32 32 - 32 - - - 64 - 64 Cessna Ci CNA500 JT15D-4 969 - 969 937 31 968 - - - 1,906 31 1,937 Cessna Ci CIT3 TFE731-3- 134 - 134 134 - 134 - - - 268 - 268
Cessna Citation X
CNA750
Rolls Royce Allison AE3007C 159 - 159 159 - 159 - - - 318 - 318
Gulfstrea m GIV-SP
GIV TAY 611- 8 45 32 77 76 - 76 - - - 121 32 153
IAI Astra 1125 IA1125
TFE731- 3A 86 - 86 86 - 86 - - - 172 - 172
LEAR 36 LEAR35 TFE731-2 2,163 599 2,762 2,592 170 2,762 - - - 4,755 769 5,524 Hawker Beechcraf t 400
MU3001JT15D-4 1,064 96 1,160 1,048 112 1,160 - - - 2,112 208 2,320
Turboprop
Cessna 44 CNA441 TPE331-8 4,971 459 5,430 4,551 879 5,430 - - - 9,522 1,338 10,860 Bombardi er DASH 8-300
DHC830PW123 5,870 - 5,870 5,870 - 5,870 - - - 11,740 - 11,740
Prop
Beechcraft BEC58P TS10-520- 14,307 2,092 16,399 14,508 1,892 16,400 588 81 669 29,403 4,065 33,468 1985 1- ENG VP PROP
GASEPV19,682 474 20,156 19,331 825 20,156 4,335 144 4,479 43,348 1,443 44,791
Helo Augusta A A109 1,212 404 1,616 1,212 404 1,616 - - - 2,424 808 3,232
Military
Fighter Jet
F-15E PW F-15E PW-229 305 - 305 294 11 305 61 - 61 660 11 671 F-15SG (R F-15E 145 - 145 140 5 145 29 - 29 314 5 319 F-35A F-35A - - - - - - - - - - - -
Attack Jet A-10A A-10A 2,253 1,502 3,755 2,253 1,502 3,755 - - - 4,506 3,004 7,510
HeloSikorsky S-70 (UH- 60A)
UH-60A1,800 600 2,400 1,800 600 2,400 - - - 3,600 1,200 4,800
Civil 74,820 7,362 82,182 72,564 9,616 82,180 4,923 225 5,148 152,307 17,203 169,510
Military 4,503 2,102 6,605 4,487 2,118 6,605 90 - 90 9,080 4,220 13,300
Grand Total 79,323 9,464 88,787 77,051 11,734 88,785 5,013 225 5,238 161,387 21,423 182,810
Notes:
(1) Counted as 2 operations per circuit
(2) consists of operations for the 389 FS and the 391 FS
All F-15E Departures are Afterburner Departures. Afterburner is only used during takeoff roll and is secured by the upwind end of the runway.
Page 107

As shown in Table C-4, the proposed F-15 aircraft would only utilize Runway 10R/28L. The majority (80%) of the departures would depart Runway 28L whereas 55% of arrivals would utilize Runway 28L.
In order to avoid significant noise impacts, the 366 FW would:
a) utilize modified departure flight tracks on Runway 10R2 andb) climb at an angle of 15 degrees to an altitude of 5,000 ft MSL3.
See Figures C-1, C-2, and C-3 for the modeled F-15 departure, arrival, and closed pattern flight tracks, respectively. All of these tracks were previously modeled in the Klamath Falls EA (Oregon National Air Guard 2009), except the Runway 10R departure tracks were modified to turn south sooner instead of flying over noise sensitive areas east of the airport. For the arrivals, there are four sets of tracks, and each set has a straight-in track and a pitch-out (overhead break) track that are identical up to the runway threshold. There are two modeled closed pattern tracks: one on Runway 10R and the other on Runway 28L.
Flight track utilization for the F-15 aircraft would be identical to the utilization modeled in the 2009 EA.
The F-15E straight-in and break arrival flight profiles were derived from similar F-15E flight profiles flown at Joint Base Elmendorf-Richardson from the F-22 Plus-Up EA (USAF 2011). The F-15E closed pattern flight profile is the same profile that the 366 FW currently flies at Mountain Home AFB but modified to conform to the course rules at BOI. The F-15E afterburner departure profile was derived from the standard NMAP database afterburner departure for the F-15E, but modified based on how the 366 FW is expected to takeoff at Gowen Field (Roberts 2014).
2 Departing Runway 10R, the F-15 aircraft would turn south sooner than previously modeled (just past the runway threshold). 3 Only applies to F-15 aircraft with PW-229 engine
Page 108

Figure C-1. Modeled F-15 Departure Flight Tracks at Gowen Field ANGB for Preferred Alternative
Page 109

"
Qi0
-
0
D D .:.: 0 >- I- 3:
c: ::J .Q> a:: u: "O
co QJ
·E "O
< :::;:
I I
Figure C-2. Modeled F-15 Arrival Flight Tracks at Gowen Field ANGB for Preferred Alternative
Page 110

Figure C-3. Modeled F-15 Closed Pattern Flight Tracks at Gowen Field ANGB for Preferred Alternative
Page 111

APPENDIX D F-15 SAFETY HISTORY
Page 112

F-15 FLIGHT MISHAP HISTORY(All Rates per 100,000 Flying Hours)
CLASS A CLASS B DESTROYED FATALYEAR Total
Class A Mishaps
Class A Rate
Total Class B Mishaps
Class B Rate
Total Destroyed
Destroyed Rate
PILOT ALL HOURS CUM HRS
CY72 0 0.00 0 0.00 0 0.00 0 0 25 25CY73 0 0.00 0 0.00 0 0.00 0 0 826 851CY74 0 0.00 2 94.79 0 0.00 0 0 2,110 2,961CY75 1 22.02 0 0.00 1 22.02 0 0 4,541 7,502CY76 0 0.00 0 0.00 0 0.00 0 0 17,803 25,305CY77 6 14.16 15 35.40 2 4.72 1 2 42,369 67,674CY78 8 11.59 30 43.46 7 10.14 1 1 69,023 136,697CY79 5 5.16 15 15.47 5 5.16 3 3 96,959 233,656CY80 5 4.57 20 18.30 3 2.74 2 2 109,309 342,965CY81 5 3.78 4 3.02 6 4.54 5 6 132,291 475,256CY82 3 1.96 4 2.61 4 2.61 2 2 153,369 628,625CY83 4 2.36 5 2.95 6 3.54 1 1 169,438 798,063CY84 3 1.71 2 1.14 4 2.28 1 2 175,515 973,578CY85 5 2.70 5 2.70 4 2.16 2 2 185,324 1,158,902CY86 7 3.53 5 2.52 8 4.04 4 4 198,095 1,356,997TY87 3 1.94 0 0.00 3 1.94 2 2 154,821 1,511,818FY88 1 0.50 3 1.49 2 0.99 0 0 201,099 1,712,917FY89 5 2.33 0 0.00 4 1.86 2 2 214,592 1,927,509FY90 7 3.08 6 2.64 7 3.08 4 5 227,617 2,155,126FY91 3 1.09 2 0.72 3 1.09 0 0 276,393 2,431,519FY92 5 2.26 2 0.91 5 2.26 2 3 220,866 2,652,385FY93 3 1.38 5 2.30 3 1.38 0 0 217,539 2,869,924FY94 4 1.90 3 1.43 4 1.90 1 1 210,231 3,080,155FY95 4 1.94 7 3.39 3 1.45 1 2 206,640 3,286,795FY96 5 2.49 4 1.99 3 1.49 0 0 200,758 3,487,553FY97 3 1.56 6 3.12 2 1.04 0 0 192,073 3,679,626FY98 3 1.59 9 4.78 2 1.06 0 0 188,205 3,867,831FY99 8 4.23 11 5.82 6 3.17 1 2 189,109 4,056,940FY00 4 2.23 21 11.71 1 0.56 0 0 179,372 4,236,312FY01 2 1.09 20 10.89 2 1.09 2 2 183,706 4,420,018FY02 5 2.57 5 2.57 2 1.03 1 1 194,847 4,614,865FY03 4 2.07 10 5.16 2 1.03 0 0 193,611 4,808,476FY04 3 1.58 9 4.75 3 1.58 0 0 189,596 4,998,072FY05 3 1.77 9 5.32 1 0.59 0 1 169,158 5,167,230FY06 1 0.59 13 7.70 1 0.59 0 0 168,854 5,336,084FY07 6 3.76 12 7.52 3 1.88 1 1 159,582 5,495,666FY08 4 2.78 4 2.78 5 3.47 2 2 143,964 5,639,630FY09 2 1.39 11 7.65 1 0.70 1 2 143,806 5,783,436FY10 1 0.80 3 2.41 0 0.00 0 0 124,357 5,907,793FY11 1 0.99 3 2.97 1 0.99 0 0 100,848 6,008,641FY12 3 3.14 1 1.05 3 3.14 1 1 95,445 6,104,086FY13 1 1.26 2 2.53 1 1.26 0 0 79,085 6,183,171FY14 2 2.18 5 5.46 1 1.09 1 1 91,550 6,274,721Total 148.00 293.00 124.00 44.00 53.00 6,274,721
Average Annual Class A Mishaps
Average Class A
Rate
Average Annual Class B Mishaps
Average Class B
Rate
Average Annual
Destroyed
Average Destroyed
Rate
Average Pilot Fatal Rate
Average Fatal Rate
Average Annual Hours

5 YR 1.60 1.63 2.80 2.85 1.20 1.22 0.41 0.41 98,25710 YR 2.40 1.88 6.30 4.93 1.70 1.33 0.47 0.63 127,665LIFETIME 3.44 2.36 6.81 4.67 2.88 1.98 0.70 0.84 145,924
Flight “rates” are number of mishaps per 100,000 flight hours. Only Aviation “Flight” mishaps are reported here. An Aviation “Flight” mishap is any mishap in which there is intent for flight and reportable damage to a DoD aircraft. Explosives and chemical agents or guided missile mishaps that cause damage in excess of $20,000 to a DoD aircraft with intent for flight are categorized as aircraft flight mishaps to avoid dual reporting. This is the only aviation mishap subcategory that contributes to the flight mishap rate (NOT flight-related or Aviation Ground Ops). Fiscal Years that have zero flying hours have been excluded.
Class A Mishap. A mishap resulting in one or more of the following: 1. Direct mishap cost totaling $2,000,000 or more ($1,000,000 for mishaps occurring before FY10). 2. A fatality or permanent total disability. 3. Destruction of a DoD aircraft. NOTE: A destroyed UAV/RPA is not a Class A mishap unless the preceding criteria in “1” or “2” are met. Class B Mishap. A mishap resulting in one or more of the following: 1. Direct mishap cost totaling $500,000 or more but less than $2,000,000 ($200,000 to $1,000,000 prior to FY10). 2. A permanent partial disability. 3. Inpatient hospitalization of three or more personnel. Does not count or include individuals hospitalized for observation, diagnostic, or administrative purposes that were treated and released.
Destroyed Aircraft: Only aircraft owned, designated or leased as “USAF” are included. Fatalities: Pilot totals only include “USAF” personnel designated as “pilot” by the Safety Investigation Board. “All” fatalities include all aviation-related fatalities regardless of designation (USAF, foreign, civilian, etc) or role (pilot, operator, passenger, etc). Additionally, all aviation-related fatalities count toward fatality rate regardless if they resulted from a “flight” (rate-producing) mishap or not.
UPDATED 08-Jan-15

F-15 Class A Mishaps by Fiscal Year
1
5
7
3
5
3
4 4
5
3 3
8
4
2
5
4
3 3
1
6
4
2
1 1
3
1
2
0
1
2
3
4
5
6
7
8
Tota
l Cla
ss A
Mis
haps
FY88FY89
FY90FY91
FY92FY93
FY94FY95
FY96FY97
FY98FY99
FY00FY01
FY02FY03
FY04FY05
FY06FY07
FY08FY09
FY10FY11
FY12FY13
FY140
0.5
1
1.5
2
2.5
3
3.5
4
4.5
Class A
Rate
Total Class A Mishaps Class A Rate Mishap TrendLine
F-15 Class B Mishaps by Fiscal Year
3
0
6
2 2
5
3
7
4
6
9
11
2120
5
109 9
1312
4
11
3 3
1
2
5
0
2
4
6
8
10
12
14
16
18
20
22
Tota
l Cla
ss B
Mis
haps
FY88FY89
FY90FY91
FY92FY93
FY94FY95
FY96FY97
FY98FY99
FY00FY01
FY02FY03
FY04FY05
FY06FY07
FY08FY09
FY10FY11
FY12FY13
FY140
1
2
3
4
5
6
7
8
9
10
11
12
Class B
Rate
Total Class B Mishaps Class B Rate Mishap TrendLine

F-15 Destroyed Aircraft by Fiscal Year
2
4
7
3
5
3
4
3 3
2 2
6
1
2 2 2
3
1 1
3
5
1
0
1
3
1 1
0
1
2
3
4
5
6
7
Tota
l Des
troy
ed
FY88FY89
FY90FY91
FY92FY93
FY94FY95
FY96FY97
FY98FY99
FY00FY01
FY02FY03
FY04FY05
FY06FY07
FY08FY09
FY10FY11
FY12FY13
FY140
0.5
1
1.5
2
2.5
3
3.5
Destroyed R
ate
Total Destroyed Destroyed Rate Destroyed TrendLine
F-15 Fatalities (All) by Fiscal Year
0
2
5
0
3
0
1
2
0 0 0
2
0
2
1
0 0
1
0
1
2 2
0 0
1
0
1
0
0.5
1
1.5
2
2.5
3
3.5
4
4.5
5
Tota
l Fat
als
FY88FY89
FY90FY91
FY92FY93
FY94FY95
FY96FY97
FY98FY99
FY00FY01
FY02FY03
FY04FY05
FY06FY07
FY08FY09
FY10FY11
FY12FY13
FY140
0
0
1
1
1
1
1
2
2
2
2
Total Fatal Rate
Total Fatals Total Fatal Rate Fatals TrendLine

APPENDIX E A-10 SAFETY HISTORY
Page 117

A-10 FLIGHT MISHAP HISTORY(All Rates per 100,000 Flying Hours)
CLASS A CLASS B DESTROYED FATALYEAR Total
Class A Mishaps
Class A Rate
Total Class B Mishaps
Class B Rate
Total Destroyed
Destroyed Rate
PILOT ALL HOURS CUM HRS
CY72 0 0.00 0 0.00 0 0.00 0 0 32 32CY73 0 0.00 0 0.00 0 0.00 0 0 124 156CY74 0 0.00 0 0.00 0 0.00 0 0 403 559CY75 0 0.00 0 0.00 0 0.00 0 0 936 1,495CY76 0 0.00 0 0.00 0 0.00 0 0 3,678 5,173CY77 2 11.96 4 23.92 2 11.96 1 2 16,722 21,895CY78 7 15.72 16 35.92 5 11.23 2 2 44,538 66,433CY79 8 9.24 2 2.31 8 9.24 4 4 86,544 152,977CY80 5 3.84 4 3.07 6 4.61 4 4 130,159 283,136CY81 5 2.86 9 5.15 5 2.86 4 4 174,924 458,060CY82 4 1.82 1 0.46 3 1.37 0 0 219,349 677,409CY83 7 3.10 0 0.00 9 3.98 4 4 226,129 903,538CY84 6 2.68 1 0.45 5 2.23 3 4 224,058 1,127,596CY85 4 1.78 2 0.89 4 1.78 2 2 224,133 1,351,729CY86 3 1.37 2 0.91 4 1.82 1 1 219,334 1,571,063TY87 5 2.92 1 0.58 5 2.92 5 5 171,089 1,742,152FY88 3 1.37 2 0.92 3 1.37 1 1 218,289 1,960,441FY89 7 3.03 0 0.00 7 3.03 3 8 230,655 2,191,096FY90 3 1.35 0 0.00 3 1.35 3 3 222,399 2,413,495FY91 2 0.88 0 0.00 3 1.31 2 2 228,273 2,641,768FY92 3 1.79 0 0.00 3 1.79 1 1 167,648 2,809,416FY93 2 1.74 0 0.00 2 1.74 1 1 115,059 2,924,475FY94 4 3.35 0 0.00 5 4.19 1 1 119,330 3,043,805FY95 2 1.69 1 0.84 2 1.69 1 1 118,600 3,162,405FY96 2 1.63 0 0.00 2 1.63 1 1 122,952 3,285,357FY97 3 2.40 1 0.80 3 2.40 2 2 125,095 3,410,452FY98 1 0.81 0 0.00 1 0.81 0 0 124,119 3,534,571FY99 2 1.63 3 2.45 1 0.82 0 0 122,629 3,657,200FY00 2 1.80 13 11.70 1 0.90 1 1 111,111 3,768,311FY01 2 1.78 4 3.55 2 1.78 0 0 112,662 3,880,973FY02 2 1.74 8 6.97 3 2.61 2 2 114,791 3,995,764FY03 1 0.81 5 4.06 2 1.62 1 1 123,181 4,118,945FY04 3 2.53 6 5.06 2 1.69 1 1 118,642 4,237,587FY05 0 0.00 5 4.44 0 0.00 0 0 112,710 4,350,297FY06 0 0.00 6 5.28 0 0.00 0 0 113,550 4,463,847FY07 0 0.00 7 6.46 0 0.00 0 0 108,329 4,572,176FY08 1 1.00 17 17.00 0 0.00 0 0 99,990 4,672,166FY09 1 1.08 22 23.73 0 0.00 0 0 92,717 4,764,883FY10 1 1.03 5 5.13 1 1.03 0 0 97,444 4,862,327FY11 2 1.93 15 14.48 2 1.93 0 0 103,611 4,965,938FY12 0 0.00 3 2.96 0 0.00 0 0 101,310 5,067,248FY13 0 0.00 3 3.18 0 0.00 0 0 94,353 5,161,601FY14 0 0.00 6 7.18 0 0.00 0 0 83,523 5,245,124Total 105.00 174.00 104.00 51.00 58.00 5,245,124
Average Annual Class A Mishaps
Average Class A
Rate
Average Annual Class B Mishaps
Average Class B
Rate
Average Annual
Destroyed
Average Destroyed
Rate
Average Pilot Fatal Rate
Average Fatal Rate
Average Annual Hours

5 YR 0.60 0.62 6.40 6.66 0.60 0.62 0.00 0.00 96,04810 YR 0.50 0.50 8.90 8.83 0.30 0.30 0.00 0.00 100,754LIFETIME 2.44 2.00 4.05 3.32 2.42 1.98 0.97 1.11 121,980
Flight “rates” are number of mishaps per 100,000 flight hours. Only Aviation “Flight” mishaps are reported here. An Aviation “Flight” mishap is any mishap in which there is intent for flight and reportable damage to a DoD aircraft. Explosives and chemical agents or guided missile mishaps that cause damage in excess of $20,000 to a DoD aircraft with intent for flight are categorized as aircraft flight mishaps to avoid dual reporting. This is the only aviation mishap subcategory that contributes to the flight mishap rate (NOT flight-related or Aviation Ground Ops). Fiscal Years that have zero flying hours have been excluded.
Class A Mishap. A mishap resulting in one or more of the following: 1. Direct mishap cost totaling $2,000,000 or more ($1,000,000 for mishaps occurring before FY10). 2. A fatality or permanent total disability. 3. Destruction of a DoD aircraft. NOTE: A destroyed UAV/RPA is not a Class A mishap unless the preceding criteria in “1” or “2” are met. Class B Mishap. A mishap resulting in one or more of the following: 1. Direct mishap cost totaling $500,000 or more but less than $2,000,000 ($200,000 to $1,000,000 prior to FY10). 2. A permanent partial disability. 3. Inpatient hospitalization of three or more personnel. Does not count or include individuals hospitalized for observation, diagnostic, or administrative purposes that were treated and released.
Destroyed Aircraft: Only aircraft owned, designated or leased as “USAF” are included. Fatalities: Pilot totals only include “USAF” personnel designated as “pilot” by the Safety Investigation Board. “All” fatalities include all aviation-related fatalities regardless of designation (USAF, foreign, civilian, etc) or role (pilot, operator, passenger, etc). Additionally, all aviation-related fatalities count toward fatality rate regardless if they resulted from a “flight” (rate-producing) mishap or not.
UPDATED 08-Jan-15

A-10 Class A Mishaps by Fiscal Year
3
7
3
2
3
2
4
2 2
3
1
2 2 2 2
1
3
0 0 0
1 1 1
2
0 0 00
1
2
3
4
5
6
7
Tota
l Cla
ss A
Mis
haps
FY88FY89
FY90FY91
FY92FY93
FY94FY95
FY96FY97
FY98FY99
FY00FY01
FY02FY03
FY04FY05
FY06FY07
FY08FY09
FY10FY11
FY12FY13
FY140
0.5
1
1.5
2
2.5
3
3.5
Class A
Rate
Total Class A Mishaps Class A Rate Mishap TrendLine
A-10 Class B Mishaps by Fiscal Year
2
0 0 0 0 0 01
01
0
3
13
4
8
56
56
7
17
22
5
15
3 3
6
0
2
4
6
8
10
12
14
16
18
20
22
Tota
l Cla
ss B
Mis
haps
FY88FY89
FY90FY91
FY92FY93
FY94FY95
FY96FY97
FY98FY99
FY00FY01
FY02FY03
FY04FY05
FY06FY07
FY08FY09
FY10FY11
FY12FY13
FY140
2
4
6
8
10
12
14
16
18
20
22
24
Class B
Rate
Total Class B Mishaps Class B Rate Mishap TrendLine

A-10 Destroyed Aircraft by Fiscal Year
3
7
3 3 3
2
5
2 2
3
1 1 1
2
3
2 2
0 0 0 0 0
1
2
0 0 00
1
2
3
4
5
6
7
Tota
l Des
troy
ed
FY88FY89
FY90FY91
FY92FY93
FY94FY95
FY96FY97
FY98FY99
FY00FY01
FY02FY03
FY04FY05
FY06FY07
FY08FY09
FY10FY11
FY12FY13
FY140
0.5
1
1.5
2
2.5
3
3.5
4
4.5
Destroyed R
ate
Total Destroyed Destroyed Rate Destroyed TrendLine
A-10 Fatalities (All) by Fiscal Year
1
8
3
2
1 1 1 1 1
2
0 0
1
0
2
1 1
0 0 0 0 0 0 0 0 0 00
1
2
3
4
5
6
7
8
Tota
l Fat
als
FY88FY89
FY90FY91
FY92FY93
FY94FY95
FY96FY97
FY98FY99
FY00FY01
FY02FY03
FY04FY05
FY06FY07
FY08FY09
FY10FY11
FY12FY13
FY140
0
1
2
2
2
3
4
Total Fatal Rate
Total Fatals Total Fatal Rate Fatals TrendLine