E3_WECC_CapitalCosts_FINAL€¦ · PPT file · Web view · 2018-03-22Expiration of tax incentives...
84
Review of Capital Costs for Generation Technologies Technical Advisory Subcommittee January 31, 2017 Arne Olson, Partner Doug Allen, Managing Consultant Femi Sawyerr, Associate
Transcript of E3_WECC_CapitalCosts_FINAL€¦ · PPT file · Web view · 2018-03-22Expiration of tax incentives...

Review of Capital Costs for Generation Technologies
Technical Advisory SubcommitteeJanuary 31, 2017
Arne Olson, PartnerDoug Allen, Managing Consultant
Femi Sawyerr, Associate

2
In 2009, E3 provided WECC with recommendations for capital costs of new electric generation technologies to use in its 10-year study cycles• Prior to this effort, the relative costs of WECC’s study cases could
only be compared on a variable-cost basis• This effort allowed WECC to quantify relative scenario costs on a
basis reflecting their actual prospective costs to ratepayers by combining variable & fixed costs
E3 has updated these capital cost assumptions several times to capture major changes in technology costs (e.g. solar PV) and ensure continued accuracyMost recent update: 2014
Total Cost
History
Fuel and Variable Costs= + Fixed Cost
(E3 Capital Cost Tool)

3
Background
In preparation for its upcoming 20-year study plan, WECC has asked E3 to provide guidance on resource cost to use in that studyThese capital costs will serve as an input to the 20-year study’s LTPT, allowing for the development of robust scenarios through cost minimizationThis efforts builds on similar work done in early 2014
3
20-Y
ear
Stud
y
INPUTS MODELS STUDY RESULTS
Twenty-Year Capital Expansion Plan
Generation Portfolio
Transmission Topology
Gen Capital Costs
Tx Capital Costs
Long-Term Planning Tools(Capital Expansion Optimization)
SCDT
NXTOther Constraints

4
Study Approach
E3 uses a two-step process to develop capital cost assumptions for the 20-year studies:
1. Determine the cost to install a power plant today (2016)2. Forecast reductions (if applicable) in technology capital costs
over the next two decades
E3 uses capital cost estimates in conjunction with other assumptions in WECC studies to determine the annualized costs of new resources:
• Financing structure and cost• Tax credits• Depreciation (MACRS)• Fixed O&M costs

5
Data Sources and Assumptions
E3 develops capital cost assumptions based on a literature review of public cost estimates from a variety of sources:• Government-contracted engineering studies• Regional or industry studies• Utility integrated resource plans (IRPs)• Publicly reported actual costs
WECC stakeholders provided review and feedback during January – April 2017All costs in this update are expressed in 2016 dollars unless explicitly stated otherwiseE3’s cost recommendations represent the “all-in” cost of building a new plant, including the cost of borrowing during construction • “Overnight” capital cost estimates are scaled up to allow for comparison with
all-inclusive cost estimates

6
Wind and Solar Capital Cost Summary
Technology SubtypesWECC 2012 E3 2014 Update E3 2016 Update
(2016 $/kW) (2016 $/kW) (2016 $/kW)
Solar PV Residential Rooftop $5,820 $4,452 $2,900
($/kW-dc) Commercial Rooftop $4,942 $3,845 $2,600
Fixed Tilt (1-20 MW) $3,102 $2,631 $1,500
Tracking (1-20 MW) $3,541 $3,035 $1,600
Fixed Tilt (> 20 MW) $2,635 $2,226 $1,300
Tracking (> 20 MW) $3,075 $2,631 $1,400
Concentrated Solar Power
Parabolic Trough with 7.5 hrs Storage* - - $6,000
($/kW-ac) Solar Tower with 9 hrs Molten Salt Storage* - - $6,500
Wind Onshore $2,196 $2,125 $1,700-$2,000
($/kW-ac) Offshore $6,589 $6,375 $4,500
*Following feedback from the CSP Alliance on Solar Thermal costs, E3 has updated previous categories (Solar Thermal with/without storage) to reflect the latest technical developments
Updated

7
Other Generation Technology Capital Cost Summary
Technology SubtypesWECC 2012 E3 2014 Update E3 2016 Update
(2016 $/kW-ac) (2016 $/kW-ac) (2016 $/kW-ac)
Biomass $4,667 $4,351 $4,300
Biogas Landfill $3,020 $2,833 $2,800
Other $6,040 $5,666 $5,600
Geothermal Binary/Flash $6,369 $5,970 $5,000
Enhanced Geothermal $6,589 $10,118 $10,000
HydroSmall $3,843 $4,047 $4,000
Large $3,294 $3,238 $3,200

8
Storage Technology Capital Cost Summary ($/kW-ac)
Technology SubtypesWECC 2012 E3 2014 Update E3 2016 Update
(2016 $/kW-ac) (2016 $/kW-ac) (2016 $/kW-ac)
Battery Li-Ion n/a$5,059
$3,000 - $5,000
Flow n/a $3,000 - $6,000
Pumped Storage n/a $2,428 $2,500
Compressed Air Energy Storage n/a n/a $1,700

9
Technology SubtypesWECC 2012 E3 2014 Update E3 2016 Update
(2016 $/kW-ac) (2016 $/kW-ac) (2016 $/kW-ac)
CHPSmall $3,859 $3,845 $3,800
Large $1,669 $1,670 $1,650
CoalSteam $3,912 $3,744 $3,700
IGCC with CCS $9,388 $8,297 $8,200
Gas CTAeroderivative
$1,147$1,214 $1,200
Frame $835 $825
Gas CCGT
Basic – Wet-Cooled
$1,356
$1,138 $1,125
Basic – Dry-Cooled $1,214 $1,200
Advanced – Wet-Cooled $1,239 $1,225
Advanced – Dry-Cooled $1,315 $1,300
Nuclear $7,823 $8,094 $8,000
Recip Engine n/a $1,315 $1,300
Conventional Generation Technology Capital Cost Summary

10
Note on interpreting graphs
Graphs in the following presentation attempt to show all data points used to generate estimates• Includes data from past years which help identify trends
over time and within data sources• Studies published by the same entity are grouped by color• For sources with a single point estimate for capital costs,
estimates are denoted by □• Many sources provided estimated ranges, which are denoted
by Δ (high estimate) and Ο (low estimate)• E3 recommended estimates (past and current) are denoted
by ◊The detailed data behind these graphs can be provided upon request

PRESENT DAY COSTS - SOLAR PV

12
Solar capital costs have continued to decline sharply during recent years• Declines seen across all technologies, as much as 50%
relative to 2014 estimates• Tight range of estimates for Residential/Commercial solar,
wider for Utility-Scale solarCost advantage of larger systems has decreased in recent years• Smaller difference in the updated numbers between the
“Small” and “Large” system capital cost estimates
Solar Price Trends over Time

13
Data is presented according to type and size (where appropriate) of installation• Residential Rooftop• Commercial Rooftop• Utility-Scale Fixed Tilt• Utility-Scale Tracking
Data points collected from sources are shown over time to indicate the trend of cost evolutions in recent yearsE3 estimate takes into account current cost estimates as well as changes over time relative to 2014 estimate
Details on Cost Estimates

14
Residential Rooftop Solar Costs over Time
E3 Recommendation:$2,900/kW-dc

15
Commercial Rooftop Solar Costs over Time
E3 Recommendation:$2,600/kW-dc

16
Utility-Scale Fixed Tilt Solar Costs over Time
E3 Recommendation:$1,500/kW-dc (1-20 MW)$1,300/kW-dc (20+ MW)

17
Utility-Scale Tracking Solar Costs over Time
E3 Recommendation:$1,600/kW-dc (1-20 MW)$1,400/kW-dc (20+ MW)

18
Aligning Cost & Performance Assumptions for Solar PV
Solar PV capacities• Direct current (DC): sum of module nameplate rating• Alternating current (AC): inverter nameplate rating
Capital costs are typically reported relative to the system’s DC nameplate rating (in $/kW-dc), but can be expressed relative to the AC nameplate ratio by multiplying by the Inverter Loading Ratio
Capital Cost
($/kW-ac)
Capital Cost
($/kW-dc)
Inverter Loading Ratio
DC nameplateAC nameplate
Source: Utility-Scale Solar 2015: An Empirical Analysis of Cost, Performance and Pricing Trends in the United States (LBNL, 2016)
For more detail on the treatment of DC and AC capacity in WECC studies, see E3’s presentation to TAS (12-12-2013)
Chart shows industry average ILRs in recent years

19
Recommended Assumptions
Values in the LBNL study cited above indicate that the recommended inverter loading ratios for the fixed tilt solar resources should be updated from their 2014 values:• Fixed tilt, utility: 1.35• Tracking, utility: 1.30• Rooftop: 1.20
Solar PV Subtypes E3 2016 Update(2016 $/kW-dc)
Inverter Loading Ratio
E3 2016 Update(2016 $/kW-ac)
$/kW-dc X ILR = $/kW-ac
Residential Rooftop $2,900 1.20 $3,480 Commercial Rooftop $2,600 1.20 $3,120 Fixed Tilt (1-20 MW) $1,500 1.35 $2,025 Tracking (1-20 MW) $1,600 1.30 $2,080
Fixed Tilt (> 20 MW) $1,300 1.35 $1,755
Tracking (> 20 MW) $1,400 1.30 $1,820

20
Summary of Solar PV Recommendations
Capital costs expressed in $2016Comparison of DC and AC costs in E3 2016 update:
Solar PV SubtypesE3 2016 Update
2016 $/kW-dc
2016 $/kW-ac
Residential Rooftop $2,900 $3,480
Commercial Rooftop $2,600 $3,120
Fixed Tilt (1-20 MW) $1,500 $2,025
Tracking (1-20 MW) $1,600 $2,080
Fixed Tilt (> 20 MW) $1,300 $1,755
Tracking (> 20 MW) $1,400 $1,820

21
Comparison of Solar PV Recommendations to Past Recommendations
Solar costs have declined in recent yearsCost differences across the different types of solar have also declined

PRESENT DAY COSTS - WIND

23
Wind capital costs have remained relatively constant over the past few years• Slight downward trend, but not approaching the cost
decreases seen for solar• Data is often presented by region, but little indication of
systematic price differences across regionsData on Offshore Wind remains sparse• First offshore wind facility in the US came online this month• Previous E3 estimates were high relative to costs released
since that update
Wind Price Trends over Time

24
Data/estimates are presented for both onshore and offshore wind
Data points are presented over time to indicate the trend of cost evolutions in recent years
E3 estimate takes into account current cost estimates as well as changes over time relative to 2014 estimate
Details on Cost Estimates

25
Data from LBNL indicates that wind capital costs are likely to vary according to the region in which the project is located• Projects in the “Interior” zone (Rocky Mountains) are less expensive
to install than those in the “West” zone• E3 recommends reflecting this difference in capital cost estimates• Within region, E3 applies state-specific capital cost multipliers to
reflect variation across state lines
Cost Differences by Region
Source: 2015 Wind Technologies Market Report, LBNL

26
Onshore Wind Solar Costs over Time
E3 Recommendation:$1,700/kW-ac (Interior)$2,000/kW-ac (West)

27
Offshore Wind Costs over Time
E3 Recommendation:$4,500/kW-ac

28
Summary of Wind Capital Cost Recommendations
Capital costs expressed in $2016
Wind Subtypes
E3 2012 Update
E3 2014 Update
E3 2016 Update
2016 $/kW-ac 2016 $/kW-ac 2016 $/kW-ac
OnshoreInterior
$2,196 $2,125$2,000
Coastal $1,700
Offshore $6,589 $6,375 $4,500
Cost decrease in both categories relative to 2014 update (6-20% for onshore, 29% for offshore)

FUTURE COST PROJECTIONS

30
Cost Trajectory Methodology
In 2012, E3 developed methodologies to create plausible trajectories of future generation capital costs• Solar PV: application of learning curves to present-day costs
• 20% learning rate for modules; 10% (Utility-Scale) or 15% (Rooftop) for BOS
• IEA Medium-Term Outlook forecast of global installations• Wind: application of learning curves to present-day costs:
• 10% learning rate• IEA Medium-Term Outlook forecast of global installations
The general framework used to project future costs remain valid, but E3 has updated assumptions based on improved/new data and information and included projections for battery storage

31
Learning curves describe an observed empirical relationship between the cumulative experience in the production of a good and the cost to produce it• Increased experience leads to lower costs due to efficiency gains in the
production process• The functional form for the learning curve is empirically derived and does not
have a direct theoretical foundation
Learning Curve Theory
The learning rate represents the expected decrease in costs with a doubling of experienceGlobal installed capacity is used as a proxy for cumulative experience in the electric sector
2x
2x-20%-20%
Pric
e
Cumulative Experience
Example: 20% Learning Rate

FUTURE COST PROJECTIONS - SOLAR

33
Components of Solar PV Costs
For each segment of solar PV, E3 has broken capital costs out into three categories:1. Module costs: direct cost of photovoltaic modules2. Non-module hard costs: costs of inverter, racking, electrical equipment, etc.3. “Soft costs”: labor, permitting fees, etc.
Cost reductions in each category will result from different drivers and may not apply equally across all market segments

34
Module Cost Reductions
Historically, over the long-term, modules have stayed relatively close to a learning rate of 20%• See International Technology Roadmap for Photovoltaic 2015 Results,
available at http://www.itrpv.netCurrent module prices are below long-term learning curve• Potential for cost reductions due to module cost declines is expected to be
limited until trend returns to long-run average

35
Forecasting Future Module Prices
E3’s projection of module costs relies on the extrapolation of global PV forecast from the IEA’s Medium Term Renewable Energy OutlookModule prices are assumed to remain stable at today’s level until the long-term trend “catches up”Learning curve approach supports anecdotal evidence that suggests further reductions in module costs are limited

36
Non-Module Cost Reduction Potential
In 2014, E3 assumed that non-module cost components for rooftop PV would follow a learning rate of 15% while those for utility-scale PV would follow a 10% learning rate
• Reflected substantial effort to identify cost reduction potential in rooftop PV systems• Reported “costs” of rooftop systems are increasingly influenced by the retail rate structures that enable
their viability• Fair market value of PV exceeds actual system costs, allowing for more rapid cost declines with
increase experience / competition• Learning rates are applied based on global installed capacity
E3 believes these learning rates are still appropriate for use in 2016
29% reduction relative to 2016
20% reduction relative to 2016

37
Comparison to Prior Recommendations: Residential and Commercial
Residential and commercial rooftop solar PV costs have been revised downward from the 2014 E3 Update reflecting recent market cost declines

38
Comparison to Prior Recommendations: Utility Scale Fixed Tilt

39
Comparison to Prior Recommendations: Utility Scale Tracking

FUTURE COST PROJECTIONS - WIND

41
Forecasting Future Turbine Prices
Learning rates are based on meta-analysis of literature presented in Rubin (2015)2
• Estimated at 12% for both on and offshore turbines
E3’s projection of module costs relies on the extrapolation of global wind forecast from the Global Wind Energy Council
• Total installed capacity increases to ~800 GW in 2020, ~2,800 GW in 2040
• Offshore wind increases from <3% of global total in 2015 to ~25% of global total in 20401
1 – Share of offshore wind is taken from IEA projections2 – Rubin, E., I. Azevedo, P. Jaramillo, S. Yeh. “A review of learning rates for electricity supply technologies.” Energy Policy 86, pp. 198-218.

42
Turbine Price Evolution over Time
Due to relative maturity of onshore wind industry, offshore costs decline more rapidly over the next 15-20 years
Past 2030, growth in offshore wind slows to levels near that for onshore
24% below 2016 estimate
51% below 2016 estimate

PRESENT DAY COSTS - STORAGE

44
Characterizing Storage Options
The breadth of potential storage applications is wide, and the appropriate technology and its characteristics will vary considerably
Sources: Sandia (2013), Indiana State Utility Forecasting Group (2013)

45
System Characteristics
The table below compares some of the operating characteristics of the energy storage technologies examined here
Technology Typical Size (MW)
Round Trip Efficiency (%)
Economic Lifetime (yrs)
O&M Costs (2016 $/kW-yr)
Pumped Hydro Storage
100+ 80 20+ 15
Lithium Ion Battery
10 92 5-10 30
Flow Battery 10 70 10-20 100Compressed Air Energy Storage
100+ 70 20+ 15

46
Recommendations – Pumped Hydro Storage
Pumped hydro is a relatively mature technology that can scale-up to over 1 GW although costs are highly dependent on the specific siteRecent projects in PacifiCorp’s territory (JD Pool, Swan Lake, and Seminoe) estimated at $2,600 - $2,700/ kW
E3 Recommendation:$2,500/kW-ac

47
Lithium Ion Battery Costs by Storage Capacity
Costs presented according to storage lifeTighter range of costs than that seen for flow batteries• Likely due to wide range of potential materials that can be used in
flow batteries
E3 Recommendation:4-Hour: $3,000/kW-ac,
$750/kWh
8-Hour, $5,000/kW-ac, $625/kWh

48
Flow Battery Costs by Storage Capacity
Costs presented according to storage lifeWide range of costs based on materials usedLi-Ion batteries expected to have minor cost advantage
E3 Recommendation:4-Hour: $3,000/kW-ac,
$750/kWh
8-Hour, $6,000/kW-ac, $750/kWh

49
Battery cost projections
Dramatic changes since 2005These cost improvement trends are expected to continue into the 2020sBecause of widespread use in other sectors, however, cannot apply “learning curve” methodology used elsewhere
• Instead, cost projections are based on expected overall % declines before the technology reaches “maturity”
Source: Nykvist et al. (2015), http://www.nature.com/nclimate/journal/v5/n4/full/nclimate2564.html

50
Forecasting Future Battery Prices
Price reduction rates are based on data presented by Lazard (2016)1
• Li-Ion: A 6% reduction rate was used; average of the high and low values predicted by Lazard
• Flow: A 5.5% reduction rate was used; average of the high and low values predicted by Lazard
Technology reaches maturity by 2028, after which reductions are minimal
1 – Lazard, Levelized Cost of Storage v2.0, 2016
Updated

51
Compressed Air Energy Storage (CAES) Costs over Time
Relatively few data points availableAll estimates in the $1,200/kW - $2,000/kW range
E3 Recommendation:$1,700/kW-ac
Updated

PRESENT DAY COSTS – OTHER TECHNOLOGIES

Concentrated Solar Power Capital Costs
In past years, E3 has generated two cost estimates for solar thermal plants • With and without storage
Based on comments from the CSP Alliance, capital cost estimates are now presented for two types of solar thermal plant• Parabolic Trough, 7.5 hours of energy storage• Power Tower, 9 hours of energy storage
Due to change in technologies, cost estimates for solar thermal were based on latest information on technology (trough/tower) and incremental cost of storage• International Renewable Energy Agency (IRENA) provided the only estimates for
technologies proposed by CSA• New cost estimates focus on technology and incremental storage costs rather than
vintage
Updated

Concentrated Solar Power – Parabolic Trough
E3 Recommendation:7.5 hours: $6,000/kW-ac
IRENA estimates (cited by CSP Alliance) shown in light
green
Updated

Concentrated Solar Power – Solar Tower
IRENA estimates (cited by CSP Alliance) shown in light
green
E3 Recommendation:9 hours: $6,500/kW-ac
Updated

Future Cost Projections - CSP
Price reduction rates are based on data presented by IRENA (2016)1
• Parabolic Trough: A 33% reduction rate between the 2015 value and the projected 2025 value
• Solar Tower: A 37% reduction rate between the 2015 value and the projected 2025 value
No additional price reductions assumed beyond those estimated by IRENA
1 – IRENA, The Power to Change: Solar and Wind Reduction Potential to 2025, 2016
Updated

Biomass Capital Costs
No clear trend in Biomass capital cost estimates• EIA estimates increased
12%, Lazard slightly down
Mature technology, costs are unlikely to decrease substantially
E3 Recommendation:$4,300/kW-ac

Geothermal CostsData indicates a modest decline in capital costs for Binary/Flash GeothermalRange of estimates has also narrowed
E3 Recommendation:$5,000/kW-ac

59
Enhanced Geothermal Costs
Little to no updated information on costs / viability of Enhanced Geothermal Systems since 2014 updateLimited deployment of EGS systems means that available cost data is based on experimental deployments
E3 Recommendation:$9,000/kW-ac

60
Hydropower Costs
A review of the available literature shows no evidence that Hydropower costs have changed since the 2014 updateEIA inputs for 2016 AEO did not update hydro costsNWPCC considers hydro to be a “secondary” resource in the 7th Power Plan• Cost information not given
No change in estimates

PRESENT DAY COSTS – CONVENTIONAL TECHNOLOGIES

62
Conventional Technology Costs
E3 conducted a high-level review of conventional technology costs to determine if there was evidence in significant changes in last two yearsGeneric cost estimates (Lazard, EIA, etc.) have experienced little to no changeIRP cost estimates have seen small changes• Lack consistent direction, indicating likely a result of project-
specific factors
Recommendation: Use nominal numbers from 2014 update, assume cost improvements offset inflation

63
Technology SubtypesWECC 2012 E3 2014 Update E3 2016 Update
(2016 $/kW-ac) (2016 $/kW-ac) (2016 $/kW-ac)
CHPSmall $3,859 $3,845 $3,800
Large $1,669 $1,670 $1,650
CoalSteam $3,912 $3,744 $3,700
IGCC with CCS $9,388 $8,297 $8,200
Gas CTAeroderivative
$1,147$1,214 $1,200
Frame $835 $825
Gas CCGT
Basic – Wet-Cooled
$1,356
$1,138 $1,125
Basic – Dry-Cooled $1,214 $1,200
Advanced – Wet-Cooled $1,239 $1,225
Advanced – Dry-Cooled $1,315 $1,300
Nuclear $7,823 $8,094 $8,000
Recip Engine n/a $1,315 $1,300
Conventional Generation Technology Capital Cost Summary

PRESENT DAY COSTS – FIXED O&M

65
Fixed O&M Recommendations
Technology Subtypes Fixed O&M ($/kW-yr.)
Solar PV Residential Rooftop $33
Commercial Rooftop $20
Fixed Tilt (1-20 MW) $25
Tracking (1-20 MW) $30
Fixed Tilt (> 20 MW) $20
Tracking (> 20 MW) $25
Solar Thermal Trough with 7.5-hr storage $65
Solar Tower with 9-hr storage $65
Wind Onshore $40
Offshore $100
Updated

66
Fixed O&M Recommendations
Technology Subtypes Fixed O&M ($/kW-yr.)
Biomass $120
BiogasLandfill $100
Other $120
GeothermalBinary/Flash $120
Enhanced Geothermal $400
HydroSmall $20
Large $20
BatteryLi-Ion $30
Flow $100
Pumped Storage $15
Compressed Air Energy Storage
$25
Updated

67
Fixed O&M Recommendations
Technology Subtypes Fixed O&M ($/kW-yr.)
CHPSmall $10
Large $10
CoalSteam $35
IGCC with CCS $65
Gas CTAeroderivative $15
Frame $9
Gas CCGT
Basic – Wet-Cooled $10
Basic – Dry-Cooled $10
Advanced – Wet-Cooled $10
Advanced – Dry-Cooled $10
Nuclear $85
Recip Engine $18
Updated

LEVELIZED COST ESTIMATES – 2016 AND 2036

69
Levelized Cost of Energy by Resource – 2016 and 2036
Expiration of tax incentives are largely offset by capital
cost improvements for Solar PV technologies
Forecasted capital cost reductions for wind (especially
offshore) make up for expiration of the PTC
Updated

70
Levelized Cost of Energy by Resource – 2016 and 2036
Expiration of tax incentives causes increases in LCOE
for mature renewable resources
Forecasted capital cost reductions for solar thermal
technologies offset loss of ITC
Updated

71
Levelized Cost of Energy by Resource – 2016 and 2036
Conventional technologies have constant LCOEs in
2016$
Updated
72
Updated
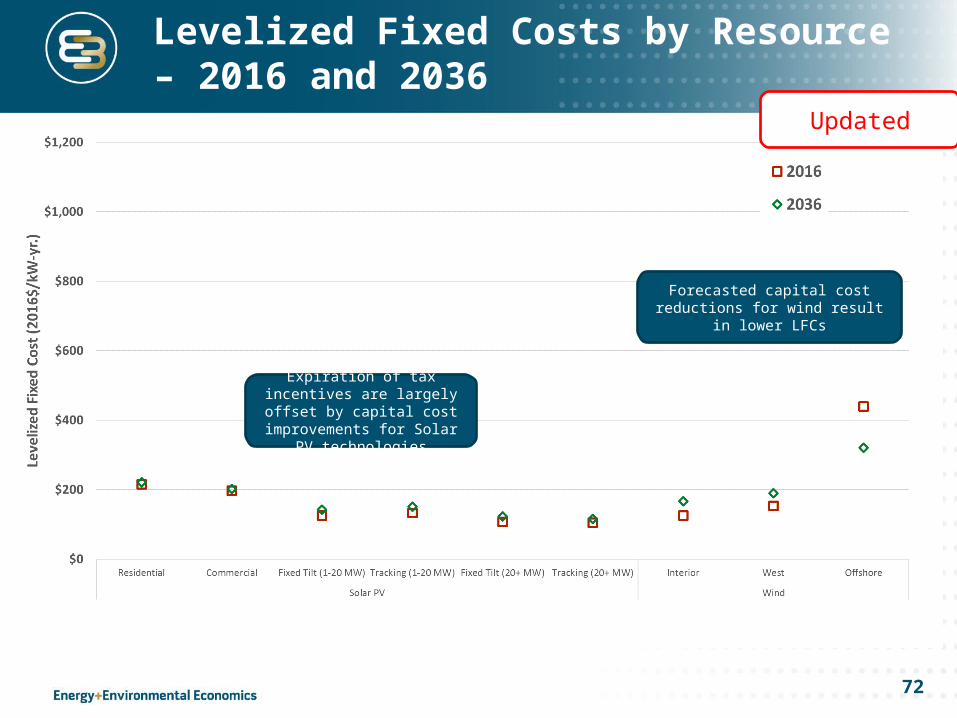
Levelized Fixed Costs by Resource – 2016 and 2036
Expiration of tax incentives are largely offset by capital
cost improvements for Solar PV technologies
Forecasted capital cost reductions for wind result in
lower LFCs

73
Updated
Levelized Fixed Costs by Resource – 2016 and 2036
Expiration of tax incentives causes increases in LFC for
mature renewable resources
Forecasted capital cost reductions for solar thermal
technologies offset loss of ITC

74
Updated
Levelized Fixed Costs by Resource – 2016 and 2036
Conventional technologies have constant LFCs in
2016$

75
Updated
Levelized Fixed Costs by Resource – 2016 and 2036
Cost improvements lower LFCs for battery storage
options
LFCs for more conventional storage options remain
constant in 2016$

Thank You!Energy and Environmental Economics, Inc. (E3)101 Montgomery Street, Suite 1600San Francisco, CA 94104Tel 415-391-5100Web http://www.ethree.com

BIBLIOGRAPHY

78
Sources
Arizona Public Service• 2014 Integrated Resource Plan. Apr 2014
• Link
Avista• 2015 Electric Integrated Resource Plan. Aug 2015
• Link
California Energy Commission• Estimated Cost of New Renewable and Fossil Generation in
California. Mar 2015• Link

79
Sources (cont’d)
California Solar Initiative (CSI)• CSI data. Nov 2016
• Link
Greentech Media• U.S. PV System Pricing H2 2016: System Price Breakdowns
and Forecasts. Nov 2016• Link
Idaho Power Company• 2015 Integrated Resource Plan. Jun 2015
• Link

80
Sources (cont’d)
International Renewable Energy Agency (IRENA)• Renewable Power Generation Costs in 2014. Jan 2015
• Link• The Power to Change: Solar and Wind Reduction Potential to
2025, Jun 2016• Link
Lazard• Levelized Cost of Energy Analysis – Version 9.0. Nov 2015
• Link• Levelized Cost of Energy Analysis – Version 10.0. Dec 2016
• Link

81
Sources (cont’d)
Lazard (cont’d)• Levelized Cost of Storage Analysis – Version 1.0. Nov 2015
• Link• Levelized Cost of Storage Analysis – Version 2.0. Dec 2016
• Link
Lawrence Berkeley National Laboratory (LBNL)• Tracking the Sun VIII: The Installed Price of Residential and
Non-Residential Photovoltaic Systems in the United States. Aug 2015
• Link

82
Sources (cont’d)
Lawrence Berkeley National Laboratory (LBNL) (cont’d)• Tracking the Sun IX: The Installed Price of Residential and
Non-Residential Photovoltaic Systems in the United States. Aug 2016
• Link• Utility Scale Solar 2015. Aug 2016
• Link• 2015 Wind Technologies Market Report. Aug 2016
• Link

83
Sources (cont’d)
National Renewable Energy Laboratory (NREL)• Distribution Generation Renewable Energy Estimate of
Costs. Feb 2016• Link
Pacificorp• 2015 Integrated Resource Plan. Mar 2015
• Link
Pacificorp and Black & Veatch• 2017 Integrated Resource Plan. Aug 2016
• Link

84
Sources (cont’d)
Portland General Electric• 2016 Integrated Resource Plan. Nov 2016
• Link