e1-Conduction Heat Transfer
14
ENT 255 Heat Transfer Laboratory Module EXPERIMENT 1 HEAT CONDUCTION 1.0 OBJECTIVES 1.1. To examine the temperature profile along a homogeneous bar and radial of cylinder by conduction. 1.2.To investigate Fourier’s Law for the linear conduction of heat along a homogeneous bar 2.0 EQUIPMENT The equipment comprises two heat-conducting specimens, a multi-section bar for the examination of linear conduction and a metal disc for radial conduction. A control panel provides electrical and power digital for display heaters in the specimens as well as the selector switch for data acquisition system A small flow of cooling water provides a heat sink at the end of the conducting path in each specimen. Figure 1: Unit Assembly for Heat Conduction Study Bench 1 1 2 3 4 5 6 7 8 9 1
-
Upload
rufus-tsai -
Category
Documents
-
view
44 -
download
2
description
fundamental chemistry engiineering
Transcript of e1-Conduction Heat Transfer
ENT 255 Heat Transfer Laboratory Module
EXPERIMENT 1
HEAT CONDUCTION
1.0 OBJECTIVES
1.1. To examine the temperature profile along a homogeneous bar and radial of cylinder by conduction.
1.2. To investigate Fourier’s Law for the linear conduction of heat along a homogeneous
bar
2.0 EQUIPMENT
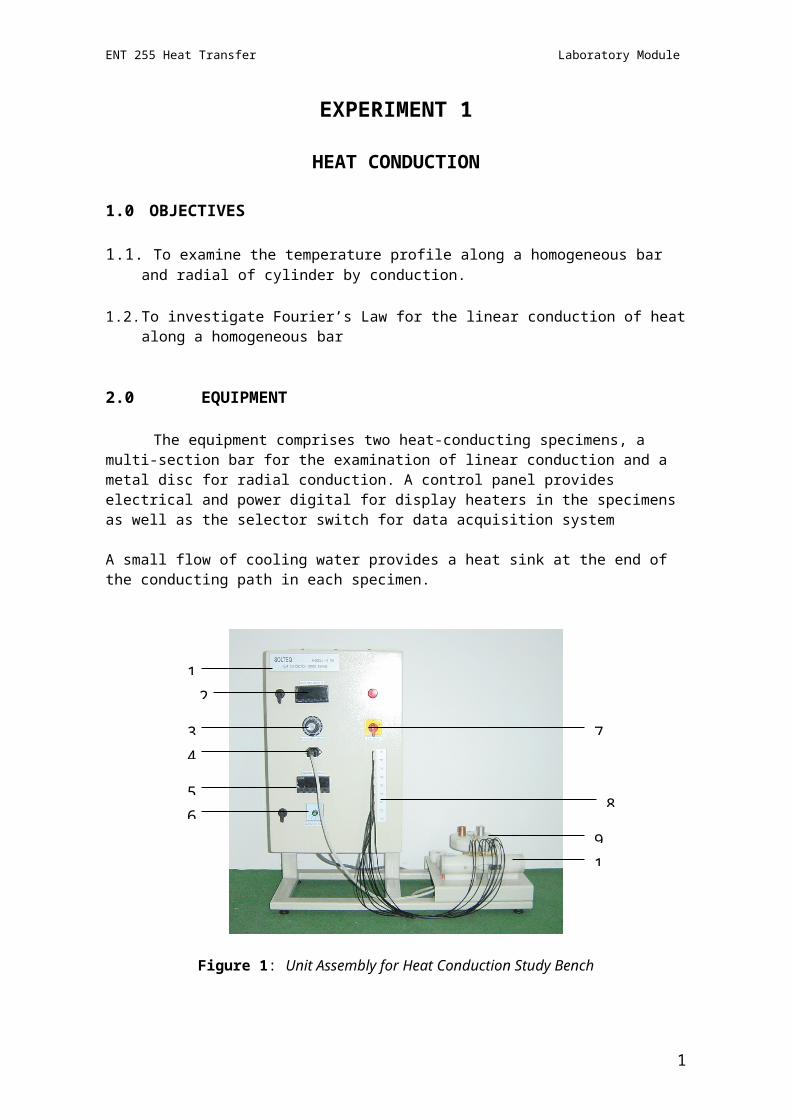
The equipment comprises two heat-conducting specimens, a multi-section bar for the examination of linear conduction and a metal disc for radial conduction. A control panel provides electrical and power digital for display heaters in the specimens as well as the selector switch for data acquisition system
A small flow of cooling water provides a heat sink at the end of the conducting path in each specimen.
Figure 1: Unit Assembly for Heat Conduction Study Bench
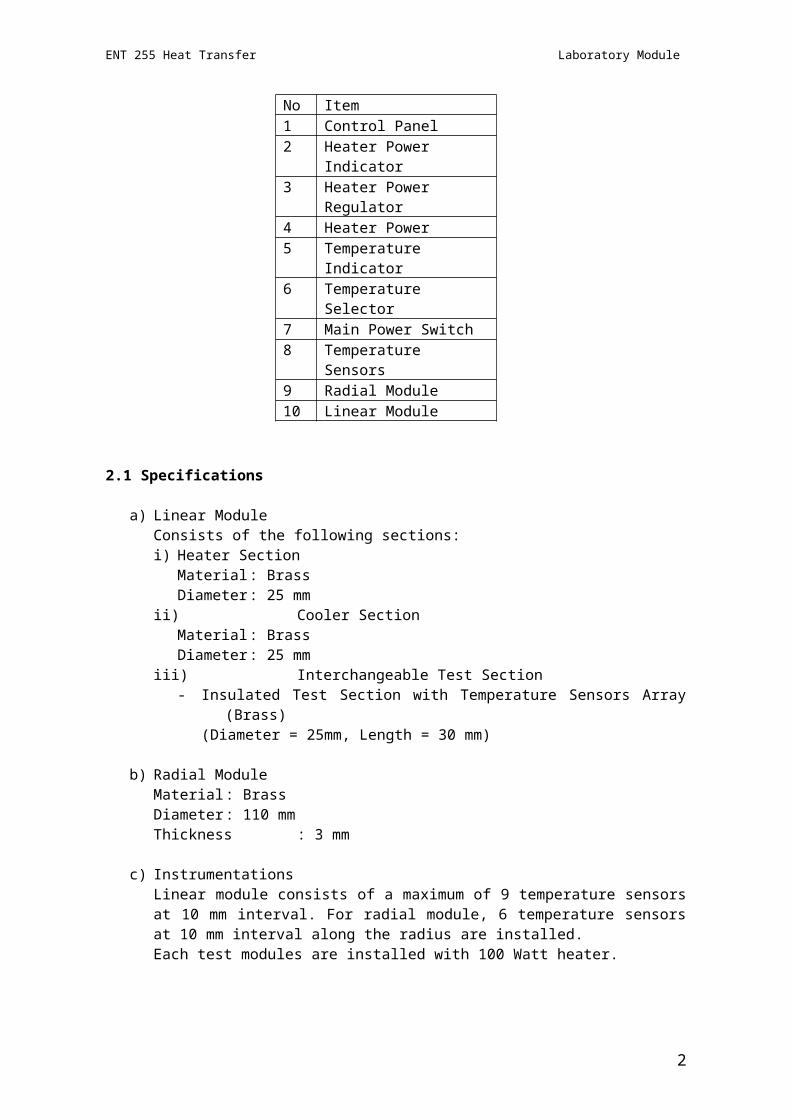
No Item1 Control Panel2 Heater Power Indicator3 Heater Power Regulator4 Heater Power5 Temperature Indicator
1
1
2
3
4
5
6
7
8
9
10
ENT 255 Heat Transfer Laboratory Module
6 Temperature Selector7 Main Power Switch8 Temperature Sensors9 Radial Module10 Linear Module
2.1 Specifications
a) Linear ModuleConsists of the following sections:i) Heater Section
Material : BrassDiameter : 25 mm
ii) Cooler SectionMaterial : BrassDiameter : 25 mm
iii) Interchangeable Test Section- Insulated Test Section with Temperature Sensors Array (Brass)
(Diameter = 25mm, Length = 30 mm)
b) Radial ModuleMaterial : BrassDiameter : 110 mmThickness : 3 mm
c) InstrumentationsLinear module consists of a maximum of 9 temperature sensors at 10 mm interval. For radial module, 6 temperature sensors at 10 mm interval along the radius are installed.Each test modules are installed with 100 Watt heater.
3.0 INTRODUCTION & THEORY
Thermal conduction is the mode of heat transfer, which occurs in a material by virtue of a temperature gradient. A solid is chosen for the demonstration of pure conduction since both liquids and gases exhibit excessive convective heat transfer. In a practical situation, heat conduction occurs in three dimensions, a complexity which often requires extensive computation to analyze. In the laboratory, a single dimensional approach is required to demonstrate the basic law that relates rate of heat flow to temperature gradient and area.
2
ENT 255 Heat Transfer Laboratory Module
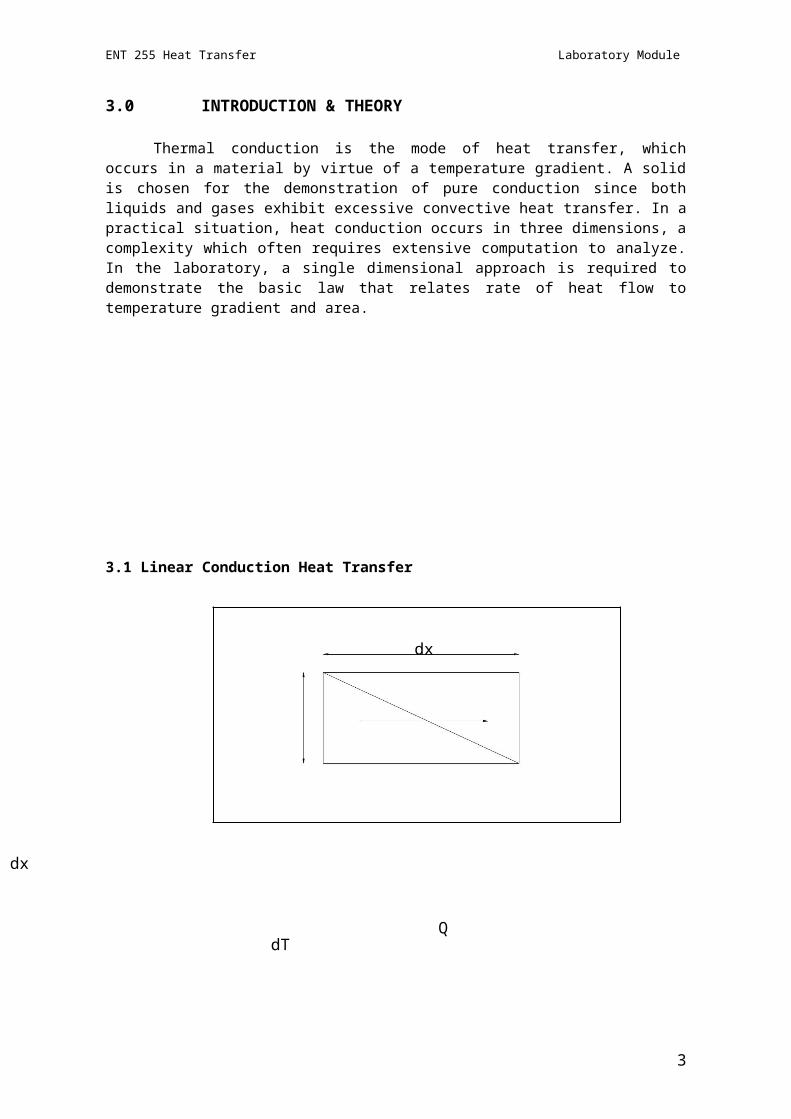
3.1 Linear Conduction Heat Transfer
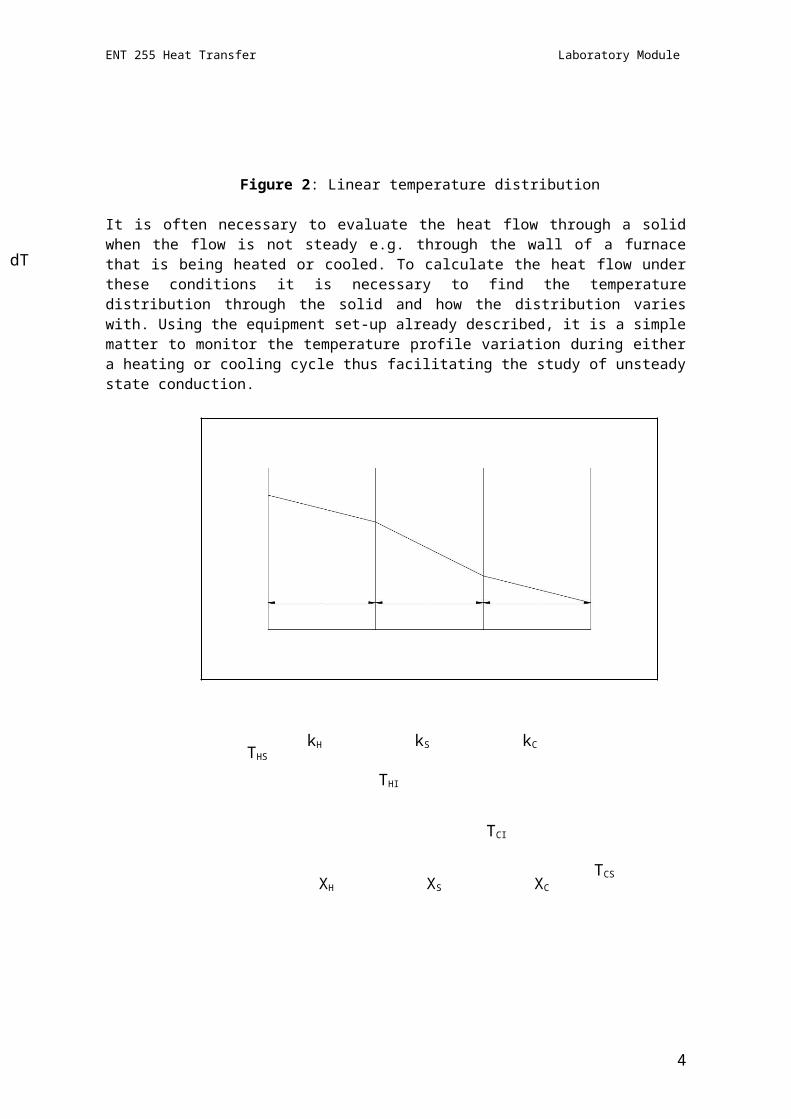
Figure 2: Linear temperature distribution
It is often necessary to evaluate the heat flow through a solid when the flow is not steady e.g. through the wall of a furnace that is being heated or cooled. To calculate the heat flow under these conditions it is necessary to find the temperature distribution through the solid and how the distribution varies with. Using the equipment set-up already described, it is a simple matter to monitor the temperature profile variation during either a heating or cooling cycle thus facilitating the study of unsteady state conduction.
3
dx
dT
Q
dx
dT
ENT 255 Heat Transfer Laboratory Module
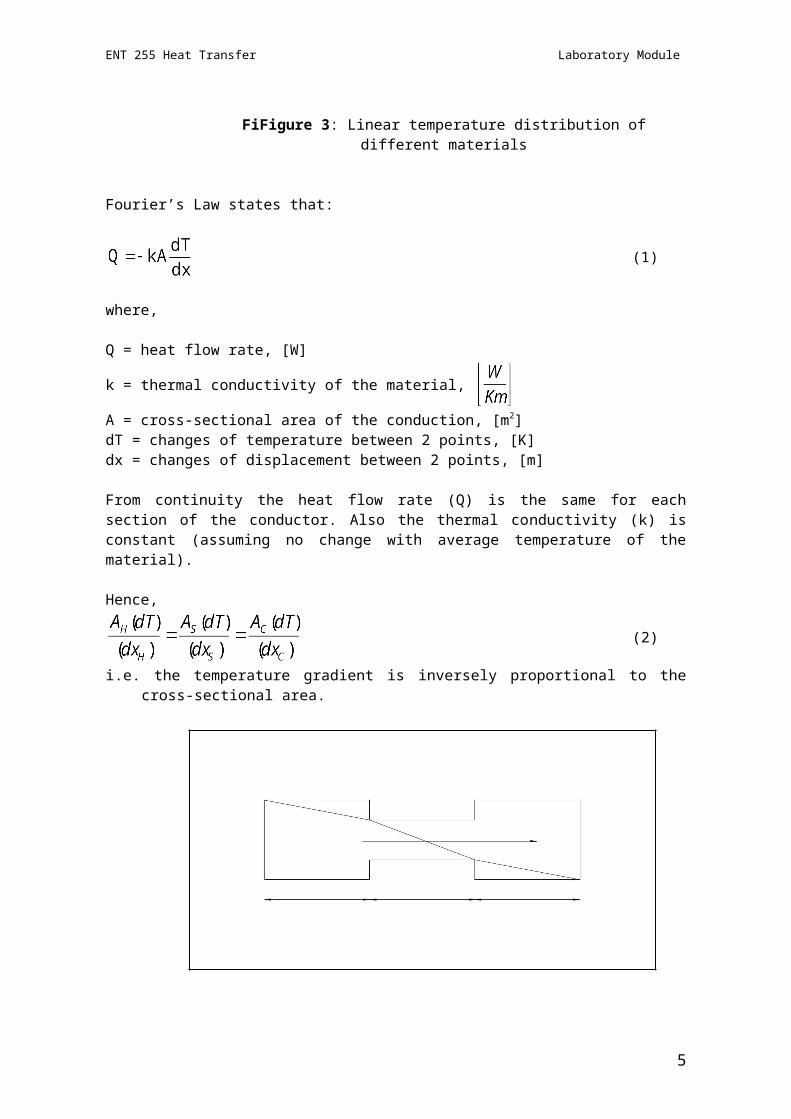
FiFigure 3: Linear temperature distribution of different materials
Fourier’s Law states that:
(1)
where,
Q = heat flow rate, [W]
k = thermal conductivity of the material,
A = cross-sectional area of the conduction, [m2]dT = changes of temperature between 2 points, [K]dx = changes of displacement between 2 points, [m] From continuity the heat flow rate (Q) is the same for each section of the conductor. Also the thermal conductivity (k) is constant (assuming no change with average temperature of the material).
Hence,
(2)
i.e. the temperature gradient is inversely proportional to the cross-sectional area.
4
XH XS XC
kH kS kCTHS
THI
TCI
TCS
ENT 255 Heat Transfer Laboratory Module
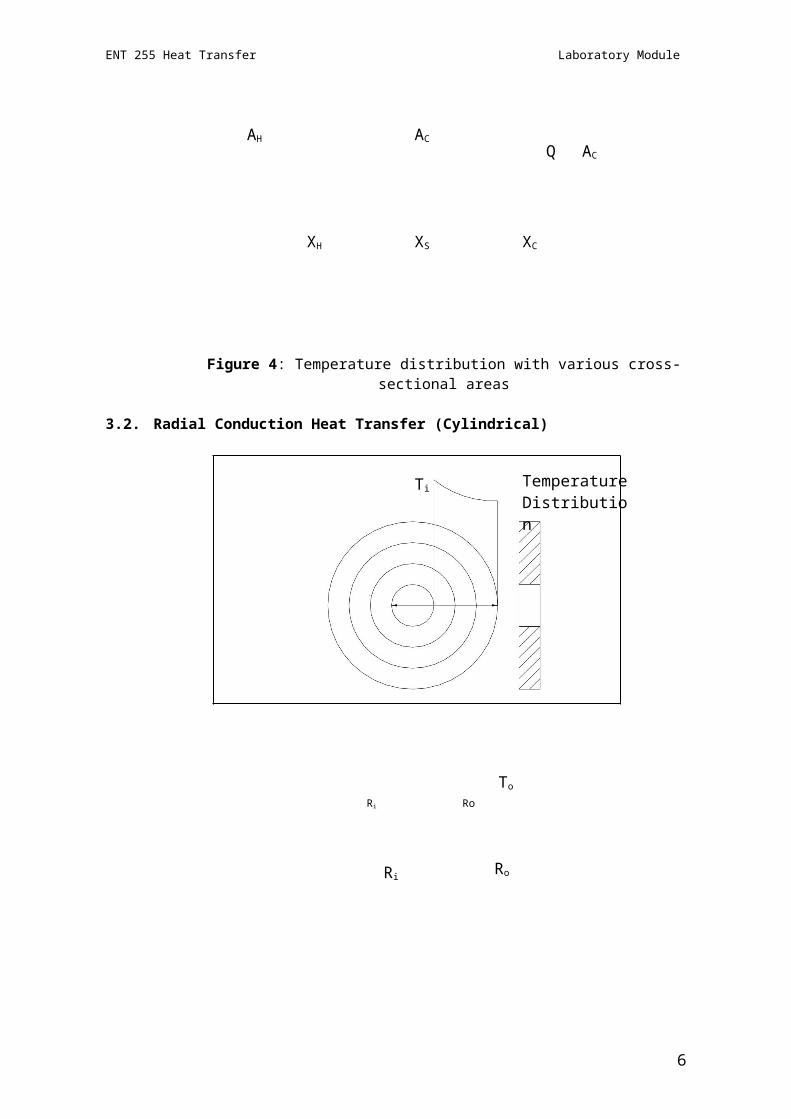
Figure 4: Temperature distribution with various cross-sectional areas
3.2. Radial Conduction Heat Transfer (Cylindrical)
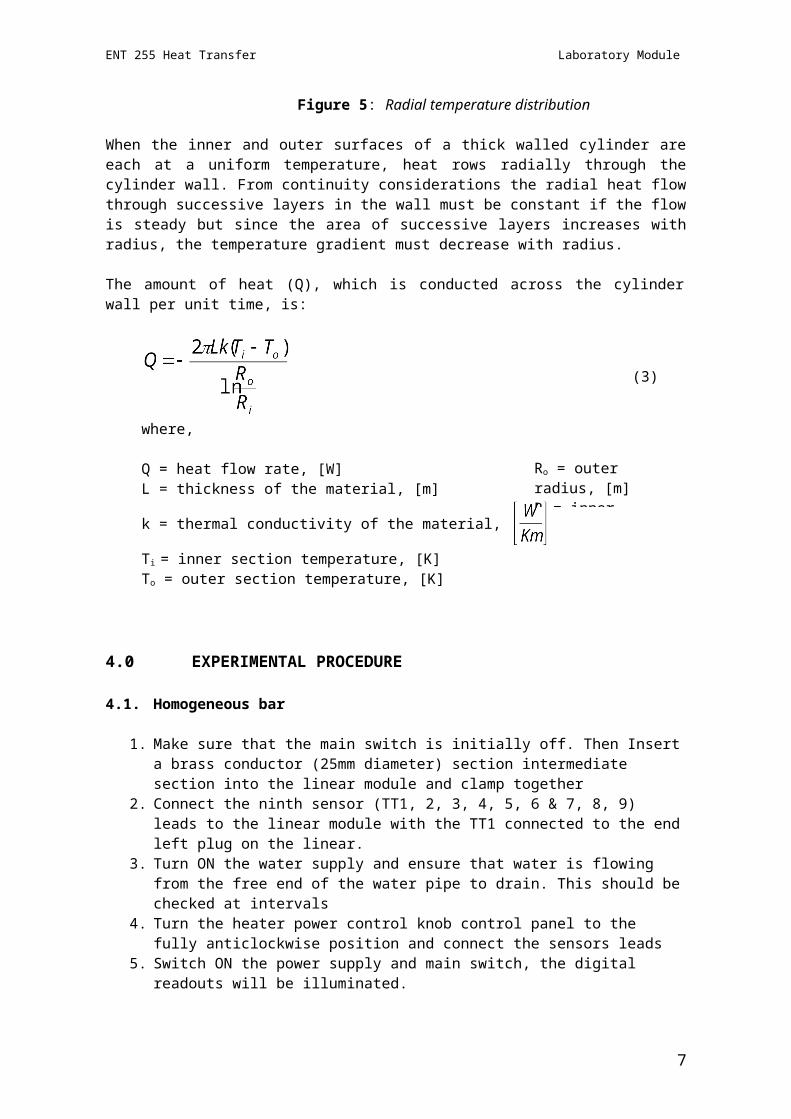
Figure 5: Radial temperature distribution
When the inner and outer surfaces of a thick walled cylinder are each at a uniform temperature, heat rows radially through the cylinder wall. From continuity considerations the radial heat flow through successive layers in the wall must be constant if the flow is
5
AC
QAH
XH XS XC
ACAC
Ri Ro
Temperature Distribution
Ri Ro
Ti
To
ENT 255 Heat Transfer Laboratory Module
steady but since the area of successive layers increases with radius, the temperature gradient must decrease with radius.
The amount of heat (Q), which is conducted across the cylinder wall per unit time, is:
(3)
where,
Q = heat flow rate, [W] L = thickness of the material, [m]
k = thermal conductivity of the material,
Ti = inner section temperature, [K]To = outer section temperature, [K]
4.0 EXPERIMENTAL PROCEDURE
4.1. Homogeneous bar
1. Make sure that the main switch is initially off. Then Insert a brass conductor (25mm diameter) section intermediate section into the linear module and clamp together
2. Connect the ninth sensor (TT1, 2, 3, 4, 5, 6 & 7, 8, 9) leads to the linear module with the TT1 connected to the end left plug on the linear.
3. Turn ON the water supply and ensure that water is flowing from the free end of the water pipe to drain. This should be checked at intervals
4. Turn the heater power control knob control panel to the fully anticlockwise position and connect the sensors leads
5. Switch ON the power supply and main switch, the digital readouts will be illuminated.
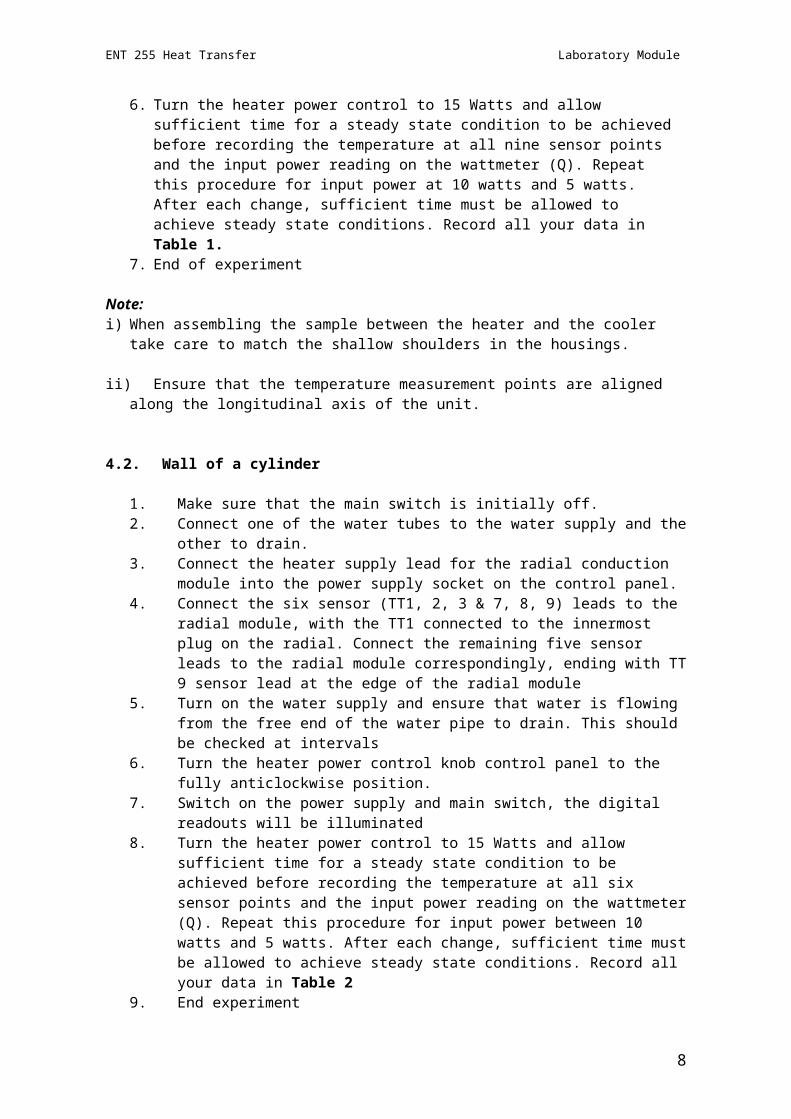
6. Turn the heater power control to 15 Watts and allow sufficient time for a steady state condition to be achieved before recording the temperature at all nine sensor points and the input power reading on the wattmeter (Q). Repeat this procedure for input power at 10 watts and 5 watts. After each change, sufficient time must be allowed to achieve steady state conditions. Record all your data in Table 1.
7. End of experiment
Note:i) When assembling the sample between the heater and the cooler take care to match
the shallow shoulders in the housings.
ii) Ensure that the temperature measurement points are aligned along the longitudinal axis of the unit.
4.2. Wall of a cylinder
1. Make sure that the main switch is initially off.2. Connect one of the water tubes to the water supply and the other to drain.
6
Ro = outer radius, [m]Ri = inner radius, [m]
ENT 255 Heat Transfer Laboratory Module
3. Connect the heater supply lead for the radial conduction module into the power supply socket on the control panel.
4. Connect the six sensor (TT1, 2, 3 & 7, 8, 9) leads to the radial module, with the TT1 connected to the innermost plug on the radial. Connect the remaining five sensor leads to the radial module correspondingly, ending with TT 9 sensor lead at the edge of the radial module
5. Turn on the water supply and ensure that water is flowing from the free end of the water pipe to drain. This should be checked at intervals
6. Turn the heater power control knob control panel to the fully anticlockwise position.
7. Switch on the power supply and main switch, the digital readouts will be illuminated
8. Turn the heater power control to 15 Watts and allow sufficient time for a steady state condition to be achieved before recording the temperature at all six sensor points and the input power reading on the wattmeter (Q). Repeat this procedure for input power between 10 watts and 5 watts. After each change, sufficient time must be allowed to achieve steady state conditions. Record all your data in Table 2
9. End experiment
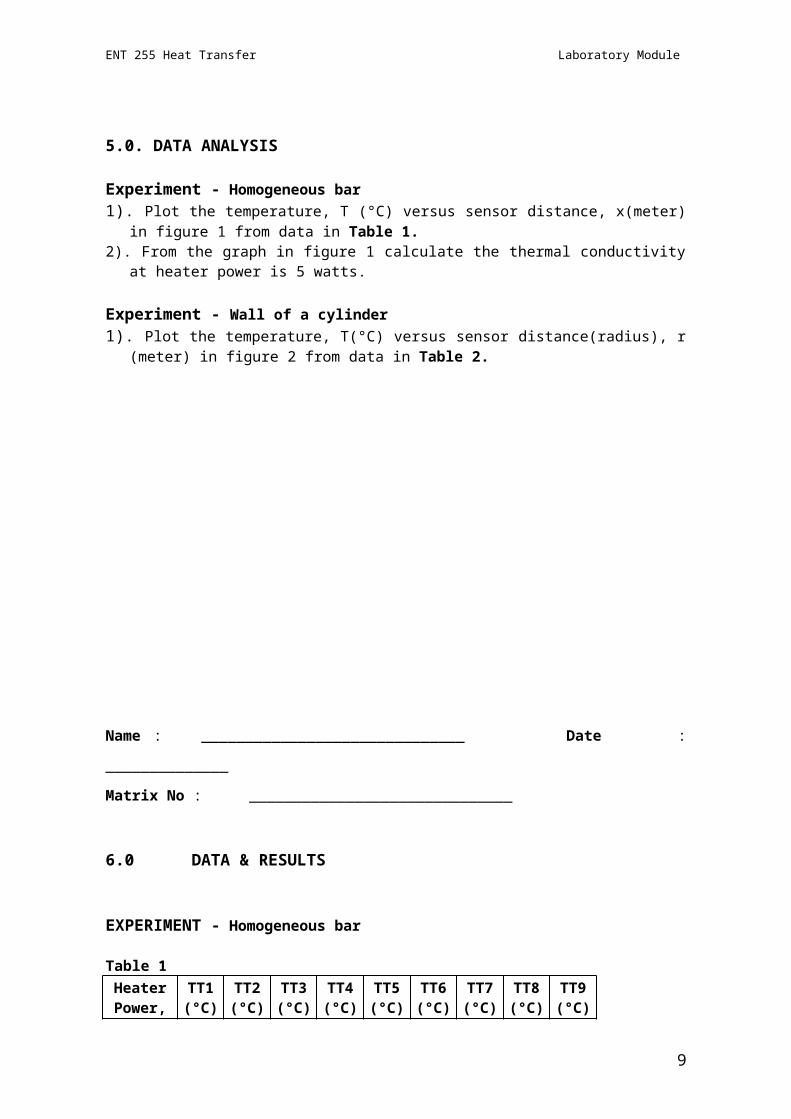
5.0. DATA ANALYSIS
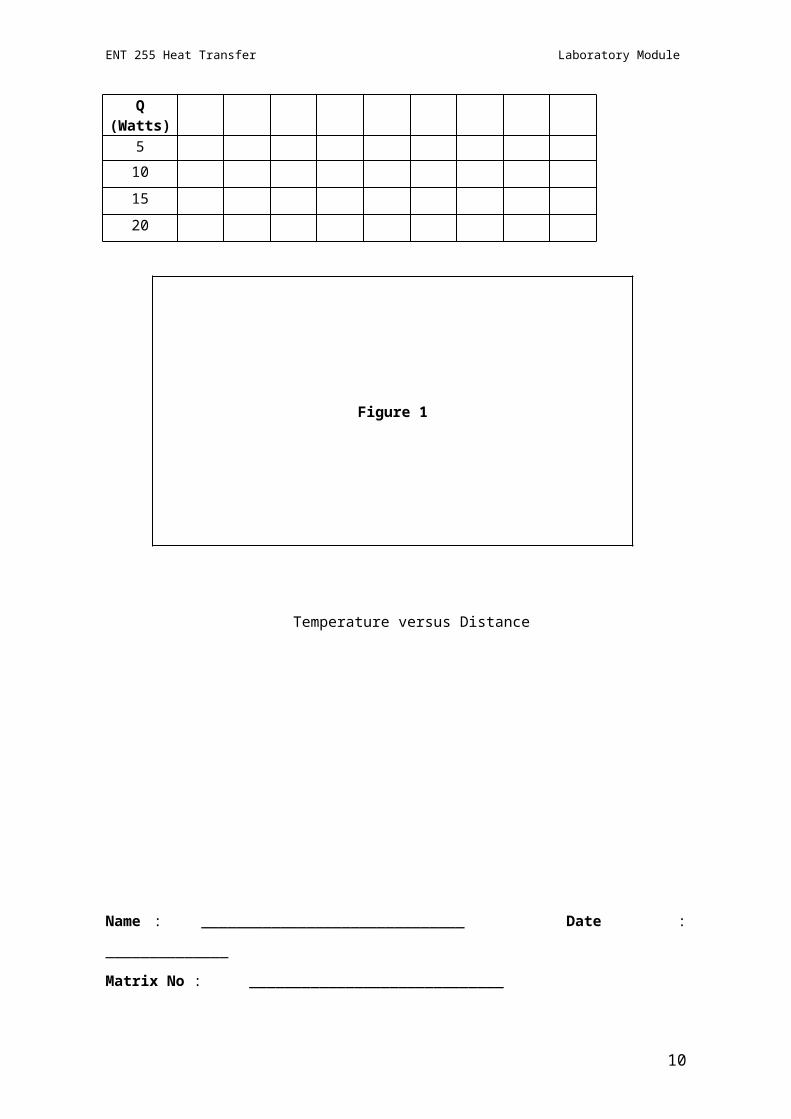
Experiment - Homogeneous bar1). Plot the temperature, T (°C) versus sensor distance, x(meter) in figure 1 from data in
Table 1.2). From the graph in figure 1 calculate the thermal conductivity at heater power is 5
watts.
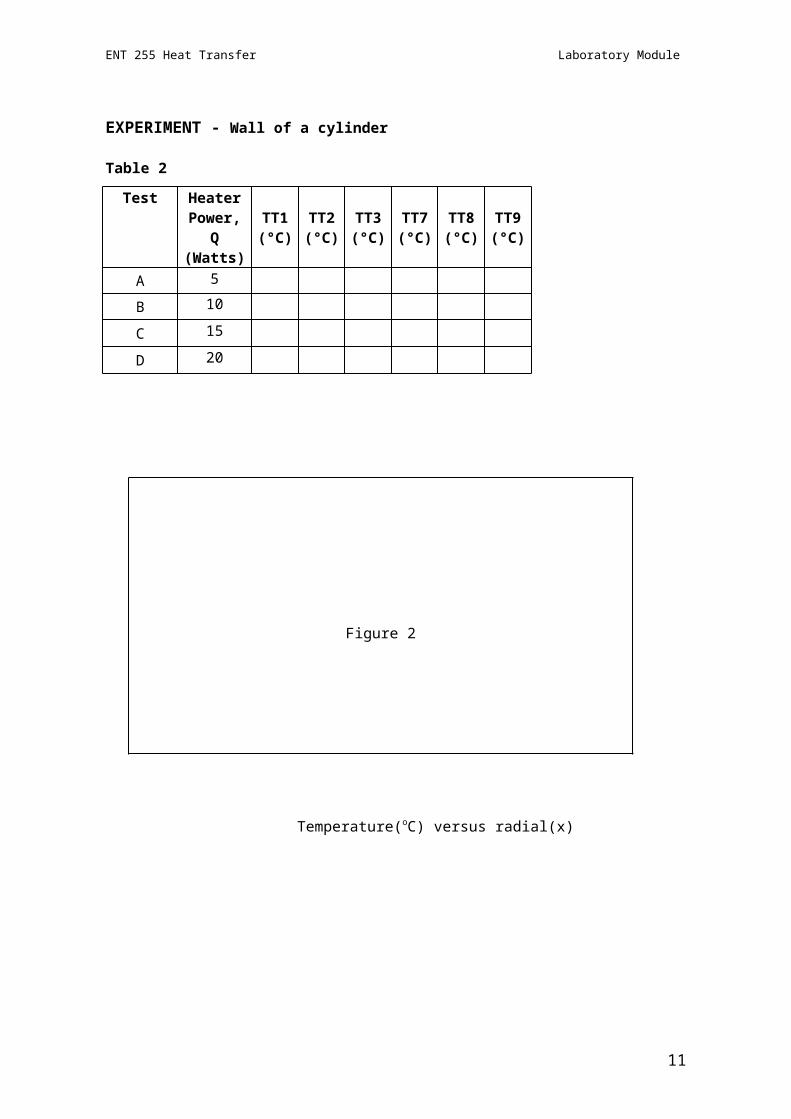
Experiment - Wall of a cylinder1). Plot the temperature, T(°C) versus sensor distance(radius), r (meter) in figure 2 from
data in Table 2.
Name : ______________________________ Date : ______________
Matrix No : ______________________________
7
ENT 255 Heat Transfer Laboratory Module
6.0 DATA & RESULTS
EXPERIMENT - Homogeneous bar
Table 1Heater
Power, Q(Watts)
TT1 (°C)
TT2 (°C)
TT3 (°C)
TT4 (°C)
TT5 (°C)
TT6 (°C)
TT7 (°C)
TT8 (°C)
TT9 (°C)
5
10
15
20
Temperature versus Distance
Name : ______________________________ Date : ______________
Matrix No : _____________________________
8
Figure 1
ENT 255 Heat Transfer Laboratory Module
EXPERIMENT - Wall of a cylinder
Table 2
Temperature(oC) versus radial(x)
Name : ______________________________ Date : ______________
Matrix No : ______________________________
7.0. DISCUSSION / EVALUATION & QUESTION
Test Heater Power, Q(Watts)
TT1 (°C)
TT2 (°C)
TT3 (°C)
TT7 (°C)
TT8 (°C)
TT9 (°C)
A 5
B 10
C 15
D 20
9
Figure 2
ENT 255 Heat Transfer Laboratory Module
7.1. Briefly summarize the key results of each experiment
7.2. Explain the significance of your findings
7.3. Explain any unusual difficulties or problems which may have led to poor results
7.4. Offer suggestions for how the experimental procedure or design could be improved.
7.5. Compare your experimental values with theoretical values given
10
ENT 255 Heat Transfer Laboratory Module
7.6 Define thermal conductivity and explain its significance in heat transfer.
7.7 Refer to Table 1, which would make for better insulation for your home? Explain your answer
Name : ______________________________ Date : ______________
Matrix No : ______________________________
8.0. CONCLUSION(Based on data and discussion, make your overall conclusion by referring to experiment objective)
Material, k(W/m.K)Brick (insulating), 0.15Brick (red), 0.60Concrete, 0.80Glass, 0.80
11
Table 1
ENT 255 Heat Transfer Laboratory Module
The conclusion for this lab is…
12