E L P ASO C OUNTY C OLORADO E L P ASO C OUNTY C OLORADO 2012 Budget Report Monthly Activity August...
30
EL PASO COUNTY COLORADO EL PASO COUNTY COLORADO 2012 Budget Report Monthly Activity August 2012 Nicola Sapp County Budget Officer October 30, 2012
-
Upload
osborne-griffith -
Category
Documents
-
view
215 -
download
0
Transcript of E L P ASO C OUNTY C OLORADO E L P ASO C OUNTY C OLORADO 2012 Budget Report Monthly Activity August...

EL PASO
COUNTY
COLORADO
EL PASO
COUNTY
COLORADO
2012 Budget Report Monthly Activity
August 2012
Nicola Sapp
County Budget OfficerOctober 30, 2012

Budget Administration 2
Presentation Overview
1. August 2012 Sales & Use Tax Activity
2. August 2012 Activity – Unrestricted (within BoCC Discretion)
- Road & Bridge Fund - Community Investment Fund
- Human Services Fund - Retirement Fund
- Self-Insurance Fund - General Fund (Unrestricted)
3. August 2012 Activity – Restricted
- General Fund (Restricted)
- Conservation Trust Fund - Economic Development
- Pension Trust Fund - Pikes Peak Workforce Center
- Schools’ Trust Fund - Land Improvement Districts
- Household Hazardous Waste Management

Budget Administration 3
Sales & Use Tax Activity August 2012

Budget Administration 4
Historical Sales Tax Collections August 31, 2012
2007 2008 2009 2010 2011 2012% Chg
'07 to '08% Chg
'08 to '09% Chg
'09 to '10% Chg
'10 to '11% Chg
'11 to '12
Cumulative % Chg
'07 to '12
Cumulative % Chg
'11 to '12
January 4,669,476 4,638,369 4,325,250 4,297,569 4,303,519 4,876,907 (0.67%) (6.75%) (0.64%) 0.14% 13.32% 4.44% 13.32%
February 4,780,698 4,852,133 4,393,823 4,570,811 4,891,936 5,145,735 1.49% (9.45%) 4.03% 7.03% 5.19% 6.06% 9.00%
March 5,381,750 5,442,730 4,921,391 5,165,463 5,441,771 5,220,265 1.13% (9.58%) 4.96% 5.35% (4.07%) 2.77% 4.14%
April 5,126,774 5,240,216 4,547,331 4,882,977 5,345,941 6,007,132 2.21% (13.22%) 7.38% 9.48% 12.37% 6.47% 6.34%
May 5,341,924 5,549,282 5,193,361 5,387,615 5,485,436 5,948,483 3.88% (6.41%) 3.74% 1.82% 8.44% 7.50% 6.79%
June 5,982,211 5,937,739 5,604,199 5,625,441 5,961,361 6,137,511 (0.74%) (5.62%) 0.38% 5.97% 2.95% 6.56% 6.06%
July 5,661,302 5,630,748 5,298,458 5,535,362 5,810,745 6,047,484 (0.54%) (5.90%) 4.47% 4.97% 4.07% 6.60% 5.75%
August 5,656,019 5,705,099 5,424,865 5,642,651 5,645,162 6,228,580 0.87% (4.91%) 4.01% 0.04% 10.33% 7.07% 6.36%
September 5,762,129 5,429,489 5,121,831 5,495,533 5,630,597 (5.77%) (5.67%) 7.30% 2.46%
October 5,292,976 5,075,261 4,861,809 5,355,120 5,204,346 (4.11%) (4.21%) 10.15% (2.82%)
November 5,197,507 4,917,786 4,753,762 5,166,106 5,250,686 (5.38%) (3.34%) 8.67% 1.64%
December 6,487,768 5,769,281 5,940,631 6,294,203 6,362,471 (11.07%) 2.97% 5.95% 1.08%
Year Total 65,340,533 64,188,132 60,386,710 63,418,851 65,333,971 45,612,097 (1.76%) (5.92%) 5.02% 3.02% 6.36% 7.07% 6.36%

Budget Administration 5
Sales Tax – Budget to Actual August 31, 2012
Budget Actual
$ Chg Budget
to Actual
% Chg Budget
to ActualCumulative
% Chg
January 4,537,302 4,876,907 339,605 7.48% 7.48%
February 4,877,600 5,145,735 268,135 5.50% 6.46%
March 5,498,143 5,220,265 (277,878) (5.05%) 2.21%
April 5,444,763 6,007,132 562,369 10.33% 4.38%
May 5,671,628 5,948,483 276,855 4.88% 4.49%
June 6,085,323 6,137,511 52,188 0.86% 3.80%
July 5,851,785 6,047,484 195,698 3.34% 3.73%
August 5,765,043 6,228,580 463,537 8.04% 4.30%
September 5,785,060
October 5,338,003
November 5,304,640
December 6,565,743
66,725,033 45,612,097 1,880,510 4.30%

Budget Administration 6
Historical Use Tax on Automobiles September 30, 2012
2007 2008 2009 2010 2011 2012% Chg
'07 to '08% Chg
'08 to '09% Chg
'09 to '10% Chg
'10 to '11% Chg
'11 to '12
Cumulative % Chg
'07 to '12
Cumulative % Chg
'11 to '12
January 244,815 255,310 187,112 171,793 196,649 288,490 4.29% (26.71%) (8.19%) 14.47% 46.70% 17.84% 46.70%
February 216,415 236,292 169,657 179,168 183,458 234,169 9.18% (28.20%) 5.61% 2.39% 27.64% 13.32% 37.50%
March 286,629 254,175 206,324 215,666 251,491 237,551 (11.32%) (18.83%) 4.53% 16.61% (5.54%) 1.65% 20.36%
April 259,063 279,488 216,521 218,239 249,748 240,993 7.88% (22.53%) 0.79% 14.44% (3.51%) (0.57%) 13.60%
May 274,512 268,159 194,514 225,040 253,778 266,069 (2.31%) (27.46%) 15.69% 12.77% 4.84% (1.11%) 11.64%
June 281,338 246,866 241,688 254,494 262,390 284,740 (12.25%) (2.10%) 5.30% 3.10% 8.52% (0.69%) 11.06%
July 271,907 278,361 227,658 254,623 231,293 284,327 2.37% (18.21%) 11.84% (9.16%) 22.93% 0.09% 12.74%
August 322,707 254,032 228,525 249,370 297,198 287,767 (21.28%) (10.04%) 9.12% 19.18% (3.17%) (1.54%) 10.29%
September 249,456 221,167 216,996 231,897 238,388 280,472 (11.34%) (1.89%) 6.87% 2.80% 17.65% (0.09%) 11.10%
October 275,186 217,338 233,228 228,775 237,170 (21.02%) 7.31% (1.91%) 3.67%
November 218,546 167,163 216,913 204,419 207,330 (23.51%) 29.76% (5.76%) 1.42%
December 176,519 170,225 221,998 200,501 219,099 (3.57%) 30.41% (9.68%) 9.28%
Year Total 3,077,092 2,848,576 2,561,135 2,633,983 2,827,992 2,404,577 (7.43%) (10.09%) 2.84% 7.37% 11.10% (0.09%) 11.10%

Budget Administration 7
Use Tax on Automobiles – Budget to Actual September 30, 2012
Budget Actual$ Chg Budget
to Actual
% Chg Budget to
ActualCumulative
% Chg
January 213,051 288,490 75,440 35.41% 35.41%
February 189,152 234,169 45,018 23.80% 29.95%
March 260,557 237,551 (23,007) (8.83%) 14.70%
April 259,974 240,993 (18,982) (7.30%) 8.50%
May 261,432 266,069 4,637 1.77% 7.02%
June 270,467 284,740 14,273 5.28% 6.69%
July 244,236 284,327 40,091 16.41% 8.09%
August 276,004 287,767 11,763 4.26% 7.56%
September 246,859 280,472 33,613 13.62% 8.23%
October 253,271
November 213,634
December 225,875
2,914,511 2,404,577 182,846 8.23%

Budget Administration 8
Historical Use Tax on Building Materials September 30, 2012
2007 2008 2009 2010 2011 2012% Chg
'07 to '08% Chg
'08 to '09% Chg
'09 to '10% Chg
'10 to '11% Chg
'11 to '12
Cumulative % Chg
'07 to '12
Cumulative % Chg
'11 to '12
January 63,661 94,488 55,915 86,658 47,274 32,915 48.43% (40.82%) 54.98% (45.45%) (30.37%) (48.30%) (30.37%)
February 30,820 34,628 34,219 94,234 69,279 39,844 12.36% (1.18%) 175.39% (26.48%) (42.49%) (22.99%) (37.57%)
March 31,880 54,412 41,327 99,913 74,063 90,379 70.68% (24.05%) 141.76% (25.87%) 22.03% 29.11% (14.42%)
April 71,747 49,770 84,550 118,571 40,858 114,578 (30.63%) 69.88% 40.24% (65.54%) 180.43% 40.18% 19.98%
May 48,055 39,439 168,216 86,094 53,149 118,467 (17.93%) 326.52% (48.82%) (38.27%) 122.90% 60.94% 39.20%
June 58,416 41,514 672,453 75,296 81,145 153,708 (28.93%) 1519.80% (88.80%) 7.77% 89.42% 80.54% 50.34%
July 60,108 62,439 107,508 61,711 69,486 130,495 3.88% 72.18% (42.60%) 12.60% 87.80% 86.57% 56.32%
August 64,075 45,443 109,762 101,280 113,510 167,620 (29.08%) 141.54% (7.73%) 12.08% 47.67% 97.78% 54.53%
September 54,510 45,828 80,170 90,823 77,896 88,192 (15.93%) 74.94% 13.29% (14.23%) 13.22% 93.72% 49.39%
October 80,458 62,829 146,308 120,567 123,400 (21.91%) 132.86% (17.59%) 2.35%
November 52,344 52,612 81,976 101,205 86,634 0.51% 55.81% 23.46% (14.40%)
December 38,112 39,100 112,409 88,404 19,763 2.59% 187.49% (21.35%) (77.64%)
Year Total 654,185 622,505 1,694,813 1,124,758 856,458 936,198 (4.84%) 172.26% (33.64%) (23.85%) 49.39% 93.72% 49.39%
Budget Administration 9
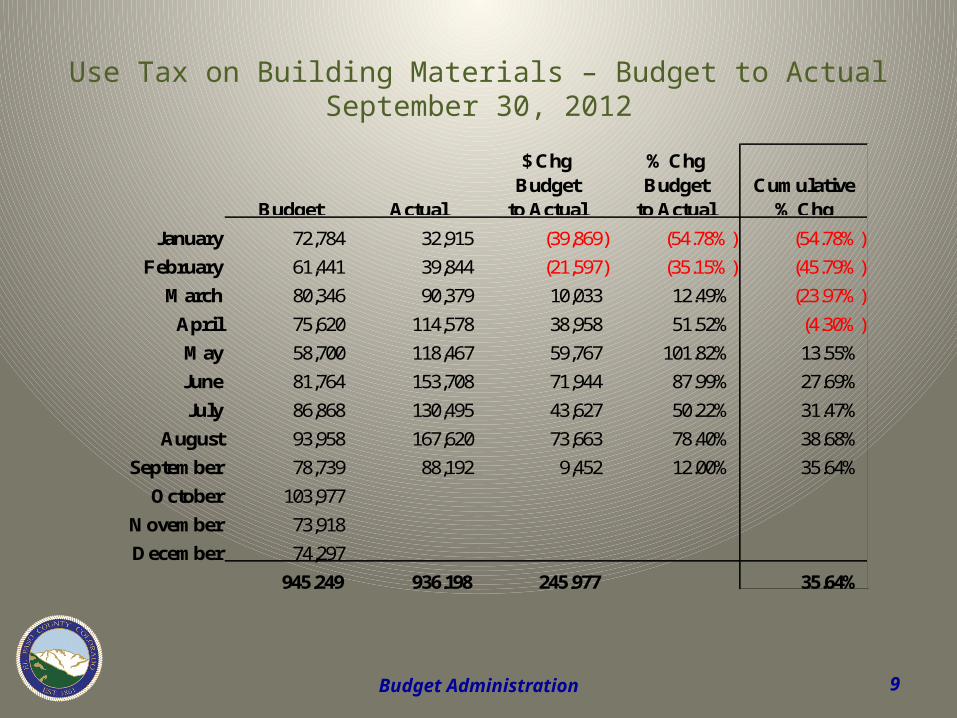
Use Tax on Building Materials – Budget to Actual September 30, 2012
Budget Actual
$ Chg Budget
to Actual
% Chg Budget
to ActualCumulative
% Chg
January 72,784 32,915 (39,869) (54.78%) (54.78%)
February 61,441 39,844 (21,597) (35.15%) (45.79%)
March 80,346 90,379 10,033 12.49% (23.97%)
April 75,620 114,578 38,958 51.52% (4.30%)
May 58,700 118,467 59,767 101.82% 13.55%
June 81,764 153,708 71,944 87.99% 27.69%
July 86,868 130,495 43,627 50.22% 31.47%
August 93,958 167,620 73,663 78.40% 38.68%
September 78,739 88,192 9,452 12.00% 35.64%
October 103,977
November 73,918
December 74,297
945,249 936,198 245,977 35.64%

Budget Administration 10
Historical Sales & Use Tax (all components) August 31, 2012
2007 2008 2009 2010 2011 2012% Chg
'07 to '08% Chg
'08 to '09% Chg
'09 to '10% Chg
'10 to '11% Chg
'11 to '12
Cumulative % Chg
'07 to '12
Cumulative % Chg
'11 to '12
January 4,977,952 4,988,167 4,568,277 4,556,020 4,547,442 5,198,313 0.21% (8.42%) (0.27%) (0.19%) 14.31% 4.43% 14.31%
February 5,027,933 5,123,053 4,597,699 4,844,213 5,144,673 5,419,748 1.89% (10.25%) 5.36% 6.20% 5.35% 6.12% 9.55%
March 5,700,258 5,751,318 5,169,042 5,481,042 5,767,325 5,548,195 0.90% (10.12%) 6.04% 5.22% (3.80%) 2.93% 4.57%
April 5,457,584 5,569,474 4,848,402 5,219,788 5,636,547 6,362,702 2.05% (12.95%) 7.66% 7.98% 12.88% 6.45% 6.79%
May 5,664,491 5,856,880 5,556,091 5,698,749 5,792,363 6,333,019 3.40% (5.14%) 2.57% 1.64% 9.33% 7.58% 7.34%
June 6,321,965 6,226,119 6,518,340 5,955,231 6,304,896 6,575,959 (1.52%) 4.69% (8.64%) 5.87% 4.30% 6.90% 6.76%
July 5,993,317 5,971,549 5,633,625 5,851,696 6,111,524 6,462,306 (0.36%) (5.66%) 3.87% 4.44% 5.74% 7.04% 6.60%
August 6,042,801 6,004,574 5,763,153 5,993,301 6,055,870 6,683,968 (0.63%) (4.02%) 3.99% 1.04% 10.37% 7.52% 7.11%
September 6,066,094 5,696,484 5,418,996 5,818,253 5,946,881 (6.09%) (4.87%) 7.37% 2.21%
October 5,648,619 5,355,428 5,241,345 5,704,461 5,564,916 (5.19%) (2.13%) 8.84% (2.45%)
November 5,468,396 5,137,560 5,052,651 5,471,730 5,544,650 (6.05%) (1.65%) 8.29% 1.33%
December 6,702,399 5,978,606 6,275,038 6,583,108 6,601,333 (10.80%) 4.96% 4.91% 0.28%
Year Total 69,071,810 67,659,213 64,642,658 67,177,592 69,018,421 48,584,209 (2.05%) (4.46%) 3.92% 4.04% 7.11% 7.52% 7.11%

Budget Administration 11
Sales & Use Tax (all components)Budget to Actual – August 2012
Budget Actual
$ Chg Budget
to Actual
% Chg Budget
to ActualCumulative
% Chg
January 4,823,137 5,198,313 375,176 7.78% 7.78%
February 5,128,193 5,419,748 291,555 5.69% 6.70%
March 5,839,046 5,548,195 (290,851) (4.98%) 2.38%
April 5,780,357 6,362,702 582,345 10.07% 4.44%
May 5,991,759 6,333,019 341,260 5.70% 4.71%
June 6,440,389 6,575,959 135,570 2.10% 4.22%
July 6,182,890 6,462,306 279,416 4.52% 4.27%
August 6,135,005 6,683,968 548,963 8.95% 4.89%
September 6,110,659
October 5,695,251
November 5,592,192
December 6,865,914
70,584,792 48,584,209 2,263,433 4.89%

Budget Administration 12
Sales & Use Tax (all components)Budget to Actual – August 2012
4,823,137
5,128,193
5,839,046
5,780,357 5,991,759
6,440,389 6,182,890
6,135,005 6,110,659
5,695,251
5,592,192
6,865,914
5,198,3137.78%
5,419,7485.69%
5,548,194(4.98%)
6,362,70210.07%
6,333,0195.70%
6,575,9592.10% 6,462,306
4.52%
6,683,9688.95%
$3,400,000
$3,800,000
$4,200,000
$4,600,000
$5,000,000
$5,400,000
$5,800,000
$6,200,000
$6,600,000
$7,000,000
$7,400,000
Jan Feb Mar Apr May Jun Jul Aug Sep Oct Nov Dec
Budget Actual
Budget Administration 13
Unrestricted Funds August 2012

Budget Administration 14
August 2012 – Road & Bridge2012
Revenues: Budget Actual Variance Budget
Property Tax 1,107,470 1,112,328 4,858 1,131,226Highway User Tax 6,238,100 6,601,675 363,575 11,000,000Specific Ownership Tax 2,463,904 2,038,016 (425,888) 3,669,800Federal Grant Projects 268,315 268,315 0 858,381Fees & Charges for Services 498,101 574,134 76,033 831,000Sales of Capital Assets 0 0 0 0Other Taxes, Mineral Leasing and PILT 436,877 356,950 (79,927) 655,315
Total Revenues 11,012,767 10,951,418 (61,349) 18,145,722
Expenditures:Personnel - R&B, Fleet 6,681,252 6,784,846 (103,594) 10,218,386Operating - Administration 269,393 86,434 182,959 462,875Operating - Diesel 933,048 883,026 50,022 1,603,175Operating - Engineering 384,055 144,288 239,767 659,888Operating - Gasoline 255,498 305,469 (49,971) 439,000Operating - Highway 705,920 956,718 (250,798) 1,212,921
Operating - Resource Management 345,478 337,126 8,352 593,605Operating - Shop Supplies & Commodities 1,091,550 1,154,187 (62,637) 1,875,515Fleet Capital 345,562 345,562 0 389,201BoCC Projects 687,757 687,757 0 2,405,809Federal Projects 284,154 284,154 0 717,232
Total Expenditures 11,983,667 11,969,567 14,100 20,577,607
Net Impact to Fund Balance (970,900) (1,018,149) (47,249) (2,431,885)
2012 Beginning Fund Balance 3,938,570Less: Restricted Funds and Cash Flow (1,506,685)
Budgeted Change in Fund Balance (2,431,885)2012 Estimated Ending Fund Balance 0
As of August 31, 2012

Budget Administration 15
August 2012 – Human Services2012
Revenues: Budget Actual Variance Budget
Sales Tax 13,497,287 13,497,287 0 15,997,101Federal & State Revenue 19,558,874 20,179,659 620,785 43,298,999Senior Center 115,933 115,933 0 173,900Donations 1,370 1,370 0 30,000
Total Revenues 33,173,464 33,794,249 620,785 59,500,000
Expenditures:Personnel 17,825,771 18,101,669 (275,898) 27,262,944Operating 17,099,074 16,319,812 779,262 28,737,056Capital 0 0 0 0
Total Expenditures 34,924,845 34,421,481 503,364 56,000,000
Net Impact to Fund Balance (1,751,381) (627,232) 1,124,149 3,500,000
2012 Beginning Fund Balance 425,385Budgeted Change in Fund Balance 3,500,000
Less: Cash Flow (3,925,385)2012 Estimated Ending Fund Balance 0
As of August 31, 2012

Budget Administration 16
August 2012 – Self Insurance2012
Revenues: Budget Actual Variance Budget
Employer Contribution 4,476,483 3,984,579 (491,904) 8,178,724Employee Contribution 4,166,667 4,335,606 168,939 6,250,000Fees & Charges for Services 66,667 91,143 24,476 100,000
Total Revenues 8,709,816 8,411,328 (298,488) 14,528,724
Expenditures:Risk & Worker's Compensation 1,685,581 1,852,235 (166,654) 2,640,000Health Insurance 11,281,062 11,523,064 (242,002) 17,345,508Dental Insurance 1,167,058 938,260 228,798 1,750,444Flex Spending 683,483 683,483 0 1,000,000Short Term Disability 101,485 143,504 (42,019) 150,000Unempl., Long Term Disab., Life 428,463 367,377 61,086 716,195
Total Expenditures 15,347,132 15,507,922 (160,790) 23,602,147
Net Impact to Fund Balance (6,637,316) (7,096,594) (459,278) (9,073,423)
2012 Beginning Fund Balance 16,133,423Budgeted Change in Fund Balance (9,073,423)
Less: Health Trust Reserve (4,000,000)Less: Worker's Comp/Building Insurance Reserve (860,000)
Less: HSA/Wellness Reserve (2,200,000)2012 Estimated Ending Fund Balance 0
As of August 31, 2012
Budget Administration 17
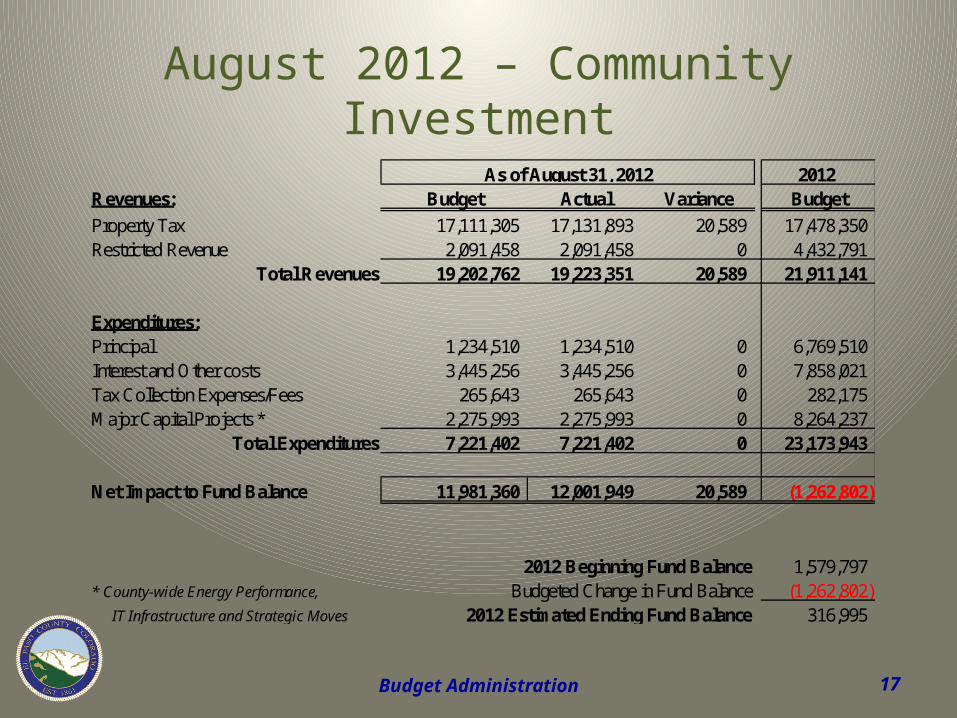
August 2012 – Community Investment2012
Revenues: Budget Actual Variance Budget
Property Tax 17,111,305 17,131,893 20,589 17,478,350Restricted Revenue 2,091,458 2,091,458 0 4,432,791
Total Revenues 19,202,762 19,223,351 20,589 21,911,141
Expenditures:Principal 1,234,510 1,234,510 0 6,769,510Interest and Other costs 3,445,256 3,445,256 0 7,858,021Tax Collection Expenses/Fees 265,643 265,643 0 282,175Major Capital Projects * 2,275,993 2,275,993 0 8,264,237
Total Expenditures 7,221,402 7,221,402 0 23,173,943
Net Impact to Fund Balance 11,981,360 12,001,949 20,589 (1,262,802)
2012 Beginning Fund Balance 1,579,797* County-wide Energy Performance, Budgeted Change in Fund Balance (1,262,802) IT Infrastructure and Strategic Moves 2012 Estimated Ending Fund Balance 316,995
As of August 31, 2012

Budget Administration 18
August 2012 – Retirement2012
Revenues: Budget Actual Variance Budget
Property Tax 5,655,619 5,669,404 13,785 5,776,935Internal Direct Bills 1,593,997 1,243,055 (350,941) 2,390,995
Total Revenues 7,249,616 6,912,459 (337,157) 8,167,930
Expenditures:Personnel 5,423,709 5,020,947 402,762 8,295,084Tax Collection Expenses/Fees 84,775 85,141 (366) 86,654
Total Expenditures 5,508,484 5,106,088 402,396 8,381,738
Net Impact to Fund Balance 1,741,132 1,806,371 65,239 (213,808)
2012 Beginning Fund Balance 1,223,458Budgeted Change in Fund Balance (213,808)
Less: Cash Flow (830,000)2012 Ending Fund Balance 179,650
As of August 31, 2012

Budget Administration 19
August 2012 – General Fund (Unrestricted)2012
Revenues: Budget Actual Variance Budget
Property Tax 17,605,754 17,594,387 (11,368) 17,983,406Sales and Use Tax Collections 42,571,499 44,834,932 2,263,433 54,588,103 Sales and Use Tax Audit Adjustments 0 (66,835) (66,835) 0Specific Ownership Tax 666,667 666,667 0 1,000,000Other Taxes 113,843 252,258 138,415 155,000Intergovernmental 547,243 1,043,640 496,397 1,359,609Fees & Charges for Services 99,399 204,902 105,504 170,700Traffic Fines 246,365 166,594 (79,771) 350,000Assessor Fees 26,886 26,210 (676) 30,000Clerk & Recorder Fees 5,257,294 6,446,885 1,189,592 8,668,250Coroner Fees 174,840 196,840 22,001 380,500Sheriff Fees 659,817 692,028 32,212 1,303,213Treasurer Fees 2,781,497 2,892,839 111,343 3,144,000Public Trustee Fees 23,465 28,919 5,454 650,000Development Services Fees 533,333 761,374 228,040 800,000Park & Recreation Fees 437,895 462,873 24,979 502,000Parking Fees 166,414 147,751 (18,663) 244,690Interest on Investments 0 63,612 63,612 0Rent Collections 67,452 60,684 (6,768) 105,609Internal Direct Bills 472,657 472,657 0 1,201,349Miscellaneous Revenue 40,445 118,807 78,362 114,900
Total Revenues 72,492,763 77,068,025 4,575,262 92,751,329
As of August 31, 2012

Budget Administration 20
August 2012 – General Fund (Unrestricted)
2012Budget Actual Variance Budget
Total Revenues 72,492,763 77,068,025 4,575,262 92,751,329
Expenditures:Personnel 48,321,399 48,240,060 81,339 73,903,316Other Operating 20,805,246 17,248,013 3,557,233 31,456,375Capital 1,608,631 1,608,631 0 2,868,205Transfers Out 24,671 10,000 14,671 37,007
Total Expenditures 70,759,948 67,106,705 3,653,243 108,264,903
Net Impact to Fund Balance 1,732,816 9,961,321 8,228,505 (15,513,574)
2012 Beginning Fund Balance 32,862,225Budgeted Change in Fund Balance (15,518,474)
Less: Restricted Fund Balance/Cash Flow (9,910,228)Less: Transfer of Road & Bridge (1,950,000)
Less: TABOR Reserve (2,097,282)Remaining Operational Reserve (3,386,241)
2012 Estimated Ending Fund Balance 0
As of August 31, 2012

Budget Administration 21
Restricted Funds August 2012

Budget Administration 22
August 2012 – General Fund (Restricted)
2012Revenues: Budget Actual Variance Budget
Restricted Fees & Charges for Services 4,422,046 4,358,720 (63,325) 6,483,938Intergovernmental - Federal 519,667 1,513,237 993,571 761,975Intergovernmental - State 5,425,024 6,206,594 781,570 7,954,580
Total Revenues 10,366,736 12,078,552 1,711,815 15,200,493
Expenditures:Personnel 4,179,310 4,077,937 101,373 6,391,886Operating 5,510,258 4,520,720 989,538 11,644,916Capital 2,142,378 2,142,378 0 2,467,508Transfers 0 0 0 734,732
Total Expenditures 11,831,946 10,741,036 1,090,910 21,239,042
Net Impact to Fund Balance (1,465,210) 1,337,516 2,802,726 (6,038,549)
2012 Beginning Fund Balance 9,699,226Budgeted Change in Fund Balance (6,033,649)
Less: TABOR Reserve (3,267,524)2012 Estimated Ending Fund Balance 398,053
As of August 31, 2012

Budget Administration 23
August 2012 – Conservation Trust Fund
2012Revenues: Budget Actual Variance Budget
Intergovernmental (GOCO) 602,880 681,893 79,013 1,200,000Interest on Investments 6,565 229 (6,336) 10,000
Total Revenues 609,445 682,122 72,677 1,210,000
Expenditures:Personnel 651,902 751,814 (99,912) 997,027Operating 96,292 124,891 (28,599) 239,950Capital 0 0 0 0Transfer to Retirement 0 0 0 44,525
Total Expenditures 748,194 876,705 (128,511) 1,281,502
Net Impact to Fund Balance (138,749) (194,583) (55,833) (71,502)
2012 Beginning Fund Balance 581,066Budgeted Change in Fund Balance (71,502)
2012 Estimated Ending Fund Balance 509,564
As of August 31, 2012
Budget Administration 24
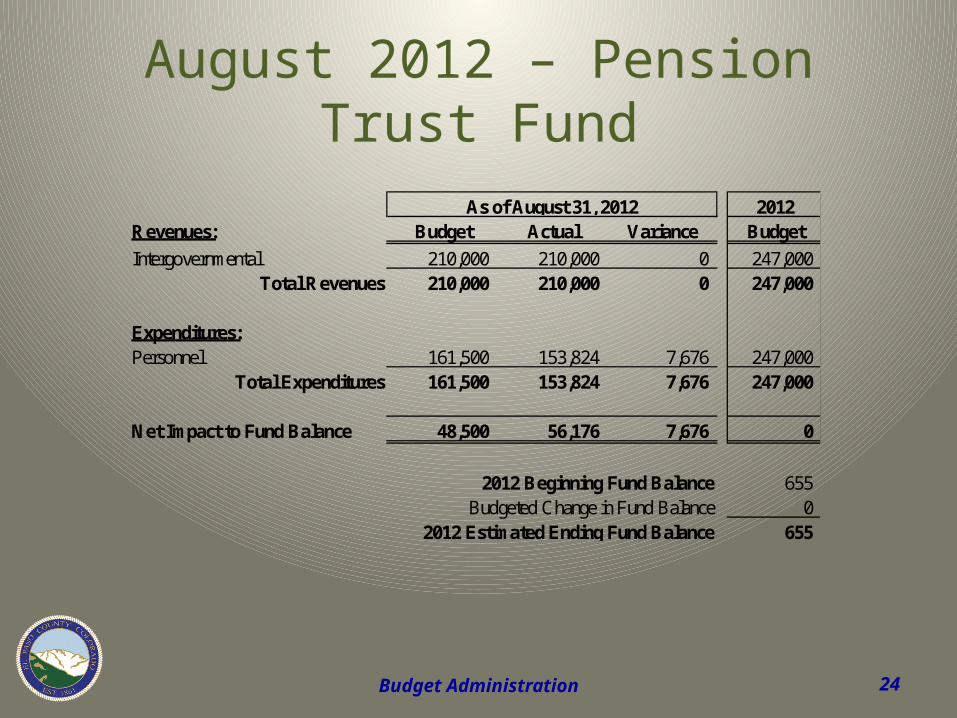
August 2012 – Pension Trust Fund
2012Revenues: Budget Actual Variance Budget
Intergovernmental 210,000 210,000 0 247,000Total Revenues 210,000 210,000 0 247,000
Expenditures:Personnel 161,500 153,824 7,676 247,000
Total Expenditures 161,500 153,824 7,676 247,000
Net Impact to Fund Balance 48,500 56,176 7,676 0
2012 Beginning Fund Balance 655Budgeted Change in Fund Balance 0
2012 Estimated Ending Fund Balance 655
As of August 31, 2012

Budget Administration 25
August 2012 – Schools’ Trust Fund
2012Revenues: Budget Actual Variance Budget
Intergovernmental 66,667 42,747 (23,920) 100,000Total Revenues 66,667 42,747 (23,920) 100,000
Expenditures:Operating 0 0 0 100,000
Total Expenditures 0 0 0 100,000
Net Impact to Fund Balance 66,667 42,747 (23,920) 0
2012 Beginning Fund Balance 39,810Budgeted Change in Fund Balance 0
2012 Ending Fund Balance 39,810
As of August 31, 2012

Budget Administration 26
August 2012 – Household Hazardous Waste Management
2012Revenues: Budget Actual Variance Budget
Tipping Fees 439,803 432,065 (7,738) 931,392Interest on Investments 1,171 124 (1,047) 1,800Scrap Metal Recycling 0 9,595 9,595 0State Revenue 0 0 0 0Other Revenue 3,333 8,000 4,667 5,000
Total Revenues 444,308 449,784 5,477 938,192
Expenditures:Personnel 184,389 204,863 (20,473) 282,007Operating 388,651 347,726 40,924 637,237Capital 0 0 0 0Transfers 0 0 0 18,948
Total Expenditures 573,040 552,589 20,451 938,192
Net Impact to Fund Balance (128,733) (102,805) 25,928 0
2012 Beginning Fund Balance 436,378Budgeted Change in Fund Balance 0
2012 Estimated Ending Fund Balance 436,378
As of August 31, 2012

Budget Administration 27
August 2012– Economic Development
2012Revenues: Budget Actual Variance Budget
Community Development Block Grant 241,190 241,190 0 871,373Enterprise Zone Contributions 2,543,482 2,543,482 0 5,000,000Economic Development Marketing Grant 0 0 0 12,500
Total Revenues 2,784,672 2,784,672 0 5,883,873
Expenditures:
Community Development Block Grant 255,710 255,710 0 871,373
Enterprise Zone Contributions and Support 2,766,721 2,766,721 0 5,021,250Total Expenditures 3,022,431 3,022,431 0 5,892,623
Net Impact to Fund Balance (237,760) (237,760) 0 (8,750)
2012 Beginning Fund Balance 202,171Budgeted Change in Fund Balance (8,750)
Less: Cash Flow (150,000)2012 Estimated Ending Fund Balance 43,421
As of August 31, 2012
Budget Administration 28
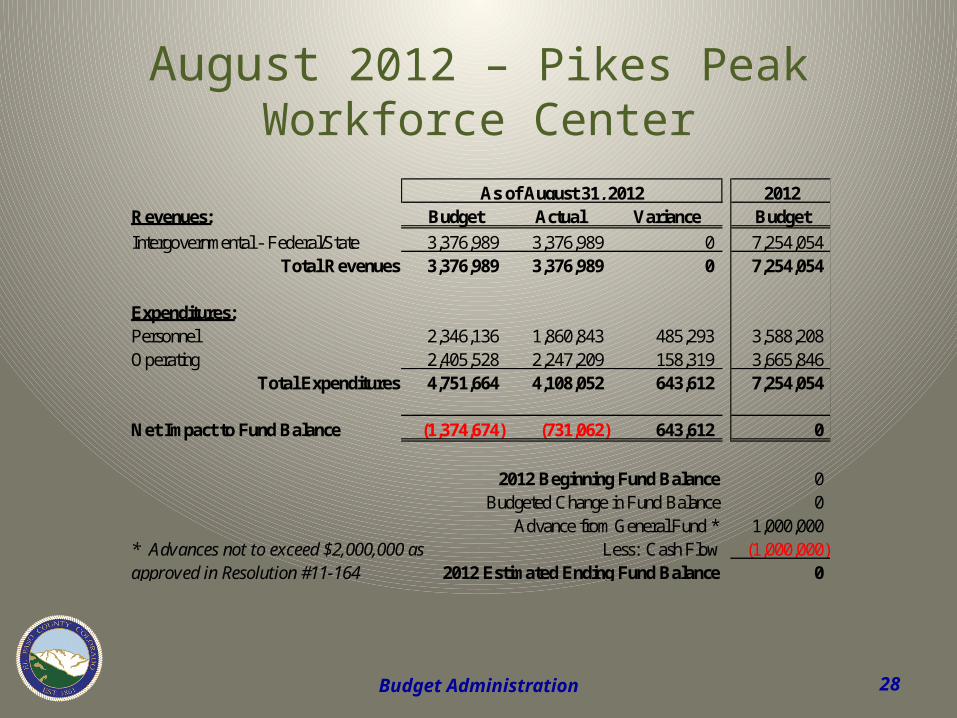
August 2012 – Pikes Peak Workforce Center
2012Revenues: Budget Actual Variance Budget
Intergovernmental - Federal/State 3,376,989 3,376,989 0 7,254,054Total Revenues 3,376,989 3,376,989 0 7,254,054
Expenditures:Personnel 2,346,136 1,860,843 485,293 3,588,208Operating 2,405,528 2,247,209 158,319 3,665,846
Total Expenditures 4,751,664 4,108,052 643,612 7,254,054
Net Impact to Fund Balance (1,374,674) (731,062) 643,612 0
2012 Beginning Fund Balance 0Budgeted Change in Fund Balance 0
Advance from General Fund * 1,000,000* Advances not to exceed $2,000,000 as Less: Cash Flow (1,000,000)approved in Resolution #11-164 2012 Estimated Ending Fund Balance 0
As of August 31, 2012

Budget Administration 29
August 2012 – Land Improvement Districts (LIDs)
2012Revenues: Budget Actual Variance Budget
Intergovernmental Collections 74,333 139,084 64,751 111,500Interest 0 173 173 0
Total Revenues 74,333 139,258 64,924 111,500
Expenditures:Operating/Treasurer's Fees 74,333 42,898 31,435 111,500
Total Expenditures 74,333 42,898 31,435 111,500
Net Impact to Fund Balance 0 96,359 96,359 0
2012 Beginning Fund Balance 97,345
* LIDs include Rancho Road and Budgeted Change in Fund Balance 0
Falcon Vista 2012 Estimated Ending Fund Balance 97,345
As of August 31, 2012

Budget Administration 30
Questions?