E. G. Ravenstein, JRSS, 1889, The Laws of Migration
72
The Laws of Migration Author(s): E. G. Ravenstein Reviewed work(s): Source: Journal of the Royal Statistical Society, Vol. 52, No. 2 (Jun., 1889), pp. 241-305 Published by: Blackwell Publishing for the Royal Statistical Society Stable URL: http://www.jstor.org/stable/2979333 . Accessed: 10/02/2012 10:33 Your use of the JSTOR archive indicates your acceptance of the Terms & Conditions of Use, available at . http://www.jstor.org/page/info/about/policies/terms.jsp JSTOR is a not-for-profit service that helps scholars, researchers, and students discover, use, and build upon a wide range of content in a trusted digital archive. We use information technology and tools to increase productivity and facilitate new forms of scholarship. For more information about JSTOR, please contact [email protected]. Blackwell Publishing and Royal Statistical Society are collaborating with JSTOR to digitize, preserve and extend access to Journal of the Royal Statistical Society. http://www.jstor.org
Transcript of E. G. Ravenstein, JRSS, 1889, The Laws of Migration
The Laws of MigrationAuthor(s): E. G. RavensteinReviewed work(s):Source: Journal of the Royal Statistical Society, Vol. 52, No. 2 (Jun., 1889), pp. 241-305Published by: Blackwell Publishing for the Royal Statistical SocietyStable URL: http://www.jstor.org/stable/2979333 .Accessed: 10/02/2012 10:33
Your use of the JSTOR archive indicates your acceptance of the Terms & Conditions of Use, available at .http://www.jstor.org/page/info/about/policies/terms.jsp
JSTOR is a not-for-profit service that helps scholars, researchers, and students discover, use, and build upon a wide range ofcontent in a trusted digital archive. We use information technology and tools to increase productivity and facilitate new formsof scholarship. For more information about JSTOR, please contact [email protected].
Blackwell Publishing and Royal Statistical Society are collaborating with JSTOR to digitize, preserve andextend access to Journal of the Royal Statistical Society.
http://www.jstor.org
1889.] 241
She LAWS of MIGRATION. By E. G. RAvENSTEIN, ESQ., F.R.G.S.
SECOND PAPER.1
[Read before the Royal Statistical Society, 16th April, 1889. The President, Dr. T. GRAHAM BALFOuiX, F.R.S., &c., in the Chair.]
CONTENTS: PAGE
General Scope of the Paper ........ 241 Birth-place and "Nationality" .... 242 " Dispersion " and " Absorption" 244 Gains and Losses due to Migration 244 Countries unequal in Population,
nor comparable ........................ 245 The United Kingdom .................... 246
German Empire .................... 247 Netherlands ............... 253
Belgium ............... 253 ILuxembnrg ...... ......... 254 Switzerland ...... ......... 254 Austria ............... , 2'5 Hungary ..... .......... 259 The Balkan Peninsula ............... 263 Denmark ..... .......... 265 Norway .... ........... 265 Sweden ... ,, 266 Finland ........ 267 Russia .. ...... 267 France .. ...... 269 Italy ........ 272 Spain and Portugal .................... 274 A General Survey of Europe ........ 274
PAGE North America ......................... 278 Canada ........... .............. 278 The United States ........................ 280 Conclusions which may be Drawn
from the facts presented as to the Laws of Migration ............ 286
Cotncluding Remarks .................... 288 Appendix (Tables I-X) ............ 290
MAPS. 1. Western Europe: the Foreign Ele-
ment. 2. Western Europe: Regions of Dis-
persion and Absorption. 3. Canada and the United States: the
Foreign Elemnent. 4. Canada and the United States: Re-
gionsof DispersionandAbsorption. 5. Dispersion of Migrants from Virginia
and Quebec. 6. Absorption of Migrants by Iowa
and Manitoba. With an inset Map illustrating the Absorption of Migrants by Kentucky.
IN March, 1885, I had the honour of reading before this Society a paper which I perhaps somewhat ambitiously headed " The Laws " of Migration." To that title I still adhere, notwithstanding the objections that may be raised against it. Of course I am perfectly aware that our laws of population, and economic laws generally, have not the rigidity of physical laws, as they are continually being interfered with by human agency. Currents of migration which would flow naturally in a certain direction traced out for them in the main by geographical features, may thus be diverted, or stopped altogether, by legislative enactments. Even London, notwithstanding its unique geographical position, and the advan-
' In the preparation of this paper I am indebted to my young friend Mr. G. Philip for assistance in computing the tables and for several of the illustrative diag,.ams.
242 RAvENSTEIN-TAe Laws of Migrationw. [June,
tages derived from its being the centre of a vast empire, would not have grown to the size it has if an enactment of the reign of Queen Elizabeth in restraint of its growth had been enforced down to the present day.
Instances of towns and even of countries having been stunted in their growth through a mistaken policy can be found as easily as can instances in which a wise legislation has partly neutralised natural disadvantages. But notwithstanding all these exceptions, I hope to be able to prove that similar conditions produce similar migratory movements, whether we examine into this question on this side of the Atlantic or on the other.
In my first paper I confined myself to the United Kingdom. On the present occasion I propose to extend my inquiry to the principal countries of continental Europe and to North America. I shall first of all place before you the leading results of some recent censuses, in as far as they throw light upon the distribution of the population according to birth places, and I shall then discuss these results with a view of discovering the principles, if any, which underlie migratory movements. If my success in the latter respect should turn out smaller than I could wish, I hope that my statistical summaries will be accepted at least in part compensation for this deficiency.
In dealing with my subject I shall adhere, as far as possible, to the lines of my former paper, so as to facilitate comparison.
I shall therefore, first of all, divide the population of each country, province, or parish into its constituent elements, as determined by place of birth. I thus call "Parochial Element" those inhabitants who resided at the time of the census in the parish in which they were born. I apply the terms " Provincial Element," " National Element," or " Foreign Element " in the same setise. Unless otherwise .stated these " Elements " are determined by place of birth, and not by " nationality," or admission to the privileges of citizenship. All persons born within the limits of the German Empire therefore pass with me for German, whether their mother tongue be German, French, or Polish. On the other hand, the children of Germans born in France, are counted by me as French- men, or rather natives of France, whether enumerated in Germany or elsewhere, or whether they have " opted " for the French nation. ality, or secured that of their parents. Fortunately the number of such persons proportionately to the total population of a country is nowhere very considerable.
There are however censuses which classify the population not according to place of birth, but according to " nationality," the distinction made being between "citizens " or " subjects " on the one hand, and legal " foreigners" on the other. These distinctions
1889.] RAxENSTEIN-The Laws of Miqrttion. 243
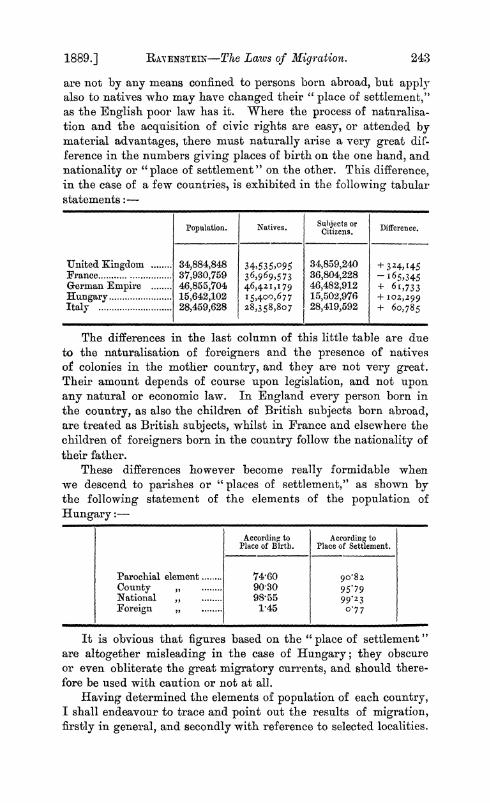
are not by any means confined to persons born abroad, but apply also to natives who may have changed their " place of settlement," as the English poor law has it. Where the process of naturalisa- tion and the acquisition of civic rights are easy, or attended by material advantages, there must naturally arise a very great dif- ference in the numbers giving places of birth on the one hand, and nationality or "place of settlement" on the other. This difference, in the case of a few countries, is exhibited in the following tabular statements:-
Population. Natives. Suhjects or Difference.
United Kingdom ........ 34,884,848 34,535,095 34,859,240 + 324) 145 France ...... . ... 37,930,759 36,969,573 36,804,228 - I65,345 German Empire ........ 46,855,704 46,42 1, 1 79 46,482,912 + 6 5,733 Hungary ...................... 15,642,102 15,400,677 15,502,976 + 02,29 9
Italy ............................ 28,459,628 2z8,358,807 28,419,592 + 60,785
The differences in the last column of this little table are due to the naturalisation of foreigners and the presence of natives of colonies in the mother country, and they are not very great. Their amount depends of course upon legislation, and not upon any natural or economic law. In England every person born in the country, as also the children of British subjects born abroad, are treated as British subjects, whilst in France and elsewhere the children of foreigners born in the country follow the nationality of their father.
These differences however become really formidable when we descend to parishes or "places of settlement," as shown by the following statement of the elements of the population of Hungary:
According to According to Place of Birth. Place of Settlement.
Parochial element ........ 14-60 go982 County , ........ 9030 95 79 National , ........ 98-55 99 23
Foreign , ........ 145 0-77
It is obvious that figures based on the "place of settlement" are altogether misleading in the case of Hungary; they obscure or even obliterate the great migratory currents, and should there- fore be used with caution or not at all.
Having determined the elements of population of each country, I shall endeavour to trace and point out the results of migration, firstly in general, and secondly with reference to selected localities.
244 RAVENSTEIN-The Laws of Migration. [June,
If, for instance, I consider the case of a province containing ioo,ooo inhabitants (9o,ooo natives and xo,ooo persons born outside of it), and I find that throughout the country there were enume- rated 1So,ooo natives of that province, I safely conclude that 6o,ooo of its natives have migrated to other parts of the country, and that this loss has only been compensated for by an inflow of 10,ooo strangers from beyond. The absolute loss due to migration would amount to 5o,oo0 persons, equal to 50 per cent. of the popu- lation. Such a province I term a province of " dispersion." Where the reverse process takes place, that is, where the total population of a province is larger than the number of its natives throughout the country, we have to deal with a province of "absorption."
It is clear that the gains and losses from migration ascertained in this manner apply only to migratory movements which go on within the limits of a State or country. They take no account of the losses suffered by emigration to foreign parts, losses which are more especially severe in the case of frontier provinces. These losses however can be expressed if we compare the natural growth of a population, or that' increase which is due to an excess of births over deaths, with the actual growth as determined by the census. Where this natural growth is in excess of the actual growth we have before us the process of " dispersion ;" where the reverse is the case we are dealing with a case of absorption.2 As an illustration I select the Duchy of Anhalt, which had 232,592 inhabitants in 1880, and 248, i66 in 1885, exhibiting thus an increase of 15,574 inhabitants, equivalent to I 29 per cent. annually. But as during the same period the births exceeded the deaths to the number of 16,738, the natural growth, had there been no emigration, would have amounted to 1-38 per cent. annually. The loss therefore due to emigration and not compensated for by immigration amounted to 139 - 129 = o-io per cent. This loss would have been still more severe if in return for the 59,290 native Anhalters who left their country for other parts of Germany and for foreign countries, there had not been a com- pensatory inflow of 57,500 Germans and foreigners. And thus whilst Anhalt is clearly a " county of absorption," and a gainer to the extent of 1'3 per cent., as long as we confine ourselves to the migratory movements going on within the borders of the German Empire, it should be classed with counties of dispersion if we desire in addition to this to take account of the emigration to foreign parts.
2 The method of computing loss and gain by migration, emigration, and immigration in combination, has been largely used in census returns (see, for instance, the various census reports for the German Empire, as also the census of England and Wales, 1881, IV, p. 51).
1889.] RAVENSTEIN-The Laws of Migration. 245
Whenever practicable I have availed myself of both methods of stating " losses" and "gains," and I must confess that the method described last presents undoubted advantages.
There is one other feature in my paper against which I feel bound to warn you, viz., the temptation of looking upon the figures which I give as being in the strict sense of the word com- parable. My figures are simply relative, and proportional to the total populations to which they refer. It is obvious that the appa- rent rate of migration must increase proportionately to the small- ness of the units of the population with which we deal. The larger or more populous the districts into which we divide a country, the less active will the process of migration appear to be, until by taking a whole country the effects of migration, if we confine our attention to what is going on among the natives residing within the boundaries of the country, absolutely neutralise each other, exhibiting neither loss nor gain. If foreign residents in the country be taken into account, the gain will amount to the numbers of these strangers, and to no more.
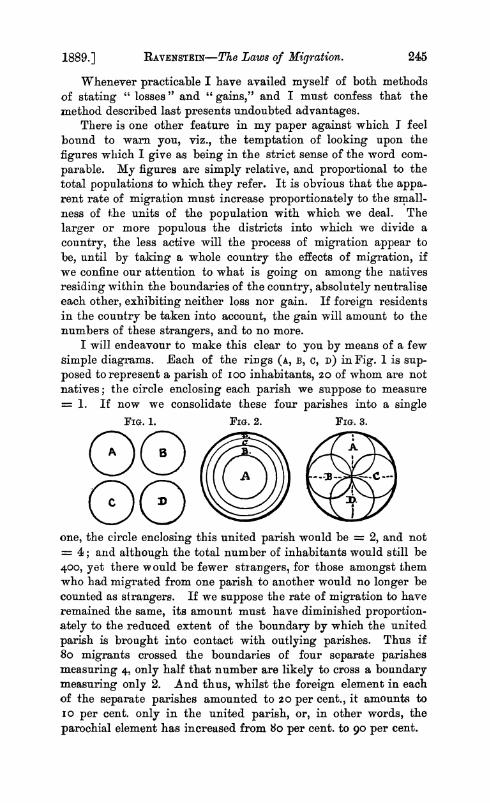
I will endeavour to make this clear to you by means of a few simple diagrams. Each of the rings (A, B, C, D) in Fig. 1 is sup- posed to represent a parish of Ioo inhabitants, 20 of whom are not natives; the circle enclosing each parish we suppose to measure = 1. If now we consolidate these four parishes into a single
FIG. 1. FIGi. 2. FIGi. 3.
one, the circle enclosing this united parish would be = 2, and not = 4; and although the total number of inhabitants would still be 400, yet there would be fewer strangers, for those amongst them who had migrated from one parish to another would no longer be counted as strangers. If we suppose the rate of migration to have remained the same, its amount must have diminished proportion- ately to the reduced extent of the boundary by which the united parish is brought into contact with outlying parishes. Thus if 8o migrants crossed the boundaries of four separate parishes measuring 4, only half that number are likely to cross a boundary measuring only 2. And thus, whilst the foreign element in each of the separate parishes amounted to 20 per cent., it amounts to io per cent. only in the united parish, or, in other words, the parochial element has increased from 8o per cent. to go per cent.
246 RAVENSTEIN- Tie Laws of Migration. [June,
If instead of consolidating four parishes, we consolidate nine, the result will still be the same if we arrange them symmetrically, placing three to each row. The boundaries of the individual parishes would be = 9, that of the consolidated parish = 3. The strangers, counted for each parish separately, would number 9 X 20 = i8o, but those in the consolidated parish would only number 6o, or 6&66 ... per cent. of the consolidated population as compared with 20 per cent. in the individual parishes. The reduc- tion is therefore proportional to the reduction in the extent of the line of contact with adjoining outlying parishes, viz., at the rate of 9: 3 = 3: I = 20: 6-66 ....
I had hoped to have been able to utilize this simple mathemati- cal illustration for the purpose of reducing the multiplicity of parishes and other divisions with which I have to deal to standard divisions of the same number of inhabitants, but in this I failed, for it is applicable only where these divisions admit of a certain symmetrical arrangement. As such an arrangement rarely, if ever, exists in nature, all attempts to deduce the migration of any division from that which is going on in another division having a different population must lead to quite misleading results. I very much doubt whether any of our mathematical members would be more successful than I have been.
Nevertheless the illustrations which I have made use of illus- trate sufficiently the facts of the case. If for instance you will look at Table I of the Appendix, you will find that in the separate States of Thuringia the native element varies between 7f+2 and 84+4 per cent., whilst in a consolidated Thuringia it rises to 88-82 per cent., having been strengthened in consequence of the natives of one State not being accounted strangers in the others.
The United Kingdom. Before proceeding to the substance of my paper, I shall place
before you a summary of the migration statistics for the United Kingdom, referring you for further details to my former paper, published in our Journal for 1886.
The United Kingdom in 1881 had a population of 34,884,848, of whom 34,535,095, or 98,99 per cent., were natives, and 350,800, or i-O1 per cent., were persons born abroad. These latter however included all persons born in British colonies, without distinction of race, and as many as 2I4,I45 of them had been born to, or had acquired the privilege of calling themselves "British subjects." The number of "foreigners " was therefore only I36,655, or 0-39 per cent., a very small number compared with the number of foreigners to be found in most other States. This no doubt is to be accounted for by the insular position of the United Kingdom,
1889.] RAVENSTEINT-Tze Laws of Migration. 247
which accounts too for the distribution of these foreigners, which differs much from what is to be found in countries having extended land frontiers. Still, as our census officials merely count heads, and do not weigh qualities, it is possible that the influence of these foreigners for good or evil may be much greater than that exercised by a similar number enumerated in other countries.
Confining ourselves to migration within the limits of the United Kingdom, and amongst the natives thereof, we find that England, and, to a smaller extent, Scotland have been the gainers, they having absorbed as many as 78 I, I I 9 natives of Ireland, of whom 562,374 fell to the share of England; in return for which the counter currents of migration only carried 91,7io natives of England, Wales, and Scotland into Ireland, the absolute loss of that country amounting thus to 689,409 persons, equivalent to 12-7 per cent. of its population in 1871. Ireland, taken as a whole, is thus a vast region of dispersion.
If however in addition to home migration we take account of international migration, it will be found that each of the three kingdoms must be placed among those countries of dispersion, the emigration from which is far in excess of the immigration. By natural growth alone, that is by the excess of births over deaths, the United Kingdom would have increased its population between 1871-81 to the extent of 13-7 per cent., and as the actual increase, notwithstanding an active inflow of persons born abroad, only amounted to Io-8 per cent., this international exchange has resulted in the serious loss of 2z9 per cent. in the course of ten years.
The German Empire.
I begin my survey of continental Europe with the German Empire, as statistics available for that purpose are exceptionally complete.
I ought to state that, for obvious reasons, I have formed several of the smaller " States " into " geographical provinces."
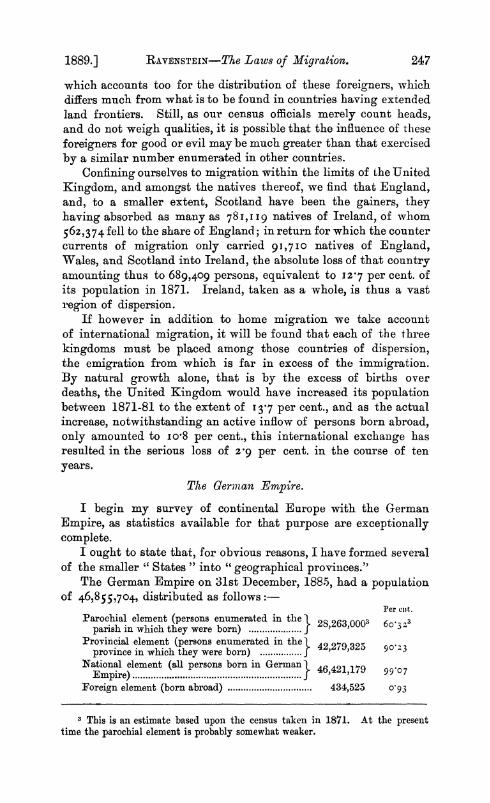
The German Empire on 31st December, 188.S, had a population of 46,855,704, distributed as follows:
Per clit. Parochial element (persons enumerated in the 28,263,OOO3 603Z3
parish in which they were born) . ........ Provincial element (persons enumerated in the 42,279,325 90z 3
province in which they were born) ....J............ National element (all persons born in German} 46,421,179 99-07
Empire) . Foreign element (born abroad) .434,523 093
3This is an estimate based upon the census taken in 1871. At the present time the parochial element is probably somewhat weaker.
248 RAVENSTEIN-The Laws of Migration. [June,
In Table I appended to this paper the results of migration throughout Germany can be clearly traced. I have been able to indicate the results of migration within the empire, as also the gains or losses if emigration into foreign countries be taken into account. If we do not look beyond the limits of the empire it will be found that Berlin, Schleswig-Holstein, Elsass, Royal Saxony, Rhineland, and Westphalia have most largely profited by an importation of the surplus population of other provinces and by the immigration of foreigners, whilst Silesia, Brandenburg (with- out Berlin), Prussian Saxony, Posen, Eastern Prussia, Pomerania, and Mecklenburg have suffered the severest losses in their natives, notwithstanding an inflow of foreign elements which has been very considerable in some of these provinces. It should however be noted that some of the provinces named above are frontier pro- vinces, and that we have not therefore taken into account the migrants which have gone from them into neighbouring foreign countries. It is obvious, for instance, that if we assume the num- ber of native Alsatians at present in France to amount to 200,000, that province, instead of exhibiting a gain of io per cent., would reveal a loss of 2z8 per cent. of its population. And as the gains of all these provinces will be reduced if emigration into neighbour- ing foreign parts be taken into account, so also will the losses of frontier provinces be intensified. Posen, as an integral part of the German Empire, exhibits a loss of 6-4 per cent., but would exhibit a loss of 12X2 per cent. if we assumed ioo,ooo native Poseners to have emigrated into the neighbouring Poland.
If international migration be taken into account, the geographi- cal provinces will follow each other in a very different order to that which they occupy in my table, for in that case Berlin and Royal Saxony alone will exhibit a gain, realised at the expense of all other provinces as well as of some foreign countries, whilst Posen, West Piussia, Mecklenburg and Pomerania will be found at the bottom of the list, they having suffered the severest losses. Had there been neither emigration nor immigration the population of the German Empire would have increased at the rate of iU13 per cent. per annum between 1880-85, instead of increasing at the reduced rate of 0o70 per cent..4 thus exhibiting a loss due to the excess of emigration amounting to 0-43 per cent.
Short-journey migrants abound in Germany as they do else- 4 The actual loss (1880-85) amounted to 980,212 souls, of whom 443,535
were females. From other data we learn that trans-Atlantic emigration has been going on (1880-84) most actively from Pomerania (x122 per cent. of population per annum),West Prussia (IxIS per cent.), Schleswig-Holstein (o8 7 per cent.), Posen (ow87 per cent.), and Mecklenburg. Between 1872 and 1881 the annual increase amounted to I107, the natural growth to i24 per cent., and the loss consequently to 0- 17 per cent.
1889.] RAVENSTEIN-The Laws of Migration. 249
where. This is amply proved by many instances given in the German census returns. Thus, out of 120,784 Royal Saxons who migrated into other provinces, as many as 37,057 had gone no fur- ther than the five nearest districts of Prussian Saxony and Silesia. That the larger towns increase in consequence of this migration at a quicker rate than do the smaller towns and the rural parts is an undoubted fact, and they do so at an increasing pace. In 1871 towns of over 2,000 inhabitants only contained 32-1 per cent. of the pop ulation, whilst in 1885 they contained 43 7 per cent. Towns of over ioo,ooo inhabitants between 1880-85 increased annually at the rate of 2 41 per cent., whilst villages or parishes of under 2,000 inhabitants decreased 0o02 per cent. This looks very much like a depopulation of the rural parts, which is not, however, peculiar to Germany alone, and cannot therefore without further examination be ascribed to the action of the land laws, as far as the United Kingdom is concerned.
Females predominate among those migrants who go only short distances, and even in entire provinces, as in Schleswig-Holstein and Oldenburg, whence they are drawn to the neighbouring Hanse towns, in which the demand for domestic servants is considerable. Among long-journey migrants they form a decided minority, for out of 1,ooo women enumerated, only 88 were found outside their native province, whilst the proportion among men similarly situated was io6.
The number of persons of foreign birth is not so large as for instance in France, but it is sufficiently so to illustrate by its geographical distribution the migratory phenomena under review. If you examine the map prepared by me, you will find that this foreign element has invaded Germany from all sides, whether the boundary be formed by the sea or be drawn across the land;. and that the inflowing currents are most powerful wherever geographical features facilitate or invite intercourse, and that they lose in strength the farther we trace them into the interior. There are of course a few exceptions to this rule, but the only ones of any importance are the capital of the empire (Berlin), and the districts of which Wiesbaden and Frankfurt are the centres. But even in these places, which attracted many foreign settlers notwithstanding that the census was taken in midwinter, the foreign element is far inferior to what it is in some of the frontier districts, for whilst in Berlin it only constitutes I135 per cent. of the population, and in Wiesbaden I 04 per cent., it rises to far higher proportions in such districts as Germain Lorraine (5,o8 per cent.) Hamburg (3 62), Upper Alsatia (3-4I), Upper Bavaria (2 43), Aix la Chapelle (2-40 per cent.), Bautzen (2 28) and others, which in addition to enjoying the advantage of being most accessible to
250 RAVENSTEIN-The Laws of Migration. [June,
foreigners, are in some instances also great seats of commerce or industry.
Of course a large proportion of these foreign migrants may be classed as long-journey migrants, but the great bulk of them nevertheless shares the peculiarity of all migrants, viz., that they go no further from their homes in search of work than is absolutely necessary. Hence the bulk of the persons of foreign birth is to be found in the provinces bordering upon the countries from which they came.5 Thus of 155,33i Austrians, I 19,464 were found in the frontier provinces of Bavaria, Saxony (Royal), and Silesia; of the 48,853 Russians, 30,802 were enumerated in Prussia, Posen, and Silesia; of the 45,270 Dutch, 31,785 were resident in Rhineland, and 5,585 in Westphalia. The Swiss abound most in Baden and Elsass; the French6 in Elsass and Lorraine, where 20,345 out of a total of 36,708 have made their homes, thus largely compensating for the loss of the Alsatians who have migrated into France; the Danes are most numerous in Schleswig-Holstein and at Hamburg and so on. Only those immigrants who have travelled long distances to reach Germany, such as the English and Americans, are more widely distributed over the country.
In further illustration of the process of migration going on in Germany, I propose to present some details for Berlin, the great centre of absorption, and for East Prussia, a province from which migration proceeds most actively.
The following table furnishes the information for Berlin, its first part exhibiting the elements represented in the population of Berlin, whilst the second part shows to what extent natives of Berlin have found their way into all parts of Germany:
5 Total number of persons of foreign birth in Germany, 434,5Z5; including r55,35 x Austrians, 48,853 Russians, 45,Z70 Dutch, 36,go2 Swiss, 36,708 Frenclh, 20,848 Danes, 15,007 Americans, 14,889 English, Irish, and Scotch, 11,309 Swedes, 11,067 Luxemburgers, 8,844. Belgians, 8,234 Italians, 6,775 Hungarians, x,865 Norwegians, &c.
G These are persons born in France. The number of Frenchmen in Germany who bave retained their nationality only amounts to 24,24I.
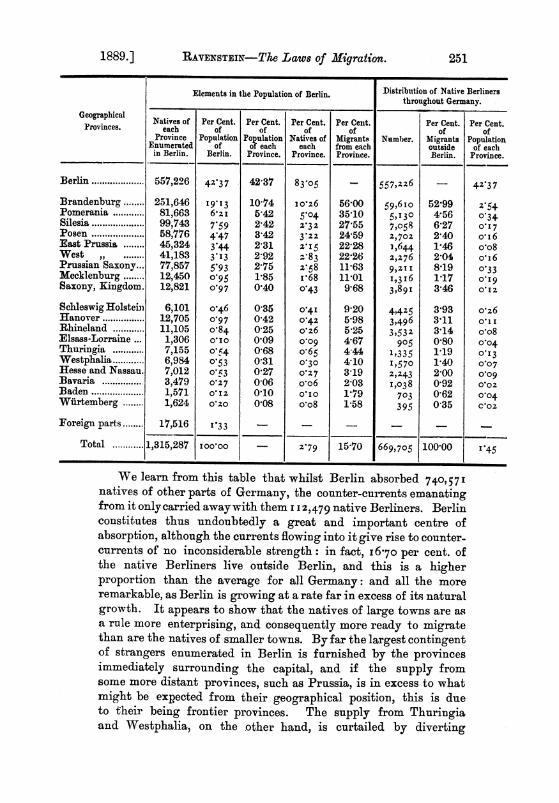
1889.] RAVENSTEIN -The Laws of Migration. 251
Elements in the Population of Berlin. Distribution of Native Berliners ElementsinthePopulationof Berlin. throughout Germany.
Geographical Natives of Per Cent. Per Cent. Per Cent. Per Cent. Per Cent. Per Cent. Provinces. each of of of of of of Province Population Population Natives of Migrants Number. Migrants Population Enumerated of of each each from each outside of each in Berlin. Berlin. Province. Province. Province. Berlin. Province.
Berlin .557,226 42'3 7 42-37 83'o5 - 557,2zz6 42'3 7
Brandenburg. 251,646 19-13 74 1o26 5600 59,610 5299 Z 54 Pomerania . 81,663 6:z I 5-42 5'04 35-10 5,130 4-56 O034 Silesia .99,743 7 5 9 2-42 2-3 2 27-55 7,058 6-27 0.I7 Posen .58,776 4-47 3-42 3-2z 24-59 2 702 2-40 oI6 East Prussia 45,324 3'44 231 2.15 22-28 1,644 1'46 o'o8 West , . 41,183 313 2-92 z-83 22-26 2,276 2'04 o0i6 Prussian Saxony ... 77,857 5 93 2-75 z.58 11-63 9,2X11 8X19 O*33 Mecklenburg 12,450 0-95 1X85 i 68 11-01 I,3P6 1-17 0oI9 Saxony, Kingdom. 12,821 0-97 040 0-43 9-68 3,89 I 3 46 o I 2 Schleswig Holstein 6,101 0o46 035 04I 9-20 4,425 3.93 oz6 Hanover .12,705 0-97 0-42 0.42 5'98 3,496 3'11 ,11I Rhineland . 11,105 o084 0-25 o0z6 5-25 3,532 3-14 o-o8 Elsass-Lorraine ... 1,306 0o10 0-09 0-09 4-67 905 0-80 Oo04 Thuringia 7,155 054 0-68 o065 4*44 1,335 1-19 O I 3 Westphalia . 6,984 0.53 031 030 4'10 1,570 1-40 0'07 Hesse and Nassau. 7,012 0-53 0-27 02z7 319 2,243 2-00 0-09 Bavaria .3,479 0-27 006 o-o6 2-03 1,038 0 92 o0oz Baden .1,571 O I2 0110 0 I0 1'79 703 062 0.04 Wiirtemberg 1,624 o0-o 0-08 o-o8 1-58 395 0 35 c o0
Foreign parts 17,516 C33 _ _ -
Total . 1,315,287 I00o00 - 2|79 1570 669,705 100-00 |145
We learn from this table that whilst Berlin absorbed 740,571 natives of other parts of Germany, the counter-currents emanating from it onlyCarried awaywith them I 12,479 native Berliners. Berlin constitutes thus undoubtedly a great and important centre of absorption, although the currents flowing into it give rise to counter- currents of no inconsiderable strength: in fact, I6-70 per cent. of the native Berliners live outside Berlin, and this is a higher proportion than the average for all Germany: and all the more remarkable, as Berlin is growing at a rate far in excess of its natural growth. It appears to show that the natives of large towns are as a rule more enterprising, and consequently more ready to migrate than are the natives of smaller towns. By far the largest contingent of strangers enumerated in Berlin is furnished by the provinces immediately surrounding the capital, and if the supply from some more distant provinces, such as Prussia, is in excess to what might be expected from their geographical position, this is due to their being frontier provinces. The supply from Thuringia and Westphalia, on the other hand, is curtailed by diverting
252 RAVENSTEiN-The Laws of Migration. [June,
currents which draw many of the migrants from these provinces into the more accessible manufacturing districts of Saxony and Westphalia. There is also a disturbing element in the large garrison maintained at Berlin, which notwithstanding the local character of the military forces of Germany, includes natives from all parts of the empire.
Speaking generally, however, the bulk of the migrants who have swelled the population of Berlin have come from the neighbouring provinces, and similarly the Berliners who have forsaken their native place for other parts of Germany have gone no further than the neighbouring provinces, as many as 53 per cent. of them being found in rural Brandenburg. Females form a majority of the migrants who have settled in Berlin, but this majority has been secured solely at the expense of the more accessible provinces. Females too form a majority among the native Berliners who have gone to reside in other parts of Germany.
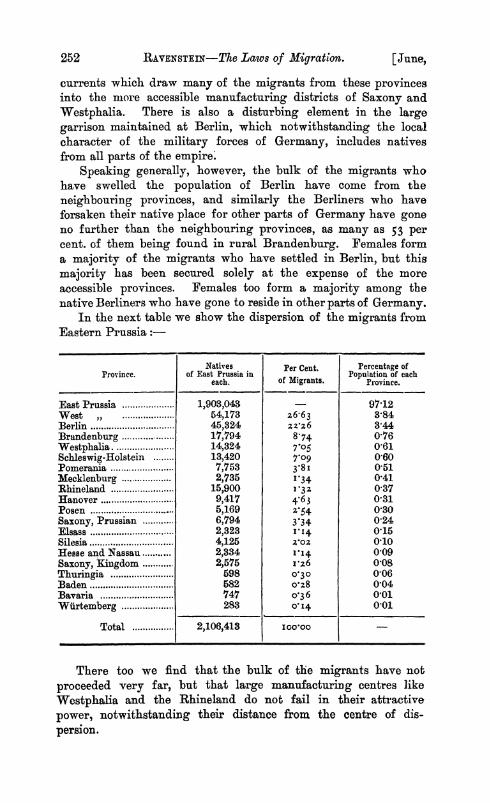
In the next table we show the dispersion of the migrants from Eastern Prussia:
Natives Per Cent. Percentage of Province. of East Prussia in Population of each
each. of Migrants. Province.
East Prussia . ................ 1,903,043 97-12 West , ................. 54,173 26 63 3,84 Berlin ................. 45,324 22z26 3 44 Brandenbur ................. 17,794 8*74 0-76 Westphalia ................. 14,324 705 0-61 Schleswig-Holstein ........ 13,420 70 0,60 Pomerania ................. 7,753 3'8i 0.51 Mecklenburg ................. 2,735 I34 0,41 Rhineland ................. 15,900 1*32 0-37 Hanover ........... 9,417 4-63 0-31 Posen ............................ 6,5169 2-54 0 30 Saxony, Prussian ............ 6,794 3x34 0,24 Elsass ......... ........ 2,323 I14 0-15 Silesia ......... . 4,125 2x02 010 Hesse and Nassau ........... 2,334 V14 0 09 Saxony, Kingdom ............ 2,575 z6 0-08 Thuringia . ........... 598 0.30 006 Baden . ................5 82 oz8 004 Bavaria ................. 747 o036 0 01 Wiirtemberg ................. 283 014 0 01
Total ................ 2)106,413 I00 00
There too we find that the bulk of the migrants have not proceeded very far, but that large manufacturing centres like Westphalia and the Rhineland do not fail in their attractive power, notwithstanding their distance from the centre of dis- persion.
1889.3 RAYENSTEIN-T7he Laws of Migration. 253
-The Netherlands. The Netherlands, on 31st December, 1879, had a population of
4,012,693 souls, distributed as follows:
Parochial element ................ 2,697,495 67r2z per cent. Provincial ,. ........... 3,551,976 88-51 National , ................ 3,936,118 98 C ,, Foreign ,................. 75,380 9 1 Of unknown birthplace 1,195
The foreign element included, in addition to 7,604 natives of Dutch colonies, 42,o26 Germans, I8,8i6 Belgians, i,6i4 English, and 5,320 persons of other nationalities. As the increase of popula- tion between 1869 and 1879 amounted to 433,i64 souls, whilst the natural growth would have yielded an increase of 449.864, there resulted a small loss of i6,700 souls, which is due to international migration. An examination of Table II in the Appendix clearly shows that Holland proper, with its big and growing towns, has been the great absorbent of population, whilst Limburg, Overyssel, and Gelderland, notwithstanding their strong foreign elements, have been the most active centres of dispersion. The towns throughout the country increased (1870-79), 17-25 per cent. in population, the rural parts only 6-8 per cent., proportions which tell their own tale. Females are as usual greater migrants than men, for whilst throughout the kingdom the two sexes are equal, there are only 94 females to o00 males among those persons who were found to live in their native parishes.
Migration is steadily increasing. The parochial element, in 1849, still mustered 69 og per cent. of the population; by 1879, as we have seen, it had been reduced to 67-22 per cent.
Foreigners are most numerous in Limburg, a German border province of great length and little width, and in the maritime province of Zeeland.
Dutcb emigration is directed mainlyto European countries, and the number of Dutchmen in Germany, Belgium, and France, is double that of the Dutchmen enumerated in the United States.
Belgium. Belgium, on 31st December, 1880, had 5,520,009 inhabitants,
distributed according to place of birth and residence in the following manner:-
Parochial element ............ 3,709,977 67'zo per cent. National ,.............. 5,376,748 99 7,, Foreign , ............ 143,261 ohz6
No details as to the distribution of the natives of each province are given, but we are safe in assuming that home-migration flows
VOL. LII. PART II. S
254 RAVENSTEIN-Tlte Laws of Mligration. [June,
towards the provinces which increase most rapidly in population, namely, Antwerp, Brabant (with Brussels), and Liege. As the natural growth exceeds the actual increase of the population, Belgium is a loser by emigration. This emigration however is not so much directed to trans-Atlantic countries as to the neighbouring country of France, where 432,265 " Belgians " were enumerated in 1881, although all the natives of Belgium living outside Belgium did not probably exceed half a million. The parochial element in the only two towns for which information is given, viz., Antwerp and Brussels, is exceptionally strong, mustering 66-ii and 5I'03 per cent. respectively; the foreign elements attaining at the same time the high percentages of 8-47 and 8-53 per cent.
Migration is increasing, for the parochial element has fallen from 69-4 per cent. in 1886, to 67-2 per cent. in 1880, and women exceed the men among short-journey migrants. This is clearly proved by the fact of there being only 97 females to ioo males in the parochial element, whilst among the total population of the country the two sexes exactly balance each other.
Persons of foreign birth" are most numerous, proportionately to the population, in the provinces of Liege, Antwerp, Luxemburg, and Brabant, the first three being frontier provinces, the last the seat of the capital. For detailed information see Table III in the Appendix.
Luxemburg. The Grand Duchy of Luxemburg has within recent years
become a great centre of dispersion, and if its population is nevertheless still increasing, this is solely due to an inflow of popu- lation from beyond its borders. Between 31st December, 1880, and 1st December, 1885, the number of natives enumerated in Luxemburg actually fell from I97,027 (940oo per cent.) to i95,68i (91 74 per cent.), whilst the foreign element rose from 12,543 to 17,602.8 In 1871 there were 3,220 natives of Germany in the Grand Duchy; in 1880, 8,412; in 1885, I[,863. The number of native Luxemburgers residing in other European States probably reaches 50,000, including zs,000 (?) in France, I i,ooo in Germany, 8,ooo in Belgiam, &c.
Switzerland. The federal census taken in December, 1880, only distinguishes
the inhabitants according to civil rights or " place of settlement,"
7 51,104 Frenclh (16,735 in Hainant, 12.085 in Brabant), 41,391 Dutch (i4,z63 in Antwerp), 34,196 Germans (I8,z68 in Liege), 7,760 Luxemburgers (4,227 in Belgian Luxemburg), 3,799 English, 5,011 others.
8 Viz., I1,863 Germans, 3,028 Belgians, 1,313 French, 496 Italians, 41S Austrians and Hungarians, 745 Swiss, 68 Dutch, 34 English.
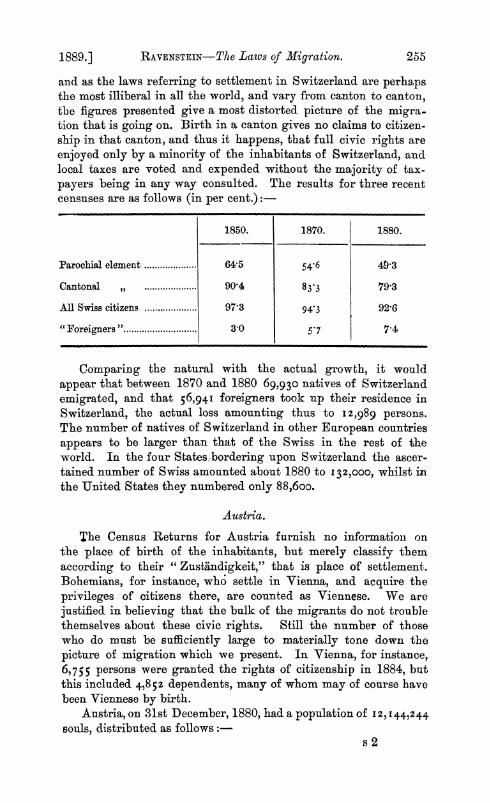
1889.] RAVENSTEIN-The Laws of Migration. 255
and as the laws referring to settlement in Switzerland are perhaps the most illiberal in all the world, and vary from canton to canton, the figures presented give a most distorted picture of the migra- tion that is going on. Birth in a canton gives no claims to citizen- ship in that canton, and thus it happens, that full civic rights are enjoyed only by a minority of the inhabitants of Switzerland, and local taxes are voted and expended without the majority of tax- payers being in any way consulted. The results for three recent censuses are as follows (in per cent.):
1850. 1870. 1880.
Parochial element .64-5 54 6 49-3
Cantonal ,. 90A4 83 3 79.3
All Swiss citizens .973 94 3 92,6
"Foreigners ". 30 5.7 7 4
Comparing the natural with the actual growth, it would appear that between 1870 and 1880 69,930 natives of Switzerland emigrated, and that 56,94i foreigners took up their residence in Switzerland, the actual loss amounting thus to I2,989 persons. The number of natives of Switzerland in other European countries appears to be larger than that of the Swiss in the resb of the world. In the four States bordering upon Switzerland the ascer- tained number of Swiss amounted about 1880 to 132,000, whilst in the United States they numbered only 88,6oo.
Austria.
The Census Returns for Austria furnish no information on the place of birth of the inhabitants, but merely classify them according to their " Zustiindigkeit," that is place of settlement. Bohemians, for instance, who settle in Vienna, and acquire the privileges of citizens there, are counted as Viennese. We are justified in believing that the bulk of the migrants do not trouble themselves about these civic rights. Still the number of those who do must be sufficiently large to materially tone down the picture of migration which we present. In Vienna, for instance, 6,755 persons were granted the rights of citizenship in 1884, bult this included 4,852 dependents, many of whom may of course have been Viennese by birth.
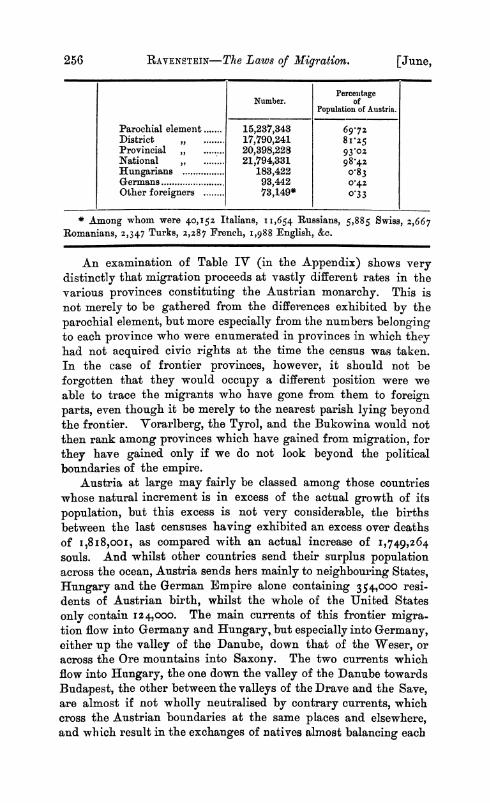
Austria, on 31st December, 1880, had a population of 12,144,244 souls, distributed as follows:-
s 2
256 RAVENSTEIN-The Laws of Migration. [June,
Percentage Number. of
Population of Austria.
Parochial element ....... 15,237,343 69.7z District ,......... 17,790,241 8 1C25 Provincial ,, ......... 20,398,228 93o0Z National ........ 21,794,331 98.4z Hungarians ................ 183,422 o.83 Germans ............... 93,442 0-42 Other foreigners ........ 73,149* 0-33
* Among whom were 40,152 Italians, I i,654 Russians, 5,885 Swiss, 2,667 Romanians, 2,347 Turks, 2,287 French, 1,988 English, &c.
An examination of Table IV (in the Appendix) shows very distinctly that migration proceeds at vastly different rates in the various provinces constituting the Austrian monarchy. This is not merely to be gathered from the differences exhibited by the parochial element, but more especially from the numbers belonging to each province who were enumerated in provinces in which they had not acquired civic rights at the time the census was taken. In the case of frontier provinces, however, it should not be forgotten that they would occupy a different position were we able to trace the migrants who have gone from them to foreign parts, even though it be merely to the nearest parish lying beyond the frontier. Vorarlberg, the Tyrol, and the Bukowina would not then rank among provinces which have gained from migration, for they have gained only if we do not look beyond the political boundaries of the empire.
Austria at large may fairly be classed among those countries whose natural increment is in excess of the actual growth of its population, but this excess is not very considerable, the births between the last censuses having exhibited an excess over deaths of I,8i8,ooI, as compared with an actual increase of 1,749,264 souls. And whilst other countries send their surplus population across the ocean, Austria sends hers mainly to neighbouring States, Hungary and the German Empire alone containing 354,ooo resi- dents of Austrian birth, whilst the whole of the United States only contain 124,000. The main currents of this frontier migra- tion flow into Germany and Hungary, but especially into Germany, either up the valley of the Danube, down that of the Weser, or across the Ore mountains into Saxony. The two currents which flow into Hungary, the one down the valley of the Danube towards Budapest, the other between the valleys of the Drave and the Save, are almost if not wholly neutralised by contrary currents, which cross the Austrian boundaries at the same places and elsewhere, and which result in the exchanges of natives almost balancing each
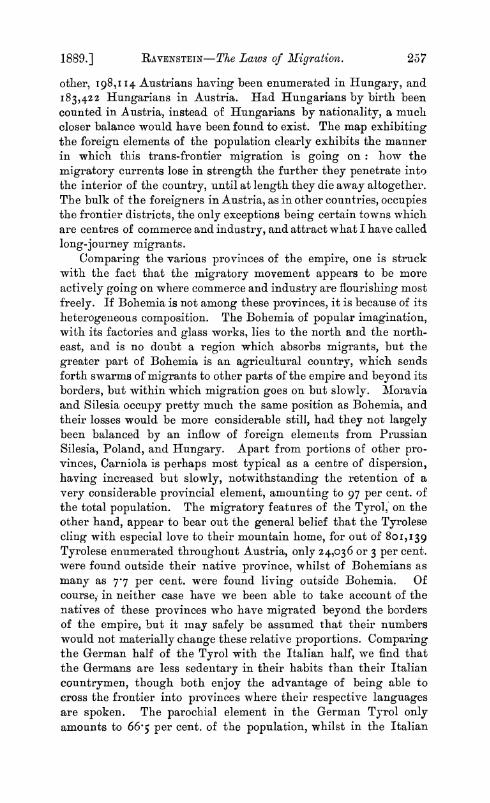
1889.] RAVENSTEIN-The Laws of Migration. 237
other, 198,I I4 Austrians having been enumerated in Hungary, and 183,422 Hungarians in Austria. Had Hungarians by birth been counted in Austria, instead of Hungarians by nationality, a much closer balance would have been found to exist. The map exhibiting the foreign elements of the population clearly exhibits the manner in which this trans-frontier migration is going on: how the migratory currents lose in strength the further they penetrate into the interior of the country, until at length they die away altogether. The bulk of the foreigners in Austria, as in other countries, occupies the frontier districts, the only exceptions being certain towns which are centres of commerce and industry, and attract what I have called long-journey migrants.
Comparing the various provinces of the empire, one is struck with the fact that the migratory movement appears to be more actively going on where commerce and industry are flourishing most freely. If Bohemia is not among these provinces, it is because of its heterogeneous composition. The Bohemia of popular imagination, with its factories and glass works, lies to the north and the north- east, and is no doubt a region which absorbs migrants, but the greater part of Bohemia is an agricultural country, which sends forth swarms of migrants to other parts of the empire and beyond its borders, but within which migration goes on but slowly. Moravia and Silesia occupy pretty much the same position as Bohemia, and their losses would be more considerable still, had they not largely been balanced by an inflow of foreign elements from Prussian Silesia, Poland, and Hungary. Apart from portions of other pro- vinces, Carniola is perhaps most typical as a centre of dispersion, having increased but slowly, notwithstanding the retention of a very considerable provincial element, amounting to 97 per cent. of the total population. The migratory features of the Tyrol. on the other hand, appear to bear out the general belief that the Tyrolese cling with especial love to their mountain home, for out of 801,139 Tyrolese, enumerated throughout Austria, only 24,036 or 3 per cent. were found outside their native province, whilst of Bohemians as many as 7-7 per cent. were found living outside Bohemia. Of course, in neither case have we been able to take account of the natives of these provinces who have migrated beyond the borders of the empire, but it may safely be assumed that their numbers would not materially change these relative proportions. Comparing the German half of the Tyrol with the Italian half, we find that the Germans are less sedentary in their habits than their Italian countrymen, though both enjoy the advantage of being able to cross the frontier into provinces where their respective languages are spoken. The parochial element in the German Tyrol only amounts to 66-5 per cent. of the population, whilst in the Italian
258 RAVENSTEIN-TDie Laws of Migration. [June,
Tyrol it reaches 87-5 per cent.; the provincial elements being respectively 95-4 and 97-9 per cent. The " Wandertrieb," which the Teutonic race sometimes claims as a characteristic peculiar to itself, therefore makes itself felt also in the Tyrolese hills, or ought we not, rather, to ascribe this difference to the greater sterility and smaller resources of the German Tyrol ?
Those provinces of Austria which appear to profit most largely from the migration going on within the empire, as well as from immigration from abroad, are Lower Austria, Styria, Salzburg, and the city of Trieste. Lower Austria owes this position mainly to the Kaiserstadt, Vienna, which shares with other large cities the peculiarity of growing largely at the expense of the surrounding country. Vienna in 1881 had 726,1i5 inhabitants, of whom 250,872 (34-5 per cent.) were Viennese citizens, whilst 94,439 (X3 per cent.) had their "legal settlement" in other parts of Lower Austria. Every province of Austria furnished a contingent to swell its population, whilst among " foreigners " (i2@9 per cent.) the Hungarians (66,578) and Germans (i8,201) were most largely represented.
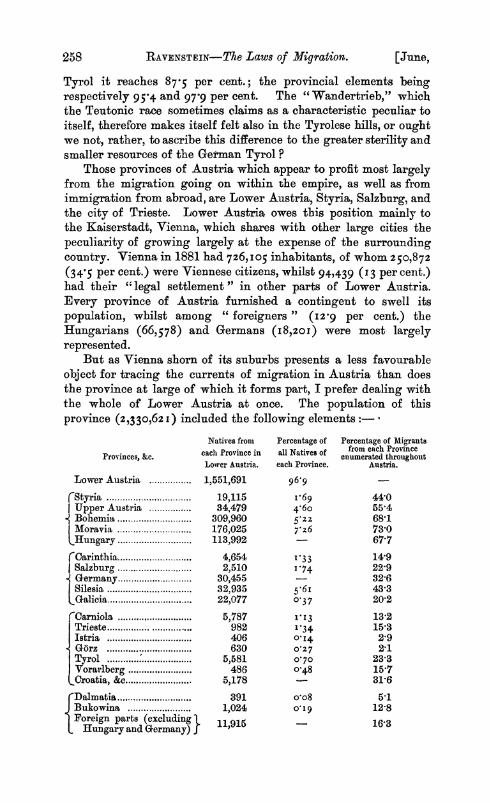
But as Vienna shorn of its suburbs presents a less favourable object for tracing the currents of migration in Austria than does the province at large of which it forms part, I prefer dealing with the whole of Lower Austria at once. The population of this province (2,330,62 i) included the following elements:
Natives from Percentage of Percentage of Migrants
Provinces, &c. each Province in all Natives of from each Province Lower Austria. each Province. Austria.
Lower Austria ................ 1,551,691 96,9
CStyria ......... ........... 19,115 ri69 44.0 C Upper Austria ................ 34,479 4-60 5514 . Bohemia ................... 309,960 5-2Z 68-1
Moravia ............................ 176,025 7z 6 73,0 Hungary ................... 113,992 - 67-7
rCarinthia .................... 4,654 I-33 14-9 | Salzburg ................... 2,510 I .74 22-9 I Germany ................... 30,455 - 32-6 |Silesia .................... 32,935 5-6i 43-3 ~alicia ................................ .22,077 0-37 20-2 t Oarniola ........................... 5,787 1I3 13-2 Trieste ................ ............... 982 1. 34 15-3 Istria ............ ......... 406 O-I4 2-9 Gorz ................. 630 0-27 2-1 Tyrol . 5,581 0.70 23-3 Vorarlberg ................... 486 0-48 151 Croatia, &c ................... ,178 5 31-6 {Dalmatia ................... 391 o-o8 5-1 Bukowina ..................... 1,024 019 12-8 Foreign parts (excluding 11915 16*3
Hungary and Germany) 1 1
1889.] RAVENSTEIN-The Laws of Migration. 259
It will thus be seen that the bulk of the migrants to be found in Vienna have come from the adjoining provinces, which have been the most liberal contributaries, absolutely, as well as relatively to the number of migrants which they have sent forth altogether. If Bohemia contributed so much more largely than other provinces which apparently enjoy greater geographical facilities, this is due to the position of that country on the frontier. We can take into account only those Bohemians who have been enumerated in Austria, but not the large number to be found in the neighbouring districts of Bavaria, Saxony, and Prussian Silesia. And what applies to Bohemia applies equally to other frontier provinces, and more especially to Salzburg, Silesia, and Galicia. The percentages allotted to these provinces would have been lower had we been able to take account of the whole of the natives of these provinces, instead of only those among them who resided in Austria when the census was taken. That such is really the fact is amply proved if we convert Styria into a frontier province, by looking upon. Carniola, Carinthia, the Tyrol, and all outside them as a foreign border land. By doing this the Styrians enumerated in Lower Austria would form 75 8 per cent. of the migrants from that province, instead of forming only 44 per cent. At all events our table, although presenting a distorted picture of the facts, nevertheless proves that the bulk of the migrants from the border provinces find their way into Lower Austria, and that distance and facilities of access are important factors, even in the face of diverting currents produced by other centres of attraction.
As to female migration, the Austrian statistics show once more that females form a majority among short-journey migrants, for 73 per cent. of the Austrian males were enumerated in their own parish, whilst the proportion of -women in a similar position was only 7i. Among migrants going longer distances, however, the females are in a decided minority.
Htungary.
The kingdom of Hungary, including Croatia and Slavonia, had in 1880 a population of 15,642,102 souls, constituted as to birth places in the following manner:
Born in the parish in which enumerated ........ 11,653,392 74-6o per cent. ,, county ,, ........ 14,103,460 9 0g30
Total born in Hungary ...................... 15,400,677 9855 ,,
Born in Austria ...........,.................. 198,114 I-27
, other foreign countries ........................ 27,413 o-i8 Birth place not known ... 15,898 - -
I have given the details for each county or " comitat" in the Appendix (Table V). Unfortunately, although the inquiries as to
260 RAVENSTEIN-The Laws of Migration. [June,
birth places were exceedingly minute, the results, as published, prove but a halting guide when inquiring into the laws which govern migration. The census publications enable us to determine the elements of the county populations, but they neither inform us as to the total number of natives of each county, nor as to their dispersion throughout the kingdom.
Nevertheless, the recorded number of births and deaths justifies us in placing Hungary among regions of dispersion, notwithstanding a very remarkable inflow of foreign elements. The natural growth between 1870-80 amounted to 486,359 souls, notwithstanding aui extraordinary severe visitation of cholera9 in 1872-73, whilst the actual growth only reached 229,013. Hungary thus suffered an absolute loss of 256,346 of her children. If am inclined to believe that the majority of these emigrants must have been Non-Magyars, for if we examine an ethnological map of Hungary, we shall find that Slavs, Germans, and Romanians, occupy more especially the periphery of the kingdom, and that by merely crossing the boundary they will find themselves among kinsmen, speaking the same language and observing similar cus- toms. Not so the Magyars of Central Hungary. If I am correct in this supposition, the process of migration should result in a, gradual Magyarization of the country, unless, indeed, we assume that the Magyars migrating into other districts of the same kingdom become denationalised, which is not probable. I am inclined, too, to believe that this outflowing current largely sets in the direction of the Balkan peninsula.
This outflow of natives is in a large measure made lp by an inflow of foreigners. The number of " foreigners," and especially of natives of the neighbouring provinces of Austria, is very con- siderable. Our map shows very clearly the method of this foreign invasion. One stream, and that the principal one, appears to follow the broad valley of the Danube, until the absorbent power of the capital weakens its strength; another stream enters the country to the south-west, and spreads over the kingdom of Croatia and Slavonia, which since the abolition of the military frontier system appears to have made considerable progress in wealth and popula- tion.10 The Carpathians form no obstacle to an overflow of popu- lation from Galicia, and through the "Wiron gate " and the passes of the Transylvanian Alps other foreigners have found their way into the country. The preponderance of the Austrians amongst
9 Th 6 natural growth, had there been no cholera epidemic, would have amounted to z,265,000 souls, being at the annual rate of o07Z per cent.
10 In Croatia-Slavonia, at all events, the actual growth between 1870-80 exceeded the natural to the extent of 5,932 souls, and this home-rule province, notwith- standing its situation on the frontier of the empire, consequently constitutes a centre of absorption, its gain amounting to owo6 per cent.
1889.] RAVENSTEIN-The Laws of Migration. 261
these foreign residents in Hungary is very marked. Only in five counties of distant Transylvania are they outnumbered by foreigners of other nationalities, namely, by Romanians. The tendency of this foreign invasion is in the direction of the lower Danube and towards the Balkan peninsula, proving once more that geographical features constitute a very important element in determining the direction of migratory currents.
But if we are pretty safe as to the character of the whole country, our available information does not enable us to divide the kingdom into regions of absorption and dispersion. We are how- ever safe in assuming that those counties which have increased their populations at an exceptional rate, must be numbered among "counties of absorption;" whilst those, at the other extremity, whose population has been dwindling, and which at the same time muster a strong native county element, are foremost among counties of dispersion. The former class has increased its popu- lation far in excess of what could have been the result of natural growth; whilst in the latter natural growth has been outstripped by migration into neighbouring counties holding out greater material prospects. We shall then find that there exist two great regions of attraction in Hungary, viz., the counties bordering -upon the Danube as far as and even beyond Budapest, and the more fertile portion of Croatia, as far eastwards as Peterwardein. Kronstadt in Transylvania might perhaps be added to these as a minor centre of attraction. The counties which appear to have furnished the largest number of migrants are those lying in the mountainous regions of the Carpathians and of Transylvania.
The towns throughout the country have grown at the expense of the surrounding rural districts, for between 1869-80 the towns of Hungary increased 457,244 souls in population, whilst the rural districts actually suffered a loss of 318,484 souls.
Women certainly are greater migrants than men, but they go shorter distances. Men actually constitute a majority of the parochial element, clearly showing that many more women than men must have left their native places to seek their fortunes else- where. Among migrants however who have gone longer distances the men are, as a rule, in the majority.
Budapest calls for special notice. The capital has grown with surprising rapidity since it became the centre of a kingdom, all but independent of Vienna. Its population between 1869 and 1880 increased 33-3 per cent., and if we examine into its elements we discover at once that this increase is not due to natural growth, which is very small indeed, but almost exclusively to an inflow of strangers from all parts of the kingdom, as also from the neigh- bouring provinces of Austria. The Hungarian census returns do
262 RAVENSTEIN-The Laws of Migration. [June,
not enable me to analyse this population as I have been able to do in the case of many English towns, and I must therefore content myself with presenting the following summary, based upon information published in M. Joseph K6r6si's admirable "Die " Hauptstadt Budapest in Jahre 1881," where also a map is to be found illustrating this process of recruiting:
Natives of each Percentage Percentage a fPopulation of Counties, &c. Residing in of Population of Counties, &c., named
Budapest. Budapest. in the Budapest. Budapest. First Column.
Budapest ............ ....... 151,981 4z-7 42-72 Pest, rural ................... 27,496 7'73 4-35 Srvuhlweissenburg (Feher).... 12,710 3-57 6-06 Komorn ........... ........ 6,292 I 77 4-12 Gran (Esztergom).2 . 2.449 o269 3148 Hont ......... .......... ,474 0o98 3 00 Raab (Gydr) ................... 3,516 0?99 3-20
Lipt . .................... 4,628 c30 622 Tur6cz ................... 1,480 ? 4z 3-22
Rest of Hungary ................ 102,216 z8.74 0 73 Austrian Empire .......... 33,004 9.z7 0-08 Other foreign parts ........... 5,200 r46 Not known............................ 1,236 036
Total .............. 355,682* 100-00
* This is the "residential" population (Wohnbev6lkerung), which differs to some extent from the actual civil population given in the appendix.
On examining this table it will be seen that the bulk of the migrants are derived from the counties immediately surrounding the capital, with a decided tendency of the counties lying westward furnishing a larger contingent than the counties lying to the east and south-east. This only illustrates the fact of a main current of migration flowing from Austria down the Danube as far as Budapest, where its strength becomes exhausted." There are how- ever, two counties (Lipt6 and Turocz) which lie far away in the Carpathians, but which nevertheless furnish a much larger con- tingent, proportionately to their population, than other counties which are geographically much more accessible. This circumstance has led M. K6r6si to make the assertion that geographical posi- tion, that is to say distance from the centre of attraction, has nothing to do with migration. In this I believe he is mistaken. There are, of course, exceptional circumstances, but distance from the centre of attraction, modified by facilities of access, and the
11 A comparison of the censuses taken in 1869 and 1880 shows that this easterly current is losing in intensity.
1889.] RAVENSTEIN-The Laws of Migration. 263
existence of rival centres of attraction, would appear to be in all cases the principal factor to be taken into account. It is not with the population of these distant counties with which we ought to compare the migrants from them which are to be found in Budapest, but with the total number of migrants who have left these counties to seek their fortunes elsewhere.
As to sexes, we find that the females preponderate among the Hungarian migrants who come to Budapest-there are i i i females to ioo males-and that this is more especially the case with refer- ence to the counties in the more immediate vicinity of the capital, which furnish the largest contingents of domestic servants. Among foreigners, on the other hand, the males preponderate largely, the only exceptions being the English, Swiss, and French migrants, amongst whom governesses are very numerous.
The huge currents of migration which set in the direction of Budapest have naturally produced counter currents of weaker force, but still traceable. And these currents even Lipto and Turocz have experienced, notwithstanding their obscure position in the Carpathian hills. Out of I75,223 natives of Budapest, as many as 23,242 (I3yz6 per cent.) resided in 1880 outside their native town.
The Balkan Peninsula.
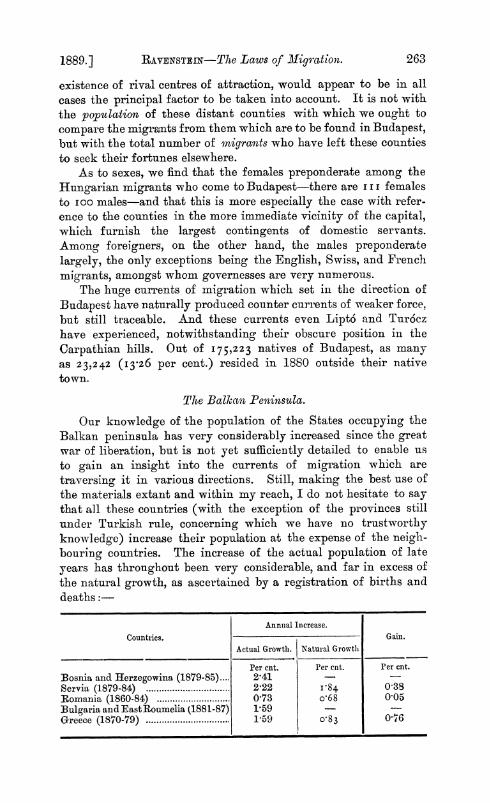
Our knowledge of the population of the States occupying the Balkan peninsula has very considerably increased since the great war of liberation, but is not yet sufficiently detailed to enable us to gain an insight into the currents of migration which are traversing it in various directions. Still, making the best use of the materials extant and within my reach, I do not hesitate to say that all these countries (with the exception of the provinces still under Turkish rule, concerning which we have no trustworthy knowledge) increase their population at the expense of the neigh- bouring countries. The increase of the actual population of late years has throughout been very considerable, and far in excess of the natural growth, as ascertained by a registration of births and deaths:-
Annuial Increase.
Countries. Gain.
Actual Growth. Natural Growth
Per cnt. Per cnt. Per cnt. Bosnia and Herzegowina (1879-85) .... 2-41 0- Servia (1879-84) ........................... 2-22 I84 038 Romania (1860-84) ........................... 0 73 o-68 005 Bulgaria and EastRoumelia (1881-87) 1-59 _ Greece (1870-79) ........................... 1-59 o083 0-76
,
264 RAVENSTEIN-TThe Laws of Migration. [June,
If these statistics can be trusted, the provinces recently freed from the government by the Turks are more rapidly increasing in population than any other part of Europe, and this increase, at least in some of them, is undoubtedly due to an inflow of popula- tion from abroad.
Bulgaria. Bulgaria, on 13th January, 1881, had a population of 2,007,919
souls, of whom 37,635, or i-88 per cent., are stated to have been born abroad. This comparatively large proportion of persons of foreign birth, in a country as yet so little developed, is accounted for by its extended boundaries, which bring it into contact with many foreign countries. The foreign element varies, in the different districts, between 1io and 9-9 per cent. It is smallest in the remote and least accessible regions of the Central Balkans, and most considerable in the east, where Bulgaria opens upon the Black Sea and along the Danube.
The foreign element amounts to 9g9 per cent. in Varna, to 5 5 per cent. in the adjoining district of Provadnaye (Provady), to 4+6 per cent. in Silistria, to 2 .6 per cent. in Russe (Rushchuk), and to 2V3 per cent. in Vidin. No details as to the origin of this foreign element are given, but we may safely conclude that it includes a large proportion of Austrians and Hungarians.
Romania. Our information respecting the population of this interesting
State is most incomplete. Births and deaths are registered, but no census has been taken since 1859-60, in which year the two principalities are supposed to have had a population of 4,424,96i souls. As 786,768 more persons were born between 1860 and 1884 than died, the population at the close of 1884 ought to have amounted to 5,2II,729 souls, if its increase had depended upon natural growth alone. If we can trust an estimate of the popula- tion made for 1884, which places it at 5,268,ooo souls, the immigra- tion between 1860 and 188-1 must have much exceeded emigration. We are inclined to think that Romania is a country of absorption, which receives large accessions to its population from the neigh- bouring States of Hungary, Austria, Bulgaria, and perhaps also from Russia, but in the absence of a census, it is quite impossible to fix the amount.'2
12 M. L. Cretzulesco (" Bulletin" of the Romanian Geographical Society, 1876) estimates the natural growth between 1860 and 1873 at 365,900, the actual growth at 648,ooo souls, and therefore assumes a gain of 282,ioo by immi- gration, which appears to us to be far in excess of the truth. According to him there lived in Romania, exclusive of the Dobruja (1873) 85,ooo Slavs, 29,500 Hungarians, 39,ooo Germans, 8,ooo Armenians, 5,ooo Greeks, &c. Many of these are, however, natives of Romania and not migrants.
1889.] RAVENSTEIN-The Laws of Migration. 265
In the Dobraja there were enumerated in 1878 i6,22o Russians, 2,471 Germans, &c., but it is quite impossible to say how many of these were natives of that district, and how many immigrants.
Denmark. Denmark on 1st February, 1880, had x,969,039 inhabitants,
distributed according to places of birth as follows: Natives of Denmark .................. . 1,904,750 96-79 per cent.
,, Iceland, Danish colonies .... 1,306 o o5 ,, foreign countries .62,983 3-16 it
Amongst persons of foreign birth there were 24,148 Swedes, 22,007 Scbleswigers, I , 145 other Germans, and 2,823 Norwegians. Foreigners are most numerous in the capital, where they form 7-96 per cent. of the total population (nearly one-half Swedes), and they are least so in the rural parts of the kingdom (2-12 per cent.).
As the natural growth (1870-80) amounted to 224,200, whilst the actual increase of the population only reached i84,298, Den- mark, during this decade, suffered a loss of 39.902 natives, and consequently takes rank among regions of dispersion. The goal of a majority among the Danish emigrants is North America. The inflowv of natives of neighbouring countries is far larger than are the counter currents of migrants issuing from Denmark, and whilst the number of Danes in Germany, Sweden, and Norway, is only 27,625, that of natives of these countries in Denmark amounts to 60, 123.
Norway. The population of Norway on 31st December, 1875, was divided
as follows as to place of birth and residence (see Table VI):- Parochial element ................ 1,319,912 73'o5 per cent. District ,, ................ 1,575,916 87'zI ,, National ,,................. 1,769,640 98-94 ,, Foreign ,, ................ 37,260 z2o6
Total .................... 1,806,900 i oooo ,,
As the natural growth of the population (1866-75) amounted annually to I-22 per cent., whilst the actual growth only reached o-6o per cent., Norway must take its place amongst regions of dispersion, and the vast majority of Norwegians who have left their native country have found a new home in the United States.'3 Migration within Norway itself (see Table VI in the Appendix) has yielded the largest profits to the two cities of Kristiania and
13 Norwegians in Sweden 4,433, Denmark 2,823, Germany x,865, British Isles 3,203, in the United States 1 8 1,729.
266 RAVENSTEIN-The Laws of Migration. [June,
Bergen, and next to these rank the two northern districts of Tromsoe and Finmark, which owe their position mainly to an inflow of migrants from the neighbouring districts of Sweden and Finland. The greatest loss, on the other hand, was suffered by Kristiansamt, a district shut off from the sea, and having no contact with foreign countries. That the towns are the largest gainers is most clearly shown by comparing the city of Bergen with the rural district of Bergenhus which surrounds it.
Females are greater migrants than the males, for the parochial element only includes 104 females to ioo males, whilst among the rest of the population the proportion is as II 2 100, and through- out the country as 1o6: 100.
Of the 37,260 foreigners, as many as 29,340 were natives of Sweden. The foreign element is strongest in Finmark (I1232 per cent.), and next to it in Kristiania (6 i9 per cent.), and the dis- tricts immediately adjoining the capital. A very strong current of migration sets from Sweden into Norway, whilst the outgoing currents are stronger than the inflowing ones as regards Denmark, Germany, and all other countries.
Sweden. The population of Sweden included on 31st December, 1880,
the following elements: Parochial element ................ 3,642,514 79'9z per cent. District (Liin) element ........ 4,035,352 88,54 ,,
National element .................... 4,539,046 99-59 Foreign , .................... 18,582 04I ,
Not ascertained .................... 8,040
4,565,668 iooC0 ,
As the population of Sweden, between 31st December, 1870, and 31st December, 1880, increased 397,143 souls, whilst the natural growth yielded a surplus of 535,897 souls, that country, like the greater part of Europe, takes its place among regions of dispersion. It is supposed that 275,ooo natives of Sweden resided at the time of the last census in foreign countries, of whom 194,337 were enumerated in the United States, 28,826 in Norway, 24,150 in Denmark, and ii,885 in Germany. Sweden therefore is a centre of dispersion, even though we take account only of her European neighbours, for the number of persons of foreign birth who have taken up their abode in Sweden is relatively very small.
If we confine ourselves to that migration which is going on within the limits of Sweden, we shall discover (see Table VII in the Appendix) that there exist four districts of absorption. The first of these includes the maritime region from the Sound to the
1889.] RAVEKSTEiN-The Laws of Miigration. 267
Norwegian border (with Gbteborg); the second includes the capital (Stockholm), and the " h1ns " lyingf to the north-west of it; the third is represented by North Bothnia (Norrbotten); and the fourth is confined to the island of Gotland. It should however he observed that the "hins " of Jomtland and North Bothnia lie on the frontier, and that many of their natives have crossed into Norway. By adding these emigrants to the migrants actually enumerated in Sweden, these two " ians " would take their place among regions of " dispersion."
Towns profit by migration at the expense of the rural parts of the country, for whilst between 1871 and 1880 the loss due to home and international migration amounted to I38,754 souls,' the towns actually made a gain of i00,875 souls.
Female migrants are more numerous than male migrants, for there are only 10o48 females to ioo males in the parochial element, whilst there are Io6-I7 in the district element, and io6-i5 in the national element.
Migration has undoubtedly increased since the development of means of communication, for in 1860 the district element still formed 92-8 per cent. of the population, whilst in 1880 it only formed 88-4 per cent. Or, to put it differently, in 1860 only 7 per cent. of the native population lived outside their native district, as compared with i i I per cent. who did so in 1880.
As to foreigners, their number is small, and the bulk of them has come from the neighbouring countries, namely Denmark (4,575), Norway (4,433), Finland (3,401), and Germany (3,289). They are most numerous in such towns as Stockholm, Malm6, and Goteborg, as also in the frontier districts.
Finland.
Finland, on 31st December, 1880, had 2,046,730 inhabitants, of whom only 14,052 (o-68 per cent.) were of foreign birth, including 7,947 Russians, 3,693 Swedes, 522 Germans, and i,890 others. The natural growth of the population is considerable, for between 1870 and 1880 it amounted to I '49 per cent. yearly, but as the actual growth is larger still (i *S per cent.), Finland, notwitb- standing its remote position, and apparent poverty in natural resources, is one of those countries which increase to some extent at the expense of their neighbours. The gain, however, is not very large, having amounted between 1870 and 1880 to only 10,905 souls.
Russia.
The population returns from the Russian Empire still leave
14 Actual growth 397,143, natural growth 531,897, loss 138,754, the rural parts suffering a correspondingly greater loss of 239,629 souls.
268 RAVENSTEIN-The Laws of Migration. [June,
much to be desired, and they leave us altogether in doubt as to the birth-places of the inhabitants. We are however in possession of apparently trustworthy returns of those persons, whether Russians or foreigners, who have openly crossed the frontiers, and these afford us some insight into the " exchange " which is going on between European Russia on the one hand, and the outer world on the other.
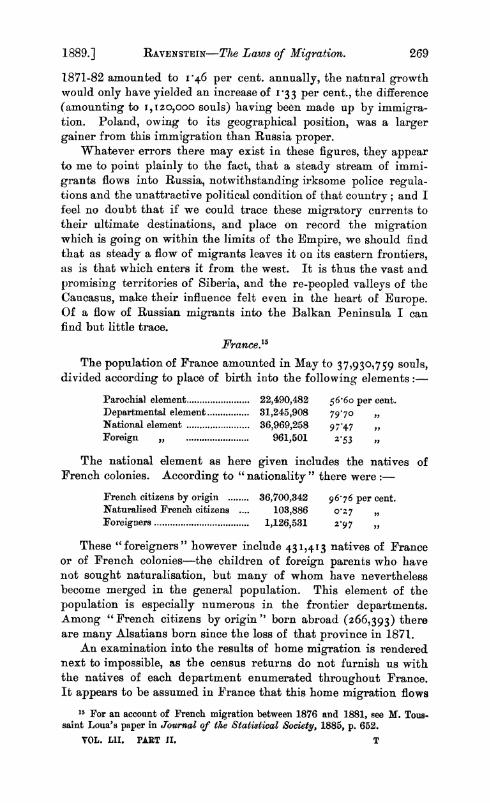
We gather from these returns that the number of foreigners who entered European Ruqssia between 1851 and 1886 was greater by I,733,44I than the number of foreigners who left that empire, thus exhibiting a very considerable inflow of population. On the other hand, 846,931 more Russians left their native country during the period under review than entered it. Balancing profits and losses, we thus find that Russia in the course of these thirty-six years gained an accession of 886,5io souls to her population.
These gains (or losses) fluctuate considerably during different epochs, as may be seen from the following tabular statement:-
Gain from Foreign Loss from Immigration. Russian Emigration. Ultimate Result.
1851-60 ......, 'I7772 234,038 Loss 1O2,z66 '61-70 ....... 461,302 44,998 Gain 4i6,304 '71-80 ....... 609,863 349,516 ,, 260,347 '81-86 ....... 531,504 218,379 ,, 3I3,1z5
Total... I,73344I 846,931 Gain 886,50
These figures show very plainly that Russia in Europe is one of the countries which absorb population, and our expectation that the elements absorbed should in the main be derived from the border countries is fully borne out by the available statistical returns, for among the foreign immigrants in excess of the emi- grants of foreign birth (or nationality ?) as many as 95i,896 were Germans, 677,054 were Austrians, and 41,o83 Romanians, leaving only 63,408 for the rest of the world, the British Islands furnishinog 12,765 towards that residue. That this inflow of migrants should create a counter-current of migration or "out-flow " is plainly seen, not only from the Russian returns, but also from those of other countries. The bulk appear to have settled in the neigh- bouring countries (Germany and Austria), for trans-oceanic emigration from Russia is still in its infancy. Of the net loss in native population which Russia suffered in 1871-86, only 175,934 persons are recorded as having arrived in the United States, whilst 391,96i persons found a home elsewhere.
An inquiry into the natural growth of the population of Russia leads to the same conclusion, for whilst the actual growth between
1889.] RAVENSTEIN-The Laws of Migration. 269
1871-82 amounted to I-46 per cent. annually, the natural growth would only have yielded an increase of 133 per cent., the difference (amounting to I, 120,000 souls) having been made up by immigra- tion. Poland, owing to its geographical position, was a larger gainer from this immigration than Russia proper.
Whatever errors there may exist in these figures, they appear to me to point plainly to the fact, that a steady stream of immi- grants flows into Russia, notwithstanding irksome police regula- tions and the unattractive political condition of that country; and I feel no doubt that if we could trace these migratory currents to their ultimate destinations, and place on record the migration which is going on within the limits of the Empire, we should find that as steady a flow of migrants leaves it on its eastern frontiers, as is that which enters it from the west. It is thus the vast and promising territories of Siberia, and the re-peopled valleys of the Caucasus, make their influence felt even in the heart of Europe. Of a flow of Russian migrants into the Balkan Peninsula I can find but little trace.
France.'5
The population of France amounted in May to 37,930,759 souls, divided according to place of birth into the following elements:-
Parochial element ................... 22,490,482 56-6o per cent. Departmental element ................ 31,245,908 79,70 National element ................... 36,969,258 9, 7 ,,
Foreign ,, ................... 961,501 2-53
The national element as here given includes the natives of French colonies. According to " nationality " there were:
French citizens by origin ........ 36,700,342 96-76 per cent. Naturalised French citizens .... 103,886 O27 ,,
Foreigners.................................... 1,126,531 2-97
These "foreigners" however include 431,413 natives of France or of French colonies-the children of foreign parents who have not sought naturalisation, but many of whom have nevertheless become merged in the general population. This element of the population is especially numerous in the frontier departments. Among " French citizens by origin " born abroad (266,393) there are many Alsatians born since the loss of that province in 1871.
An examination into the results of home migration is rendered next to impossible, as the census returns do not furnish us with the natives of each department enumerated throughout France. It appears to be assumed in France that this home migration flows
15 For an account of French migration between 1876 and 1881, see M. Tous- saint Loua's paper in Journat of the Statistical Society, 1885, p. 652.
VOL. LMI. PART 11. T
270 RAVENSTEIN-The Laws of Migration. [June,
most actively out of those departments in which the preponderance of the female sex is most marked,16 or, in other words, that the males take the lead in migration even for such short distances as those from one department to another. Such no doubt is the case in some departments, as in that of the Creuse, which exports an ever increasing number of men into other parts of France, whilst retaining most of its women. It cannot however be the case everywhere, and notably not in the case of the department of the Seine, in which the females are slightly in excess, but which notwithstanding this fact is a centre of absorption and not one of dispersion. In fact the preponderance of one sex or of the other in a department explains nothing, unless we learn at the same time how this preponderance was brought about, whether by a departure of the males, or by an inflow of females.
But if we are unable satisfactorily to trace the currents of home migration, we are in a position to estimate the gain and loss resulting from home and international migration jointly. Between December, 1881, and 30th May, 1886, the natural growth of the population would have amounted to 376, io8 souls had there been no emigration, whilst the actual growth amounted to 525,469 souls, the immigration of persons born abroad thus balancing not only all losses resulting from emigration, but leaving in addition a handsome profit of I49,36i souls. Full details as to the gains or losses of each department will be found in Table VIII of the Appendix, and it will there be seen that the great regions of absorption cluster round Paris and Lyons, and the coast of the Mediterranean in the direction of Marseille; whilst the remotely situated departments are most prominent as regions of disper- sion.
On one other result of migration the published census results enlighten us sufficiently, namely, with reference to its effects upon the population of the towns and of the rural parts of the country. The towns of France between 1881-86 exhibited a natural growth of 43,665 souls, the rural parts of 332,443 souls, yet when the inhabitants were counted in 1886 the towns were found to have made a gain of 626,30I souls, whilst the rural parts had sustained a loss of 455,554. The gain of the towns proportionately to the population of 1881, amounted to 4f78 per cent.; the loss of the raral parts reached iP87 per cent. In many of the large towns the natives must form a minority. In Paris the native town element only mustered 349 per cent.; the accessions from the outlying parts of the department of the Seine amounted to 3-I per cent.; but the contributions of the remainder of France reached 53-9I
la " Rdsultats statistiques du d6nombrement de 1886," p. 80 of the introduc- tion.
1889.] RAYENSTEN-The Laws of M7igration. 271
per cent., and those from foreign parts 89og per cent.17 Between 1881 and 1886, the rural parts have absolutely decreased in population (from 24,575,506 to 24,452,395), but I am not yet prepared to describe the loss by so ugly a word as " depopulation" of the rural districts.
On one other point the French census reports furnish a satis- factory answer, namely, as to whether migration is increasing. In 1866 the departmental element of the population still amounted to. 88-24 per cent.; in 1872 it had fallen to 86-25 per cent., and in 1886 to 840oo per cent., thus exhibiting a steady decrease, which can only have been brought about through a corresponding increase in the number of migrants.
Persons born abroad are more numerous in France than in any other country of Europe. Their influence in modifying the cha- racter of the people, though slow, should not be underrated, and the population of France would exhibit only a very small increase were it not for these formidable reinforcements received from abroad. The number of these foreign migrants is increasing, and their influence is all the more potent as their natural growth, not- withstanding the preponderance of men among them, appears to be greater than that of the native population. If there existed sta- tistics as to the parentage of all natives of France, such as we have for Canada and the United States, the result would possibly surprise in more than one respect. But even without these statistics, the influence of these foreign elements is sufficiently apparent in the foreign names of many persons who have achieved eminence in France.
Speaking broadly, persons of foreign birth are most numerous in the frontier departments and in certain maritime towns. Their nationality in these localities corresponds with that of the nearest foreign country, in fact, as concerns migration, political boundaries do not appear to exist: Germans, notwithstanding the hostile feeling supposed to be entertained towards them, have nevertheless crossed the frontiers in considerable numbers, whilst natives of France have not allowed themselves to be deterred by rigorous passport regulations from crossing the French boundary into neighbouring parts of Germany.
Paris, no doubt, with its manifold attractions to migrants of a more select type, has attracted more foreign settlers (propor- tionately to its population) than many of the frontier departments. But whilst the foreign element in Paris only amounts to 8-og per cent., it reaches 9-33 per cent. in Meurthe-et-Moselle, ioN5 in the
17 I should have liked to have dealt with the elements of the population of Paris as fully as I have done in the case of other large towns, but the materials at my command do not admit of this.
T 2
272 RAVENSTEIN-The Laws of Migration. [June,
Nord, and I9z98 in Belfort. Passing from German Lorraine in the direction of Paris, the foreign element amounts to 9-33 per cent. in the frontier department of Meurthe-et-Moselle, to 2-72 per cent. in that of the Meuse, to 3-74 per cent. in that of the Marne, to 3-0I per cent. in that of the Seine-et-Marne, and to 7-72 per cent. in that of the Seine.
Persons born abroad are not classified according to their place of birth: instead of this we are furnished with the number of " foreigners " distinguished according to nationalities. We thus learn that these "foreigners" included 482,26I Belgians, 264,568 Italians, ioo,1i4 Germans, 79,550 Spaniards, 78,584 Swiss, 37,149 Dutch and Luxemburgers, 36,134 English, &c.
* Italy. According to the census taken in Italy on 31st December, 1881,
the population of that kingdom (28,459,628) included:-
Persons born in Italy ............ 28,358,807 99-64 per cent. ,, abroad ............... 100,821 o36 ,,
Of these latter only 59,956 were "foreigners." No details are given which would enable us to trace the migratory movements going on,18 but we are furnished with ample information on the geographical distribution of persons of foreign birth. This dis- tribution exhibits the usual features, viz., a massing of these foreign migrants in the frontier provinces, at certain sea ports (Leghorn, Naples), and at a few favoured localities in the interior (Rome and Florence). Thus in Liguria persons of foreign birth constitute I 33 per cent. of the population (due, in a measure, to the presence of winter visitors on the Riviera) ; in Venetia they form o64 per cent., in Piedmont o055 per cent., in Lombardy 0-53 per ceut., and in Tuscany, notwithstanding Leghorn and Florence, only 044 per cent. The city of Rome, with 2-34 per cent. of persons of foreign birth, forms an exception; but notwithstanding its attractions to holiday makers, lovers of art and religious pilgrims, it scarcely ranks before Milan (2-i8 per cent.), which enjoys the advantage of being near the frontier. A majority of these foreigners settle in the towns, for the foreign element in the population of the district capitals mustered I-22 per cent., whilst in the rural parts of Italy it did not rise higher than o1i9 per cent.
As the population of Italy increased 1,658,474 souls between the censuses of 1871 and 1881, whilst the recorded natural growth
18 Exceptions were made in favour of Rome and Milan. Of the total population of Rome (300,467), 134,156 persons (44-65 per cent.) were born in Rome, and 7,037 (2X34 per cent.) were born abroad. In Milan (population 32x,839) 1I55,714 (48'38 per cent.) were natives of Milan, whilst 7,028 (2I8 per cent.) were natives of foreign parts.
1889.] RAVENSTEIN-The Laws of Migration. 273
amounted to 2,020,789 souls, Italy must be classed with those countries which send forth larger number of emigrants than they receive in return. In this exchange Italy is generally the loser, as far as European States are concerned: in other words, the number of Italians in all the neighbouring -States, including Spain, France, Switzerland, Austria, and Hungary, is larger than that of natives of these States in Italy. The same may be said of the countries constituting the African and Asiatic seaboards of the Mediter- ranean. Nay, even the Italian contingents sent across the Alps into Germany and other remote regions appear to be larger than those received in return, and the Italian migrants enumerated in Germany are almost visibly increasing, having risen from at most 5,604 in 1880, to 8,234 in 1885. Italian emigration is annually assuming vaster proportions, and the Italian element in America, especially in the Argentina and Brazil, is steadily rising. In an official volume entitled " Censimento degli Italiani all' estero " (Rome, 1884), we are furnished with the following estimate of Italians residing outside Italy:
Europe. Africa America. Asia. Austral- Total. asia.
Italians by birth ............. 42,314 14,373 226,618 1,73 6 1,990 287,031 ,, born abroad ........ 26,981 I 2,685 191,618 2,722 655 234,954 ,, whose birthplace} 311,057 35,145 160,806 3,167 232 510,907 is not known
Total . 380,352 62,203* 579,335t 7,6z5 2,877 1,032,392
# Of whom 33,693 in Algeria, I i,io6 in Tunis, and i6,302 in Egypt. t Of whom z54,388 in the Argentina, i70,000 (?) in the United States, and
82,196 in Brazil.
Amongst these Italian emigrants the male sex preponderates throughout, there being only 65 females to every loo males, and this preponderance increases generally speaking with the distance from Italy.
A distribution of these emigrants amongst the provinces in which they were born is scarcely practicable, owing to defective returns, but as far as our information goes it would appear that those provinces which receive the largest accession of migrants from abroad furnish the heaviest contingents; and that the Italians who migrate into northern Africa are largely natives of Sicily and of Southern Italy generally. For further particulars on this subject I must refer to the work quoted above.
274 RAVENSTEIN-lTe Laws of Migration. [June,
Spain and Portugal.
Spain between 1860 and 1877 increased in population from I 5,673,536 to I6,625,860 souls, being an annual increase of o034 per cent. During the same period the natural growth, computed from very imperfect data, amounted to o038 per cent., showing that Spain- sustained a loss in her children slightly exceeding the gains derived from foreign immigration. Many, if not the majority, of these Spanish immigrants find a home in France and in northern Africa (Algeria), rather than in Spanish colonies and daughter States."' The Spanish census for 1877 only distinguishes between natives of Spain and persons born abroad, of whom there were 40,741.20 Our map shows that these foreigners are nowhere very numerous, and that the only provinces in which they exceeded i per cent. are Cadiz, Huelva, and Guipuzcoa. These are not only readily accessible provinces, but they are at the same time the centres of much commerce and industry (mining). That the Pyrenees form a very formidable barrier to migratory currents is plainly indicated on our map.
As to Portugal, our statistics are scanty in the extreme, but after a careful examination of the vital and emigration statistics, there can be no doubt that this country annually sustains severe losses by emigration. The annual increase of the population between 1864 and 1878 only amounted to o059 per cent. per annum, whilst the natural growth can hardly have been less than o073 per cent. There, as elsewhere, the rural population drifts to the large sea-port towns, and either remains there, or is carried further by migratory currents crossing the ocean.
A General Survey of Europe.
Before leaving Europe for North America, it seems only proper to summarise the results obtained thus far. This I have done in the following table:
19 Ibaiez (Espafia, 1888) estimates the Spaniards residing abroad at 346,485, including 114,320 in Algeria, 73,781 in France, 59,ooo in the Argentina, 39,730 in Uruguay, &c.
20 French 17,657, Portuguese 7,94i, English 4,771, Italians 3,497.
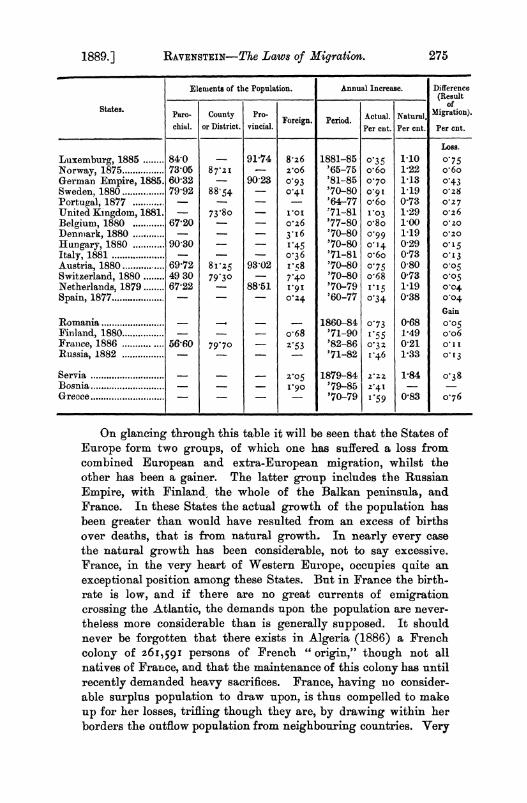
1889.] RAvENSTEIN-The Laws of Migration. 275
Elements of the Population. Annual Increase. Difference (Result
States. ~~~~~~~~~~~~~~~~~~~~~~of States. Paro- County Pro- Foreign. Period. Actual. Natural Migration). chial. or District. vincial. Per cut. Per cnt. Per cut.
Loss. Luxemburg, 1885 ........ 84-0 9174 8-26 1881-85 o03 5 1-10 0-75 Norway, 1875 ............... 73 05 87'21 - z2o6 '65-75 o 6o 1-22 o 6o German Empire, 1885. 60(32 90 23 0.93 '81-85 070 1-13 0.43 Sweden, 1880 . .............. 79-92 8854 0 041 '70-80 o-901 1119 o0z8 Portugal, 1877.. ...-.'64-77 o-6o 0173 0-27 United Kingdom, 1881. - 73.80 - roI '71-81 1.03 1-29 0-26
Belgium, 1880 ............ 67'20 -2 o6 '77-80 o-8o 1'00 0- zo Dennmark, 1880...- - 3.I6 '70-80 o99 1 19 0-20
Hungary, 1880 ............ 90 30 4- - I5 '70-80 0. 4 0-29 o0l5 Italy, 1881.. _ - 0-36 '71-81 o-6o 0073 0lI3 Austria, 1880 ............... 69-72 81l25 93-02 I;8 '70-80 0-75 080 005 Switzerland, 1880 ........ 49 30 79'30 - 740 '70-80 o-68 0-73 0o05 Netherlands, 1879 ........ 67-22 88-51 i*9i '70-79 I.15 1-19 o004 Spain, 1877 .... . 0_z4 '60-77 0-34 0'38 0-04
Gain Romania ............... _ -. - . 1860-84 0-73 0-68 o0o5 Finland, 1880 ............... o68 '71-90 I55 1-49 o o6 France, 1886 ............... 56-60 7970 -? _ -3 '82-86 0-;Z 021 o-11
Russia, 1882.- - -.-.'71-82 146 1-33 013
Servia ...................-......- .o5 1879-84 z2 z 1o84 0'38 Bosnia . I- - 9 o '79-85 2-4 -1
Greece............................ - '70-79 i.5p9 0Q83 o076
On glancing through this table it will be seen that the States of Europe form two groups, of which one has suffered a loss from combined European and extra-European migration, whilst the other has been a gainer. The latter group includes the Russian Empire, with Finland, the whole of the Balkan peninsula, and France. In these States the actual growth of the population has been greater than would have resulted from an excess of births over deaths, that is from natural growth. In nearly every case the natural growth has been considerable, not to say excessive. France, in the very heart of Western Europe, occupies quite an exceptional position among these States. But in France the birth- rate is low, and if there are no great currents of emigration crossing the Atlantic, the demands upon the population are never- theless more considerable than is generally supposed. It should never be forgotten that there exists in Algeria (1886) a French colony of 26i,59i persons of French " origin," though not all natives of France, and that the maintenance of this colony has until recently demanded heavy sacrifices. France, having no consider- able surplus population to draw upon, is thus compelled to make up for her losses, trifling though they are, by drawing within her borders the outflow population from neighbouring countries. Very
276 RAVENSTEIN-The Laws of M1tigration. [June,
different to this is the position in which Russia and the countries of the Balkan peninsula find themselves. There the population increases rapidly, but the undeveloped resources of these countries, although not equal to those of some favourite trans-oceanic fields of emigration, are such as to produce a considerable inflow of population from the rest of Europe.
The " losses " recorded in our table are largely due to trans- oceanic emigration, or they are at all events aggravated by it. This is more especially the. case as regards the United Kingdom, the German Empire, and Scandinavia. Whether Italy's losses are more largely due to migration within the borders of Europe than to trans-oceanic emigration I am not prepared to decide, seeing that our statistics are so very imperfect. The number of natives of Italy who live in other parts of Europe is about 342,ooo, and I believe this exceeds the natives of Italy who live outside Europe. Italian emigration is however assuming ever increasing propor- tions, and Italy gradually gains upon other countries which send huge contingents of migrants into other parts of the world. There can be no doubt however that the losses sustained by Belgium, Luxemburg, and Hungary are ascribable mainly to an emigration to neighbouring European States.
If we confine ourselves to migration within the limits of Europe, we shall find that some countries have lost in this exchange of natives of the soil, whilst others have been the gainers. As no data for Russia and the Balkan States are available, I am compelled to confine myself to Western Europe.
It will then be found that about the time the latest censuses were taken, 2,655,700 natives of Western Europe lived outside the State in which they had been born.21 Among this total there were 452,300 Germans, 447,800 Belgians, 404,1oo Austrians, 327,600 Italians, 202,700 Frenchmen, 194,100 Hungarians. 126,900 Swiss, 97,900 Netherlanders, 95,900 natives of the United Kingdom, 91,200 Spaniards, 74,700 Swedes, 46,900 Luxemburgers, 34,200 Danes, 30,500 natives of Man and the Channel Islands, &c. Of course these losses were in many instances more than made up by an inflow of migrants from other parts of Europe, and where this was not the case they were at least considerably reduced in amount. In the following statement I have arranged the various States of Western Europe into two groups, of which the first includes those States which have gained in population as a result of the migration going on within the limits of Western Europe, whilst the second group is formed of States which have been the
21 The figures I give are merely rough estimates, but I believe them to be fairly representative of the facts under consideration.
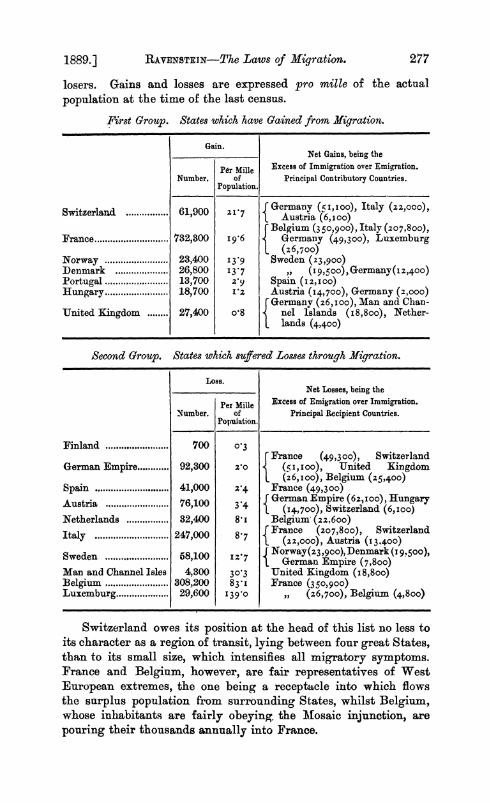
1889.] RAVENSTEIN-The Laws of Migration. 277
losers. Gains and losses are expressed pro mile of the actual population at the time of the last census.
First Group. States which have Gained from Migration.
Gain. Net Gains, being the
Per Mille Excess of Immigration over Emigration. Number. of Principal Contributory Countries.
Population.
Switzerland ................ 61,900 2617 Germany (51,100), Italy (zz,ooo), 1Austria (6, ioo)
( Belgium (350,900), Italy (207,800), France .732,300 I 96 Germany (49,300), Luxemburg
L (26,7oo) Norway .23,400 I3 9 Sweden (23,900) Denmark .26,800 13-7 , (I 9,500), Germany(i 2,400) Portugal .13,700 2-Y Spain (I2, 00)
Hungary........................18,700 Iz Austria (14,700), Germany (2,000) [Germanv (26, roo), Man and Chan-
United Kingdom 27,400 o'8 nel islands (i8,8oo), Nether- I lands (4,400)
Second Group. States which suffered Losses through Migration.
Loss. Net Losses, being the
Per Mille Excess of Emigration over Immigration. Number. of Principal Recipient Countries.
Population.
Finland .700 0-3 France (49,300), Switzerland
German Empire .......... 92,300 X o0 (5i,i00), United Kingdom _ (26,I00), Belgium (25,400)
Spain .41,000 2-4 France (49,300) Austria .76,100 3 4 German Empire (62,100), Hungary
1 (14,700), Switzerland (6,i00) Netherlands .32,400 8 i Belgium' (22,600) Italy..........................247,000 87 France (207,800), Switzerland
l(2z,ooo), Austria (13.400) Sweden . 58,100 . J Norway(23 ,9oo), Denmark (I 9500), Sweden ........................8,10 In7 lGerman Empire (7,800)
Man and Channel Isles 4,300 30-3 United Kingdom (i8,800) Belgium .308,200 83. France (350,900) Luxemburg .29,600 I39*0 (z6,700), Belgium (4,800)
Switzerland owes its position at the head of this list no less to its character as a region of transit, lying between four great States, than to its small size, which intensifies all migratory symptoms. France and Belgium, however, are fair representatives of West European extremes, the one being a receptacle into which flows the surplus population from surrounding States, whilst Belgium, whose inhabitants are fairly obeying. the Mosaic injunction, are pouring their thousands annually into France.
278 RAVENSTEIN-The Laws of Migration. [June,
Hungary, Austria., and Germany would of course occupy different places in our list were we to embrace Russia and the Balkan States within these " United States of Western Earope," for the number Qf Western Europeans in the East is undoubtedly much larger than is that of " Easterlings " in the west.
America. Before I proceed to a consideration of the migration statistics
of Canada and the United States, with which I propose to close my survey, it appears to me to be desirable 'that I should draw attention to several points of difference, which distinguish these regions of the new world from our old-established European States. In Europe, or at all events in Western Europe, nearly all the land capable of being cultivated has been occupied and peopled. As a consequence of this, our great migratory currents are produced either by the development of commerce and industry in certain localities, or by an outflow of emigrants, whose places are filled up by local currents of migration. These agencies make themselves felt also in North America, but in addition to them there exists one factor whose power is hardly known in Europe, namely, the powerful attraction exercised by vast areas of cultiv- able land not yet taken possession of by cultivators.
Another difference is this: whilst with us in Europe the "foreign element " constitutes a mere fraction of the population, it assumes vast proportions in the new world. Here in Europe every inflow of foreign elements is largely compensated by an outflow of natives, but in the new world the inflowing currents are overpoweringly strong, whilst the compensatory counter currents are of the feeblest proportions.
These differences should constantly be borne in mind when discussing the statistics of American migration. They have been most marked in the past, and are very striking still. In course of time, however, they will become less glaring, until at last the new world shall have become assimilated to the old in its migratory currents no less than in other respects depending upon the popu- lation having attained a density commensurate with the natural resources of the country.
The Dominion of Canada. The population of the Dominion of Canada at the time of the
last census (1881) was composed as follows:- Provincial element ...................... 3,584,266 .8z88 per cent. Dominion ,.3..................... 8,715,492 85z9l ,, American ,. ...................... 77,753 V79 ,,
Other foreign elements .................... 5 31,565 14'o9 ,,
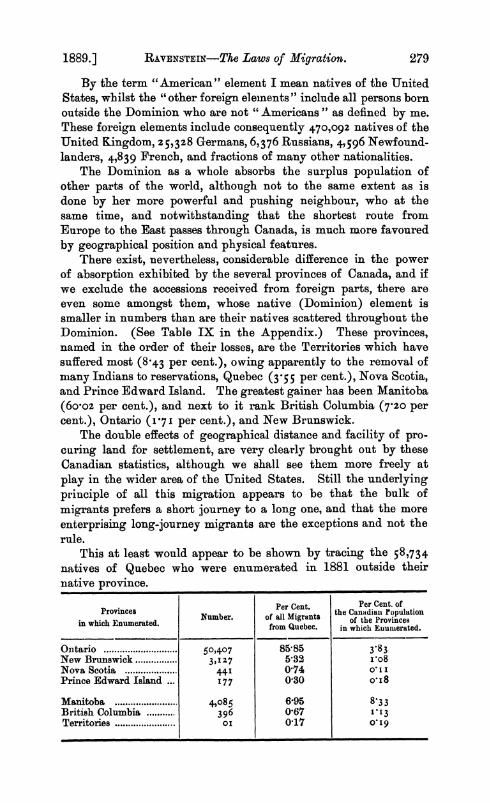
1889.] RAVENSTEIN-The Laws of Migration. 279
By the term "American" element I mean natives of the United States, whilst the " other foreign elements " include all persons born outside the Dominion who are not " Americans " as defined by me. These foreign elements include consequently 470,092 natives of the United Kingdom, 25,328 Germans, 6,376 Russians, 4,596 Newfound- landers, 4,839 French, and fractions of many other nationalities.
The Dominion as a whole absorbs the surplus population of other parts of the world, although not to the same extent as is done by her more powerful and pushing neighbour, who at the same time, and notwithstanding that the shortest route from Europe to the East passes through Canada, is much more favoured by geographical position and physical features.
There exist, nevertheless, considerable difference in the power of absorption exhibited by the several provinces of Canada, and if we exclude the accessions received from foreign parts, there are even some amongst them, whose native (Dominion) element is smaller in numbers than are their natives scattered throughout the Dominion. (See Table IX in the Appendix.) These provinces, named in the order of their losses, are the Territories which have suffered most (8-43 per cent.), owing apparently to the removal of many Indians to reservations, Quebec (3 55 per cent.), Nova Scotia, and Prince Edward Island. The greatest gainer has been Manitoba (6ooz per cent.), and next to it rank British Columbia (7-20 per cent.), Ontario (1-71 per cent.), and New Brunswick.
The double effects of geographical distance and facility of pro- curing land for settlement, are very clearly brought out by these Canadian statistics, although we shall see them more freely at play in the wider area of the United States. Still the underlying principle of all this migration appears to be that the bulk of migrants prefers a short Journey to a long one, and that the more enterprising long-journey migrants are the exceptions and not the rule.
This at least would appear to be shown by tracing the 58,734 natives of Quebec who were enumerated in 1881 outside their native province.
Per Cent. Per Cent. of Provinces Numbthe Canadian Population inwhich Enumerated. Nme. oalMirns of the Provinces from Quebec. in which Enumerated.
Ontario ................. 50,407 85-85 3'83 New Brunswick ................ 3,1 z7 5,32 Io8 Nova Scotia 0................. 44 I 074 o0XI Prince Edward Island ... 177 0 30 oi8
Manitoba ................. 4,o85 6.95 83 3 British Columbia ........... 396 0,67 1C13 Territories .................. 0 0,17 019
280 RAvENSTEIN-The Laws of Migration. [June,
Whilst the table shows very distinctly that most of the migrants from Quebec went no further than the neighbouring province of Ontario, it shows at the same time that a minor current proceeds from Quebec towards Nova Scotia, and that the main current which carries so many of its sons and daughters into Ontario has not lost all strength when it has reached the western extremity of that province, but still sweeps onward, though with diminished force, and only dies away when it reaches the shore of the Pacific. This is the nature of all these westerly currents in North America. They are like mighty rivers, which flow along slowly at the outset, and after depositing most of the human beings whom they hold in suspension, sweep along more impetuously, until they enter one of the great western lake reservoirs (in our case Manitoba), on leaving which they are nearly limpid.
If on the other band we inquire whence a province like Manitoba has drawn the many migrants which entitle her to so prominent a place as a centre of absorption, the answer is once more from the nearest available surplus population.
Of the 98,992 natives of Canada enumerated in Manitoba in 1881, 18,020 were natives of Manitoba itself, 19,125 had come from Ontario, 6,422 from the Territories, and 4,o85 from Quebec.
In 1885, when another census was taken, it was found that the natives of the other provinces had increased considerably, but the contingents proportionately furnished by each province had hardly changed, except that the Territories, which had themselves become more desirable places for agricultural settlers, furnished a much smaller contingent. In other words, the migratory current bad retained its strength whilst passing over Manitoba, carrying more migrants than formerly beyond it.
The United States. The population of the United States, classified according to
birth places, included the following elements in (1880):-
State element ..... .... 33,789,498 67 37 per cent. National element ......... 43,475,840 86 69 ,, Foreign ,,.......... 6,679,943 13*31 ,1
Full details for each State and territory will be found in Table X of the Appendix.
That which strikes us most in examining this table is not so much the large number of persons of foreign birth, than the great mobility of the native Americans. They are greater wanderers, less tied to home associations, than are the inhabitants of Europe. This fact is sufficiently accounted for by the vast extent of unoccupied land, and the great natural resources of the country,
1889.] RAVENSTEIN-The Laws of Migration. 281
which have as yet hardly been touched. Have we not witnessed migrations on an equally surprising scale when the value of the iron ores of Furness and of Cleveland first came to be recognised ?
Putting aside persons of foreign birth, we find that the State element includes 75-4 per cent. of the total native population of the United States, whilst in Austria and Germany, with provinces fairly comparable, the provincial element reaches 93 and go per cent. respectively.
If we compare the census returns for 1870 with those for 1880, we shall find that every State and territory has increased in popu- lation, but, on examining into the causes of this increase, it will at once become apparent that it is due, in a large measure, to foreign immigration. Thus the States of Massachusetts, Connecticut, and Rhode' Island exhibit an actual growth of 470,158 souls, of which only i62,886 were due to an excess of births over deaths, whilst immigration from other States added 182,150 souls to the popula- tion, and foreign immigration I25,122 only. If we bear in mind that the natural growth would have been much slower had there been no foreign immigrants to contribute towards it, we shall be able to estimate the foreign element at its full value. Had we any trustworthy statistics of births and marriages for every State of the Federal territory, it would be found that the actual increase of population in some of them is virtually dependent upon foreign immigration. Take Maine as an instance. In that State the actual increase of population between 1870 and 1880 amounted to 22,000 souls, viz., 12,000 natives of the United States, and io,ooo foreigners. Assuming the excess of births over deaths to have been the same as in the three States of New England for which we have vital statistics, the natural, growth during the period under consideration must have amounted to 46,ooo souls, clearly showing that in the case of Maine the time when its population shall cease to increase must be close at hand.
If we divide the United States into two regions, one of disper- sion and the other of absorption, it will be found that the former includes eighteen States and territories, all of them, with the exception of New Mexico, lying to the east of the Mississippi. This is taking account of the native element only. If we include the foreign element it will be found that four of these States, viz., New Hampshire, Connecticut, Pennsylvania, and New York, have recovered their loss in consequence of the arrival of numerous foreign immigrants, who at the time of the last census resided within their boundaries. The losses have been most severe in Vermont, Virginia, New Hampshire, and Maine, whilst the gains were most considerable in the newly opened territories in the North West (see Table X, and map).
282 RAVENSTEIN-The Laws of Migration. [June,
In illustration of the process of dispersion going on in the United States, I select Virginia, whose exhausted soil appears no longer to be able to support a rapidly increasing population. Of native Virginians there were enumerated throughout the United States 2,1 i8,460, of whom as many as 683,336 had found a home outside their nptive State. Of these migrants 285,422 (41v74 per cent.) had gone no further than one of the border States; 268,818 (39 33 per cent.) had crossed a border State and had settled in a State just beyond it; whilst 129,096 (x8'93 per cent.) had gone to other parts of the Union. If we examine a map exhibiting the distribution of these migrants, we shall find that of the currents of migration which pass out of Virginia, that which flows in a westerly direction, towards the thinly peopled territories to the west of the Mississippi, is the most powerful. Another current swerves round to the south-west, and follows the valley of the Mississippi to the Gulf of Mexico. A third current crosses South Carolina into Georgia. It is quite obvious that whilst geographical features have exercised a preponderating influence upon these currents, economical reasons, such as the facility of acquiring land, have very materially modified these. Virginian migration presents in fact the same features as the migration of the natives of Quebec. Tracing the westerly current, we find that nearly one half of the migrants (47 per cent.) settled in Western Virginia, 26 per cent. were enumerated in Kentucky and Tennessee,2n 19 per cent. in Missouri, 5 per cent. in Kansas, and only 3 per cent. further westward.
The leading numerical facts in connection with this migration from Virginia are exhibited in the following tabular statement:
22 Kentucky, Southern Indiana and Southern Illinois lie on the western track. As I have no figures for parts of States, I substituted Tennessee for Illinois and Ohio.
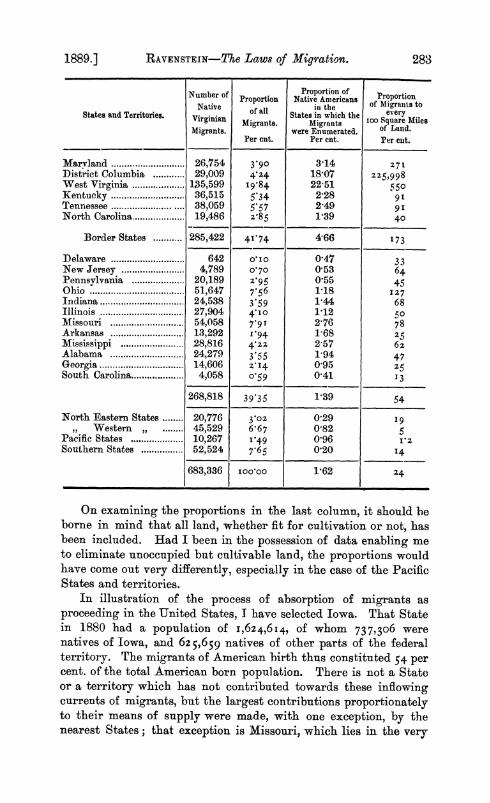
1889.] RAVENSTEIN-The Laws of Migration. 283
Number of Proportion of Proportion Native Proportion Native Americans of Migrants to oftall iii the Z
States and Territories. ofal States in which the J0 every Virginian Migrants. Migrants quare Miles Migrants. were Enumerated. of Land.
Per cnt. Per cnt. Per cut.
Maryland............................26,754 390 3-14 271 District Columbia . 29,009 424 18-07 225,998 West Virginia .................. 135,599 19-84 22 51 .55 Kentucky .................. 36,515 5-34 2-28 91 Tennessee .................. 38,059 5'57 2 49 9I North Carolina .................. 19,486 2z85 1-39 40
Border States ........... 285,422 41-74 4 66 173
Delaware .. .. 642 010 0447 33 New Jersey .. .. 4,789 0?70 0-53 64 Pennsylvania .. .. 20,189 2'95 0-55 45 Ohio .. . .... 51,647 7.56 1-18 127 Indiana .24,538 3 59 1-44 68 Illinois .27,904 410 1-12 50 Missouri .54,058 7-91 2-76 78 Arkansas. 13,292 1.94 1l68 25 Mississippi .28,816 4.z2 2-57 62 Alabama .24,279 3-55 1l94 47 Georgia .14,606 21I4 095 25 South Carolina .4,058 0?59 0-41 13
268,818 39 35 1-39 54 North Eastern States . 20,776 302 029 9
Western ,. 45,529 6-67 0-82 5 Pacific States .10,267 1.49 0-96 I n Southern States .52,524 7-65 0'20 14
683,336 Ioo000 1P62 24
On examining the proportions in the last column, it should be borne in mind that all land, whether fit for cultivation or not, has been included. Had I been in the possession of data enabling me to eliminate unoccupied but cultivable land, the proportions would have come out very differently, especially in the case of the Pacific States and territories.
In illustration of the process of absorption of migrants as proceeding in the United States, I have selected Iowa. That State in 1880 had a population of 1,624,614, of whom 737,306 were natives of Iowa, and 62 5,659 natives of other parts of the federal territory. The migrants of American birth thus constituted 54 per cent. of the total American born population. There is not a State or a territory which has not contributed towards these inflowing currents of migrants, but the largest contributions proportionately to their means of supply were made, with one exception, by the nearest States; that exception is Missouri, which lies in the very
284 RAVENSTEIN-The Laws of Migrahtor. [June,
centre of the great westerly current, and whose resources have so largely been drawn upon in the peopling of the neighbouring State of Kansas. Out of i,202,371 migrants who went forth from the six border States, as many as 173,662 (14-4 per cent.) were found at the last census to have taken up their residence in Iowa. If Missouri be excluded, the proportion rises to I6'7 per cent. Including within the next zone all those States and territories any portion of which lies within 300 geographical miles from the Iowa border, we find that they sent forth 2,564,26i migrants (who were alive in 1880), of whom 2I3,3i8 or 8 3 per cent. were enumerated in Iowa. A third zone, lying outside the former, but within 600 miles of Iowa, out of 4,524,763 migrants contributed 201,606, or 4-4 per cent., towards the population of that State. Lastly, there remains an outer zone, of whose natives 1,267,728 were enumerated in other parts of the union, including 46,984 (3 7 per cent.) in Iowa. If we examine into the details of each zone we shall find that there exist considerable differences. It will be found, for instance, that the frontier and maritime States furnish larger contingents than might be expected from their distance from the centre of absorption. This is more especially noticeable in the case of those New England States which are centres of dispersion. It is obvious, however, that the proportions of these States would be reduced considerably if we took account of the migrants who have left them for the neighbouring provinces of Canada. For further details I refer to the accompanying map.
If any further proof were wanted that migration in the United States proceeds on the same lines as in Europe, it is furnished by considering the interstate migration. Looking at my small diagram illustrating the migration of native Americans into Kentucky, it will be seen at once that the number of immigrants, proportionately to the whole of the American-born population, is most, considerable in the border counties, and that the migratory currents flow along certain well defined geographical channels. This preponderance is most striking in the westernmost counties, which form a kind of pan-handle, and are accessible from three directions. The features are exactly the same as have been found to exist in European provinces. In America, as with us, the short- journey migrants constitute a majority, and no mere change of political boundaries would affect this fact.
The American census furnishes no information on the compara- tive migratoriness of men and women, but it affords us an insight into migration as it affects the large cities. I think I am safe in assuming that the time has not yet arrived in the United States when the cities, as with us, are being fed at the expense of the
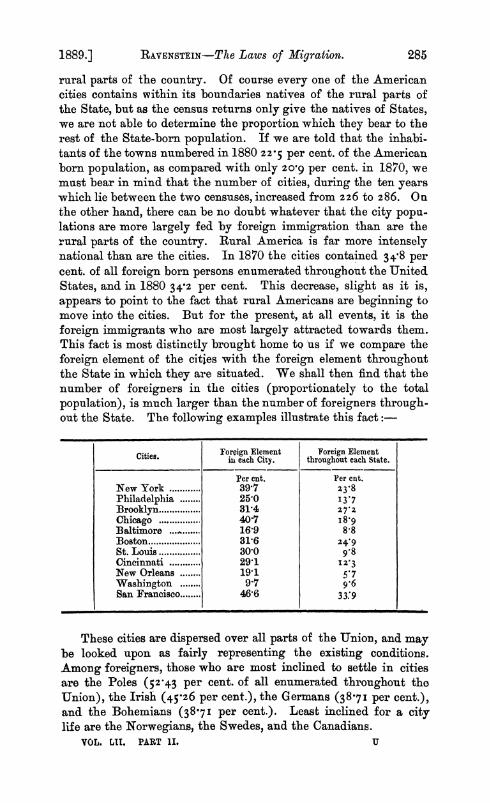
1889.] RAVENSTEIN-The Laws of Migration. 285
rural parts of the country. Of course every one of the American cities contains within its boundaries natives of the rural parts of the State, but as the census returns only give the natives of States, we are not able to determine the proportion which they bear to the rest of the State-born population. If we are told that the inhabi- tants of the towns numbered in 1880 22V5 per cent. of the American born population, as compared with only 209 per cent. in 1870, we mast bear in mind that the number of cities, during the ten years which lie between the two censuses, increased from 226 to 286. On the other hand, there can be no doubt whatever that the city popu- lations are more largely fed by foreign immigration than are the rural parts of the country. Rural America is far more intensely national than are the cities. In 1870 the cities contained 34+8 per cent. of all foreign born persons enumerated throughout the United States, and in 1880 34+2 per cent. This decrease, slight as it is, appears to point to the fact that rural Americans are beginning to move into the cities. But for the present, at all events, it is the foreign immigrants who are most largely attracted towards them. This fact is most distinctly brought home tQ us if we compare the foreign element of the cities with the foreign element throughout the State in which they are situated. We shall then find that the number of foreigners in the cities (proportionately to the total population), is much larger than the number of foreigners through- out the State. The following examples illustrate this fact:
Citis. .Foreign Element Foreign Element Cities. in each City. throughout each State.
Per cnt. Per cnt. New York ........... 39 7 z238 Philadelphia ........ 25-0 13.7 Brooklyn ................ 314 27z Chicago ........... 40 7 i8'9 Baltimore ... . . 16-9 8-8 Boston.................... 316 Z4 9 St. Louis ........... 30 0 9-8 Cincinnati ........... 291 Iz3 New Orleans ........ 191 5.7 Washington ........ 9.7 96 San Francisco ........ 4646 33:9
These cities are dispersed over all parts of the Union, and may be looked upon as fairly representing the existing conditions. Among foreigners, those who are most inclined to settle in cities are the Poles (52-43 per cent. of all enumerated throughout the Union), the Irish (45 26 per cent.), the Germans (38 7I per cent.), and the Bohemians (38-71 per cent.). Least inclined for a city life are the Norwegians, the Swedes, and the Canadians.
VOL. L1I. PART 11. U
286 RAVENSTEIN-Th eLaws of Migration. [June,
General Conclusions.
Having thus placed before you a vast array of facts and figures, I venture to deduce from them certain principles or laws which appear to me to guide all migratory movements. I do not question for a moment that the principal, though not the only cause of migration, has to be sought for in over-population in one part of the country, whilst there exist elsewhere undeveloped resources which hold out greater promise for remunerative labour. It is obvious that this is not the only cause. Bad or oppressive laws, heavy taxation, an unattractive climate, uncongenial social surroundings, and even compulsion (slave trade, transportation), all have produced and are still producing currents of migration, but none of these currents can compare in volume with that which arises from the desire inherent in most men to "better" themselves in material respects. It is thus that the surplus population of one part of the country drifts into another part, where the development of industry and commerce, or the possibility of procuring productive land still in a state of nature, call for more hands to labour. But how is this call supplied? Suppose there exists a surplus of labour in one province and a deficiency in another, whilst the intervening provinces are able to find remunerative occupation for all their inhabitants. Will the labourer, in search of work, travel across these intervening provinces, in order to supply the deficiency? I say, no!
1. The want will be supplied from the immediate neighbourhood, and its effect will travel from province to province until it makes itself felt in the most remote among them. Of course there arise exceptional wants as also exceptional opportunities, such as have been pointed out in the case of the United States, but under normal conditions the migratory movement will be a gradual one; it will proceed step by step, and will be transmitted from province to province. I may be permitted to liken this movement to that which is produced in a cistern of water after the tap has been turned on.
2. Tf this really is so, then the bulk of the migrants ought to travel short distances only, and that they really do this even in America, where the conditions are quite exceptional, I believe to have amply proved. No better proof of it could be found than in the invasion of a country by foreigners, among whom long-journey migrants must obviously be more numerous than among other classes of migrants. If you will carefully examine my tables and the illustrative maps, you will find that foreign emigrants are for the most part content with going no further than the nearest foreign province or the most convenient centre of absorption. If
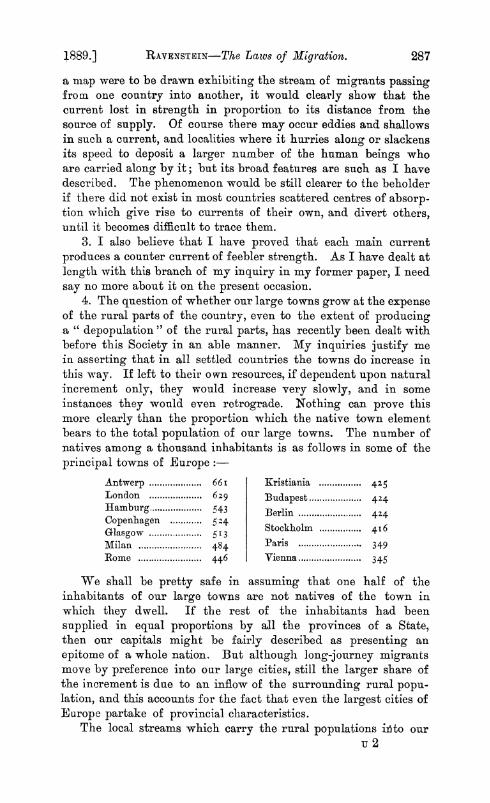
1889.] RAYENSTEIN-The Laws of Migration. 287
a map were to be drawn exhibiting the stream of migrants passing from one country into another, it would clearly show that the current lost in strength in proportion to its distance from the source of supply. Of course there may occur eddies and shallows in such a current, and localities where it hurries along or slackens its speed to deposit a larger number of the human beings who are carried along by it; but its broad features are such as I have described. The phenomenon would be still clearer to the beholder if there did not exist in most countries scattered centres of absorp- tion which give rise to currents of their own, and divert others, until it becomes difficult to trace them.
3. I also believe that I have proved that each main current produces a counter current of feebler strength. As I have dealt at length with this branch of my inquiry in my former paper, I need say no more about it on the present occasion.
4. The question of whether our large towns grow at the expense of the rural parts of the country, even to the extent of producing a " depopulation " of the rural parts, has recently been dealt with before this Society in an able manner. My inquiries justify me in asserting that in all settled countries the towns do increase in this way. If left to their own resources, if dependent upon natural increment only, they would increase very slowly, and in some instances they would even retrograde. Nothing can prove this more clearly than the proportion which the native town element bears to the total population of our large towns. The number of natives among a thousand inhabitants is as follows in some of the principal towns of Europe
Antwerp ....... 66i Kristiania ...... 425 London ....... 629 Budapest ...... 424 Hamburg ........- 543 Berlin ...... 424 Copenhagen ....... 54 Stockholm . 46 Glasgow . ....... 513
...Stockholm....... 49 Milan ........................ 349 Rome ....... 446 Vienna ...... 345
We shall be pretty safe in assuming that one half of the inhabitants of our large towns are not natives of the town in which they dwell. If the rest of the inhabitants had been supplied in equal proportions by all the provinces of a State, then our capitals might be fairly described as presenting an epitome of a whole nation. But although long-journey migrants move by preference into our large cities, still the larger share of the increment is due to an inflow of the surrounding rural popu- lation, and this accounts for the fact that even the largest cities of Europe partake of provincial characteristics.
The local streams which carry the rural populations iito our u 2
288 RAvENSTEIN-The Laws of Migration. [June,
towns arc sometimes quite independent of the larger streams of migration, but generally they become merged in them. In the United States, however, and I suppose in other newly settled countries having large agricultural resources, this tendency of the rural population towards the towns is hardly perceptible. The towns there increase largely in consequence of foreign immigration. If it were possible to create or open up similar resources in the rural parts of our European countries, you would at once put a stop to the rural exodus which has been proved to be going on in nearly all parts of Europe, and which is so justly deplored.
5. Females appear to predominate among short-journey migrants. I have drawn attention to exceptions to this rule, but numerically they are insignificant. On the other hand long-journey migrants appear to predominate among females born in large towns, including London; all the great Scotch towns, Paris, Vienna, and many others. Some of these ladies are no doubt carried abroad by counter currents with a view to their adorning rural homes, but many, I am sure, are sought for their accomplishments in certain branches of industry.
6. Does migration increase? I believe so! The exception in England, where the county element rose from 74 o0 per cent. in 1871 to 75'I9 per cent. in 1881, is an exception accounted for by the interference of Irish immigrants with the normal process of migration.n Wherever I was able to make a comparison I found that an increase in the means of locomotion and a development of manufactures and commerce have led to an increase of migration. In fact you need only seek out those provinces of a country within which migration is proceeding most actively, and you will either find yourself in the great centres of human industry, or in a part of the country whose resources have only recently become avail- able. Migration means life and progress; a sedentary population stagnation.
Concluding Remarks.
One other remark before I conclude. Does the process of migration, as illustrated by me, convey any lesson of practical utility, as, for instance, with reference to the colonisation of tropical regions ? 1 believe that it does. I have pointed out in the course of my paper how large is the proportion of Italians who have settled in Northern Africa, as also is that of Spaniards, Southern Frenchmen, and Greeks. These migrants reached their present homes in the normal course of migration, that is to say, they are " short-journey " migrants. In exchanging their native land
23 Census of England and Wales, iv, p. 51.
1889.] RAVENSTEIN-The Laws of Migration. 289
for the new country in which they have settled down, they under- went no violent alterations of climatic conditions, and we are justified in asserting that they will thrive and flourish there, instead of perishing prematurely, as have the long-journey migrants, who left Alsatia and Germany for Algeria. And what is more, these natives of southern Europe not only attain a high age in their African homes, bat they also become the founders of families. It strikes me that if tropical Africa or other tropical regions are ever to be " colonised " by European races, the rules instinctively followed by most of the migrants should be adhered to. A sudden transition from the temperate to the tropical world can yield no permanent results. That world can be won only, if it is to be won, by a deliberate invasion persisted in during many generations of men. As regards northern Africa in particular, those Europeans who are already seated upon the shores of the Mediterranean appear to me to be most fit for this difficult task. Working their way inland, from stage to stage, each stage marking a generation of men, these European colonisers would follow the Nile valley and other available highroads traced out by nature, already availed of by their predecessors, until even the terrors of a tropical climate would cease to be terrors to the far-off descendants of the men who first started upon this mighty enterprise.
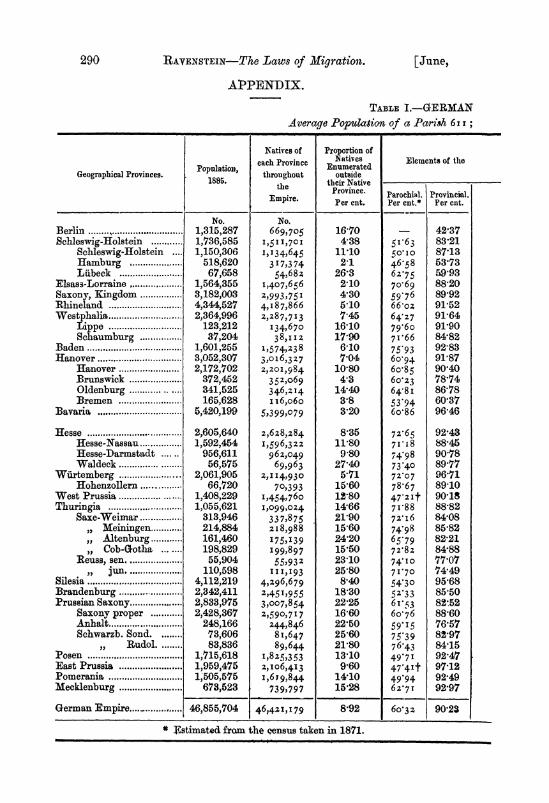
290 RAVENSTEIN-The Laws of Migration. [June,
APPENDIX.
TABLE I.-GERMAN Average Population of a Parish 6 xI;
Natives of Proportion of each Province lnumeatives Elements of the
eachuProvince Enumerated Geographical Provinces. , throughout outside
1885. I their Native the Province. Empire. Province Parochial. Provincxial. Empire. ~Per cut. Per cnt.* Per cot.
No. No. Berlin ... . . .......... 1,315,287 669,705 16-70 - 42 37 Schleswig-Holstein . 1,736,585 I ,511,7CI 4-38 5163 83-21
Schleswig-Holstein 1,150,306 1,34,645 11 10 5O iO 87-13 Hamburg .518,620 3 I 7,374 2-1 46-58 63-73 Ldbeck .67,658 54,682 26-3 6z.75 59.93
Elsass-Lorraine .1,564,355 1,407,656 2-10 7o-69 88-20 Saxony, Kingdom .3,182,003 2,993,751 4'30 59'76 89-92 Rhineland .4,344,527 4,I87,866 5-10 66 oz 91-52 Westphalia .2,364,996 2,287,713 7-45 64 27 91-64
Lippe .123,212 134,670 16-10 79-6o 91-90 Schaumburg .37,204 38,I12 17-90 71I66 84'82
Baden .1,601,255 1,574,238 6-10 75 93 92 83 Hanover .3,052,307 3,o16,327 7-04 6O094 91-87
Hanover .2,172,702 2,201,984 10'80 6oc85 90.40 Brunswick .372,452 352,o69 4-3 6O'23 78-74 Oldenburg .341,525 346,2.14 14-40 64-8 I 86 78 Bremen .165,628 i i6,o6o 3-8 53-94 60'37
Bavaria .5,420,199 5)399,079 3-20 6o-86 96-46
Hesse .2,605,640 2,628,284 8'35 72.65 92-43 Hesse-Nassau .1,592,454 1,596,322 11-80 7 I1 8 88-45 Hesse-Darmstadt 956,611 962,049 9 80 74 98 90 78 Waldeck .56,575 69,963 27A40 73 40 89-77
Wiirtemberg .2,061,905 2,114,930 5.71 72-07 96-71 Hohenzollern .66,720 70,393 15,60 78.67 89-10
West Prussia .1,408,229 2,454,76o 12-80 472 It 90 18 Thuringia .1,055,621 1,099,024 14 66 7I-88 88-82
Saxe-Weimar .313,946 337,875 21-90 72i16 84-08 ,, Meiningen 214,884 2I8,988 15 60 74'98 85-82
Altenburg 161,460 175,139 24 20 65.79 82-21 Cob-Gotha 198,829 I99,897 15,50 72-82 84-88
ReUis, sen ................ 55,904 55,932 23 10 74-10 77O07 , jun .110,598 111,193 25 80 7I.70 74-49
Silesia ................. 4,112,219 4,296,679 8 40 54'30 95-68 Brandenburg .2,342,411 2,451,955 18-30 52-33 85 50 Prussian Saxony .2,833,975 3,007,854 22,25 6 1 53 82,52
Saxony proper . 2,428,367 2,590,717 16-60 6O076 88'60 Anhalt . .248,166 244,846 22'50 59'I5 76-57 Schwarzb. Sond. 73,606 8I,647 25'60 75 39 82 97
,, Rudol 83,836 89,644 21,80 76-43 84-15 Posen .1,715,618 1,82 5,353 13,10 49'7I 92 47 East Prussia .1,959,475 2,IO6,413 9 60 47 4It 97-12 Pomerania .1,505,575 1I,69,844 14 10 49*94 92A49 Mecklenburg .673,523 739,797 15 28 62.7 1 92-97
German Empire ......... 46,855,704 46,421,179 8-92 6o'3z 90,23
# :stimated from the census taken in 1871.
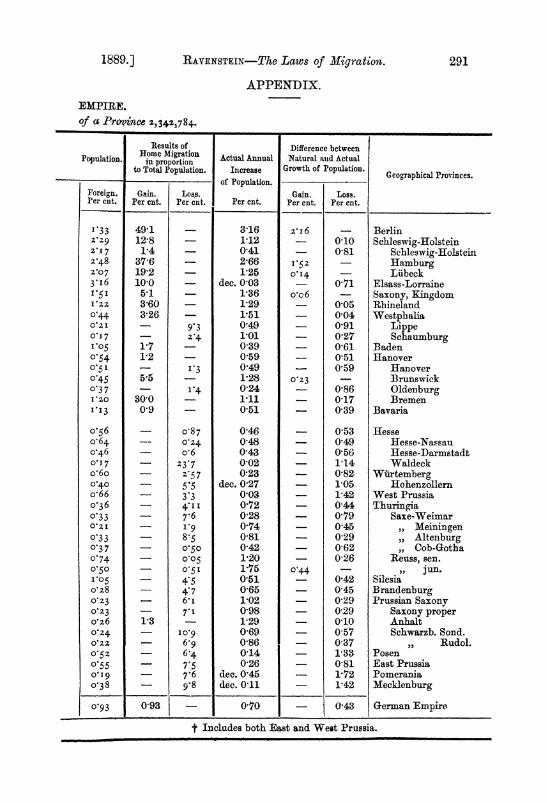
1889.] RAvENSTEIN-The Laws of Miigration. 291
APPENDIX. EMPIRE. Of a Pravznce 2,342,784.
Results of Difference between Population. Home Migration Actual Annual Natural and Actual in proportion
to Total Population. Increase Growth of Population. Geographical Provinces. _ of Population. Foreign. Gain. Loss. Gain. Loss. Per cnt. Per cnt. Per cnt. Per cnt. Per cnt. Per cnt.
1.33 49-1 3'16 zsI 6 _ Berlin 2, ̂9 12'8 1-12 010 Schleswig-Holstein 2-.17 1-4 0-41 0 81 Schleswig-Holstein 2-48 37-6 2-66 -52 Hamburg z o7 19-2 - 1'25 o I4 Libeck 3-I6 10 0 dec. 0 03 - 071 Elsass-Lorraine I 5 1 5-1 1-36 o o6 _ Saxony, Kingdom I2Z 3-60 1-29 0 05 Rhineland 0.44 3'26 _ 1.51 0 04 Westpbalia 02I - 9 049 0191 Lippe ?- 7 - 24 1-01 _ 0-27 Schaumburg Io5 107 - 039 0-61 Baden 0'94 1'2 0.59 0-51 Hanover O.5 1 - .3 0 49 - 059 Hanover 045 5.5 1'28 o023 - Brunswick 0?3 7 - 14 0-24 _ 086 Oldenburg P zO 30 0 _ 1 11 _ 017 Bremen I*I3 0-9 0-51 0 39 Bavaria
o'56 - 08 7 0-46 _ 053 Hesse o064 - o024 0 48 0-49 Hesse-Nassau o-46 o 6 0 43 0 56 Hesse-Darmstadt 0oJ7 23-7 0 02 1 l14 Waldeck o-6o Z-57 0-23 0 82 Wuirtemberg 0.40 - 5 dec. 0-27 - 105 Hohenzollern o-66 3-3 0 03 - 142 West Prussia 0o36 4. I I 0-72 0 44 Thuringia o033 7- 6 0-28 0 79 Saxe-Weimar 02I - *19 0 74 0 45 ,, Meiningen 0o33 8.5 0-81 0-29 ,, Altenburg 0.3 7 - o5o 0-42 0-62 ,, Cob-Gotha 0.74 005 1,20 0 26 Reuss, sen. 0.50 - 051 1-75 0.44 ,, jun. 105 - 45 0-51 0-42 Silesia o0z8 _ 4.7 0-65 0-45 Brandenburg 0o23 6- I 1-02 0-29 Prussian Saxony 0o23 7.1 0-98 0-29 Saxony proper o0z6 1-3 1-29 0 10 Anhalt 0o24 - 1 09 0-69 - 057 Schwarzb. Sond. 0o2 - 6-9 0-86 0 37 ,, Rudol. 0o52 6-4 0-14 1-33 Posen 0.55 7-5 0-26 0 81 East Prussia ? J9 7.6 dec. 0 45 1-72 Pomerania 0?38 9.8 dec. 011 1-42 Mecklenburg
_ 0.93 0 93 - 070 - 043 German Empire,
t Includes both East and West Prussia.
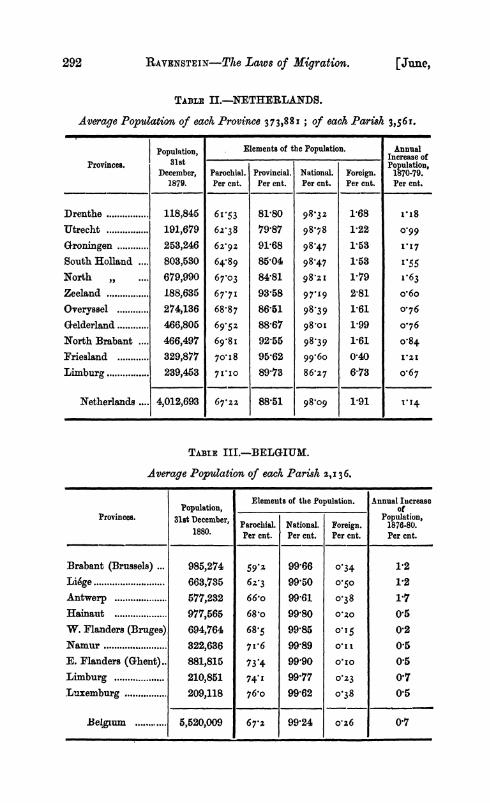
292 RAVENSTEIN-The Laws of Migration. [June,
TABIX II.-NETHERLANDS. Average Population of each Province 373,88!; of each Parish 3,561.
Population, Elements of the Population. Annual Provinces. 8:1st -____ -____ Increase of
Provinces. 31 stPopulation, December, Parochial. Provincial. National. Foreign. 1870-79.
1879. Per cnt. Per cut. Per cnt. Per cut. Per cnt.
Drenthe ............ 118,845 6I.53 8180 98 3Z 168 ri8 Utrecht ............ 191,679 6.z,38 79'87 98 78 1-22 099 Groningen ............ 253,246 6z9 z 91-68 98 47 1 53 I*I 7 South Holland *- 803,530 64:89 85-04 98-47 1 53 I'55
North ,, .... 679,990 67'o3 84-81 98'z1 1-79 1.63
Zeeland ............ 188,635 67'7I 93-58 97'19 2 81 o-6o Overyssel ............ 274,136 68*87 86-51 98 39 1-61 O 76 Gelderland ............ 466,805 69 5z 88 67 98-OI 1.99 o-76
North Brabant .... 466,497 69-8I 92-55 98.39 1-61 o.84 Friesland ............ 329,877 70oi8 95-62 99-6o o040 I-ZI
Limburg ............ 239,453 71 IO 89-73 86 2.7 6 73 o.67
Netherlands .... 4,012,693 67 -z 1 88-51 98 ?9 1 91 11I4.
TABTE III.-BELGIUM.
Average Population of each Parish 2,I36.
Elements of the Population. Annual Increase Population, . of
Provinces. 31st December, Parochial. National. Foreign. Population, 1880. Paochial. ational.Foreign. 1876.80.
- 1880. Per cnt. Per cnt. Per Cnt. Per cnt.
Brabant (Brussels) 985,274 59 z 99-66 o034 1-2 Li6ge .............. 663,735 6z.3 99 50 o.5o 112 Antwerp .............. 577,232 66-o 99-61 O'38 1 7
Hainaut .............. 977,565 68*o 99 80 O02O 0.5 W. Flanders (Bruges) 694,764 68 5 99-85 0 ,5 0 2 Namur .............. 322,636 7CI6 99 89 O I I 0 5 E. Flanders (Ghent).. 881,815 73'4 99 90 OxO 0 5
Limburg .210,851 74.1 99'77 0-23 0 7 Luxemburg .209,118 76,o 99 62 o.38 0 5
Belgium ............ 5,520,009 67'2 99u24 o-z6 0 7
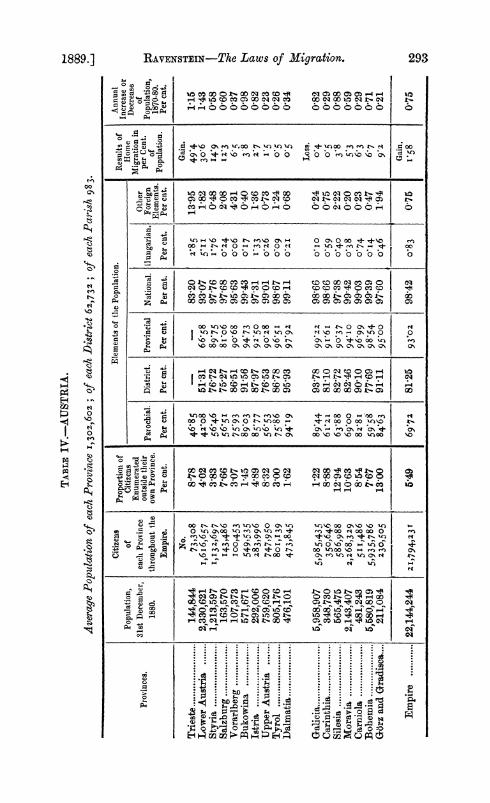
TABLE IV.-AUSTRIA.
Average Population of each Province 1,302,602; of each District 62,732; of each Parish 983. L
Citizens Proportion of Elements of the Population. Results of Annual Population, of Citizens Home Increase or
Enumerated Ohr Migration in Decreaae Provinces. 31st December, each Province outsideei Parochial. | District. Provini National ungarian. Foreignr per Cent. of
1880. throughout the own Province. Eloha.Dsrc.PoicilNtoa.Hnain oement of population, Eeet.Ppulation. 1870-80. ~ Empire. Per cnt. Per cnt. Per cnt. Per cnt. Per cut. Per cnt. Per cut. Po Per cnt. '
No. Gain. - Trieste .144,844 73,308 8478 46 85 - 83-20 z 85 1395 49 4 115 Lower Austria ........ 2,330,621 1,6 I 6,657 4'02 42 o8 51-31 6658 93.07 5.I1 1-82 3o-6 1 43 > Styria .1,213,597 1,132,697 3 83 56.46 76-72 89'75 97 76 s 76 0O48 x4f9 0?58 I Salzburg .163,570 143,486 7 66 56'5I 75-27 8i o6 97 68 o024 2-08 I Z.3 0 60 Vorarlberg .107,373 100,453 3-07 759 3 8651 go968 95 63 o o6 4-31 6 5 037 05 Bukowina .571,671 549,535 1-45 89g03 91-56 94-73 99-43 o0-7 0 40 3 8 0-98 b Istria .................... 292,006 283,996 4 89 8 577 87-97 92'50 97-31 1I33 1-36 2.7 082 a Upper Austria 759,620 747,950 8-32 56-53 76-53 9 028 99 01 o z6 0-73 1I5 023 Tyrol .805,176 80iI39 3 00 75 86 86 78 96'51 98 67 0o09 1-24 0-5 026 Dalmatia .476,101 473,845 1-62 94 I9 95 93 97 92 99 11 o021I 0 68 0.5 034
l l l l I I I I I I ~~~~~~~~~~~~~~~~~~~~~~~~Lss. I ; Galicia .5,958,907 5,985,435 1-22 89 44 93 78 9922Z 98'66 0o10 024 0.4 0-82 Carinthia .348,730 350,646 8-88 6 2z 81 10 9 I16 I 98 66 o059 0-75 0-5 029 Silesia .................... 565,475 586,988 12'94 63 88 82 72 90?37 97-38 040 2-22 3.8 0 88 a Moravia .2,143,407 2,268,329 10-63 69-oo 82 46 9450 9942 o38 020 5-3 059 Carniola .481,243 511,486 8 54 8 z'8 i 90 10 96.99 99 03 0.74 0-23 6 3 029 Bohemia . 5,680,819 5,935,786 7 67 5958 7-69 98'54 99 39 O-I4 0 47 6 7 0'71 Gtlrz and Gradisca 211,084 230,505 13-00 84+63 91-11 95-00 97-60 0o46 1 94 9g2 021
Gain, Empire ... 22,144,244 1|,794,23 | 6549 697z2 81-25 | 02 98 42 o783 075 158 075 s
980
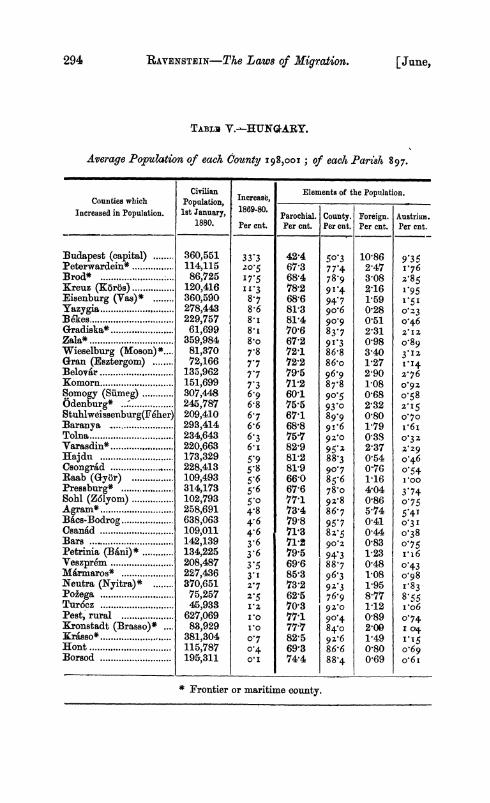
294 RAvENSTEIN-The Laws of Migration. [June,
TABLI V.-EUNQARY.
Average PopuZation of each County 198,oo0; of each Parish 87.
Civilian :Elements of the Population. Counties which Population, Increase,
Increased in Population. 1st January, 1869-80. Parochial. County. Foreign. Austrian. 1880. Per cnt. Per cnt. Per cut. Per cnt. Per cnt.
Budapest (capital) ........ 360,551 33-3 424 5O03 10 86 9-35 Peterwardein* ................ 114,115 205 67-3 77 4 2 47 I76 Brod* ........... ..... 86,725 I 68-4 78-9 308 285 }reuz (K6ros) ................ 120,416 I 13 78-2 9 14 2-16 1.95 Eisenburg (Vas)* ........ 360,590 8.7 68-6 94 7 1-59 1-51 Yazygia ..... 278,443 8-6 81-3 go-6 0-28 oz_3 B6kes ................ 229,757 8 i 81'4 90g9 0-51 0-46 Gradiska* .............. 61,699 8-1 70-6 83.7 2'31 2,zI Zala* ................ 359,984 8'o 67-2 91-3 0-98 o-89 Wieselburg (Moson) *.... 81,370 7-8 72-1 86 8 3-40 31 2 Gran (Esztergom) ........ 72,166 7-7 72-2 86-o 1-27 I.I4 Belovir ................ 135,962 7-7 79 5 96-9 2-90 2.76 Komorn ................ 151,699 73 71-2 87-8 1 08 0 9Z Somogy (Simeg) ............ 307,448 6-9 60-1 90o5 0-68 0-58 (Odenburg* ................ 245,787 6-8 75-5 93 0 2-32 2.15 Stuhlweissenburg(Feher) 209,410 6-7 67-1 89-9 0-80 0 70 Baranya ................ 293,414 6-6 68-8 9 * 6 1-79 i 6 i Tolna .234,643 6.3 75-7 92'0 038 0-3 2 Varasdin* ................ 220,663 6-i 82-9 95 Z 2-37 Z-29 ajdu .173,329 5 9 81-2 88.3 0-54 0o46
Csongrd ................. 228,413 5-8 81-9 90-7 0-76 054 Raab (Gy~3r) .109,493 5-6 66-0 85.6 1-16 1-00 Pressburg* - ................ 314,173 5.6 67-6 78.o 4-04 3*74 Sohi (Z61yom) ................ 102,793 5-o 77-1 9z 8 0-86 0-75 Agram* ................ 258,691 4.8 73-4 86-7 5-74 541 Bacs-Bodrog - ........... . 638,063 4. 6 79-8 957 0-41 3 I Csanad .......... ...... 109,011 4.6 71-3 8z25 0 44 o'38 Bars ........ ........ 142,139 3-6 71-2 902 0-83 o075 Petrinia (Bni)* ............ 134,225 3-6 79.5 94:3 1-23 v 16 Veszpr6m ................ 208,487 3*5 69-6 88-7 0-48 0-43 Marmaros* ................ 227,436 3.I 85-3 96.3 1-08 o g8 Neutra (Nyitra) * 370,651 2-7 73-2 9-z3 1-95 r183 Poiega ........... ..... 75,257 2-5 62-5 76.9 8-77 8-55 TurOcz ................ 45,933 I*z 70 3 92 O 1-12 1-o6 Pest, rural ................ 627,069 IcO 77-1 90'4 0 89 o,74 Xronstadt (Brasso)* .... 88,929 1- 777 84-O 2 00 I o4j ra'sso* ... - - 381,304 o07 82-5 92-6 1-49 vI5 EOnt ........ ........ 115,787 0-4 69-3 86-6 0-80 O069
Borsod ................ 195,311 O I 74-4 88-4 0-69 o 6I
* Frontier or maritime county.
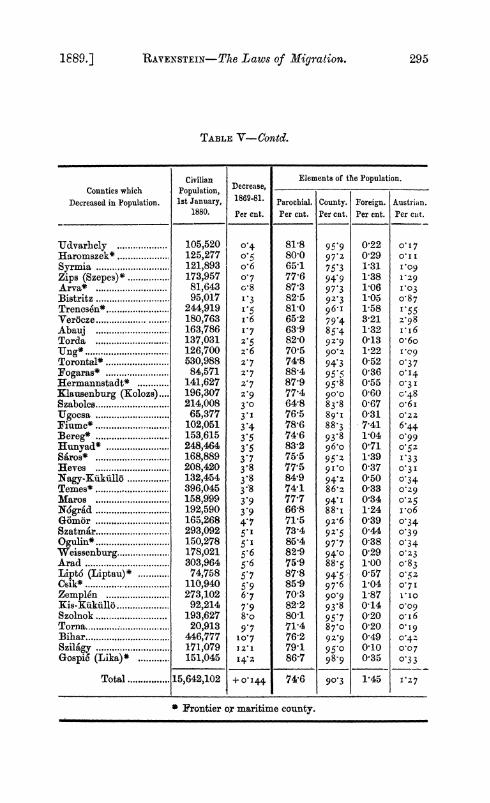
1889.] RAVENSTEIN-The Laws of Migration. 295
TABLE V-COntd.
Civilian Elements of the Population. Counties which Population, Decre1se,
Decreased in Population. 1st January, 1869-81. Parochial. County. Foreign. Austrian. 1880. Per cnt. Per cut. Per cnt. Per cut. Per clt.
Udclvarhely ................ 105,520 O04 81-8 95 9 0-22 017 Haromszek* ................ 125,277 0o5 80 0 97-2 0 29 O- i Syrmia ................ 121,893 o 6 65-1 75>3 1*31 IO9
Zips (Szepes)* ................ 173,957 0-7 77-6 94*9 1-38 1-29 Arva* ................ 81,643 oc8 87 3 97 3 1 06 I103 :Bistritz ................ 95,017 1*3 82 5 9V23 1 05 o087 Trencsen* . ............... 244,919 I>3 81-0 96 1 1-58 I.55 Verocze . ............... 180,763 a*6 65-2 79 4 3 21 2.98 Abauj ................ 163,786 1-7 63 9 85 4 1-32 I*I6 Torda ... . 137,031 2.5 82-0 929 0-13 0o6o TUng* ................ 126,700 z26 70 5 90g2 1'22 I -9
Torontal* ................ 530,988 2.7 74-8 94-3 0-52 O037 Fogaras* ................ 84,571 2-7 88-4 95'* 036 o0I4 Hermannstadt* ............ 141,627 2-7 87-9 95 8 0-55 03 1 Elausenburg (Kolozs) .... 196,307 2-9 77-4 90g0 0-60 0.48 Szabolcs . ............... 214,008 3-0 64 8 83-8 0-67 o-6I Ugocsa .. .............. 65,377 3.I 76-5 89 1 0-31 o02Z
Fiume* ................ 102,051 3-4 78'6 88.3 7-41 6.44 Bereg* ................ 153,615 3-5 74 6 93 8 1-04 o099 Hunyad* ................ 248,464 3-5 83-2 960o 0'71 O.5 2 Saros* ................ 168,889 3-7 75.5 952. 1-39 I *33 Heves ................ 208,420 3.8 77.5 91I0 0 37 03I Nagy-KiikIll6 ................ 132,454 38 84-9 94-2 0 50 0.34 Temes* ................ 396,045 3 8 74-1 86z> 0 33 o0 9 Maros ................ 158,999 3-9 777 94 I 0 34 O.25 N6grad ................ 192,590 3 9 66-8 88-I 1-24 I ro6 Glm6or .......... ...... 165,268 4-7 71P5 92.6 0-39 034 Szatmar . ............... 293,092 5. I 73-4 92-5 0 44 039 Ogulin* . .............. 150,278 5 1 85-4 97 7 0 38 034 Weissenburg . ............. 178,021 5.6 82-9 94.0 0-29 O2 3 Arad ............... 303,964 5.6 75-9 88.5 1-00 o083 Lipt6 (Liptau)* ............ 74,758 5 7 87-8 94-5 0-57 o052. Csik* ............. .. 110,940 5-9 85-9 97.6 1'04 0-71 Zemplen ............... 273,102 6.7 70 3 90?9 187 ioIO Kis-akuI ..ll ................ 92,214 7 9 82-2 93.8 0-14 o0og Szolnok . .............. 193,627 8-o 80-1 95 7 0-20 o-i6 Torna . .............. 20,913 9 7 71-4 87.o 0-20 0oig Bihar . .............. 446,777 io07 76-2 92-9 0 49 o04Z Szilggy ............... 171,079 jz21 79-1 95-o 0 10 0o0 7 Gospic (Lika)* ............ 151,045 I42. 86 7 98-9 0*35 0-33
Total .... 15,642,102 +i O144 74-6 90?3 1-45 V2 7
Frontier or maritime county.
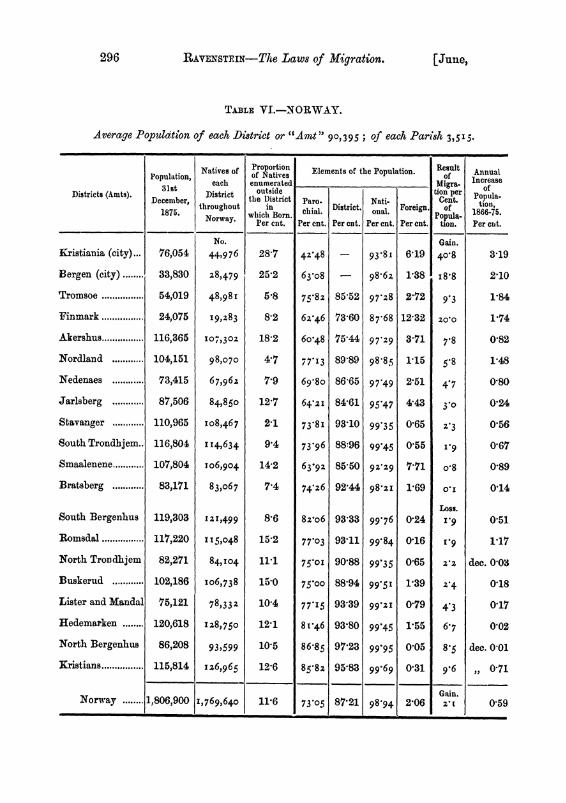
296 RAVENSTF.IN-The Laws of Migration. [June,
TABLE VI.-NORWAY.
Average Population of each District or "Amt" 90,395; of each Parish 3,515.
Natives of Pro ortion Elements of the Population. Result Annual Population, of Natives of increase , each enumerated Migra, of Districts (Amts). 31st District outside Pion per P1oula' December, the District Paro Nati- I Cent. opa
1875. throughout in thial District. I Foreign. o 1866-75 Norway. which Born. Pe n. Popula- Per ent. Per cnt. Per cnt. Per cnt. Per cnt. tion. Per cot.
No. Gain. Iristiania (city) ... 76,054 44,976 287 42.48 - 93*81 6-19 40-8 3-19
Bergen (city) ........ 33,830 28)479 25-2 63,o8 98-62 1-38 I8-8 2-10
Tromsoe ........... 54,019 48,98 I 5-8 75-82 85-52 97-z8 2-72 9-3 1-84
Finmark ........... 24,075 I9,283 8-2 6A246 73-60 87-68 12-32 20z0 1-74
Akershus ........... 116,365 107,302 18'2 60-48 75.44 972 9 3-71 7.8 0-82
Nordland ........... 104,151 98,070 4.7 771I3 89 89 988 8. 115 5-8 1P48
Nedenaes ........... 73,415 6 7,962 7.9 69-80 86-65 97 49 2-51 47 0-80
Jarlsberg ........... 87,506 84,850 12-7 642z I 84-61 95 47 4-43 3.o 0-24
Stavanger ........... 110,965 io8,467 2-1 73.8I 93-0 199 35 0-65 2.3 0-56
South Trondhjem.. 116,804 114,634 914 73-96 88-96 99 45 0-55 IV9 0-67
Smaalenene ........... 107,804 1 o6,904 14-2 63.92 85-50 9229 7-71 o-8 0-89
Bratsberg ........... 83,171 83,o67 7-4 74-z6 92'44 9821 1-69 o-I 0-14
Loss. South Bergenhus 119,303 121,499 8-6 82zo6 93-33 99-76 0-24 1I9 0-51 Romsdal ........... 117,220 115,048 15-2 77'03 93-11 99.84 0-16 C9 1-17
North Tronddhjem 82,271 84,104 11-1 75o01 90-88 99 35 0-65 2-2 dec. 0-03
Buskerud ........... 102,186 Io6,738 15-0 75?00 88-94 99.5I 1-39 2-4 0-18
Lister and Mandal 75,121 78,332 10-4 77'15 93-39 99 21 0-79 4'3 0-17
Hedemarken ........ 120,618 128,750 12-1 8 1-46 93-80 99 45 1-55 6.7 0Q02
North Bergenhus 86,208 93,599 10-5 86-85 97,23 99 95 0 05 8.5 dec. 0 01
Xristians ........... 115,814 I26,965 12-6 85.82 9583 99-69 0-31 9,6 ,, 0-71
Gain. Norway ..-1,806,900 1,769,640 11-6 73o05 87-21 98-94 2-06 zct 0-59
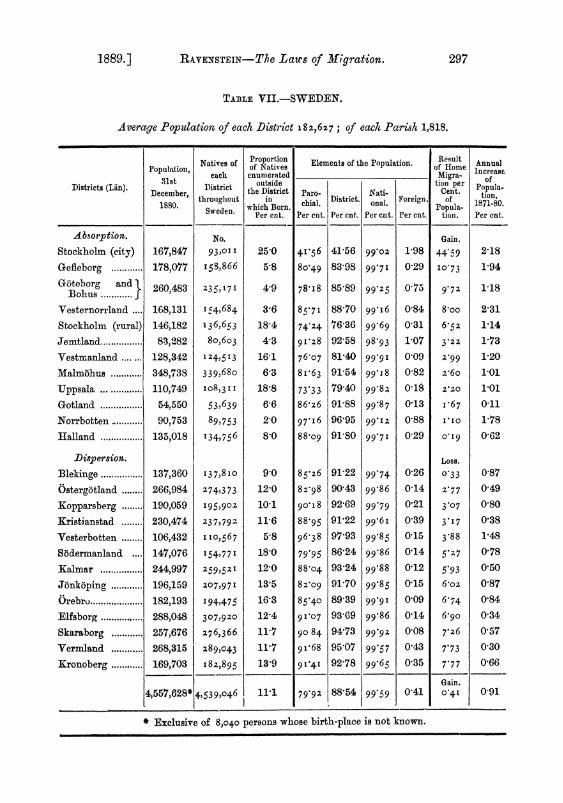
1889.] RAVENSTEIN-The Laws of Migration. 297
TABLE VII.-SWEDEN.
Average Population of each District 182,627; of each Parish 1,818.
Natives of Proportion Elements of the Population. Result Anua Population, e of Natives of Home niiua_ 31st enumerated __ _ _ _ _ _ _ _ _ _ _ _ _ _ _- M igra- ofre
s
Districts ~ December outside Ditittion per p ofu Districts (Lin). llecember, District the District Paro- Nati- Cent. tpnla
1880. wlrdgD. which Born. chial. onal. Foreign. Popula- 1871-80. Sweden. Per cnt. Per cut. Per cnt. Per cnt. Per cnt. tion. Per cnt.
Absorption. No. Gain.
Stockholm (city) 167,847 93,01I 25-0 41'56 41-56 990o2 198 44 59 2-18 Gefleborg ........... 178,077 158,866 5-8 8o049 83 98 99,7 1 0 29 O173 1-94
BOhUS.b - 260,483 235,171 4-9 78-I8 85-89 99-25 075 9.72 1-18
Vesternorriand .... 168,131 I154,684 3-6 85.71 88 70 991i6 0 84 8-oo 2-31 Stockholm (rural) 146,182 136,653 18-4 74 24 76-36 99-69 0-31 6.5z 1.14 Jemtland ........... 83,282 8o,603 4-3 91*28 92-58 98'93 1-07 322 1173 Vestmanland .... ... 128,342 1 24, 5 I 3 16.1 760o7 81-40 99-9 I 0-09 299 1-20 Malmbhus ........348,738 339,68O 6-3 8I*63 91-54 991I8 0 82 2-6O 1-01
Uppsala ........... 110,749 108,3I 1 18-8 73 33 79*40 99 82 0-18 Z 20 1101
Gotland ........... 54,550 53,639 6-6 86-z6 91-88 99'87 0,13 1.67 0 11
Norrbotten ........... 90,753 89,753 2 0 971I6 96B95 99.I2 0?88 I'Io 1-78
Halland ........... 135,018 T34,756 8 0 88-O9 91 80 99 7I 029 0O19 0-62
Dispersion. Loss.
Blekinge ........... 137,360 137,810 9 0 85-26 91-22 99-74 0-26 033 0 87
Ostergbt]and ........ 266,984 274,373 12-0 8z 98 9043 99 86 0-14 2'77 049
Eopparsberg ........ 190,059 195,902 10 1 90o18 92 69 99-79 021 3 07 0 80
Kristianstad ........ 230,474 237,792 11 6 88-95 91 22 99'6i 039 31I 7 038
Vesterbotten ........ 106,432 110,567 5-8 96-38 97-93 99-85 0 15 3.88 1'48
SWdermanland .... 147,076 154,77 I 18-0 79 95 86,24 99-86 0,14 5.27 0-78
Kalmar ............ 244,997 259,521 12 0 88-04 93 24 99 88 012 5 93 0 50
Jbnk6ping ........... 196,159 207,971 13'5 820O9 91 70 99 85 0 15 6 oz 0-87 Orebro ........... 182,193 I 94,475 16'3 85'40 89 39 99 9 I 0'09 6 74 0-84
Elfsborg ........... 288,048 307,920 12 4 9107 93 69 99 86 014 6 9O 0 34
Skaraborg ........... 257,676 276,366 11-7 9o 84 94 73 99*92 0 08 7'26 0-57
Vermland ........... 268,315 289,043 11-7 91i68 95 07 99-57 0-43 7-73 0 30
Kronoberg ........... 169,703 I 82,895 13 9 91.41 92 78 99-65 035 7 7 7 0 66
Gain. 4,557,628* 4,539,O46 11-1 79 92 88-54 99-59 0 41 0.41 0.91
# Exclusive of 8,040 persons whose birth-place is not kown.
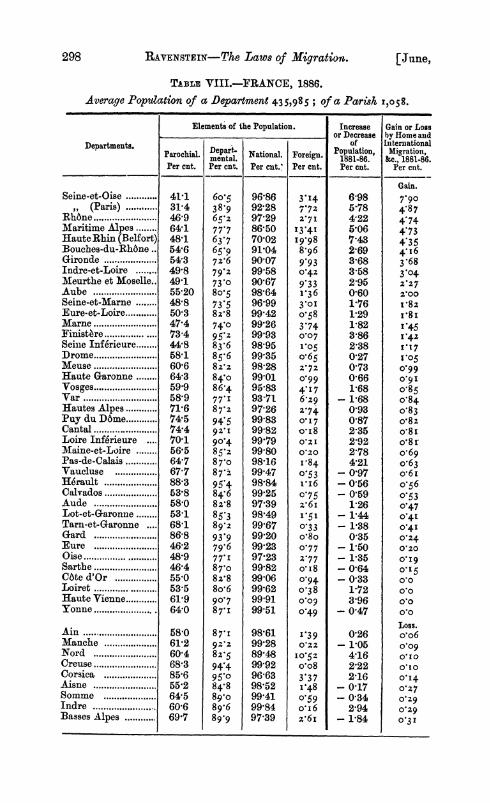
298 RAVEN.STEIN-The Laws of Migration. [June,
TABLE VIII.-FRANCE, 1886. Average Population of a Department 435,985; of a Parish 1,058.
Elements of the Population. Increase Gain or Loss - _______ - or Decrease by Home and
Departments. ~~~ ~~~~~~of International Departments. Parochial. Dmepnata National. Foreign. Population, Migration, Deptart. N1881-86. &cc., 1881-86.
Per cnt. Per cut. Per Cut.' Per cnt. Per cut. Per cuit.
Gain. Seine-et-Oise.. 41-1 6o5 9686 3.14 6-98 7.9o
(Paris) ..... 31-4 38.9 92-28 7A72 5678 4.87 Rh6ne . . 46-9 652 9729 2.71 4-22 4'74 Maritime Alpes .. 64-1 777 8650 I3.41 5-06 4'73 Haute Rhin (Belfort) 48-1 63.7 70-02 I9*98 7.43 4'35 ]Bouches-du-Rhbne 54-6 65.9 91'04 8 96 2-69 4.i6 Gironde . . 543 726 90'07 9 93 3-68 3-68 Indre-et-Loire ........ 49-8 79-2 99-58 0 4z 3-58 3'04 Meurthe et Moselle 49-1 73 0 90-67 9'33 2-95 227 Aube . . 55-20 80-5 98-64 1V36 0-60 z2oo Seine-et-Marne 48-8 73'5 96-99 3.01 1-76 tc8z Eure-et-Loire .. 50-3 8 28 99-42 0o58 1-29 I8 I Marne . . 474 74'o 99'26 3'74 1'82 1.45 Finistsre. . 73-4 95z 99.93 0.07 3-86 4z Seine Inferieure .. 44-8 83.6 98-95 1.05 2-38 I17 Drome . . 8-1 85.6 99 35 o 65 0'27 1.05 Meuse . . 60-6 8zz 98-28 272 073 0o99 Haute Garonne .. 64-3 84.o 99-01 0o99 0-66 09I Vo ses . . 599 86.4 95-83 41I7 1-68 085 Var . .58-9 77.I 93-71 6-29 - 1-68 o.84 Hautes Alpes .. 71-6 8 7.z 97-26 2-74 0-93 o83 Puy du Dbme .. 745 94 5 99-83 01I7 0-87 o 8z Cantal . . 744 9 21 99-82 o-I8 2 35 o 8e Loire Inf6rieure 70-1 90.4 99 79 o z I 2-92 o-8r Maine-et-Loire 56-5 85z 99-80 o0:o 2-78 o-69 Pas-de-Calais .. 64-7 87-o 98-16 I-84 4-21 o63 Vaucluse . . 67-7 8 7. ; 9947 05 3 - 0'97 o-6 I Herault . . 88-3 95'4 98-84 i i6 - 056 o.56 Calvados.... . 53-8 84.6 99i25 c075 - 0i59 0-53 Aude . . 58-0 8 z8 97-39 z-6I 1-26 o047 Lot-et-Garonne .. 53-1 85.3 98-49 1/51 - 1-44 041 Tarn-et-Garonne 68-1 89'2 99-67 033 - 1-38 0o41 Gard . . 86-8 93'9 99-20 o8o 0-35 o024 Eure . . 46-2 79.6 99-23 0.77 - 1-50 0-20 Oise . . 48-9 77 1 97-23 2V77 - 1-35 0OI9 Sarthe . . 46-4 87o 99-82 oi i8 -0-64 0.15 C6te d'Or .. 55-0 8z 8 99-06 094 - 0-33 0O0 Iioiret . . 53-5 8o-6 99-62 0-38 1-72 OO Haute Vienne .. 61-9 90-7 99-91 oop 3-96 OO Yonne . . 64-0 87.I 99-51 0.49 - 0-47 OO
Loss. Ain . .58-0 8 7'I 98-61 I*39 0-26 o o6 Manche . . 61-2 92-2 99-28 o022 - 105 0o09 Nord . . 60-4 82-5 89-48 1o.52 4-16 O ro Creuse - . 68-3 94'4 99-92 oo8 2-22 0O10 Corsica -85-6 950o 96-63 3 37 2-16 0.14 Aisne -55-2 84.8 98-52 148 0-17 o027 Somme -64-5 89o 99-41 0.59 -- 0-34 0-29 Indre . . 60-6 89-6 99-84 ox 6 2-94 0o29 Basses Alpes ... 69-7 89-9 97-39 z6i -1-84 0.31
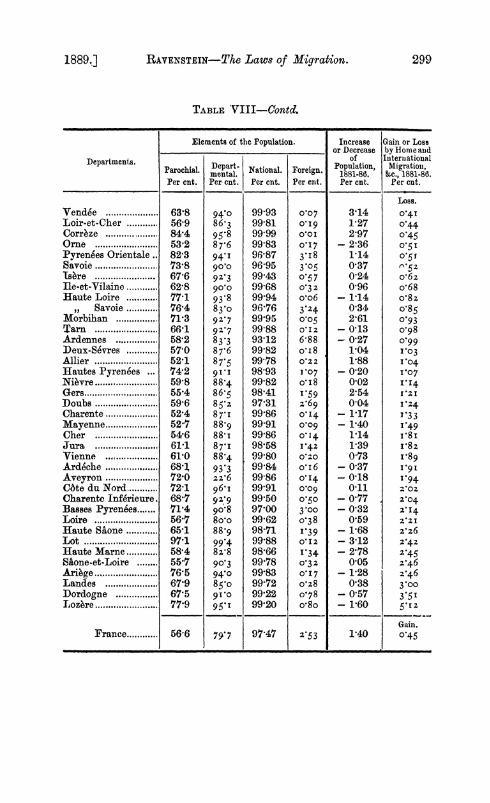
1889.] RAVENSTEIN-The Laws of Migration. 299
TABLE VIII-Contd.
Elements of the Population. Increase Gain or Loss or Decrease by Home an d
Departments. of International Parochial. Depart- National. Foreign. Population, Migration,
Deptart. N1881-86. &c., 1881-86. Per cnt. Per- cnt. Per cnt. Per cot. Per cnt. Per cnt.
Loss. Vendee .............. 63'8 94f0 99.93 o0o7 3814 o.41 Loir-et-Cher ............ 56-9 86 3 99 81 0oI9 1 27 o 4 Correze .............. 84.4 95.8 99 99 O? I 2-97 O45 Orne .............. 53-2 87.6 99 83 oI7 -2 36 o.5 I Pyrenees Orientale .. 82 3 94 1 96 87 3.I 8 1 14 O05 1 Savoie .............. 73-8 90g0 96 95 3*05 0-37 `5 2 Isere .............. 67 6 92'3 99.43 0-5 7 0-24 o 62 Ile-et-Vilaine ............ 62 8 90g0 99-68 o032 0-96 o 68 Haute Loire ............ 77-1 93.8 99 94 oo6 -1-14 o08z
l Savoie ............ 76A4 83'o 96-76 3-24 O034 o 85 Morbihan .............. 71P3 9Z 7 99 95 0-05 2-61 O093 Tarn .............. 66f1 927 99 88 o0I 2 - 013 og98 Ardennes .............. 58-2 8 3.3 93-12 6 88 - 027 o099 Deux-Sevres ............ 57 0 876 99 82 oa 8 1-04 r .o3 Allier . 52-1 87.5 99 78 o02 2 188 0o4 Hautes Pyrenees 74... 42 91I1 98 93 0.07 - 020 I07 Nibvre .............. 59 8 88 4 99 82 oxI8 0-02 I.I4 Gers .............. 55-4 86-5 98-41 1I59 2-54 I 21 Doubs .............. 59 6 8 5.z 97-31 z*69 0 04 124 Charente .............. 52-4 8 7-I 99-86 o.I4 - 117 133 Mayenne .............. 52-1 88'9 99 91 o o9 - 140 i49 Cher .............. 54-6 88- i 99-86 O-14 1P14 Ir8 i Jura .............. 6141 8. I 98-58 I 4z 1-39 I*8 z Vienne .............. 61P0 88.4 99-80 o ,o 0 73 I*89 Ardeche .............. 681, 93*3 99.84 oi 6 - 0 37 I*91 Aveyron .............. 72-0 2 26 9986 014 - 018 I 94 COte du Nord ............ 72 1 961i 99-91 0o09 0-11 _o-z Charente Inf6rieure. 681 92,9 99 50 o5o - 0 77 2V04 Basses Pyrenees 71....... 14 go- 8 97-00 300 - 0-32 2.I4 Loire ........ ..... 56-7 8o o 99-62 o038 0-59 2 2I Haute SAone ............ 65-1 88'9 98 71 39 - 1-68 2z26 Lot ........ ....... 97-1 99 4 99-88 oIz - 3-12 2z42 Haute Marne ............ 58-4 8z 8 98-66 1r34 - 2178 2.45 SAone-et-Loire ........ 551 90?3 99-78 0-32 0 05 2-46 Arihge .. 76-5 94 0 99-83 o0I7 - 1-28 2.46 Landes ............. 67-9 85-0 99172 O-28 0-38 3o00 Dordogne ............. 67-5 9CI0 99-22 o78 0 57 3.51 Lozbre . 77-9 951, 99-20 o-8o -1 60 5.12
Gain. France ........ 56 6 79*7 97 47 2.53 1-40 0.45
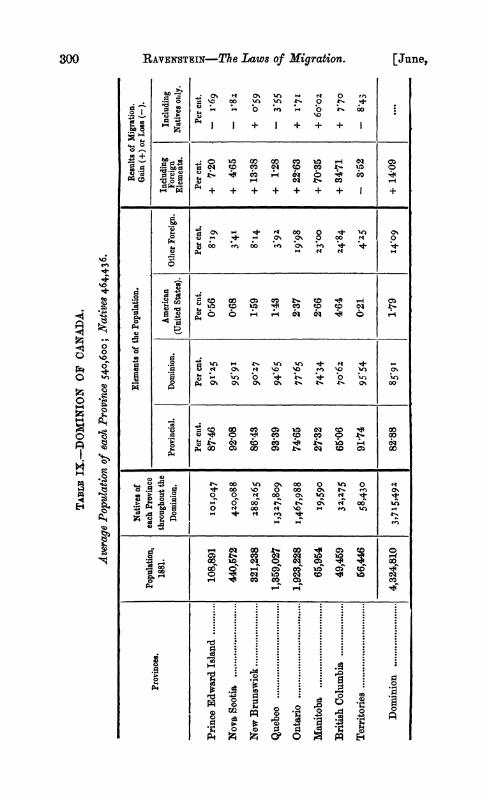
TDLEI IX.-DOMINION OF CANADA.
Average Population of each Province 540,60o; Natives 464,436.
Natives of Elements of the Population. Results of Migration. P plto, each Province _ _ _ _ _ _ _-_ _ _ _ _ _ - _ _ _ _ _ _ _ _ _ _ _ _
Gain (+) or Loiss() Provinces. Population, ec Poice-p
Provinces1881. throughout the ..American Including Including W Dominion. Provincial. Dominion. (United States) Other Foreign. Foreign
(United States). Elements. Natives only. w
Per cut. Per cnt. Per cut. Per cnt. Per cnt. Per cut.
Prince Edward Island ............ 108,891 101,047 87-46 9TC25 0 56 8,i9 + 7-20 | 1@69
Nova Sootia ............. 440,572 420,o88 92-08 95'91 0-68 3'41 + 4.65 - 1,82
New Brunswick ............. 321,238 z288,z65 86A43 90 27 1 59 8'14 + 13-38 + 0o59
Quebeo. .*............................. 1,359,027 1,327,809 93 39 94'65 1-43 3'9z + 128 - 3 55 5 ,
Ontario ................................... 1,923,228 1,467,988 74 65 77 65 2-37 | 1998 + 22 63 + 1,71
Manitoba ....
65,954 19,590 2732 274 '34 266 |230 + 7035 + 6o0oz 2
British Columbia . .49,459 32,275 | 6506 | 706 | 464 | 24684 + 34- + 77
Territories ........5 |6,446 58,430 9174 95-54 0-21 4-25 - 3-52 - 843
Dominion ........ 4,324,810 3,715,492 8288 85-91 1179 14'09 + 14-09 ....
0)
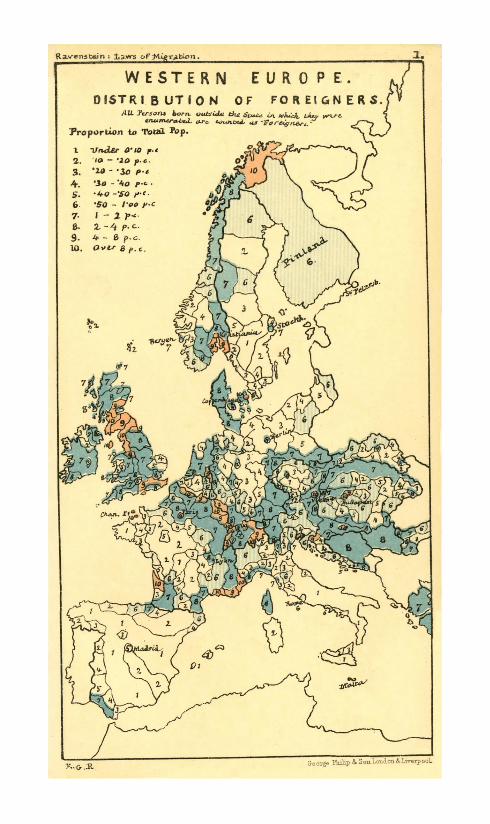
tav enstzsn * laws o*Fi&r&tion.
WESTERN E DR PE. DI6TR IB UT IO N OF FO R El G.N ES.
AU Asor, ofi v-fA &sX a.. Le , a," '
Propoorion to. Toa Ptp.
I VAJ oDo Pe'd 2. to- 'JOp .. 3. -*3j. Pd-
4. -So3--C.ep So - lee0 r*C
7. 1 .2?'- B 2. -'ep -
Art A
77
S~ 0 og ?.p& o 1&aLW'?0
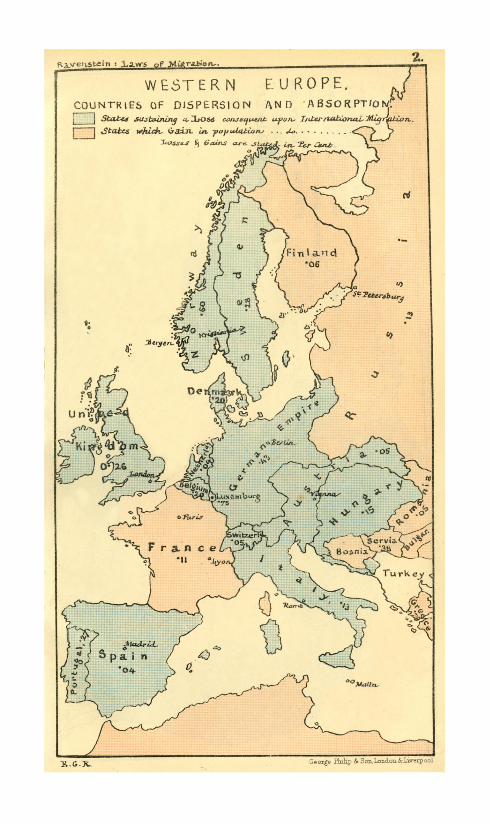
Rasvexstein s laws of MiAraon- 2.
WESTERN E UROPE. COuNrRIE$ OF DISPERSION AND ASSOIIPTIO
Ste nMAuiu Aas Aeapat adwo a ?Mrs nLAa. jJ Staics I>h14L sae. Ma-Age ' 4-'. . am"
L
XGqO9 Nhp & So =& o& Lwnpoo
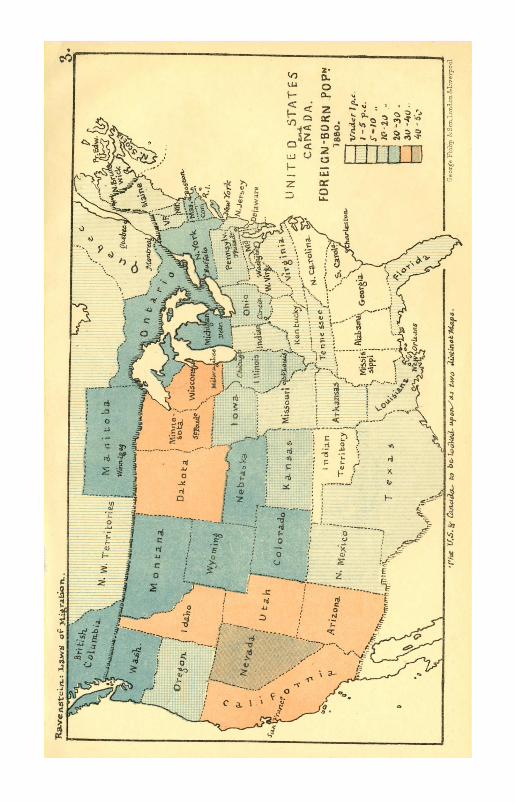
Rt'vtAetc;4Lls L tws of MivtlbOiW.
W. LJ n t oM
!J'LflI I %.~~~~~~ owI
s jL s, ~ ~ ~ ~ L~ V D~tAE J ~~~~~CANA DA. goo II alan ~~~~~~~~~~FOREIGIUBURN POP'?
N. I Vnwt Ipl V 2 . I~~~~ ..... j A W ~~~~~~~~~~~~~~~~~~~~~-30.'
4A~A.5E I...~, .lj~net Mard. O~g ?' 3h -L.clc &Y ?P
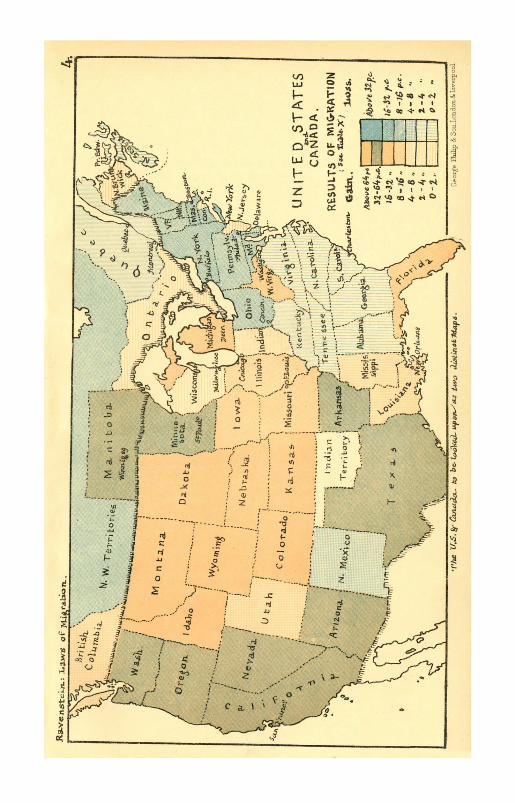
ft-ye"Uih t t 62S ; Of Vwer~tir.. 4
:1. I~d~d&/ w 'M.-riJ@oba
r r \ { t . ........ .. .rI$uI UNITE TC NAD STWF.
Dak;Trak _ ... RESULTS Of MI&HATION
r ,# OiL 0 1 NB laeiO ~ritrl2? %* ic [
N>.tou / I -~'~ -..E -8 miiidi ,<ii. ,, J2 a
tahs^< e,' & .
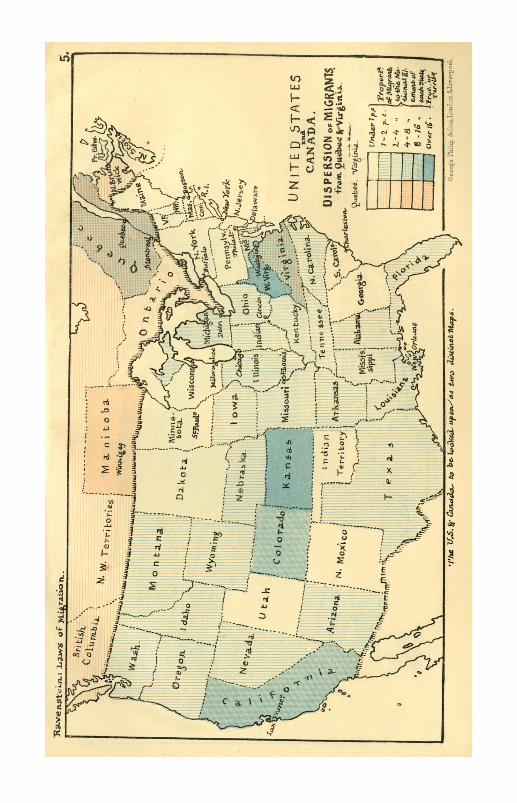
IC~~~~~~~~~~~~~~~~~~~~~~~~~~~~~~~ri~~~~~~~~~~~~~~~~~~*
*ntlow.)
Coio~~~brakj Ohi K vg ..... ...CW
I-- ........ . CANAVA.
ncA'an 0.0 OIPE R31ONopMIGR&A". J
..~~~~~~~~~~~~~~~~~~~~~~ e. ~~~~~~~N. Mo c0 9XI C-Trribr- " .
~~ZIZ~~iT~ rj L sI4
0 Gap-.,~~~~~~&mm&o
Lf y~%,/j -w
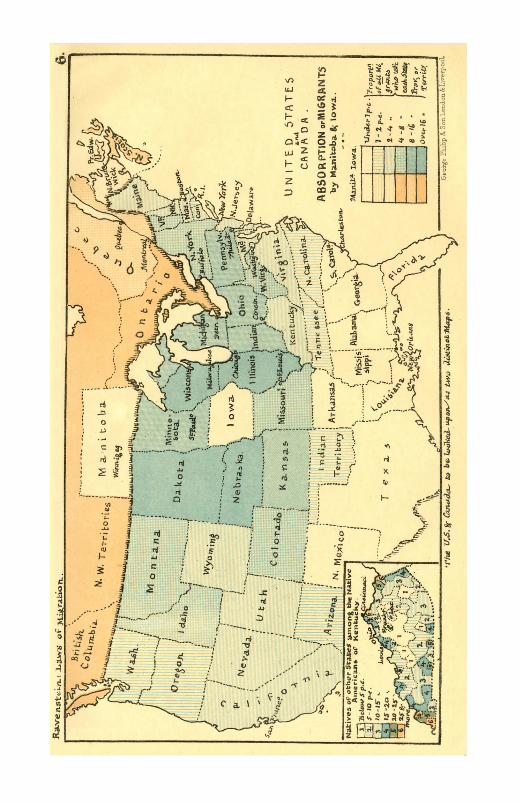
usL 1%-..- -..c
C0 , ,,18M > Id I nJ a
W- M a. | iob3
~~ / *m*USS~~umS~gpam~~aimg.~ ~ ~22 X Oh.
es O, Da It $1 -ddo : D1 tb.ta
tisws~~~~~~~~~~Ak~ss b7 * _bS ; ow J,\
tnakgve s ^eii 9q Co- Argj t '71w eSulfl
-, T * X z, 't?'. ' K _ X - -,
i.ppl
Joa
eaX,^ Y
a'-' d& xS I a\ e - Hdornt N I 1 1"',6; obwL1
*1_ _ _fS +,eor~p 2'Li'ao 3.5c ,a _m& Ia".w ' L
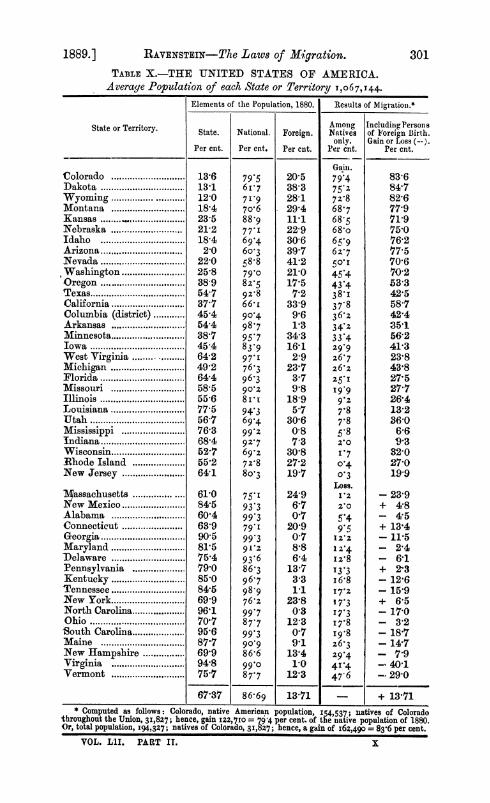
1889.] RAVENSTEIN-The Laws of Migration. 301 TABLE X.-THE UNITED STATES OF AMERICA.
Averaye Population of each State or Territory 1,067,144.
Elements of the Population, 1880. Results of Migration.*
State or Territory. Among IncludingPersons aeor or. State. National. Foreign. Natives of Foreign Birth. only. Gain or Loss
Per cnt. Per cnt. Per cnt. Per cnt. Per cnt.
Gain. Colorado ............................ 13'6 79'5 20'5 794 83-6 Dakota . . . 13'1 6I*7 38-3 752Z 8417 Wyoming ... 120 719 28 1 72'8 82-6 Montana ... 184 7o'6 29-4 68'7 77.9 Kansas .. ............... 23 5 88 9 11'1 68.5 71l9 Nebraska ... 21-2 77-I 22-9 68'o 75-0 Idaho . . . 18-4 69'4 30-6 65'9 76-2 Arizona . . . 20 6O3 39-7 6 '7 77.5 Nevada ... 22 0 58-8 41-2 5O'1 70-6 ,Washington ... 25-8 79o 21-0 45'4 70-2 Oregon .. . 389 8z'5 175 43 4 53-3 Texas . . . 54-7 9z8 7-2 381I 42'5 California ... 37-7 66' 339 378 58-7 Columbia (district) .. 454 90'4 9'6 36'2 42-4 Arkansas .................. 54 4 98'7 1'3 34'2 351 Minnesota ... 38-7 957 43 33*4 56-2 Iowa . . . 454 839 16'1 29'9 41-3 West Virginia . ......... 64-2 97"I 2 9 z6'7 23'8 Michigan ... 492 76'3 23'7 z6'z 43'8 Florida ... 64-4 96'3 3-7 Z.5I 27-5 Missouri ... 585 902 98 I 9'9 27-7 Illinois . . . 556 8 ril 18-9 9'Z 26'4 Louisiana ... 77-5 943 5-7 78 13-2 Utah . . . 567 69-4 30'6 7'8 36-0 Mississippi ... 76-3 99'2 08 58 6-6 Indiana ... 68-4 92-7 7 3 2o %93 Wisconsin .... 527 69z 30-8 I.7 32-0 Rhode Island. . 55'2 72'8 27-2 O04 27-0 New Jersey ... 64-1 80'3 197 O3 19 9
Loss. Sassachusetts ... 610 75'I 249 1'z - 23-9 New Mexico . . 84-5 9 3' 6-7 z'o + 4'8 Alabama ... 604 99'3 0'7 5'4 - 4-5 Connecticut ... 639 79-1 209 9'5 + 13-4 Georgia ... 905 993 0.7 iz'z -11-5 Maryland ... 81'5 912 8'8 1 z4 - 2'4 Delaware ... 754 93. 6 6-4 iz'8 - 6'1 Pennsylvania ... 790 86'3 13-7 13'3 + 2,3 Kentucky ... 850 96'7 3-3 i6'8 - 12'6 Tennessee ... 84- 989 1.1 17-2 - 15'9 New York ... 69-9 76-z 23'8 17-3 + 6-5 North Carolinar.. 961 997 03 17'3 - 17-0 Ohio . . . 70'7 8 7'7 12 3 17'8 - 3-2 -South Carolina.. 956 993 0'7 I9-8 - 187 Maine. . 877 90g9 9'1 z6'3 - 14'7 New Hampshire .. 69'9 86-6 13-4 29-4 7 7 9 Virginia ... 94-8 99'0 1-0 41I4 - 40-1 Vermont ... 75-7 87'7 12'3 47 6 _ . 29 0
67'37 86-69 13-71 + 13'71 * Computed as follows: Colorado, native American population, 154,537; natives of Colorado
throughout the Union, 3I,827; hence, gain n22,710 = 79 4 per cent. of the native popuation of 1880. Or, total population, I94,327; natives of Colorado, 31,827; hence, a gain of I62,490 = 83'6 per cent.
VOL. LiI. PART II. x
302 [June,
DiscusSION ons MuR. RAVENSTEIN'S PAPER.
MR. N. A. HUMPHREYS said that the paper to which they had just listened was one to be studied rather than discussed. There was however one point of interest which had not been dealt with in the paper, namely, the destination of all the emigrants from Europe, and especially from the United Kingdom. The last census report showed that nearly 4 millions of the natives of the United Kingdom were known to be in 1881 living elsewhere. One peculiarity with regard to the emigration from England was that, so far as the census authorities had been able to find out, only ioo,ooo of the natives of the United Kingdom were in 1881 living in Europe, whereas nearly 3 millions were living in the United States, and nearly another million in the colonies. With regard to the contrast between England and France, the United Kingdom lost on the balance by migration between 1871 and 1881 164,000 persons, while France, on the other hand, in part compensation for the low birth-rate, actually increased its population by the balance of migration to the extent of 149,000. No doubt Mr. Ravenstein was correct in assuming that one of the reasons why England contained such a small proportion of foreigners was its insular position. It was an interesting fact that whereas England had supplied prior to 1881 4 millions to the population of different parts of the world, she really only contributed to the population of France the small amount of 36,447 persons. After carefully read- ing Mr. Ravenstein's former paper, and listening to the present one, he arrived at the conclusion that migration was rather distinguished for its lawlessness than for having any definite law. He could not recognise any law from the figures that Mr. Ravenstein had brought before them other than the simple fact that overcrowding of popu- lation was a prelude to dispersion. The difficulty however of establishing the existence of a law of migration did not detract from the great value of the figures which Mr. Ravenstein had submitted to them.
Mr. T. H. ELLIOTT said that the paper had rather whetted than appeased his curiosity, inasmuch as any laws of migration could probably be supported by a much larger number of proofs than were as yet available. It ought he thought to be remembered that in a country with a high birth-rate it was possible that there might be both a considerable increase in the population and a large amount of emigration to other countries, and it therefore by no means followed that a country of dispersion might not be in a better position than a country of absorption. Of course in any consideration of the laws of migration the economic conditions of a country must also be taken into account. Where, as in America the attractions of virgin soil are existing, the population would of
1889.] Discussion on M3r. Rtvenstein's Paper. 303
course flow thereto. He thought that too much importance had been attached to the blue patches on the border line. A great many facts had been submitted to the meeting, and he hoped that Mr. Ravenstein would on a future occasion analyse the causes which led to the existence of those facts.
Mr. STEPHEN BOURNE said that although Mr. Ravenstein had spoken of " Laws of Migration," he had not formulated them in such a categorical order that they could be criticised. It was quite clear that the migration must be governed not by the size of the space included within the border line, but by the length of that border line. The only law with which they were conversant was that where a population treads upon each other's toes, there was a disposition to seek more open spaces, and that was the reason why England sent forth so many of her inhabitants. If there was any peculiarity, such as the gold fields of Australia, or the virgin soil of the west of America, of course people would be attracted there. if Mr. Ravenstein would kindly collect together and give a tabular statement of the two classes of countries, those of dispersion and those of absorption, there would be something that they could investigate critically. Mr. Ravenstein had pointedly asked him (MIr. Bourne) why it was that Maine was a country of great dispersion? The real reason was that Maine was one of the earliest settled provinces of America, and as the inhabitants were prone to seek for unexhausted lands, they followed the general rule and migrated towards the other seaboard. The theory that tropical Africa must be colonised from the old countries on its borders was not consonant with the history of the case. No doubt the first instinct of persons who migrated was to choose the country which involved the least amount of labour and expense in travelling; but in a country like England, having portions of the empire all over the world, emigration was not confined to any particular locality. Our insular position too afforded more easy transit to far distances. Tropical Africa was not at all likely to be settled from the bordering nations of Europe, because those were not the nations in which the migratory spirit was most prominent. He thought that tropical Africa would be reached from the Cape of Good Hope and the western and eastern coasts, following the streams into the interior, rather than from the old and decaying nations that bordered the Mediterranean. He did not quite gather any general law as to why female migrants were increasing so much. He could understand that they did not go long distances as a rule, because they were not so qualified for travel as the male sex; but the reason why females migrated from large towns into the country was because the facilities of education and association attracted them from out- lying districts.
Sir R. W. RAWSON thought it was very doubtful that the peopling of Africa was likely to proceed from the north southward. The Sahara would be a barrier to the extension of population southward, except down the Nile. He agreed with Mr. Elliott
x 2
304 Discussion [June,
that migration might be going on as actively within the interior of a county or country as across the borders. But the governments of different countries, and county councils and poor law boards within smaller spheres, were interested in ascertaining the number of persons who entered and passed out of their jurisdiction. France was a country of absorption to such an extent, that the govern- ment there must in regard to its politics take into consideration the changes in the social condition of its population; while on the other hand Germany was a country of dispersion; it was sending out hundreds of thousands a year into foreign countries. Four or five years ago he said that there were ten and a half millions of Germans existing out of Germany, and Mr. Ravenstein was then of opinion that he had understated the number. The emigration of Italy to South America, to France, to Germany, must- have an influence in the consideration of the politics of Italy and Europe.
Mr. A. K. DONALD wished to ask Mr. Ravenstein whether he did not think that the excessive emigration from Germany was very largely due to the strain of military service there ? He was of opinion that most of the artizan class who left Germany could get quite as good a living there as in England or in America. He did not mean that nominally their wages were as much, but the amount of practical comfort they had was quite as great. One of the speakers seemed to think that migration was caused by over-popu- lated countries spilling their population. Most people would think London over populated, and yet there was a very large influx. A similar state of things prevailed in other capital towns, where living was dear, and where employment often could not be obtained. He was under the impression that very often a spirit of adventure had quite as much to do with the migration as the mere desire for more bread and butter. Too much had been made in the paper of the division lines as showing anything very extraordinary, because such lines might be made on any part of any country with the same results. Before the laws of migration were discovered the causes of emigration must be known, and he fancied that those in the first place would be found to be of an economical character, and to a secondary extent due to the spirit of adventure which might exist in some races more than in others. It was a very interesting fact that as a general rule emigrants did not go very far, but simply pushed from province to province; this pointed to the influx of foreigners into England as one of the causes of the emigration of Englishmen.
Mr. R. HAmILTON considered that Mr. Ravenstein had made a very satisfactory and interesting contribution to that generalization of particulars which would enable them to make a law of migration hereafter. It was an exceedingly difficult thing to know where to draw the line in preliminary investigations of this nature. It was satisfactory to note how easy means of communication between different countries was leading to more intimate intercourse in very many ways. It sometimes happenpd that the wants of one country were curiously supplied by the workmen of another.
1889.] on illr. Ravenstein's Paper. 305
Thus for instance in the construction of the Forth Bridge, notwithstanding the large amount of excellent labour to be obtained in England, Italian workmen had the preference in laying in comparatively deep water the foundations of the enormous buttresses required for that great work. English labourers are in their turn often required to do special kinds of work abroad. The subject of migration is a broad one, and important movements are going on in many other parts of the world. There was a strong migration from the north-west of Africa down by the valley of the Niger. There was also a strong influx on the eastern coast of the same continent from various causes, and the migratory spirit, which was so prominent all over the world ages ago, seemed to be very active at the present time. Many different phenomena would have to be generalised before they could have what in the proper sense of the word could be called a law of migration.
Major CRAIGIE asked Mr. Ravenstein if it would not be possible to give some more information with regard to the movements of the foreign element in the United States. So large a portion of the population of the newly settled Western States was made up of European immigrants, that a record of their primary destination and subsequent settlement would add to the value of the paper.
Mr. RAVENSTEIN, in reply, said that in preparing some of his maps of North America, he had left the foreign element out of account, because it followed quite different rules from the native population. The object was to show that the invasion of a district decreased in strength as the interior was approached. He did not for one moment claim to have discovered any great laws, and he had expressly stated that the origin of migration was economical. All he had tried to show was how the first impulse was being brought into action. It was next to impossible to trace English- men, Frenchmen, and Germans throughout the world. Some figures in the Canadian census had struck him as expressing impossibilities. That census pretended not only to give the elements of population according to birth, but to trace them back for generations. However, that was so large an inquiry that he must leave it to some other member of the Society. Of course he had considered birth-rates, as otherwise he could not have com- puted the absolute loss and gain in the population of a country. He thought that an inquiry into the birth-rates and natural growth of large towns, as compared with what was going on in rural parts, would furnish excellent materials for a valuable paper, and would bring forth some very strange results. He had no reason to think that emigration from Germany was largely due to military service. If it were there ought to be no emigration from this country, but a large emigration from France, where the conditions of military service were even more onerous than they were in Germany.