fiMXTYes No O0'rf~s> V ^ ^ VARIANCE APPLICATION Applicants ...

Articleshttps://doi.org/10.1038/s41560-017-0043-6
© 2017 Macmillan Publishers Limited, part of Springer Nature. All rights reserved. © 2017 Macmillan Publishers Limited, part of Springer Nature. All rights reserved.
1Chemical Sciences and Engineering Division, Argonne National Laboratory, Argonne, IL, USA. 2Material Science and Engineering Department, Northwestern University, Evanston, IL, USA. 3X-ray Science Division, Argonne National Laboratory, Argonne, IL, USA. 4Centre for Nanoscale Materials, Argonne National Laboratory, Argonne, IL, USA. Chun Zhan and Zhenpeng Yao contributed equally to this work. *e-mail: [email protected]; [email protected]; [email protected]
Conventional cathode materials employed in lithium-ion bat-teries are generally lithiated transition metal (TM) oxide compounds. These materials store and release electrical
energy when Li ions are extracted and inserted with charge com-pensated by redox reactions of the TM cations, respectively1. The specific capacity (mAh g–1) of these cathodes, therefore, is limited by the number of electrons per TM cation that can participate in the redox reactions and the relatively high atomic weight of the TM oxide host. Recently, the exclusive dependence on TM cations as the redox centre in the cathode has been challenged by the discovery of oxygen redox reactivity in Li-excess layered oxides2–8. The oppor-tunity has thus arisen to boost the capacity and energy density of lithium-ion batteries if the anionic and cationic redox activity can be enabled at the same potential9,10. However, it is challenging to develop anionic-redox-based cathodes with acceptable cycle per-formance. The key issue is the irreversible O2 gas release due to the instability of oxygenates (that is, O− or On
2−) generated in the solid state. Several studies have demonstrated stabilized oxygenate spe-cies in cathode materials using expensive 4d or 5d TMions such as Ir and Ru2,3,8,10. Nevertheless, low-cost 3d TM oxides are desirable to achieve highly reversible oxygen redox in practical applications, which requires an understanding of the mechanisms underpinning the anionic redox chemistry in this category of materials.
In principle, Li2O with the anti-fluorite structure maximally exploits the anionic redox, as it uses only oxygen ions to provide the charge-compensating electrons in the lithiation/delithiation reac-tion: Li2O ↔ 0.5Li2O2 + Li+ + e− (ref. 11). The direct Li2O/Li2O2 con-version requires a catalyst to promote the electrochemical reaction because of the low electrochemical activity and poor electronic con-ductivity of lithium oxides. The release of O2 is often associated with this reaction due to the metastability of the delithiated Li2O (ref. 12).
Prior studies show that the potential of the oxygen redox reaction of Li2O/Li2O2/LiO2 is as low as ~3.0 V versus Li+/Li (refs 11–14). This value is comparable to the potential of several 3d TM redox reactions, offering the possibility of simultaneous cationic and anionic redox in TM-substituted anti-fluorite compounds. Indeed, it has been shown that the ionic and electronic conductivity, and electrochemical activ-ity, are enhanced on substituting some of the Li ions with TM in Li-rich, defect anti-fluorite compounds such as Li5FeO4, Li6CoO4 and Li6MnO4 (refs 15–19). The anti-fluorite structure offers high potential capacity due to the rich Li ion content (over 5 per transition metal ion). For instance, Li5FeO4 (LFO) delivers a theoretical capacity over 700 mAh g–1 when charging to 4.7 V versus Li+/Li, amounting to an electrochemical extraction of about 4 Li+ ions per Fe3+ ion14,18–21. As it is unrealistic to expect that four electrons can be removed from a single Fe3+ ion, anionic (O2−) oxidation has been suggested but without quantitative analysis or clear confirmation20–22. Despite pre-vious studies of the electrochemical properties of LFO, little is known about the nature of the oxygen redox including the electrochemical potential, the reversibility, and the interplay of Fe and O redox.
Herein, we report the realization of simultaneous anionic and cationic redox in anti-fluorite structures, exemplified by Li5FeO4, at the same potential. Highly reversible anionic redox reactivity with no obvious oxygen release was enabled in this Earth-abundant iron-based oxide under a controlled voltage range. We also pres-ent a clear and quantitative picture of the structural and composi-tion evolution of the LFO by ex situ and in situ X-ray diffraction (XRD), Raman, pressure measurement, differential electrochemical mass spectrometry (DEMS), X-ray absorption near-edge spectra (XANES), and first-principles calculations. Simultaneous oxida-tion of Fe3+ to Fe4+ and O2− to O− was observed at approximately 3.5 V versus Li+/Li during the extraction of the first two Li ions
Enabling the high capacity of lithium-rich anti-fluorite lithium iron oxide by simultaneous anionic and cationic redoxChun Zhan1, Zhenpeng Yao2, Jun Lu 1*, Lu Ma3, Victor A. Maroni1, Liang Li 4, Eungje Lee1, Esen E. Alp3, Tianpin Wu3, Jianguo Wen4, Yang Ren3, Christopher Johnson1, Michael M. Thackeray1, Maria K. Y. Chan4, Chris Wolverton2* and Khalil Amine1*
Anionic redox reactions in cathodes of lithium-ion batteries are allowing opportunities to double or even triple the energy density. However, it is still challenging to develop a cathode, especially with Earth-abundant elements, that enables anionic redox activity for real-world applications, primarily due to limited strategies to intercept the oxygenates from further irrevers-ible oxidation to O2 gas. Here we report simultaneous iron and oxygen redox activity in a Li-rich anti-fluorite Li5FeO4 electrode. During the removal of the first two Li ions, the oxidation potential of O2− is lowered to approximately 3.5 V versus Li+/Li0, at which potential the cationic oxidation occurs concurrently. These anionic and cationic redox reactions show high reversibility without any obvious O2 gas release. Moreover, this study provides an insightful guide to designing high-capacity cathodes with reversible oxygen redox activity by simply introducing oxygen ions that are exclusively coordinated by Li+.
NATuRE ENERgY | VOL 2 | DECEMBER 2017 | 963–971 | www.nature.com/natureenergy 963
© 2017 Macmillan Publishers Limited, part of Springer Nature. All rights reserved. © 2017 Macmillan Publishers Limited, part of Springer Nature. All rights reserved.
Articles Nature eNergy
from LFO. After the initial extraction of two Li ions, the iron and oxygen redox couples are highly reversible within the solid state in subsequent cycles between 1.0 and 3.8 V versus Li+/Li. A Li-excess Li6–O configuration, identified by density functional theory (DFT) calculations, plays a key role in enabling the reversible O−/O2− redox behaviour. Our findings further the understanding of the oxygen redox mechanism and help in the design of low-cost 3d TM oxide-based high-energy-density cathode materials.
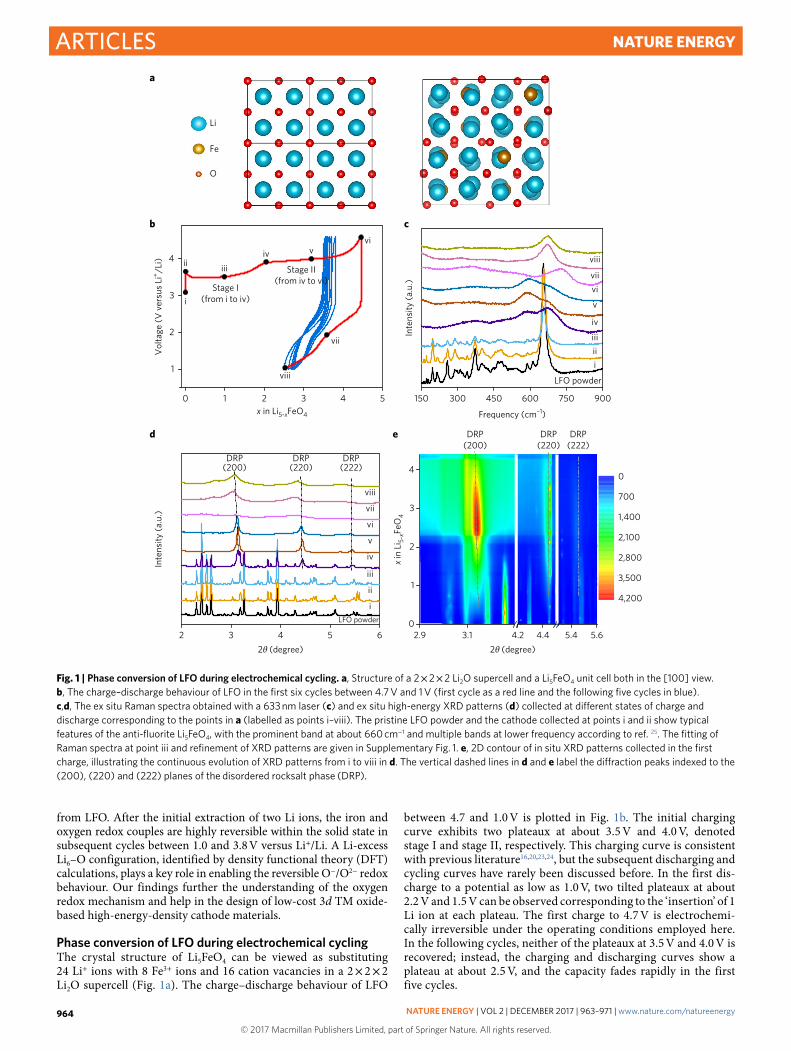
Phase conversion of LFO during electrochemical cyclingThe crystal structure of Li5FeO4 can be viewed as substituting 24 Li+ ions with 8 Fe3+ ions and 16 cation vacancies in a 2 × 2 × 2 Li2O supercell (Fig. 1a). The charge–discharge behaviour of LFO
between 4.7 and 1.0 V is plotted in Fig. 1b. The initial charging curve exhibits two plateaux at about 3.5 V and 4.0 V, denoted stage I and stage II, respectively. This charging curve is consistent with previous literature16,20,23,24, but the subsequent discharging and cycling curves have rarely been discussed before. In the first dis-charge to a potential as low as 1.0 V, two tilted plateaux at about 2.2 V and 1.5 V can be observed corresponding to the ‘insertion’ of 1 Li ion at each plateau. The first charge to 4.7 V is electrochemi-cally irreversible under the operating conditions employed here. In the following cycles, neither of the plateaux at 3.5 V and 4.0 V is recovered; instead, the charging and discharging curves show a plateau at about 2.5 V, and the capacity fades rapidly in the first five cycles.
Li
a
b c
d e
Fe
4 ii
ii
i
i
iii
iii
iv
iv
v
v
vi
vi
vii
vii
viii
viii
3Stage I
(from i to iv)
Stage II(from iv to vi)
Vol
tage
(V v
ersu
s Li
+ /Li)
Inte
nsity
(a.u
.)
Inte
nsity
(a.u
.)
2
1
4
3
2
1
0
0 1 2
2 3 42θ (degree) 2θ (degree)
5 6 2.9 3.1 4.2 4.4 5.4 5.6
x in Li5-xFeO4
x in
Li 5-
xFeO
4
DRP(200)
DRP(200)
DRP(220)
DRP(220)
DRP(222)
DRP(222)
0
700
1,400
2,100
2,800
3,500
4,200
Frequency (cm–1)
3 4 5 150 300 450 600 750 900
LFO powder
ii
i
iii
iv
v
vi
vii
viii
LFO powder
O
Fig. 1 | Phase conversion of LFO during electrochemical cycling. a, Structure of a 2 × 2 × 2 Li2O supercell and a Li5FeO4 unit cell both in the [100] view. b, The charge–discharge behaviour of LFO in the first six cycles between 4.7 V and 1 V (first cycle as a red line and the following five cycles in blue). c,d, The ex situ Raman spectra obtained with a 633 nm laser (c) and ex situ high-energy XRD patterns (d) collected at different states of charge and discharge corresponding to the points in a (labelled as points i–viii). The pristine LFO powder and the cathode collected at points i and ii show typical features of the anti-fluorite Li5FeO4, with the prominent band at about 660 cm−1 and multiple bands at lower frequency according to ref. 25. The fitting of Raman spectra at point iii and refinement of XRD patterns are given in Supplementary Fig. 1. e, 2D contour of in situ XRD patterns collected in the first charge, illustrating the continuous evolution of XRD patterns from i to viii in d. The vertical dashed lines in d and e label the diffraction peaks indexed to the (200), (220) and (222) planes of the disordered rocksalt phase (DRP).
NATuRE ENERgY | VOL 2 | DECEMBER 2017 | 963–971 | www.nature.com/natureenergy964

© 2017 Macmillan Publishers Limited, part of Springer Nature. All rights reserved. © 2017 Macmillan Publishers Limited, part of Springer Nature. All rights reserved.
ArticlesNature eNergy
LFO electrodes at different states of charge in the first cycle (labelled i to viii in Fig. 1b) were harvested for ex situ Raman and XRD analyses to determine the crystal phase conversion correlated with the plateaux, as shown in Fig. 1c,d, respectively. The fitting of the Raman spectrum at point iii and the refinement of the XRD pat-terns at points i, iv and v are shown in Supplementary Fig. 1 and Supplementary Table 1. Both the ex situ Raman and XRD profiles show that the initial LFO with an orthorhombic structure (space group of Pbca) converted completely to a disordered rocksalt phase (DRP) at the 3.5 V plateau with the removal of two Li ions (from point i to iv in Fig. 1b)25. The two-phase coexistence can be observed in the middle of the plateau (point iii in Fig. 1b) as shown by the XRD pattern (Fig. 1d). Continuous phase conversion in the first charge is demonstrated in the two-dimensional (2D) contour of the in situ XRD patterns (Fig. 1e). Gradual fading of the original anti-fluorite phase and growth of the DRP can be observed when 0 < x < 2.
Charging of LFO beyond two Li ions on the 4.0 V plateau has been reported previously20, but the mechanistic details of the reaction
were not elucidated. Here, both the ex situ and in situ XRD patterns show that the DRP remains as the dominant phase on the 4.0 V plateau. The peaks of the DRP grow stronger at the begin-ning of the 4.0 V plateau (2 < x < 2.5), then start to get broader and weaker when x > 2.5, and eventually become flattened at the end of charging. The XRD patterns of the DRP appear again in the first discharge, but the anti-fluorite phase cannot be recovered, confirm-ing that deep delithiation of LFO is irreversible.
High-resolution images from transmission electron micros-copy (TEM) helped explain the evolution of the XRD patterns, as shown in Fig. 2. The pristine LFO consists of well-crystallized particles of about 1 μ m in size, with the selected-area electron dif-fraction (SAED) pattern showing a typical single-crystal character (Fig. 2a–c). In contrast, after the removal of two Li ions, the single crystal of LFO breaks into nanoparticles of about 10 nm in size with the overall shape maintained (Fig. 2d,e). The SAED pattern indicates a polycrystalline character of the particle, and the dif-fraction rings are well correlated with the peaks in the XRD pat-tern at point iv.
The fracture of the active particles greatly increases the interface area between the cathode and electrolyte, which should lead to the impedance decrease of the LFO cathode in the first plateau. This trend is observed in the in situ electrochemical impedance spec-tra in Fig. 3. Other possible reasons for this impedance decrease include the enhanced charge conductivity due to the initial delithia-tion and the electronic structure change of iron and oxygen ions. The impedance of the cathode reaches the lowest level at the end of the first plateau and then increases gradually with further delithia-tion at the second plateau. A deeper exploration into the electro-chemistry in the delithiation process is required to understand this
a
b
c
d
e
f
220200
111
0.2 μm 0.2 μm
2 nm 2 nm
2 1/nm 2 1/nm
Fig. 2 | Morphology and structure change of Li5FeO4 during the first charge. a–f, Low-resolution TEM image (a,d), high-resolution TEM image (b,e) and SAED pattern (c,f) of pristine Li5FeO4 (a–c) and the sample charged to 3.8 V after the removal of two Li ions (d–f). It can be observed clearly that the micrometer-size LFO particles break into nanoparticles due to the delithiation. The SAED pattern of the delithiated LFO is indexed by the typical cubic phase structure, with diffuse rings generated by the nanoparticles.
0200
400600
8001,0
000
–400
–800
–1,200
–1,600
–2,000
0200
400600
8001,0
000
–400
–800
–1,200
–1,600
–2,000
Z'' (
Ω)
Z'' (
Ω)
Z' (Ω) Z' (Ω)
a
3
1
4
2
0
x in Li5–x FeO4
x in Li5–xFeO4
Stage I
c
Stage IIb
0 1 2 3 4
3.0
3.5
4.0
4.5
Vol
tage
(V)
Stage I
Stage II
Fig. 3 | In situ electrochemical impedance spectra of Li5FeO4 during the first charge. a–c, The EIS plots collected during charging stage I (a) and stage II (b) as denoted in the voltage profile of the first charge of LFO to 4.7 V (c). The colour of the lines and spheres represents the number of Li ions removed from the cathode, as demonstrated by the colour scale bar on the right. The arrows in a and b show that the impedance of LFO decreases at the 3.5 V plateau but increases at the 4.0 V plateau. The EIS measurements were performed using a three-electrode cell with LFO as the working electrode, a Li wire as the reference electrode and a Li metal foil as the counter electrode. In this way, the impedance contribution of the Li metal anode can be eliminated.
NATuRE ENERgY | VOL 2 | DECEMBER 2017 | 963–971 | www.nature.com/natureenergy 965

© 2017 Macmillan Publishers Limited, part of Springer Nature. All rights reserved. © 2017 Macmillan Publishers Limited, part of Springer Nature. All rights reserved.
Articles Nature eNergy
V-shape evolution of impedance, which will be discussed in detail in the ‘Simultaneous cationic and anionic redox’ section.
Cationic and anionic oxidation during the first chargeFigure 4a shows the in situ Fe K-edge XANES of LFO during the first charge to 4.7 V, and the quantitative analysis of the oxi-dation state of Fe by linear combination fitting is presented in Supplementary Fig. 2a. In stage I (charge to 3.5 eV), the edge posi-tion of the main peak A1, which is related to the oxidation state of Fe, shifted to higher energy (A1′ ) due to the oxidation of Fe3+ to Fe(3+δ)+ (δ ≈ 0.5) with extraction of the first two Li+ ions. This is an indirect indication that some other type of redox reaction is active, as δ should be 2 if the Li removal is fully charge-compensated by the Fe ion. The shoulder peak B and the strong pre-edge peak C are signatures of FeO4 tetrahedral coordination20,24. The pre-edge
is partly caused by a quadrupole-allowed Fe 1s to 3d transition, which is also evident in the octahedral coordination, just not as strongly as in the tetrahedral coordination. The decrease in the intensity of peaks B and C, as well as the gradual change of the three main peaks (A1, A2 and A3 to A1′ and A2′ ), originated from the conversion of the FeO4 tetrahedron in the pristine LFO to the FeO6 octahedron in the DRP24. The disappearance of the FeO4 tet-rahedron is also evident in the Raman spectra (Fig. 1c). In con-trast, during stage II, the edge position of peak A shifted to lower energy, indicating that Fe was reduced during further removal of Li+ without coordination change. Again, the reduction of Fe dur-ing charge indicates that some other species is being oxidized (that is, O ions). This result is consistent with the ex situ Fe Mossbauer spectra shown in Supplementary Fig. 2b and Supplementary Table 2.
0
10
20
30
40
3 4 5
0
1
2
3
4
5
6
520 525 530 535 540 545 550 555 560 0.0
0.1
0.2
0.3
7,105 7,115 7,125 7,135 7,145 7,155
0.0
0.5
1.0
1.5
0.0
0.5
1.0
1.5
0 1 2 3 4 5
0.0
0.5
1.0
1.5
0.0
0.5
1.0
1.5
e
f
d
c
Stage II
Time (h)
Voltage (V)
Stage I
a b
Gauge pressure (PSI)
0 1 2 3 4x in Li5-xFeO4
0 1 2 3 4x in Li5-xFeO4
Gauge pressure (PSI)
2.0
2.5
3.0
3.5
4.0
4.5 Voltage
Vol
tage
(V)
LFO at 3.8 V-expt.
LFO at 3.8 V-simulated
Pristine LFO-expt.
O K-edge EELS
Pristine LFO-simulated
Inte
nsity
(a.u
.)
Energy loss (eV)
O2
CO2
N (1
/e)
Nor
mal
ized
xµ(
E)
Stage II
Energy (eV)
Stage I
CB
A1
A1'
A2
A3 A2'
|x (R
)|
Stage II
R (Å)
Stage IFe–O
Fe–Fe
Fig. 4 | Evolution of iron and oxygen in the first charge. a–c, In situ Fe K-edge XANES (a) and EXAFS (b) of LFO during the first charge to 4.7 V, corresponding to the stages denoted on the charging curve (c). The decrease of the shoulder peak B and the pre-edge peak C, as well as the gradual change of the three main peaks (A1, A2 and A3 to A1′ and A2′ ), originated from the conversion of the FeO4 tetrahedron in the pristine LFO to the FeO6 octahedron in the DRP. The arrows in a show the shift of the main edge in the two stages, while the arrows in b show the decrease of the Fe–O peak and the increase of the Fe–Fe peak during charging stage I. d, Experimentally collected and simulated ex situ O K-edge EELS of Li5-xFeO4 when x = 0 and 2 in the first charge. The simulations were performed using the crystal structure obtained from the experimental results, and thus the calculated shifting and shape variation of the peaks involve both the structural evolution and O redox. e, In situ pressure measurement showing the gauge pressure value inside the cell (blue line) corresponding to the charging voltage profile (red line) in the first cycle. f, Quantitative DEMS data for O2 and CO2 released in the LFO/Li cell in the first charge to 4.7 V. N (per electron) denotes the number of gas molecules generated by each electron. The lines show the smoothed curves using a fast Fourier transform filter.
NATuRE ENERgY | VOL 2 | DECEMBER 2017 | 963–971 | www.nature.com/natureenergy966

© 2017 Macmillan Publishers Limited, part of Springer Nature. All rights reserved. © 2017 Macmillan Publishers Limited, part of Springer Nature. All rights reserved.
ArticlesNature eNergy
The Fe K-edge extended X-ray absorption fine structure (EXAFS) was measured to investigate bond distances and the local structure surrounding the Fe atoms. Figure 4b shows the Fourier transform of the k2-weighted EXAFS. The peak at ~1.5 Å corresponds to the Fe–O bond. The Fe–O bond in pristine LFO is longer than that in the FeO6 unit, which demonstrates tetrahedral coordination of Fe in LFO24. The Fe–O bond is gradually shortened at the end of stage I, that is, approaching the Fe–O bond length of the FeO6. The Fe–O bond distance did not change in an obvious manner during stage II.
When comparing the number of Li ions extracted versus the valence change of Fe during the two plateaux, we inferred that about (2–δ) electrons per formula unit (or per Fe) are required from O atoms in the 3.5 V plateau, and another (2 + δ) electrons are required in the 4.0 V plateau. Therefore, the average valences of the four oxygen ions are expected to change from –2 to – (1.5 + 0.25δ) and then to –1. The evolution of oxygen valence in the solid cath-ode was traced by ex situ O K-edge electron energy-loss spectros-copy (EELS) of pristine LFO and LFO charged to 3.8 V (Fig. 4d). Three peaks near 528.4 eV, 533.6 eV and 539.4 eV are observed in the O K-edge spectrum of pristine LFO, whereas the spectrum for LFO after charging across the 3.5 V plateau exhibits only two board peaks at 528.4 eV and 538.2 eV. The drastic change in the EELS spectra shows the response of oxygen electronic structure to Li
electrochemical extraction, which may possibly be linked to a change in the oxygen bonding environment or oxygen redox. The experimentally observed O K-edge EELS spectra of pristine and del-ithiated LFO were confirmed by O core-level spectrum simulation.
Figure 4e,f shows the in situ pressure measurement and quantita-tive DEMS data of the LFO/Li cell in the first charge to 4.7 V. The pressure increase shows that minor gas release is observed during the charge plateau at 3.5 V. Subsequently, a large amount of gas is released during the 4.0 V plateau. The calculation from DEMS data shows that about 0.1 O2 gas molecules are released per electron on the first plateau. This number increases rapidly to about 0.3 O2 per electron when the potential rises to 4.0 V.
Simultaneous cationic and anionic redoxThe composition of the product generated at the 3.5 V plateau was assumed to be LiαFe(4−α)+O2 by the authors of ref. 24, but the (111)/(200) peak intensity ratio for this composition should be much higher than that in their observed XRD profiles. They attributed the ‘mismatch’ of I(111) to lattice distortion. This ‘mismatch’ is also observed here and, indeed, can be eliminated by reducing the Fe/O ratio in the DRP in the XRD Rietveld refinements (Supplementary Fig. 1). The refined occupancies of the atoms yield a stoichi-ometry of Li3FeO3.5 for the DRP after the removal of two Li ions
Reversible
O redox
e– e–
e–
Li4FeO3.5 Li3FeO3.5
Li2FeO3
IrreversibleO redox
O0
O0
Li
Li
0.0 0.2 0.3 0.4 0.5
a cb
0.0 0.1 0.3 0.4 0.5
Cation
disordering
Partially remain
Partially oxidized
to O 0 and collapse
Number of states per eV0.10.2
Number of states per eV
–3.5
–3.0
–2.5
–2.0
–1.5
–1.0
–0.5
0.0
Ener
gy (e
V)
Ener
gy (e
V)
O 2pFe 3d
O 2pFe 3d
O 2pFe 3d
0.5
–3.5
–3.0
–2.5
–2.0
–1.5
–1.0
–0.5
0.0
0.5EF
O2–
Fe
Li
EF
O–
Fe
Li
0.0 0.2 0.3 0.4 0.50.1Number of states per eV
Ener
gy (e
V)
–3.5
–3.0
–2.5
–2.0
–1.5
–1.0
–0.5
0.0
0.5EF
OFe
Li
Li5FeO4Continuouslyoxidized to O0
LiFeO2
IrreversibleO redox
O2– O1–
O1–
Li
d
O2–
Fe
Li
Fig. 5 | Effect of Li6–O configurations on the electronic states of O ions in cation DRPs. The Li6–O configurations lead to labile oxygen states. a–c, pDOS of the O 2p orbitals and Fe 3d orbitals of O2− ions in the Li6–O configurations and nearest Fe ions in cation-disordered Li4FeO3.5 (a), O1− ions in the Li6–O configuration and nearest Fe ions in cation-disordered Li3FeO3.5 (b) and O2− ions in Li/Fe-coordinated O configurations and nearest Fe ions in cation-disordered Li3FeO3.5 (c). Insets: isosurfaces of the charge density (yellow) around the oxygen ions in the energy range of 0 to − 1.0 eV. All energies are expressed relative to Fermi energy (dashed black lines). Increased pDOS can be found near the Fermi level for the O ions coordinated by six Li, which originates from the particular Li6–O configuration. d, Schematic of the role played by the Li6–O configurations during the (de)lithiation of LFO. The irreversible delithiation from Li3FeO3.5 to Li2FeO3 and LiFeO2 is accompanied by the oxidation of O− to O0 and subsequent elimination of the Li6–O configurations. Meanwhile, the O− ions in these Li6–O configurations can be reversibly reduced to O2− on further lithiation instead of delithiation. Thus, the O−/O2− redox can be reversible when the delithiation does not proceed beyond the point where Li6–O configurations are eliminated.
NATuRE ENERgY | VOL 2 | DECEMBER 2017 | 963–971 | www.nature.com/natureenergy 967

© 2017 Macmillan Publishers Limited, part of Springer Nature. All rights reserved. © 2017 Macmillan Publishers Limited, part of Springer Nature. All rights reserved.
Articles Nature eNergy
(Supplementary Table 1), which is consistent with the DFT simula-tions (Supplementary Notes).
The O K-edge spectra for both Li5FeO4 and Li3FeO3.5 are simu-lated on the basis of the DFT-predicted structures (Supplementary Figs. 3 and 4), using the OCEAN code implementing the Bethe–Salpeter equation approach26,27 (details in Supplementary Notes). The simulated spectra are in excellent agreement with the EELS spectra (Fig. 4d). To determine the electronic origin of each peak, we also compared the simulated spectra with the projected ground-state density of states (DOS) of Li5FeO4 and Li3FeO3.5, as shown in Supplementary Fig. 5. The three peaks in the Li5FeO4 spectrum are attributed to electronic transitions from the O 1s core level to the unoccupied Fe 3d states (of Fe3+ in tetrahedral sites) mixed with O 2p, and to delocalized O p states that are mixed with Fe states at higher energies28. Similarly, the two peaks in the Li3FeO3.5 spectrum can tentatively be assigned to the empty 3d states of Fe3+ and Fe4+ that hybridize with O 2p state, and also to O p states mixed with Fe states in the extended region. The fidelity of the Li3FeO3.5 structural model obtained from DFT calculation is thus corroborated by the close resemblance between the experimental and simulated O core-level spectra.
Therefore, the removal of the four Li ions can be expressed as follows:
→ + . + +.+ −Li FeO Li FeO 0 25O (gas) 2Li 2e (1)5 4 3 3 5 2
→ + . + +.+ −Li FeO LiFeO 0 75O (gas) 2Li 2e (2)3 3 5 2 2
The number of O2 molecules released per electron is 0.125 at 3.5 V (equation (1)) and 0.375 at 4 V (equation (2)), which is close
to the DEMS results. On the basis of the EELS and XANES results mentioned above, Li3FeO3.5 can be expressed as Li3(Fe3+
0.5Fe4+0.5)
(O2−3O−
0.5), which is also consistent with charge states deduced from DFT (see below and Supplementary Fig. 6). According to this electrochemistry, the lowest impedance of the cathode at around x = 2 (Fig. 3) could originate from the high electrochemical activity of the Fe4+ and O− in the Li3FeO3.5. In total, the removal of the first two Li+ ions is charge-compensated by one electron from the for-mation of oxygen vacancies (0.5 O2− to 0.25 O2), 0.5 electrons from oxygen redox in the solid state (0.5 O2− to 0.5 O−) and 0.5 electrons from Fe redox (0.5 Fe3+ to 0.5 Fe4+). Subsequently, 0.75 O2 gas per formula unit is released from 0.5 O− plus one O2−, providing two electrons for the removal of another two Li ions and 0.5 electrons for the reduction of 0.5 Fe4+ back to 0.5 Fe3+.
When comparing our results for LFO with those of layered oxides reported previously, we find that the potential for oxygen redox (~3.5 V versus Li+/Li) and O2 release (4.0 V versus Li+/Li) in the LFO cathode is lower than that in the layered oxides (4.2 V and 5 V versus Li+/Li, respectively, for Li4FeSbO6)4. One possible reason for the more facile oxygen redox is the difference in the bonding or coordination environment of the oxygen ions relative to the cation (Li/Fe)-disordered sub-lattice in the DRP. Unlike con-ventional cubic cathode materials, which are well ordered and have only a single local environment for oxygen ions, a variety of local oxygen environments exist in cation DRPs. Through systemati-cally calculating and examining the DOS and charge/spin density around oxygen ions in various local environments using DFT, we demonstrate that the local configuration sensitively affects oxygen redox activity in LFO (Fig. 5). To determine the oxidation states of oxygen ions, we compared calculated magnetizations of oxygen ions with the number of unpaired electrons of the corresponding ions at each oxidation state (Supplementary Fig. 6). In the result-ing Li3FeO3.5 phase, DFT calculations show that all of the O− ions share a common ‘Li6–O’ configuration (Fig. 5d) with only Li ion coordination (first nearest neighbours) while the remaining oxy-gen ions stay as O2− with at least one Fe first nearest neighbour (Supplementary Fig. 7). The projected DOS (pDOS) of the oxy-gen 2p states and 3d states of the nearest iron ion for Li6–O- and Fe-coordinated configurations were examined and are shown in Fig. 5b,c. A much greater pDOS from the oxygen states than from the iron states immediately below the Fermi level is found for the O− ion coordinated with six Li ions (Fig. 5b). The origin of this increased DOS can be identified by visualizing the charge den-sity around the oxygen ion for the energy range corresponding to the extraction of one electron (inset of Fig. 5b). Distinct from the previously reported local Li-excess ‘Li–O–Li’ configuration6, here we find that the O− in the local Li-excess environment originat-ing from this particular Li6–O configuration can emit one labile electron and become O0 on further delithiation of Li3FeO3.5. Our calculations indicate that the local coordination is responsible for oxygen redox (O2− to O−). We find that the irreversible delithiation from Li3FeO3.5 to Li2FeO3 and LiFeO2 is accompanied by gradual oxidation of O− to O0 and subsequent elimination of the ‘oxygen redox’-specific Li6–O configurations (Fig. 5d). Nevertheless, the O− ions in these Li6–O configurations should be reversibly reduced to O2− on further lithiation instead of delithiation. Thus, the calcu-lations suggest that the O−/O2− redox can be reversible when the cutoff voltage for charging is lowered such that delithiation does not proceed to the point where Li6–O configurations are elimi-nated (and O0 is formed). We will discuss this hypothesis in the following section.
Reversibility of the anionic and cationic redoxFigure 6 shows the cycle performance and the in situ gas release measurements for LFO during cycling between 1.0 and 3.8 V after the extraction of the first two Li ions in the first charge. As
0 40 80 120
1
2
3
4
5
0 5 10 15 200.0
0.2
0.4
0.6
0.8
1.0
1.2b
Voltage
Vol
tage
(V)
Test time (h)
a
0
1
2
3
4
Gauge pressure
Pressure (PSI)
Nor
mal
ized
dis
char
ge c
apac
ity
Cycle number
4.7 V3.8 then 4.7 V
3.8 V 4.7 V
Fig. 6 | Onset voltage for O2 gas release from Li5FeO4 a, The voltage profile (red line) and the in situ pressure (blue line) of the Li5FeO4/Li cells during cycles with an upper cutoff voltage of 3.8 V. b, Performance of Li5FeO4 when cycled with a cutoff voltage of 3.8 V and then 4.7 V (magenta line, corresponding to cell in a versus at 4.7 V from the beginning (navy line)).
NATuRE ENERgY | VOL 2 | DECEMBER 2017 | 963–971 | www.nature.com/natureenergy968

© 2017 Macmillan Publishers Limited, part of Springer Nature. All rights reserved. © 2017 Macmillan Publishers Limited, part of Springer Nature. All rights reserved.
ArticlesNature eNergy
shown in Fig. 6a, no obvious gas release occurred when the cell was cycled with the upper voltage limited to 3.8 V. On the contrary, the gas pressure increased every time the cell was charged to 4.0 V (Supplementary Fig. 8a). In addition, the noticeable gas release at
the 4.0 V plateau is maintained after several cycles between 3.8 V and 1.0 V, confirming that the oxygen ion redox couple stays in the solid cathode when it is cycled below 3.8 V after the first two-Li extraction. The cathode showed stable capacity when cycled with the upper voltage limit at 3.8 V, but not 4.7 V (Fig. 6b and Supplementary Fig. 8b).
To study the reversibility of the Fe3+/Fe4+ redox couple, in situ Fe K-edge XANES were collected for the LFO cathode during the cycles after the first charge to 3.8 V, as shown in Fig. 7. During the discharge from 3.8 V to 1.0 V, the main Fe K-edge shifted back to around 7,130 eV, confirming the reduction from Fe(3+δ)+ to Fe3+. However, the typical tetrahedral Fe3+ peaks and edges of the original LFO (shown in Fig. 7a) were not recovered. This finding indicates that the octahedral Fe(3+δ)+ in the DRP does not move back to a tet-rahedral site (in the original LFO phase) after being reduced to Fe3+. The irreversibility of the Fe redox in the first charge and discharge is consistent with the asymmetric voltage–capacity profile in the first cycle. On the other hand, after the first charge to 3.8 V, the Fe K-edge XANES shows a nearly symmetric pattern between the first discharge and the second charge, as demonstrated in the 2D con-tour graphs (Fig. 7c,d), indicating that Fe(3+δ)+/Fe3+ at the octahedral site can be reduced and oxidized reversibly.
According to the DFT simulations of the lithiated phase (Li~4FeO3.5), the pDOS from the 2p states of the oxygen ions in the centre of the Li6–O configurations, which are inherited from Li3FeO3.5, is confirmed to be greater than the pDOS from the 3d states of the nearest iron ions (Fig. 5a). Corresponding labile elec-tron extraction/insertion from these Li6–O configurations enables reversible O2−/O− redox. As about one Li ion (corresponding to a capacity around 170 mAh g–1) is involved in the first discharge and the following cycling between 1.0 and 3.8 V, about 0.5 electron is provided by cationic redox (0.5 Fe4+ ↔ 0.5 Fe3+) and 0.5 electron is then provided by anionic redox (0.5 O− ↔ 0.5 O2−).
7,110 7,115 7,120 7,125 7,130 7,135 7,140
1 2 3 40
4
8
12
16
First dischargeFirst discharge
Second charge
Nor
mor
lized
abs
orpt
ion
(a.u
.)
Energy (eV)7,115 7,120 7,125 7,130 7,135 7,140
Energy (eV)
a b
Firs
t-or
der-
deriv
ed a
bsor
ptio
n (a
.u.)
Second charge
7,120 7,125 7,130Energy (eV)
0.000
0.375
0.750
1.125
1.500
Test
tim
e (h
)
Voltage (V)7,117 7,121 7,125 7,129 7,133
edc
Energy (eV)
–0.010
0.043
0.095
0.148
0.200
Fig. 7 | Reversibility of the Fe3+/Fe4+ redox couple. a,b, Normalized (a) and first-order-derived (b) in situ Fe K-edge XANES collected on the LFO cathode during the first discharge and the second charge after the initial charge to 3.8 V. c–e, 2D contour of a (c) and b (e), corresponding to the charge–discharge curve (d).
Li3FeO3.5
AmorphousLiFeO2
x in Li5–xFeO4
Vol
tage
ver
sus
Li (V
)
Fe3+(Td)
O2–
Fe 3+(Oh)
O 2–
Fe3+(OH)
O2–+O2(g)
Li5FeO4
LiFeO
5
1
2
3
4
0 1 2 3 4
Fe3+/Fe4+(Oh)
O2–/O–/O2
Fe3+/Fe4+(Oh)
O2–/O–
Fe 3+/Fe 4+(Oh)
O 2–/O –
Oxygen sites with random vacancies
Fig. 8 | Schematic of the structural change and redox reactions in Li5FeO4 during electrochemical cycling. For clarity, the structure of pristine Li5FeO4 is simplified as the standard anti-fluorite structure by ignoring the position offsets of the atoms. The first charging voltage profile is plotted in red. The structure of the cathode material after discharging of Li3FeO3.5 (shown as the blue curve) is demonstrated in Supplementary Fig. 8d, resulting from the refinement of the ex situ XRD pattern. As the octahedral sites are fully occupied in Li3FeO3.5, the lithiation of Li3FeO3.5 occurs with the insertion of Li ions into the tetrahedral sites.
NATuRE ENERgY | VOL 2 | DECEMBER 2017 | 963–971 | www.nature.com/natureenergy 969

© 2017 Macmillan Publishers Limited, part of Springer Nature. All rights reserved. © 2017 Macmillan Publishers Limited, part of Springer Nature. All rights reserved.
Articles Nature eNergy
DiscussionFigure 8 summarizes the structural changes and redox reactions involved in the electrochemical cycling of LFO. With the removal of two Li ions on the 3.5 V plateau, Fe and Li ions migrate from tetrahedral sites to octahedral sites with a conversion from the anti-fluorite phase to a DRP. At the same time, part of the Fe3+ and part of the O2− are oxidized to Fe4+ and O−, together with the formation of some oxygen vacancies. The Fe4+/Fe3+ and O−/O2− redox couples in the lattices are reversible with substantial capacity retention in the subsequent cycles when the upper potential is limited to 3.8 V. Charging beyond two Li ions results in the reduction of Fe4+ to Fe3+, as well as O2 gas release.
The pursuit of breaking the capacity limits has recently turned the research focus to the anionic redox. Fundamental research has been carried out on stabilizing oxygenate species by using 4d or 5d metal ions via, for example, high M–O covalence; however, we believe that 3d metal oxides with lower cost and weight could be more practical in terms of real applications. The combined experimental and computational studies in this work demon-strate how the coordination structure and bonding environment enable reversible oxygen redox in the 3d metal oxides. The Li2O-like anti-fluorite structure facilitates oxygen redox potential lower than 3.8 V, while the fully cationic disordered rocksalt phase gen-erated in the charging stabilizes the oxygenate species (that is, O−) via the Li6O configuration. In fact, the Li6–O configuration can be tuned by controlling the Li/TM disordering in the oxides, which could be readily followed by further studies to realize improved capacities and stability in different electrodes. This extensive understanding of oxygen redox in different coordination envi-ronments could enable new pathways to next-generation, high-energy cathode materials based on simultaneous anionic and cationic redox chemistry.
MethodsMaterial preparation and electrochemical tests. Li-rich anti-fluorite Li5FeO4 (LFO) powders were synthesized by solid-state synthesis in an Ar-filled glovebox (details reported elsewhere29). Electrochemistry tests were performed with 2032 coin cells assembled with a cathode material of 80% LFO, 10% carbon black and 5% polyvinylidene difluoride binder. The GenII electrolyte was used: 1.2 M LiPF6 in ethylene carbonate/ethyl methyl carbonate at a 3:7 ratio by weight. Unless specified otherwise, the cells were cycled with a constant current density of 19 mA g−1 (about 1/40 C for the first charge).
The in situ electrode electrochemical impedance spectra were collected with Li metal wire as the reference electrode, Li metal as the counter electrode and the LFO as the cathode, using a Solartron Analytical 1400 System. The a.c. amplitude was set at ± 5 mV, and the applied frequency range was between 100 kHz and 0.05 Hz. In situ pressure measurements were carried out in a home-modified system by connecting a pressure transducer (Omega) to the open end of a Swagelok-type cell. DEMS measurements were performed following the method described in detail elsewhere30. The system was built based on a mass spectrometer (HPR-40, Hiden Analytical). The mass spectrometer was calibrated by standard mixture gas of CO2, O2, and H2 (2%, 5%, and 10%) in Ar. Before the testing, ultrahigh purity Ar was purged through the whole system and then the cell was isolated for gas accumulation. During the cell testing, the gas generated in the cell was accumulated for every 60 min and then pushed to the sample cross space by pure Ar. Then, the gas was further injected to the mass spectrometer to measure the partial pressures of Ar, O2 and CO2. The pressure of the sample cross space was recorded by a pressure transducer (PX419-USBH), and the volume of the sample cross space was calibrated by known volume tubings.
Material characterization. High-energy synchrotron XRD measurements were carried out at the 11-ID-C beamline of the Advanced Photon Source (APS), Argonne National Laboratory. The wavelength of the X-ray is 0.11165 nm. The XRD patterns were collected in the transmission mode using a Perkin Elmer large-area detector. The collected 2D patterns were then integrated into conventional 1D patterns (intensity versus 2θ) for final data analysis using the Fit2d software. The XRD Rietveld refinement was carried out with the Fullprof Suite 2012. Raman spectra were obtained using a Renishaw inVia Raman Microprobe. The spectra were excited with 633 nm radiation. Other details of the sample handling, spectra measurement, and data processing procedures are as described in ref. 25.
TEM images and SAED patterns were taken by a field-emission transmission electron microscope (FEI Titan 80-300ST) with a spherical and chromatic aberration imaging corrector working at 80 kV. Spherical and chromatic aberration correction enables the microscope to attain resolution better than 0.1 nm (measured by Young’s fringes) at 80 kV.
X-ray absorption spectroscopy (XAS) measurements at the Fe K-edge were completed at the APS on the bending-magnet beamline 9-BM-B with an electron energy of 7 GeV and an average current of 100 mA. The incident beam was monochromatized by a Si(111) double-crystal monochromator. Harmonic rejection was accomplished with a 25% detune. The monochromator energy was calibrated with a Fe foil by setting the first derivative maxima to 7,110.75 eV. In situ XAS experiments were performed on the coin cells with a window of 3-mm diameter sealed with 50-μ m-thick Kapton tape in transmission mode. The cells were cycled with a MACCOR cycler. Data reduction and analysis were performed by using the ATHENA software31.
Ex situ Mossbauer spectroscopy was conducted on cycled electrodes. Cathode laminates at selected states of charge were removed from the coin cells and covered with Kapton tape to reduce effects from the outside environment. The measurements were performed in transmission geometry with a 20 mCi 57mCo in Rh source and a Peltier-cooled silicon detector. The isomer shift (measured relative to an α -Fe foil) and the quadrupole splitting values were obtained by a least-squares fitting of the data using Lorentzian functions.
DFT calculations. First-principles calculations were performed using the Vienna Ab-initio Simulation Package32–35 and the projector augmented wave potentials36. The generalized gradient approximation of Perdew–Becke–Ernzerhof37 was used for the exchange-correlation functional. A plane-wave basis set with a cutoff energy of 520 eV and Γ -centered k-meshes with an approximate density of 8,000 k-points per reciprocal atom was used in all calculations. The DFT + U method was used to treat Fe 3d (UFe = 4.0 eV) states following previous work22,38–41.
Data availability. The data that support the plots within this paper and other findings of this study are available from the corresponding author upon reasonable request
Received: 16 May 2017; Accepted: 23 October 2017; Published online: 8 December 2017
References 1. Whittingham, M. S. Lithium batteries and cathode materials. Chem. Rev. 104,
4271–4301 (2004). 2. Sathiya, M. et al. Reversible anionic redox chemistry in high-capacity
layered-oxide electrodes. Nat. Mater. 12, 827–835 (2013). 3. McCalla, E. et al. Visualization of O–O peroxo-like dimers in high-capacity
layered oxides for Li-ion batteries. Science 350, 1516–1521 (2015). 4. McCalla, E. et al. Understanding the roles of anionic redox and oxygen
release during electrochemical cycling of lithium-rich layered Li4FeSbO6. J. Am. Chem. Soc. 137, 4804–4814 (2015).
5. Luo, K. et al. Charge-compensation in 3d-transition-metal-oxide intercalation cathodes through the generation of localized electron holes on oxygen. Nat. Chem. 8, 684–691 (2016).
6. Seo, D.-H. et al. The structural and chemical origin of the oxygen redox activity in layered and cation-disordered Li-excess cathode materials. Nat. Chem. 8, 692–697 (2016).
7. Sathiya, M. et al. Electron paramagnetic resonance imaging for real-time monitoring of Li-ion batteries. Nat. Commun. 6, 6276 (2015).
8. Grimaud, A., Hong, W., Shao-Horn, Y. & Tarascon, J.-M. Anionic redox processes for electrochemical devices. Nat. Mater. 15, 121–126 (2016).
9. Freire, M. et al. A new active Li–Mn–O compound for high energy density Li-ion batteries. Nat. Mater. 15, 173–177 (2016).
10. Pearce, P. E. et al. Evidence for anionic redox activity in a tridimensional-ordered Li-rich positive electrode β -Li2IrO3. Nat. Mater. 16, 580–586 (2017).
11. Zhu, Z. et al. Anion-redox nanolithia cathodes for Li-ion batteries. Nat. Energy 1, 16111 (2016).
12. Okuoka, S.-i et al. A new sealed lithium-peroxide battery with a Co-doped Li2O cathode in a superconcentrated lithium bis(fluorosulfonyl)amide electrolyte. Sci. Rep. 4, 5684 (2014).
13. Ogasawara, Y. et al. Charge/discharge mechanism of a new Co-doped Li2O cathode material for a rechargeable sealed lithium-peroxide battery analyzed by X-ray absorption spectroscopy. J. Power Sources 287, 220–225 (2015).
14. Harada, K. et al. Electrochemical reactions and cathode properties of Fe-doped Li2O for the hermetically sealed lithium peroxide battery. J. Power Sources 322, 49–56 (2016).
15. Narukawa, S. et al. Anti-fluorite type Li6CoO4, Li5FeO4, and Li6MnO4 as the cathode for lithium secondary batteries. Solid State Ionics 122, 59–64 (1999).
16. Imanishi, N. et al. Antifluorite compounds, Li5+xFe1−xCoxO4, as a lithium intercalation host. J. Power Sources 146, 21–26 (2005).
NATuRE ENERgY | VOL 2 | DECEMBER 2017 | 963–971 | www.nature.com/natureenergy970

© 2017 Macmillan Publishers Limited, part of Springer Nature. All rights reserved. © 2017 Macmillan Publishers Limited, part of Springer Nature. All rights reserved.
ArticlesNature eNergy
17. Noh, M. & Cho, J. Role of Li6CoO4 cathode additive in Li-ion cells containing low coulombic efficiency anode material. J. Electrochem. Soc. 159, A1329–A1334 (2012).
18. Lim, Y.-G. et al. Anti-fluorite Li6CoO4 as an alternative lithium source for lithium ion capacitors: an experimental and first principles study. J. Mater. Chem. A 3, 12377–12385 (2015).
19. Kirklin, S., Chan, M. K. Y., Trahey, L., Thackeray, M. M. & Wolverton, C. High-throughput screening of high-capacity electrodes for hybrid Li-ion-Li-O2 cells. Phys. Chem. Chem. Phys. 16, 22073–22082 (2014).
20. Johnson, C. et al. Li2O removal from Li5FeO4: A cathode precursor for lithium-ion batteries. Chem. Mater. 22, 1263–1270 (2010).
21. Trahey, L. et al. Activated lithium-metal-oxides as catalytic electrodes for Li–O2 cells. Electrochem. Solid-State Lett. 14, A64–A66 (2011).
22. Thackeray, M. M., Chan, M. K. Y., Trahey, L., Kirklin, S. & Wolverton, C. Vision for designing high-energy, hybrid Li ion/Li–O2 cells. J. Phys. Chem. Lett. 4, 3607–3611 (2013).
23. Hirano, A. et al. Electrochemical properties and Mossbauer effect of anti-fluorite type compound, Li5FeO4. Solid State Ionics 176, 2777–2782 (2005).
24. Okumura, T., Shikano, M. & Kobayashi, H. Effect of bulk and surface structural changes in Li5FeO4 positive electrodes during first charging on subsequent lithium-ion battery performance. J. Mater. Chem. A 2, 11847–11856 (2014).
25. Maroni, V. A., Johnson, C. S., Rood, S. C. M., Kropf, A. J. & Bass, D. A. Characterization of novel lithium battery cathode materials by spectroscopic methods: The Li5+xFeO4 system. Appl. Spectrosc. 67, 903–912 (2013).
26. Gilmore, K. et al. Efficient implementation of core-excitation Bethe–Salpeter equation calculations. Comput. Phys. Commun. 197, 109–117 (2015).
27. Vinson, J., Rehr, J. J., Kas, J. J. & Shirley, E. L. Bethe-Salpeter equation calculations of core excitation spectra. Phys. Rev. B 83, 115106 (2011).
28. Mizokawa, T. et al. Role of oxygen holes in LixCoO2 revealed by soft X-ray spectroscopy. Phys. Rev. Lett. 111, 056404 (2013).
29. Su, X. et al. A new strategy to mitigate the initial capacity loss of lithium ion batteries. J. Power Sources 324, 150–157 (2016).
30. McCloskey, B. D., Bethune, D., Shelby, R., Girishkumar, G. & Luntz, A. Solvents’ critical role in nonaqueous lithium–oxygen battery electrochemistry. J. Phys. Chem. Lett. 2, 1161–1166 (2011).
31. Ravel, B. & Newville, M. ATHENA, ARTEMIS, HEPHAESTUS: data analysis for X-ray absorption spectroscopy using IFEFFIT. J. Synchrotron Rad. 12, 537–541 (2005).
32. Kresse, G. & Hafner, J. Ab initio molecular dynamics for liquid metals. Phys. Rev. B 47, 558–561 (1993).
33. Kresse, G. & Hafner, J. Ab initio molecular-dynamics simulation of the liquid-metal–amorphous-semiconductor transition in germanium. Phys. Rev. B 49, 14251–14269 (1994).
34. Kresse, G. & Furthmüller, J. Efficiency of ab-initio total energy calculations for metals and semiconductors using a plane-wave basis set. Comput. Mater. Sci. 6, 15–50 (1996).
35. Kresse, G. & Furthmüller, J. Efficient iterative schemes for ab initio total-energy calculations using a plane-wave basis set. Phys. Rev. B 54, 11169–11186 (1996).
36. Blochl, P. E. Projector augmented-wave method. Phys. Rev. B 50, 17953–17979 (1994).
37. Perdew, J. P., Ernzerhof, M. & Burke, K. Rationale for mixing exact exchange with density functional approximations. J. Chem. Phys. 105, 9982–9985 (1996).
38. Wang, L., Maxisch, T. & Ceder, G. Oxidation energies of transition metal oxides within the GGA + U framework. Phys. Rev. B 73, 195107 (2006).
39. Zhou, F., Marianetti, C. A., Cococcioni, M., Morgan, D. & Ceder, G. Phase separation in LixFePO4 induced by correlation effects. Phys. Rev. B 69, 201101 (2004).
40. Kirklin, S. et al. The Open Quantum Materials Database (OQMD): assessing the accuracy of DFT formation energies. npj Comput. Mater 1, 15010–15024 (2015).
41. Saal, J. E., Kirklin, S., Aykol, M., Meredig, B. & Wolverton, C. Materials design and discovery with high-throughput density functional theory: The Open Quantum Materials Database (OQMD). JOM 65, 1501–1509 (2013).
AcknowledgementsThis work was supported by the Centre for Electrochemical Energy Science, an Energy Frontier Research Centre funded by the US Department of Energy, Office of Science, Office of Basic Energy Sciences under award number DE-AC02–06CH11. Use of the Advanced Photon Source and the Centre for Nanoscale Materials, both Office of Science user facilities operated for DOE, Office of Science by Argonne National Laboratory, was supported by the US DOE under Contract No. DE-AC02-06CH11357. The authors acknowledge C.-K. Lin and X. Wang for preparing the Li5FeO4 powders and electrodes. L.L. and M.K.Y.C. thank E. Shirley and J. Vinson for the use of and guidance with the OCEAN code. The computing resources are supported by the National Energy Research Scientific Computing Center, a DOE Office of Science User Facility supported by the Office of Science of the US Department of Energy under Contract DE-AC02-05CH11231, and Blues, a high-performance computing cluster operated by the Laboratory Computing Resource Center at Argonne National Laboratory.
Author contributionsC.Z. and J.L. conceived the idea and design of the experiments. Z.Y. and C.W. performed the DFT simulations. L.M. and T.W. carried out the measurements and analysis of XAS. V.A.M. performed the fitting of Raman spectra. J.W performed the TEM imaging. L.L. and M.K.Y.C. performed the oxygen core-level spectrum simulations. E.L. and E.E.A performed the measurements and analysis of ex situ Mossbauer spectroscopy. Y.R. contributed to measurements of in situ and ex situ XRD. C.J. and M.M.T. contributed to discussions and interpretation of the data. The project was supervised by J.L. and K.A.
Competing interestsThe authors declare no competing financial interests.
Additional informationSupplementary information is available for this paper at https://doi.org/10.1038/s41560-017-0043-6.
Reprints and permissions information is available at www.nature.com/reprints.
Correspondence and requests for materials should be addressed to J.L. or C.W. or K.A.
Publisher’s note: Springer Nature remains neutral with regard to jurisdictional claims in published maps and institutional affiliations.
NATuRE ENERgY | VOL 2 | DECEMBER 2017 | 963–971 | www.nature.com/natureenergy 971