E Enrollment nrollment M Management anagement PPlan
51
2012 2012 2012- 2013 2013 2013 E E nrollment nrollment M M anagement anagement P P lan lan ARKANSAS STATE UNIVERSITY ARKANSAS STATE UNIVERSITY
Transcript of E Enrollment nrollment M Management anagement PPlan
201220122012---201320132013
EEnrollment nrollment MManagement anagement PPlanlanARKANSAS STATE UNIVERSITYARKANSAS STATE UNIVERSITY

Arkansas State University 2012-2013 Enrollment Management Plan
EXECUTIVE SUMMARYAugust 30, 2013
Arkansas State University’s Enrollment Management Plan is built upon outcomes from the enrollment
management planning process that involved numerous individuals in a number of planning and
development sessions since September 2004. The first enrollment management plan developed from
these ongoing planning sessions was in 2005-2006. It was revised in 2008-2009 to reflect completion
and/or progress toward achievement of established goals. This document, the 2012-2013 Enrollment
Management Plan revision, continues the assessment. It contains progress updates from various
planning subcommittees and reflects ideas and insights from students, faculty, staff, administrators,
constituents and stakeholders.
This plan is a part of ASU’s overall mission, vision and strategic directions, to promote intellectual
development and student success through a diverse, student-centered environment. Many of the
initiatives and activities listed in the plan are already in various stages of implementation. Although a
work in progress, this plan will serve as a blueprint to inform and to guide the university’s recruitment
and retention strategies for students, allocation of institutional resources, marketing, development
initiatives and strategic planning. The following strategic enrollment management goals and objectives
represent the highest priorities in support of recruitment, enrollment, student retention, student
financial support, student services and marketing at Arkansas State University.
Student Recruitment and Enrollment Goal:
To establish and prioritize recruiting initiatives that will lead to an increase in enrollment,
retention, and graduation of high quality students. Student recruitment and enrollment strategic
objectives include: (1) increase enrollment, retention, and graduation; (2) create a culture that
embraces a campus-wide recruitment effort; (3) enhance mechanisms for creating ongoing feeder
programs to the university; (4) enhance and expand relationships with prospective students and
parents; (5) provide focus to the international recruiting effort.
Student Financial Support Goal:
To provide enhanced opportunities for students to receive both merit-based and need-based aid to
promote increased enrollment, retention, and graduation at ASU. Student financial support
strategic objectives include: (1) award academic scholarships to improve the academic integrity of
the scholarship program and the university as a whole by recruiting top scholars; (2) award
scholarships to increase and enhance enrollment, retention rates and graduation rates with an
emphasis on the Jonesboro campus; (3) focus new efforts by the Office of Financial Aid and
Scholarships to increase access to college for first-generation and low-income students.

Arkansas State University 2012-2013 Enrollment Management Plan
Student Retention and Success Goal:
To promote student engagement, success, and responsibility. Student retention and success
strategic objectives include: (1) create policies that foster student success; (2) develop an academic
advising structure that promotes student success; (3) develop a learning culture that supports
student success.
Student Services Goal:
To graduate successful, satisfied students with a strong allegiance to Arkansas State University.
Student services strategic objectives include: (1) establish a “student first” culture, “The ASU
Experience”; (2) provide a “Student Solution Center” for improvement in student services; (3)
increase awareness of available student services; (4) improve satisfaction level of current student
services offerings; (5) provide services that are consistent with the needs of the markets served by
ASU; (6) leverage technology, people and processes to maximize “The ASU Experience.”
Marketing Goal:
To promote ASU through a combination of planning, communication, and effective strategies that
lead to a competitive positioning edge and yield a higher market share of eligible and academically
well-prepared students. Marketing strategic objectives include: (1) establish a clear identity for
ASU; (2) differentiate ASU from its competitors; (3) increase web-based communications in recruiting
students; (4) raise awareness of the ASU Graduate School.

Arkansas State University 2012-2013 Enrollment Management Plan
TABLE OF CONTENTS
INTRODUCTION ................................................................................................................................1
INSTITUTIONAL AND SITUATIONAL ANALYSIS .................................................................................4
PROGRESS UPDATE SUMMARY: INSTITUTIONAL AND SITUATION ASSESSMENT .........................22
STUDENT RECRUITMENT AND ENROLLMENT STRATEGY ..............................................................24
STUDENT FINANCIAL SUPPORT STRATEGY ....................................................................................35
STUDENT SUCCESS AND RETENTION STRATEGY ...........................................................................37
STUDENT SERVICES STRATEGY ......................................................................................................40
MARKETING STRATEGY ..................................................................................................................42
RESOURCES AND INFRASTRUCTURE FUNDING .............................................................................44
CONCLUSION .................................................................................................................................45
ACKNOWLEDGEMENTS ..................................................................................................................46
The educational mission of the university is to support the recruitment and enrollment of students and to foster the attainment of their educational and professional goals. This will be accomplished by developing and implementing the objectives set forth in ASU’s Enrollment Management Plan. Many of the initiatives and activities listed in this report are already in various stages of implementation. Every action plan and program listed in this document will be evaluated routinely and revised if necessary. If new enrollment management objectives are identified, action plans will be developed and included in future reports. This is a working document that will serve to inform and to guide the university’s recruitment and retention strategies for students.

Arkansas State University 2012-2013 Enrollment Management Plan
TABLES
1. Enrollment Trends for All Arkansas State University Instructional Sites ........................................................... 5
2. Enrollment Trends for International Students at ASU ....................................................................................... 5
3. Population of Arkansas and Selected Arkansas, Missouri and Tennessee Counties ........................................ 6
4. Age of Population in Arkansas and Selected Northeast Arkansas Counties ...................................................... 7
5. Ethnicity of Population in Arkansas and Selected Northeast Arkansas Counties .............................................. 7
6. Educational Attainment of Adults in Arkansas and Selected Northeast Arkansas Counties ............................. 8
7. Income vs. Poverty of Population in Arkansas and Selected Northeast Arkansas Counties .............................. 8
8. Job Distribution of Population in Arkansas and Selected Northeast Arkansas Counties ................................... 9
9. Median Earnings and Unemployment Rate by Level of Education .................................................................. 10
10. Enrollment by College (Based on Declared Majors) ........................................................................................ 11
11. Degrees & Certificates Awarded ...................................................................................................................... 11
12. Yield and Conversion Rates of Undergraduate and Graduate Students Who Applied to Attend ASU ............ 12
13. Average ACT Composite Score and High School GPA for First-Time-Entering College Freshmen Enrolled at
Arkansas State University ................................................................................................................................ 13
14. Arkansas First-Time-Entering College Freshmen Requiring Remediation in Reading ...................................... 14
15. Arkansas First-Time-Entering College Freshmen Requiring Remediation in English ....................................... 14
16. Arkansas First-Time-Entering College Freshmen Requiring Remediation in Math ......................................... 15
17. Arkansas First-Time-Entering College Freshmen Retention and Graduation Rates ....................................... 16
18. ASU’s Full-Time, First-Time Freshmen Retention Rates................................................................................... 16
19. ASU’s Full-Time, First-Time-Entering Freshmen 6-Year Graduation Rates ...................................................... 16
20. Students Receiving Financial Aid While Attending Arkansas State University ................................................ 17
21. State Appropriations as a Percent of E&G Revenues....................................................................................... 17
22. Average 2010-2011 Resident Undergraduate Expenses at Public 4-Year Colleges and Universities by College
Board Region .................................................................................................................................................... 18
23. Annual Tuition and Fees at ASU ....................................................................................................................... 18
24. Fall Enrollment at Arkansas Higher Education Institutions .............................................................................. 19
25. Annual Semester Credit Hours Generated in Courses Provided by Arkansas State University ....................... 20
26. Full-Time-Equivalent (FTE) Enrollment at All ASU Instructional Sites .............................................................. 21
Arkansas State University 2012-2013 Enrollment Management Plan
1 | P a g e
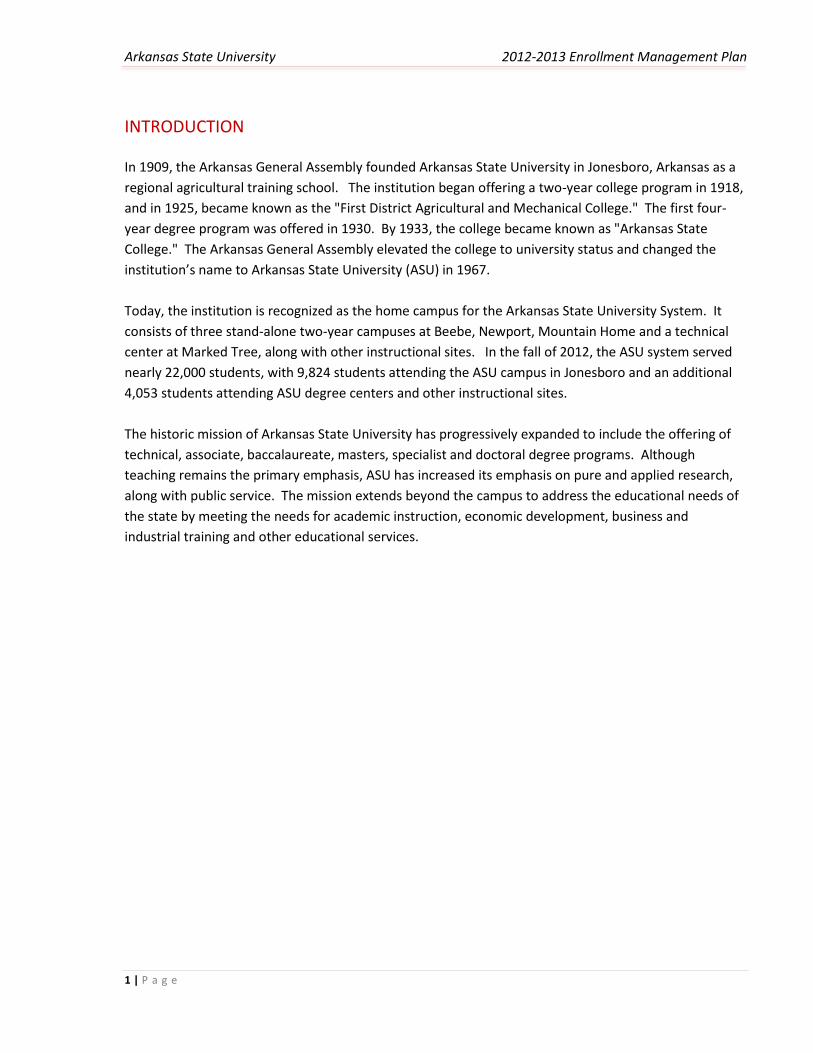
INTRODUCTION
In 1909, the Arkansas General Assembly founded Arkansas State University in Jonesboro, Arkansas as a
regional agricultural training school. The institution began offering a two-year college program in 1918,
and in 1925, became known as the "First District Agricultural and Mechanical College." The first four-
year degree program was offered in 1930. By 1933, the college became known as "Arkansas State
College." The Arkansas General Assembly elevated the college to university status and changed the
institution’s name to Arkansas State University (ASU) in 1967.
Today, the institution is recognized as the home campus for the Arkansas State University System. It
consists of three stand-alone two-year campuses at Beebe, Newport, Mountain Home and a technical
center at Marked Tree, along with other instructional sites. In the fall of 2012, the ASU system served
nearly 22,000 students, with 9,824 students attending the ASU campus in Jonesboro and an additional
4,053 students attending ASU degree centers and other instructional sites.
The historic mission of Arkansas State University has progressively expanded to include the offering of
technical, associate, baccalaureate, masters, specialist and doctoral degree programs. Although
teaching remains the primary emphasis, ASU has increased its emphasis on pure and applied research,
along with public service. The mission extends beyond the campus to address the educational needs of
the state by meeting the needs for academic instruction, economic development, business and
industrial training and other educational services.
Arkansas State University 2012-2013 Enrollment Management Plan
2 | P a g e
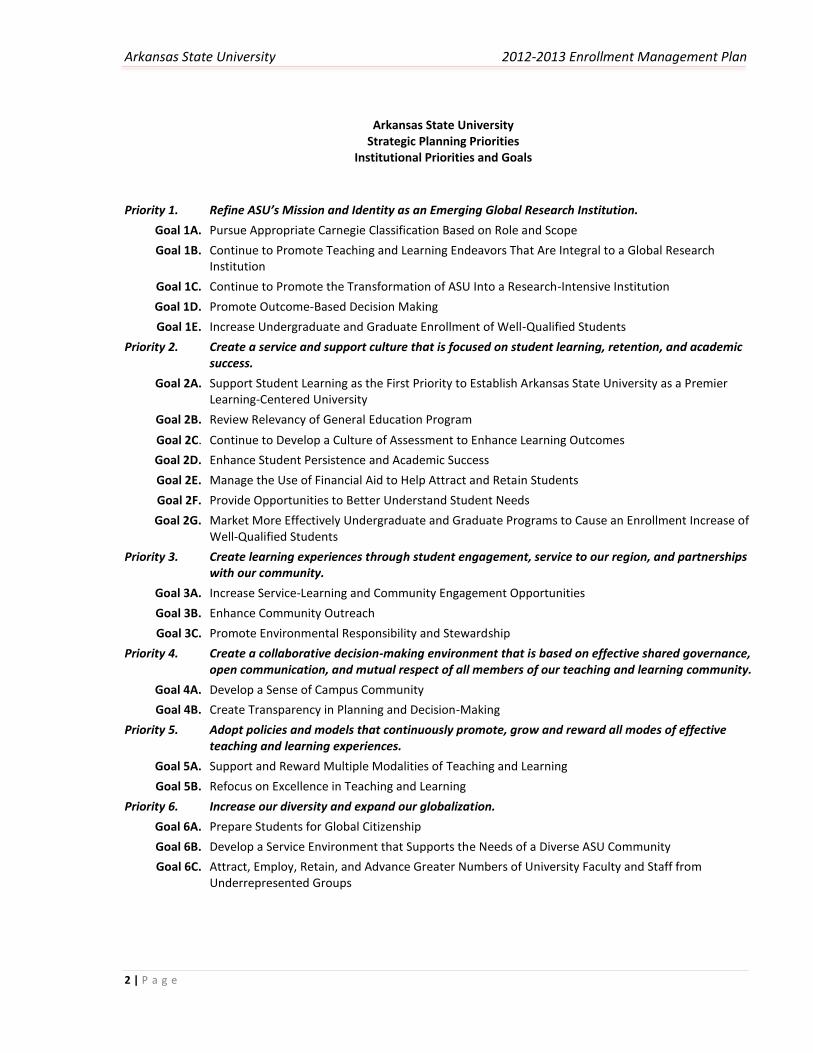
Arkansas State University Strategic Planning Priorities
Institutional Priorities and Goals
Priority 1. Refine ASU’s Mission and Identity as an Emerging Global Research Institution.
Goal 1A. Pursue Appropriate Carnegie Classification Based on Role and Scope
Goal 1B. Continue to Promote Teaching and Learning Endeavors That Are Integral to a Global Research Institution
Goal 1C. Continue to Promote the Transformation of ASU Into a Research-Intensive Institution
Goal 1D. Promote Outcome-Based Decision Making
Goal 1E. Increase Undergraduate and Graduate Enrollment of Well-Qualified Students
Priority 2. Create a service and support culture that is focused on student learning, retention, and academic success.
Goal 2A. Support Student Learning as the First Priority to Establish Arkansas State University as a Premier Learning-Centered University
Goal 2B. Review Relevancy of General Education Program
Goal 2C. Continue to Develop a Culture of Assessment to Enhance Learning Outcomes
Goal 2D. Enhance Student Persistence and Academic Success
Goal 2E. Manage the Use of Financial Aid to Help Attract and Retain Students
Goal 2F. Provide Opportunities to Better Understand Student Needs
Goal 2G. Market More Effectively Undergraduate and Graduate Programs to Cause an Enrollment Increase of Well-Qualified Students
Priority 3. Create learning experiences through student engagement, service to our region, and partnerships with our community.
Goal 3A. Increase Service-Learning and Community Engagement Opportunities
Goal 3B. Enhance Community Outreach
Goal 3C. Promote Environmental Responsibility and Stewardship
Priority 4. Create a collaborative decision-making environment that is based on effective shared governance, open communication, and mutual respect of all members of our teaching and learning community.
Goal 4A. Develop a Sense of Campus Community
Goal 4B. Create Transparency in Planning and Decision-Making
Priority 5. Adopt policies and models that continuously promote, grow and reward all modes of effective teaching and learning experiences.
Goal 5A. Support and Reward Multiple Modalities of Teaching and Learning
Goal 5B. Refocus on Excellence in Teaching and Learning
Priority 6. Increase our diversity and expand our globalization.
Goal 6A. Prepare Students for Global Citizenship
Goal 6B. Develop a Service Environment that Supports the Needs of a Diverse ASU Community
Goal 6C. Attract, Employ, Retain, and Advance Greater Numbers of University Faculty and Staff from Underrepresented Groups

Arkansas State University 2012-2013 Enrollment Management Plan
3 | P a g e
Priority 7. Continually improve our institutional efficacy and alignment of resources with our priorities.
Goal 7A. Enhance Recruitment and Retention Initiatives of Faculty and Staff
Goal 7B. Maintain Current and Strategically Plan for Future Infrastructure Needs
Goal 7C. Expand Resources and Refine Budget Procedures
Arkansas State University 2012-2013 Enrollment Management Plan
4 | P a g e
INSTITUTIONAL AND SITUATIONAL ANALYSIS Dr. Kathryn Jones, Director of Institutional Research and Planning
A. ASU ENROLLMENT TRENDS
Since 1990-1991, the competition for providing higher education services to Arkansans has increased
significantly. In 1990-1991, Arkansas had 33 public and private four- and two-year higher education
institutions within the state; which included ten public two-year community colleges. Arkansas Act
1244 of 1991, was established to create the Arkansas technical and community college system
throughout the state offering instruction in technical, vocational, adult education programs, industry
training and two-year college transfer programs. The Act allowed for an additional 11 vocational-
technical institutions to become technical colleges within this system--doubling the number of two-year
higher education institutions within Arkansas to more than 20. Presently, Arkansas has 11 public four-
year colleges and universities, 22 two-year public institutions and another 18 private four- and two-year
higher education institutions. All 51 Arkansas higher education institutions, along with out-of-state
colleges and universities, are recruiting less than 30,000 Arkansas high school graduates each year.
A-State’s student body is essentially regional – primarily from Northeast Arkansas and the Mississippi
River Delta region. The enrollment has increased during the past ten-years and has varied by program
and instructional location. Fall 2012 enrollment at Arkansas State University was 13,877, an increase
of 2,387 students from fall 2008 to fall 2012. Undergraduate enrollment has averaged 10,024 students
from 2008 to 2012. Graduate enrollment has increased by 115% during this same 5-year period, with
recent growth spurred by new doctoral programs, the Academic Partnerships, the Arkansas Bioscience
Institute (ABI) and new external funding. (Refer to Table 1.)

Arkansas State University 2012-2013 Enrollment Management Plan
5 | P a g e
2 0 0 8 to 2 0 12 5 - Ye a r
E nrollment Numbe r 5 - Ye a r Sta nda rd
Category 2 0 0 8 2 0 0 9 2 0 10 2 0 11 2 0 12 Cha nge Ave ra ge De via tion
T otal E nrollment 11,490 12,156 13,415 13,900 13,877 2,387 12,968 1,088
Jonesboro 9,626 9,873 9,873 9,829 9,824 198 9,805 103
Other Instructional Sites 1,864 2,283 3,542 4,071 4,053 2,189 3,163 1,027
Undergraduate S tudents 9,764 10,024 10,051 10,113 10,168 404 10,024 156
Graduate S tudents 1,726 2,132 3,364 3,787 3,709 1,983 2,944 951
M ale S tudents 4,580 4,820 5,236 5,378 5,465 885 5,096 380
Female S tudents 6,910 7,336 8,179 8,522 8,412 1,502 7,872 711
M inority S tudents (Based on Ethnicity) * 2,206 2,352 2,689 2,694 2,714 508 2,531 236
African American 1,956 1,918 2,130 2,133 2,108 152 2,049 104
American Indian 38 38 53 60 66 28 51 13
Asian American 90 64 70 88 89 -1 80 12
Hispanic American 122 107 182 246 266 144 185 71
Native Hawaiian/Pacif ic Islander -- 5 7 12 7 -5 -- --
Two or More Races -- 220 247 155 178 23 -- --
Undergraduates 25 or Older 2,455 2,614 2,639 2,572 2,452 -3 2,546 88
Arkansas Residents 9,998 10,474 10,761 10,698 10,708 710 10,528 316
Out-of -S tate Residents 1,170 1,263 2,079 2,414 2,311 1,141 1,847 589
* Note: Individuals that are international and individuals of unknown ethnic origin are not included in minority student f igures.
Analysis Prepared by the Arkansas State University Office of Institutional Research & Planning
Table 1. Enrollment Trends for All Arkansas State University Instructional Sites
Fa ll Se me ste rs
2008-12 5-Year
Enrollment Number 5-Year Standard
Category 2008 2009 2010 2011 2012 Change Average Deviation
International Students 322 419 575 788 858 536 592 230
Undergraduate International 153 217 339 525 611 458 369 196
Graduate International 169 202 236 263 247 78 223 38
# of Countries Represented 52 59 62 58 59 7 58 4
Analysis Prepared by the Arkansas State University Office of Institutional Research & Planning
Fall Semesters
Table 2. Enrollment Trends for International Students at ASU
B. ARKANSAS POPULATION CHARACTERISTICS
Population Changes. More than half of the population growth in the America over the next 20 years will
be in the 16 Southern Regional Education Board (SREB) states. The population in Arkansas increased by
25.5 percent from 1990 to 2012.
Arkansas State University is located in Craighead County, which is part of the Jonesboro
Metropolitan area as defined by the U.S. Census Bureau. Craighead is one of 75 counties in
Arkansas and its 2012 estimated population of 99,735 ranked seventh in the state.

Arkansas State University 2012-2013 Enrollment Management Plan
6 | P a g e
Approximately 14.7 percent of Arkansas’ population is located in Arkansas counties within a 75-
mile area of the ASU campus and Craighead County.
Forty-nine percent of ASU’s fall 2012 enrollment (13,877 headcount) originated from Arkansas,
Missouri and Tennessee counties within a 75-mile area of the Jonesboro campus.
Table 3. Population of Arkansas and Selected Arkansas, Missouri, and Tennessee Counties
2012 Rank Percent 1990 to 2012 Rank Persons ASU 2012
Population 2012 Among 75 Of Percent Among 75 Per Fall
Estimates Population Counties Population Change Counties Sq. Mile Enrollment
State of Arkansas 2,937,979 --- --- 25.5% --- 57 10,708
Pulaski, Central Arkansas 388,953 1 13.2% 11.2% 38 512 574
Benton, Northwest Arkansas 232,268 2 7.9% 138.2% 1 274 81
Washington, Northwest Arkansas 211,411 3 7.2% 86.4% 3 224 94
Sebastian, West Arkansas 127,304 4 4.3% 27.8% 23 239 69
Faulkner, Central Arkansas 118,704 5 4.0% 97.8% 2 183 145
Saline, Central Arkansas 111,845 6 3.8% 74.3% 5 155 209
Garland, Central Arkansas 96,903 8 3.3% 32.0% 16 143 148
Counties within 75 miles of ASU 430,634 --- 14.7% 8.5% --- 50 6,866
Clay 15,684 50 0.5% -13.4% 65 25 194
Craighead (ASU Location) 99,735 7 3.4% 44.6% 8 141 2,821
Crittenden 50,021 14 1.7% 0.2% 49 82 400
Cross 17,683 43 0.6% -8.0% 57 29 262
Greene 43,163 17 1.5% 35.7% 13 75 1,117
Independence 37,025 21 1.3% 18.7% 31 48 227
Jackson 17,600 44 0.6% -7.1% 55 28 174
Lawrence 17,012 48 0.6% -2.5% 52 29 199
Mississippi 45,562 15 1.6% -20.8% 68 51 484
Poinsett 24,307 29 0.8% -1.4% 50 32 439
Randolph 17,930 42 0.6% 8.3% 39 27 191
Sharp 17,054 46 0.6% 20.9% 29 28 178
St. Francis 27,858 23 0.9% -2.2% 51 44 180
Other 55 Arkansas Counties 1,219,957 --- 41.5% 12.3% --- 32 2,522
Butler, Missouri * 43,053 --- --- 11.1% --- 62 72
Dunklin, Missouri * 31,826 --- --- -3.9% --- 59 160
Pemiscot, Missouri * 18,111 --- --- -17.4% --- 37 59
Ripley, Missouri * 14,036 --- --- 14.1% --- 22 28
Shelby, Tennessee * 940,764 --- --- 13.8% --- 1,233 279*Note: Missouri and Tennessee counties within 75 miles of ASU and Craighead county.
Source: U.S. Census Bureau and Southern Regional Education Board (SREB)
Analysis Prepared by the Arkansas State University Office of Institutional Research & Planning

Arkansas State University 2012-2013 Enrollment Management Plan
7 | P a g e
AGE. There was growth in every age group during the 2000s in the SREB states. Sixty-six percent of the
population in Arkansas are 25 years of age or older. (Refer to Table 4.)
Table 4. Age of Population in Arkansas and Selected Northeast Arkansas Counties
Arkansas 2011
Population Rank * % of Age % of Age % of Age
By Age Group Number In U.S. Number Group Number Group Number Group Number % of Area
Pre-school Age (0 to 4) 196,345 34 7,086 3.6% 2,846 1.4% 3,437 1.8% 36,910 6.8%
School Age (5 to 17) 514,129 34 17,356 3.4% 7,896 1.5% 9,375 1.8% 98,171 18.0%
College Age (18 to 24) 285,630 34 12,452 4.4% 3,743 1.3% 4,280 1.5% 50,441 9.3%
Young Adult (25 to 44) 745,665 34 26,574 3.6% 11,042 1.5% 11,410 1.5% 134,975 24.8%
Older Adult (45 to 64) 767,111 32 22,834 3.0% 11,085 1.4% 11,814 1.5% 142,555 26.2%
Older (65 plus) 429,099 31 12,013 2.8% 6,108 1.4% 5,650 1.3% 81,574 15.0%
Median Age 37.6 26 33.4 --- 37.7 --- 35.0 --- 39.6 ---* Note: Rank in U.S. is among the 50 states.
** Arkansas counties within 75 miles of ASU and Craighead county.
Source: U.S. Census Bureau and Southern Regional Education Board (SREB)
Analysis Prepared by the Arkansas State University Office of Institutional Research & Planning
Arkansas Craighead County
Area of ASUJ **
Greene County Mississippi County Within 75-Mile
ETHNICITY. As shown in Table 5, twenty-five percent of the population in Arkansas is non-white as
compared to twenty-three percent within the 75-mile area of ASU.
Table 5. Ethnicity of Population in Arkansas and Selected Northeast Arkansas Counties
Arkansas 2011
Population By Rank * % of Ethnic % of Ethnic % of Ethnic
Known Ethnic Group Number In U.S. Number Group Number Group Number Group Number % of Area
American Indian 27,581 33 535 1.9% 239 0.9% 193 0.7% 2,279 0.5%
Asian 39,525 36 1,134 2.9% 139 0.4% 275 0.7% 2,728 0.6%
Black 457,736 22 13,243 2.9% 369 0.1% 15,668 3.4% 79,851 18.8%
Hispanic 195,075 32 4,567 2.3% 1,005 0.5% 1,711 0.9% 14,067 3.3%
White 2,354,196 33 81,817 3.5% 41,422 1.8% 29,216 1.2% 340,188 80.1%
% Non-White 24.9% --- 16.8% --- 3.0% --- 36.4% --- 22.5% ---* Note: Rank in U.S. is among the 50 states.
** Arkansas counties within 75 miles of ASU and Craighead county.
Source: U.S. Census Bureau
Analysis Prepared by the Arkansas State University Office of Institutional Research & Planning
Arkansas Craighead County
Area of ASUJ**
Greene County Mississippi County Within 75-Mile
Arkansas State University 2012-2013 Enrollment Management Plan
8 | P a g e
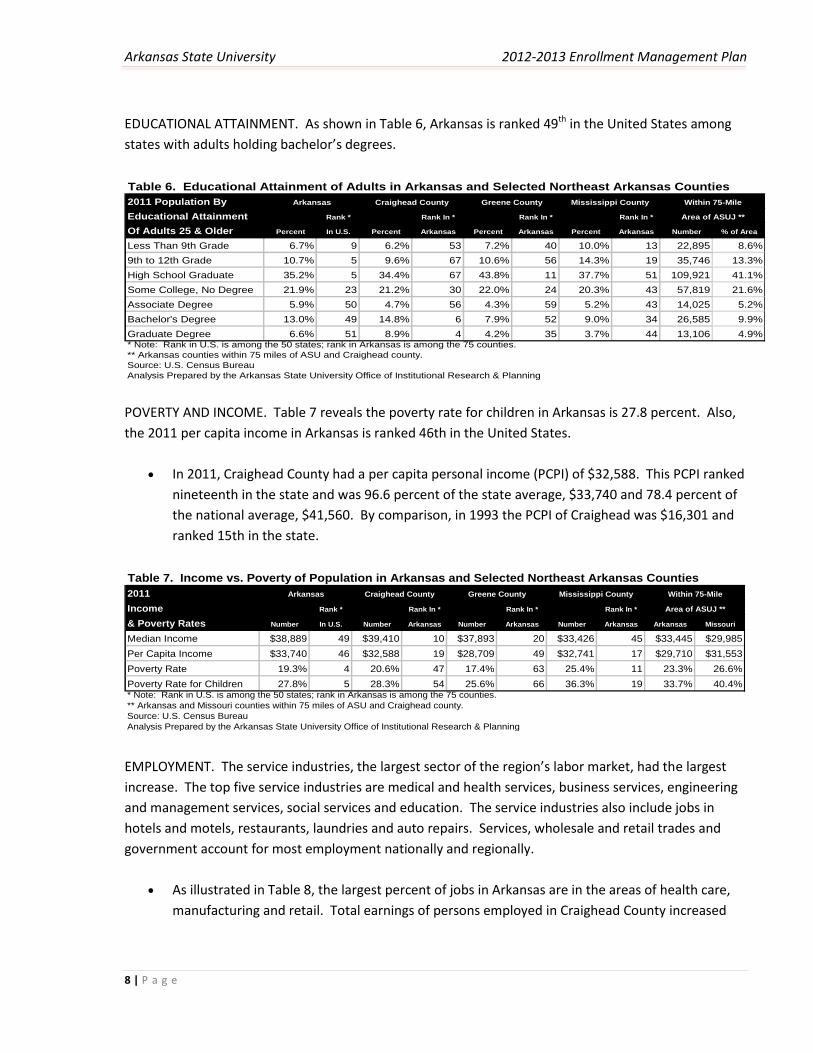
EDUCATIONAL ATTAINMENT. As shown in Table 6, Arkansas is ranked 49th in the United States among
states with adults holding bachelor’s degrees.
Table 6. Educational Attainment of Adults in Arkansas and Selected Northeast Arkansas Counties
2011 Population By
Educational Attainment Rank * Rank In * Rank In * Rank In *
Of Adults 25 & Older Percent In U.S. Percent Arkansas Percent Arkansas Percent Arkansas Number % of Area
Less Than 9th Grade 6.7% 9 6.2% 53 7.2% 40 10.0% 13 22,895 8.6%
9th to 12th Grade 10.7% 5 9.6% 67 10.6% 56 14.3% 19 35,746 13.3%
High School Graduate 35.2% 5 34.4% 67 43.8% 11 37.7% 51 109,921 41.1%
Some College, No Degree 21.9% 23 21.2% 30 22.0% 24 20.3% 43 57,819 21.6%
Associate Degree 5.9% 50 4.7% 56 4.3% 59 5.2% 43 14,025 5.2%
Bachelor's Degree 13.0% 49 14.8% 6 7.9% 52 9.0% 34 26,585 9.9%
Graduate Degree 6.6% 51 8.9% 4 4.2% 35 3.7% 44 13,106 4.9%* Note: Rank in U.S. is among the 50 states; rank in Arkansas is among the 75 counties.
** Arkansas counties within 75 miles of ASU and Craighead county.
Source: U.S. Census Bureau
Analysis Prepared by the Arkansas State University Office of Institutional Research & Planning
Arkansas Craighead County
Area of ASUJ **
Greene County Mississippi County Within 75-Mile
POVERTY AND INCOME. Table 7 reveals the poverty rate for children in Arkansas is 27.8 percent. Also,
the 2011 per capita income in Arkansas is ranked 46th in the United States.
In 2011, Craighead County had a per capita personal income (PCPI) of $32,588. This PCPI ranked
nineteenth in the state and was 96.6 percent of the state average, $33,740 and 78.4 percent of
the national average, $41,560. By comparison, in 1993 the PCPI of Craighead was $16,301 and
ranked 15th in the state.
Table 7. Income vs. Poverty of Population in Arkansas and Selected Northeast Arkansas Counties
2011
Income Rank * Rank In * Rank In * Rank In *
& Poverty Rates Number In U.S. Number Arkansas Number Arkansas Number Arkansas Arkansas Missouri
Median Income $38,889 49 $39,410 10 $37,893 20 $33,426 45 $33,445 $29,985
Per Capita Income $33,740 46 $32,588 19 $28,709 49 $32,741 17 $29,710 $31,553
Poverty Rate 19.3% 4 20.6% 47 17.4% 63 25.4% 11 23.3% 26.6%
Poverty Rate for Children 27.8% 5 28.3% 54 25.6% 66 36.3% 19 33.7% 40.4%* Note: Rank in U.S. is among the 50 states; rank in Arkansas is among the 75 counties.
** Arkansas and Missouri counties within 75 miles of ASU and Craighead county.
Source: U.S. Census Bureau
Analysis Prepared by the Arkansas State University Office of Institutional Research & Planning
Arkansas Craighead County
Area of ASUJ **
Greene County Mississippi County Within 75-Mile
EMPLOYMENT. The service industries, the largest sector of the region’s labor market, had the largest
increase. The top five service industries are medical and health services, business services, engineering
and management services, social services and education. The service industries also include jobs in
hotels and motels, restaurants, laundries and auto repairs. Services, wholesale and retail trades and
government account for most employment nationally and regionally.
As illustrated in Table 8, the largest percent of jobs in Arkansas are in the areas of health care,
manufacturing and retail. Total earnings of persons employed in Craighead County increased

Arkansas State University 2012-2013 Enrollment Management Plan
9 | P a g e
from $969,039,862 in 2000 to $2,422,227 in 2011. The largest industries as of 2011 were health
care, social assistance, 16.2 percent; retail trade, 11.8 percent; and manufacturing 10.8 percent.
(US Bureau of Labor Statistics (BLS))
Table 8. Job Distribution of Population in Arkansas and Selected Northeast Arkansas Counties
2011 Industry
Distribution Rank * Rank In * Rank In * Rank In *
Of Jobs Number In U.S. Number Arkansas Number Arkansas Number Arkansas Arkansas Missouri
% Unemployed 8.0% 26 7.3% 62 10.0% 20 11.1% 2 10.2% 9.7%
Total Jobs 1,552,597 -- 58,459 -- 18,987 -- 24,179 -- 206,630 49,967
Average Wage per Job $37,787 46 $34,296 19 $33,124 22 $38,606 7 $31,251 $29,172
% Manufacturing Jobs 10.5% -- 10.8% -- 25.1% -- 23.4% -- 11.6% 9.7%
Average Wage per Job $53,137 48 $54,343 18 $53,373 19 $82,869 2 $47,634 $46,215
% Health Care Jobs 11.2% -- 16.2% -- 10.2% -- -- -- 12.8% 14.1%
Average Wage per Job $44,810 50 $54,123 3 $39,298 14 -- -- $37,784 $33,840
% Retail Jobs 10.3% -- 11.8% -- 10.7% -- 9.2% -- 11.1% 13.0
Average Wage per Job $29,016 35 $27,573 21 $26,250 30 $25,752 36 $25,629 $25,765
% Transportation Jobs 4.3% -- 2.7% -- 2.3% -- 3.5% -- 4.4% 3.3%
Average Wage per Job $52,980 26 $51,641 14 $26,517 55 $51,611 15 $42,606 $46,211
% Finance/Insurance Jobs 3.7% -- 3.1% -- 3.0% -- 2.2% -- 3.0% 3.7%
Average Wage per Job $45,454 40 $42,369 6 $37,427 14 $32,780 27 $32,163 $30,484
% Food Service Jobs 6.3% -- 7.5% -- 5.4% -- 4.9% -- 5.3% 6.0
Average Wage per Job $17,695 46 $18,383 6 $16,025 19 $15,777 23 $15,161 $14,965* Note: Rank in U.S. is among the 50 states; rank in Arkansas is among the 75 counties.
** Arkansas and Missouri counties within 75 miles of ASU and Craighead county.
Source: U.S. Bureau of Labor Statistics (BLS)
Analysis Prepared by the Arkansas State University Office of Institutional Research & Planning
Arkansas Craighead County
Area of ASUJ **
Greene County Mississippi County Within 75-Mile
C. HIGHER EDUCATION AND JOB TRENDS
There is a significant increase in earnings over the course of a lifetime when a high school graduate
earns a college degree as opposed to someone who does not. College graduates not only earn more, but
experience a lower unemployment rate than workers without a degree. (Refer to Table 9.)
(Federal Consumer Information Center. “Five Articles on College Graduates: Outlook, Earnings, and
More.” http://www.pueblo.gsa.gov)
A college degree or higher is the most significant source of education or training for all of the 50 highest
paying occupations. (Bureau of Labor Statistics. “Tomorrow’s Jobs” http://www.bls.gov)
About one out of every four new jobs created in the U.S. economy will be in either the health
care and social assistance or private educational services sectors. Employment growth will be
driven by increasing demand for health care and social assistance because of an aging
population and longer life expectancies.
Service occupations are projected to have the largest number of total job openings. These jobs
have relatively low pay and limited training requirements.

Arkansas State University 2012-2013 Enrollment Management Plan
10 | P a g e
Table 9. Median Earnings and Unemployment Rate by Level of Education
2008 Median Earnings Total Estimated Expected Adjusted Expected Median Median Average
By Level Median After-Tax Lifetime Lifetime Earnings Earnings Earnings Unemployment
Of Education Earnings Income Earnings Earnings * Ratio ** Of Males Of Females Rate (2012)
Professional Degree $100,000 $74,400 $5,137,355 $2,123,309 2.74 $125,000 $71,300 2.1%
Doctoral Degree $91,900 $68,800 $3,897,650 $1,748,716 2.58 $100,000 $74,000 2.5%
Master's Degree $67,300 $51,100 $2,865,460 $1,427,392 1.97 $81,000 $57,500 3.5%
Bachelor's Degree $55,700 $42,700 $2,498,260 $1,189,836 1.66 $65,800 $47,000 4.5%
Associate Degree $42,000 $32,700 $1,769,090 $943,181 1.24 $50,100 $36,800 6.2%
Some College, No Degree $39,700 $31,000 $1,702,780 $878,259 1.13 $45,800 $32,600 7.7%
High School Diploma $33,800 $26,700 $1,418,890 $738,609 1.00 $39,000 $28,400 8.3%
Less Than High School Diploma $24,300 $19,600 $1,052,647 $551,462 0.71 $27,300 $19,800 12.4%* Note: Present value of total lifetime earnings, adjusted by a 5% discount rate.
** Ratio of expected lifetime earnings to earnings of a high school graduate.
Source: College Board
Analysis Prepared by the Arkansas State University Office of Institutional Research & Planning
JOB OUTLOOK IN ARKANSAS. The ten fastest-growing jobs in Arkansas are in the health care and
technology fields. Careers in hospitality services, retail, agriculture and trucking are also among the
fastest growing fields. Education, construction, government and human services are also expected to
grow. (Arkansas Business. “Job Outlooks in Arkansas.” http://www.arkansasbusiness.com)
Nine of Arkansas’ fastest-growing sectors offer careers at some of the country’s largest
companies, including Wal-Mart, Acxiom and Alltel. These sectors are: agriculture and food,
business, construction, education, health care, hospitality, retail sales, technology and
engineering, and trucking and mechanics.
These occupations in Arkansas have been growing quickly and are projected to continue to grow
with low unemployment through 2016: database administrators, computer support specialists,
system analysts, computer engineers, personal and home-care aides, home health aides, medical
assistants, special education teachers, adjustment clerks, teacher aides, child care workers,
social workers, receptionists and information clerks, food service and lodging managers, nursing
aides and orderlies, hand packers, guards, secondary school teachers, cooks, registered nurses
and food preparation workers.
ASU DEGREE PROGRAMS. Arkansas State University offers a variety of associate, baccalaureate and
graduate degree programs. During the past several years, the academic majors that have graduated the
most students have been in the disciplines of education, business and health care.
The leading associate degree programs at ASU based on the number of degrees awarded are:
general education, nursing, radiologic technology, general studies, and physical therapy
assistant.
Arkansas State University 2012-2013 Enrollment Management Plan
11 | P a g e
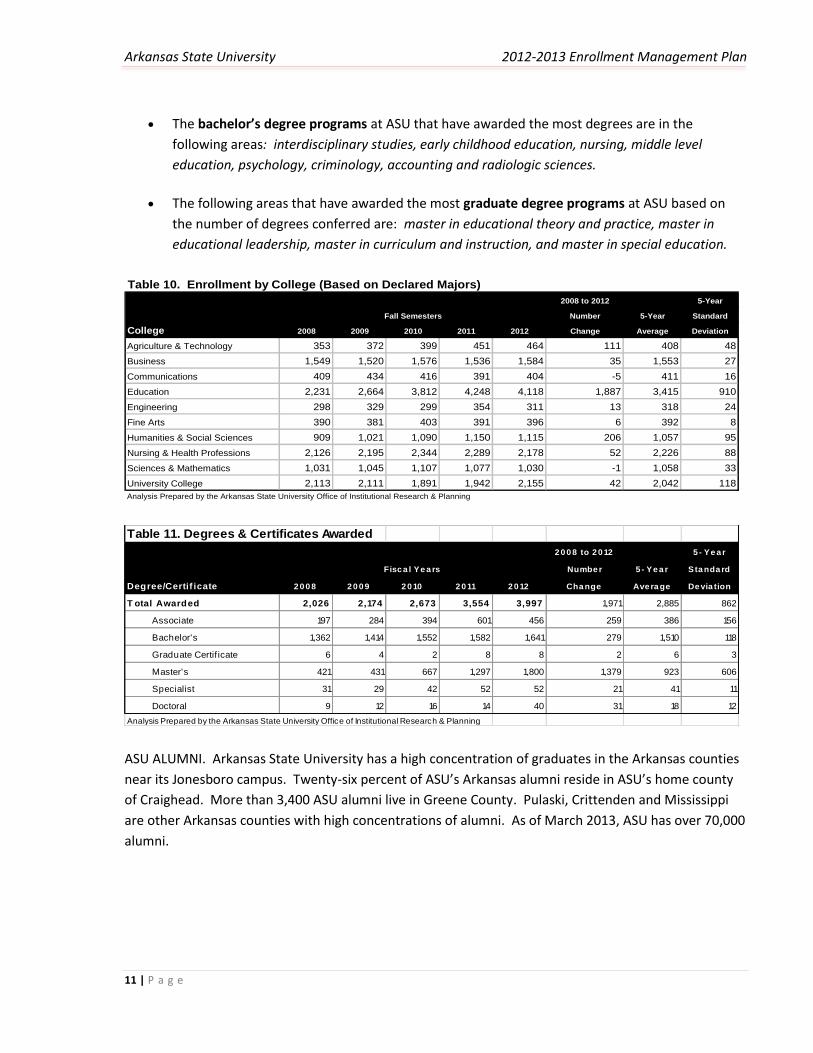
The bachelor’s degree programs at ASU that have awarded the most degrees are in the
following areas: interdisciplinary studies, early childhood education, nursing, middle level
education, psychology, criminology, accounting and radiologic sciences.
The following areas that have awarded the most graduate degree programs at ASU based on
the number of degrees conferred are: master in educational theory and practice, master in
educational leadership, master in curriculum and instruction, and master in special education.
Table 10. Enrollment by College (Based on Declared Majors)
2008 to 2012 5-Year
Number 5-Year Standard
College 2008 2009 2010 2011 2012 Change Average Deviation
Agriculture & Technology 353 372 399 451 464 111 408 48
Business 1,549 1,520 1,576 1,536 1,584 35 1,553 27
Communications 409 434 416 391 404 -5 411 16
Education 2,231 2,664 3,812 4,248 4,118 1,887 3,415 910
Engineering 298 329 299 354 311 13 318 24
Fine Arts 390 381 403 391 396 6 392 8
Humanities & Social Sciences 909 1,021 1,090 1,150 1,115 206 1,057 95
Nursing & Health Professions 2,126 2,195 2,344 2,289 2,178 52 2,226 88
Sciences & Mathematics 1,031 1,045 1,107 1,077 1,030 -1 1,058 33
University College 2,113 2,111 1,891 1,942 2,155 42 2,042 118
Analysis Prepared by the Arkansas State University Office of Institutional Research & Planning
Fall Semesters
Table 11. Degrees & Certificates Awarded
2 0 0 8 to 2 0 12 5 - Ye a r
Numbe r 5 - Ye a r Sta nda rd
Degree/Certif icate 2 0 0 8 2 0 0 9 2 0 10 2 0 11 2 0 12 Cha nge Ave ra ge De via tion
T otal Awarded 2,026 2,174 2,673 3,554 3,997 1,971 2,885 862
Associate 197 284 394 601 456 259 386 156
Bachelor's 1,362 1,414 1,552 1,582 1,641 279 1,510 118
Graduate Certif icate 6 4 2 8 8 2 6 3
Master's 421 431 667 1,297 1,800 1,379 923 606
Specialist 31 29 42 52 52 21 41 11
Doctoral 9 12 16 14 40 31 18 12
Analysis Prepared by the Arkansas State University Office of Institutional Research & Planning
Fisc a l Ye a rs
ASU ALUMNI. Arkansas State University has a high concentration of graduates in the Arkansas counties
near its Jonesboro campus. Twenty-six percent of ASU’s Arkansas alumni reside in ASU’s home county
of Craighead. More than 3,400 ASU alumni live in Greene County. Pulaski, Crittenden and Mississippi
are other Arkansas counties with high concentrations of alumni. As of March 2013, ASU has over 70,000
alumni.

Arkansas State University 2012-2013 Enrollment Management Plan
12 | P a g e
D. HIGHER EDUCATION PREPARATION AND ADMISSIONS
According to the report “State of College Admission 2011,” the application rates increased dramatically
due to record increase in applications submitted per-student. Acceptance rates for first-time-entering
college freshmen at four-year colleges and universities in the United States were 63.8 percent. Yield
rates (those accepted who enrolled) declined significantly to 38.0 percent in 2011.
(“State of College Admission 2011” National Association for College Admission Counseling)
The acceptance rate for potential first-time freshmen at Arkansas State University in the fall of
2012 was 70.6 percent--this includes those potential students who were admitted and
completed the admissions process. The fall 2012 yield rate was 44.8 percent which includes
those potential students who were accepted/admitted and enrolled. (Refer to Table 12.)
The acceptance rate for undergraduate transfers at Arkansas State University in the fall of 2012
was 71.0 percent--this includes those potential students who were admitted and completed the
admissions process. The fall 2012 yield rate was 67.8 percent which includes those potential
students who were accepted/admitted and enrolled. (Refer to Table 12.)
The acceptance rate for new graduate students at Arkansas State University in the fall of 2012
was 65.4 percent. The fall 2012 yield rate was 71.1 percent which includes those potential
students who were accepted/admitted and enrolled. (Refer to Table 12.)
Table 12. Yield and Conversion Rates
Of Undergraduate and Graduate Students Who Applied to Attend Arkansas State University
Undergraduate 2008-2012 5-Year
& Graduate Number 5-Year Standard
Applicants 2008 2009 2010 2011 2012 Change Average Deviation
First-Time-Entering Freshmen 4,288 4,118 4,568 4,806 5,289 1,001 4,614 460
% Applied Who Were Admitted * 81.9% 76.6% 70.1% 63.3% 70.6% -11.3% 72.5% 7.1%
% Admitted Who Enrolled at ASU 54.2% 54.7% 53.6% 51.4% 44.8% -9.4% 51.7% 4.1%
Number Admitted Who Enrolled at ASU 1,902 1,725 1,716 1,562 1,671 -231 1,715 123
Undergraduate Transfer Students 1,564 1,543 1,839 1,851 2,167 603 1,793 255
% Applied Who Were Admitted * 78.5% 81.7% 75.0% 72.3% 71.0% -7.5% 75.7% 4.4%
% Admitted Who Enrolled at ASU 68.5% 69.8% 70.7% 71.3% 67.8% -0.7% 69.6% 1.5%
Number Admitted Who Enrolled at ASU 840 880 976 954 1,043 203 939 80
New Graduate Students 1,365 1,844 2,881 2,877 3,000 1,635 2,393 741
% Applied Who Were Admitted * 82.3% 73.4% 64.4% 68.6% 65.4% -16.9% 70.8% 7.3%
% Admitted Who Enrolled at ASU 51.6% 55.5% 61.4% 67.3% 71.1% 19.5% 61.4% 8.1%
Number Admitted Who Enrolled at ASU 580 752 1,139 1,329 1,394 814 1,039 358* Note: This category represents those Individuals who applied, completed admissions process, and were admitted--not all students complete
the admission process.
Analysis Prepared by the Arkansas State University Office of Institutional Research & Planning
Fall Semesters
ADMISSION POLICIES, PRACTICES AND STANDARDS. According to the State of College Admission 2011
report prepared by the National Association for College Admission Counseling, grades in college
preparatory courses, strength of curriculum, standardized admission test scores and overall high school
GPA were the top factors in college admission decisions. Application essay and class rank came in fourth

Arkansas State University 2012-2013 Enrollment Management Plan
13 | P a g e
and fifth. Achievement test scores (i.e., SAT II or subject specific) were viewed as less important in
admissions decisions. (“State of College Admission 2011” National Association for College Admission
Counseling)
In the fall of 2012, 533 of ASU’s entering freshmen had an ACT Composite score of 24 or higher
compared to 647 in the fall of 2011. During this same time, the average high school GPA for
first-time-entering college freshmen who enrolled at Arkansas State University increased from
3.13 in fall 2008 to 3.37 in fall 2012. The average ACT Composite score for entering ASU
freshmen increased from 21.2 in fall 2008 to 22.9 in fall 2012. (Refer to Table 13.)
Table 13. Average ACT Composite Score and High School GPA
For First-Time-Entering College Freshmen Enrolled at Arkansas State University
Average ACT Composite Score 2008 to 2012 5-Year
& High School GPA Number 5-Year Standard
Of First-Time Freshmen 2008 2009 2010 2011 2012 Change Average Deviation
Number of First-Time Freshmen 1,902 1,725 1,716 1,562 1,671 -231 1,715 123
Average ACT Composite Score 21.2 21.3 22.1 22.8 22.9 1.7 22.1 0.8
# with 30 to 36 ACT Composite 37 56 51 72 57 20 55 13
# with 24 to 29 ACT Composite 496 436 521 527 590 94 514 56
# with 19 to 23 ACT Composite 696 626 695 655 741 45 683 44
# with ACT Composite Below 19 487 432 291 167 152 -335 306 152
# with Other Test Scores 186 175 158 141 131 -55 158 23
Average High School GPA 3.13 3.15 3.28 3.34 3.37 0.24 3.25 0.11
Analysis Prepared by the Arkansas State University Office of Institutional Research & Planning
Fall Semesters
REMEDIATION. Based on Arkansas higher education mandated standards, 10.8 percent of the fall 2012
entering freshmen enrolled at Arkansas State University required remedial course work in reading, 11.6
percent in English and 20.9 percent in mathematics. (Refer to Tables 14, 15 and 16.)

Arkansas State University 2012-2013 Enrollment Management Plan
14 | P a g e
Table 14. Arkansas First-Time-Entering College Freshmen Requiring Remediation in Reading
Arkansas 2008 to 2012 5-Year
Public 4-Year Percent 5-Year Standard
Colleges & Universities 2008 2009 2010 2011 2012 Change Average Deviation
Arkansas State (ASU) 27.1% 26.7% 16.8% 14.7% 10.9% -16.2% 19.2% 7.3%
Arkansas Tech (ATU) 17.8% 20.5% 23.1% 24.5% 26.5% 8.7% 22.5% 3.4%
Henderson State (HSU) 18.0% 19.3% 20.8% 23.4% 23.9% 5.9% 21.1% 2.6%
Southern Arkansas (SAU) 33.1% 30.6% 32.8% 29.0% 25.4% -7.7% 30.2% 3.2%
UA-Fayetteville (UAF) 3.8% 3.6% 3.0% 2.8% 3.0% -0.8% 3.2% 0.4%
UA-Ft. Smith (UAFS) 14.3% 17.4% 16.1% 14.9% 13.2% -1.1% 15.2% 1.6%
UA-Little Rock (UALR) 26.3% 25.4% 18.3% 16.6% 19.8% -6.5% 21.3% 4.3%
UA-Monticello (UAM) 47.0% 56.2% 55.4% 52.4% 50.3% 3.3% 52.3% 3.8%
UA-Pine Bluff (UAPB) 73.7% 75.6% 75.9% 68.8% 65.4% -8.3% 71.9% 4.6%
Central Arkansas (UCA) 8.5% 6.4% 11.5% 10.5% 11.6% 3.1% 9.7% 2.2%
All 4-Year Arkansas Colleges 20.7% 21.7% 19.1% 17.1% 16.1% -4.6% 18.9% 2.4%
All 2-Year Arkansas Colleges 39.5% 40.4% 43.4% 40.3% 40.5% 1.0% 40.8% 1.5%
All Public Arkansas Colleges 27.2% 29.2% 28.1% 25.5% 24.9% -2.3% 27.0% 1.8%Source: Arkansas Department of Higher Education
Analysis Prepared by the Arkansas State University Office of Institutional Research & Planning
Fall Semesters
Table 15. Arkansas First-Time-Entering College Freshmen Requiring Remediation in English
Arkansas 2008 to 2012 5-Year
Public 4-Year Percent 5-Year Standard
Colleges & Universities 2008 2009 2010 2011 2012 Change Average Deviation
Arkansas State (ASU) 29.0% 27.7% 19.8% 15.6% 11.7% -17.3% 20.8% 7.5%
Arkansas Tech (ATU) 24.0% 25.7% 29.6% 30.8% 32.9% 8.9% 28.6% 3.7%
Henderson State (HSU) 21.0% 20.4% 22.5% 27.1% 26.3% 5.3% 23.5% 3.1%
Southern Arkansas (SAU) 38.0% 30.6% 33.5% 32.5% 25.1% -12.9% 31.9% 4.7%
UA-Fayetteville (UAF) 4.4% 4.6% 3.1% 2.5% 3.2% -1.2% 3.6% 0.9%
UA-Ft. Smith (UAFS) 17.9% 22.8% 23.9% 17.8% 16.8% -1.1% 19.8% 3.3%
UA-Little Rock (UALR) 27.8% 7.7% 22.6% 19.5% 21.2% -6.6% 19.8% 7.4%
UA-Monticello (UAM) 47.4% 59.4% 59.6% 52.4% 54.8% 7.4% 54.7% 5.1%
UA-Pine Bluff (UAPB) 75.4% 76.2% 78.2% 69.7% 66.8% -8.6% 73.3% 4.8%
Central Arkansas (UCA) 5.5% 3.7% 15.1% 12.0% 14.2% 8.7% 10.1% 5.2%
All 4-Year Arkansas Colleges 22.3% 23.3% 22.2% 18.9% 18.1% -4.2% 21.0% 2.3%
All 2-Year Arkansas Colleges 47.3% 49.9% 50.6% 49.2% 48.4% 1.1% 49.1% 1.3%
All Public Arkansas Colleges 31.0% 34.0% 32.8% 29.9% 29.0% -2.0% 33.6% 2.1%
Analysis Prepared by the Arkansas State University Office of Institutional Research & Planning
Fall Semesters
Source: Arkansas Department of Higher Education

Arkansas State University 2012-2013 Enrollment Management Plan
15 | P a g e
Table 16. Arkansas First-Time-Entering College Freshmen Requiring Remediation in Math
Arkansas 2008 to 2012 5-Year
Public 4-Year Percent 5-Year Standard
Colleges & Universities 2008 2009 2010 2011 2012 Change Average Deviation
Arkansas State (ASU) 39.0% 39.2% 30.0% 25.5% 20.9% -18.1% 30.9% 8.1%
Arkansas Tech (ATU) 31.2% 35.2% 38.4% 38.7% 40.0% 8.8% 36.7% 3.5%
Henderson State (HSU) 25.5% 28.4% 29.1% 33.9% 32.6% 7.1% 29.9% 3.4%
Southern Arkansas (SAU) 39.7% 40.7% 36.5% 24.3% 32.9% -6.8% 34.8% 6.6%
UA-Fayetteville (UAF) 7.0% 7.5% 5.7% 5.5% 4.5% -2.5% 6.0% 1.2%
UA-Ft. Smith (UAFS) 37.5% 43.5% 42.4% 38.4% 35.0% -2.5% 39.4% 3.5%
UA-Little Rock (UALR) 39.1% 37.7% 30.9% 32.2% 30.3% -8.8% 34.0% 4.1%
UA-Monticello (UAM) 57.3% 68.2% 64.4% 59.6% 61.5% 4.2% 62.2% 4.2%
UA-Pine Bluff (UAPB) 85.1% 82.9% 84.8% 76.5% 76.5% -8.6% 81.2% 4.3%
Central Arkansas (UCA) 26.3% 25.4% 27.1% 23.4% 25.8% -0.5% 25.6% 1.4%
All 4-Year Arkansas Colleges 32.3% 34.1% 30.1% 26.6% 25.5% -6.8% 29.7% 3.7%
All 2-Year Arkansas Colleges 63.0% 64.7% 63.2% 61.9% 61.3% -1.7% 62.8% 1.3%
All Public Arkansas Colleges 43.0% 46.4% 42.4% 39.3% 38.4% -4.6% 41.9% 3.2%Source: Arkansas Department of Higher Education
Analysis Prepared by the Arkansas State University Office of Institutional Research & Planning
Fall Semesters
E. HIGHER EDUCATION RETENTION AND GRADUATION RATES
The percentage of ASU’s first-time-entering freshmen, enrolled full-time, who completed a degree
within six years of college entrance (2006 to 2012) was 41.6 percent.
According to the Arkansas Department of Higher Education, Arkansas public, four-year
institutions had a six year graduation rate of 39.3 percent for the 2006 first-time freshmen
compared to 17.1 percent for the public two-year institutions. (Refer to Table 17.)
According to the Arkansas Department of Higher Education, Arkansas public, four-year
institutions had a first-to-second year retention rate of 68.7 percent for the 2011 first-time
freshmen compared to 48.7 percent for the public two-year institutions. (Refer to Table 17.)

Arkansas State University 2012-2013 Enrollment Management Plan
16 | P a g e
Arkansas
Public 4- & 2-Year
Colleges & Universities (2010-2011) (2011-2012) (2009-2011) (2010-2012) (2004-2010) (2005-2011) (2006-2012)
Arkansas State (ASU) 71.3% 70.4% 54.8% 60.2% 34.8% 40.2% 41.6%
Arkansas Tech (ATU) 64.5% 65.3% 55.1% 46.0% 38.9% 42.7% 40.8%
Henderson State (HSU) 57.6% 58.9% 48.2% 45.0% 31.7% 30.4% 35.0%
Southern Arkansas (SAU) 60.0% 60.3% 44.3% 44.0% 32.8% 32.5% 33.3%
UA-Fayetteville (UAF) 83.4% 81.2% 74.9% 75.3% 56.6% 58.2% 60.0%
UA-Ft. Smith (UAFS) 59.9% 60.2% 42.2% 45.2% 22.1% 23.6% 26.9%
UA-Little Rock (UALR) 61.6% 67.2% 49.1% 49.3% 21.3% 21.9% 19.3%
UA-Monticello (UAM) 40.8% 42.6% 32.0% 29.7% 26.0% 27.9% 26.9%
UA-Pine Bluff (UAPB) 56.0% 54.6% 42.5% 40.1% 24.1% 23.0% 27.6%
Central Arkansas (UCA) 69.0% 70.2% 59.6% 54.8% 42.6% 40.1% 40.8%
All 4-Year Arkansas Colleges 68.1% 68.7% 55.4% 55.5% 38.0% 39.5% 40.8%
* Note: Percent retained and percent graduated at Arkansas Institution where first enrolled (native students only)--does not include transfer-outs.
Source: Arkansas Department of Higher Education
Analysis Prepared by the Arkansas State University Office of Institutional Research & Planning
Six Year IPEDS/ADHEADHE Retention Rates
1st to 2nd Year 2nd to 3rd Year Graduation Rates
Table 17. Arkansas First-Time-Entering College Freshmen Retention and Graduation Rates *
The first-to-second year retention rate for ASU full-time, first-time freshmen has averaged 70.9 percent
over the past three years. Based on a three-year average the six-year graduation rate for ASU full-time,
first-time freshmen is 39.1 percent.
Table 18. ASU's Full-Time, First-Time Freshmen Retention Rates
2 0 0 8 to 2 0 12 5 - Ye a r
Pe rc e nt 5 - Ye a r Sta nda rd
2007-2008 2008-2009 2009-2010 2010-2011 2011-2012 Cha nge Ave ra ge De via tion
All Full-T ime, First-T ime Freshmen 68.3% 67.9% 70.8% 71.3% 70.4% 2.1% 69.7% 1.5%
African American 64.1% 69.1% 63.6% 64.0% 74.2% 10.1% 67.0% 4.6%
W hite American 69.6% 72.9% 75.6% 72.9% 69.2% -0.4% 72.0% 2.7%
Other Ethnicity 69.2% 51.6% 63.7% 73.7% 72.6% 3.4% 66.2% 9.0%
Analysis Prepared by the Arkansas State University Office of Institutional Research & Planning
Fa ll to Fa ll Se me ste rs
Table 19. ASU's Full-Time, First-Time Freshmen Six-Year Graduation Rates
2 0 0 2 to 2 0 0 6 5 - Ye a r
Pe rc e nt 5 - Ye a r Sta nda rd
2002-2008 2003-2009 2004-2010 2005-2011 2006-2012 Cha nge Ave ra ge De via tion
All Full-T ime, First-T ime Freshmen 39.8% 38.0% 34.8% 40.2% 41.6% 1.8% 38.9% 2.6%
African American 22.8% 29.5% 19.4% 25.8% 26.6% 3.8% 24.8% 3.9%
W hite American 43.3% 40.2% 40.2% 44.9% 46.4% 3.1% 43.0% 2.8%
Other Ethnicity 32.2% 32.9% 33.8% 37.2% 33.8% 1.6% 34.0% 1.9%
Analysis Prepared by the Arkansas State University Office of Institutional Research & Planning
Fa ll Cohort to S ix- Ye a r Gra dua ting Te rm
F. HIGHER EDUCATION AFFORDABILITY
Based on the report “Measuring Up 2008: The National Report Card on Higher Education,” families in
Arkansas devote a large share of family income, even after financial aid, to attend the state’s two- and
four-year colleges and universities. Net college costs for low- and middle-income Arkansas students to
attend public four-year colleges and universities represent nearly 24 percent of their annual income.

Arkansas State University 2012-2013 Enrollment Management Plan
17 | P a g e
(“Measuring Up 2008: The State Report Card on Higher Education - Arkansas”
http://measuringup.highereducation.org)
STUDENT AID. During 2011-2012, approximately 72.6 percent of the students enrolled at Arkansas State
University received some type of financial assistance; 49.0 percent of the full-time undergraduates
received need-based Pell grants.
Table 20. Students Receiving Financial Aid While Attending Arkansas State University
Recipients 2008-12 5-Year
Of Financial Aid Number 5-Year Standard
By Aid Type 2007-08 2008-09 2009-10 2010-11 2011-12 Change Average Deviation
Federal, State, & Institutional Grants 5,423 5,920 6,977 8,471 7,503 2,080 6,859 1,222
State & Institutional Scholarships 3,097 3,285 3,545 4,796 4,905 1,808 3,926 860
Federal, State, & Institutional Loans 6,848 7,595 8,428 8,550 9,126 2,278 8,109 892
Total Unduplicated Aid Recipients 9,386 10,258 11,652 12,845 12,944 3,558 11,417 1,573
% of ASU Students Receiving Aid 68.7% 71.7% 71.5% 73.0% 72.6% 3.9% 71.5% 1.7%
% Undergraduates Receiving Pell Grants* 47.0% 42.0% 47.0% 49.0% 49.0% 2.0% 46.8% 2.9%
Average Loan Indebtedness of Graduates ** $17,500 $18,750 $18,900 $18,900 $18,900 $1,400 $18,590 $613* Note: Undergraduates enrolled full-time receiving Pell Grants.
** ASU bachelor degree graduates who received loans.
Analysis Prepared by the Arkansas State University Office of Institutional Research & Planning
Annual Fiscal Years
Table 21. State Appropriations as a Percent of E&G Revenues
2 0 0 8 - 12 5 - Ye a r
Numbe r 5 - Ye a r Sta nda rd
E &G Revenues ($'s in millions) 2 0 0 7 - 0 8 2 0 0 8 - 0 9 2 0 0 9 - 10 2 0 10 - 11 2 0 11- 12 Cha nge Ave ra ge De via tion
T otal Unrestricted E &G Revenues $122.9 $130.8 $141.1 $148.9 $155.7 33 $139.9 $13.3
Unrestricted State Appropriations $59.8 $59.3 $58.1 $59.4 $61.1 1 $59.5 $1.1
State Appropriations as a % of E&G Revenues 48.7% 45.3% 41.2% 39.9% 39.2% -9.4% 42.9% 4.0%
T otal Restricted E &G Revenues $45.9 $54.1 $63.2 $82.3 $74.8 29 64.1 14.8
Restricted State Appropriations $5.0 $3.4 $4.7 $3.6 $3.6 -140.0% 4.1 0.7
State Appropriations as a % of E&G Revenues 10.9% 6.3% 7.4% 4.4% 4.8% -6.1% 6.8% 2.6%
Analysis Prepared by the Arkansas State University Office of Institutional Research & Planning
Annua l Fisc a l Ye a rs
TUITION AND REQUIRED FEES. According to the College Board report “Trends in College Pricing 2012,”
the average tuition and required fees charged to in-state students at public four-year colleges and
universities nationally in 2012-2013 was $8,655, up $399 from $8,256 in 2011-2012. The average total
cost of attendance including tuition, required fees, room and board increased $724 to $17,860 in 2012-
2013. In 2012-2013, undergraduate Arkansas residents paid approximately $7,180 in tuition and
required fees to enroll in 30 credit hours of course work during the academic year at ASU. (Refer to
Table 22.)

Arkansas State University 2012-2013 Enrollment Management Plan
18 | P a g e
Table 22. Average 2012-2013 Resident Undergraduate Expenses
At Public 4-Year Colleges and Universities by College Board Region
Public 4-Year 2012-2013 * Dollar Amount Public 4-Year 2012-2013 * Dollar Amount
Colleges & Universities Tuition & Fees Above or Below Colleges & Universities Tuition & Fees Above or Below
by College Board Region Only ASU's Tuition & Fees by College Board Region w/Room & Board ASU's Expenses
Midwest $9,267 $2,087 National $17,860 $3,980
National $8,655 $1,475 Midwest $17,745 $3,865
Southwest $7,721 $541 UA-Fayetteville (UAF) $16,387 $2,507
UA-Fayetteville (UAF) $7,715 $535 UA-Little Rock (UALR) $16,333 $2,453
South $7,621 $441 South $15,898 $2,018
UA-Little Rock (UALR) $7,344 $164 Southwest $15,383 $1,503
Central Arkansas (UCA) $7,332 $152 Arkansas State (ASU) $13,880 $0
Arkansas State (ASU) $7,180 $0 Central Arkansas (UCA) $12,612 -$1,268* Note: Tuition and required fees based on 30 credit hours annually; average room and board for on-campus residential students included.
Source: College Board
Analysis Prepared by the Arkansas State University Office of Institutional Research & Planning
Table 23. Annual Tuition & Fees at ASU
2 0 0 9 to 2 0 13 5 - Ye a r
Numbe r 5 - Ye a r Sta nda rd
T utition & Fees 2 0 0 8 - 0 9 2 0 0 9 - 10 2 0 10 - 11 2 0 11- 12 2 0 12 - 13 Cha nge Ave ra ge De via tion
Undergraduate (15 hrs/semester)
Resident (annual 30 hours) $6,370 $6,370 $6,640 $6,934 $7,180 $810 $6,699 $356
Nonresident (annual 30 hours) $14,290 $14,290 $14,860 $12,238 $12,610 -$1,680 $13,658 $1,157
Graduate (9 hrs/semester)
Resident (annual 18 hours) $4,640 $4,640 $4,820 $5,030 $5,198 $558 $4,866 $246
Nonresident (annual 18 hours) $10,436 $10,436 $10,850 $9,073 $9,338 -$1,098 $10,027 $774
Analysis Prepared by the Arkansas State University Office of Institutional Research & Planning
Annua l
G. HIGHER EDUCATION ACCESSIBILITY AND COMPETITION
Within 150 miles of Arkansas State University, there are more than 200 associate degree program
options, 400 baccalaureate degree options and more than 230 graduate degree options currently being
offered within the region. These programs are offered by a variety of competitors including public and
private four- and two-year institutions of the Arkansas Higher Education System, the University of
Memphis, University of Missouri at Rolla, Southeast Missouri State University at Cape Girardeau and
Three Rivers Community College at Poplar Bluff, Missouri. Recent additions to the competitive mix
include institutions offering on-line courses and degrees, and high schools and two-year institutions
which are providing upper-division course work in selected baccalaureate programs.
The Western Interstate Commission for Higher Education has projected that the number of high school
graduates in Arkansas will increase from 26,621 in 2005 to 32,013 by the year 2022—an increase of
5,392 students. It should be noted that according to the Arkansas Department of Higher Education, 51.7
percent of Arkansas’s high school graduates in 2010 attended either a two- or four-year Arkansas higher
education institution—this figure does not include high school graduates who enrolled in out-of-state
colleges. The national college going rate in 2009 was 70.1 percent.
Arkansas State University 2012-2013 Enrollment Management Plan
19 | P a g e
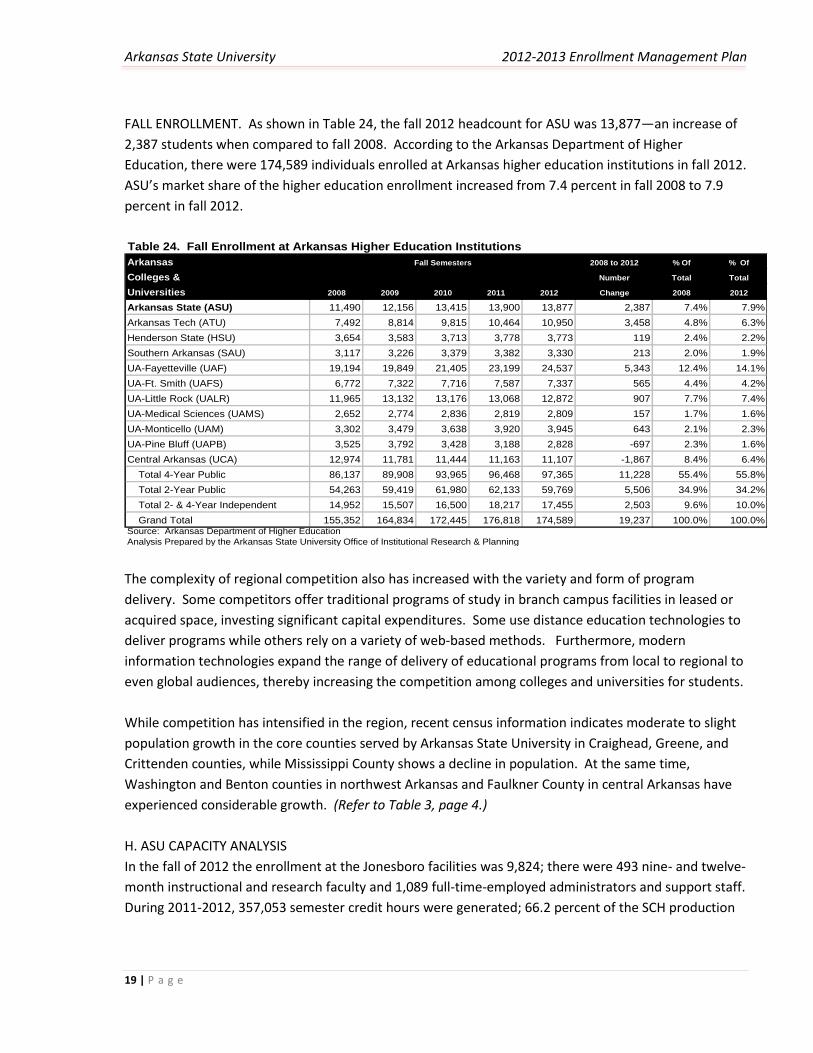
FALL ENROLLMENT. As shown in Table 24, the fall 2012 headcount for ASU was 13,877—an increase of
2,387 students when compared to fall 2008. According to the Arkansas Department of Higher
Education, there were 174,589 individuals enrolled at Arkansas higher education institutions in fall 2012.
ASU’s market share of the higher education enrollment increased from 7.4 percent in fall 2008 to 7.9
percent in fall 2012.
Arkansas 2008 to 2012 % Of % Of
Colleges & Number Total Total
Universities 2008 2009 2010 2011 2012 Change 2008 2012
Arkansas State (ASU) 11,490 12,156 13,415 13,900 13,877 2,387 7.4% 7.9%
Arkansas Tech (ATU) 7,492 8,814 9,815 10,464 10,950 3,458 4.8% 6.3%
Henderson State (HSU) 3,654 3,583 3,713 3,778 3,773 119 2.4% 2.2%
Southern Arkansas (SAU) 3,117 3,226 3,379 3,382 3,330 213 2.0% 1.9%
UA-Fayetteville (UAF) 19,194 19,849 21,405 23,199 24,537 5,343 12.4% 14.1%
UA-Ft. Smith (UAFS) 6,772 7,322 7,716 7,587 7,337 565 4.4% 4.2%
UA-Little Rock (UALR) 11,965 13,132 13,176 13,068 12,872 907 7.7% 7.4%
UA-Medical Sciences (UAMS) 2,652 2,774 2,836 2,819 2,809 157 1.7% 1.6%
UA-Monticello (UAM) 3,302 3,479 3,638 3,920 3,945 643 2.1% 2.3%
UA-Pine Bluff (UAPB) 3,525 3,792 3,428 3,188 2,828 -697 2.3% 1.6%
Central Arkansas (UCA) 12,974 11,781 11,444 11,163 11,107 -1,867 8.4% 6.4%
Total 4-Year Public 86,137 89,908 93,965 96,468 97,365 11,228 55.4% 55.8%
Total 2-Year Public 54,263 59,419 61,980 62,133 59,769 5,506 34.9% 34.2%
Total 2- & 4-Year Independent 14,952 15,507 16,500 18,217 17,455 2,503 9.6% 10.0%
Grand Total 155,352 164,834 172,445 176,818 174,589 19,237 100.0% 100.0%Source: Arkansas Department of Higher Education
Analysis Prepared by the Arkansas State University Office of Institutional Research & Planning
Fall Semesters
Table 24. Fall Enrollment at Arkansas Higher Education Institutions
The complexity of regional competition also has increased with the variety and form of program
delivery. Some competitors offer traditional programs of study in branch campus facilities in leased or
acquired space, investing significant capital expenditures. Some use distance education technologies to
deliver programs while others rely on a variety of web-based methods. Furthermore, modern
information technologies expand the range of delivery of educational programs from local to regional to
even global audiences, thereby increasing the competition among colleges and universities for students.
While competition has intensified in the region, recent census information indicates moderate to slight
population growth in the core counties served by Arkansas State University in Craighead, Greene, and
Crittenden counties, while Mississippi County shows a decline in population. At the same time,
Washington and Benton counties in northwest Arkansas and Faulkner County in central Arkansas have
experienced considerable growth. (Refer to Table 3, page 4.)
H. ASU CAPACITY ANALYSIS
In the fall of 2012 the enrollment at the Jonesboro facilities was 9,824; there were 493 nine- and twelve-
month instructional and research faculty and 1,089 full-time-employed administrators and support staff.
During 2011-2012, 357,053 semester credit hours were generated; 66.2 percent of the SCH production

Arkansas State University 2012-2013 Enrollment Management Plan
20 | P a g e
were produced by nine-month instructional faculty—with an average of 546 SCH produced per nine-
month faculty. (Refer to Table 25.)
Table 25. Annual Semester Credit Hours Generated in Courses Provided by Arkansas State University
Semester 2008-12 5-Year
Credit Hour (SCH) Number 5-Year Standard
Production * 2007-08 2008-09 2009-10 2010-11 2011-2012 Change Average Deviation
Annual Semester Credit Hours 272,919 286,902 319,785 354,724 357,053 84,134 318,277 38,327
Undergraduate SCH 246,834 257,003 265,486 275,134 276,899 30,065 264,271 12,608
Graduate SCH 26,085 29,899 54,299 79,590 80,154 54,069 54,005 25,976
Avg SCH Produced per 9-Mth Faculty** 493 531 532 574 546 53 535 29
Fall SCH as % of Annual SCH 46.9% 46.6% 45.0% 45.0% 45.3% -1.6% 45.8% 0.9%
Spring SCH as % of Annual SCH 43.8% 43.7% 44.1% 43.3% 42.7% -1.1% 43.5% 0.5%
Summer SCH as % of Annual SCH 9.3% 9.7% 10.9% 11.7% 12.0% 2.7% 10.7% 1.2%
% of SCH Generated by FT Faculty 72.0% 71.0% 70.0% 67.0% 70.0% -2.0% 70.0% 1.9%* Note: SCH is based on instructional activity at all ASU instructional sites.
** Average annual SCH produced per 9-month faculty includes summer sessions.
Analysis Prepared by the Arkansas State University Office of Institutional Research & Planning
Annual - Fiscal Years
Based on classroom utilization studies, the largest number of filled seats for instructional activity at the
Jonesboro facilities since 2000 has occurred on Tuesday and Thursday mornings. During the fall 2012
semester, approximately 55.8 percent of the filled seats for courses occurred during the morning hours
before noon, 33.4 percent of the filled seats were during the afternoon hours from noon until 5 p.m.
and 10.8 percent of the filled seats were in courses offered after 5 p.m. Based on the number of seats
available for fall 2012 classes, it is estimated that the morning course sections at the Jonesboro location
were filled at approximately two-thirds capacity.
ASU DEGREE CENTERS. ASU has worked to maintain or increase its enrollment by establishing degree
centers on a number of two-year campuses located at Beebe, Mountain Home, Blytheville, Forrest City,
Newport, and West Memphis. These degree centers offer place bound students the opportunity to
pursue a baccalaureate degree at the same campus where they completed their two-year program. ASU
also has an instructional site at Paragould, where students may complete general education courses.
The idea has been to bring education to the students. As indicated in Table 26, 8.3 percent of ASU’s full-
time-equivalent (FTE) enrollment during 2011-2012 occurred at other instructional sites.

Arkansas State University 2012-2013 Enrollment Management Plan
21 | P a g e
Table 26. Full-Time-Equivalent (FTE) Enrollment at All Arkansas State University Instructional Sites
2008-12 5-Year
Full-Time-Equivalent (FTE) Number 5-Year Standard
Enrollment 2007-08 2008-09 2009-10 2010-11 2011-12 Change Average Deviation
Annual FTE Enrollment 9,379 10,012 11,112 12,847 12,570 3,191 11,184 1,527
% Annual FTE is Undergraduate 88.3% 87.3% 79.6% 71.4% 73.4% -14.9% 80.0% 7.7%
% Annual FTE is Graduate 11.7% 12.7% 20.4% 28.6% 26.6% 14.9% 20.0% 7.7%
% Annual FTE at Jonesboro* 88.4% 84.0% 92.0% 88.4% 84.3% -4.1% 87.4% 3.3%
% Annual FTE at Other Sites 11.6% 16.0% 18.0% 11.6% 15.7% 4.1% 14.6% 2.9%
% Annual FTE is CVN-Instruction 1.7% 1.6% 1.4% 1.7% 1.0% -0.7% 1.5% 0.3%
% Annual FTE is Web-Instruction 10.0% 14.4% 18.5% 26.9% 29.0% 19.0% 19.8% 8.1%
Ratio of FTE Students to FTE Faculty ** 17 18 18 19 19 2 18 1
* Note: Includes web
** Note: FTE faculty is based on fall and spring semesters, summers not included.
Analysis Prepared by the Arkansas State University Office of Institutional Research &, Planning
Annual - Fiscal Years
INSTRUCTIONAL TECHNOLOGY. ASU has committed to moving entire courses online, augmenting
existing courses through technological mediums and creating online degree programs. To accomplish
this goal, ASU has established the Interactive Teaching and Technology Center that works with faculty to
integrate technology into their instruction – whether online or in the more traditional classroom. The
amount of FTE enrollment utilizing compressed video instruction and/or web-based instruction has been
increasing, accounting for 11.7 percent of the FTE enrollment in 2007-2008 to 30.0 percent in 2011-
2012. (Refer to Table 26.)

Arkansas State University 2012-2013 Enrollment Management Plan
22 | P a g e
PROGRESS UPDATE SUMMARY: INSTITUTIONAL AND SITUATION ASSESSMENT Dr. Kathryn Jones, Director of Institutional Research and Planning
Arkansas State University’s enrollment increase at the Jonesboro campus (ASU) for fall 2012 is
attributed to a combination of factors including a greater awareness of the university’s quality, more
academic scholarship opportunities for students, aggressive recruiting of prospective undergraduate
and graduate students, greater accessibility to higher education degree programs and course offerings,
and increased efforts to improve the academic success and retention of undergraduate students. The
total unduplicated headcount for all instructional sites associated with the Jonesboro campus is 13,877,
a slight decrease of 23 students over fall 2011. The full-time-equivalent enrollment for fall 2012 is
10,095, an increase of 0.7%.
There were 1,671 new freshmen enrolled fall 2012 at ASU an increase of 7.0 percent from fall
2011. Enrollment of undergraduate transfer students increased from 840 students enrolled in
fall 2008 to 1,043 transfers enrolled fall 2012.
There are 3,709 graduate students enrolled at all ASU instructional sites for fall 2012, compared
to 3,787 for fall 2011. The graduate student enrollment includes 2,944 students enrolled in
master’s degree programs, 378 enrolled in specialist degree programs, and 245 enrolled in
doctoral degree programs.
ASU’s growth is also attributed to continuing initiatives to increase accessibility to higher
education to Arkansans by providing degree programs and course offerings at other
instructional sites throughout Arkansas—over 4,000 individuals are enrolled at sites located at
Beebe, Blytheville, Forrest City, Mt. Home, West Memphis, other locations including area high
schools and on-line/web based courses.
In fall 2012, 5,836 students enrolled in online/web/web-assisted instruction provided by the
Jonesboro campus, compared to 2,692 students enrolled in web-based instruction for fall 2008.
ASU’s College of Education has seven online graduate degree programs that have increased in
enrollment, with over 2,000 students enrolled in the programs.
Another factor that has been instrumental in the enrollment stability and growth at ASU has
been the on-going efforts to improve the academic success and retention of undergraduate
students—70.4% of the fall 2011 full-time, first-time freshmen returned to enroll at ASU for fall
2012.
The recent 6-year graduation rate for the fall 2006 full-time, first-time freshmen cohort was
41.6%.
Undergraduate and graduate enrollment of international students attending ASU has increased
from 322 students in fall 2008 to 858 students in fall 2012.
During the 2011-2012 academic year 3,997 undergraduate and graduate degrees were
conferred to students. The highest amount on record.
In fall 2012, ASU had 13.6% of the market share of full-time-equivalent (FTE) enrollment among the ten public 4-year colleges and universities in Arkansas—ASU is ranked 2nd highest,

Arkansas State University 2012-2013 Enrollment Management Plan
23 | P a g e
the University of Arkansas at Fayetteville has 28.5% of FTE market share, and the University of
Central Arkansas is third with 12.8% of the FTE market share.
During 2011-2012, 72.6% of ASU’s students received financial assistance. Among those students
receiving aid, 49.0% received federal Pell grants.
Among the ten public 4-year colleges and universities in Arkansas, ASU’s 2012-2013 tuition and
mandatory fee charges for Arkansas residents enrolled full-time as undergraduates ($7,180) is
ranked 4th highest—the University of Arkansas at Fayetteville ($7,715), the University of
Arkansas-Little Rock ($7,344), and the University of Central Arkansas ($7,332) have higher costs.

Arkansas State University 2012-2013 Enrollment Management Plan
24 | P a g e
STUDENT RECRUITMENT AND ENROLLMENT STRATEGY Dr. Lynita Cooksey, Associate Vice Chancellor for Academic Services Dr. Tammy Fowler, Director of Recruitment Mr. Tugrul Polat, Executive Assistant to the Chancellor for International Programs Dr. Andrew Sustich, Dean of Graduate School and Honors College
UNDERGRADUATE ENROLLMENT AND ADMISSION
The Office of Recruitment directly supports A-State’s strategic direction to increase enrollment. It will
do so with action steps developed to specifically achieve “Goal 1E- Increase undergraduate and
graduate enrollment of well-qualified students” and “Goal 2G- Market more effectively undergraduate
and graduate programs to cause an enrollment increase of well-qualified students.” Action steps have
been developed to achieve these goals in the most effective and efficient methods possible. For these
goals and actions steps to be successful, it is imperative that ASU adopt an institution-wide
commitment and adequate funding to support these efforts.
When developing student recruitment and enrollment strategies, certain issues/factors will have an
impact on the outcome; therefore, they must be delineated here.
ASU’s current admission standards have increased each of the last five years.
Recruiting resources are spread too thinly and should be targeted toward students who have
the ability to succeed at ASU.
Limited resources require recruitment efforts to be maximized by targeting those high schools
with the highest possible enrollment potential.
Outreach efforts to prospective students must start earlier and include multiple media
messages, such as electronic and print media.
As the admissions standards increase to experience an increase in enrollment, an increase in the
number of admits/enrollments of students scoring 24 or above must be achieved.
Percent of admitted FA through April 30
ACT Range 2010 2011 2012
Below 19 1.1081
19-23 Composite* 0.4485 0.5019 0.3814
24-26 Composite 0.2608 0.2700 0.3321
27-36 Composite 1.1826 0.2108 0.2836

Arkansas State University 2012-2013 Enrollment Management Plan
25 | P a g e
In order to optimize personnel and financial resources, recruitment efforts must target those areas most
densely populated with students who have the highest enrollment potential. First, 2012 high school
juniors scoring a minimum 24 composite on the ACT were identified as Tier 1 recruits. Second, those
high schools most densely populated with these Tier 1 students were identified. An analysis of each of
these high schools’ enrollment at ASU over the last seven years was performed. The high schools were
then placed into two groups. One group is made up of those high schools with high numbers of Tier 1
students and ASU enrollment growth each of the last three years. Group two is the high schools with
high numbers of Tier 1 students who have growth potential due to increased enrollment in the last year.
Recruitment staff will be targeting the 54 Arkansas high schools identified in this process. The majority
of the schools are located in Northeast and Central Arkansas, and Northwest Arkansas. The Northwest
and Southwest corner of the state does not show high enrollment potential.
Focus groups of high achieving students were held to discuss what influenced them in their college
choice process. These students wanted more personal contact, print materials with more photos of
campus and students, and more information on academic programs and faculty research. Recruiting
high achieving students will require more personal contact from the recruit staff and a refocus of
communication plans. Recruit staff will be designing individual communication plans to target their Tier
1 students. These plans are tailored to their individual recruitment territories and will focus on the
individual students using emails, social media, and personal mail communication pieces. The larger mail
publications will contain more photos of campus and highlight academic departments and programs.
Recruitment efforts outside the State of Arkansas will focus on the bootheel of Missouri and on students
with a minimum ACT composite of 23 or above. Competition in this area is difficult due to not being
able to offer institutional scholarships to students outside the State of Arkansas. The recent reduction in
out-of-state tuition, partnered with our out-of-state tuition waiver scholarship, hopefully will open
doors and create opportunities for recruitment.
Focus groups with high achieving students revealed early contact was valuable to them in the college
search process. Information from colleges in the sophomore and junior years of high school were
instructive. As a result, the communication plan will include contacts in the sophomore and junior
years. Sophomore year communication will include mailings with general college preparedness and
process information. The junior year communication will include more specific step-by-step timelines
and how ASU can meet the students’ long-term higher educational goals.
All recruitment efforts will be painstakingly tracked during this recruitment cycle. Statistical analysis will
be conducted to determine the most effective and efficient communications, programs, and contacts.
The results will then be used to shape future recruitment strategies.
The Office of Recruitment will target high achieving students beginning early in the college search
process. Students will receive personal attention from the recruit staff and targeted communications

Arkansas State University 2012-2013 Enrollment Management Plan
26 | P a g e
through mail and electronic media. Resources will be maximized by reaching out to those students with
the highest potential to enroll, retain, and graduate. The results will be an increased average ACT score
of incoming first-time freshmen, increase in the number of incoming freshmen with an ACT composite of
24 or higher, and an increase in out-of-state freshmen/transfer enrollment.
Priority 1 Refine ASU's Mission and Identity as an Emerging Global Research Institution.
Goal 1.E Increase undergraduate and graduate enrollment of well-qualified students.
Action Step Determine the criteria, methods and processes by which high achieving students select the college they will attend, including an analysis of desired communication venues, programming and contacts that are successful.
Responsibility Recruitment
Timeline Spring 2013
Measure Focus groups with high achieving students and their parents will be conducted.
Target Audience High school juniors with a minimum ACT composite score of 24 and high school seniors with a minimum ACT composite score of 24.
Status On-going
Action Step Redirect resources to actively and aggressively recruit students with a minimum ACT composite score of 24.
Responsibility Recruitment
Timeline Fall 2013
Measure Financial and personnel resources will be redirected for mailings, telephone contacts to and name purchases of targeted students to achieve an increase in the number of first-time freshmen enrolling with a minimum ACT composite score of 26 and an increase in the average ACT score of incoming freshmen to 23. A 3% increase in first-time students with a 26 or higher ACT composite score will be deemed successful.
Target Audience High school juniors with a minimum ACT composite score of 24 and high school seniors with a minimum ACT composite score of 24.
Status In progress
Action Step Establish early relationships with high achieving students beginning with contacts in the sophomore year and continue into the junior year by purchasing ACT EOS names.
Responsibility Recruitment
Timeline Fall 2013
Measure Names of targeted students will be purchased and an initial mailing will be sent with a response card. Response cards returned will be entered into the Banner SIS system Recruitment module resulting in an increase in the number of sophomore contacts.
Target Audience High school sophomores
Status In progress
Action Step Software will be utilized to target student populations most likely to enroll, such as ACT Educational Information Service, and the Banner reporting instance.
Responsibility Recruitment
Timeline Fall 2013
Measure Counts will be made monthly to analyze student contacts to determine probability of enrollment will result in better resource allocation to those efforts which will produce enrollment as evidenced by an increase in the number of high achieving students visiting campus, completing applications, and enrolling.
Target Audience High schools seniors
Status In progress
Action Step Recruit staff will develop and implement personal communication plans including electronic, print and web-based communications with high achieving students in their territories.
Responsibility Recruitment
Timeline Fall 2013
Measure Recruit staff will be assessed on the development and implementation of the plan. Communication pieces must go out in a timely manner to the appropriately targeted market.
Target Audience High school juniors with a minimum ACT composite score of 24 and high school seniors with a minimum ACT composite score of 24.
Status On-going
Action Step Create and implement targeted preview days based on academic interest for high school juniors and seniors.

Arkansas State University 2012-2013 Enrollment Management Plan
27 | P a g e
Responsibility Recruitment
Timeline Fall 2013
Measure The number of students and parents attending events will be tracked.
Target Audience High school seniors with a minimum ACT composite score of 24.
Status On-going
Action Step Establish a "Student First" culture in the Office of Admissions.
Responsibility Undergraduate Admissions
Timeline Fall 2011
Measure Applications and supporting documents will be processed in a timely manner according to standards set by processing supervisors and follow-up sent to applicants accurately and timely. Emails will be responded to within 24 hours of receipt and telephone calls will be returned the same day.
Target Audience Applicants
Status In progress
Action Step Campus visitors will have an experience that will positively impact/influence their perception of the campus.
Responsibility Recruitment
Timeline Fall 2013
Measure All campus visitors will be asked to complete an exit survey online in the Office of Recruitment. Assessment of the registration, recruitment advisor, ambassador, tour and the overall experience will be conducted.
Target Audience Campus visitors
Status On-going
Action Step Review comparative data from competing institutions to determine our relative success at recruiting high achieving students.
Responsibility Recruitment
Timeline Fall 2012
Measure ASU will be less than 10% away from comparative group enrollment of high school seniors with a minimum ACT composite of 26.
Target Audience First-time freshmen
Status On-going
Priority 2 Create a service and support culture that is focused on student learning, retention, and academic success.
Goal 2.G Market more effectively undergraduate and graduate programs to cause an enrollment increase of well-qualified students.
Action Step Establish a faculty, staff and student speaker's bureau, for use at high schools and two-year institutions to market our academic programs early to prospective students.
Responsibility Recruitment
Timeline Fall 2013
Measure 3-5 presentations will be given at targeted high schools and two-year colleges per semester.
Target Audience High school students and two-year college students
Status On-going
Action Step Design and implement a communication plan for contact with parents of prospective students that guides them through the college search process.
Responsibility Recruitment
Timeline Fall 2013
Measure Email and print communications will be designed and sent to parents of prospective students. A survey will be sent at the end of the communication cycle to determine usefulness to parents.
Target Audience Parents of high school juniors and seniors.
Status On-going
Action Step Bring concurrently enrolled high school students to campus for scholarly and social events, thereby increasing familiarity and comfort with the campus and academic programs offered.
Responsibility Undergraduate Recruitment
Timeline Fall 2011Spring 2013
Measure The number of students and parents attending events will be tracked.
Target Audience Concurrently enrolled high school students
Status On-going

Arkansas State University 2012-2013 Enrollment Management Plan
28 | P a g e
GRADUATE RECRUITMENT AND ENROLLMENT
After the development of the 2005 Enrollment Management Plan, Jim Black, enrollment management
consultant, noted the following in a report following his November 10-11, 2005, visit:
While progress to date is impressive, there exist two areas of concern. First, the Graduate
School cannot contribute significantly to the enrollment growth goals of the university with the
current level of resources. In particular, the Graduate School is severely limited with technology
and staffing. The Graduate School (1) does not have access to the HRS and FRS modules of the
enterprise system, (2) has minimal Web development and maintenance capacity, (3) and limited
capability to create and cultivate a prospect database. Regarding the latter, there is no
acquisition and cultivation of GRE and GMAT test-takers, a common practice in graduate
education, and no coordinated communication between the Graduate School and ASU graduate
programs with prospective students. Even if the technology infrastructure existed, ASU would
need additional personnel to implement. It is strongly recommended that you create a position
for a director of graduate recruitment. It is unreasonable to expect the dean to serve this
function and have any impact on enrollment outcomes. To put it bluntly, you have no graduate
recruitment effort of substance. You need to build an infrastructure that aligns with the
expectations for that unit, including a budget for recruitment and marketing.
One year later during a follow-up visit on December 4-5, 2006, his report noted:
Graduate recruitment at ASU has been under-resourced since its inception. With a modest
investment of one graduate recruiter position and operating dollars earmarked for recruitment,
the Graduate School could develop a robust communications plan including publications;
electronic communications, and advertising; design marketing-oriented Web sites for all
graduate programs; host information sessions; expand outreach activities; and support
recruitment efforts implemented by the graduate program faculty.
Following the lead of the Undergraduate Admissions office, the Graduate School began working with
Azorus to implement their CRM (Client Relationship Management) system in December 2008. Pam
Struttmann was hired part-time as Director of Recruitment and Marketing for the Graduate School in
late spring 2009. This position is still provisional and off-budget, but was upgraded to full-time in July
2010. After a long implementation process, the Azorus portal and communications plan for the
Graduate School went live in mid-fall 2009 and operated for about two years. The Graduate School had
hoped to be able to access the experience base in Undergraduate Admissions to fully utilize the Azorus
product, but was not able to. While Azorus had maintained the communication plan with prospects, it
was never fully integrated with Banner to have any significant ROI (Return on Investment) analysis for
graduate recruiting. Graduate enrollment continued to increase in traditional, online, and international
numbers, but informed decisions could not be made as to how this was being achieved.

Arkansas State University 2012-2013 Enrollment Management Plan
29 | P a g e
The Graduate School moved to the Hobsons EMT Connect product as its CRM solution. This required an
extended implementation period to bring this up to speed (during which we still utilized the Azorus
contract until its expiration in fall 2011). This also requires the Recruitment/Marketing director position
to become a line-item budgeted position rather than off-budget, but this has not happened to date.
The Hobsons EMT Connect implementation took place beginning summer 2011. This was protracted
and extended several months due to need to renegotiate the agreement after beginning
implementation steps. The product went live in February 2012. It has worked well to better maintain
communications with prospective students through the stages from prospect to applicant to admit to
enrolled. The Graduate School is now able to track prospects clearly including how they came into the
system. This has allowed the purchase of GRE and GMAT test taker information and targeted marketing
to the group and evidence of return on investment that justifies continuing this practice.
One action plan from the 2005 Strategic Management Plan that remains vital, and even more so if ASU is
to be an emerging global research university, is to raise incentives for graduate students. This was laid
out in the previous plan and the only progress to date was an internal Graduate School decision in 2006
to reduce the number of graduate assistants offered in order to raise stipends for graduate assistants
hired. But stipend levels and lack of tuition remission (other than for doctoral assistants) makes ASU
non-competitive for attracting the most highly qualified graduate students in high research activity
disciplines. So this remains an action item.
Another action plan from the 2005 Strategic Management Plan is to establish a recruiting plan for
graduate student recruitment. There has been considerable progress on this plan but further progress is
limited by the extent to which resources are allocated to achieve it.
To become an emerging research institution, ASU faculty must be more engaged in research. A
traditional way to provide additional time on research for faculty at research institutions is to better
utilize well qualified graduate assistants in the classroom, laboratory, and in tutorials. This will require
additional resources for graduate assistant support as well as development of orientation and oversight
programs to adequately and continuously assess the quality of instruction by these graduate assistants.
This transition will also require the introduction of new graduate programs that are doctoral level and
research intensive, and the commensurate support for faculty and graduate students that are necessary
for a doctoral program to succeed. Priority 1 Refine ASU's Mission and Identity as an Emerging Global Research Institution.
Goal 1.A Pursue Appropriate Carnegie Classification Based on Role and Scope
Action Step Increase enrollment of graduate students enrolled in high research disciplines
Responsibility Graduate School, AAR, and academic colleges
Timeline Continuous
Resources This cannot be accomplished without significant resources to raise graduate assistant stipends and provide tuition remission to these students.
Measure Enrollment growth and increase in quality of graduate students
Target Audience Prospective graduate students
Status Ongoing

Arkansas State University 2012-2013 Enrollment Management Plan
30 | P a g e
Action Step Establish a recruiting plan for graduate student recruitment
Responsibility Graduate School, AAR, and academic colleges
Timeline Continuous
Resources Resources for technology tools to use in recruiting and for personnel to utilize these tools
Measure Enrollment growth and increase in quality of graduate students
Target Audience Prospective graduate students
Status In progress and Ongoing
Goal 1.B Continue to Promote Teaching and Learning Endeavors That Are Integral to a Global Research Institution
Action Step Better utilization of quality graduate assistants in the teaching/learning environment
Responsibility Graduate School, AAR, and academic colleges
Timeline New
Resources New GA support to place GAs in more classrooms/labs/ tutorials
Measure Faculty time on research as well as graduate student enrollment
Target Audience Graduate students
Status Ongoing
Goal 1.C Continue to Promote the Transformation of ASU Into a Research-Intensive Institution
Action Step Develop new graduate programs that help drive the selective areas of research excellence at ASU
Responsibility Graduate School, AAR, and academic colleges
Timeline Continuous
Resources Startup and operating costs for new program
Measure New graduate programs with significant research productivity of faculty and students
Target Audience Graduate students, faculty, funding organizations
Status Ongoing
INTERNATIONAL RECRUITMENT AND ENROLLMENT
Arkansas State University launched an initiative in January 2008 to expand its international recruitment
and retention efforts to enhance campus diversity and to better prepare American students for the
rigors of a globally interconnected and competitive marketplace. To help market the university in
international countries, ASU developed an international recruiting DVD and an integrated family of
marketing materials specific to international audiences. Additionally, ASU upgraded its international
website and considers this an essential component in effective international student recruiting. All of
the associated marketing materials and the international website undergo regular review and are
subject to continuous quality improvement.
ASU has developed and is expanding and improving a network of agencies/agents that have expertise in
placing well-qualified international students at public institutions of higher education in the United
States. All prospective agencies/agents must complete a questionnaire, which includes listing of
institutions it represents and associate contact information that is properly vetted by ASU before an
agent/agency is offered a contract to represent the University. As indication of the University’s
diligence, it should be noted that approximately 30 percent of the applicant agencies/agents are
rejected. Agency/agent contracts have been reviewed for proper legal form by legal counsel for the ASU
System and include, by reference and attachment, a Code of Ethics. A confirmed violation of the Code of
Ethics is considered a material breach of contract that normally results in immediate termination of the
relationship by ASU.
Arkansas State University 2012-2013 Enrollment Management Plan
31 | P a g e
In addition to using well-qualified and scrupulously honest international agents/agencies, the University
sends its own international recruiters overseas to participate in student recruiting fairs as well as
agency/agent fairs. Further, selected representatives of the University visit officials in American
Consulates and Embassies to inform them of their recruiting efforts in the respective countries and to
seek their advice and counsel on ways to improve the success rates for the issue of student visas and to
verify the performance of agencies/agents. The university places special emphasis on recruiting in those
countries that are associated with a substantial number of students attending institutions of higher
education in the United States. These countries include, but are not limited to, People’s Republic of
China, India, Japan, Turkey, Saudi Arabia, Korea, and Nepal; however, ASU will be seeking international
students from many other countries to enhance campus diversity.
Another focus of the university will be to expand and enhance its English as a Second Language (ESL)
program. ASU is seeking accreditation for the ESL Program through the Commission on Accreditation of
English Language Programs (CEA) and is taking positive and appropriate actions to hire the best and
brightest faculty to support this program. ASU recognizes that having an ESL program is critical to
providing access to educational opportunity for the many international students who lack adequate
English competency.
Arkansas State University engages in student exchange programs with various institutions of higher
education throughout the world. These exchanges are preceded by formal agreement (e.g., Memoranda
of Understanding, Twinning Agreements, and Transfer and Articulation Agreements). Such exchanges
and relationships may also inure to such things as two plus two programs in which individuals at
institutions of higher education in other countries will take the first two years of a baccalaureate
program in their home country and conclude the baccalaureate program at ASU (perhaps with a dual
degree opportunity).
From January 1, 2008, through May 1, 2011, ASU expanded the number of well-qualified international
students it serves from 127 to 1,068.Special efforts will also be engaged to help these students make the
adjustment to the American culture as well as to the rigors of academic studies in the United States.
Actions in this regard include New Student Orientation for international students, workshops and
symposia related to cultural differences, academic orientation, planned interactions with American
students, and special events. In conjunction with the above and other related and planned actions, one
of the overarching objectives of the international student recruiting initiative is to grow and keep the
international student enrollment at or near optimal level until the overall percentage of well-qualified
international students at ASU represents 7% - 10% of the total student population at the University
(excluding students enrolled in the English as a Second Language [ESL] program).
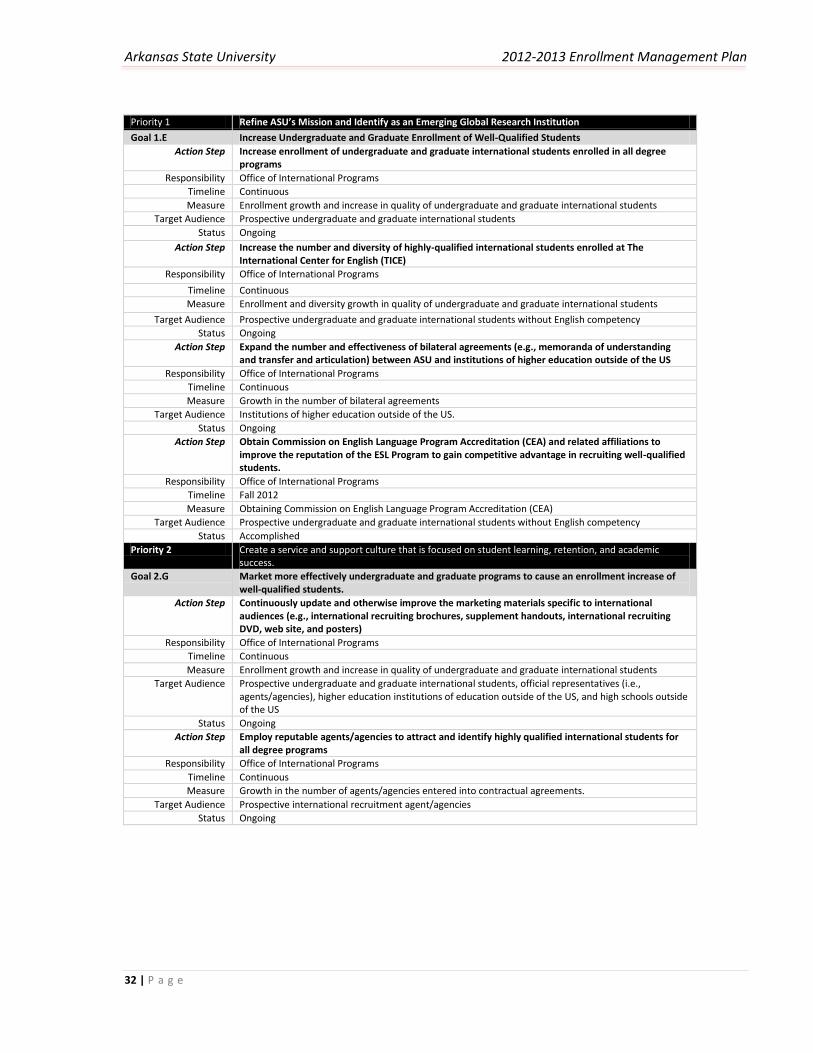
Arkansas State University 2012-2013 Enrollment Management Plan
32 | P a g e
Priority 1 Refine ASU’s Mission and Identify as an Emerging Global Research Institution
Goal 1.E Increase Undergraduate and Graduate Enrollment of Well-Qualified Students
Action Step Increase enrollment of undergraduate and graduate international students enrolled in all degree programs
Responsibility Office of International Programs
Timeline Continuous
Measure Enrollment growth and increase in quality of undergraduate and graduate international students
Target Audience Prospective undergraduate and graduate international students
Status Ongoing
Action Step Increase the number and diversity of highly-qualified international students enrolled at The International Center for English (TICE)
Responsibility Office of International Programs
Timeline Continuous
Measure Enrollment and diversity growth in quality of undergraduate and graduate international students
Target Audience Prospective undergraduate and graduate international students without English competency
Status Ongoing
Action Step Expand the number and effectiveness of bilateral agreements (e.g., memoranda of understanding and transfer and articulation) between ASU and institutions of higher education outside of the US
Responsibility Office of International Programs
Timeline Continuous
Measure Growth in the number of bilateral agreements
Target Audience Institutions of higher education outside of the US.
Status Ongoing
Action Step Obtain Commission on English Language Program Accreditation (CEA) and related affiliations to improve the reputation of the ESL Program to gain competitive advantage in recruiting well-qualified students.
Responsibility Office of International Programs
Timeline Fall 2012
Measure Obtaining Commission on English Language Program Accreditation (CEA)
Target Audience Prospective undergraduate and graduate international students without English competency
Status Accomplished
Priority 2 Create a service and support culture that is focused on student learning, retention, and academic success.
Goal 2.G Market more effectively undergraduate and graduate programs to cause an enrollment increase of well-qualified students.
Action Step Continuously update and otherwise improve the marketing materials specific to international audiences (e.g., international recruiting brochures, supplement handouts, international recruiting DVD, web site, and posters)
Responsibility Office of International Programs
Timeline Continuous
Measure Enrollment growth and increase in quality of undergraduate and graduate international students
Target Audience Prospective undergraduate and graduate international students, official representatives (i.e., agents/agencies), higher education institutions of education outside of the US, and high schools outside of the US
Status Ongoing
Action Step Employ reputable agents/agencies to attract and identify highly qualified international students for all degree programs
Responsibility Office of International Programs
Timeline Continuous
Measure Growth in the number of agents/agencies entered into contractual agreements.
Target Audience Prospective international recruitment agent/agencies
Status Ongoing

Arkansas State University 2012-2013 Enrollment Management Plan
33 | P a g e
Priority 6 Increase our diversity and expand our globalization
Goal 6.A Prepare students for global citizenship
Action Step Expand the number of ASU students and faculty members participating in academic pursuits outside of the US
Responsibility Office of International Programs
Timeline Continuous
Measure Growth in the number of faculty-led programs and affiliated programs
Target Audience Current undergraduate and graduate students and faculty members
Status Ongoing
DISTANCE LEARNING INITIATIVES
Prior to calendar year 2008, Arkansas State University did not offer any complete academic programs
online and did not have regulatory approval to offer academic programs online. Rather, ASU offered a
number of courses by distance learning with limited enrollment, but encountered increasing interest by
students in having more courses and complete academic programs offered by distance learning through
ASU. Moreover, proprietary providers of large enrollment online academic programs (e.g., University of
Phoenix, DeVry University, Kaplan University, Stryker University, and others) began to offer academic
programs and courses in Arkansas that attracted many students who previously would have
matriculated at a traditional university including ASU. Typically such courses and programs were offered
at a premium above that charged by public institutions of higher education. This created both an
opportunity and a threat that ASU needed to address with a sense of urgency or it was destined to lose
a substantial amount of enrollment and possibly the ability to offer certain academic programs as it
might not meet state mandated academic viability standards related to the number of graduates from
academic programs.
Since ASU did not have any substantial experience in marketing or offering complete academic programs
online to large audiences employing cutting edge techniques, it sought out and found a company with
the necessary expertise that offered an array of support services to academic institutions to help jump
start and ramp up its large market scale distance learning programs. After appropriate due diligence,
albeit with insufficient faculty consultation, ASU entered into a Services Agreement with Higher
Education Holdings, LLC (HEH) in April 2008, in which HEH provided necessary expertise and a first-rate
learning management system (i.e., EPIC) and ASU agreed to obtain regulatory approval for and offer
complete academic programs online. It should be noted that the Services Agreement with HEH was
modified on a number of occasions by mutual agreement of the parties and the name of the entity with
which ASU now has a Services Agreement is Academic Partnerships, LLC (AP).
After obtaining regulatory approval to offer complete academic programs online by the Board of
Trustees for Arkansas State University, the Arkansas Department of Higher Education, the Arkansas
Department of Education, and the Higher Learning Commission of the North Central Association of
Colleges and Schools, ASU began to offer with support from AP (at a discounted tuition rate), five
master’s programs through its College of Education (i.e., Masters of Education in Educational Theory

Arkansas State University 2012-2013 Enrollment Management Plan
34 | P a g e
and Practice, Masters of Education in Curriculum and Instruction, Masters of Education in Educational
Leadership, Masters of Education in Special Education P-4, and Masters of Education in Special
Education 4-12). By January 2011 these programs enrolled more than 2,000 school teachers and more
than 1,000 school teachers graduated from these programs. In the fiscal year July 1, 2010 through June
30, 2011, ASU was able to create a positive net balance of approximately $1.2 million after subtracting
all AP program delivery costs from tuition and fee revenue from students enrolled in these programs.
ASU also offers the Bachelor of Science in Interdisciplinary Studies, Educational Specialist in Educational
Leadership, Masters of Public Administration, and the Masters in Education in Gifted, Talented, and
Creative with the marketing support of AP.
ASU has obtained regulatory authority to offer the above academic programs in a limited number of
states outside of Arkansas and is engaged actively in seeking permission to do so in many other states.
This will enable the University to offer these and other approved academic programs to a growing
number of prospective students. It is expected that these programs will attract a substantial enrollment
of students that would not otherwise matriculate at ASU.
Academic courses and programs which preclude large-scale delivery due to specialized accreditation and
other reasons will be offered by ASU (as appropriate) without the assistance of AP. For example, the
College of Business now offers the AACSB accredited Masters of Business Administration online without
any non-academic support from AP. Accordingly, and for optimal advantage, ASU can offer a wide
variety of academic courses and programs online either on a large scale or a small scale as warranted. It
is expected that this will enable ASU to continue offering access to high quality academic courses and
programs by distance learning that will complement academic courses and programs offered in the
more traditional presentation format.

Arkansas State University 2012-2013 Enrollment Management Plan
35 | P a g e
STUDENT FINANCIAL SUPPORT STRATEGY Mr. Terry Finney, Director of Financial Aid and Scholarships
Arkansas State University has a long tradition of providing scholarships to high achieving, academically
qualified prospective students in their first year of college and to transfer students. ASU’s academic
scholarship program is very generous and the university maintains a level of funding consistent with
state funding. However, ASU-Jonesboro generally expends only half the dollar amount awarded by
competing in-state higher education institutions. Many of ASU’s first time entering students are from
lower income families who are first generation college students. As the costs of attending college
increase, and federal and state funding is reduced, ASU is increasingly in need of additional funding from
endowments and private funds to provide for low income and high achieving students.
In looking to the future, it is important to recognize that ASU must continue to secure funds to recruit,
enroll, and retain students who will succeed and graduate. With this in mind, financial aid funds have
been shifted to two new scholarship programs for 2011-2012 and beyond to address these needs. The
first of these new programs is the Need Based Grant Program which will help bridge the gap between
tuition, fee, and room and board costs for our neediest students. This will afford high need and high
achieving students the opportunity to attend ASU without the worry of financing their education.
The second of these new programs is the Incentive Scholarship. This program will target students who
enrolled without a scholarship and excelled at ASU after their freshman year. This will help retain those
students by rewarding excellence and providing additional funding for those who obtain at least a 3.25
grade point average.
ASU will continue to award scholarships to attract top students from the state to increase enrollment,
retention, and graduation rates.
The following strategy proposal outlines the student support goals, initiations, and action plans along
with the processes involved.
Priority 2 Create a service and support culture that is focused on student learning, retention, and academic success.
Goal 2.D Enhance Student Persistence and Academic Success
Action Step Award high achieving first-year students that will improve retention and graduation rates
Responsibility Financial Aid and Scholarships
Timeline 2011-2012
Measure Increase in scholarships recipients with at least 24 ACT and 3.25 GPA
Target Audience High school seniors
Status Ongoing
Action Step Implement ASU Need Based Grant Program for high achieving - low income students
Responsibility Financial Aid and Scholarships
Timeline 2011-2012
Measure Increased retention of students
Target Audience High school seniors
Status Ongoing
Action Step Implement ASU Incentive Based Scholarship

Arkansas State University 2012-2013 Enrollment Management Plan
36 | P a g e
Responsibility Financial Aid and Scholarships
Timeline 2011-2012
Target Audience Current students with at least 3.25 GPA
Status Ongoing
Goal 2.E Provide Opportunities to Better Understand Student Needs
Action Step Continue to automate the processes of the Financial Aid Office to remove any barriers for students to apply for and receive financial aid
Responsibility Financial Aid and Scholarships
Timeline 2011-2012
Measure Reduced walk-in office traffic and phone calls
Target Audience Current and prospective students
Status In process and ongoing
Action Step Conduct surveys to determine effectiveness of scholarship programs
Responsibility Financial Aid and Scholarships
Timeline 2011-2012
Measure Number of surveys returned
Target Audience Scholarship recipients
Status Projected 2011-2012
Priority 7 Continually improve our institutional efficacy and alignment of resources with our priorities
Goal 7.B Maintain Current and Strategically Plan for Future Infrastructure Needs
Action Step Sustain current scholarship funding levels and explore additional funding
Responsibility University Advancement, Student Affairs, Financial Aid and Scholarships
Timeline 2011-2012
Measure Additional students awarded scholarships
Target Audience High school seniors and transfer students
Status 2011-2012
Goal 7.C Expand Resources and Refine Budget Procedures
Action Step Increase endowed funds to offer additional scholarships
Responsibility University Advancement
Timeline 2011-2012
Measure Increase in the number and amount of privately funded scholarships
Target Audience Alumni and corporations
Status In process
Action Step Maintain or increase current funding level for scholarship funds
Responsibility Student Affairs, Financial Aid and Scholarships
Timeline 2011-2012
Measure Increase of students receiving scholarships
Target Audience High school seniors and current students
Status 2011-2012

Arkansas State University 2012-2013 Enrollment Management Plan
37 | P a g e
STUDENT SUCCESS AND RETENTION STRATEGY Dr. Lynita Cooksey, Associate Vice Chancellor for Academic Services Ms. Tracy Finch, Registrar Ms. Jill Simons, Director of Advisement Services
The retention and graduation rates of college students are a critical measure of institutional success.
Arkansas State University has a steadfast commitment to improving these rates which is evident by the
implementation of several initiatives suggested in the 2008 Enrollment Management Plan. ASU has
invested heavily in the success of first-year students by creating a mandatory three-credit, first-year
experience seminar for all entering first-year students. Since this implementation, ASU has noted a
positive trend in the academic standing and retention rates of first-year students. In 2009, ASU opened
the door to a full service Learning Support Center that provides tutorial assistance for general education
and high risk courses. The LSC now serves nearly 1,000 students each semester through tutoring,
supplemental instruction, and structured learning assistance programs. For Fall 2013, the Learning
Support Center will be moved to the former Graduate School which is highly visible.
Despite an institutional commitment to student success, the fact remains that the State of
Arkansas continues to report dismal college graduation rates. At 41.4%, Arkansas is 14 points below the
national six-year graduation rate of 55.9% (IPEDS, 2010). The Arkansas Legislative Task Force on Higher
Education Remediation, Retention, and Graduation Rates has called upon Arkansas institutions to raise
the average percentage of citizens holding bachelor's degrees to 27% by 2015. Arkansas currently
produces 11,186 bachelor's degrees per year. At the current rate, Arkansas will have 337,256 citizens
with bachelor’s degrees, only 22.3%, by 2015 (Access to Success Report, 2008). Arkansas will remain shy
of the number of graduates needed by the state for continued economic growth. Thus, ASU must do its
part to increase the number of students in the graduation pipeline through its diligence in promoting
student retention and success.
In response to this call to action, Arkansas State University recently organized an Academic Retention
Consortium (ARC) to review, report, and respond to the academic progress of all students including
student subpopulations (e.g., African American males). This consortium will offer the institution an
intimate look at data that will go beyond the traditional reporting methods currently utilized. This
includes a review of the D, F, and W grades reported per student each term. Studies show that students
who earn credit at a regular rate are more likely to persist in college.
In terms of credit accrual, developmental education, which offers no credit, is costly and slows student
progress to degree completion. ASU is actively engaged in the redesign of the curriculum for all
developmental education courses. These courses will offer a hybrid approach to classroom teaching by
incorporating both traditional and web-based facilitation. Other options include employing mastery-
based units to allow students the ability to self-pace their learning experience. Students will be able to
breeze through some units while spending more time focused on others.

Arkansas State University 2012-2013 Enrollment Management Plan
38 | P a g e
Another plausible way to encourage degree completion is to review new methods for which credits can
be earned and degrees can be conferred. There are a number of learners for whom the traditional
degree path is a hindrance to college completion. ASU is currently exploring the possibility of granting
prior learning experience to students. Institutions can use Prior Learning Assessment or PLA to evaluate
students learning acquired through alternative methods such as work, training, volunteer experiences,
and personal life. Prior learning credit that is awarded generally works in concert with the other
coursework students take to complete their degree. ASU is also looking into a Professional Studies
degree completion option to encourage associate degree holders, stop outs, and individuals needing a
degree merely for job advancement to consider/reconsider college completion. This flexible
degree option will offer upper-level courses in business, technology, communication as a capstone
to students' prior college credits.
These strategies are based on research and national trends and are thought to improve time to
completion of college degrees. The following strategy proposal outlines the student support goals,
initiations, and action plans along with the processes involved.
Priority 2 Create a service and support culture that is focused on student learning, retention, and academic success.
Goal 2.D Enhance Student Persistence and Academic Success
Action Step Establish ongoing, date-driven, academic retention consortium (ARC) to review persistence and graduation patterns
Responsibility AAR
Timeline Fall 2011/ongoing
Measure Improvement of persistence and graduation rates
Target Audience ASU community
Status Complete – ARC is established 2012-13
Action Step Improve developmental education success and completion rate
Responsibility UC
Timeline AY 2011-2012
Measure Improvement of completion rates
Target Audience Students needing dev. Ed.
Status In progress – Participation in CCA grant Academic Year 2012-13 results show improvements
Action Step Offer Prior Learning Assessment (PLA) opportunities
Responsibility AAR
Timeline AY 2011-2012
Measure Improvement of college completion rates
Target Audience Stop outs, transfers, adult learners needing a degree
Status Investigating
Action Step Offer a degree completion program
Responsibility UC
Timeline AY 2011-2012
Measure Improvement of college completion rates
Target Audience Students seeking alternative degree options
Status In progress – 522 en route degrees conferred/ BSIS graduation is steady climbing (FY11) 150 (FY12) 160 (FY13) 169
Action Step Enhance the academic advising pipeline from FY to graduation
Responsibility AAR
Timeline AY 2011-2012
Measure Increase students' ability to navigate degree pathways (Satisfaction inventory)
Target Audience ASU students
Status In progress – Advisor training enhanced. Master Advising Program Fall 2013. Added professional advisor to College of Media and Communications.

Arkansas State University 2012-2013 Enrollment Management Plan
39 | P a g e
Action Step Increase opportunities for high impact activities to occur across all disciplines
Responsibility AAR
Timeline AY 2011-2012
Measure Increase satisfaction, persistence and employability in academic disciplines
Target Audience ASU students
Status In progress – Common Reader for Fall 2013/ Create@astate focus now includes all disciplines in undergraduate/graduate programs/ McNair offors opportunity for research. Added programs through Honors Program.

Arkansas State University 2012-2013 Enrollment Management Plan
40 | P a g e
STUDENT SERVICES STRATEGY Dr. Lonnie Williams, Associate Vice Chancellor for Student Affairs
As members of the university community, the committee is concerned with the delivery of quality programs and services to students and constituents, and with all aspects of the student’s and constituent’s experience on campus. Attention must be given to the quality of every interaction between student or constituent and an ASU employee, hereafter referred to as the Arkansas State University Experience or ASU Experience. The ASU Experience will be a positive one (“student first” concept) for students and constituents based on the following four major areas:
Satisfaction Assessment. Conduct customer satisfaction survey of existing services. Identify gaps
where breakdowns are occurring.
Student Engagement. Using student engagement survey, identify the current level of student
involvement that exists at ASU and how student services affect that level of involvement.
Resource Allocation. Improve the quality of current student services by improving efficiency,
eliminating non-essentials and streamlining processes.
Quality Service. Deliver on the promises made to stakeholders and customers. Develop a plan to
eliminate breakdowns in the student services systems.
The following strategy proposed by the Student Services Committee outlines the student services goal,
objectives, initiatives and action plans along with the parties involved.
Priority 2 Create a service and support culture that is focused on student learning, retention, and academic success.
Goal 2.D Enhance Student Persistence and Academic Success
Action Step Increase programs and activities offered on campus during weekends
Responsibility Student Leadership Center
Timeline Fall 2011
Measure Increase number of student programs offered and traffic flow in student union on weekends by 15%
Target Audience All students
Status Accomplish by spring 2012
Action Step Make good customer service priority one for all departments
Responsibility Vice Chancellor Student Affairs and Student Affairs department directors
Timeline Complete
Measure Cover 10 tenets of customer service at Student Affairs new employee orientation and annual meeting of staff
Target Audience All constituents of the university
Status Ongoing
Goal 2.E Provide Opportunities to Better Understand Student Needs
Action Step Administer the National Survey of Student Engagement to gain information on how students spend their time and what they are gaining from the collegiate experience.
Responsibility Office of Institutional Research, Academic Affairs, and Student Affairs
Timeline November of each year
Measure Comparison of ASU student responses to the national database
Target Audience First-year and seniors
Status Ongoing
Action Step Conduct student survey to gauge student satisfaction with student programming
Responsibility Leadership Center
Timeline Ongoing
Measure Improve satisfaction level of programming by 15% annually
Target Audience All students
Status Future development

Arkansas State University 2012-2013 Enrollment Management Plan
41 | P a g e
Priority 3 Create learning experiences through student engagement, service to our region, and partnerships with our community.
Goal 3.A Increase Service-Learning and Community Engagement Opportunities
Action Step Increase opportunities for internships/work experiences with corporations and community based organizations
Responsibility Career Management Center
Timeline Ongoing
Measure 10% increase annually in number of internships/work experiences received
Target Audience All students
Status Future development, Base developed 2012-2013
Action Step Explore opportunities with community agencies and academic departments to provide internships for student engagement
Responsibility Career Management Center and individual academic departments
Timeline May 2012
Measure 10% increase annually in number of internships/work experiences received
Target Audience All students
Status Future development, Base developed 2012-2013
Action Step Continue customer service training for staff and students
Responsibility Executive Assistant to the Vice Chancellor for Student Affairs
Timeline Ongoing
Measure At least one training session per year for full-time staff and students
Target Audience All staff and part-time workers
Status Developed by October 2011, implemented by spring 2012
Action Step Develop and facilitate a self-assessment of each department within Student Affairs to determine effectiveness in addressing issues and timeliness of responses
Responsibility Vice Chancellor Student Affairs and Student Affairs department directors
Timeline Fall 2011
Measure Survey for each department completed and administered to constituents at least once a semester
Target Audience All constituents of the university
Status Future development
Priority 6 Increase our diversity and expand our globalization
Goal 6.B Develop a Service Environment that Supports the Needs of a Diverse ASU Community
Action Step Make the Multicultural Center an integral part of the campus diversity efforts
Responsibility Dean of Student Development
Timeline Ongoing
Measure 15% increase in the number of visitors to and programs offered by the Center annually
Target Audience All constituents of the university
Status Completed August 2012 and Ongoing
Action Step Develop an advisory board for the Multicultural Center
Responsibility Dean of Student Development
Timeline Fall 2011
Measure Completion by October 2011, increasing diversity of opinion on programming
Target Audience All constituents of the university
Status Completed Spring 2012

Arkansas State University 2012-2013 Enrollment Management Plan
42 | P a g e
MARKETING STRATEGY Mr. Bill Smith, Executive Director of Marketing
Competition for high-quality college-bound students is a growing global phenomenon. ASU competes
for students not only in our region but internationally as well. The major competitors for those students
include the University of Central Arkansas, University of Arkansas-Fayetteville, Arkansas Tech and to a
lesser degree, University of Arkansas-Little Rock. In addition, ASU fights to maintain their position and
prestige against the onslaught of online education providers in the marketplace. Each of these
competitors has a growing presence in the Arkansas market place, stimulated through paid advertising
and strong scholarship programs. Recently, the company who promotes ASU’s online programs signed
an agreement with the University of Arkansas to offer similar programs. This presents a threat to ASU’s
offerings as it will be difficult to differentiate from the competitor.
Historically, the marketing efforts at ASU have relied on print publications, scholarships and traditional
recruiting methods to carry out its marketing plan. During the last two years, emphasis has been placed
on integrating marketing communications throughout the university. Arkansas State has embraced the
importance of being a united front against increasingly fierce competition. Collaboration has improved
between marketing and Recruitment and the colleges themselves. University marketing reflects the
materials used by Recruitment. Advertising dollars have been directed toward outlets that focus
primarily on high potential students. Overall brand advertising still relies heavily on billboards, although
marketing took major steps in improving the quality of broadcast advertising with the addition of an in-
house videographer. Social media integration is severely lacking.
Starting in 2011, the marketing and communications department began a strategic realignment to
provide a more proactive service to university constituents and to begin to implement marketing
integration. Previously, the department reacted to customer requests by giving them what they asked
for. Now, it works with customers to create products that are “reputation building” not only for the
individual department and program but for the university as a whole. In addition, the university hired
marketing research firm Simpson Scarborough (SS) to conduct a brand research identity study. Their
research and data collected helped to begin to establish a well-defined university brand. Using this
information, ASU can now confidently initiate a strategic approach to identify and establish its
uniqueness. This study has lead to the development of a positioning plan and refinement of a brand
message.
This brand research identity study also allowed us to identify effective strategies to gain greater brand
presence, as well as the tools to enhance the university’s brand in the minds of audiences locally,
regionally, nationally, and internationally. The university is beginning to define a brand that is
distinctive, accurately portrays the mission and position of Arkansas State University, and uniquely
conveys a consistent, cohesive, comprehensive identity and message.
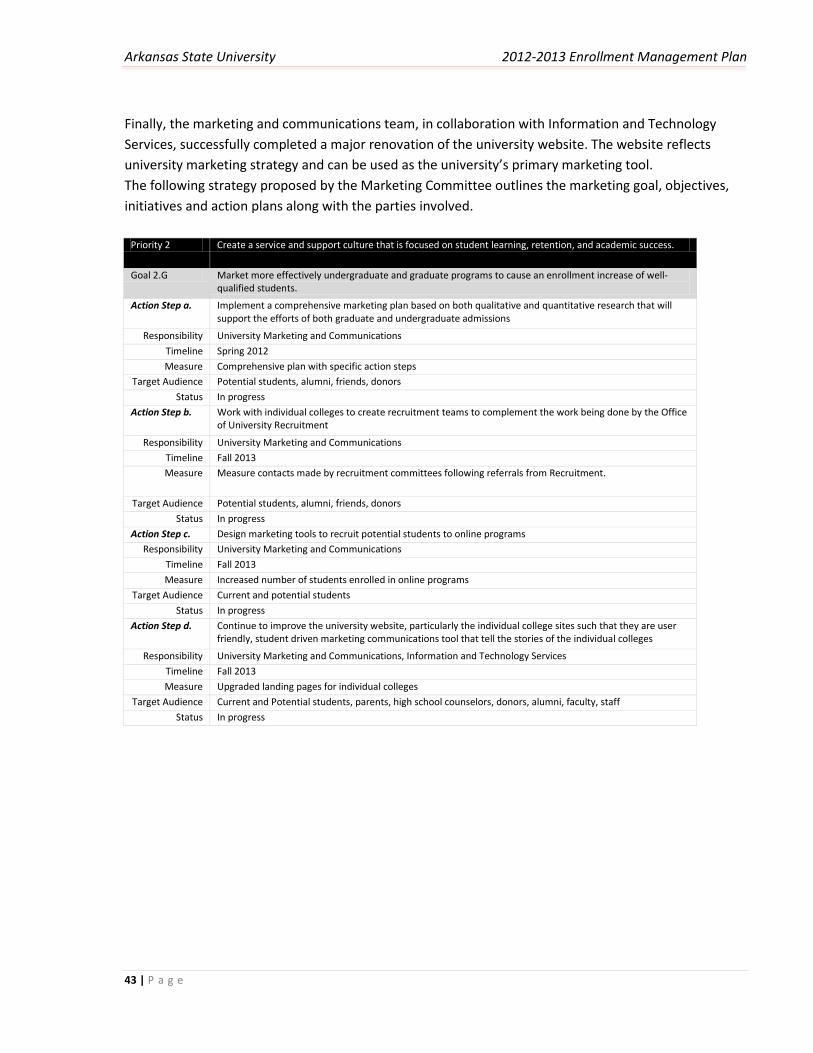
Arkansas State University 2012-2013 Enrollment Management Plan
43 | P a g e
Finally, the marketing and communications team, in collaboration with Information and Technology
Services, successfully completed a major renovation of the university website. The website reflects
university marketing strategy and can be used as the university’s primary marketing tool.
The following strategy proposed by the Marketing Committee outlines the marketing goal, objectives,
initiatives and action plans along with the parties involved.
Priority 2 Create a service and support culture that is focused on student learning, retention, and academic success.
Goal 2.G Market more effectively undergraduate and graduate programs to cause an enrollment increase of well-qualified students.
Action Step a. Implement a comprehensive marketing plan based on both qualitative and quantitative research that will support the efforts of both graduate and undergraduate admissions
Responsibility University Marketing and Communications
Timeline Spring 2012
Measure Comprehensive plan with specific action steps
Target Audience Potential students, alumni, friends, donors
Status In progress
Action Step b. Work with individual colleges to create recruitment teams to complement the work being done by the Office of University Recruitment
Responsibility University Marketing and Communications
Timeline Fall 2013
Measure Measure contacts made by recruitment committees following referrals from Recruitment.
Target Audience Potential students, alumni, friends, donors
Status In progress
Action Step c. Design marketing tools to recruit potential students to online programs
Responsibility University Marketing and Communications
Timeline Fall 2013
Measure Increased number of students enrolled in online programs
Target Audience Current and potential students
Status In progress
Action Step d. Continue to improve the university website, particularly the individual college sites such that they are user friendly, student driven marketing communications tool that tell the stories of the individual colleges
Responsibility University Marketing and Communications, Information and Technology Services
Timeline Fall 2013
Measure Upgraded landing pages for individual colleges
Target Audience Current and Potential students, parents, high school counselors, donors, alumni, faculty, staff
Status In progress

Arkansas State University 2012-2013 Enrollment Management Plan
44 | P a g e
RESOURCES AND INFRASTRUCTURE FUNDING
In support of enrollment management initiatives, a funding model for use in implementing ASU’s
Enrollment Management plan is proposed. The model recognizes the importance of obtaining new funds
as well as reallocation of current funds. Priority should be given to allocating resources to those
activities which support enrollment objectives.
1. It is proposed that departments/divisions/units will submit requests for funding based on criteria established by the ASU chancellor and vice chancellors. Funds will be distributed to those with the greatest needs and in conjunction with the recruitment and retention goals and objectives.
2. Given the decline in state support to ASU, it is recommended that consideration be given for the allocation of current resources to those units charged with implementing the plan.
3. It is recommended that all units involved in recruitment and retention initiatives seek grant
support for their new projects through external foundations and agencies.
4. It is recommended that University Advancement seek funding through development
opportunities, to establish endowments for need-based and performance-based scholarships
and to support new recruitment and retention programs.

Arkansas State University 2012-2013 Enrollment Management Plan
45 | P a g e
CONCLUSION
Arkansas State University is committed to creating a student-focused learning and service
environment. The educational mission of the university is to support the recruitment and enrollment of
students and to foster the attainment of their educational and professional goals. This will be
accomplished by developing and implementing the objectives set forth in ASU’s Enrollment
Management Plan. Enrollment management is not the sole responsibility of a single person,
department, or division; everyone who is a part of the university community plays a role in the
management of enrollment at ASU. The success of the enrollment management initiatives outlined in
this plan will depend on the contribution that everyone makes at ASU.
Oversight
The ASU chancellor and vice chancellors will be responsible for defining future recruitment, enrollment,
retention, and graduation goals for the campus; for proposing initiatives to meet the goals; and for
assessing the success of the current plan. Every action and program listed in the plan should be
evaluated annually before repeating it in subsequent years.
Next steps will include:
1. Development of new and/or alignment of existing academic and student support plans with this
plan.
2. Creation of an annual progress report.
3. Budget discussions that include the allocation of resources to implement the enrollment
management initiatives.
Arkansas State University 2012-2013 Enrollment Management Plan
46 | P a g e
ACKNOWLEDGEMENTS
Enrollment Management Plan Committee Convener
Dr. William R. Stripling, Vice Chancellor for Student Affairs
Institutional and Situational Assessment
Dr. Kathryn Jones, Director of Institutional Research and Planning
Institutional Strategic Directions
Dr. Kathryn Jones, Director of Institutional Research and Planning
Student Recruitment and Enrollment Strategy
Dr. Tammy Fowler, Director of Recruitment
Dr. Andrew Sustich, Dean of Graduate School
Mr. Tugrul Polat, Executive Assistant to the Chancellor for International Programs
Dr. Lynita Cooksey, Vice Chancellor for Academic Affairs, Provost
Student Financial Support Strategy
Mr. Terry Finney, Director of Financial Aid and Scholarships
Student Retention and Success Strategy
Dr. Lynita Cooksey, Vice Chancellor for Academic Affairs, Provost
Ms. Jill Simons, Executive Director of University College
Ms. Tracy Finch, Registrar
Student Services Strategy
Dr. Lonnie Williams, Associate Vice Chancellor for Student Affairs
Marketing Strategy
Mr. Bill Smith, Executive Director of Marketing