E DBS16 - Contactlabcontactlab.com/.../2016/10/EDBS_2016_Contactlab_Report_Excerpt.pdf · Global...
49
E + DBS16 This document and the global cross tabs are subject to copyright. Milan, October 2016 Global report - Focus on Italy EUROPEAN (+) DIGITAL BEHAVIOUR STUDY 2016 Research report presenting the results of the study conducted in April 2016, with a comparative analysis on the UK, Germany, France, Spain, Switzerland, New York, Korea, Shanghai, Tokyo, Moscow and St. Petersburg. EXCERPT
Transcript of E DBS16 - Contactlabcontactlab.com/.../2016/10/EDBS_2016_Contactlab_Report_Excerpt.pdf · Global...

E+DBS16
This document and the global cross tabs are subject to copyright.
Milan, October 2016
Global report - Focus on Italy
EUROPEAN (+) DIGITAL BEHAVIOUR STUDY 2016
Research report presenting the results of the study
conducted in April 2016, with a comparative
analysis on the UK, Germany, France, Spain,
Switzerland, New York, Korea, Shanghai, Tokyo,
Moscow and St. Petersburg.
EXCERPT

2© Copyright 2016 Contactlab
This document may not be modified, organized or reutilized in any way without the express written permission of the rightful owner.
No materials, data or information internally published for the purposes of research within the ‘European+ Digital Behaviour Study 2016’ may be reproduced, distributed, transmitted, republished or otherwise used in any way, in part or in whole, without express written permission from Contactlab.
The materials, data and information contained within the statistics tables drawn up for each participant enterprise in the study may be employed for internal usage; the publication and communication of these results outside of the enterprise in question must be agreed by Contactlab.
For more information about the Report or to request permission to reproduce results or materials, please email [email protected]
COPYRIGHT

3© Copyright 2016 Contactlab
This document may not be modified, organized or reutilized in any way without the express written permission of the rightful owner.
EDBS: A SINGLE SOURCE STUDY ON OPERATIVE DIGITAL TOPICS
AB
C
D
EF
G
H
I
E+dbs 2016:
30.500 cases
representative of 200M
+ of users |
11 markets |
90 questions |
F. E-CROSSBORDER AND EXPORT POTENTIAL
H. PROFILE & ATTITUDE
G. FASHION PURCHASES AND HIGH-END FASHION ATTITUDE
E. ECOMMERCE AND CLICK & COLLECT
B. INTERACTIVITY ONLINE AND DIGITAL ACTIVITIES
A. DEVICES AND MOBILE EVOLUTION
C. SOCIAL NETWORK AND BRAND INFLUENCE
D. DIGITAL DIRECT MARKETING AND ITS EFFECTIVENESS
Devices used in the past 4 weeks to connect to the internet (PC at home, sm.phone, tablet, sm.Tv, videogame console, etc.)
Time spent online Smartphone usage in-store to compare prices/ get prod.
information Intention to use a SmartTV/Smartphone/Tablet
General online activities (email, social media, ecommerce, home banking, multimedia, gaming, etc.)
Specific online activities (streaming, dating, job searching, e-government, QR code, etc.)
DII: Digital Interactivity index
Social accounting (FB, LinkedIn, Instagram, TW, G+, Tinder, etc.)
Brand engagement attitude via social networking (follow a brand, like/unlike, etc.)
Social login users SOI: Social Opportunity Index
Newsletter subscriptions Newsletter topics Channels for subscribing to newsletters (on brands’
websites, through self-service kiosks, etc.) Reasons for subscribing (stay up-to-date, get
exclusive benefits/ discounts, etc.) Effectiveness of newsletters vs. other channels DOI: Direct Opportunity Index
Ecommerce users and intention to shop online Products/ services bought online (27 prod/services cat.) Online shopping expenditure Information sources for online shopping Online sales channels (e-tailers, private sales, etc.) Preferred payment methods (standard c.card, PayPal, digital wallet, etc.) Click&collect use and propensity EXI: Ecommerce Expenditure Index (27 cat)
Products/ services bought online abroad Reasons for buying abroad (better prices, more choice,
etc.) Expenditure abroad Country shopped Recommendability of countries for ecommerce Country image
Sociodemographic profile (gender, age, geographical area, occupation, education, hh composition, age of children)
Offline buyer of: clothing/ footwear, cosmetics, tech products, holidays
I. CONSUMER SEGMENTATIONAND INDEXES
DII: Digital Interactivity Index DOI: Direct Opportunity Index SOI: Social Opportunity Index EXI: Ecommerce Expenditure Index FSI: Fashion Spending Index LAI: Luxury Attitude Index LCI: Luxury Consumption Index
Online/ offline fashion behaviour Target affluent behaviour Fashion concept evolution Luxury brand awareness/ attractiveness (27) LAI: Luxury Attitude Index LCI: Luxury Consumption Index
4© Copyright 2016 Contactlab
This document may not be modified, organized or reutilized in any way without the express written permission of the rightful owner.
EDBS AS A KNOWLEDGE SYSTEM
The 2016 edition of the EDBS is enriched by a new set of reports, segmentations and indexes reflecting the different
dimensions of users' online experience, and their attitude and consumption of high-end goods.
GOALS
• DECISION-MAKING AND FORECASTING IN BUSINESS
• Digital trends in European and Extra-European market areas (11)
• Decision-making in ecommerce categories (27)
• DECISION-MAKING AND FORECASTING IN THE FASHION INDUSTRY
• Fashion trends in European and Extra-European market areas (11)
• Online shopping experience drivers (9)
• Luxury brand positioning (27)
• MERCHANT’S DB PROFILING
• Profiling on digital clusters and indexes
• Affluent target calculation
• Sociodemographic segmentation
• Benchmarking on digital and socio-demo
SearchOutputs
Reports on internet and ecommerce
• EDBS+ SCENARIO
• EDBS+ FASHION
• EDBS+ TRAVEL
• EDBS+ FOOD
• EDBS+ OTHER ON DEMAND
Cross-industry Indexes
• DII: Digital Interactivity Index
• DOI: Direct Opportunity Index (opportunity to engage via newsletter)
• SOI: Social Opportunity Index (opportunity to engage via social network)
• EXI: Ecommerce Expenditure Index (on 27 cat)
Indexes for fashion industry
• FSI: Fashion Spending Index (online/offline)
• LAI: Luxury Attitude Index
• LCI: Luxury Consumption Index
• Luxury brands positioning (awareness/ attractiveness of 27 main brands in 11 market
areas)

5© Copyright 2016 Contactlab
This document may not be modified, organized or reutilized in any way without the express written permission of the rightful owner.
EDBS KNOWLEDGE SYSTEM: CROSS-INDUSTRY INDEXES
Dimension Cluster Index Goal
Online activities
1. Hyper-actives ++
2. Hyper-actives +
3. Actives
4. Passives -
5. Passives - -
► DII - Digital Interactivity
Index
• Find out how interactive your customers are online
• Identify the most effective means to communicate
and interact with them
• Understand the trade-off between advanced
solutions and digital education
Digital direct communication impact (opportunity to engage via newsletter)
1. Committed
2. Open
3. Passive
4. Opportunistic
5. Not disturb
6. Unaware
► DOI - Direct Opportunity
Index• Gain a detailed understanding of the relationship
between the direct channel (newsletter) and the
social media channel
• Calculate engagement opportunities through
owned media
• Help define the digital media plan Brand relationship via social network (opportunity to engage via social network)
1. Committed
2. Open
3. Passive
4. Not disturb
5. Non user
► SOI - Social Opportunity
Index
Online expenditure on different
products/ services (27 categories)
1. High
2. Medium
3. Low
► EXI - Ecommerce
Expenditure Index
• Quantify your industry’s online expenditure
• Identify trends with regards online spending
capacity

6© Copyright 2016 Contactlab
This document may not be modified, organized or reutilized in any way without the express written permission of the rightful owner.
EDBS KNOWLEDGE SYSTEM: LUXURY INDUSTRY INDEXES
Dimension Cluster Index Goal
Fashion spending(online and/or offline purchase of fashion products)
1. High
2. Medium
3. Low
► FSI – Fashion
Spending Index
• Quantify (online/ offline) spending on fashion
products
High-end brands relationship(category attitude)
1. High-end lover
2. High-end assayer
3. High-end selector
4. High-end skeptic
5. High-end resistant
► LAI - Luxury
Attitude Index
• Identify targets respecting the affinity to/
distance from brand high-end products
• Drive segmentation for direct communication
Fashion luxury consumption(category attitude AND product buying)
1. Luxury staunch
2. Luxury committed
3. Luxury selector
4. Luxury detached
► LCI – Luxury
Consumption
Index
• Calculate an affluent target
• Identify trends

7© Copyright 2016 Contactlab
This document may not be modified, organized or reutilized in any way without the express written permission of the rightful owner.
GLOBAL REPORT INDEX
EXECUTIVE SUMMARY FOR ITALY
ANALYSIS:
DIGITAL CLUSTERS AND INDEXES
INTERNET AND ECOMMERCE SCENARIO
DEVICE AND MOBILE EVOLUTION
LEVEL OF INTERACTIVITY ON THE INTERNET: ONLINE ACTIVITIES
SOCIAL NETWORKING AND BRAND INFLUENCE
DIGITAL DIRECT MARKETING
ECOMMERCE
(Available in the full report: "e-crossborder and the attractiveness of Italian ecommerce" , "fashion purchases and high-end fashion attitude"
METHODOLOGICAL NOTES

EXECUTIVE SUMMARY
Italy

9© Copyright 2016 Contactlab
This document may not be modified, organized or reutilized in any way without the express written permission of the rightful owner.
EUROPEAN (+) DIGITAL BEHAVIOUR STUDY
Report 2016The rate of smartphone adoption by Italians is growing at almost double the rate of internet use, itself growing at 6%
In Italy in 2016, the number of individuals regularly using the internet (almost one time per week) reached 30,5 million, with
penetration among 16-65 y.o. of 78%.
Despite a +6% increase in the past 12 months, Italy remains significantly behind other European+ countries, with the UK and
Germany in first place.
The increase of internet users in Italy has resulted primarily from smartphone use (+13%), which has led to users connecting to
the internet increasingly frequently, confirming the default position of ‘always on’ already recognised in 2015.
69% of internet users are in fact mobile users; ‘triple players’ (users who connected to the internet with their smartphone/
tablet/ pc), reached 19%, confirming the strong trend for growth noted in recent years (2015: 15%; 2014: 10%; 2013: 6%).
Despite a slight fall in use, desktop/laptop pc remains the standard primary device, used in the last month by 83% of users.
In 2016, SmartTv passed the 10% threshold, almost doubling with respect to 2015. There is significant interest in SmartTv –
12% of users intend to adopt it in the next 12 months (47% in an unspecified timeframe) – but the market offer is ineffective in
converting users.
Internet use is still “basic”, though online shopping and home banking saw a significant increase
The use of smartphones to connect to the internet is still growing. Likewise, the number of activities carried out regularly
(weekly) on this device is rising.
With regards online activities, there was a considerable rise in online shopping (+38% on 2013) and home banking (+18% on
2013).
Italian internet users remain ‘basic’, with an interactivity index (0-100) of 39, a score significantly lower than the other EU+
countries (UK 51, ES 49).
INTERNET USE IN ITALY: RISE PRIMARILY DUE TO EXPONENTIAL INCREASE IN THE USE OF
MOBILE DEVICES

10© Copyright 2016 Contactlab
This document may not be modified, organized or reutilized in any way without the express written permission of the rightful owner.
EUROPEAN (+) DIGITAL BEHAVIOUR STUDY
Report 2016
THE OPPORTUNITY TO ENGAGE DIGITALLY THROUGH OWNED MEDIA
Report 2016Social media as an engagement opportunity has now spread to different platforms
The use of social networks remains pretty much stable over the last 12 months with about 80% penetration.
The opportunity to engage Italian users through social networks is slightly lower than in the rest of Europe; nonetheless almost
1 in 5 Italian internet users has a relationship that can be defined as “committed" with brands on social networks while overall,
37% are “open" towards communication from and “with” brands on s.n.
As regards the most popular social networks, Facebook confirms its number 1 position (82%), followed by Google+ (49%) and
YouTube (46%). Google+ and Instagram registered the highest growth over the last 36 months.
There has been a significant rise over the last 12 months for products/brands pages on Facebook as drivers of online
purchases.
The “social network login” (using an existing social account to register to another site) maintains its relevance both in Italy (with
a 29% of users) and in the other EU+ countries (used, on average, by 1 in 5 users).
Direct marketing is recognized as the most effective communication channel
Newsletter services confirm their role as the main channel by which users can stay up-to-date with brands.
This communication channel represents even more a starting point for purchases (online or offline): 65% of newsletter users
often or sometimes buy the products featured in the messages in physical stores (+3% on 2015), while half of users purchase
online from links within newsletters (+19% on 2015).
The opportunity to engage Italian users through direct marketing is also slightly lower than in the rest of EU+; nonetheless one
third of users have a neutral attitude toward this channel, an attitude that can with little effort be turned in an open one,
characterized by more active and engaged behaviours.

11© Copyright 2016 Contactlab
This document may not be modified, organized or reutilized in any way without the express written permission of the rightful owner.
EUROPEAN (+) DIGITAL BEHAVIOUR STUDY
Report 2016
ONLINE SHOPPING: PENETRATION AND EXPENDITURE INCREASING WITH FURTHER POTENTIAL FOR
GROWTH
Report 201647% of internet users are online shoppers, and they spend 1,600€ online each year
Penetration of online shopping among internet users in Italy continues to grow, landing at 47%. Even though 14,3 million
people shop online, the full potential has not yet been reached.
Average online spending grew by more than 30%, reaching 1.600 € per year: the almost 2 million "ecommerce newbies"
contributed to this growth.
PayPal and prepaid credit cards remain the preferred payment methods for online purchases, preferred by 57% and 52% of
users respectively.
As regards the drivers of online purchases, the starting point for collecting information on the desired product/service remains
the brand website; more detailed information is then acquired from ecommerce portals with products specifications or from
reviews on specialized websites.
For their purchases, Italian online shoppers mainly use ecommerce portals with various product categories. This type of online
channel has a lower usage in the other EU areas, where the first place is held by sites of retailers that also have physical
shops.
The fashion sector maintains its first position among goods/services categories bought online
7,3 million individuals (+1,6 million on 2015), equal to 51% online shoppers, chose to buy online products belonging to this
category.
Second and the third position also remain unchanged over the last 12 months: 2nd place is held by transport tickets (6,3 million
individuals), and 3rd place is tech products/ home electronics (5,4 million buyers).

12© Copyright 2016 Contactlab
This document may not be modified, organized or reutilized in any way without the express written permission of the rightful owner.
EUROPEAN (+) DIGITAL BEHAVIOUR STUDY
Report 2016
TRENDS IN THE DIGITAL ARENA
Report 2016 In the main European countries (UK, Germany, France, Spain), internet penetration reached 94%. With a linear trend based
on data from previous years, we expect this threshold to be reached in Italy over the next 4 years.
According to this forecast, there will be 37 million 16-65 y.o. Italian internet users, meaning 6.7 million new regular users.
As regards ecommerce, the average penetration of online shoppers in Europe is 78% (84% among internet users). Taking
into consideration the current distribution of online shoppers and past trends, a longer period is needed to reach this threshold.
The use of click&collect grew slightly for all the categories analysed. Nevertheless, this growth does not mirror the high level
of interest in purchasing with this method, recorded both in 2015 and 2016. There is huge potential in this interest.
The use of smartphone among Italian internet users is slightly below the European average. If trends recorded over the past
36 months continue and the behaviours of people who are not already mobile users are further consolidated, in 3 years
smartphones will be used by more than three-quarters of Italian internet users.

13© Copyright 2016 Contactlab
This document may not be modified, organized or reutilized in any way without the express written permission of the rightful owner.
THE DIGITAL INTERACTIVITY INDEX – INTERNATIONAL VIEW
IT UK DE FR ES CH NY* KR* Shanghai* Tokyo*Moscow/
St. Pet.*
►DII
Digital Interactivity Index39 51 46 45 49 45 55 53 61 40 53
hyper-actives + + 13 36 26 27 39 21 44 40 59 18 39
hyper-actives + 17 21 22 17 16 22 17 22 19 15 27
actives 23 18 19 21 17 24 18 18 9 17 21
passives - 22 12 16 14 11 17 12 11 8 20 10
passives -- 25 13 17 21 17 16 9 9 5 30 3
*for these countries the total sample always refers to online shoppers
39 51 46 45 49 45 55 53 61 40 53
13 36 26 27 39 21 44 40 59 18 39
17 21 22 17 16 22 17 22 19 15 27
23 18 19 21 17 24 18 18 9 17 21
22 12 16 14 11 17 12 11 8 20 10
25 13 17 21 17 16 9 9 5 30 3

14© Copyright 2016 Contactlab
This document may not be modified, organized or reutilized in any way without the express written permission of the rightful owner.
OPPORTUNITY TO ENGAGE VIA NEWSLETTERS/ SOCIAL NETWORKS – INTERNATIONAL VIEW
IT UK DE FR ES CH NY* KR* Shanghai* Tokyo*Moscow/
St. Pet.*
►DOI - Direct
Opportunity Index42 47 43 43 42 43 53 44 58 41 52
Committed 4 9 6 5 7 4 19 7 35 7 9
Open 19 33 22 27 28 22 35 37 32 23 39
Passive 33 23 26 25 20 32 14 12 2 21 23
Opportunistic 1 3 1 1 1 3 2 1
Not disturb 21 8 27 22 10 27 5 8 3 18 15
Unaware 22 27 16 20 35 14 26 33 28 29 13
►SOI - Social
Opportunity Index21 24 20 23 27 22 27 22 34 16 26
Committed 19 27 16 22 29 20 31 18 36 11 28
Open 18 23 21 22 26 22 23 29 42 17 26
Passive 33 24 32 27 31 33 26 38 20 31 34
Opportunistic 8 12 16 12 9 12 12 7 1 9 7
Non users 22 14 15 17 5 13 8 8 1 32 5
*for these countries the total sample always refers to online shoppers
21 24 20 23 27 22 27 22 34 16 26
19 27 16 22 29 20 31 18 36 11 28
18 23 21 22 26 22 23 29 42 17 26
33 24 32 27 31 33 26 38 20 31 34
8 12 16 12 9 12 12 7 1 9 7
22 14 15 17 5 13 8 8 1 32 5
42 47 43 43 42 43 53 44 58 41 52
4 9 6 5 7 4 19 7 35 7 9
19 33 22 27 28 22 35 37 32 23 39
33 23 26 25 20 32 14 12 2 21 23
1 3 1 1 1 3 2 1
21 8 27 22 10 27 5 8 3 18 15
22 27 16 20 35 14 26 33 28 29 13

15© Copyright 2016 Contactlab
This document may not be modified, organized or reutilized in any way without the express written permission of the rightful owner.
FASHION AND AFFLUENT SEGMENTATION – INTERNATIONAL VIEW
IT UK DE FR ES CH NY* KR* Shanghai* Tokyo*Moscow/
St. Pet.*
►Fashion spending
Online/offline
High
Medium
Low
►LAI -
Luxury Attitude Index43 47 47 46 46 43 55 52 64 47 49
High-end experience lover 13 22 18 21 21 12 39 21 56 17 24
High-end assayer 12 15 16 13 15 12 17 23 20 14 14
High-end selector 43 37 41 37 38 43 30 45 20 49 39
High-end skeptic 14 9 11 11 10 13 7 5 3 8 12
High-end resistant 18 17 14 18 16 20 7 6 1 12 11
*for these countries the total sample always refers to online shoppers
43 47 47 46 46 43 55 52 64 47 49
13 22 18 21 21 12 39 21 56 17 24
12 15 16 13 15 12 17 23 20 14 14
43 37 41 37 38 43 30 45 20 49 39
14 9 11 11 10 13 7 5 3 8 12
18 17 14 18 16 20 7 6 1 12 11
18 29 27 26 32 31 49 39 65 30 28
30 37 45 37 36 38 32 33 26 29 36
52 34 28 37 31 31 19 28 10 41 35

16© Copyright 2016 Contactlab
This document may not be modified, organized or reutilized in any way without the express written permission of the rightful owner.
LUXURY CONSUMPTION INDEX – INTERNATIONAL VIEW
IT UK DE FR ES CH NY* KR* Shanghai* Tokyo*Moscow/
St. Pet.*
►LCI
Luxury Consumption
Index
49 59 59 58 63 55 74 66 86 58 60
Staunch 14 29 24 26 30 17 47 31 67 25 26
Committed 15 15 18 15 20 20 19 24 16 18 18
Selector 23 22 30 24 22 29 18 22 12 22 24
Detached 48 35 28 35 27 35 17 22 5 35 31
*for these countries the total sample always refers to online shoppers
16
13
41
13
17
H-Experience lover
H-Assayer
H-Selector
H-Skeptic
H-Resistant
LCIluxury consumptionindex and clusters
EXPENDITURE ON FASHION
HIGH MEDIUM LOW
49 59 59 58 63 55 74 66 86 58 60
14 29 24 26 30 17 47 31 67 25 26
15 15 18 15 20 20 19 24 16 18 18
23 22 30 24 22 29 18 22 12 22 24
48 35 28 35 27 35 17 22 5 35 31

INTERNET AND E-COMMERCE SCENARIO
• The spread of the Internet in Europe – Last 5 years*
• Online shoppers last 12 months in Europe – Last 5 years
• E+DBS16 universes – Regular Internet users and online shoppers in Italy
• E+DBS16 represented universes: Europe and extra-EU areas
• E+DBS16 represented universes in Europe: trends
*The sections denoted in light grey are part of the full report only

*Definition by “Eurostat – Information Society”: frequency of internet access: once a week (including every day). Users 16-74 y.o.
Only for Switzerland , the value for 2015 is an estimate by Contactlab based on the official BFS/ Eurostat data
THE SPREAD OF INTERNET IN EUROPE – LAST 5 YEARSSource: EUROSTAT* data processed by Contactlab
81
84
8789 90
82 8385 86 86
77 7880
8284
74
78
8081
61
65 66
71
75
5153
56
59
63
30
40
50
60
70
80
90
100
2011 2012 2013 2014 2015
UK
CH
DE
FR
ES
IT
+2,9%
is the average growth of
internet pop in Europe +
from 2014 to 2015

19© Copyright 2016 Contactlab
This document may not be modified, organized or reutilized in any way without the express written permission of the rightful owner.
* Source: “Eurostat – Information Society”: Last online purchase in the 12 months, % of individuals 14-74 y.o.
ONLINE SHOPPERS LAST 12 MONTHS IN EUROPE – LAST 5 YEARSSource: EUROSTAT* data processed by Contactlab
7173
7779
81
5659
6467
69
64 65
69 70
73
53
5759
6265
2730
32
37
42
1517
2022
26
0
10
20
30
40
50
60
70
80
90
100
2011 2012 2013 2014 2015
UK
CH
DE
FR
ES
IT
+7,7%
The average amount
ecommerce rose in
Europe+ between 2014
and 2015

20© Copyright 2016 Contactlab
This document may not be modified, organized or reutilized in any way without the express written permission of the rightful owner.
E+DBS16 REPRESENTED UNIVERSE - REGULAR INTERNET USERS AND ONLINE SHOPPERS IN ITALYSource: EUROSTAT ICT/ ContactLab
100%
78%
36%
Total
national
population
Regular
internet users
(weekly)
Online
shoppers
(at least one
product in the last
12 months)
Individuals
16-65 years old (.000)39.400 30.500 14.300
100% 78% 36%

21© Copyright 2016 Contactlab
This document may not be modified, organized or reutilized in any way without the express written permission of the rightful owner.
E+DBS16 UNIVERSES: EUROPE AND EXTRA-EU AREASSource: EUROSTAT/ National bureaus of statistics for each country, data processed by Contactlab
ITALY(.000)
UK(.000)
GERMANY(.000)
FRANCE(.000)
SPAIN(.000)
SWITZERLAND(.000)
Nr of interviews n=22.,588 n=1,000 n=1,001 n=1,002 n=1,004 n=1,001
Total population 16-65 39,400 41,900 53,600 41,800 30,900 5,500
Internet population (16-65) 30,500 41,000 51,700 37,600 28,000 5,300
Online shoppers (16-65) 14,300 38,100 47,500 33,000 18,000 4,700
New York(.000)
Korea(.000)
Shanghai(.000)
Tokyo (.000)
Moscow/ St. Pet(.000)
Nr of interviews n=473 n=475 n=437 n=462 n=1.049
Total population 16-65 8,400 37,600 19,600 8,900 12,600
Online shoppers (16-65) 6,600 25,700 11,300 6,500 5,800
Tot. USA Tot. China Tot. Japan Tot. Russia
Online shoppers (16-65) 252,000 370,400 79,000 26,000

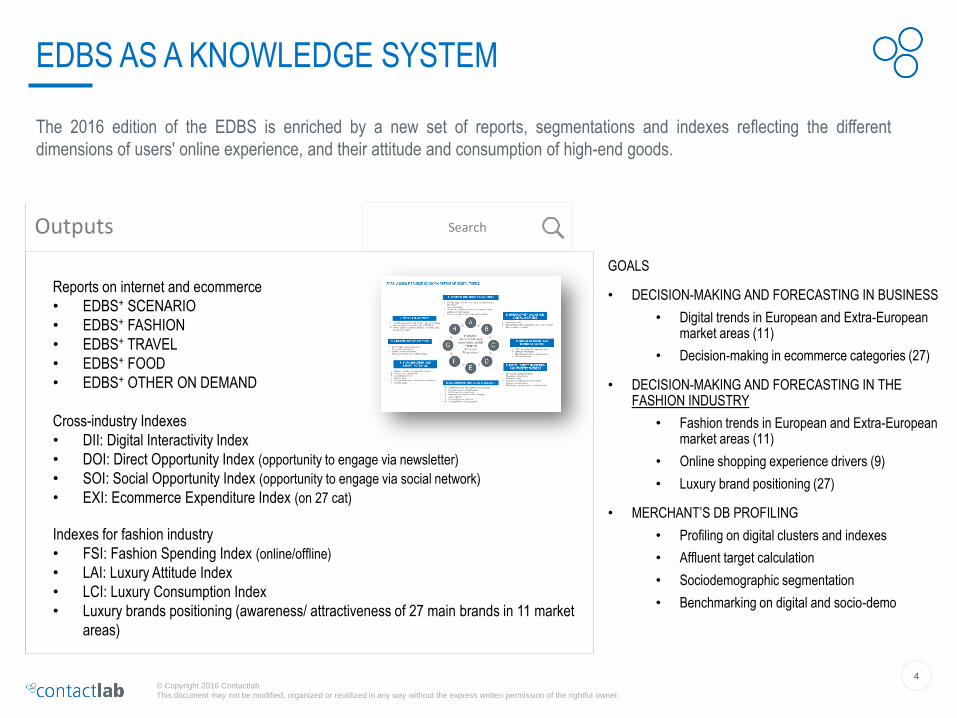
DEVICE AND MOBILE EVOLUTION
• Internet devices (connecting for personal reasons) – last 4 weeks (eu)*
• Internet device evolution (it)
• Access to the internet: always online vs connection when needed
• Time spent online during a regular day
• Italy: device overlapping & mobile segments - last 4 weeks
• Device and mobile evolution – worldwide overview
• Non-smart tv users: intention to adopt in the near future
• Non-smartphone users: intention to adopt in the near future | forecast to 2018
• Non-tablet users: intention to adopt in the near future | forecast to 2018
*The sections denoted in light grey are part of the full report only
23© Copyright 2016 Contactlab
This document may not be modified, organized or reutilized in any way without the express written permission of the rightful owner.
% var 2013 VS 2016:
-13% +121% +138% +450%
% var 2015 VS 2016:
-8% +13% +29% +83%
INTERNET DEVICE EVOLUTIONBase: total internet users 16-65 y.o., %
76
62
31
11
83
55
24
6
82
42
19
3
87
28
13
2
PC/ laptop from home Smartphone Tablet SmartTv
2016 (n=22.588) 2015 (n=16.344) 2014 (n= 20.258) 2013 (n= 57.336)

24© Copyright 2016 Contactlab
This document may not be modified, organized or reutilized in any way without the express written permission of the rightful owner.
5
3
4
35
53
I think I will start to use onewithin the next 3 months
I think I will start to use one in3 - 6 months
I think I will start to use one in6 - 12 months
I think I will start to use one,but I do not know when
No, I do not think that I willconnect to the Internet in this
way
47
total
prospect
12
Next 12
months
(non users/ owners smartTv, n=16.343)
11
17 72
SmartTv last 4 weeks users
SmartTv occasional users
Non users
NON-SMART TV USERS: INTENTION TO ADOPT IN THE NEAR FUTUREBase: total internet users 16-65 y.o., n=22.588; %
Thinking about the use of a smart Tv, which of the following statements is true for you?

LEVEL OF INTERACTIVITY ON THE INTERNET: ONLINE ACTIVITIES
• Interactivity level – last 36 months trend (it)*
• Interactivity level
• Main online activities carried out yearly (total users - eu)
• Main online activities carried out yearly - last 36 months trend (it)
• Other online activities - last 4 weeks (eu)
• Smartphone: main activities carried out online weekly (eu)
• Smartphone: main activities carried out online weekly - last 24 months trend (it)
• Use of the smartphone in stores to compare prices (often+sometimes) (trend it)
• Main online activities weekly - worldwide overview
*The sections denoted in light grey are part of the full report only

INTERACTIVITY LEVEL – LAST 36 MONTHS TRENDBase: total internet users 16-65 y.o., %
DII - Digital Interactivity
Index (0-100)39 37 36 35
25
22
23
17
13
2016 (n=22.588)
hyper-actives + +
hyper-actives +
actives
passives -
passives -- 27
21
22
17
13
2015 (n=16.334)
28,7 M individuals
28
24
23
14
11
2014 (n=20.258)
29
25
21
15
10
2013 (n=57.336)
30,5 M individuals
26,5 M individuals
25,0 M individuals
14,3 M
9,2 M
7,0 M
13,8 M 13,5 M
6,3 M6,6 M
6,1 M 5,2 M
13,8 M
8,6 M
6,3 M

27© Copyright 2016 Contactlab
This document may not be modified, organized or reutilized in any way without the express written permission of the rightful owner.
INTERACTIVITY LEVELBase: total internet users 16-65 y.o., %
DII - Digital Interact.
Index (0-100)39 51 46 45 49
25
1317
2117
22
12
1614
11
23
18
1921
17
17
21
22 17
16
13
36
26 27
39
ITALY (n=22.588) UK (n=1.000) GERMANY (n=1.001) FRANCE (n=1.002) SPAIN (n=1.004)
hyper-actives + +
hyper-actives +
actives
passives -
passives --

28© Copyright 2016 Contactlab
This document may not be modified, organized or reutilized in any way without the express written permission of the rightful owner.
ecommerce
SMARTPHONE: MAIN ACTIVITIES CARRIED OUT ONLINE WEEKLYBase: smartphone users 16-65 y.o. (It 62%, Uk 69%; De 65%; Fr 61%, Es 66%) %
82
75
68
54
47
36
30
24
18 17
83
76
68
42
46
42
52
34
19
35
79
72
64
49 48
37
3235
12
27
80
73
57
42
49
3336 37
15
20
85 84
63
5552
41
49
37
19
27
Email Socialnetworking
News Information onproducts/services
Multimediaentertainment
Sports &hobbies
Home-banking efinance online
Online gaming E-learning/onlineeducation
Online shopping
ITALY (n=13.990) UK (n=691) GERMANY (n=652) FRANCE (n=612) SPAIN (n=667)

29© Copyright 2016 Contactlab
This document may not be modified, organized or reutilized in any way without the express written permission of the rightful owner.
MAIN ONLINE ACTIVITIES WEEKLY – WORLDWIDE OVERVIEWBase: total internet users 16-65 y.o., %
U M/stPt.: 5,8 M*
U SH: 11,3 M*
U NY: 6,6M*U: 5,3 M
U: 51,7 MU: 41,0 M
U: 30,5 MU: 28,0 M
U: 37,6 M
*In
NY
, KR
, Sha
ngha
i, T
okyo
, Mos
cow
/St.
Pet
the
tota
lsam
ple
alw
ays
refe
rsto
onl
ine
shop
pers
U : 25,7 M*
IT UK DE FR ES CH NY KR Shanghai TokyoMoscow/
St. Pet.
% % % % % % % % % % %
Email 84 90 89 90 90 91 90 86 74 87 96
Reading news 64 68 60 54 64 61 67 76 73 59 85
Social networking 63 70 63 68 82 64 70 66 73 49 85
Info. on prod./services 45 43 40 38 53 31 41 47 53 54 69
Multimedia entertainment 41 47 39 43 47 38 52 52 61 35 63
Sports & hobbies 32 43 28 25 41 23 40 37 47 42 38
Home banking 29 60 42 40 52 28 46 50 38 18 19
Online gaming 22 31 28 33 33 24 37 41 44 25 40
E-Learning 16 17 8 11 19 11 22 21 30 8 13
Online shopping 12 39 22 16 32 14 41 48 47 29 21
DII - Digital Interactivity Index (0-100) 39 51 46 45 49 45 55 53 61 40 53
U Tokyo: 6,5 M*

SOCIAL NETWORKING AND BRAND INFLUENCE
• Main online activities carried out yearly: focus on social networking*
• Social networking: distribution of accounts by all users (it)
• Social networking: distribution of main accounts by all users - last 36 months trend (it)
• Brand engagement via social network - ways of interacting (it)
• SOI: the social opportunity index (the opportunity to engage via social media)
• Spread of the "social login" - last 36 months trend
• Social networking - worldwide overview
*The sections denoted in light grey are part of the full report only

31© Copyright 2016 Contactlab
This document may not be modified, organized or reutilized in any way without the express written permission of the rightful owner.
SOCIAL NETWORKING: DISTRIBUTION OF ACCOUNTS BY ALL USERS Base: social network users 16-65 y.o., (78%); %
82
49
46
38
34
33
32
23
22
14
13
11
7
4
3
2
2
1
Google+
Youtube
Amazon
Paypal
Microsoft/ Windows Live ID
Yahoo
Telegram
Snapchat
Flickr
MySpace
Foursquare
Tinder
Happn
ITALY (n=17.546)
On which of the following sites do you have an account?

32© Copyright 2016 Contactlab
This document may not be modified, organized or reutilized in any way without the express written permission of the rightful owner.
Social Opportunity Index
(SOI)21 24 20 23 27
SOI: THE SOCIAL OPPORTUNITY INDEX (OPPORTUNITY TO ENGAGE VIA SOCIAL MEDIA)Base: total internet users 16-65 y.o., %
2214 15 17
5
8
1216 12
9
33
24
32
27
31
18
23
21
22
26
1927
1622
29
ITALY (n=22.588) UK (n=1.000) GERMANY (n=1.001) FRANCE (n=1.002) SPAIN (n=1.004)
Committed
Open
Passive
Not disturb
Non user

33© Copyright 2016 Contactlab
This document may not be modified, organized or reutilized in any way without the express written permission of the rightful owner.
SPREAD OF THE "SOCIAL LOGIN" – LAST 36 MONTHS TRENDBase: social network users 16-65 y.o., %
2016 2015 2014 2013 2016 2015 2014 2013 2016 2015 2014 2013 2016 2015 2014 2013 2016 2015 2014 2013
(n=17.546) (n=12.552) (n=15.759) (n=41.638) (n=856) (n=894) (n= 950) (n= 1.004) (n=846) (n=833) (n= 850) (n= 869) (n=835) (n=821) (n= 827) (n= 825) (n=951) (n=946) (n= 927) (n= 941)
…To use my social network account to subscribe automatically to another website
(e.g. using Facebook Connect, Twitter Login or Google+ sign-In, etc.)
29
25 2526
2523
13
24
2018
16
12
20
13
19
1211
14
1113
ITALY UK GERMANY FRANCE SPAIN

DIGITAL DIRECT MARKETING
• Number of active email addresses*
• Email providers
• Newsletter subscriptions
• Main newsletter topics (it)
• Newsletter topics (eu)
• The newsletter attitude
• Online vs offline channel for subscribing to newsletters
• Benefits sought for subscribing to newsletters
• Responses to communication from newsletters
• DOI: the direct opportunity index (the opportunity to engage via newsletter)
• Digital direct marketing - worldwide overview
• Effectiveness of different communication methods used by brands/ companies
*The sections denoted in light grey are part of the full report only

35© Copyright 2016 Contactlab
This document may not be modified, organized or reutilized in any way without the express written permission of the rightful owner.
18
5
8
22
16
13
10
8
I am not subscribed to any newsletters
1 newsletter
2 different newsletters
3/4 different newsletters
5/6 different newsletters
7/10 different newsletters
10/20 different newsletters
more than 20 different newsletters
ITALY (n=21.647)
NEWSLETTER SUBSCRIPTIONSBase: email users 16-65 y.o. (96%); %
• Newsletter users on
internet users:
– 78
– 73
– 84
– 80
– 65
• Avg. nr. =
– 5,6
– 4,8
– 6,7
– 6,4 – 4,1
82%
newsletter users(on email users)
Now we’ll refer to emails that are sent periodically from brands, business, organizations after a user has subscribed.
These types of emails will all be defined as newsletters.
Thinking about all of the email you receive, how many different newsletters are you subscribed to?

36© Copyright 2016 Contactlab
This document may not be modified, organized or reutilized in any way without the express written permission of the rightful owner.
RESPONSES TO COMMUNICATION FROM NEWSLETTERSBase: newsletter users 16-65 y.o., (78%), %
11
13
8
7
54
37
35
21
when I receive an offer in a newsletter, Igo to the store and buy the products /
services reported in the message
I buy online (…) from a link within the newsletter
I forward a newsletter to a friend if Ithink he/she might be interested
I share a newsletter on social networks,when it contains interesting promotions
Yes, often Yes, sometimes
TOP2
(often+sometimes)
2016 2015
65 63
50 42
43 n.a.
28 28
Thinking about newsletters, in which of the following situations do you recognize yourself?

37© Copyright 2016 Contactlab
This document may not be modified, organized or reutilized in any way without the express written permission of the rightful owner.
DOI: THE DIRECT OPPORTUNITY INDEX (THE OPPORTUNITY TO ENGAGE VIA NEWSLETTER)Base: total internet users 16-65 y.o., %
Direct Opportunity Index
(DOI)42 47 43 43 42
2227
1620
35
21 8 27 22
101 3
1
33
23
2625 20
19
33
22 2728
49 6 5 7
ITALY (n=22.588) UK (n=1.000) GERMANY (n=1.001) FRANCE (n=1.002) SPAIN (n=1.004)
Committed
Open
Passive
Opportunistic
Not disturb
Unaware

38© Copyright 2016 Contactlab
This document may not be modified, organized or reutilized in any way without the express written permission of the rightful owner.
DIGITAL DIRECT MARKETING – WORLDWIDE OVERVIEWBase: total internet users 16-65 y.o., %
U M/stPt.: 5,8 M*
U SH: 11,3 M*
U NY: 6,6M*U: 5,3 M
U: 51,7 MU: 41,0 M
U: 30,5 MU: 28,0 M
U: 37,6 M
U : 25,7 M*
IT UK DE FR ES CH NY* KR* Shanghai* Tokyo*Moscow/
St. Pet.
* % % % % % % % % % % %
Newsletter subscribers 78 73 84 80 65 87 74 67 72 71 87
=100 =100 =100 =100 =100 =100 =100 =100 =100 =100 =100
On FASHION 47 35 52 46 47 44 33 31 40 35 35… … … … … … … … … … … …
Avg nr of subscriptions 5,6 4,8 6,7 6,4 4,1 6,1 4,3 3 2,7 6,4 6,5
SUBSCRIPTIONS:
Via online 77 92 95 90 92 91 88 87 85 88 92
Via offline 50 32 22 43 30 29 46 41 72 44 55
ENGAGEMENT (often+sometimes):
Go to shop and buy the prod. 65 78 68 74 79 70 84 84 97 70 79
Go to website and buy the prod. 50 85 82 77 74 73 92 90 94 77 86
Direct Opportunity Index (DOI) 42 47 43 43 42 43 53 44 58 41 52
*In
NY
, KR
, Sha
ngha
i, T
okyo
, Mos
cow
/St.
Pet
the
tota
lsam
ple
alw
ays
refe
rsto
onl
ine
shop
pers
U Tokyo: 6,5 M*

39© Copyright 2016 Contactlab
This document may not be modified, organized or reutilized in any way without the express written permission of the rightful owner.
EFFECTIVENESS OF DIFFERENT COMMUNICATION METHODS USED BY BRANDS/ COMPANIESBase: total internet users 16-65 y.o., n=22.588; %
«TOP2»AVG
(5-1)
66 3,9
49 3,5
38 3,1
32 3,1
Thinking about brands, companies or organisations that you like to follow closely, how useful do you personally find these
communication methods?
26
19
16
10
40
30
22
22
12
14
15
18
6
10
13
13
4
8
14
13
12
19
20
24
communication via email/ newsletter
communication via social media
communication via chat (whatsapp, Skype…)
communication via app notifications/pushmessages
Very useful Fairly useful Neither much nor little useful Not much useful Not at all useful I do not know

ECOMMERCE
• E-commerce trend - online shoppers «at least once in the past 12 months» (it)
• Non online shoppers: intention to purchase online in the near future*
• Product categories purchased online in the last 12 months
• EXI - ecommerce expenditure index 2016 (main categories)
• Average online shopping expenditure for each category (last 12 months)
• Information channels for online shopping
• Favourite methods of payment for online purchases
• Ecommerce channels used
• Recommendability of ecommerce channels
• Use/ recommendability of ecommerce channels
• Main barriers to ecommerce - last 24 months trend
• Categories purchased/ interest to purchase with "click&collect“
• Ecommerce - worldwide overview
*The sections denoted in light grey are part of the full report only

41© Copyright 2016 Contactlab
This document may not be modified, organized or reutilized in any way without the express written permission of the rightful owner.
34
4043
47
2013 (n=57.336) 2014 (n=20.258) 2015 (n=16.344) 2016 (n=22.588)
E-COMMERCE TREND – "SHOPPED ONLINE AT LEAST ONCE IN THE PAST 12 MONTHS" Base: total internet users 16-65 y.o., %
last 12m + 18%
last 12m + 9%
2013 vs 2016
+38%
10.6 M online sh.
8.5 M online sh.
12.4 M online sh.14.3 M online sh.
last 12m + 8%
2013 vs 2015
+26%

42© Copyright 2016 Contactlab
This document may not be modified, organized or reutilized in any way without the express written permission of the rightful owner.
EXI* - ECOMMERCE EXPENDITURE INDEX 2016 (MAIN CATEGORIES)Base: online shoppers 16-65 y.o.for each category
184
136
164
184 186
135 140127
117
73
120
97
50
100
150
200
250
300
350
400
450
UK
CH
DE
FR
ES
IT
*EXI. = expenditure over previous 12 months by category/ avg exp across 27 categ in 6 EU countries *100

43© Copyright 2016 Contactlab
This document may not be modified, organized or reutilized in any way without the express written permission of the rightful owner.
USE/ RECOMMENDABILITY OF ECOMMERCE CHANNELSBase: online shoppers 16-65 y.o., n=10.575, (47%), %
...ecommerce portals with various product categories
… sites of retailers that also have shops
… online shop of the brand
...specialized websites by type of product/ e-tailer
… comparison sites of offers and prices
… private sales sites
...purchasing groups online with coupon
... from online private ads
0
10
20
30
40
50
60
0 10 20 30 40 50 60
PROMOTERS (10+9) (%) (avg.24.5)
US
ER
S(%
) (a
vg. 2
9,5)

44© Copyright 2016 Contactlab
This document may not be modified, organized or reutilized in any way without the express written permission of the rightful owner.
ECOMMERCE – WORLDWIDE OVERVIEW (1/2)Base: online shoppers 16-65 y.o., %
U M/stPt.: 5,8 M
U SH: 11,3 M
U NY: 6,6MU: 4,7 M
U: 47,5 MU: 38,1 M
U: 14,3 M
IT UK DE FR ES CH NY* KR* Shanghai* Tokyo*Moscow/ St.
Pet.*% % % % % % % % % % %
Most used ecommerce channels:
1°Ecomm.
portals
53
Sites with
shops
58
Sites with
shops
53
Sites with
shops
46
E-tailers
49
Sites with
shops
48
Sites with
shops
47
Compar. e-
sites
55
Ecomm. portals
55
Ecomm.
portals
44
E-tailers
54
2°Sites with
shops
45
Brand’s
e-shops
43
E-tailers
50
E-tailers
38
Brand’s
e-shops
44
Brand’s
e-shops
47
Brand’s
e-shops
39
Ecomm.
Portals
42
E-tailers
53
Sites with
shops
40
Ecomm.
portals/ e-
tailers 41
U: 18,0 M
U: 33,0 M
U : 25,7 M
U Tokyo: 6,5 M

45© Copyright 2016 Contactlab
This document may not be modified, organized or reutilized in any way without the express written permission of the rightful owner.
ECOMMERCE – WORLDWIDE OVERVIEW (2/2)Base: total internet users 16-65 y.o., %
U M/stPt.: 5,8 M*
U SH: 11,3 M*
U NY: 6,6M*U: 5,3 M
U: 51,7 MU: 41,0 M
U: 30,5 M
IT UK DE FR ES CH NY* KR* Shanghai* Tokyo*Moscow/
St. Pet.*% % % % % % % % % % %
Main barriers for ecommerce:
1°can't check
in person
39
high costs
of shipping
33
can't check
in person
30
can't
check in
person
33
can't
check in
person
28
can't
check in
person
35
high
costs of
shipping
43
can't
check in
person
40
can't check
in person
39
high
costs of
shipping
40
can't
check in
person
33
2°
afraid of
not
receiving
29
can't check
in person
32
high costs
of shipping
25
high costs
of
shipping
31
afraid of
not
receiving
22
high
costs of
shipping
30
can't
check in
person
35
afraid of
not
receiving
34
can't find
online what
I want 23
can't
check in
person
28
afraid of
not
receiving
31
Users of Click&Collect 12 17 10 10 15 9 7 6 3 7 15
Users + prospect of C&C 53 64 45 54 61 47 63 60 81 37 63
U: 28,0 M
U: 37,6 M
*In
NY
, KR
, Sha
ngha
i, T
okyo
, Mos
cow
/St.
Pet
the
tota
lsam
ple
alw
ays
refe
rsto
onl
ine
shop
pers
U : 25,7 M*
U Tokyo: 6,5 M*

METHODOLOGICAL NOTES

47© Copyright 2016 Contactlab
This document may not be modified, organized or reutilized in any way without the express written permission of the rightful owner.
EUROPEAN (+) DIGITAL BEHAVIOUR STUDY
Report 2016
EUROPEAN (+) DIGITAL BEHAVIOUR STUDY
2016The European Digital Behaviour Study is a study analysing the digital behaviour of internet users with
reference to all types of internet use in Europe+ (6 countries). Since the 2015 edition, the study has also looked
at users outside Europe (including, in 2016, 4 metropolitan areas – Tokyo, Shanghai, Moscow, St. Petersburg –
and the Republic of Korea).
By providing a complete and detailed overview of digital behaviour, the objective of the report is to provide
useful information to enterprises seeking new opportunities in electronic communication and relations, and new
commercial openings.
The study was conducted using a total sample of over 30,000 cases. This includes users interviewed during the
sampling process, as well as those who accessed the study through participating merchants who sent the
invitation to their database of Italian users asking them to take part in the research.*
The country samples represent individuals between 16 and 65 years of age who connect to the internet at least
once a week, irrespective of device and purpose of use (c.f. interview methods in methodology notes).
*Each merchant that took part in the study in Italy was sent, as a reward for participating, the complete set of
statistic tables referring to their own customer base, on a confidential basis.
This report and the related statistics tables demonstrate the aggregate results and do not contain any data that
can be attributed to the specific customer base of a participating merchant.

48© Copyright 2016 Contactlab
This document may not be modified, organized or reutilized in any way without the express written permission of the rightful owner.
ecommerce
Interview method
Europe+ (Italy, UK, Germany, France, Spain, Switzerland):
CAWI survey on ‘regular’ internet users aged 16 – 65, who connect at least once a week, regardless of the device and reason.
Extra-EU markets (New York, Shanghai, Tokyo, Moscow/St Petersburg, Korea):
CAWI survey on ‘online shoppers’ aged 16-65, who purchased/ordered online goods/services in the last year.
Sample design
In the European countries, a representative sample was formed based on the latest data provided by the Eurostat – Information Society and by national
bureaus of statistics. As regards the other extra-EU markets, have been used data from OECD and national bureaus of statistics.
Boost from merchants
In Italy, the representative sample was combined with the sample taken from the lists of merchants. Profiles were then re-balanced to maximize their
representativeness.
The numbers
30.492 cases, composed of 22.588 Italian internet users.
Average duration of online interview: 25 minutes.
EUROPEAN (+) DIGITAL BEHAVIOUR STUDY: INTERVIEW METHOD AND SAMPLING

Need a deep dive on those data?
Ask for more information:
www.contactlab.com


![CONFIRMING CEDENTES · CONFIRMING CEDENTES Para acceder a CONFIRMING: [Imagen1] Ir a Financiación Desplegar Confirming (emisores de pagos) Imagen1 · Podrá obtener la información](https://static.fdocuments.net/doc/165x107/5f07bf467e708231d41e89f0/confirming-cedentes-confirming-cedentes-para-acceder-a-confirming-imagen1-ir.jpg)