E-banking process standardization – An evaluation of customer perception … … · ·...
17
E-banking process standardization – An evaluation of customer perception and satisfaction MRS. SUKANYA KUNDU*, DR. SAROJ KUMAR DATTA, DR. VISHAL VYAS Faculty of Management Studies Mody Institute of Technology & Science Lakshmangarh – 332311, Rajasthan INDIA Phone: +91-1573-225001 (12 Lines) [email protected], [email protected], [email protected] http://www.mitsuniversity.ac.in Abstract: E-banking initiatives of Indian Public sector banks have started generating awareness among the customers. However the e-banking services and the service process differ from bank to bank. Through electronic delivery channel banks are targeting customers from all of geographical location, educational background, age of the individual and the income level. The differentiation in service delivery process creates confusion among the customers especially when the customers are from varied background. Some selected parameters of standardisation related to ATM and Internet banking services has been taken into consideration. Based on the primary data gathered on the perception and satisfaction level of customers of some selected Public sector banks on these parameters, it has been found that there exists a gap between the customer perception and satisfaction level. Going into further analysis, some essential factors have been identified which affects the perception and satisfaction level of the customers of Indian PSBs. How the individual parameters in factors are influencing the overall factor has also been identified. Three factors of perception and four factors of satisfaction have been identified from the research that has equal weight in their respective area. Finally, some measures have been suggested for the PSBs on how they should address this problem of process standardization of e-banking. The research paper bears out that if more standardised services are offered through the e-banking delivery channels keeping in mind perception level of the customers then it will not only attract new customers but also will help the PSBs to retain its existing customer. Keywords: process standardisation, Internet banking, customer satisfaction, customer perception, service quality 1 Introduction Analysis and reorganization of the business process has become essential nowadays for the business organizations to keep pace with the dynamically changing business environment. The focus of the organizations should lie on increasing flexibility in to meet the future requirements. Process standardisation as well as the shared use of services within the framework of service-oriented architectures is some of the most frequently discussed approaches to achieve this goal (Balgheim and Ollagnier 2005, Koch and Rill 2005, Bieberstein et al. 2005, Kilian-Kehr et al. 2007). A business process is defined as “the specific ordering of work activities across time and place, with a beginning, an end, and clearly identified input and output” (Davenport 1993) and the purpose of organizations to implement business processes is to produce value for customers (Earl et al. 1995). In the context of business process, ‘standardisation’ refers to the process of developing a standard that enables organizations to focus their attention on delivering excellence in customer service. When the standardised components of business process are taken and used differently by applying a specific business flow and business rules, a unique service/product is created which enhances the competitive advantage of the firm. The underlying purpose of standardisation is to deliver measurable benefits when applied within the infra- structure of a company itself - business costs and risks can be minimised, internal processes streamlined and communication improved. Standardisation improves WSEAS TRANSACTIONS on BUSINESS and ECONOMICS Sukanya Kundu, Saroj Kumar Datta, Vishal Vyas E-ISSN: 2224-2899 171 Issue 4, Volume 9, October 2012
-
Upload
truongkien -
Category
Documents
-
view
227 -
download
5
Transcript of E-banking process standardization – An evaluation of customer perception … … · ·...

E-banking process standardization – An evaluation of customer perception and satisfaction
MRS. SUKANYA KUNDU*, DR. SAROJ KUMAR DATTA, DR. VISHAL VYAS
Faculty of Management Studies Mody Institute of Technology & Science
Lakshmangarh – 332311, Rajasthan INDIA
Phone: +91-1573-225001 (12 Lines) [email protected], [email protected], [email protected]
http://www.mitsuniversity.ac.in
Abstract: E-banking initiatives of Indian Public sector banks have started generating awareness among the customers. However the e-banking services and the service process differ from bank to bank. Through electronic delivery channel banks are targeting customers from all of geographical location, educational background, age of the individual and the income level. The differentiation in service delivery process creates confusion among the customers especially when the customers are from varied background. Some selected parameters of standardisation related to ATM and Internet banking services has been taken into consideration. Based on the primary data gathered on the perception and satisfaction level of customers of some selected Public sector banks on these parameters, it has been found that there exists a gap between the customer perception and satisfaction level. Going into further analysis, some essential factors have been identified which affects the perception and satisfaction level of the customers of Indian PSBs. How the individual parameters in factors are influencing the overall factor has also been identified. Three factors of perception and four factors of satisfaction have been identified from the research that has equal weight in their respective area. Finally, some measures have been suggested for the PSBs on how they should address this problem of process standardization of e-banking. The research paper bears out that if more standardised services are offered through the e-banking delivery channels keeping in mind perception level of the customers then it will not only attract new customers but also will help the PSBs to retain its existing customer. Keywords: process standardisation, Internet banking, customer satisfaction, customer perception, service quality 1 Introduction
Analysis and reorganization of the business process has become essential nowadays for the business organizations to keep pace with the dynamically changing business environment. The focus of the organizations should lie on increasing flexibility in to meet the future requirements. Process standardisation as well as the shared use of services within the framework of service-oriented architectures is some of the most frequently discussed approaches to achieve this goal (Balgheim and Ollagnier 2005, Koch and Rill 2005, Bieberstein et al. 2005, Kilian-Kehr et al. 2007). A business process is defined as “the specific ordering of work activities across time and place, with a beginning, an end, and clearly identified input and
output” (Davenport 1993) and the purpose of organizations to implement business processes is to produce value for customers (Earl et al. 1995). In the context of business process, ‘standardisation’ refers to the process of developing a standard that enables organizations to focus their attention on delivering excellence in customer service. When the standardised components of business process are taken and used differently by applying a specific business flow and business rules, a unique service/product is created which enhances the competitive advantage of the firm. The underlying purpose of standardisation is to deliver measurable benefits when applied within the infra-structure of a company itself - business costs and risks can be minimised, internal processes streamlined and communication improved. Standardisation improves
WSEAS TRANSACTIONS on BUSINESS and ECONOMICS Sukanya Kundu, Saroj Kumar Datta, Vishal Vyas
E-ISSN: 2224-2899 171 Issue 4, Volume 9, October 2012

management focus and reinforces the rise of a new class of function-based companies. Irving Wladawsky-Berger, technology strategist at IBM, has an interesting webpost on how process standardisation fosters innovation and drives competitive advantage. He suggests that "we need to evolve from today's labour-intensive and one-of-a-kind approach to building business solutions, and embrace methodologies based on science and engineering, using sophisticated tools and disciplined processes, much as happened during the Industrial Revolution. And, as was the case with the Industrial Revolution, we need to standardise those processes where differentiation brings little or no incremental value, so as to avoid the huge inefficiencies involved in re-inventing the same process over and over again. We can then apply our energies to innovating around those processes and business models that bring true differentiation and value to the business." Bill Gates of Microsoft Corporation had once commented “The first rule of technology is that automation applied to an efficient operation will magnify the efficiency. The second is that automation applied to an inefficient operation will magnify the inefficiency”. Information technology has been deployed in most of the of back-office and customer-interface activities of banking worldwide. In India, Public Sector banks are also adopting information technology in their retail banking services to do the daily job easily and to attract more and more customers. Many of the Indian PSBs have started using various electronic channels to reach urban, semi-urban and rural parts of India. Therefore they are to cater to the needs of an asymmetric customer base where there is a considerable difference in educational background, age group, income level etc. There can be customers who are highly techno-savvy as well as customers who are not accustomed with technology at all. In such a situation, variation in the type of services offered through electronic mode by different banks can cause confusion and create adverse effect on adaptation of e-banking. There are two solutions to address this asymmetric customer base issue – a) highly personalized service should be provided or b) a more standardised service should be given which should be usable by all. This research paper takes up the second solution of the two above mentioned alternatives and tries to find out the customers’ view, i.e., their perception and satisfac-tion regarding standardisation aspect of the prevailing e-banking process. By the term e-banking, here, we
have considered ATMs and i-banking (Internet banking). Generally, standards are consensus-based, that is, they are developed by experts with the aim of arriving at a common standpoint. Therefore, this research work is a proactive attempt to find out whether the perception and satisfaction level of e-banking customers of Indian PSBs are indicating a need for implementation of some standards in the e-banking process. Research objectives Standardisation of business process adds to the efficiency of an existing system. The Indian Public Sector banks are adopting technologies to offer banking services on anytime anywhere basis. Due to the diversification in the customer base some standardised process should be followed so that it can be easily operable by any of its customer. The main objectives of this research can be summarised as follows: First, to examine customers’ perception and satisfaction on different dimensions of standardisation of e-banking process of Indian PSBs Second, to identify whether there exists any gap between the customer perception and satisfaction Third, to find out the exact factors which are liable for the gap between perception and satisfaction and come out with suggestions to address those issues. 1.1 Literature review 1.1.1Customer perception & satisfaction Oliver (1977) initiated focus on the antecedents of satisfaction, and suggested that performance outcome of a product interacts with prior expectancies to either confirm or disconfirm the expectancies of the performance. Olson and Dover (1979) in their work on consumer expectations define expectations as beliefs about a product or services attributes or preference at some time in the future. Yi (1991) identifies two basic conceptualizations of expectations. One version gives an institutional perspective and states that preconception beliefs about the overall performance of the product / service are created by previous experience; the organization’s claim; product information; or word of mouth. Oliver and Bearden (1983) have observed, however, that there are likely two components of expectations: the level of performance expected, and the certainty of receiving that level of performance. Oliver and Bearden proposed operationalising these components in a
WSEAS TRANSACTIONS on BUSINESS and ECONOMICS Sukanya Kundu, Saroj Kumar Datta, Vishal Vyas
E-ISSN: 2224-2899 172 Issue 4, Volume 9, October 2012

fashion similar to the “value – expectancy attitude model” of Fishbein (1975). Anderson and Sullivan (1993) plot satisfaction’s response to the difference between perceived quality and expectation as a response function. As perceived performance exceeds expectation, satisfaction increases, but at a decreasing rate. As perceived performance falls short of expectation, Anderson and Sullivan utilise an asymmetric loss function to show that satisfaction will be more responsive to disconfirmation (negative disconfirmation) than to affirmation (positive disconfirmation). 1.1.2 Business process and standards Processes are considered ‘a generic factor in all organizations. They are the way things get done’ (Armistead, Pritchard and Machin, 1999). Processes can also be considered as ‘strategic assets’, which require companies to ‘take a business process orientation’ (McCormack and Johnson, 2001). According to John Pyke (2003) BPM is simply technology that allows us to create an independent process layer, which provides a level of abstraction thus removing the process from the control of application. In the same way as the middleware provides a data abstraction layer, BPM provides a ‘process abstraction’ layer. Standards are pointless and meaningless unless the standards are useful, deliver business benefit, simple to use and adopted. A process-oriented approach with a stronger emphasis on customer satisfaction has to be introduced, focusing on continual performance improvement (McAdam & Fulton, 2002). However, Armistead, Pritchard and Machin (1999); Melan (1989) has commented that process measurement is an integral part of Business Process Management, which seeks to optimize process performance against both customer requirements and economic targets. They have also pointed out that single measures of performance can be dangerous. It should be recognized that one of the key aspect of process performance is the extent to which processes fulfil customer requirements. Importance is given to customer satisfaction and customer loyalty in addition to measures of efficiency (Armistead and Machin, 1997). An empirical study by Kohlbacher (2009) indicates that BPM helps organizations to gain higher customer satisfaction, product quality, delivery speed and time-to-market speed. A standard is an agreed, repeatable way of doing an activity. Standards help to increase the reliability and
the effectiveness of services provided to the customers. Standards are created by bringing together the experience and expertise of all interested parties specially the service provider and the customer. In its basic level, standardisation means that processes have exactly the same steps, in the same sequence, and completed by the same roles for all units doing the process. At an even more stringent level standardisation means that the process runs at the same speed. Standardisation is derived from scientific management (Taylor, 1911), a perspective that suggests routinization is the key to coping with complexity. Standardised work practices detail how work should be performed; their goal is to reduce the variance associated with each task and, thereby, improve overall effectiveness (March, 1991). A vital component of standardisation is the use of statistical tools to monitor and analyze work processes, so that problems can be highlighted, mistakes can be learned from, and consistent work quality achieved (Crosby, 1989). One of the anticipated benefits related to the acquisition of standardisation is increased operational and business performance. However, according to Feng et al. (2008) this can only be achieved through the adoption of a quality philosophy, where employee training, periodic audits and commitment are key features of the organisation. Standardisation of business processes intends to improve performance and to give management more control over operational performance. Advantages from standardisation include: more reliable process ; variations in quality shrink, less expenses in development of innovative new practices, and less expenses in the administration of processes (Albrecht Richen and Ansgar Steinhorst, 2005). Work standardisation should also help to ensure that high-quality service is delivered to customers (Olian & Rynes, 1991).The lack of standard procedures and quality controls and the absence of many of the environmental and behavioural cues that influence the development of trust make it difficult to create trust in an online environment (Rocco, 1998). Standard demands continuous improvement and the establishment of measurable goals. Companies must pay careful attention to the development of these goals, so that they represent the driving force for improvement and teamwork (Tsim et al., 2002; Varva, 2003; Zuckerman, 2001). The components of standardisation, such as consistency and error reduction, should relate positively to performance and
WSEAS TRANSACTIONS on BUSINESS and ECONOMICS Sukanya Kundu, Saroj Kumar Datta, Vishal Vyas
E-ISSN: 2224-2899 173 Issue 4, Volume 9, October 2012

customer satisfaction (Gilson at el, 2005). According to Juran (1998) there are multiple dimensions of quality, which can be classified into one of the two broad categories namely quality that meets customer needs and quality that ensures freedom from deficiency. Freedom from deficiency refers to the degree to which the design is reliable with respect to the degree of variance in customer experience in set of features, features level and service quality. This type of quality is standardisation quality. A report on ISO 9001 standard shows that parameters like on-time delivery, product quality, availability, price, lead time, product range, sales support, technical support are taken into care while deciding upon the ISO standards. The final report of a research project titled “The Economic Benefits of Standardisation” was released by DIN, the German institute for standardisation (2001) which commissioned the study in 1997 along with the German Federal Minister of Economic Affairs and Technology. Thousands of companies in Germany, Austria, and Switzerland were surveyed to determine the value of standardisation to their corporations, as well as to the overall economy of the three countries. Over 4,000 companies in 10 industry sectors were selected at random and sent a printed questionnaire containing 49 questions. The information obtained states monitoring and measuring customer satisfaction can help identify opportunities for improvement of the organization’s strategies, products, processes, and characteristics that are valued by customers, and which serve the organization’s objectives. Such improvements can strengthen customer confidence and result in commercial and other benefits. 1.1.3 e-banking in Indian PSBs Ashish K. Sen (2001) pointed out that new Private Sector Banks in India have done significant technological upgrading, thus getting ahead in competition primarily in customer service, a concept that was almost forgotten by the giant Public Sector Banking System, which enjoyed monopoly in the banking industry of the country. He also observes that the Public Sector Banks (PSBs) are putting their acts together – reorganizing and restructuring themselves – all with an eye on customer service and customer convenience and competition is indeed the key. G.V. Chalam (2002) has studied the growth and trend of IT application in Indian banking sector and he made an assessment of its impact on banks’ performance. He
took into consideration the perception of customers on the quality and expectation from such IT-enabled services and the views of employees on such environment. A very interesting and revealing study has been carried out by V. Mehta (2000) on the impact of IT on banks with productivity reference to J&K Bank Ltd. Both qualitative and quantitative evaluation of Computer Based Information System (CBIS) was done to adjudge the efficacy of the new system. The study showed that the overall response towards the change was rather encouraging. In another study by Peeru Mohamed H. (2005) observed that Indian banking have undergone a sea of change in their operational mechanism in view of Government of India’s liberal economic policy. Peeru Mohamed studied public, private and foreign banks’ operations in South India and suggested the need for better CRM practices to improve customer satisfaction. In his research paper, Peeru Mohamed concluded that in India systematic research was very limitedly available in the area of CRM as applicable to banking services. 2 Problem Statements
It has been observed that customers face difficulties in their day to day retail banking operation with e-banking delivery channels due to lack of standard practices in the process. The study has been done to know the user perception and satisfaction regarding e-banking channels. It is assumed that study on the customer perception will bring out what the customers actually want from e-banking in terms of standardized process. On the other hand the questions related to the satisfaction level will give the customers perceived performance It has been found that some ATM outlets provide access checking before entering while the others are not.
• Some ATM outlets are having touch screen machines and some has function keys. Those who are accustomed with using one type of machines faces difficulties in using another type. It kills more time and the queue outside the ATM outlet keeps on going long.
• It has been found that card reading mechanisms in ATMs are not also same; some machines are having card insertion facility and some have card swipe facility. In motorized (card insertion)
WSEAS TRANSACTIONS on BUSINESS and ECONOMICS Sukanya Kundu, Saroj Kumar Datta, Vishal Vyas
E-ISSN: 2224-2899 174 Issue 4, Volume 9, October 2012

system sometimes cards gets locked and causes harassment to the customer.
• Customers who are familiar with operating on non-voice over machines faces problem with voice over machine and vice-versa.
• Another major issue is regarding the transaction limit with different ATM cards. Different transaction limits has been assigned to ATM cards from different PSBs.
• Different sets of products are offered through different bank’s ATM and also through i-banking sites which makes the customer disappointed who want a standard suite of products to be provided with.
• The instruction sequences are not same for every bank for same type of retail banking operations. This again takes more time to go through the instructions carefully and act accordingly.
• The online form formats are different for different banks and the field-wise validation checking differs from bank to bank.
All these causes lack of comfort in using e-banking. It may be questioned whether these variations are creating any value addition from the service providers’ side and if the answer is ‘no’ then there is no need in maintaining this differentiation as these causes more ambiguity among customers. The research paper is intended to find an answer to this question. 3 Research Methodologies
This work was done mainly as an exploratory research to find out the correlation between standardization of the e-banking process and customer satisfaction. It was planned to analyze the Customer Psyche i.e., to find out what were the customers’ needs and expectations and their e-banking experience with the Public Sector Banks. Hence, the twenty four questions (close-ended ones) of customer questionnaire were divided under the following sections: Section A: Customer’s perception of e-banking services provided through ATM and i-banking Section B: Customer satisfaction level with the present practices of e-banking. We have used Likert-type Scales, consisting of a number of statements which express either a favourable or unfavourable attitude towards the given object to which the respondent is asked to react. The respondent indicated his agreement or disagreement with each statement in the instrument. Each response
is given a numerical score, indicating its favourableness or unfavourableness, and the scores are totalled to measure the respondent’s attitude. In other words, the overall score represents the respondent’s position on the continuum of favourableness-unfavourableness towards an issue. Customers of Indian Public Sector banks who have experience with delivery channels of e-banking form the population here. The banks which have a high rating in the usage of electronic payment systems (volume and value of transaction wise) were chosen for this study. Five PSBs has been selected which have high value and volume of Internet banking transactions and have presence in terms of number of ATM outlets namely State Bank of India, Punjab National Bank, Bank of Baroda, Union Bank of India, Bank of India. Major cities are considered as subgroups here as the customers of the major metro cities are the main users of Internet banking and ATM. Among these subgroups the four major metro cities are selected for collecting the sample of Internet banking and ATM customers. To decide the sample size of ATM customers for each of these five banks and again each of the four cities within these five selected PSBs, number of ATM outlets of the banks in four metro cities have been collected. Percentage has been worked out to find out the ranking in terms of no. of ATM outlets in these five banks and four cities within in each of the five banks. Accordingly 112 customers from SBI, 56 from PNB, 74 from BOB, 50 from UBI and 36 customers from BOI were selected. The banks were not willing to share the list of ATM and Internet banking users due to security reason. Quota sampling method was applied to select the customers of Internet banking and ATM. Same method has been followed to decide the sample size of Internet banking customers. A total of 320 customers were given the questionnaires out of which 291 were usable the average response rate being 87%. The data collected through questionnaire were analyzed using the following statistical techniques:
• Univariate statistical technique: the measures of central tendency, namely, mean were used for determining customer satisfaction on various dimensions of Indian retail banking sector.
• Bi-variate statistical techniques: the correlation matrix of the variables has been used to determine the association amongst the variables.
• Multivariate statistical techniques: factor analysis was carried out to identify the different
WSEAS TRANSACTIONS on BUSINESS and ECONOMICS Sukanya Kundu, Saroj Kumar Datta, Vishal Vyas
E-ISSN: 2224-2899 175 Issue 4, Volume 9, October 2012

dimensions of Indian retail banking industry, and the variables that impact the dimensions.
The above analysis was carried out using SPSS ver 17.0 software 4 Data Analysis & Research Findings
The data collected were analyzed and tested under two categories:
• Category I: Customer’s perception on different factors of standardization of e-banking process
• Category II: Customer’s satisfaction on different factors of standardization of e-banking process
Table 1 shows the variables obtained from the questionnaire and their description on which data has been collected and analyzed.
Sl no.
Variable name Description
1 P_ACCLOCK Importance of similar type of access mechanism at the entry point of ATM outlet 2 P_MCHNTYPE Importance of single type of ATM machines (either with touch screen or with function keys)
installed at the ATM outlet 3 P_SWIPE Importance of single type of card reading mechanism (either swiping or card
insertion/motorized ) 4 P_VOICEOVER Importance of single type instruction (either with voice over or without voice over) 5 P_INSTRCTN Importance of similar instruction sequence appearing on the ATM screen for any particular
banking transaction (e.g. cash deposit / withdrawal) irrespective of the bank 6 P_PRDSUITE Importance of similar suite of products offered through the all ATMs irrespective of the
bank 7 P_TRANSLIMIT Importance of similar transaction limit for all the debit cards operating at the POS 8 P_PRDSUITEIBANK Importance of similar suite of products offered through the all i-banking website irrespective
of the bank 9 P_INSTRCTNSEQ Importance of similar instruction sequence for any banking operation through i-banking
website irrespective of the bank 10 P_TERMINOLOGY Importance of using same sort of terminology to indicate same type of banking operations 11 P_FRMFORMAT Importance of similar form formats for any banking operation through i-banking website
irrespective of the bank 12 P_VALIDATNCHECK Importance of similar sort of validation checking through i-banking website irrespective of
the bank 13 S_ACCLOCK Satisfaction level with different access mechanism at the entry point of ATM outlet 14 S_MCHNTYPE Satisfaction level with different type of ATM machines (with touch screen and with function
keys) 15 S_SWIPE Satisfaction level with different type card reading mechanism (swiping and card
insertion/motorized) 16 S_VOICEOVER Satisfaction level with different type of instruction (with voiceover and without voiceover) 17 S_INSTRCTN Satisfaction level with different instruction sequence appearing on the ATM screen for any
particular banking transaction (e.g. cash deposit / withdrawal) 18 S_PRDSUITE Satisfaction level with different suite of products offered through the ATMs 19 S_TRANSLIMIT Satisfaction level with different transaction limit for all the debit cards operating at the POS 20 S_PRDSUITEIBANK Satisfaction level with different suite of products offered through different banks’ i-banking
website 21 S_INSTRCTNSEQ Satisfaction level with different sequence of i-banking instruction through the website of the
bank different banks 22 S_TERMINOLOGY Satisfaction level with different terminologies used different banks to indicate same type of
operations 23 S_FRMFORMAT Satisfaction level with different form format for banking operation through i-banking
website for different banks 24 S_VALIDATNCHECK Satisfaction level with different sort of validation checking through i-banking website
irrespective of the bank Table 1: Name and description of the variables used in SPSS ver 17.0
WSEAS TRANSACTIONS on BUSINESS and ECONOMICS Sukanya Kundu, Saroj Kumar Datta, Vishal Vyas
E-ISSN: 2224-2899 176 Issue 4, Volume 9, October 2012

Category I: Customer’s perception on different factors of standardization of e-banking process
a) Mean value analysis :
Figure 1: Mean values analysis of customer perception regarding different parameters of standardization for ATM
and i-banking
The mean values of all the parameters related to cus-tomer’s perception in ATMs and i-banking are above 4.00. Therefore it can be said customers of Indian PSBs perceive that they should receive standardised products and services through standardised process of these two delivery channels. Standard formats of validation checking and standard form format are the two parameters with highest scores in the mean values analysis of customer percep-
tion regarding standardization for i-banking opera-tions. Uniformity in the transaction limit with ATM cards, standardized set of instruction through ATM for same banking operation, single type of ATM machine (function key / touch screen) and uniformity in the product range offered are some of the areas which the customers find very important from the standard-ization point of view.
b) Correlation analysis
perception access lock
perception machine
type
perception swipe/
motorized
perception voice over machines
perception instruction
perception product
suite
perception access lock 1.000 .569 .456 .429 .414 .056
perception machine type .569 1.000 .538 .446 .461 .354
perception swipe/ motorized .456 .538 1.000 .917 .183 .116
perception voice over machines .429 .446 .917 1.000 .226 .149
perception instruction .414 .461 .183 .226 1.000 .406
perception product suite .056 .354 .116 .149 .406 1.000
perception transaction limit .235 .485 .284 .304 .449 .299
perception i-banking product suite .057 .226 -.110 -.061 .153 .540
perception instruction sequence in i-banking transaction
-.183 -.108 -.450 -.417 .142 .431
perception terminology of operation -.154 -.082 -.159 -.123 -.065 .429
perception format of online form .168 .335 .063 .085 .273 .289
perception validation checking .242 .280 .286 .299 .205 .358
WSEAS TRANSACTIONS on BUSINESS and ECONOMICS Sukanya Kundu, Saroj Kumar Datta, Vishal Vyas
E-ISSN: 2224-2899 177 Issue 4, Volume 9, October 2012

perception transaction
limit
perception i-banking product
suite
perception instruction sequence in i-banking transaction
perception terminolog
y of operation
perception format of
online form
perception validation checking
perception access lock .235 .057 -.183 -.154 .168 .242
perception machine type .485 .226 -.108 -.082 .335 .280
perception swipe/ motorized .284 -.110 -.450 -.159 .063 .286
perception voice over machines .304 -.061 -.417 -.123 .085 .299
perception instruction .449 .153 .142 -.065 .273 .205
perception product suite .299 .540 .431 .429 .289 .358
perception transaction limit 1.000 .359 -.078 -.086 .305 .303
perception i-banking product suite .359 1.000 .468 .473 .484 .382
perception instruction sequence in i-banking transaction
-.078 .468 1.000 .731 .415 .171
perception terminology of operation -.086 .473 .731 1.000 .437 .184
perception format of online form .305 .484 .415 .437 1.000 .596
perception validation checking .303 .382 .171 .184 .596 1.000
Table 2: Correlation among the different parameters of perception about standardization
The pairs of variables that are correlated to each other are given below:
Variable Var iable description Nature of correlation perception access lock perception machine type Moderate (+)
perception swipe/ motorized Moderate (+) perception voice over machines Moderate (+) perception instruction Moderate (+)
perception machine type
perception swipe/ motorized Moderate (+) perception voice over machines Moderate (+) perception instruction Moderate (+) perception product suite Moderate (+) perception transaction limit Moderate (+)
perception swipe/ motorized perception voice over machines High (+) perception instruction sequence in i-banking transaction
Moderate (-)
perception voice over machines perception instruction sequence in i-banking transaction
Moderate (-)
perception instruction perception product suite Moderate (+) perception transaction limit Moderate (+)
perception product suite perception i-banking product suite Moderate (+) perception instruction sequence in i-banking transaction
Moderate (+)
perception terminology of operation
Moderate (+)
WSEAS TRANSACTIONS on BUSINESS and ECONOMICS Sukanya Kundu, Saroj Kumar Datta, Vishal Vyas
E-ISSN: 2224-2899 178 Issue 4, Volume 9, October 2012

Variable Variable description Nature of correlation perception i-banking product suite perception instruction sequence in
i-banking transaction Moderate (+)
perception terminology of operation
Moderate (+)
perception format of online form Moderate (+) perception instruction sequence in i-banking transaction
perception terminology of operation
High (+)
perception format of online form Moderate (+) perception terminology of operation perception format of online form Moderate (+) perception format of online form perception validation checking Moderate (+)
Table 3 : Nature of correlation between variables of e-banking perception
c) Factor analysis:
Rotated Component Matrixa
Component
1 2 3 perception machine type .463 .654 perception swipe/ motorized .938 perception voice over machines .919 perception instruction .824 perception product suite .610 .441 perception transaction limit .762 perception i-banking product suite .723 perception instruction sequence in i-banking transaction .764 -.478 perception terminology of operation .836 perception format of online form .724 perception validation checking .581 .449 Extraction Method: Principal Component Analysis. Rotation Method: Varimax with Kaiser Normalization. a. Rotation converged in 5 iterations.
Table 4: Rotated Component Matrix - customer’s perception
Three factors were extracted through varimax with Kaiser Normalization rotation method, having eigenvalue more than 1. Rotation converged in 5 iterations. Factor 1 comprises variable namely perception product suite, perception i-banking product suite, perception instruction sequence in i-banking transaction, perception terminology of operation, perception format of online form, perception
validation checking indicating the service range cum software support dimension. Factor 2 includes variable perception swipe/ motorized and perception voice over machines, indicating the service quality dimension. Factor 3 includes variables perception machine type, perception instruction, perception transaction limit indicating service support dimension.
WSEAS TRANSACTIONS on BUSINESS and ECONOMICS Sukanya Kundu, Saroj Kumar Datta, Vishal Vyas
E-ISSN: 2224-2899 179 Issue 4, Volume 9, October 2012

Category II: Customer’s satisfaction on different factors of standardization of e-banking process
a) Mean value analysis :
Figure 2: Mean value analysis of customer satisfaction regarding different parameters of standardization
From the mean value analysis it can be seen that in average satisfaction level is 1.82 which well below the normal satisfaction level. Therefore it
indicates a clear need for an evaluation of the standardization aspect of e-banking service process.
b) Correlation analysis:
satisfaction access lock
Satisfaction machine
type
Satisfaction swipe/
motorized
Satisfaction voice over machines
Satisfaction instruction sequence
Satisfaction product
suite
satisfaction access lock 1.000 .477 .122 .337 .043 .136
Satisfaction machine type .477 1.000 .279 .458 -.007 -.025
Satisfaction swipe/ motorized .122 .279 1.000 .041 .609 -.137
Satisfaction voice over machines .337 .458 .041 1.000 -.119 .289
Satisfaction instruction sequence .043 -.007 .609 -.119 1.000 -.159
Satisfaction product suite .136 -.025 -.137 .289 -.159 1.000
Satisfaction transaction limit -.085 -.122 -.164 -.273 -.133 .349
Satisfaction i-banking product suite .026 .163 -.053 .465 -.159 .523
Satisfaction instruction sequence in i-banking transaction
.020 -.028 -.103 .091 -.215 .430
Satisfaction terminology of operation
-.015 .083 -.005 .085 .072 .116
Satisfaction format of online form .382 .118 -.110 .336 -.163 .487
Satisfaction validation checking .282 .156 .055 .248 .025 .196
WSEAS TRANSACTIONS on BUSINESS and ECONOMICS Sukanya Kundu, Saroj Kumar Datta, Vishal Vyas
E-ISSN: 2224-2899 180 Issue 4, Volume 9, October 2012

Satisfaction transaction
limit
Satisfaction i-banking
product suite
Satisfaction instruction sequence in i-banking
transaction
Satisfaction terminology of operation
Satisfaction format of
online form
Satisfaction validation checking
satisfaction access lock -.085 .026 .020 -.015 .382 .282
Satisfaction machine type -.122 .163 -.028 .083 .118 .156
Satisfaction swipe/ motorized -.164 -.053 -.103 -.005 -.110 .055
Satisfaction voice over machines -.273 .465 .091 .085 .336 .248
Satisfaction instruction sequence -.133 -.159 -.215 .072 -.163 .025
Satisfaction product suite .349 .523 .430 .116 .487 .196
Satisfaction transaction limit 1.000 .171 .284 .172 .222 .122
Satisfaction i-banking product suite
.171 1.000 .240 .440 .255 .119
Satisfaction instruction sequence in i-banking transaction
.284 .240 1.000 .034 .266 .088
Satisfaction terminology of operation
.172 .440 .034 1.000 .130 .041
Satisfaction format of online form .222 .255 .266 .130 1.000 .432
Satisfaction validation checking .122 .119 .088 .041 .432 1.000
Table 5: Correlation among the different parameters of satisfaction about standardization
The pair of variables that are correlated to each other are given in the following table. Variable Var iable description Nature of
correlation Satisfaction access lock Satisfaction machine type Moderate (+)
Satisfaction format of online form Moderate (+) Satisfaction machine type Satisfaction voice over machine Moderate (+) Satisfaction swipe/ motorized Satisfaction instruction sequence Moderate (+) Satisfaction voice over machines Satisfaction i-banking product suite Moderate (+) Satisfaction product suite
Satisfaction transaction limit Moderate (+) Satisfaction i-banking product suite Moderate (+) Satisfaction instruction sequence in i-banking transaction
Moderate (+)
Satisfaction format of online form Moderate (+) Satisfaction i-banking product suite Satisfaction terminology of operation Moderate (+) Satisfaction format of online form Satisfaction validation checking Moderate (+)
Table 6: Nature of correlation between variables of e-banking satisfaction
WSEAS TRANSACTIONS on BUSINESS and ECONOMICS Sukanya Kundu, Saroj Kumar Datta, Vishal Vyas
E-ISSN: 2224-2899 181 Issue 4, Volume 9, October 2012
c) Factor analysis :
Rotated Component Matrixa
Component
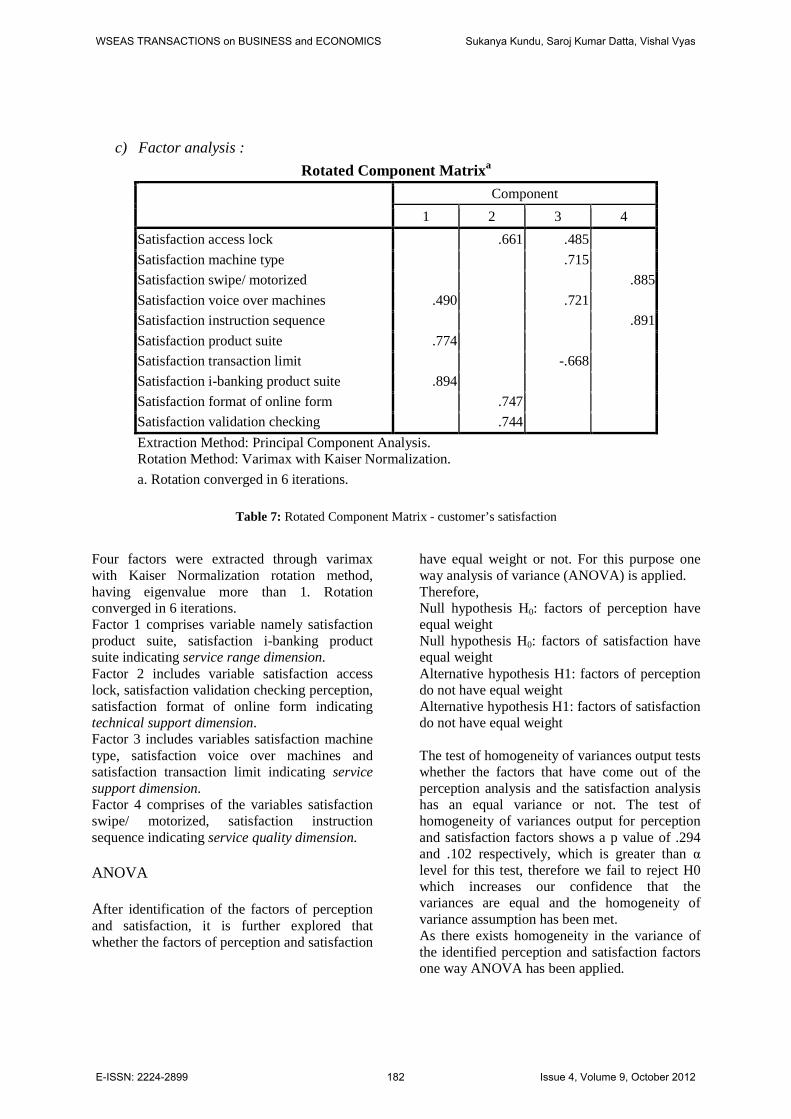
1 2 3 4 Satisfaction access lock .661 .485 Satisfaction machine type .715 Satisfaction swipe/ motorized .885 Satisfaction voice over machines .490 .721 Satisfaction instruction sequence .891 Satisfaction product suite .774 Satisfaction transaction limit -.668 Satisfaction i-banking product suite .894 Satisfaction format of online form .747 Satisfaction validation checking .744 Extraction Method: Principal Component Analysis. Rotation Method: Varimax with Kaiser Normalization. a. Rotation converged in 6 iterations.
Table 7: Rotated Component Matrix - customer’s satisfaction Four factors were extracted through varimax with Kaiser Normalization rotation method, having eigenvalue more than 1. Rotation converged in 6 iterations. Factor 1 comprises variable namely satisfaction product suite, satisfaction i-banking product suite indicating service range dimension. Factor 2 includes variable satisfaction access lock, satisfaction validation checking perception, satisfaction format of online form indicating technical support dimension. Factor 3 includes variables satisfaction machine type, satisfaction voice over machines and satisfaction transaction limit indicating service support dimension. Factor 4 comprises of the variables satisfaction swipe/ motorized, satisfaction instruction sequence indicating service quality dimension.
ANOVA
After identification of the factors of perception and satisfaction, it is further explored that whether the factors of perception and satisfaction
have equal weight or not. For this purpose one way analysis of variance (ANOVA) is applied. Therefore, Null hypothesis H0: factors of perception have equal weight Null hypothesis H0: factors of satisfaction have equal weight Alternative hypothesis H1: factors of perception do not have equal weight Alternative hypothesis H1: factors of satisfaction do not have equal weight The test of homogeneity of variances output tests whether the factors that have come out of the perception analysis and the satisfaction analysis has an equal variance or not. The test of homogeneity of variances output for perception and satisfaction factors shows a p value of .294 and .102 respectively, which is greater than α level for this test, therefore we fail to reject H0 which increases our confidence that the variances are equal and the homogeneity of variance assumption has been met. As there exists homogeneity in the variance of the identified perception and satisfaction factors one way ANOVA has been applied.
WSEAS TRANSACTIONS on BUSINESS and ECONOMICS Sukanya Kundu, Saroj Kumar Datta, Vishal Vyas
E-ISSN: 2224-2899 182 Issue 4, Volume 9, October 2012

Perception
Levene Statistic df1 df2 Sig.
1.227 2 870 .294
Table 8: Test of Homogeneity of Variances –
perception
Satisfaction
Levene Statistic df1 df2 Sig.
2.073 3 1160 .102
Table 9: Test of Homogeneity of Variances –
perception
Sum of
Squares df
Mean
Square F Sig.
Between Groups (Combined) 1.363 2 .681 .675 .510
Linear Term Contrast .500 1 .500 .495 .482
Deviation .863 1 .863 .855 .356
Within Groups 878.506 870 1.010 Total 879.869 872
Table 10: ANOVA – perception
Sum of
Squares df
Mean
Square F Sig.
Between Groups (Combined) .096 3 .032 .032 .992
Linear Term Contrast .022 1 .022 .023 .880
Deviation .073 2 .037 .037 .964
Within Groups 1143.882 1160 .986 Total 1143.977 1163
Table 11: ANOVA – satisfaction The perception analysis shows p value associated with the F ratio is equals .510 and satisfaction reveals a p value associated with F
ratio equal to .992. Both of the p values are greater than the α level (.05), so we fail to reject H0.
.
(I) Factor (J) Factor
Mean
Difference (I-J) Std. Error Sig.
95% Confidence Interval
Lower Bound Upper Bound
Factor1 Factor2 .09600168 .08330696 .482 -.0995802 .2915836
Factor3 .05861250 .08330696 .761 -.1369694 .2541944
Factor2 Factor1 -.09600168 .08330696 .482 -.2915836 .0995802
Factor3 -.03738918 .08330696 .895 -.2329711 .1581927
Factor3 Factor1 -.05861250 .08330696 .761 -.2541944 .1369694
Factor2 .03738918 .08330696 .895 -.1581927 .2329711
Table 12: multiple comparisons (Tukey HSD)- Perception
WSEAS TRANSACTIONS on BUSINESS and ECONOMICS Sukanya Kundu, Saroj Kumar Datta, Vishal Vyas
E-ISSN: 2224-2899 183 Issue 4, Volume 9, October 2012

(I) Factor (J) Factor
Mean
Difference (I-J) Std. Error Sig.
95% Confidence Interval
Lower Bound Upper Bound
Factor1 Factor2 .01613198 .08232468 .997 -.1956696 .2279335
Factor3 -.00650010 .08232468 1.000 -.2183017 .2053015
Factor4 -.00553256 .08232468 1.000 -.2173341 .2062690
Factor2 Factor1 -.01613198 .08232468 .997 -.2279335 .1956696
Factor3 -.02263209 .08232468 .993 -.2344337 .1891695
Factor4 -.02166455 .08232468 .994 -.2334661 .1901370
Factor3 Factor1 .00650010 .08232468 1.000 -.2053015 .2183017
Factor2 .02263209 .08232468 .993 -.1891695 .2344337
Factor4 .00096754 .08232468 1.000 -.2108340 .2127691
Factor4 Factor1 .00553256 .08232468 1.000 -.2062690 .2173341
Factor2 .02166455 .08232468 .994 -.1901370 .2334661
Factor3 -.00096754 .08232468 1.000 -.2127691 .2108340
Table 13: multiple comparisons (Tukey HSD)- Satisfaction
All the mean differences are found to be within the lower and upper bound for both perception and satisfaction. 5 Findings and Conclusions
E-banking in Indian PSBs is trying to emerge as an alternative channel of delivery. The usual branches of banks have culminated into PC networks, whereby the consumer can draw all the benefits and services of the bank at a single click of the mouse. Once the branch offices of bank are interconnected through terrestrial or satellite links, there would be no physical identity for any branch. It would be a borderless entity permitting anytime, anywhere and anyhow banking. PSBs are also trying to increase its customer base through the use of technology which has a capability to bring the rural customers under its purview also. This causes a wide variation also within the bank’s customer-base. Keeping this in mind banks should offer its products in such a way that it can be easily consumed by everyone. This research paper indicates that a gap exists between the customer perception and customer satisfaction regarding standardization of e-banking operation in Indian PSBs. It can be seen
from the mean value analysis that the average of mean value of customer importance on the selected parameters of standardization is 4.59, while the average of mean value of satisfaction level for the same parameters is 1.82. Hence, it indicates that standardization of e-banking process is an important aspect though customers’ present satisfaction level is showing their expectation is not getting fulfilled by the present e-banking service provided by the Indian PSBs. The PSBs should give a deep thought into this matter. The statistical analysis clearly reflect that the dimensions of the Indian e-banking services which affect their customer perception and satisfaction level. The perception analysis of the customers’ psyche has given three dimensions namely service range cum software support dimension, service quality dimension and service support dimension. While the satisfaction analysis has identified four dimensions: service range dimension, technical support dimension, service support dimension and service quality dimension. If compared, it can be seen that the study is revealing same type of dimension both from the perception and satisfaction analysis of the customers of Indian PSBs. Again one way ANOVA test is showing that the all the factors
WSEAS TRANSACTIONS on BUSINESS and ECONOMICS Sukanya Kundu, Saroj Kumar Datta, Vishal Vyas
E-ISSN: 2224-2899 184 Issue 4, Volume 9, October 2012
of perception a have an equal impact and same has been found for the satisfaction analysis also. It can be seen that unstandardized business process of electronic banking has a strong and negative effect on the level of customer satisfaction. Hence in order to improve their competitiveness in the present market environment the strategic bankers should concentrate to improve on the dimensions of product range, service quality, service support, technical support etc. giving equal importance to each of the identified dimensions. The restructuring of the Indian e-banking needs to be addressed by adopting the following policies and strategic directions. Service range: Banking being a rudimentary service sector, e-banking service offered by the Indian PSBs should be of similar type. In its present practice, the services offered through ATM and i-banking differs within a bank and service offered by these two delivery channels also varies from bank to bank. This creates dissatisfaction among the customers and ultimately works as a hindrance towards adaptation of e-banking. Service quality: The e-banking service should deliver standardised quality service, so that the customers can avoid hazards of differentiated service delivery while availing electronic channel of banking. Using same type of machines, same type of instruction sequence for same banking operation increases the service quality as customers do not have to bother about which bank’s ATM he/she is using or which bank’s website he/she is accessing. Once the customers feel at ease with the e-banking process they will use the channel again. Service support: Customers expect uniform service support across all the PSBs. Uniformity in the instruction sequence, service facility and transaction limit will make ATM operations more easy and attractive to the targeted customers. Technical support: Banks should same type of validation checking and same type of form format for receiving input from its customers or prospects. This will act as technical support
especially for those who are new to technology applications. Technical support will reduce the lead-time of e-banking operation as standard mechanism for accessing the ATM, standard format of the form and validation checking will enhance the ease of understanding the banking operation and will reduce the e-banking transaction time. 5.1 Limitations M-banking is considered to be one of the powerful delivery channels of e-banking. Till date few Indian PSBs are providing m-banking facilities and the customer base for this channel is also very small. Therefore m-banking has been kept outside the focus of this research work. Moreover, though Indian PSBs are targeting the rural and semi urban-parts of India to brought under the scope of e-banking data has not been collected from rural and semi urban areas. No demographic analysis has been provided in this research paper which can open up separate dimension related to this research area. A larger sample size can give more accurate analysis of the situation. 5.2 Further Research This research work leaves a tremendous scope for further research. It findings of this study can be used for developing a separate model for standardization in banking industry especially for the Public Sector banks. Nevertheless, the above study leaves an immense scope for carrying out further research in the areas like: providers’ perspective and comparing that with the customers’ perspective, other operational aspect of banking operations, other geographic areas i.e., in the rural areas to find out whether there is any significant difference in the behaviour of the banking customers who are geographically separated.
5.3 Managerial Implications
This research paper will have useful implications on the managerial decisions of the Indian PSBs. India being the second largest populous country in the world and financial services being basic need for any individual nowadays Indian PSBs are having a huge potential customer base to explore. Technology innovation has made
WSEAS TRANSACTIONS on BUSINESS and ECONOMICS Sukanya Kundu, Saroj Kumar Datta, Vishal Vyas
E-ISSN: 2224-2899 185 Issue 4, Volume 9, October 2012

banking services within reach of every citizen irrespective of the geographical presence. It reflects that e-banking has a good prospect in India. The research paper indicates that if more standardised services are offered through the e-banking delivery channels keeping in mind perception level of the customers then it will not only attract new customers but also will help the PSBs to retain its existing customer.
References
[1] Anderson, Eugene W. and Sullivan, W. (1993). The Antecedents and Consequences of Customer Satisfaction for Firms. Marketing Science, 12(2), 125-143
[2] Armistead, C. and Machin, S. (1997). Implications of business process management for operations management. International Journal of Operations and Production Management, l, 886–898.
[3] Armistead, C., Pritchard, J. P. and Machin, S. (1999). Strategic business process management for organisational effectiveness. Long Range Planning, 32, 96–106.
[4] Chalam, Dr. G.V. (2002). Impact of Information Technology on the Performance of the Banking Sector. Research Bulletin of the ICWAI, XXI, 17-27
[5] Crosby, P. B. (1989). Let’s talk quality. New York: McGraw-Hill.
[6] Davenport, T. H. (1993). Process Innovation. Harvard Business School Press, Cambridge, MA.
[7] Earl, M. J., J. L. Sampler, J. E. Short. 1995. Strategies for business process reengineering: Evidence from field studies. J. Management Inform. Systems, 12(1), 31–56.
[8] Feng, M., Terziovski, M. and Samson, D. (2008). Relationship of ISO 9001:2000 quality system certification with operational and business performance. Journal of Manufacturing Technology Management, 19, 22–37.
[9] Gilson, L. L., Mathieu, J. E., Shalley, C. E. and Ruddy, T. M. (2005). Creativity and
standardization: complementary or conflicting drivers of team effectiveness?, Academy of Management Journal, 48, 521-531.
[10] Juran, J.M.(1988). Juran’s quality control handbook. 4th ed, New York, McGraw Hill
[11] Koch, M. and Rill, M. (2005). Serviceorientierte Architekturen bei Finanzdienstleistern. ibi research an der Universität Regensburg GmbH
[12] Kohlbacher, M. (2009): The Effects of Process Orientation on Customer Satisfaction, Product Quality and Time-Based Performance. Paper presented at the 29th International Conference of the Strategic Management Society, Washington DC, October 11–14
[13] March, J. G. (1991). Exploration and exploitations in organizational learning. Organization Science, 21, 71–87.
[14] McAdam, R., and Fulton, F. (2002). The impact of the ISO 9000:2000 quality standards in small software firms. Managing Service Quality, 12, 336–345
[15] McCormack, K. and B. Johnson (2001). Business process orientation, supply chain management and the e-corporation. IIE Solutions; Norcross, 33, 33–37.
[16] Mehta, Dr. Varsha (2000). Information Technology and Productivity in Banks – A Case of Jammu & Kashmir Bank Ltd. Prabandh, Journal of Faculty of Management Studies, Mohanlal Sukhadia University, 1-25.
[17] Melan, E. (1989). Process management: a unifying framework. National Productivity Review, 8, 395–406.
[18] Mohamed, H. Peeru.(2002). Enhancing Marketing Productivity of Banking Services: A CRM Approach. Customer Relationship Management: A step by step Approach. Vikas Publishing House, India.
[19] Olian, J. D., & Rynes, S. L. (1991). Making total quality work: Aligning organizational processes, performance measures, and stakeholders. Human Resource Management, 30, 303–333.
[20] Oliver, R.L. (1997). Satisfaction: A Behavioral Perspective on the Consumer. The McGraw-Hill Companies Inc., New York
WSEAS TRANSACTIONS on BUSINESS and ECONOMICS Sukanya Kundu, Saroj Kumar Datta, Vishal Vyas
E-ISSN: 2224-2899 186 Issue 4, Volume 9, October 2012

[21] Olson, Jerry C. and Dover, P. (1979). Disconfirmation of Consumer Expectation through Product Trail. Journal of Applied Psychology, 64, 179-189.
[22] Pyke, J. (2003), The problem with process management standards, www.edocmagazize.com
[23] Richen, A., Steinhorst, A. (2005). Standardisation or Harmonization? You need both. BPTrends
[24] Rocco, E. (1998, April). Trust breaks down in electronic contexts but can be repaired by some initial face-to-face contact. Paper presented at the CHI‘98 Conference: Human Factors in Computing Systems, Los Angeles, CA
[25] Taylor, F. W. (1911). The principles of scientific management. New York, Harper & Brothers.
[26] Tsim, Y.C., Yeung, V.W.S., and Leung, E.T.C. (2002). An adaptation to ISO 9001:2000 for certified organizations. Managerial Auditing Journal, 17, 245–250.
[27] Varva, T.G. (2003). Customer satisfaction measurement simplified: A step-by-step guide for ISO 9000:2000 certification. Milwaukee. WI: ASQ Quality Press.
[28] Yi, Youjae (1991). A Critical Review of Consumer Satisfaction in Zeithaml. Review of Marketing 1989. Chicago: American marketing Association.
[29] Zuckerman, A. (2001). ISO 9000:2000 now official. World Trade, 14(4), 68–69.
WSEAS TRANSACTIONS on BUSINESS and ECONOMICS Sukanya Kundu, Saroj Kumar Datta, Vishal Vyas
E-ISSN: 2224-2899 187 Issue 4, Volume 9, October 2012