Dynamique des communautés bactériennes detapis ...
261
HAL Id: tel-00151969 https://tel.archives-ouvertes.fr/tel-00151969 Submitted on 5 Jun 2007 HAL is a multi-disciplinary open access archive for the deposit and dissemination of sci- entific research documents, whether they are pub- lished or not. The documents may come from teaching and research institutions in France or abroad, or from public or private research centers. L’archive ouverte pluridisciplinaire HAL, est destinée au dépôt et à la diffusion de documents scientifiques de niveau recherche, publiés ou non, émanant des établissements d’enseignement et de recherche français ou étrangers, des laboratoires publics ou privés. Dynamique des communautés bactériennes detapis microbiens soumis aux stressenvironnementaux Aude Fourçans To cite this version: Aude Fourçans. Dynamique des communautés bactériennes detapis microbiens soumis aux stressenvi- ronnementaux. Ecologie, Environnement. Université de Pau et des Pays de l’Adour, 2004. Français. <tel-00151969>
Transcript of Dynamique des communautés bactériennes detapis ...
HAL Id: tel-00151969https://tel.archives-ouvertes.fr/tel-00151969
Submitted on 5 Jun 2007
HAL is a multi-disciplinary open accessarchive for the deposit and dissemination of sci-entific research documents, whether they are pub-lished or not. The documents may come fromteaching and research institutions in France orabroad, or from public or private research centers.
L’archive ouverte pluridisciplinaire HAL, estdestinée au dépôt et à la diffusion de documentsscientifiques de niveau recherche, publiés ou non,émanant des établissements d’enseignement et derecherche français ou étrangers, des laboratoirespublics ou privés.
Dynamique des communautés bactériennes detapismicrobiens soumis aux stressenvironnementaux
Aude Fourçans
To cite this version:Aude Fourçans. Dynamique des communautés bactériennes detapis microbiens soumis aux stressenvi-ronnementaux. Ecologie, Environnement. Université de Pau et des Pays de l’Adour, 2004. Français.<tel-00151969>
N° d’ordre : 2004PAUU3007
THÈSE
présentée à
L’UNIVERSITÉ DE PAU ET DES PAYS DE L’ADOUR
École doctorale des Sciences exactes et de leurs applications
par Aude FOURÇANS
pour obtenir le grade de
DOCTEUR
Spécialité : Microbiologie
Dynamique des communautés bactériennes de
tapis microbiens soumis aux stress
environnementaux
Soutenue le : 9 avril 2004
Après avis de :
Philippe Normand (DR, UMR 5557 CNRS UCBL, Lyon I) Rapporteur
Jean Claude Bertrand (Pr, LOB UMR 6535, Aix-Marseille II) Rapporteur
Devant la commission d’examen formée de :
Philippe GOULAS (Pr, LEM EA 3525, Université de Pau) Président
Gerard MUYZER (Pr Associé, Delft University of Technology – Netherlands) Examinateur
Pierre CAUMETTE (Pr, LEM EA 3525, Université de Pau) Directeur de thèse
Robert DURAN (MCF HDR, LEM EA 3525, Université de Pau) Co-directeur de thèse

Mes premiers remerciements s’adressent en premier lieu à mes Directeurs de thèse pour avoir répondu favorablement à mon souhait appuyé d’effectuer une thèse ; pour leur accueil au sein du Laboratoire d’Ecologie Moléculaire ; pour m’avoir dirigée de manière si complémentaire, et surtout pour toute la confiance qu’ils m’ont accordée dans ce travail de thèse :
Pierre Caumette, Professeur à l’Université de Pau et des Pays de l’Adour, pour son accueil
chaleureux au sein du Laboratoire d’Ecologie Moléculaire, pour ses conseils, pour les possibilités d’ouverture au milieu scientifique et de collaboration, par le biais du projet européen MATBIOPOL et l’accès à divers congrès.
Robert Duran, Maître de Conférence à l’Université de Pau et des Pays de l’Adour, pour son encadrement avisé pendant cette thèse, pour sa présence judicieuse, pour l’indépendance qu’il m’a laissé prendre et dans laquelle j’ai su m’épanouir, pour sa disponibilité et ses conseils précieux, tout simplement pour le bel exemple de chercheur qu’il a su me donner.
Je tiens également à remercier les rapporteurs de cette thèse, Philippe Normand, Directeur de
recherche CNRS à l’Université Claude Bernard de Lyon, et Jean Claude Bertrand, Professeur à l’Université d’Aix Marseille, pour avoir accepté de juger ce travail, et aussi pour leur réelle patience dans l’attente du manuscrit ! Merci aussi à Philippe Goulas, Professeur à l’Université de Pau et des Pays de l’Adour, d’avoir présidé ce jury de thèse ; Gerard Muyzer, Professeur associé à l’Université de Delft, qui malgré la distance à volontiers accepté de participer à ce jury de thèse et d’examiner mon travail..
Ce travail de recherche n’aurait pu avoir lieu sans le soutien financier du Conseil Général des Pyrénées Atlantiques et de la Communauté Economique Européenne.
Evidemment cette thèse ne serait pas ce qu’elle est sans l’aide, la disponibilité et la bonne humeur sans cesse renouvelée de tous les membres du laboratoire. Je vous en suis reconnaissante car cela m’a permis d’évoluer dans un environnement de confiance et de sérénité. Je commencerais par citer la bande des jeunes MC de l’équipe Microbio, Régis et ses longues discussions devant un café, le calme olympien de Rémy face au speed de Marisol,…et un MC adoptif…Patrice, peut-être un bureau dans le futur labo !? Les étudiants, fort nombreux pendant ces 4 années, alors ne m’en veuillez pas si je ne peux tous vous citer ! Plus particulièrement une pensée pour mes deux « p’tits » DEA devenus grands (thésards !), Tony toujours assorti à son mobile, et Sylvain perdu sans son surf et ses skis! A vous les joies de la thèse ! Merci aussi au « club » des thésards Microbio :Odile (ah ! …Marseille !), Guillaume (c’est pas mal aussi Préchacq !) et Benji (t’as pas changé depuis le collège !). De gros bisous aux « jumelles », thésardes adoptives du LEM, Odile, Miss Montpellier (dur, dur la bio mol chère docteur !) et Séraphine alias Séverine, Miss Nouméa (courage plus qu’un an !). Merci en dernier lieu à Christine, Béatrice, Pat, Solange, Arnaud et Marie-Jo pour votre aide, vos conseils et vos coups de mains réguliers ! Enfin, un grand merci à Sophie et Guille, vous avez été présentes au sein du laboratoire au cours de ma thèse. J’ai pu apprécier votre présence, votre expérience, et tout particulièrement votre amitié. Et je les apprécie toujours !
Une tendresse toute particulière à mes parents, et à mon frère, pour vos encouragements tout au
long de mes études et vis à vis de mes choix, pour votre présence aimante de tous les instants, surtout durant cette dernière année que je vous ai fait vivre …ou subir ! Vous pourriez presque dire « on a fait une thèse ! ».

Résumé
Le principal objectif de ce travail de recherche était l’étude de la dynamique des
communautés bactériennes de tapis microbiens afin de comprendre leurs fonctionnements et
leur mécanismes d’adaptation face aux stress environnementaux. De part le développement
dans des habitats très variés et soumis à des variations des conditions environnementales
importantes, les tapis microbiens constituent des modèles de choix pour ce type d’études. La
biodiversité bactérienne a principalement été abordée par T-RFLP (Terminal Restriction
Fragment Length Polymorphism), approche moléculaire d’écologie microbienne.
Premièrement, ce travail a porté sur la description de deux tapis microbiens
photosynthétiques présents sur deux sites différents de salinité distinctes, marin (Iles
Orcades), et hypersalé (Marais salants de Camargue). La combinaison de différentes
approches d’analyses ont permis d’obtenir une image à l’échelle du micromètre de ces tapis.
Ainsi, la diversité bactérienne des principales communautés (eubactéries, bactéries
phototrophes pourpres, bactéries sulfato-réductrices) de ces tapis microbiens a été décrite par
l’approche moléculaire de T-RFLP. Les résultats de cette analyse, associés à ceux d’analyses
biogéochimiques, moléculaire DGGE (Denaturing Gradient Gel Electrophoresis),
microscopiques (CLSM), et de biomarqueurs lipidiques a permis de relier les communautés
bactériennes présentes et d’appréhender leurs rôles écologiques au sein de ces écosystèmes
complexes. Ces deux tapis bien que très différents révèlent une organisation très fine,
constituée de couches distinctes verticales de quelques micromètres, où s’agencent les
populations bactériennes en fonction de leurs caractéristiques physiologiques et des
conditions environnementales. Le tapis de Camargue est dominé en surface par les
cyanobactéries filamenteuses, principalement Microcoleus chthonoplastes. De plus, la
distribution des bactéries phototrophes pourpres et sulfato-réductrices est répartie en fonction
des gradients mesurés de sulfure, oxygène et lumière. Le tapis des îles Orcades est au
contraire dominé par les bactéries pourpres, très diversifiées, principalement du genre
Thiocapsa. Les cyanobactéries y sont faiblement représentées. La diversité bactérienne
phototrophes et sulfato-réductrices est très finement organisée le long de gradients physico-
chimiques.
Dans un deuxième temps, la distribution spatio-temporelle du tapis microbien de
Camargue en fonction du cycle nycthéméral a été étudiée. Des comportements adaptatifs chez
les bactéries pourpres, les cyanobactéries et les bactéries sulfato-réductrices ont ainsi pu être
révélés. Parmi ces réponses aux variations des microgradients de sulfure et d’oxygène, la
migration a été mise en évidence chez un grand nombre de ces microorganismes.
L’analyse de l’impact d’hydrocarbures sur les tapis microbiens de Guérande et de
Camargue a été le troisième point abordé. L’influence des paramètres environnementaux sur
la dégradation naturelle du pétrole Erika a pu être démontrée. De plus, l’impact réel de la
pollution sur les communautés du tapis a été observé montrant une succession de différentes
communautés bactériennes. Ceci révèle les capacités d’adaptation de ces écosystèmes face à
ce stress d’hydrocarbures. Même si la dégradation par voie microbiologique n’a pu être mise
en évidence dans ces systèmes, l’analyse de la diversité des gènes codant pour les
dioxygénases montre une grande diversité, suggérant que les tapis microbiens possèdent un
potentiel de dégradation important.
Ce travail a permis de mettre en évidence l’organisation dynamique des bactéries au
sein de tapis microbiens, et d’approcher leurs comportements adaptatifs vis à vis des stress
soumis.
Mots clés : Biodiversité bactérienne, tapis microbien, T-RFLP, hypersalé, structure verticale,
gradients physico-chimiques, pollution d’hydrocarbures.


INTRODUCTION 1
I. ETUDE BIBLIOGRAPHIQUE 4 I.1. LE TAPIS MICROBIEN 5 I.1.1. Description générale 5 I.1.2. Les groupes bactériens fonctionnels majeurs 8 I.1.2.1. Les cyanobactéries 8 I.1.2.2. Les bactéries chimiolithotrophes sulfo-oxydantes 9 I.1.2.3. Les bactéries phototrophes anoxygéniques (BPA) 9 I.1.2.4. Les bactéries sulfato-réductrices (BSR) 12 I.1.2.5. Les autres groupes bactériens fonctionnels 13 I.1.3. Structure verticale des communautés 14 I.1.3.1. Gradients physico-chimiques 14 I.1.3.2. Cycle du soufre 16 I.1.3.3. Distribution spatiale des communautés : résultats d’interactions 18 I.2. ADAPTATIONS AUX STRESS ENVIRONNEMENTAUX 20 I.2.1. Salinité 20 I.2.2. Gradients physico-chimiques 23 I.2.2.1. Exemple du stress oxique 23 I.2.2.2. L’énergie tactisme 24 I.2.3. Pollution d’hydrocarbures 25 I.2.3.1. Origine et Composition des pétroles 25 I.2.3.2. Dégradation des hydrocarbures 26 I.2.3.2.1. Par les microorganismes 26 I.2.3.2.2. Par les tapis microbiens 28 I.3. LES TECHNIQUES MOLECULAIRES D’ECOLOGIE MICROBIENNE 29 I.3.1. La T-RFLP (Terminal Restriction Fragment Length Polymorphism) 30 I.3.2. La DGGE (Denaturing Gradient Gel Electrophoresis) 31 II. PROCEDURES EXPERIMENTALES 32 II.1. SITES D’ETUDE 33 II.1.1. Présentation 33 II.1.1.1. Les salins de Camargue (Salins-de-Giraud - France) 33 II.1.1.2. Les îles Orcades (Ecosse) 36 II.1.1.3. Les marais salants de Guérande (Pradel – France) 38 II.2. ECHANTILLONNAGES 41 II.2.1. Le tapis microbien de Camargue 41 II.2.1.1. Campagne de mars/ juin 2000 41 II.2.1.2. Campagne de juin 2001 41 II.2.2. Le tapis microbien des Iles Orcades 42 ø Campagne de juillet 2000 42 II.2.3. Le tapis microbien de Guérande 42 ø Campagne de mars 2001 42 II.3. MAINTIEN DE TAPIS MICROBIEN EN MICROCOSME 43 II.3.1. Eau de mer synthétique (Camargue et Guérande) 43 II.3.2. Mise en place d’un microcosme : exemple du tapis de Guérande 43 II.4. SOUCHES BACTERIENNES, MILIEUX DE CULTURE ET CONSERVATION 45 II.4.1. Souches bactériennes utilisées 45 II.4.2. Milieux et conditions de cultures 46
II.4.2.1. Culture d’Escherichia coli 46 II.4.2.2. Culture des bactéries anaérobies 47 ø Bactéries anoxygéniques phototrophes 47 ø Bactéries sulfato-réductrices (BSR) 48 II.4.3. Conservation des souches 49 II.5. TECHNIQUES DE BIOLOGIE MOLECULAIRE 50 II.5.1. Extraction d’ADN génomique 50 II.5.1.1. A partir de cultures pures 50 II.5.1.2. A partir d’échantillons de tapis microbien 51 II.5.2. Réactions de polymérisation en chaîne (PCR) 51 II.5.2.1. PCR classique 52 ø Conditions de réaction 52 ø Conditions d’amplification 52 ø Amorces utilisées pour l’étude 53 II.5.2.2. « Nested » PCR 53 ø Conditions de réaction et d’amplification 54 ø Amorces choisies pour l’étude 54 II.5.3. Purification des produits PCR 54 II.5.4. Dosage de l’ADN par la méthode des « dots » 55 II.5.5. Digestion enzymatique 55 II.5.6. Electrophorèse 56 II.5.7. T-RFLP 56 II.5.7.1. Principe 56 II.5.7.2. Protocole expérimental 57 II.5.7.3. Analyses statistiques 58 II.5.8. RFLP 60 II.5.8.1. Principe 60 II.5.9. Banque de gènes amplifiés 61 II.5.9.1. Principe 61 II.5.9.2. Ligation 62 II.5.9.3. Transformation 62 II.5.10. Séquençage 62 II.5.10.1. Séquençage automatique 62 ø Méthode de Sanger 63 II.5.10.2. Analyse des séquences 63 III. DESCRIPTION DE TAPIS MICROBIENS 64 III.1. INTRODUCTION 65 III.2. LE TAPIS MICROBIEN HYPERSALE DE CAMARGUE (SALINS-DE-GIRAUD) 67 "Characterization of functional bacterial groups in a hypersaline microbial mat community (Salins-de-Giraud, Camargue, France)" 67 III.3. LE TAPIS MICROBIEN MARIN DES ILES ORCADES (ECOSSE) 96 "Microbial mats on the Orkney Islands revisited: microenvironment and microbial community composition"eeeeeeeeeeeeeeeeeeeeeeeeeeeeeeeeeeeeeeeeeeeeeeeeeeeeeeeeeeeeeeeeeeeeeei96 IV. DYNAMIQUE VERTICALE DES POPULATIONS EN FONCTION DES FLUCTUATIONS
PHYSICO-CHIMIQUES D’UN CYCLE NYCTHEMERAL 136 IV.1. INTRODUCTION 137 IV.2. BACTERIES PHOTOSYNTHETIQUES 139 "Vertical shift of phototrophic bacterial communities during a diel cycle in a cyanobacterial microbial mat (Salins-de-Giraud, Camargue, France)." 139 IV.3. BACTERIES SULFATO-REDUCTRICES 162
"Hypersaline microbial mat: vertical migration of sulfate reducing bacteria along a diel cycle"eeeeeeeeeeeeeeeeeeeeeeeeeeeeeeeeeeeeeeeeeeeeeeeeeeeeeeeeeeeeeeeeeeeeeeeeeeei162 V. ADAPTATION DES POPULATIONS BACTERIENNE FACE A UNE POLLUTION
D’HYDROCARBURES 182 V.1. INTRODUCTION 183 V.2. TAPIS MICROBIEN DE GUERANDE SOUMIS A UNE POLLUTION PAR LE PETROLE DE
L’ERIKA eeeeeee185 "Degradation of Erika fuel oil" 185 V.3. TAPIS MICROBIEN DE CAMARGUE SOUMIS A UNE POLLUTION PAR DIFFERENTS
PETROLES eeeeei203 "T-RFLP and functional analyses of bacterial communities changes in microbial mats following petroleum exposure" 203
CONCLUSIONS ET PERSPECTIVES 220
REFERENCES BIBLIOGRAPHIQUES 226

Introduction
Introduction
1

Introduction
Introduction :
Les tapis microbiens, écosystèmes sédimentaires complexes, mettent en jeu de
nombreux processus biologiques différents. Leurs compositions variées en communautés
bactériennes, cyanobactéries, bactéries chimiolithotrophes sulfo-oxydantes, bactéries
phototrophes anoxygéniques, bactéries sulfato-réductrices, et la nature compacte de leurs
organisations sont les caractéristiques principales de ce type d’écosystème.
De plus, ils sont, entre autres, le siège des cycles du carbone, du soufre et de l’azote.
Ils participent donc étroitement au processus dynamique du renouvellement des molécules
utilisées comme donneurs et accepteurs d’électrons par les diverses communautés
bactériennes qui les composent. Ces consortiums microbiens constituent des modèles d’étude
et de compréhension des nombreuses interactions existantes entre les communautés et leur
environnement.
Depuis ces dernières années, l’essor de nouveaux outils moléculaires d’analyse de la
biodiversité ont permis d’appréhender ces systèmes de manière intégrée, s’affranchissant ainsi
des méthodes de cultures classiques. Alors que plus de 99% des microorganismes présents
dans la nature ne sont pas accessibles par les méthodes de microbiologie classique, les
méthodes d’écologie moléculaire permettent d’améliorer les études de la diversité. Ainsi, il en
découle une meilleure compréhension et connaissance de ces écosystèmes complexes.
D’un point de vue écologique, l’étude présentée vise à étudier la place et le rôle des
microorganismes à deux niveaux :
de l’écosystème, en intégrant à l’étude de biodiversité les aspects
métaboliques, et physico-chimiques du tapis microbien.
•
• des communautés bactériennes, analysant la biodiversité du tapis microbien et
le comportement des différentes communautés face à divers stress.
Le travail présenté ici porte sur l’étude de la diversité des principales communautés
bactériennes de tapis microbiens par une approche moléculaire de polymorphisme de
restriction la T-RFLP (Terminal Restriction Fragment Length Polymorphism).
2
Introduction
Le chapitre introductif est consacré à la présentation des tapis microbiens, de leurs
communautés bactériennes majeures, et des connaissances actuelles sur les comportements de
ces communautés face à divers stress physico-chimiques, salin ou par pollution.
Face au stress salin, leurs adaptations en terme de diversité a été abordée par l’étude de
deux tapis microbiens distincts, l’un hypersalé (Salins-de-Giraud, Camargue), l’autre marin
(Iles Orcades, Ecosse). Cette étude descriptive associant l’analyse de la diversité bactérienne
et des facteurs environnementaux fait l’objet de deux articles au sein du chapitre III.
Les gradients physico-chimiques naturellement présents au sein des tapis microbiens
sont source de stress régulier par leurs fluctuations quotidiennes. L’impact de ces gradients
sur les bactéries sulfato-réductrices et phototrophes (anoxygéniques et oxygéniques) a été
étudié en détails, et les résultats sont présentés dans deux articles.
Les pollutions par des hydrocarbures, accidentelles ou non, ont des conséquences
importantes sur la diversité des bactéries. De nombreux microorganismes sont connus pour
leur capacité à métaboliser les hydrocarbures. Vu le potentiel métabolique que constituent les
tapis microbiens, l’impact de cette pollution a été étudié sur deux tapis microbiens hypersalés
(Guérande et Camargue), et les résultats sont présentés sous forme d’article.
3

I. Etude bibliographique
Chapitre I : Etude bibliographique
4

I. Etude bibliographique
I. Etude bibliographique
I.1. Le tapis microbien
I.1.1. Description générale
Dans la nature, les microorganismes ont la capacité, de part leur grande diversité
métabolique, de coloniser différents types d’habitats et d’interagir entre eux formant de ce fait
des écosystèmes plus ou moins complexes. Ainsi, la présence de tapis microbiens dans de
nombreux sites couvrant toutes les zones climatiques et géographiques, en est un bel exemple.
Ils se développent à l’interface eau-sédiment, d’environnements peu profonds tels que les
estuaires (Mir et al., 1991), les sources hydrothermales (Ferris et al., 1996), les lacs
(Brambilla et al., 2001), les déserts, les plages sablonneuses abritées (van Gemerden et al.,
1989a; Wieland et al., 2003), ou bien les environnements hypersalés comme les marais
salants (Caumette et al., 1994; Giani et al., 1989).
Souvent décrit depuis de nombreuses années (Castenholz, 1994; Caumette et al., 1994;
Esteve et al., 1992; Giani et al., 1989; Guerrero et al., 1993; Mir et al., 1991; Stal, 1994; Stal
et al., 1985 ; van Gemerden et al., 1989a; van Gemerden et al., 1989b), les tapis microbiens
correspondent à l’association de différentes populations microbiennes organisées selon leurs
physiologies, sous forme d’une structure verticale composée de strates successives. Les tapis
bactériens, généralement photosynthétiques, s’organisent de la surface vers la profondeur,
depuis les cyanobactéries, les bactéries hétérotrophes aérobies, les bactéries
chimiolithotrophes sulfo-oxydantes, les bactéries phototrophes anoxygéniques (pourpres et
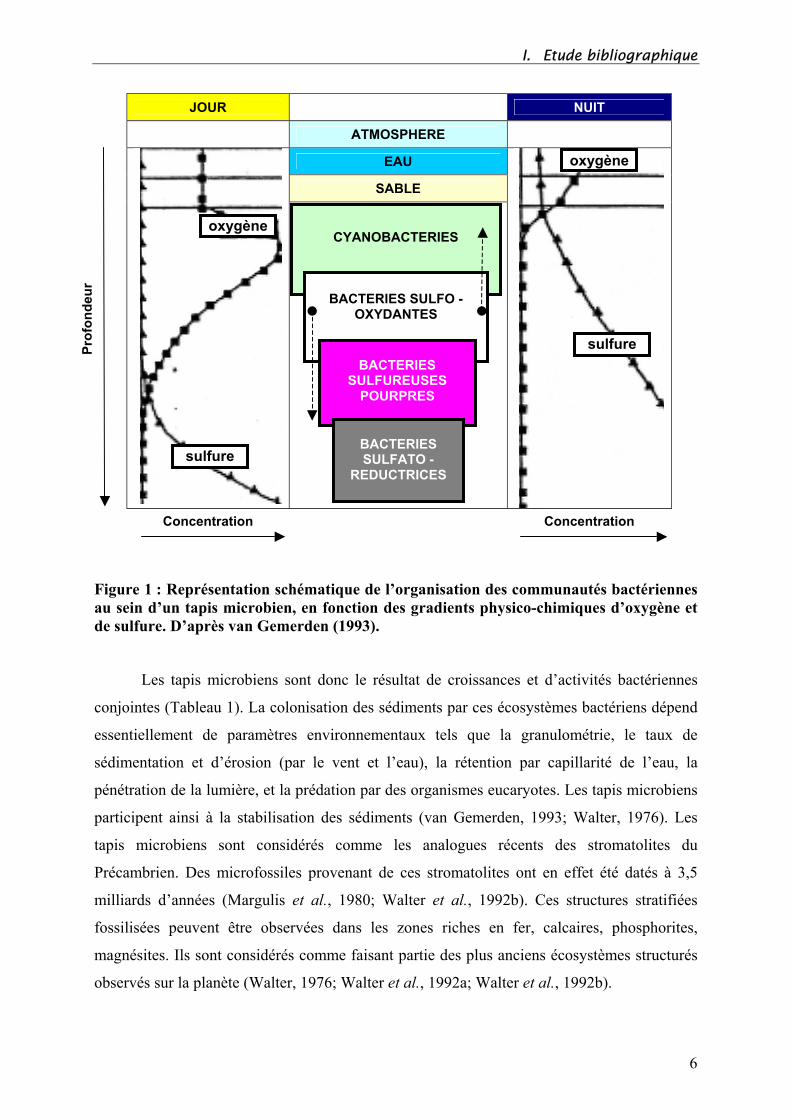
vertes) jusqu’aux bactéries sulfato-réductrices (Figure 1). Les microorganismes fermentatifs,
méthanogènes, nitrifiants ou dénitrifiants sont aussi présents au sein de ces tapis microbiens,
mais en quantités moins importantes (van Gemerden, 1993). Ainsi, sous l’influence des
activités métaboliques des différents membres de ces communautés bactériennes, des
gradients physico-chimiques verticaux d’oxygène, de sulfure et d’intensité lumineuse sont
formés (Jørgensen et al., 1983; Revsbech et al., 1983).
5
I. Etude bibliographique
JOUR NUIT
ATMOSPHERE
EAU
SABLE
Pro
fon
deu
r
Concentration
Concentration
CYANOBACTERIES
BACTERIES SULFO - OXYDANTES
BACTERIES SULFUREUSES
POURPRES
BACTERIES SULFATO -
REDUCTRICES
oxygène
oxygène
sulfure
sulfure
Figure 1 : Représentation schématique de l’organisation des communautés bactériennes
au sein d’un tapis microbien, en fonction des gradients physico-chimiques d’oxygène et
de sulfure. D’après van Gemerden (1993).
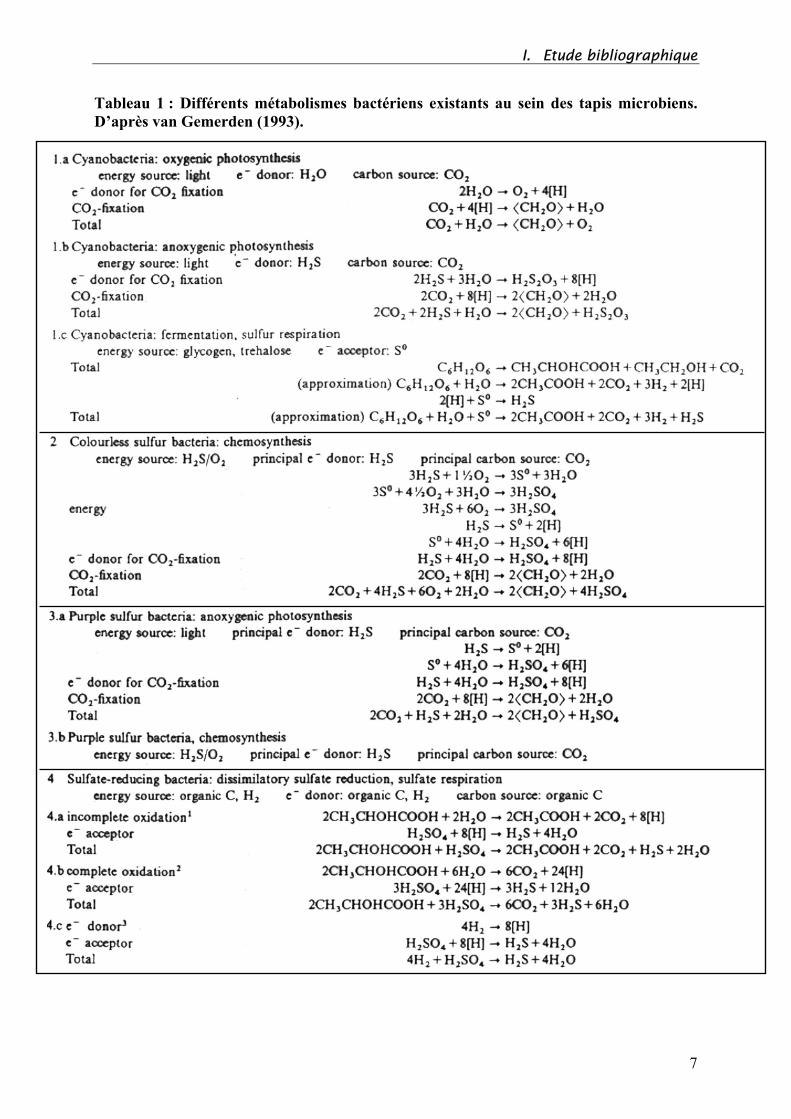
Les tapis microbiens sont donc le résultat de croissances et d’activités bactériennes
conjointes (Tableau 1). La colonisation des sédiments par ces écosystèmes bactériens dépend
essentiellement de paramètres environnementaux tels que la granulométrie, le taux de
sédimentation et d’érosion (par le vent et l’eau), la rétention par capillarité de l’eau, la
pénétration de la lumière, et la prédation par des organismes eucaryotes. Les tapis microbiens
participent ainsi à la stabilisation des sédiments (van Gemerden, 1993; Walter, 1976). Les
tapis microbiens sont considérés comme les analogues récents des stromatolites du
Précambrien. Des microfossiles provenant de ces stromatolites ont en effet été datés à 3,5
milliards d’années (Margulis et al., 1980; Walter et al., 1992b). Ces structures stratifiées
fossilisées peuvent être observées dans les zones riches en fer, calcaires, phosphorites,
magnésites. Ils sont considérés comme faisant partie des plus anciens écosystèmes structurés
observés sur la planète (Walter, 1976; Walter et al., 1992a; Walter et al., 1992b).
6
I. Etude bibliographique
Tableau 1 : Différents métabolismes bactériens existants au sein des tapis microbiens.
D’après van Gemerden (1993).
7
I. Etude bibliographique
I.1.2. Les groupes bactériens fonctionnels majeurs
I.1.2.1. Les cyanobactéries
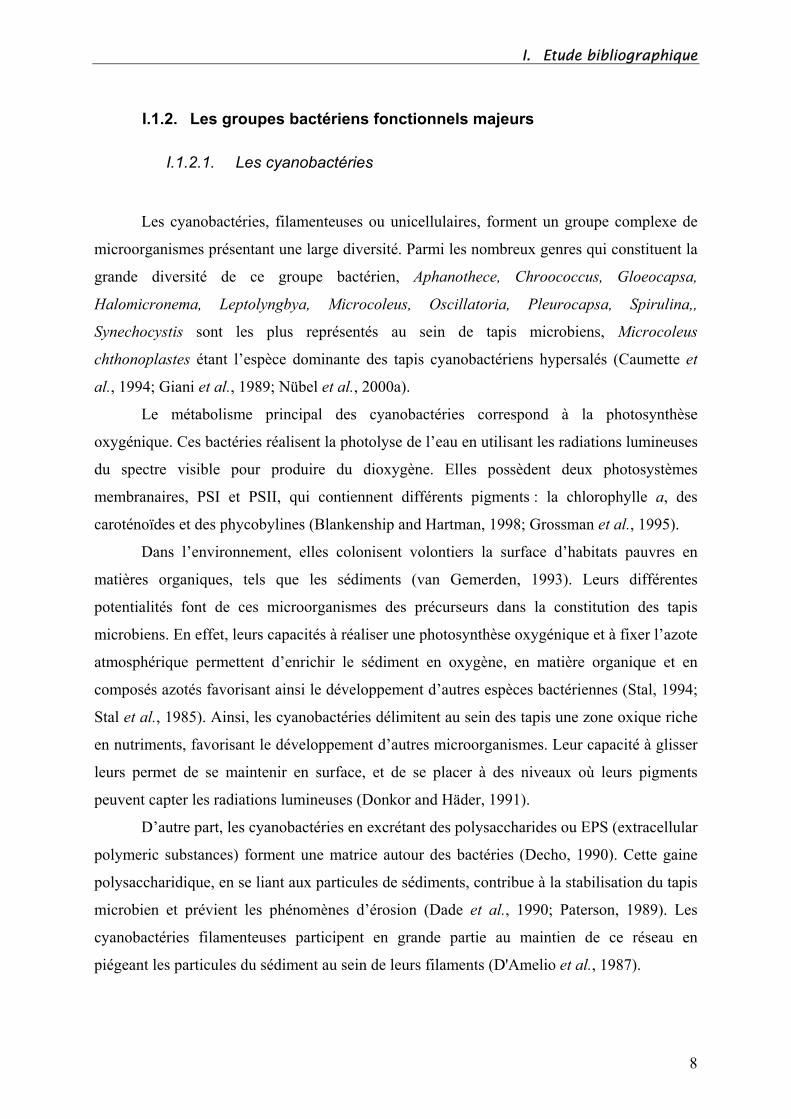
Les cyanobactéries, filamenteuses ou unicellulaires, forment un groupe complexe de
microorganismes présentant une large diversité. Parmi les nombreux genres qui constituent la
grande diversité de ce groupe bactérien, Aphanothece, Chroococcus, Gloeocapsa,
Halomicronema, Leptolyngbya, Microcoleus, Oscillatoria, Pleurocapsa, Spirulina,,
Synechocystis sont les plus représentés au sein de tapis microbiens, Microcoleus
chthonoplastes étant l’espèce dominante des tapis cyanobactériens hypersalés (Caumette et
al., 1994; Giani et al., 1989; Nübel et al., 2000a).
Le métabolisme principal des cyanobactéries correspond à la photosynthèse
oxygénique. Ces bactéries réalisent la photolyse de l’eau en utilisant les radiations lumineuses
du spectre visible pour produire du dioxygène. Elles possèdent deux photosystèmes
membranaires, PSI et PSII, qui contiennent différents pigments : la chlorophylle a, des
caroténoïdes et des phycobylines (Blankenship and Hartman, 1998; Grossman et al., 1995).
Dans l’environnement, elles colonisent volontiers la surface d’habitats pauvres en
matières organiques, tels que les sédiments (van Gemerden, 1993). Leurs différentes
potentialités font de ces microorganismes des précurseurs dans la constitution des tapis
microbiens. En effet, leurs capacités à réaliser une photosynthèse oxygénique et à fixer l’azote
atmosphérique permettent d’enrichir le sédiment en oxygène, en matière organique et en
composés azotés favorisant ainsi le développement d’autres espèces bactériennes (Stal, 1994;
Stal et al., 1985). Ainsi, les cyanobactéries délimitent au sein des tapis une zone oxique riche
en nutriments, favorisant le développement d’autres microorganismes. Leur capacité à glisser
leurs permet de se maintenir en surface, et de se placer à des niveaux où leurs pigments
peuvent capter les radiations lumineuses (Donkor and Häder, 1991).
D’autre part, les cyanobactéries en excrétant des polysaccharides ou EPS (extracellular
polymeric substances) forment une matrice autour des bactéries (Decho, 1990). Cette gaine
polysaccharidique, en se liant aux particules de sédiments, contribue à la stabilisation du tapis
microbien et prévient les phénomènes d’érosion (Dade et al., 1990; Paterson, 1989). Les
cyanobactéries filamenteuses participent en grande partie au maintien de ce réseau en
piégeant les particules du sédiment au sein de leurs filaments (D'Amelio et al., 1987).
8
I. Etude bibliographique
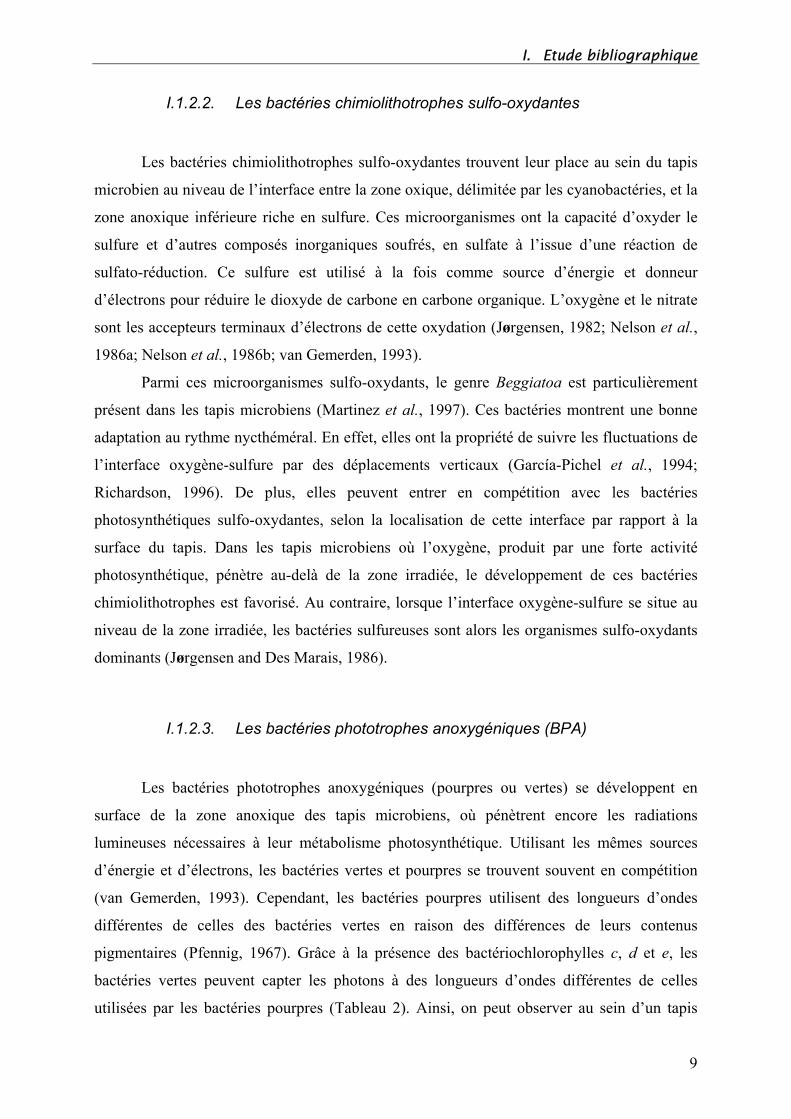
I.1.2.2. Les bactéries chimiolithotrophes sulfo-oxydantes
Les bactéries chimiolithotrophes sulfo-oxydantes trouvent leur place au sein du tapis
microbien au niveau de l’interface entre la zone oxique, délimitée par les cyanobactéries, et la
zone anoxique inférieure riche en sulfure. Ces microorganismes ont la capacité d’oxyder le
sulfure et d’autres composés inorganiques soufrés, en sulfate à l’issue d’une réaction de
sulfato-réduction. Ce sulfure est utilisé à la fois comme source d’énergie et donneur
d’électrons pour réduire le dioxyde de carbone en carbone organique. L’oxygène et le nitrate
sont les accepteurs terminaux d’électrons de cette oxydation (Jørgensen, 1982; Nelson et al.,
1986a; Nelson et al., 1986b; van Gemerden, 1993).
Parmi ces microorganismes sulfo-oxydants, le genre Beggiatoa est particulièrement
présent dans les tapis microbiens (Martinez et al., 1997). Ces bactéries montrent une bonne
adaptation au rythme nycthéméral. En effet, elles ont la propriété de suivre les fluctuations de
l’interface oxygène-sulfure par des déplacements verticaux (García-Pichel et al., 1994;
Richardson, 1996). De plus, elles peuvent entrer en compétition avec les bactéries
photosynthétiques sulfo-oxydantes, selon la localisation de cette interface par rapport à la
surface du tapis. Dans les tapis microbiens où l’oxygène, produit par une forte activité
photosynthétique, pénètre au-delà de la zone irradiée, le développement de ces bactéries
chimiolithotrophes est favorisé. Au contraire, lorsque l’interface oxygène-sulfure se situe au
niveau de la zone irradiée, les bactéries sulfureuses sont alors les organismes sulfo-oxydants
dominants (Jørgensen and Des Marais, 1986).
I.1.2.3. Les bactéries phototrophes anoxygéniques (BPA)
Les bactéries phototrophes anoxygéniques (pourpres ou vertes) se développent en
surface de la zone anoxique des tapis microbiens, où pénètrent encore les radiations
lumineuses nécessaires à leur métabolisme photosynthétique. Utilisant les mêmes sources
d’énergie et d’électrons, les bactéries vertes et pourpres se trouvent souvent en compétition
(van Gemerden, 1993). Cependant, les bactéries pourpres utilisent des longueurs d’ondes
différentes de celles des bactéries vertes en raison des différences de leurs contenus
pigmentaires (Pfennig, 1967). Grâce à la présence des bactériochlorophylles c, d et e, les
bactéries vertes peuvent capter les photons à des longueurs d’ondes différentes de celles
utilisées par les bactéries pourpres (Tableau 2). Ainsi, on peut observer au sein d’un tapis
9
I. Etude bibliographique
microbien une stratification verticale des ces bactéries phototrophes anoxygéniques, les
bactéries pourpres se localisant au-dessus des bactéries vertes.
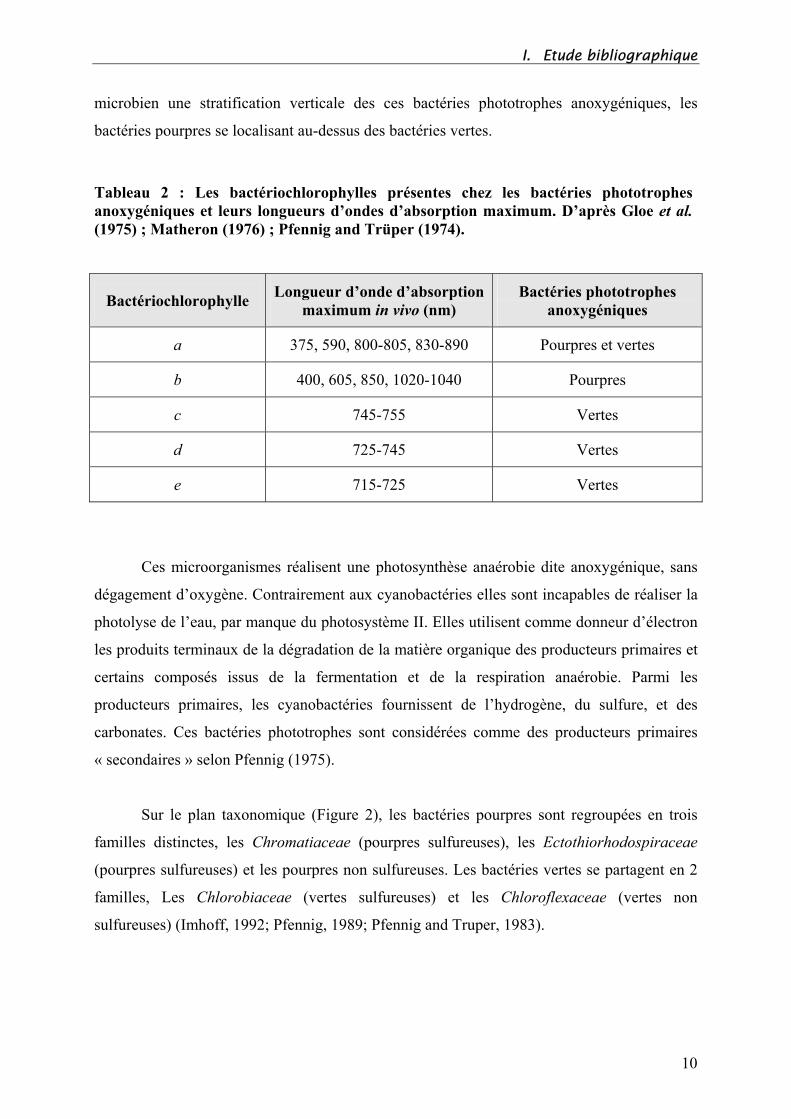
Tableau 2 : Les bactériochlorophylles présentes chez les bactéries phototrophes
anoxygéniques et leurs longueurs d’ondes d’absorption maximum. D’après Gloe et al.
(1975) ; Matheron (1976) ; Pfennig and Trüper (1974).
Bactériochlorophylle Longueur d’onde d’absorption
maximum in vivo (nm)
Bactéries phototrophes
anoxygéniques
a 375, 590, 800-805, 830-890 Pourpres et vertes
b 400, 605, 850, 1020-1040 Pourpres
c 745-755 Vertes
d 725-745 Vertes
e 715-725 Vertes
Ces microorganismes réalisent une photosynthèse anaérobie dite anoxygénique, sans
dégagement d’oxygène. Contrairement aux cyanobactéries elles sont incapables de réaliser la
photolyse de l’eau, par manque du photosystème II. Elles utilisent comme donneur d’électron
les produits terminaux de la dégradation de la matière organique des producteurs primaires et
certains composés issus de la fermentation et de la respiration anaérobie. Parmi les
producteurs primaires, les cyanobactéries fournissent de l’hydrogène, du sulfure, et des
carbonates. Ces bactéries phototrophes sont considérées comme des producteurs primaires
« secondaires » selon Pfennig (1975).
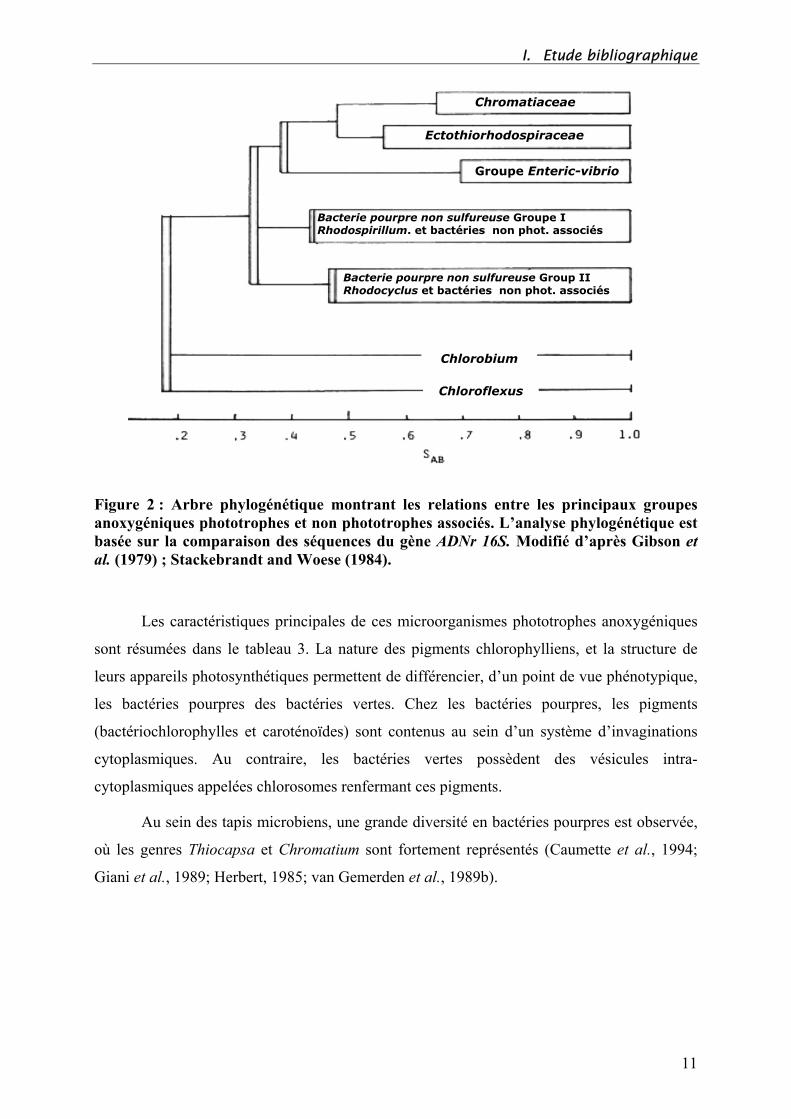
Sur le plan taxonomique (Figure 2), les bactéries pourpres sont regroupées en trois
familles distinctes, les Chromatiaceae (pourpres sulfureuses), les Ectothiorhodospiraceae
(pourpres sulfureuses) et les pourpres non sulfureuses. Les bactéries vertes se partagent en 2
familles, Les Chlorobiaceae (vertes sulfureuses) et les Chloroflexaceae (vertes non
sulfureuses) (Imhoff, 1992; Pfennig, 1989; Pfennig and Truper, 1983).
10
I. Etude bibliographique
11
Chloroflexus
Bacterie pourpre non sulfureuse Group II Rhodocyclus et bactéries non phot. associés
Chlorobium
Bacterie pourpre non sulfureuse Groupe I Rhodospirillum. et bactéries non phot. associés
Groupe Enteric-vibrio
Ectothiorhodospiraceae
Chromatiaceae
Figure 2 : Arbre phylogénétique montrant les relations entre les principaux groupes
anoxygéniques phototrophes et non phototrophes associés. L’analyse phylogénétique est
basée sur la comparaison des séquences du gène ADNr 16S. Modifié d’après Gibson et
al. (1979) ; Stackebrandt and Woese (1984).
Les caractéristiques principales de ces microorganismes phototrophes anoxygéniques
sont résumées dans le tableau 3. La nature des pigments chlorophylliens, et la structure de
leurs appareils photosynthétiques permettent de différencier, d’un point de vue phénotypique,
les bactéries pourpres des bactéries vertes. Chez les bactéries pourpres, les pigments
(bactériochlorophylles et caroténoïdes) sont contenus au sein d’un système d’invaginations
cytoplasmiques. Au contraire, les bactéries vertes possèdent des vésicules intra-
cytoplasmiques appelées chlorosomes renfermant ces pigments.
Au sein des tapis microbiens, une grande diversité en bactéries pourpres est observée,
où les genres Thiocapsa et Chromatium sont fortement représentés (Caumette et al., 1994;
Giani et al., 1989; Herbert, 1985; van Gemerden et al., 1989b).

I. Etude bibliographique
Tableau 3 : Principales caractéristiques des bactéries phototrophes anoxygéniques.
Microorganismes
phototrophes
Donneurs
d’électrons
Source de
carbone
Réserves de
soufre
Bactério-
chlorophylles Croissance
Pourpres sulfureuses
(Chromatiaceae,
Ectothiorhospiraceae)
H2, H2S,
S°,
composés
soufrés
CO2,
composés
organiques
Globules
intracellulaires
ou
extracellulaires
Bchl a, b
Photolithototrophe
en anaérobiose,
chimiotrophes en
aérobiose et à
l’obscurité
Pourpres
non-sulfureuses
Composés
organiques,
(H2, H2S,
S°,
composés
soufrés)
CO2,
composés
organiques
Globules
extracellulairesBchl a, b
Photohétérotrophe
en anaérobiose,
chimiotrophes en
aérobiose et à
l’obscurité
Vertes sulfureuses
(Chlorobiaceae)
H2S, S°,
H2,
composés
soufrés,
CO2 Globules
extracellulairesBchl a, c, d, e
Photolithototrophe
anaérobie stricte
Vertes
non- sulfureuses
(Chloroflexaceae)
Composés
organiques,
(H2S, S°,
H2)
CO2,
composés
organiques
aucune Bchl a, c, d
Photohétérotrophe
en anaérobiose,
chimiotrophes en
aérobiose et à
l’obscurité
I.1.2.4. Les bactéries sulfato-réductrices (BSR)
Les bactéries sulfato-réductrices se localisent dans les zones anoxiques des sédiments.
La respiration aérobie des bactéries hétérotrophes du tapis appauvrit le sédiment en oxygène
conduisant à l’anoxie du tapis microbien en profondeur (Marshall, 1989). Cette zone est
également enrichie en matière organique, composés simples provenant des processus de
dégradation aérobies et anaérobies, et en sulfate issu de l’oxydation des sulfures par les
bactéries phototrophes anoxygéniques. Les bactéries sulfato-réductrices s’y développent
aisément en utilisant les composés organiques simples comme donneurs d’électrons et sources
de carbone, et le sulfate comme accepteur terminal d’électrons. Cette respiration dissimilatrice
du sulfate entraîne la production de sulfure et la formation d’un gradient associé (Barton and
Tomei, 1995 ; Fauque, 1995). La sulfato-réduction est un processus important de
minéralisation de la matière organique au sein d’environnements anoxiques, tels que les
écosystèmes hypersalés et marins (Ollivier et al., 1994).
12
I. Etude bibliographique
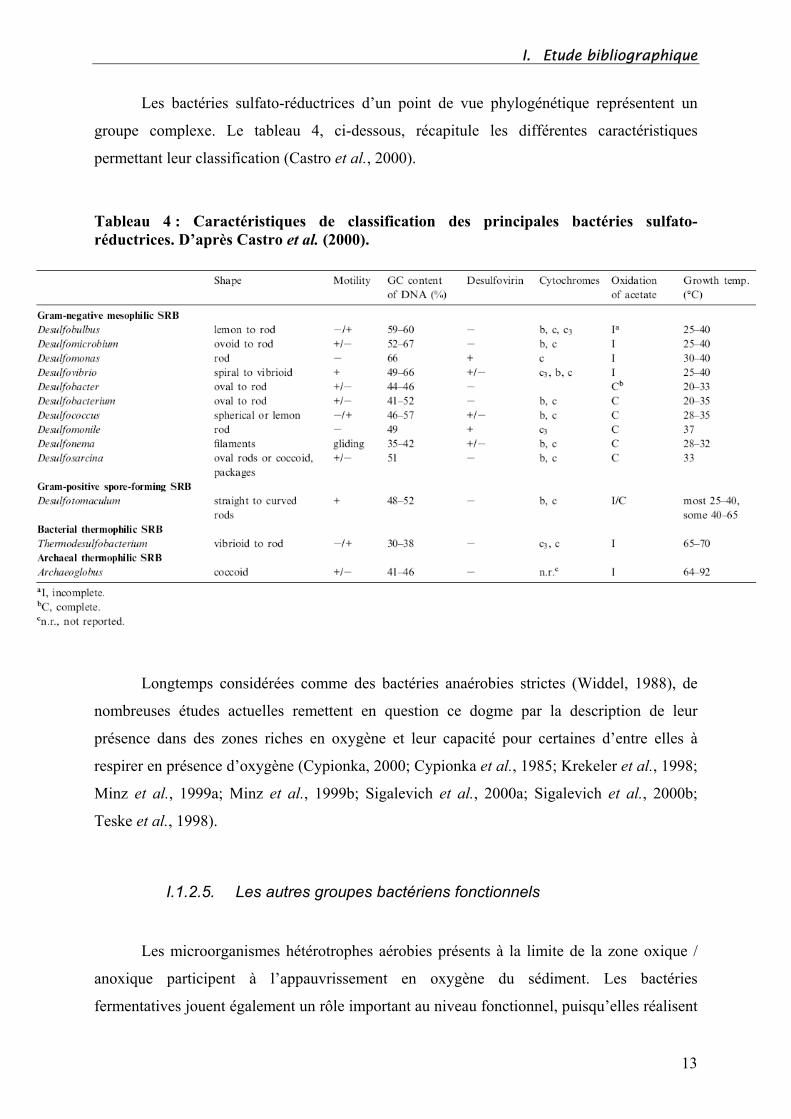
Les bactéries sulfato-réductrices d’un point de vue phylogénétique représentent un
groupe complexe. Le tableau 4, ci-dessous, récapitule les différentes caractéristiques
permettant leur classification (Castro et al., 2000).
Tableau 4 : Caractéristiques de classification des principales bactéries sulfato-
réductrices. D’après Castro et al. (2000).
Longtemps considérées comme des bactéries anaérobies strictes (Widdel, 1988), de
nombreuses études actuelles remettent en question ce dogme par la description de leur
présence dans des zones riches en oxygène et leur capacité pour certaines d’entre elles à
respirer en présence d’oxygène (Cypionka, 2000; Cypionka et al., 1985; Krekeler et al., 1998;
Minz et al., 1999a; Minz et al., 1999b; Sigalevich et al., 2000a; Sigalevich et al., 2000b;
Teske et al., 1998).
I.1.2.5. Les autres groupes bactériens fonctionnels
Les microorganismes hétérotrophes aérobies présents à la limite de la zone oxique /
anoxique participent à l’appauvrissement en oxygène du sédiment. Les bactéries
fermentatives jouent également un rôle important au niveau fonctionnel, puisqu’elles réalisent
13
I. Etude bibliographique
les étapes préliminaires de la dégradation de la matière organique et fournissent des substrats
aux bactéries sulfato-réductrices. Les bactéries nitrifiantes (bactéries aérobies oxydant
l’azote), dénitrifiantes (bactéries aéro-anaérobies facultatives pouvant utiliser des formes
oxydées de l’azote comme accepteur final d’électrons) et méthanogènes (bactéries anaérobies
productrices de méthane) sont présentes au sein des tapis microbiens mais en moindre
abondance (van Gemerden, 1993).
I.1.3. Structure verticale des communautés
I.1.3.1. Gradients physico-chimiques
Ces écosystèmes microbiens, comprenant des bactéries sulfato-réductrices, des
phototrophes des chimiolithotrophes sulfo-oxydantes, associées à des couches denses de
cyanobactéries productrices d’oxygène, sont le siège de gradients physico-chimiques étroits.
La nature compacte des tapis combinée aux divers processus biologiques tels que la
photosynthèse, la respiration, la fermentation, et la sulfato-réduction créent des micro-
gradients de concentrations d'oxygène, de sulfure soluble, d'ions hydrogène, et d'autres
espèces chimiques (Revsbech et al., 1983). De plus, les gradients liés à l’intensité de la
lumière et à son spectre apparaissent avec la forte absorption des radiations lumineuses
(Jørgensen and Des Marais, 1988; Kühl, 1992; Kühl and Fenchel, 2000; Lassen et al., 1992;
Pierson et al., 1987).
Ces gradients environnementaux présentent de fortes fluctuations au cours du cycle
nycthéméral (jour / nuit), en fonction de la grande variété de métabolismes bactériens mis en
jeu (Jørgensen et al., 1983; Wieland et al., 2004) (Figure 3).
Ainsi, en journée, les radiations lumineuses disponibles en surface pour les
cyanobactéries induisent une production d’oxygène importante, par la photosynthèse. Cette
forte concentration en oxygène pénètre jusqu’au niveau du premier millimètre du tapis, puis
diminue fortement et disparaît sous l’action des bactéries hétérotrophes aérobies qui le
consomment. Il s’est donc défini au-delà de ce millimètre une zone totalement anoxique. A
l’opposé, il apparaît un gradient de sulfure par le biais de la réduction du sulfate, réalisée par
les bactéries sulfato-réductrices situées dans les profondeurs du sédiment. Cette forte
concentration en sulfure disparaît brutalement entre le 1er
et le 2ème
millimètre, sous l’action
des bactéries sulfo-oxydantes phototrophes ou non. Il en résulte une zone anaérobie riche en
14
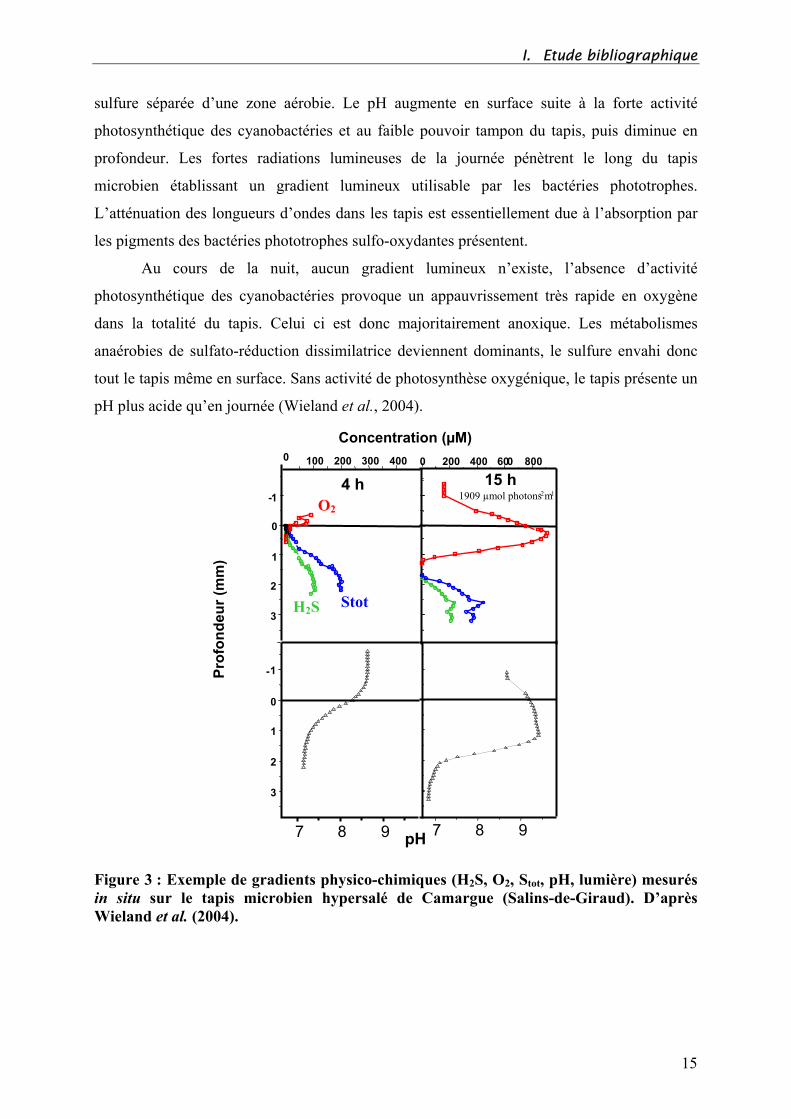
I. Etude bibliographique
sulfure séparée d’une zone aérobie. Le pH augmente en surface suite à la forte activité
photosynthétique des cyanobactéries et au faible pouvoir tampon du tapis, puis diminue en
profondeur. Les fortes radiations lumineuses de la journée pénètrent le long du tapis
microbien établissant un gradient lumineux utilisable par les bactéries phototrophes.
L’atténuation des longueurs d’ondes dans les tapis est essentiellement due à l’absorption par
les pigments des bactéries phototrophes sulfo-oxydantes présentent.
Au cours de la nuit, aucun gradient lumineux n’existe, l’absence d’activité
photosynthétique des cyanobactéries provoque un appauvrissement très rapide en oxygène
dans la totalité du tapis. Celui ci est donc majoritairement anoxique. Les métabolismes
anaérobies de sulfato-réduction dissimilatrice deviennent dominants, le sulfure envahi donc
tout le tapis même en surface. Sans activité de photosynthèse oxygénique, le tapis présente un
pH plus acide qu’en journée (Wieland et al., 2004).
Concentration (µM)
pH
Stot
O2 -1
0
1
H2S
97 8
0 200 400 600 800
4 h
0 100 200 300 400
1909 µmol photon m
15 h -1s -2
1-
0
1
2
3
2
3
97 8
Pro
fon
de
ur
(mm
)
Figure 3 : Exemple de gradients physico-chimiques (H2S, O2, Stot, pH, lumière) mesurés
in situ sur le tapis microbien hypersalé de Camargue (Salins-de-Giraud). D’après
Wieland et al. (2004).
15
I. Etude bibliographique
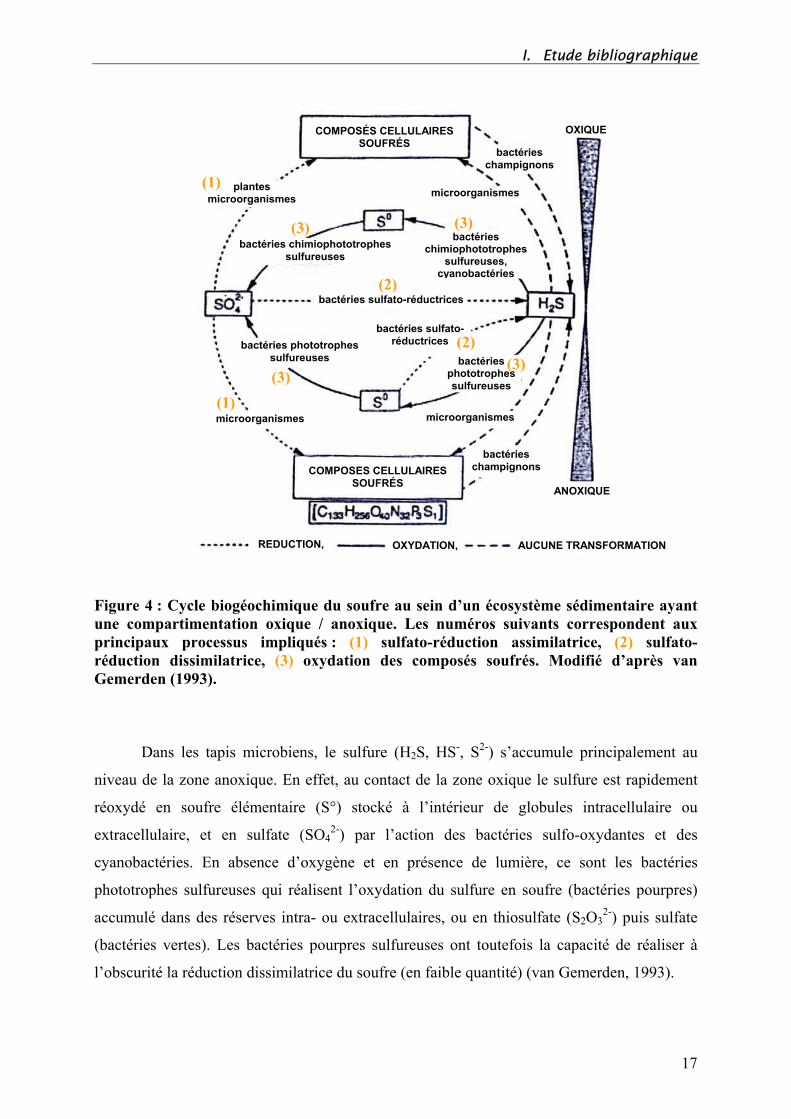
I.1.3.2. Cycle du soufre
Les tapis microbiens sont caractérisés par la forte interaction entre les différents cycles
biogéochimiques de l’oxygène, du soufre, et du carbone (Canfield and Des Marais, 1993)
(Wieland and Kühl, 2000). Les communautés sulfato-réductrices, phototrophes
anoxygéniques sulfureuses et sulfo-oxydantes constituent les trois principaux groupes
physiologiques des tapis impliqués dans le cycle du soufre (Overmann and van Gemerden,
2000). Un tel écosystème représente un modèle idéal d’étude du cycle du soufre.
De part l’état d’oxydation variable du soufre de –2 (sulfure : S2-
) à +6 (sulfate : SO42-
),
les différents composés soufrés existants (sulfate, sulfite, soufre, thiosulfate, polythionates)
peuvent être oxydés en tant que donneur d’électrons ou réduit en tant qu’accepteur
d’électrons. Les bactéries jouent un rôle important dans ces différents processus. Le soufre
constitue un élément essentiel pour ces organismes vivants, puisqu’il intervient dans la
composition d’acides aminés (cystéine, méthionine), la structure tertiaire de protéines (ponts
disulfures), la constitution de coenzymes (thiamine, biotine) et d’osmolytes, mais aussi au
niveau de centres réactionnels d’enzymes (en association avec le fer) impliqués dans divers
métabolismes bactériens.
Le cycle du soufre correspond à la combinaison de plusieurs processus biologiques ou
chimiques mis en jeu, assurant le renouvellement dynamique des donneurs et accepteurs
d’électrons dans le tapis microbien (Figure 4). Au sein du tapis, les différents groupes
bactériens sont très proches les uns des autres permettant ainsi une étroite relation entre les
différents processus biologiques présents (van Gemerden, 1993). Le cycle du soufre
correspond à l’association de trois processus principaux :
- la sulfato-réduction assimilatrice (1),
- la sulfato-réduction dissimilatrice (2),
- l’oxydation des composés soufrés (3).
16
I. Etude bibliographique
REDUCTION, AUCUNE TRANSFORMATIONOXYDATION,
bactéries phototrophes sulfureuses (3)
bactéries phototrophesulfureuses
s (3)
COMPOSÉS CELLULAIRES SOUFRÉS
bactéries sulfato-réductrices (2)
bactéries champignons
microorganismesmicroorganismes (1)
bactéries sulfato-réductrices(2)
bactéries chimiophototrophes
sulfureuses, cyanobactéries
(3)
bactéries chimiophototrophes sulfureuses
(3)
bactéries champignons
microorganismesplantes
microorganismes (1)
ANOXIQUE
OXIQUE
COMPOSES CELLULAIRES SOUFRÉS
Figure 4 : Cycle biogéochimique du soufre au sein d’un écosystème sédimentaire ayant
une compartimentation oxique / anoxique. Les numéros suivants correspondent aux
principaux processus impliqués : (1) sulfato-réduction assimilatrice, (2) sulfato-
réduction dissimilatrice, (3) oxydation des composés soufrés. Modifié d’après van
Gemerden (1993).
Dans les tapis microbiens, le sulfure (H2S, HS-, S
2-) s’accumule principalement au
niveau de la zone anoxique. En effet, au contact de la zone oxique le sulfure est rapidement
réoxydé en soufre élémentaire (S°) stocké à l’intérieur de globules intracellulaire ou
extracellulaire, et en sulfate (SO42-
) par l’action des bactéries sulfo-oxydantes et des
cyanobactéries. En absence d’oxygène et en présence de lumière, ce sont les bactéries
phototrophes sulfureuses qui réalisent l’oxydation du sulfure en soufre (bactéries pourpres)
accumulé dans des réserves intra- ou extracellulaires, ou en thiosulfate (S2O32-
) puis sulfate
(bactéries vertes). Les bactéries pourpres sulfureuses ont toutefois la capacité de réaliser à
l’obscurité la réduction dissimilatrice du soufre (en faible quantité) (van Gemerden, 1993).
17
I. Etude bibliographique
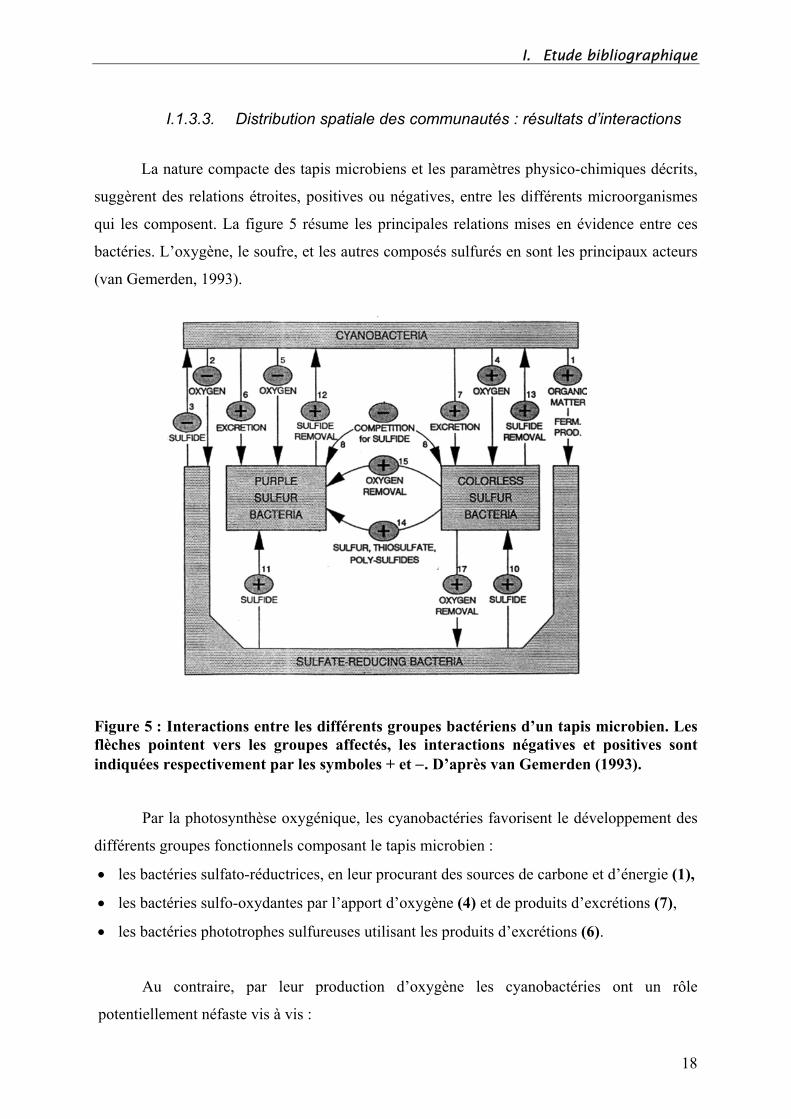
I.1.3.3. Distribution spatiale des communautés : résultats d’interactions
La nature compacte des tapis microbiens et les paramètres physico-chimiques décrits,
suggèrent des relations étroites, positives ou négatives, entre les différents microorganismes
qui les composent. La figure 5 résume les principales relations mises en évidence entre ces
bactéries. L’oxygène, le soufre, et les autres composés sulfurés en sont les principaux acteurs
(van Gemerden, 1993).
Figure 5 : Interactions entre les différents groupes bactériens d’un tapis microbien. Les
flèches pointent vers les groupes affectés, les interactions négatives et positives sont
indiquées respectivement par les symboles + et −. D’après van Gemerden (1993).
Par la photosynthèse oxygénique, les cyanobactéries favorisent le développement des
différents groupes fonctionnels composant le tapis microbien :
les bactéries sulfato-réductrices, en leur procurant des sources de carbone et d’énergie (1), • • •
les bactéries sulfo-oxydantes par l’apport d’oxygène (4) et de produits d’excrétions (7),
les bactéries phototrophes sulfureuses utilisant les produits d’excrétions (6).
Au contraire, par leur production d’oxygène les cyanobactéries ont un rôle
potentiellement néfaste vis à vis :
18
I. Etude bibliographique
des BSR, certaines sont très sensibles à l’oxygène produit (2), • • des BPA, dont la synthèse de leurs pigments est inhibée induisant l’utilisation d’un
métabolisme chimiolithotrophe moins productif (5).
Les bactéries chimiolithotrophes sulfo-oxydantes permettent au contraire de protéger
les BPA (15), mais aussi les BSR (17) de cet important apport en oxygène, en l’utilisant pour
oxyder le sulfure présent. De plus, celles-ci produisent des composés soufrés réduits
utilisables par les BPA (14).
Les BSR, par la sulfato-réduction, produisent du sulfure en grande quantité au sein du
tapis. Celui-ci est toxique pour les cyanobactéries (3), puisqu’il inhibe leur croissance. En
contre partie, ce sulfure sera réoxydé par les différentes bactéries sulfo-oxydantes (10) (11).
Ceci est bénéfique à la prolifération des cyanobactéries (12) (13), dont la croissance est
inhibée par le sulfure. L’utilisation concomitante de ce même donneur d’électrons, fait entrer
en compétition ces deux groupes fonctionnels(8).
De Wit et al. (1995) ont cherché à modéliser les interactions existantes entre les
différentes communautés d’un tapis microbien afin de cerner l’impact des paramètres
biotiques et abiotiques sur la structuration des communautés. Ce modèle mathématique simule
la croissance de microorganismes autotrophes d’un tapis microbien en relation avec les
gradients d’oxygène, de sulfure et de lumière. Les microorganismes modèles choisis M.
chtonoplastes, Thiocapsa roseospersicina, et Thiobacillus tioparus, sont respectivement
représentatifs des cyanobactéries, des bactéries pourpres sulfureuses, et des bactéries sulfo-
oxydantes. Il s’agit d’une simulation mathématique de 2 mois au cours desquelles un tapis
microbien se développe en fonction de paramètres environnementaux donnés. Les résultats de
cette étude révèlent une stratification typique de tapis microbiens très similaire à celle souvent
décrite. Un tel modèle permet donc de décrire les relations complexes existantes entre les
populations bactériennes et les paramètres environnementaux, à partir de connaissances
écophysiologiques. De plus, il permet de déduire les impacts liés aux changements de
conditions environnementales, sur la structure des communautés bactériennes.
19
I. Etude bibliographique
I.2. Adaptations aux stress environnementaux
Les tapis microbiens comme décrits précédemment sont des structures complexes
mettant en jeu de nombreuses interactions biologiques ou non. L’apport d’un stress extérieur
qu’il soit récurant (fortes concentrations en sels dans les marais salants) ou accidentel
(pollution chimique, pétrolière), induit un fort potentiel d’adaptation des communautés
bactériennes présentes.
I.2.1. Salinité
De nombreux tapis microbiens se développent au niveau d’environnements hypersalés,
tels que les marais salants (Caumette et al., 1994; Giani et al., 1989; Hirschler-Rea et al.,
2003; Nicholson et al., 1987; Nubel et al., 2001; Teal et al., 1996). La production de sels, par
évaporation de l’eau, induit la précipitation séquentielle des sels de calcium, puis de sodium.
Ces habitats présentent donc une grande variabilité au niveau de leur concentration totale en
sels, de leur composition ionique, et de leur pH.
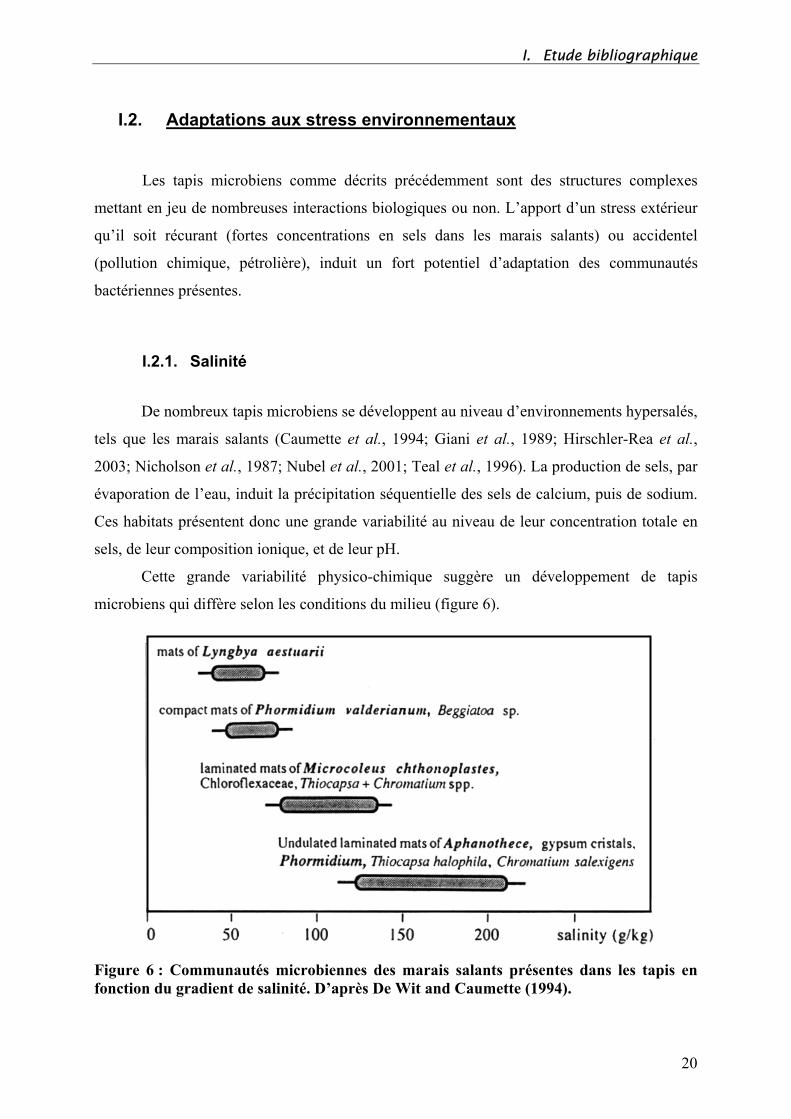
Cette grande variabilité physico-chimique suggère un développement de tapis
microbiens qui diffère selon les conditions du milieu (figure 6).
Figure 6 : Communautés microbiennes des marais salants présentes dans les tapis en
fonction du gradient de salinité. D’après De Wit and Caumette (1994).
20
I. Etude bibliographique
Les communautés bactériennes présentes sont capables de s’adapter au stress osmotique par
une grande versatilité métabolique allant de l’halotolérance aux halophiles extrêmes (Ollivier
et al., 1994).
Les microorganismes sont dits halotolérants lorsqu’ils sont capables de se développer
sans sels, tout en tolérant des concentrations variables en sels. Au contraire, ils sont halophiles
lorsqu’ils ne peuvent se développer qu’en présence de sels. Parmi les microorganismes
tolérants aux sels, trois groupes peuvent être définis en fonction de la concentration en sels
nécessaire à une croissance optimale (Larsen, 1986) :
groupe 1 : microorganismes légèrement halophiles (optimum se situant entre 2 et 5 %), • • •
groupe 2 : microorganismes halophiles modérés (optimum se situant entre 5 et 20 %),
groupe 3 : microorganismes halophiles extrêmes (optimum se situant entre 20 et 30 %).
Il existe différents mécanismes d’osmorégulation chez les microorganismes leur
permettant de se développer au sein d’environnements hypersalés :
- le transport d’ion à travers la membrane par des pompes ioniques
- la synthèse ou l’accumulation de molécules organiques.
Les osmolytes organiques permettent en effet de maintenir la pression de turgescence au sein
des cellules soumises à un stress aux sels. Une grande variété de substrats est disponible dans
les habitats hypersalés. Outre le potassium K+, les bactéries halophiles, accumulent des
composés de faibles poids moléculaires tel que la glycine-bétaïne. Les cyanobactéries sont
aussi capables d’accumuler le sucrose et le thréalose. Les espèces d’Ectothiorhodospira
synthétisent un acide aminé cyclique l’ectoïne (Ollivier et al., 1994).
L’étude de différents tapis microbiens hypersalés a pu montrer l’impact de la salinité
sur la diversité bactérienne. En effet, plus la salinité augmente, plus la biodiversité
bactérienne de ces tapis diminue (Benlloch et al., 2002; Casamayor et al., 2002; Nübel et al.,
2000b).
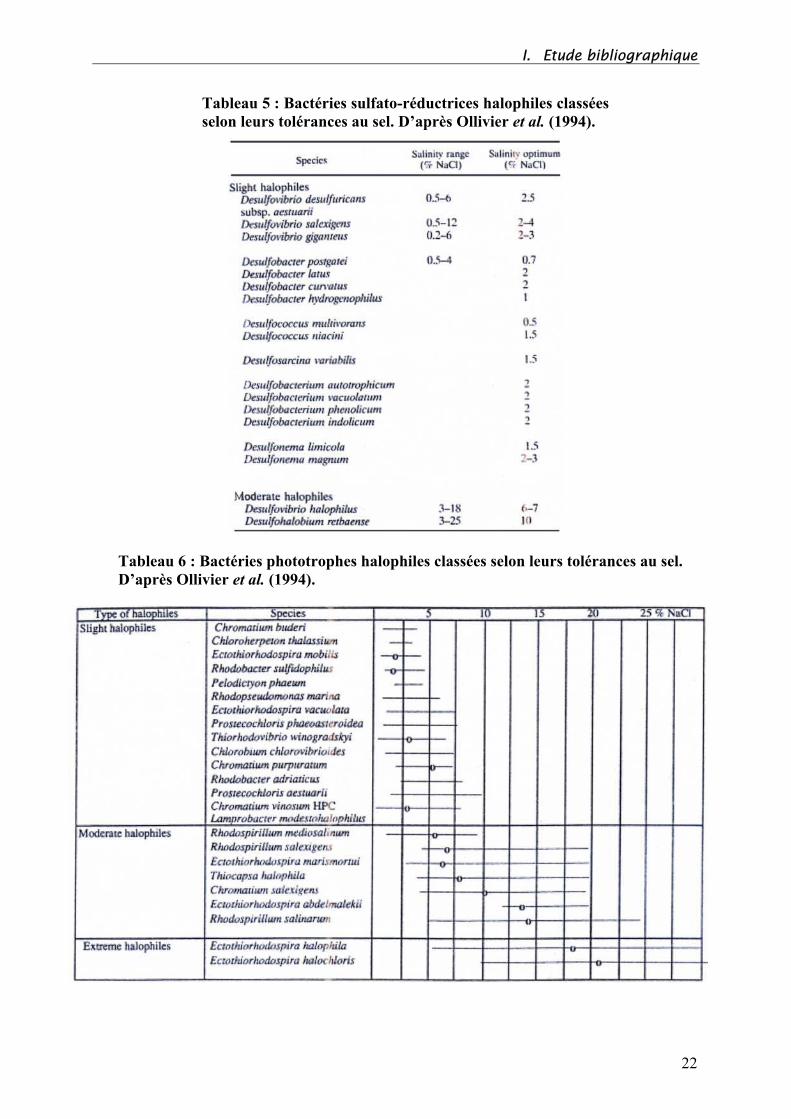
Les tableaux 5 et 6 ci-dessous résument la tolérance aux sels des bactéries sulfato-
réductrices et des bactéries phototrophes.
21
I. Etude bibliographique
Tableau 5 : Bactéries sulfato-réductrices halophiles classées
selon leurs tolérances au sel. D’après Ollivier et al. (1994).
Tableau 6 : Bactéries phototrophes halophiles classées selon leurs tolérances au sel.
D’après Ollivier et al. (1994).
22
I. Etude bibliographique
I.2.2. Gradients physico-chimiques
Au cœur des tapis microbiens, les gradients physico-chimiques de sulfure, d’oxygène,
de pH, et de lumière présents peuvent être source de stress. Comme l’ont montré plusieurs
travaux (Revsbech et al., 1983; Wieland et al., 2004), ces gradients présentent de fortes
fluctuations au cours d’un cycle nycthéméral, en terme de concentration et de localisation.
Ponctuellement, mais régulièrement les bactéries sont donc soumises aux stress induits par
l’oxygène, le sulfure, la lumière ou le pH.
I.2.2.1. Exemple du stress oxique
Le stress oxique est l’un des plus étudiés chez les bactéries sulfato-réductrices,
microorganismes longtemps considérés comme des anaérobies strictes. En effet, de
nombreuses études de biodiversité ont démontré la présence régulière de BSR dans la zone
oxique de tapis microbiens (Canfield and Des Marais, 1991; Minz et al., 1999a; Minz et al.,
1999b; Teske et al., 1998).
Certaines BSR tolèrent la présence d’oxygène en s’adaptant par différents moyens :
Présence d’enzyme de détoxication (catalase, superoxyde dismutase), • •
•
Migration vers des conditions optimales de croissance. Des vitesses de migration allant
de 1 à 69 µm.s-1
ont été mesurées, pour des souches de l’espèce Desulfovirio oxyclinae
(Krekeler et al., 1998).
Agrégation, observée chez le genre Desulfonema lorsqu’il se retrouve en surface du
tapis (Sigalevich et al., 2000a).
Au contraire, d’autres BSR ont des métabolismes versatiles, puisqu’elles sont capables de
respirer en présence d’oxygène (Cypionka, 2000; Cypionka et al., 1985; Krekeler et al., 1998;
Sigalevich et al., 2000b).
De nombreux autres stress, vis à vis de l’eau, de la lumière, du sulfure et de l’oxygène
ont été étudiés chez les cyanobactéries (Bebout and Garcia-Pichel, 1995; Garcia-Pichel and
Pringault, 2001; Kruschel and Castenholz, 1998; Pringault and Garcia-Pichel, 2003), les
bactéries pourpres (Rhodobacter sphaeroides, Marichromatium gracile) (Romagnoli et al.,
2002; Thar and Kuhl, 2001), les bactéries sulfo-oxydantes (Beggiatoa) (García-Pichel et al.,
23
I. Etude bibliographique
1994; Richardson, 1996). Un mécanisme général de migration a été décrit pour tous ces
microorganismes afin d’échapper rapidement à ces conditions physico-chimiques extrêmes.
Ce comportement s’appelle l’énergie tactisme.
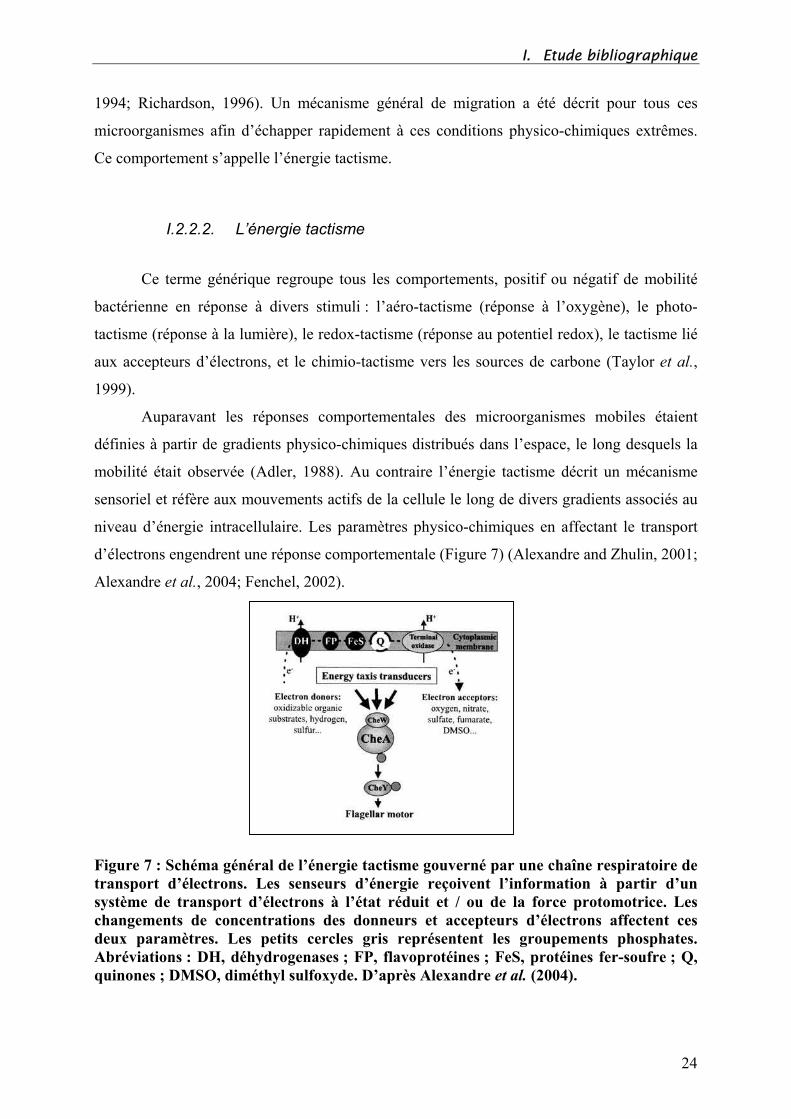
I.2.2.2. L’énergie tactisme
Ce terme générique regroupe tous les comportements, positif ou négatif de mobilité
bactérienne en réponse à divers stimuli : l’aéro-tactisme (réponse à l’oxygène), le photo-
tactisme (réponse à la lumière), le redox-tactisme (réponse au potentiel redox), le tactisme lié
aux accepteurs d’électrons, et le chimio-tactisme vers les sources de carbone (Taylor et al.,
1999).
Auparavant les réponses comportementales des microorganismes mobiles étaient
définies à partir de gradients physico-chimiques distribués dans l’espace, le long desquels la
mobilité était observée (Adler, 1988). Au contraire l’énergie tactisme décrit un mécanisme
sensoriel et réfère aux mouvements actifs de la cellule le long de divers gradients associés au
niveau d’énergie intracellulaire. Les paramètres physico-chimiques en affectant le transport
d’électrons engendrent une réponse comportementale (Figure 7) (Alexandre and Zhulin, 2001;
Alexandre et al., 2004; Fenchel, 2002).
Figure 7 : Schéma général de l’énergie tactisme gouverné par une chaîne respiratoire de
transport d’électrons. Les senseurs d’énergie reçoivent l’information à partir d’un
système de transport d’électrons à l’état réduit et / ou de la force protomotrice. Les
changements de concentrations des donneurs et accepteurs d’électrons affectent ces
deux paramètres. Les petits cercles gris représentent les groupements phosphates.
Abréviations : DH, déhydrogenases ; FP, flavoprotéines ; FeS, protéines fer-soufre ; Q,
quinones ; DMSO, diméthyl sulfoxyde. D’après Alexandre et al. (2004).
24
I. Etude bibliographique
I.2.3. Pollution d’hydrocarbures
Le développement industriel a entraîné un accroissement de la pollution des
écosystèmes naturels. Les pollutions chimiques, dans le cas des pétroles, peuvent être soit
naturelles (par transformation de la matière organique), soit accidentelles (dégazage ou
naufrage de pétroliers). La présence d’hydrocarbures dans les habitats naturels peut-être
source de toxicité pour la flore microbienne présentes.
Au sein d’écosystèmes contaminés, comme les tapis microbiens, l’association des
organismes semble bénéfique à la dégradation des hydrocarbures. En effet, Höpner et al.
(1996) ont pu mettre en évidence, suite à la pollution pétrolière du golfe Arabo-Persique, le
développement de tapis microbiens sur les zones contaminées. Cette prolifération de tapis a
été associée à une dégradation des hydrocarbures sur quelques mois.
I.2.3.1. Origine et Composition des pétroles
Les hydrocarbures de l’environnement se trouvent en grande quantité dans les
gisements naturels profonds. Ils proviennent de diverses origines après transformation, sous
l’effet de la chaleur et de la pression, de substances organiques végétales (diagénèse,
catagénèse). La formation de pétrole dans les gisements est influencée en premier lieu par la
nature de la matière qui a été enfouie. On distingue quatre fractions principales : les
hydrocarbures saturés, les hydrocarbures aromatiques, les résines, les asphaltènes (Harayama
et al., 1999).
Durant la phase de maturation du pétrole, l’influence thermique et biologique peut agir
très sensiblement sur sa composition et ses propriétés par exemple en raison de la
biotransformation des fractions légères d’hydrocarbures en composés gazeux.
Les hydrocarbures aromatiques polycycliques (HAP) peuvent représenter jusqu'à 45 %
en poids des hydrocarbures selon les types de pétroles. Les composés aromatiques soufrés
(dérivés thiophéniques) peuvent représenter 23 % de la fraction aromatique d'une huile (Tissot
and Welte, 1984). Les naphtalènes, les phénanthrènes et les dibenzothiophènes font partie des
HAP les plus abondants au sein d’un pétrole.
25
I. Etude bibliographique
I.2.3.2. Dégradation des hydrocarbures
I.2.3.2.1. Par les microorganismes
ø La « réponse hydrocarbure »
Les microorganismes développent différents mécanismes pour faire face à la présence
d’hydrocarbures. Ces mécanismes sont essentiels pour leurs permettre de tolérer et résister à
la présence d’hydrocarbures, d’atteindre des substrats très peu solubles et parfois même de
transporter des molécules volumineuses à l’intérieur des cellules.
De nombreuses études ont permis de mettre en évidence différents processus utilisés
par les microorganismes pour métaboliser les hydrocarbures :
•
•
•
•
•
•
Les modifications des membranes biologiques (composition en
phospholipides) permettent d’éviter les altérations causées par les hydrocarbures (Pinkart and
White, 1997; Tsitko et al., 1999).
La formation de biofilms permettant le positionnement des bactéries à
l’interface eau/huile, assurant ainsi le contact avec le substrat (Van Hamme et al., 2003).
Le transport actif des hydrocarbures à travers les membranes biologiques
permet l’entrée des molécules dans les cellules et par conséquent leur dégradation (Kim et al.,
2002; Story et al., 2000; Whitman et al., 1998).
La tolérance aux hydrocarbures grâce à des systèmes de pompes de flux
(Duque et al., 2001; Kieboom et al., 1998a; Kieboom et al., 1998b; Rojas et al., 2001).
Le chimiotactisme permet aux bactéries de se diriger par rapport aux
hydrocarbures (Pandey and Jain, 2002).
La production de surfactants permet de rendre accessibles certaines molécules
(Makkar and Cameotra, 1998; Makkar and Cameotra, 2002; Van Hamme and Ward, 2000).
ø Les voies de dégradation : gènes impliqués
Le devenir des hydrocarbures dans l'environnement dépend de processus biotiques et
abiotiques tels que la photo-oxydation, l'oxydation chimique, et l'activité microbiologique.
Les micro-organismes peuvent agir soit directement via le métabolisme cellulaire, soit de
manière indirecte en modifiant les conditions physico-chimiques du milieu. De nombreuses
voies de dégradation aérobie et anaérobie ont été étudiées permettant de connaître les gènes
impliqués et de comprendre leurs régulations :
26

I. Etude bibliographique
•
•
•
Des hydroxylases (mono-oxygénases) réalisent les premières étapes de
dégradation des alcanes en aérobie, puis les intermédiaires hydroxylés peuvent suivre les
voies de la β-oxydation (Morgan and Watkinson, 1994; Rehm and Reiff, 1982). Les opérons
de dégradation aérobie des alcanes regroupant les gènes alk ont été caractérisés chez de
nombreuses souches bactériennes tel que les genres Pseudomonas (Canosa et al., 2000; Panke
et al., 1999; van Beilen et al., 2001; Yuste and Rojo, 2001), Burkholderia (Marín et al.,
2001), Acinetobacter (Geissdorfer et al., 1999; Ratajczak et al., 1998), Nocardioides
(Hamamura et al., 2001), Rhodococcus (Koike et al., 1999) et Alcanivorax (Dutta and
Harayama, 2001).
Bien que très peu d'études aient mis en évidence la dégradation des alcanes en
anaérobiose, les bactéries sulfato-réductrices sont toutefois capables de dégrader des
composés en C20 (Aeckersberg et al., 1991).
Les composés aromatiques sont transformés, en aérobiose, en intermédiaires
hydroxylés grâce à l'action de mono-oxygénases et de di-oxygénases. L'ouverture du cycle est
alors réalisée à partir des intermédiaires hydroxylés catechol, protocatechuate, et gentisate
obtenus (Smith, 1994). De nombreux opérons de dégradation aérobie des Hydrocarbures
Aromatiques Polycycliques (HAP) ont été caractérisés. Parmi ceux-ci citons ceux regroupant
les gènes nah de dégradation du naphtalène chez Pseudomonas (Simon et al., 1999; Simon et
al., 1993; Yen and Serdar, 1988), les gènes ndo, dox et nag codant pour des dioxygenases
impliquées dans la dégradation du naphtalène chez Pseudomonas (Denome et al., 1993;
Fuenmayor et al., 1998; Kurkela et al., 1988), les gènes phn et pah de dégradation du
phénathrène chez Burkholderia et Pseudomonas respectivement (Kiyohara et al., 1994;
Laurie and Lloyd-Jones, 1999), les gènes phd et nid chez les souches à gram positif
Nocardioides et Rhodococcus (Saito et al., 2000; Treadway et al., 1999), les gènes nid et pbh
impliqués dans la dégradation de l’anthracène, fluorenthène et pyrène chez Mycobacterium et
Sphingomonas respectivement (Story et al., 2000).
Récemment, les opérons de dégradation anaérobie des HAP regroupant les
gènes bbs impliqués dans la voie de la benzylsuccinate synthase chez Thauera aromatica
(Leuthner and J., 1998) et les gènes edb chez Azoarcus (Johnson et al., 2001; Kaine et al.,
1983; Kniemeyer and Heider, 2001) ont été étudiés et caractérisés.
27
I. Etude bibliographique
I.2.3.2.2. Par les tapis microbiens
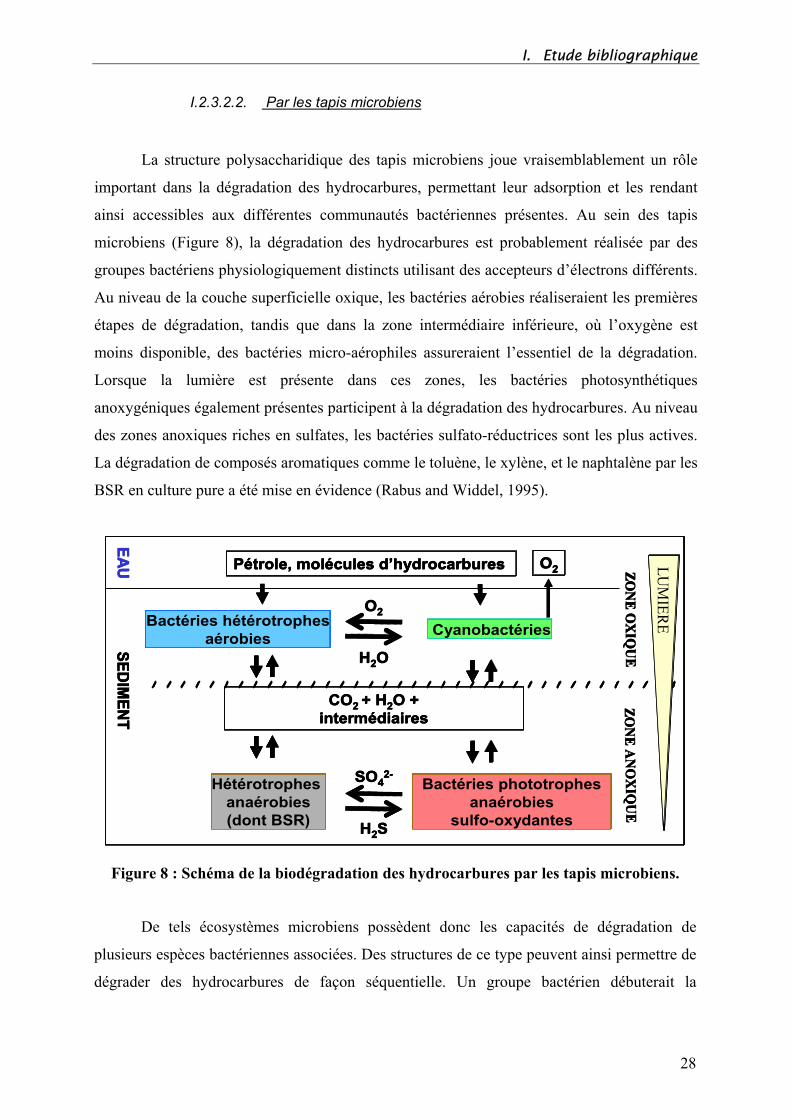
La structure polysaccharidique des tapis microbiens joue vraisemblablement un rôle
important dans la dégradation des hydrocarbures, permettant leur adsorption et les rendant
ainsi accessibles aux différentes communautés bactériennes présentes. Au sein des tapis
microbiens (Figure 8), la dégradation des hydrocarbures est probablement réalisée par des
groupes bactériens physiologiquement distincts utilisant des accepteurs d’électrons différents.
Au niveau de la couche superficielle oxique, les bactéries aérobies réaliseraient les premières
étapes de dégradation, tandis que dans la zone intermédiaire inférieure, où l’oxygène est
moins disponible, des bactéries micro-aérophiles assureraient l’essentiel de la dégradation.
Lorsque la lumière est présente dans ces zones, les bactéries photosynthétiques
anoxygéniques également présentes participent à la dégradation des hydrocarbures. Au niveau
des zones anoxiques riches en sulfates, les bactéries sulfato-réductrices sont les plus actives.
La dégradation de composés aromatiques comme le toluène, le xylène, et le naphtalène par les
BSR en culture pure a été mise en évidence (Rabus and Widdel, 1995).
Pétrole, molécules d’hydrocarbures O2
CO2 + H2O +intermédiaires
Hétérotrophes anaérobies(dont BSR)
ZO
NE
OX
IQU
EZ
ON
E A
NO
XIQ
UE
EA
US
ED
I ME
NT
Bactéries phototrophes anaérobies
sulfo-oxydantes
SO42-
H2S
CyanobactériesBactéries hétérotrophes
aérobies
O2
H2O
LU
MIE
RE
Pétrole, molécules d’hydrocarbures O2
CO2 + H2O +intermédiaires
Hétérotrophes anaérobies(dont BSR)
ZO
NE
OX
IQU
EZ
ON
E A
NO
XIQ
UE
EA
US
ED
I ME
NT
Bactéries phototrophes anaérobies
sulfo-oxydantes
SO42-
H2S
CyanobactériesBactéries hétérotrophes
aérobies
O2
H2O
LU
MIE
RE
Pétrole, molécules d’hydrocarbures O2
CO2 + H2O +intermédiaires
Hétérotrophes anaérobies(dont BSR)
ZO
NE
OX
IQU
EZ
ON
E A
NO
XIQ
UE
EA
US
ED
I ME
NT
Bactéries phototrophes anaérobies
sulfo-oxydantes
SO42-
H2S
CyanobactériesBactéries hétérotrophes
aérobies
O2
H2O
LU
MIE
RE
LU
MIE
RE
Figure 8 : Schéma de la biodégradation des hydrocarbures par les tapis microbiens.
De tels écosystèmes microbiens possèdent donc les capacités de dégradation de
plusieurs espèces bactériennes associées. Des structures de ce type peuvent ainsi permettre de
dégrader des hydrocarbures de façon séquentielle. Un groupe bactérien débuterait la
28
I. Etude bibliographique
dégradation puis celle-ci serait poursuivie à partir des produits intermédiaires obtenus grâce à
l’activité d’un autre groupe.
L’étude de différents tapis microbiens (Abed et al., 2002; Cohen, 2002; Höpner et al.,
1996) a pu mettre en évidence une adaptation importante des populations bactériennes après
une pollution aux hydrocarbures. En effet, les populations capables de métaboliser les
hydrocarbures présents sont devenues dominantes au sein de l’écosystème. De plus, il en
ressort une diversité plus faible de ces microorganismes hydrocarbonoclastes, en comparaison
avec des systèmes microbiens non stressés. Les Bactéries à coloration Gram négative font
parties des bactéries les plus représentées dans ces conditions de stress aux hydrocarbures.
Du point de vue de la dégradation, Abed et al. (2002) a pu montrer que les tapis
microbiens étaient responsables d’environ 30 % de la dégradation des molécules modèle n-
octadécane et de phénantrène. De même Grotzschel et al. (2002) ont pu observer la
dégradation préférentielle des composés aromatiques phénanthrène et dibenzothiophène en
comparaison aux alcanes pristane et n-octadécane. Cependant la dégradation de tous ces
composés modèles sur 18 semaines n’est pas complète.
I.3. Les techniques moléculaires d’écologie microbienne
L’essor de la biologie moléculaire combinée à la phylogénie a permis un fort
développement des connaissances lié à la diversité microbienne jusqu’alors sous-estimée.
Celle-ci fut longtemps abordée uniquement par des méthodes microbiologiques reposant sur
l’isolement de souches. Les techniques moléculaires, reposant principalement sur l’étude du
gène ADNr 16S, ont donné un nouvel élan à l’écologie microbienne. L’analyse d’écosystèmes
plus complexes semble désormais accessible à travers ces méthodes indirectes. En effet à
partir de ces approches, il est possible de décrire la diversité microbienne in situ à un instant t,
et dans un espace donné. Les paramètres définissant la diversité, à savoir la richesse en espèce
(nombre d’espèce au sein d’une communauté), et la régularité (Evenness) sont désormais plus
aisés à déterminer.
Parmi les nombreuses techniques moléculaires d’analyse de la biodiversité : la T-
RFLP et la DGGE seront développées car elle représentent deux méthodes majeures pour
aborder la biodiversité.
29
I. Etude bibliographique
I.3.1. La T-RFLP (Terminal Restriction Fragment Length Polymorphism)
Cette technique développée par Liu et al. (1997) est une méthode rapide d’analyse des
communautés microbiennes, basée sur le polymorphisme de restriction (Marsh, 1999). A
partir de l’ADN génomique extraits d’échantillons, une PCR amplifiant le gène codant pour
l’ADNr 16S est réalisée à l’aide d’amorces marquées en 5’par un fluorochrome. Le produit
d’amplification est ensuite digéré par une ou plusieurs endonucléase de restriction. Les
fragments digérés sont séparés par électrophorèse capillaire(Trotha et al., 2002). Seuls les
fragments de restriction terminaux fluorescents seront détectés. Les résultats obtenus
constituent une empreinte de la communauté analysée.
Principalement réalisée sur le gène ADNr 16S, elle peut aussi l’être sur des gènes
fonctionnels. Par exemple, les bactéries phototrophes pourpres phylogénétiquement très
diverses, se répartissent en plusieurs sous-classes α-, く- et け-protéobactéries. La forte
conservation du gène PufM, codant pour une sous-unité du centre réactionnel de la
photosynthèse permet d’utiliser ce gène, et d’être ainsi un marqueur de ce groupe
phylogénétique (Achenbach et al., 2001).
A l’heure actuelle, l’analyse des fragments de restrictions terminaux ou T-RFs est une
étape limitante dans l’analyse des empreintes obtenues. Le site web RDP (Ribosomal
Database Project) propose une base de données des séquences ADNr 16S et des programmes
d’analyse des profils T-RFLP (Maidak et al., 2001 ; Marsh et al., 2000) et plus récemment
MiCA (Microbial Community Analysis) et le T-RFLP PAT (phylogenetic assignment tool)
(Kent et al., 2003). De plus, il a été mis en évidence l’existence de pseudo T-RFs (Egert and
Friedrich, 2003) et de variations possibles entre le T-RF observée et leur taille réelle (Kaplan
and Kitts, 2003), pointant sur l’importance de l’analyse et de la justesse des résultats. Malgré
cela, la sensibilité et la reproductibilité de cette technique ont été démontrés par Osborn et al.
(2000) et Dunbar et al. (2001).
De part la rapidité de cette technique, la quantité d’informations et de résultats
produits demandent désormais des analyses statistiques supplémentaires à l’analyse
phylogénétique des profils T-RLFP (Blackwood et al., 2003; Grant and Ogilvie, 2003). Ceci
laisse entrevoir la possibilité d’intégrer des données additionnelles tels que les facteurs
environnementaux afin d’appréhender leurs rôles dans la diversité observée.
Mengoni et al. (2002), comme Grant and Ogilvie (2004) ont développé des approches
de clonage des T-RFs afin de compléter cette technique de la T-RFLP par une identification
des communautés observées.
30
I. Etude bibliographique
31
•
•
I.3.2. DGGE (Denaturing Gradient Gel Electrophoresis)
La technique de la DGGE permet de discriminer des fragments d’ADN de tailles
identiques (200-700 bp), mais de compositions en bases différentes (substitution de bases)
(Muyzer et al., 1993). Son principe est basé sur la différence de mobilité électrophorétique
des fragments d’ADN amplifié en fonction de leurs températures de fusion. La température de
fusion d’un produit PCR, c’est-à-dire la température moyenne de dénaturation des deux brins
est fonction de sa séquence. Une modification de séquence entraîne donc une modification de
température de fusion. Cette modification est mise en évidence par électrophorèse sur gel de
polyacrylamide en présence d’un gradient d’agent dénaturant (formamide, urée).
En écologie microbienne, les échantillons étudiés sont comparés sur leurs contenus en
ADNr 16S, image des différentes communautés bactériennes présentes (Muyzer et al., 1998).
L’avantage de cette technique est de pouvoir déterminer les différentes séquences détectées
par excision des bandes du gel, réamplification et séquençage. Cette méthode est donc
fortement appropriée à l’étude d’écosystème microbien et à leur dynamique des populations
(Benlloch et al., 2002; Ferris et al., 1996).
La DGGE présentent quelques variantes, au niveau du gradient mi en jeu :
TGGE (Temperature Gradient Gel Electrophoresis) : la séparation des fragments
amplifiés se fait sous l’effet d’un gradient de température (Muyzer, 1999; Muyzer and Smalla,
1998).
TTGE (Temporal Temperature Gradient gel Electrophoresis) : La séparation se fait
sur un gel sous l’effet d’un agent dénaturant en concentration uniforme, et d’une température
graduellement croissante (Farnleitner et al., 2000; Ogier et al., 2002).
II. Procédures expérimentales
Chapitre II : Procédures expérimentales
32

II. Procédures expérimentales
II. Procédures expérimentales
II.1. Sites d’étude
II.1.1. Présentation
Cette thèse entre dans le cadre du programme européen MATBIOPOL* dans lequel
quatre tapis microbiens ont été pris comme modèles d’étude, localisés sur les sites : de
Camargue (Salins-de-Giraud - France), des Iles Orcades (Ecosse), de Solar Lake (Eilat -
Israël) et du Delta de l’Ebre (Espagne). Elle s’intègre également au sein du programme
national LIT’EAU dans lequel le tapis microbien de Guérande (Pradel - France) a été utilisé
comme modèle au sein de notre laboratoire. Dans ce travail, seuls les tapis microbiens de
Camargue, des Iles Orcades et de Guérande ont été analysés.
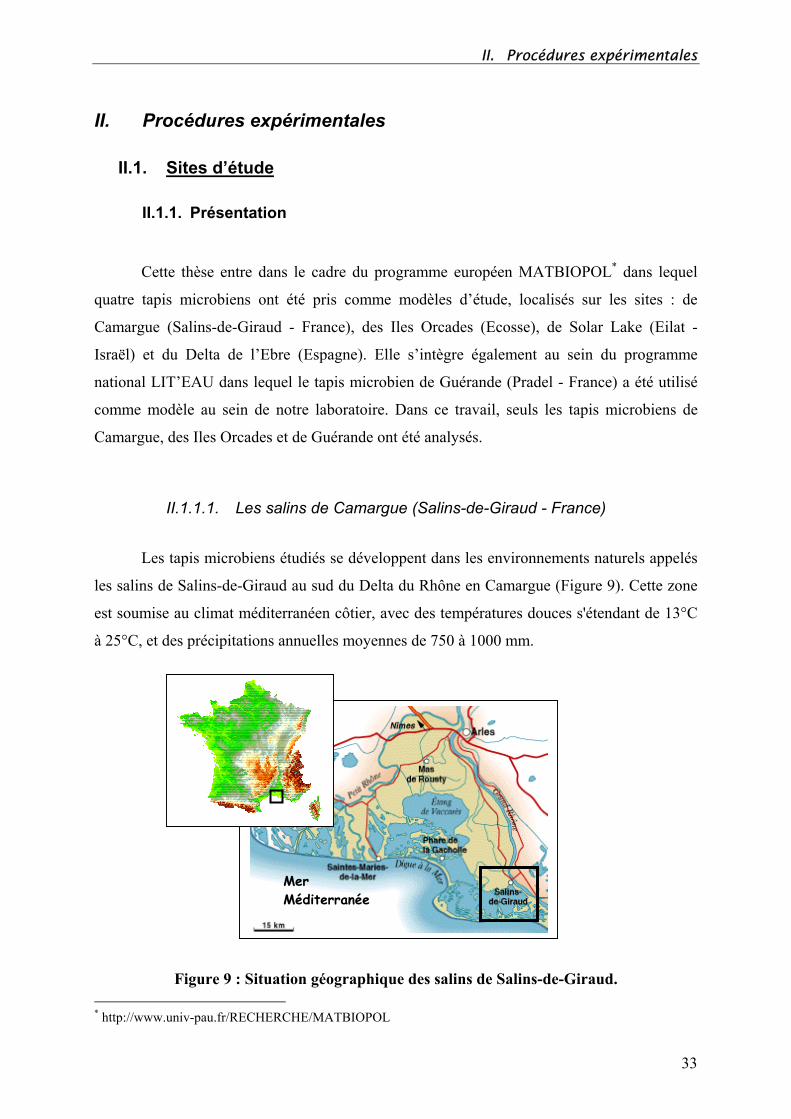
II.1.1.1. Les salins de Camargue (Salins-de-Giraud - France)
Les tapis microbiens étudiés se développent dans les environnements naturels appelés
les salins de Salins-de-Giraud au sud du Delta du Rhône en Camargue (Figure 9). Cette zone
est soumise au climat méditerranéen côtier, avec des températures douces s'étendant de 13°C
à 25°C, et des précipitations annuelles moyennes de 750 à 1000 mm.
Mer
Méditerranée
Figure 9 : Situation géographique des salins de Salins-de-Giraud.
33
* http://www.univ-pau.fr/RECHERCHE/MATBIOPOL
II. Procédures expérimentales
Les salins sont exploités par évaporation naturelle de l’eau de mer, pour produire du
sel. Celle-ci circule dans de grands bassins lagunaires, les « partènements », où sous l’action
conjuguée du soleil et du vent son volume est réduit de 20 % à 10 % et permet au carbonate
de calcium (CaCO3) et au gypse (CaSO4.2H2O) de précipiter. La saumure ainsi prête à
cristalliser est ensuite dirigée vers des bassins soigneusement dimensionnés appelés « tables
salantes », où a lieu la précipitation et la récolte de la halite (NaCl naturel). Les salins de
Camargue présentent une surface de 10 000 hectares de partènements, et de 770 hectares
consacrés aux tables salantes. La production de sel des Salins du Midi s’élève en moyenne à
1 000 000 de tonnes par an.
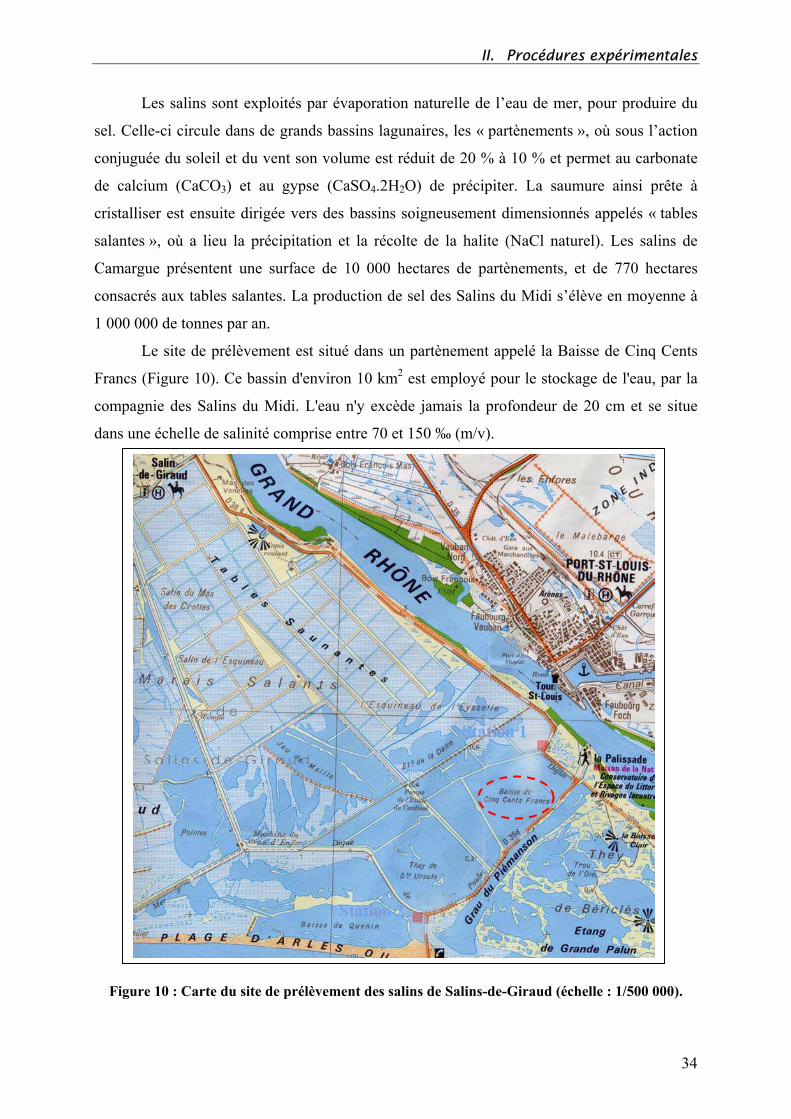
Le site de prélèvement est situé dans un partènement appelé la Baisse de Cinq Cents
Francs (Figure 10). Ce bassin d'environ 10 km2 est employé pour le stockage de l'eau, par la
compagnie des Salins du Midi. L'eau n'y excède jamais la profondeur de 20 cm et se situe
dans une échelle de salinité comprise entre 70 et 150 ‰ (m/v).
d e
S a l i n s - d e - G i r a u d
Figure 10 : Carte du site de prélèvement des salins de Salins-de-Giraud (échelle : 1/500 000).
34
II. Procédures expérimentales
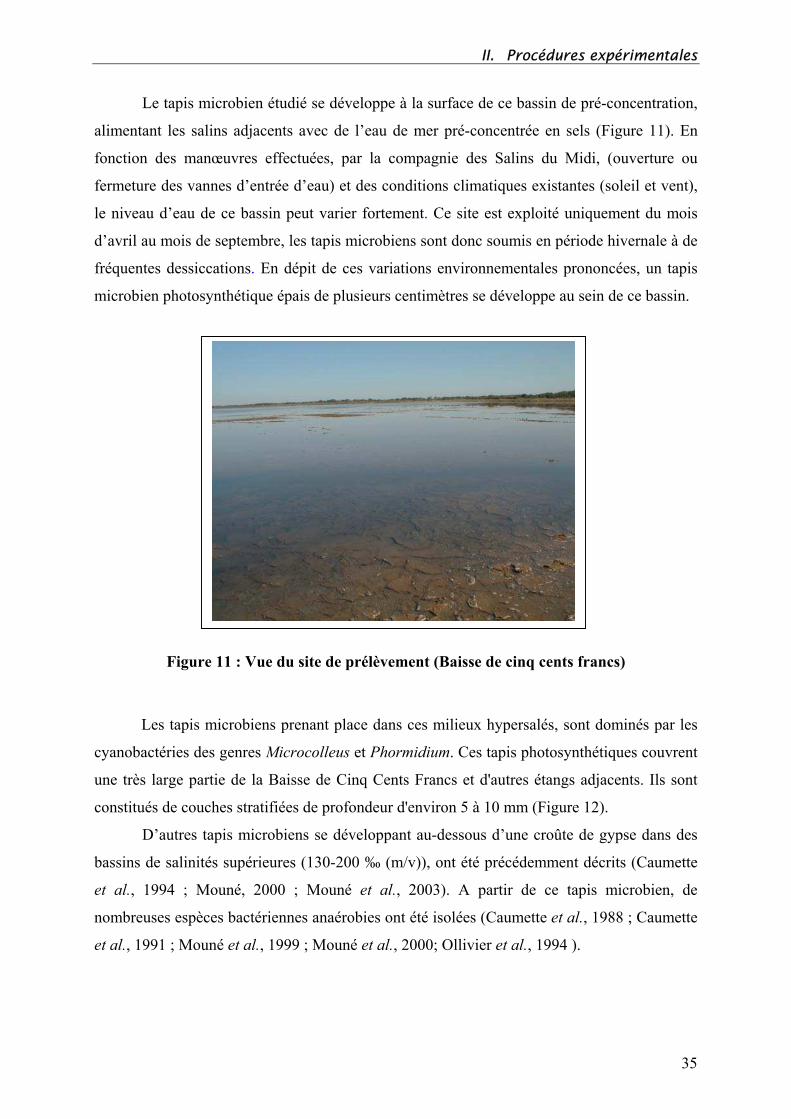
Le tapis microbien étudié se développe à la surface de ce bassin de pré-concentration,
alimentant les salins adjacents avec de l’eau de mer pré-concentrée en sels (Figure 11). En
fonction des manœuvres effectuées, par la compagnie des Salins du Midi, (ouverture ou
fermeture des vannes d’entrée d’eau) et des conditions climatiques existantes (soleil et vent),
le niveau d’eau de ce bassin peut varier fortement. Ce site est exploité uniquement du mois
d’avril au mois de septembre, les tapis microbiens sont donc soumis en période hivernale à de
fréquentes dessiccations. En dépit de ces variations environnementales prononcées, un tapis
microbien photosynthétique épais de plusieurs centimètres se développe au sein de ce bassin.
Figure 11 : Vue du site de prélèvement (Baisse de cinq cents francs)
Les tapis microbiens prenant place dans ces milieux hypersalés, sont dominés par les
cyanobactéries des genres Microcolleus et Phormidium. Ces tapis photosynthétiques couvrent
une très large partie de la Baisse de Cinq Cents Francs et d'autres étangs adjacents. Ils sont
constitués de couches stratifiées de profondeur d'environ 5 à 10 mm (Figure 12).
D’autres tapis microbiens se développant au-dessous d’une croûte de gypse dans des
bassins de salinités supérieures (130-200 ‰ (m/v)), ont été précédemment décrits (Caumette
et al., 1994 ; Mouné, 2000 ; Mouné et al., 2003). A partir de ce tapis microbien, de
nombreuses espèces bactériennes anaérobies ont été isolées (Caumette et al., 1988 ; Caumette
et al., 1991 ; Mouné et al., 1999 ; Mouné et al., 2000; Ollivier et al., 1994 ).
35
II. Procédures expérimentales
BA
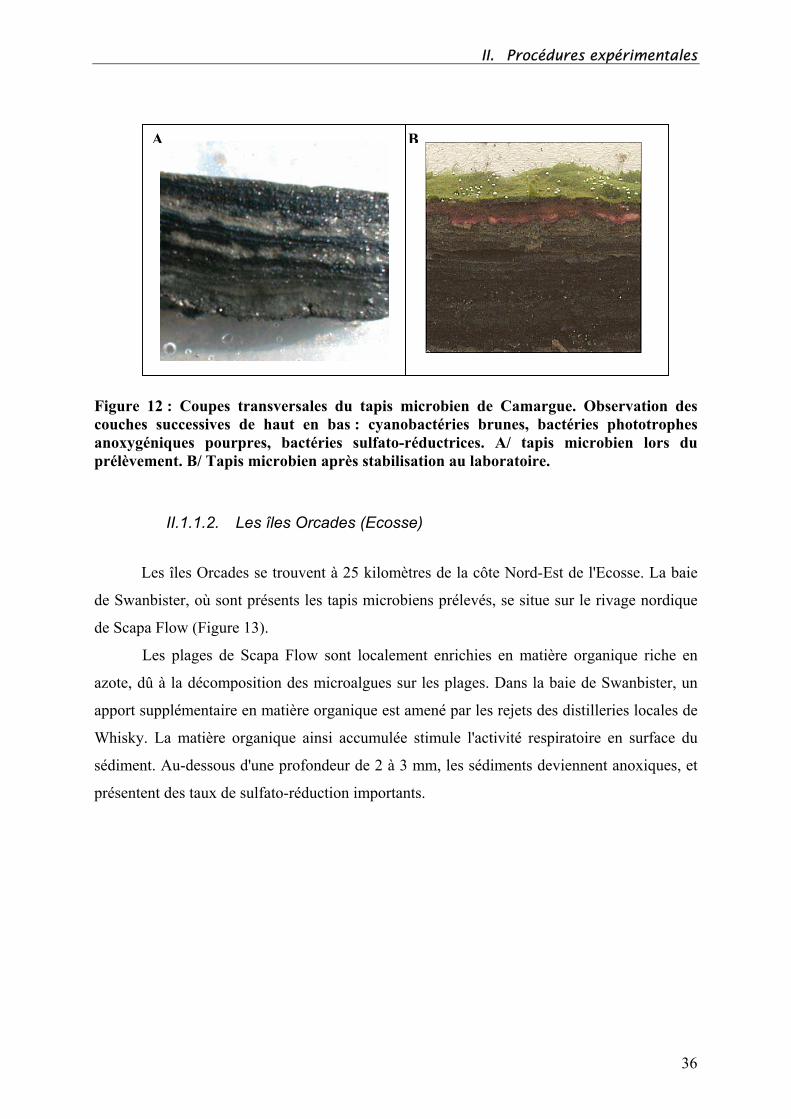
Figure 12 : Coupes transversales du tapis microbien de Camargue. Observation des
couches successives de haut en bas : cyanobactéries brunes, bactéries phototrophes
anoxygéniques pourpres, bactéries sulfato-réductrices. A/ tapis microbien lors du
prélèvement. B/ Tapis microbien après stabilisation au laboratoire.
II.1.1.2. Les îles Orcades (Ecosse)
Les îles Orcades se trouvent à 25 kilomètres de la côte Nord-Est de l'Ecosse. La baie
de Swanbister, où sont présents les tapis microbiens prélevés, se situe sur le rivage nordique
de Scapa Flow (Figure 13).
Les plages de Scapa Flow sont localement enrichies en matière organique riche en
azote, dû à la décomposition des microalgues sur les plages. Dans la baie de Swanbister, un
apport supplémentaire en matière organique est amené par les rejets des distilleries locales de
Whisky. La matière organique ainsi accumulée stimule l'activité respiratoire en surface du
sédiment. Au-dessous d'une profondeur de 2 à 3 mm, les sédiments deviennent anoxiques, et
présentent des taux de sulfato-réduction importants.
36
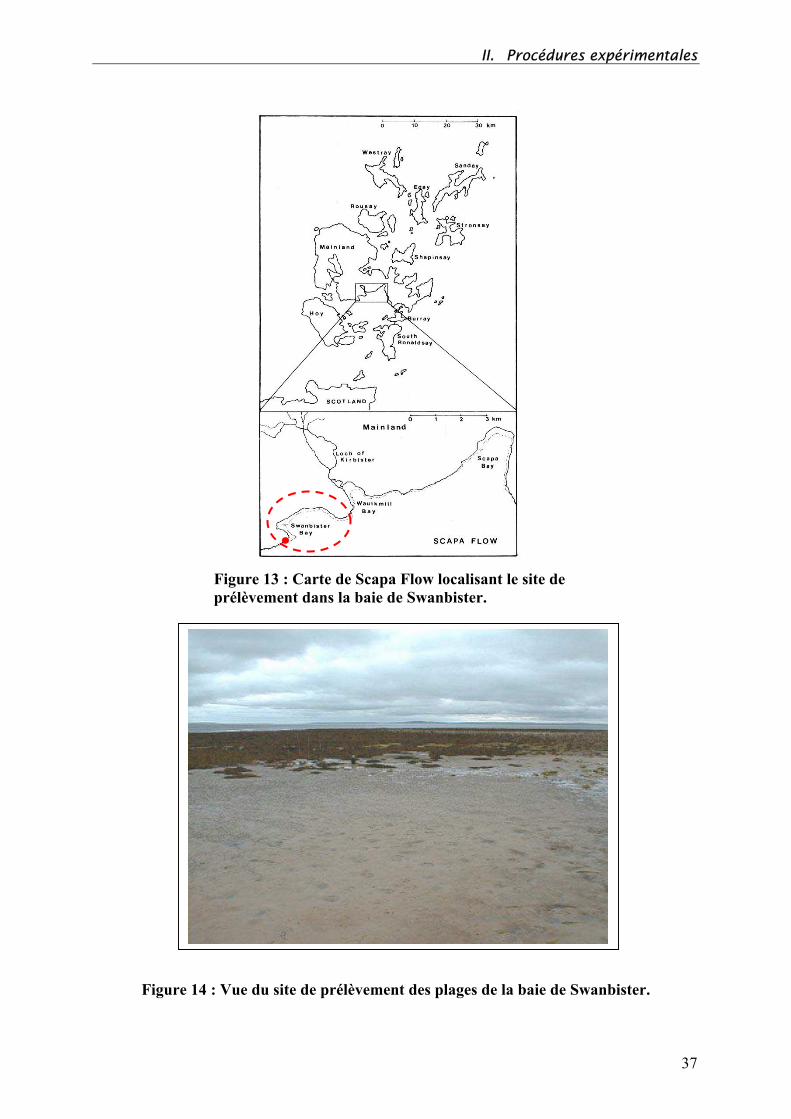
II. Procédures expérimentales
Figure 13 : Carte de Scapa Flow localisant le site de
prélèvement dans la baie de Swanbister.
Figure 14 : Vue du site de prélèvement des plages de la baie de Swanbister.
37
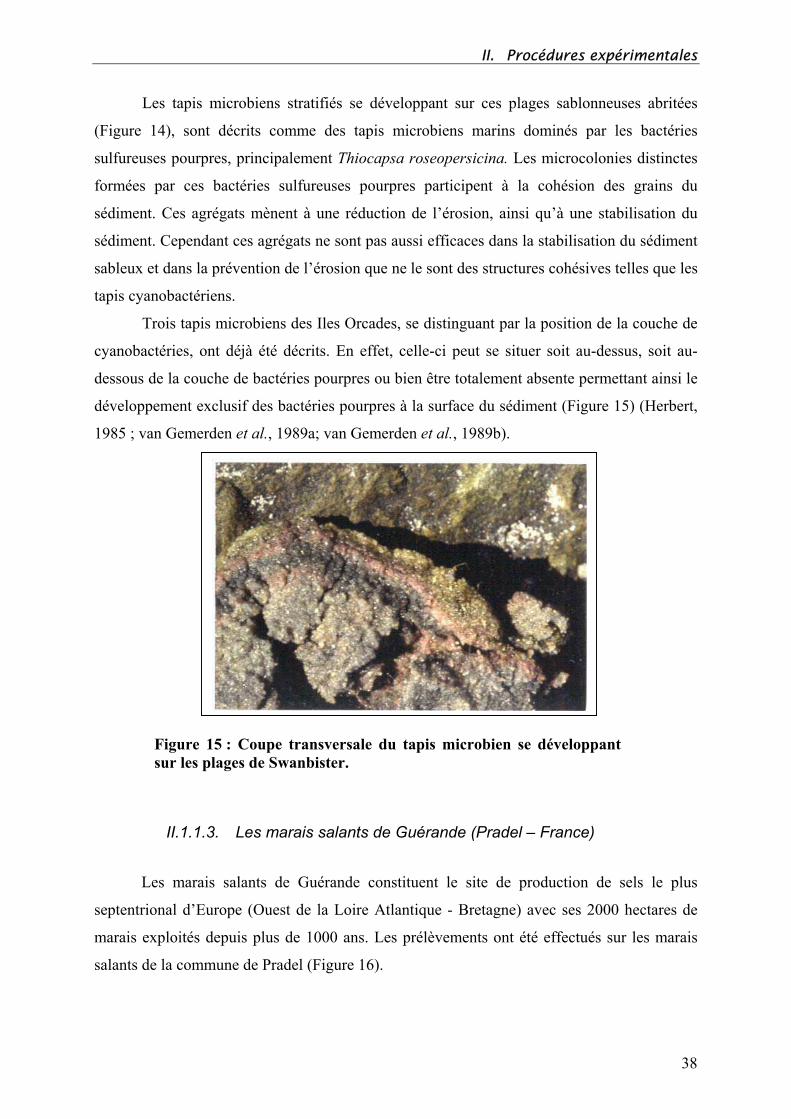
II. Procédures expérimentales
Les tapis microbiens stratifiés se développant sur ces plages sablonneuses abritées
(Figure 14), sont décrits comme des tapis microbiens marins dominés par les bactéries
sulfureuses pourpres, principalement Thiocapsa roseopersicina. Les microcolonies distinctes
formées par ces bactéries sulfureuses pourpres participent à la cohésion des grains du
sédiment. Ces agrégats mènent à une réduction de l’érosion, ainsi qu’à une stabilisation du
sédiment. Cependant ces agrégats ne sont pas aussi efficaces dans la stabilisation du sédiment
sableux et dans la prévention de l’érosion que ne le sont des structures cohésives telles que les
tapis cyanobactériens.
Trois tapis microbiens des Iles Orcades, se distinguant par la position de la couche de
cyanobactéries, ont déjà été décrits. En effet, celle-ci peut se situer soit au-dessus, soit au-
dessous de la couche de bactéries pourpres ou bien être totalement absente permettant ainsi le
développement exclusif des bactéries pourpres à la surface du sédiment (Figure 15) (Herbert,
1985 ; van Gemerden et al., 1989a; van Gemerden et al., 1989b).
Figure 15 : Coupe transversale du tapis microbien se développant
sur les plages de Swanbister.
II.1.1.3. Les marais salants de Guérande (Pradel – France)
Les marais salants de Guérande constituent le site de production de sels le plus
septentrional d’Europe (Ouest de la Loire Atlantique - Bretagne) avec ses 2000 hectares de
marais exploités depuis plus de 1000 ans. Les prélèvements ont été effectués sur les marais
salants de la commune de Pradel (Figure 16).
38

II. Procédures expérimentales
Guérande
Pradel Océan
Atlantique
Figure 16 : Situation géographique des salines sur la commune de Pradel proche de
Guérande. (échelle : 1/25 000)
Dans les marais salants de Guérande (Figure 17) la production du sel, réalisée de
manière artisanale par les Salines de l’Ouest, s’élevait entre 1994 et 1998 à 12 000 tonnes par
an. Malgré la pollution pétrolière du littoral atlantique due au naufrage de l’Erika en décembre
1999, les marais salants de Guérande n’ont pas été atteints par la marée noire.
Figure 17 : Vue du site des marais salants de Pradel (Guérande).
39
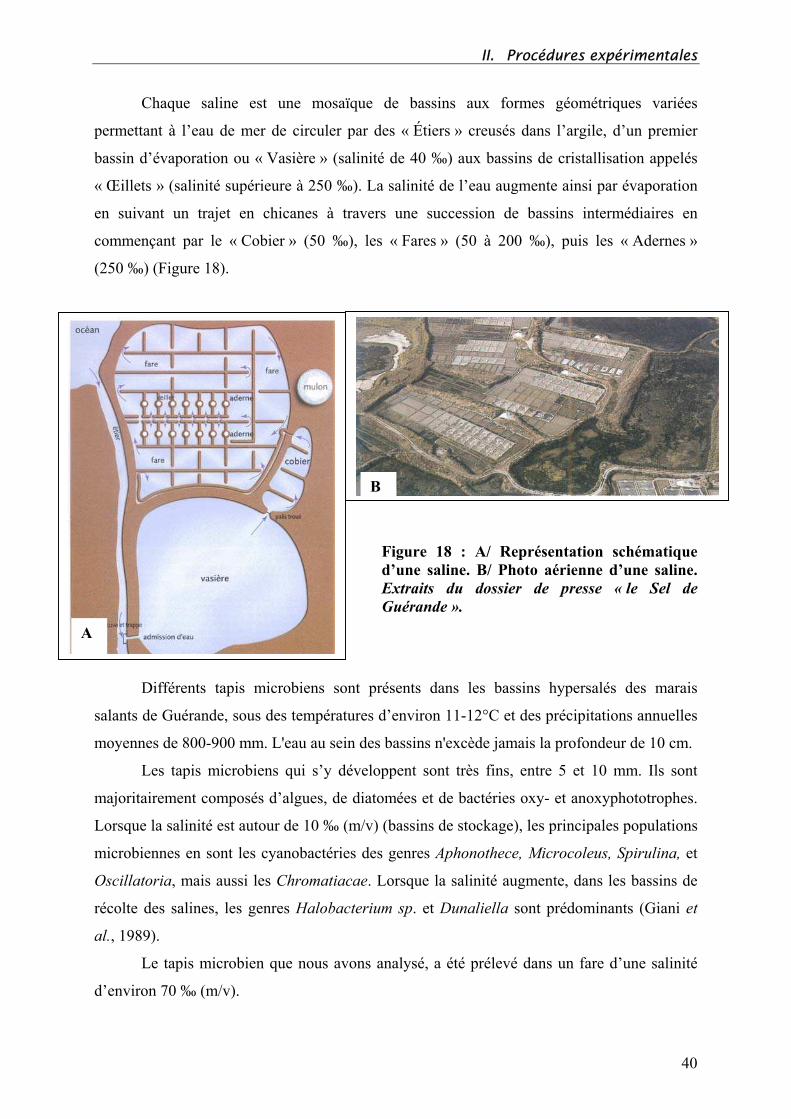
II. Procédures expérimentales
Chaque saline est une mosaïque de bassins aux formes géométriques variées
permettant à l’eau de mer de circuler par des « Étiers » creusés dans l’argile, d’un premier
bassin d’évaporation ou « Vasière » (salinité de 40 ‰) aux bassins de cristallisation appelés
« Œillets » (salinité supérieure à 250 ‰). La salinité de l’eau augmente ainsi par évaporation
en suivant un trajet en chicanes à travers une succession de bassins intermédiaires en
commençant par le « Cobier » (50 ‰), les « Fares » (50 à 200 ‰), puis les « Adernes »
(250 ‰) (Figure 18).
Figure 18 : A/ Représentation schématique
d’une saline. B/ Photo aérienne d’une saline.
Extraits du dossier de presse « le Sel de
Guérande ».
A
B
Différents tapis microbiens sont présents dans les bassins hypersalés des marais
salants de Guérande, sous des températures d’environ 11-12°C et des précipitations annuelles
moyennes de 800-900 mm. L'eau au sein des bassins n'excède jamais la profondeur de 10 cm.
Les tapis microbiens qui s’y développent sont très fins, entre 5 et 10 mm. Ils sont
majoritairement composés d’algues, de diatomées et de bactéries oxy- et anoxyphototrophes.
Lorsque la salinité est autour de 10 ‰ (m/v) (bassins de stockage), les principales populations
microbiennes en sont les cyanobactéries des genres Aphonothece, Microcoleus, Spirulina, et
Oscillatoria, mais aussi les Chromatiacae. Lorsque la salinité augmente, dans les bassins de
récolte des salines, les genres Halobacterium sp. et Dunaliella sont prédominants (Giani et
al., 1989).
Le tapis microbien que nous avons analysé, a été prélevé dans un fare d’une salinité
d’environ 70 ‰ (m/v).
40
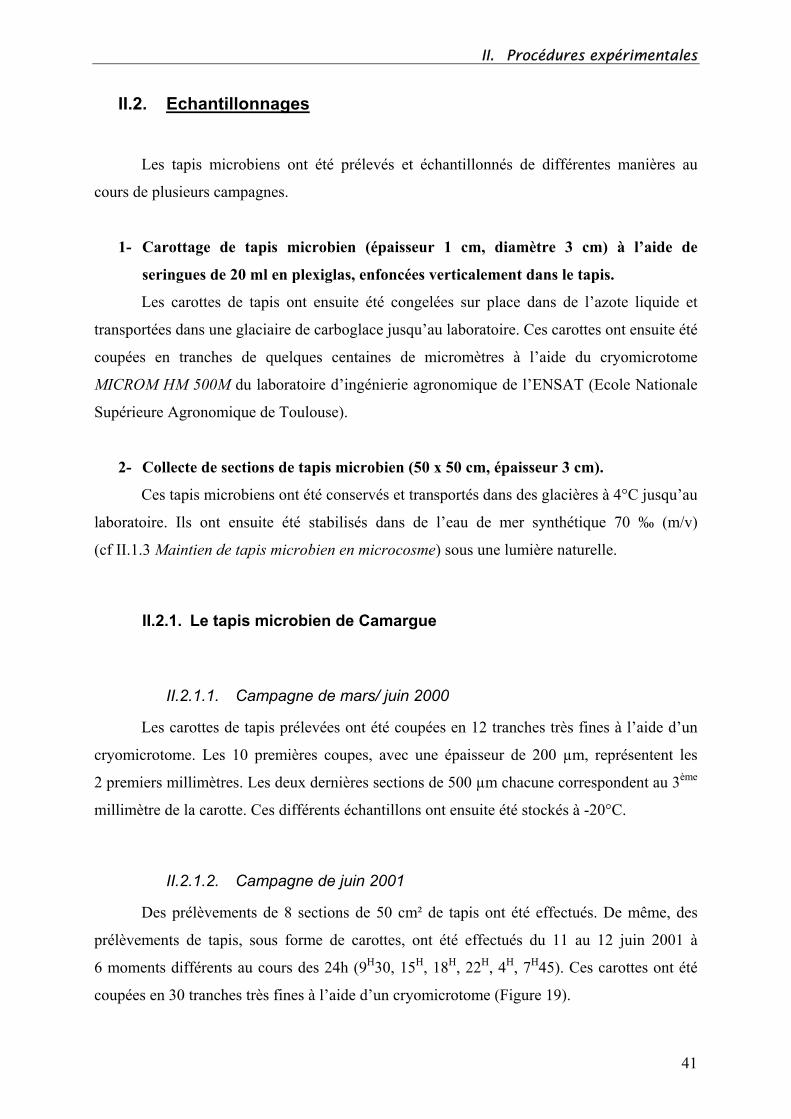
II. Procédures expérimentales
II.2. Echantillonnages
Les tapis microbiens ont été prélevés et échantillonnés de différentes manières au
cours de plusieurs campagnes.
1- Carottage de tapis microbien (épaisseur 1 cm, diamètre 3 cm) à l’aide de
seringues de 20 ml en plexiglas, enfoncées verticalement dans le tapis.
Les carottes de tapis ont ensuite été congelées sur place dans de l’azote liquide et
transportées dans une glaciaire de carboglace jusqu’au laboratoire. Ces carottes ont ensuite été
coupées en tranches de quelques centaines de micromètres à l’aide du cryomicrotome
MICROM HM 500M du laboratoire d’ingénierie agronomique de l’ENSAT (Ecole Nationale
Supérieure Agronomique de Toulouse).
2- Collecte de sections de tapis microbien (50 x 50 cm, épaisseur 3 cm).
Ces tapis microbiens ont été conservés et transportés dans des glacières à 4°C jusqu’au
laboratoire. Ils ont ensuite été stabilisés dans de l’eau de mer synthétique 70 ‰ (m/v)
(cf II.1.3 Maintien de tapis microbien en microcosme) sous une lumière naturelle.
II.2.1. Le tapis microbien de Camargue
II.2.1.1. Campagne de mars/ juin 2000
Les carottes de tapis prélevées ont été coupées en 12 tranches très fines à l’aide d’un
cryomicrotome. Les 10 premières coupes, avec une épaisseur de 200 µm, représentent les
2 premiers millimètres. Les deux dernières sections de 500 µm chacune correspondent au 3ème
millimètre de la carotte. Ces différents échantillons ont ensuite été stockés à -20°C.
II.2.1.2. Campagne de juin 2001
Des prélèvements de 8 sections de 50 cm² de tapis ont été effectués. De même, des
prélèvements de tapis, sous forme de carottes, ont été effectués du 11 au 12 juin 2001 à
6 moments différents au cours des 24h (9H30, 15H, 18H, 22H, 4H, 7H45). Ces carottes ont été
coupées en 30 tranches très fines à l’aide d’un cryomicrotome (Figure 19).
41
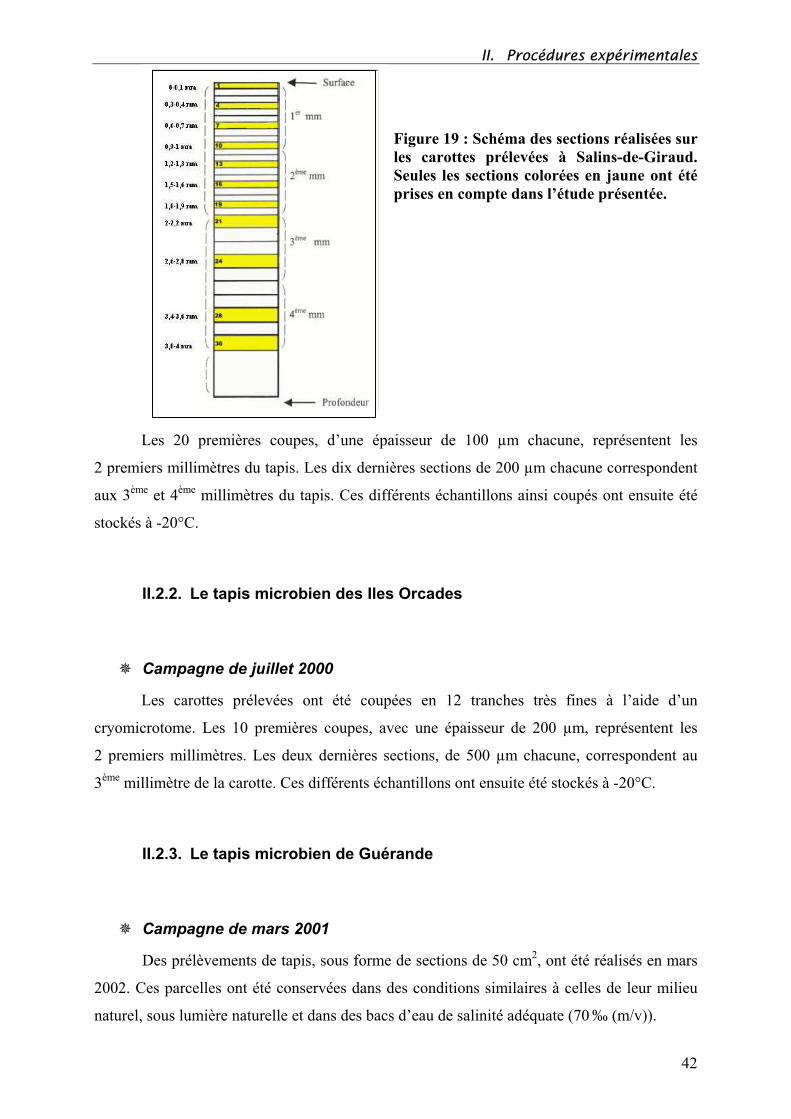
II. Procédures expérimentales
Figure 19 : Schéma des sections réalisées sur
les carottes prélevées à Salins-de-Giraud.
Seules les sections colorées en jaune ont été
prises en compte dans l’étude présentée.
Les 20 premières coupes, d’une épaisseur de 100 µm chacune, représentent les
2 premiers millimètres du tapis. Les dix dernières sections de 200 µm chacune correspondent
aux 3ème et 4ème millimètres du tapis. Ces différents échantillons ainsi coupés ont ensuite été
stockés à -20°C.
II.2.2. Le tapis microbien des Iles Orcades
ø Campagne de juillet 2000
Les carottes prélevées ont été coupées en 12 tranches très fines à l’aide d’un
cryomicrotome. Les 10 premières coupes, avec une épaisseur de 200 µm, représentent les
2 premiers millimètres. Les deux dernières sections, de 500 µm chacune, correspondent au
3ème millimètre de la carotte. Ces différents échantillons ont ensuite été stockés à -20°C.
II.2.3. Le tapis microbien de Guérande
ø Campagne de mars 2001
Des prélèvements de tapis, sous forme de sections de 50 cm2, ont été réalisés en mars
2002. Ces parcelles ont été conservées dans des conditions similaires à celles de leur milieu
naturel, sous lumière naturelle et dans des bacs d’eau de salinité adéquate (70 ‰ (m/v)).
42
II. Procédures expérimentales
II.3. Maintien de tapis microbien en microcosme
II.3.1. Eau de mer synthétique (Camargue et Guérande)
La préparation de l’eau de mer synthétique à 70 ‰ (m/v) utilisée pour maintenir les
tapis microbiens en laboratoire, a été réalisée en préparant séparément 3 solutions, stérilisées
séparément à l’autoclave :
Solution 1 Solution 2 Solution 3
KCl 1.5 g.l-1 MgSo4.7H2O 13.28 g.l-1 Na2Co3 0.53 g.l-1
CaCl2.2H2O 2.94 g.l-1 MgCl2.6H2O 10.56 g.l-1 NH4Cl 2.65 mg.l-1 NaCl 53 g.l-1 KBr 0.24 g.l-1 SrCl26H2O 0.048 g.l-1 NaF 0.003 g.l-1 Tampon phosphate 1M pH 7,4
5 µM
SL12 sans EDTA 1 ml.l-1
L’eau de mer synthétique est obtenue en mélangeant 650 ml de la solution 1, 250 ml
de la solution 2, et 100 ml de la solution 3.
La solution d'oligo-éléments SL12 utilisée dans la solution 1 est préparée en solution
stock comme suit (modifiée d'après Overmann et al. (1992)) :
H3BO3, 300 mg.l-1 ; FeSO4.7H2O, 1.1 g.l-1 ; CoCl2.6H2O, 190 mg.l-1 ; MnCl2.2H2O, 50 mg.l-1 ;
ZnCl2, 42 mg.l-1 ; NiCl2.6H2O, 24 mg.l-1 ; Na2MoO4.2H2O, 18 mg.l-1 ; CuCl2.2H2O, 2 mg.l-1.
II.3.2. Mise en place d’un microcosme : exemple du tapis de Guérande
A partir des parcelles de tapis prélevées, quatorze carottes de tapis microbiens (5 cm
de diamètre et 1 cm d’épaisseur) ont été maintenues en microcosme au sein de carottiers de
verre, dans de l’eau de mer synthétique à 70 ‰ (m/v). La moitié de ces carottes a été
contaminée en surface avant leur mise en eau en ajoutant par pesée une quantité de pétrole
brut de l’Erika (300 à 350 mg par carottier). Les carottes restantes ont été utilisées comme
tapis témoin non contaminé par le pétrole. Deux des carottes restantes ont été stérilisées puis
contaminées par du pétrole brut de l’Erika pour servir de témoins abiotiques (Figure 20).
43

II. Procédures expérimentales
B A
Témoin abiotique
Tapis contaminés
Tapis non contaminés
Figure 20 : A/ Photographie du dispositif de maintien des tapis microbiens de Guérande.
B/ Photographie des tapis microbiens de Guérande en carottiers contaminés par du
pétrole brut Erika.
Le témoin abiotique a été analysé uniquement pour les temps de prélèvement t0 et t90
jours. Il consiste en une carotte de tapis stérilisée par 3 cycles d’autoclave successifs de
21 min à 110°C à la pression de 1 bar. Il a ensuite été contaminé en surface par du pétrole brut
Erika. Sa mise en eau a été faite dans le même bac que les autres carottiers non stériles. Pour
cela, le bas du carottier a été bouché hermétiquement à l’aide d’un dispositif équipé d’un filtre
(0,45 µm) pour « stériliser » le flux d’eau synthétique entrant dans le carottier (Figure 21).
H2O synthétique 70 ‰ filtrée
Bouchon hermétique
Carottier de verre
Pétrole brut Erika
Tapis stérilisé Filtre 0,45 µm
Flux d’eau
BA
Flux d’eau
Tapis microbien
Pétrole brut Erika
Carottier de verre
H2O synthétique70 ‰ filtrée
Figure 21 : Représentation schématique des tapis microbiens maintenus en microcosme
dans des carottiers de verre. A/ Tapis microbien contaminé par du pétrole. B/ Témoin
abiotique.
44
II. Procédures expérimentales
Par ailleurs, les paramètres du milieu ont été contrôlés tout au long de l’expérience,
afin de pouvoir considérer la pollution pétrolière comme le facteur principal affectant la
biodiversité des tapis :
- Maintien du niveau d’eau à l’aide d’un système de circulation d’eau (pompe
péristaltique),
- Cycle 16h de lumière / 8h d’obscurité, à l’aide d’un éclairage de 8 ampoules à
incandescence de 60W, 1 néon à fluorescence (émetteant à 450 nm, et 700-
780 nm), et un néon lumière blanche (émettant à 600 nm).
- Maintien du pH ~ 8,
- Maintien de la salinité S ~ 70 ‰ (m/v),
- Température ambiante ~ 25°C.
A partir des microcosmes mis en place, des prélèvements ont été réalisés tous les
quinze jours et ce durant les trois mois d’incubation (de t0 à t90 jours). Pour chaque
prélèvement, un carottier témoin et un contaminé ont été échantillonnés. A partir de ces
carottiers prélevés, une vingtaine de micro-carottages (5 mm de diamètre et 1 cm d’épaisseur)
ont été effectués à la surface du tapis, à l’aide de pipettes Pasteur en verre. Les échantillons
ainsi prélevés ont été immédiatement stockés à -80°C.
II.4. Souches bactériennes, milieux de culture et conservation
II.4.1. Souches bactériennes utilisées
Toutes les souches types et Escherichia coli décrites ci-dessous ont été utilisées
comme souches témoins positifs lors des PCR sur des gènes d’intérêt. Escherichia coli a aussi
été utilisée comme cellule hôte de clonage. Leurs caractéristiques génotypiques sont
présentées dans le tableau 7.
45
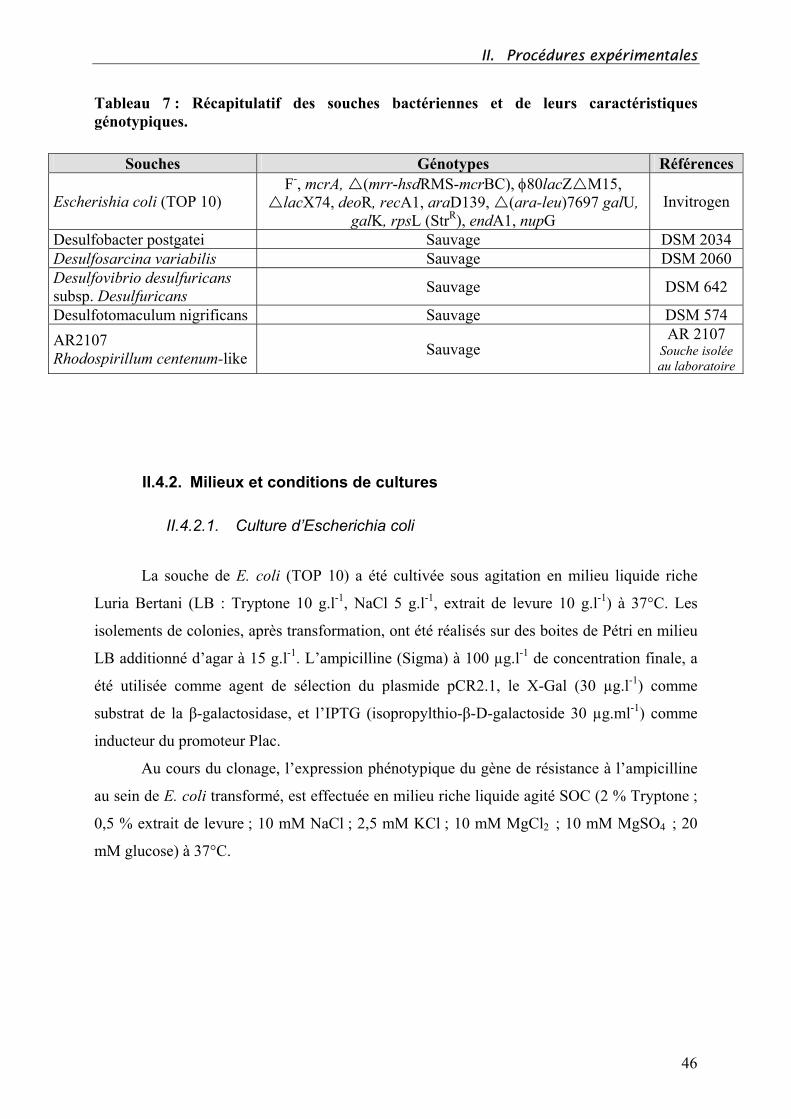
II. Procédures expérimentales
Tableau 7 : Récapitulatif des souches bactériennes et de leurs caractéristiques
génotypiques.
Souches Génotypes Références
Escherishia coli (TOP 10) F-, mcrA, t(mrr-hsdRMS-mcrBC), φ80lacZtM15, tlacX74, deoR, recA1, araD139, t(ara-leu)7697 galU,
galK, rpsL (StrR), endA1, nupG Invitrogen
Desulfobacter postgatei Sauvage DSM 2034 Desulfosarcina variabilis Sauvage DSM 2060 Desulfovibrio desulfuricans subsp. Desulfuricans
Sauvage DSM 642
Desulfotomaculum nigrificans Sauvage DSM 574
AR2107 Rhodospirillum centenum-like
Sauvage AR 2107
Souche isolée
au laboratoire
II.4.2. Milieux et conditions de cultures
II.4.2.1. Culture d’Escherichia coli
La souche de E. coli (TOP 10) a été cultivée sous agitation en milieu liquide riche
Luria Bertani (LB : Tryptone 10 g.l-1, NaCl 5 g.l-1, extrait de levure 10 g.l-1) à 37°C. Les
isolements de colonies, après transformation, ont été réalisés sur des boites de Pétri en milieu
LB additionné d’agar à 15 g.l-1. L’ampicilline (Sigma) à 100 µg.l-1 de concentration finale, a
été utilisée comme agent de sélection du plasmide pCR2.1, le X-Gal (30 µg.l-1) comme
substrat de la く-galactosidase, et l’IPTG (isopropylthio-く-D-galactoside 30 µg.ml-1) comme
inducteur du promoteur Plac.
Au cours du clonage, l’expression phénotypique du gène de résistance à l’ampicilline
au sein de E. coli transformé, est effectuée en milieu riche liquide agité SOC (2 % Tryptone ;
0,5 % extrait de levure ; 10 mM NaCl ; 2,5 mM KCl ; 10 mM MgCl2 ; 10 mM MgSO4 ; 20
mM glucose) à 37°C.
46

II. Procédures expérimentales
II.4.2.2. Culture des bactéries anaérobies
Les bases minérales sont préparées dans une fiole conique (Figure 22) et stérilisées à
l’autoclave pendant 20 min à 121°C sous une pression de 1 bar. Après stérilisation, la fiole est
refroidie sous atmosphère N2/CO2 (90/100, v/v) jusqu’à température ambiante.
Figure 22 : Fiole conique utilisée
pour la préparation des milieux
de culture, d'après Widdel
(1980).
ø Bactéries anoxygéniques phototrophes
Le milieu de culture utilisé est préparé à partir d'un milieu de base synthétique dont la
composition est la suivante :
KH2PO4 0.25 g.l-1
NH4Cl 0.50 g.l-1
CaCl2.2H2O 0.05 g.l-1
Solution SL12 sans EDTA* 1 ml.l-1
NaCl** 0 g.l-1 20 g.l-1 50 g.l-1 100 g.l-1
MgSO4.7H2O** 0.4 g.l-1 0.8 g.l-1 1.5 g.l-1 3 g.l-1
MgCl2.6H2O** 1 g.l-1 2 g.l-1 3 g.l-1 6 g.l-1
La base minérale est stérilisée, puis refroidie comme précédemment décrit. Les
solutions suivantes sont alors additionnées stérilement :
47
* cf II.1.3.1 Maintien de tapis microbien en microcosme / Eau de mer synthétique (Camargue et Guérande) ** selon la salinité désirée
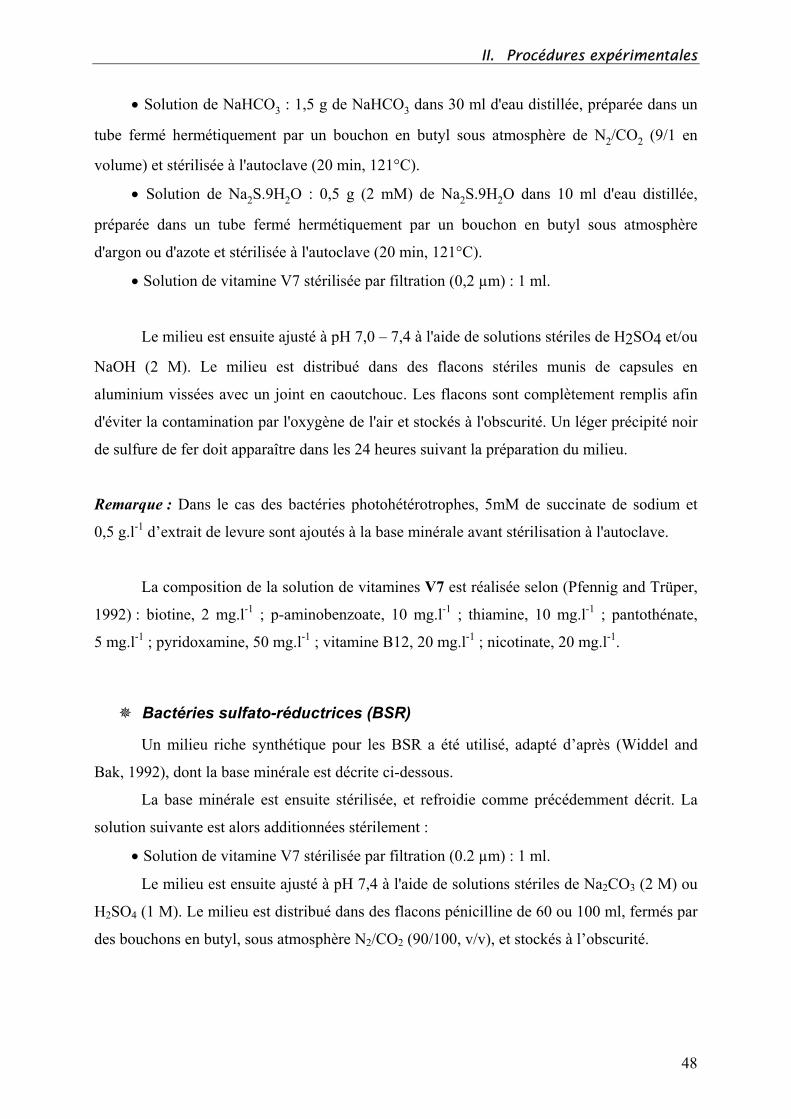
II. Procédures expérimentales
• Solution de NaHCO3 : 1,5 g de NaHCO3 dans 30 ml d'eau distillée, préparée dans un
tube fermé hermétiquement par un bouchon en butyl sous atmosphère de N2/CO2 (9/1 en
volume) et stérilisée à l'autoclave (20 min, 121°C).
• Solution de Na2S.9H2O : 0,5 g (2 mM) de Na2S.9H2O dans 10 ml d'eau distillée,
préparée dans un tube fermé hermétiquement par un bouchon en butyl sous atmosphère
d'argon ou d'azote et stérilisée à l'autoclave (20 min, 121°C).
• Solution de vitamine V7 stérilisée par filtration (0,2 µm) : 1 ml.
Le milieu est ensuite ajusté à pH 7,0 – 7,4 à l'aide de solutions stériles de H2SO4 et/ou
NaOH (2 M). Le milieu est distribué dans des flacons stériles munis de capsules en
aluminium vissées avec un joint en caoutchouc. Les flacons sont complètement remplis afin
d'éviter la contamination par l'oxygène de l'air et stockés à l'obscurité. Un léger précipité noir
de sulfure de fer doit apparaître dans les 24 heures suivant la préparation du milieu.
Remarque : Dans le cas des bactéries photohétérotrophes, 5mM de succinate de sodium et
0,5 g.l-1 d’extrait de levure sont ajoutés à la base minérale avant stérilisation à l'autoclave.
La composition de la solution de vitamines V7 est réalisée selon (Pfennig and Trüper,
1992) : biotine, 2 mg.l-1 ; p-aminobenzoate, 10 mg.l-1 ; thiamine, 10 mg.l-1 ; pantothénate,
5 mg.l-1 ; pyridoxamine, 50 mg.l-1 ; vitamine B12, 20 mg.l-1 ; nicotinate, 20 mg.l-1.
ø Bactéries sulfato-réductrices (BSR)
Un milieu riche synthétique pour les BSR a été utilisé, adapté d’après (Widdel and
Bak, 1992), dont la base minérale est décrite ci-dessous.
La base minérale est ensuite stérilisée, et refroidie comme précédemment décrit. La
solution suivante est alors additionnées stérilement :
• Solution de vitamine V7 stérilisée par filtration (0.2 µm) : 1 ml.
Le milieu est ensuite ajusté à pH 7,4 à l'aide de solutions stériles de Na2CO3 (2 M) ou
H2SO4 (1 M). Le milieu est distribué dans des flacons pénicilline de 60 ou 100 ml, fermés par
des bouchons en butyl, sous atmosphère N2/CO2 (90/100, v/v), et stockés à l’obscurité.
48
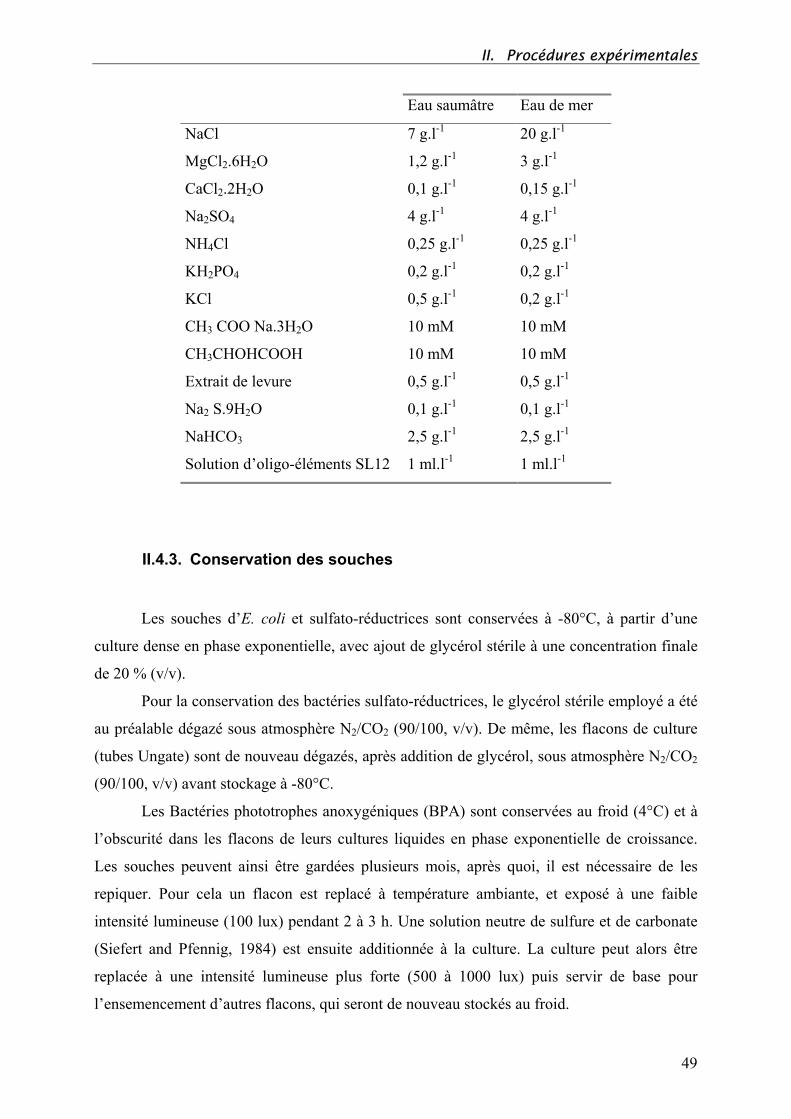
II. Procédures expérimentales
Eau saumâtre Eau de mer
NaCl 7 g.l-1 20 g.l-1
MgCl2.6H2O 1,2 g.l-1 3 g.l-1
CaCl2.2H2O 0,1 g.l-1 0,15 g.l-1
Na2SO4 4 g.l-1 4 g.l-1
NH4Cl 0,25 g.l-1 0,25 g.l-1
KH2PO4 0,2 g.l-1 0,2 g.l-1
KCl 0,5 g.l-1 0,2 g.l-1
CH3 COO Na.3H2O 10 mM 10 mM
CH3CHOHCOOH 10 mM 10 mM
Extrait de levure 0,5 g.l-1 0,5 g.l-1
Na2 S.9H2O 0,1 g.l-1 0,1 g.l-1
NaHCO3 2,5 g.l-1 2,5 g.l-1
Solution d’oligo-éléments SL12 1 ml.l-1 1 ml.l-1
II.4.3. Conservation des souches
Les souches d’E. coli et sulfato-réductrices sont conservées à -80°C, à partir d’une
culture dense en phase exponentielle, avec ajout de glycérol stérile à une concentration finale
de 20 % (v/v).
Pour la conservation des bactéries sulfato-réductrices, le glycérol stérile employé a été
au préalable dégazé sous atmosphère N2/CO2 (90/100, v/v). De même, les flacons de culture
(tubes Ungate) sont de nouveau dégazés, après addition de glycérol, sous atmosphère N2/CO2
(90/100, v/v) avant stockage à -80°C.
Les Bactéries phototrophes anoxygéniques (BPA) sont conservées au froid (4°C) et à
l’obscurité dans les flacons de leurs cultures liquides en phase exponentielle de croissance.
Les souches peuvent ainsi être gardées plusieurs mois, après quoi, il est nécessaire de les
repiquer. Pour cela un flacon est replacé à température ambiante, et exposé à une faible
intensité lumineuse (100 lux) pendant 2 à 3 h. Une solution neutre de sulfure et de carbonate
(Siefert and Pfennig, 1984) est ensuite additionnée à la culture. La culture peut alors être
replacée à une intensité lumineuse plus forte (500 à 1000 lux) puis servir de base pour
l’ensemencement d’autres flacons, qui seront de nouveau stockés au froid.
49
II. Procédures expérimentales
II.5. Techniques de biologie moléculaire
II.5.1. Extraction d’ADN génomique
II.5.1.1. A partir de cultures pures
L’extraction de l’ADN génomique de souches pures a été réalisée à partir de cultures
denses en phase stationnaire. 1 ml de culture est centrifugé entre 10 000 à 15 000 rpm pendant
10 à 15 min. (si le culot est instable, la centrifugation peut être réalisée à 4°C). Le culot bien
sec peut être stocké à – 20°C.
Afin d’effectuer la lyse cellulaire, le culot est mis en suspension dans du TGE (Tris
25 mM, Glucose 50 mM, EDTA 10 mM) avec du lysozyme (1 mg.ml-1) puis incubé pendant
10 minutes à 37°C. Les protéines sont ensuite dégradées par action de la protéinase K
(100 µg.ml-1) au cours d’une incubation de 30 minutes à 37°C en présence de SDS (0,5%).
Une seconde incubation après ajout de SDS (0,5%), est effectuée pendant 10 minutes à 60°C.
Les molécules insolubles (débris cellulaires, protéines, polysaccharides, lipides) sont
ensuite éliminées par dénaturation au cours de différentes extractions au phénol. La première
étape s’effectue en additionnant à l’extrait cellulaire un volume de phénol saturé et équilibré
avec du TE [pH 8] contenant des antioxydants (0,1 % hydroxyquinoline, 0,2 %
く-mercaptoéthanol). Les deux phases sont mélangées quelques secondes au vortex puis
séparées par une centrifugation de 5 min à 10 000 rpm. La phase aqueuse est soigneusement
prélevée en évitant de récupérer les protéines dénaturées situées à l’interface phase
aqueuse/phénol. La phase organique peut être de nouveau extraite par ajout de TE (Tris HCl
10 mM, EDTA 1 mM, [pH 8]) volume à volume en procédant comme précédemment décrit.
Une seconde extraction au PCIH (phénol/chloroforme/alcool isoamilique/hydroxyquinoléine :
48/48/4/0.1 ; v/v/v/p) est réalisée volume à volume sur les phases aqueuses réunies. Le phénol
résiduel de la phase aqueuse est éliminé par une extraction au CI (chloroforme/alcool
isoamilique : 96/4 ; v/v) volume à volume.
Les acides nucléiques obtenus en solution sont alors précipités à l’éthanol, en ajoutant
à la phase aqueuse 1/10e de volume d'acétate de sodium 3 M [pH 5,2] et deux volumes
d'éthanol absolu à froid (conservé à –20°C). Le mélange est incubé soit 1 h à -80°C, soit toute
une nuit à -20°C.
Les acides nucléiques sont ensuite récupérés par centrifugation pendant 15 à 30 min à
14 000 rpm à une température de 4°C. Le culot est lavé de ses sels par un volume d'éthanol
70% à froid, suivi d’une centrifugation de 15 à 30 min à 14 000 rpm à 4°C. Puis il est séché
50
II. Procédures expérimentales
au Speed-Vac (Dna 120, SAVANT) pendant 5 min à chaleur moyenne. Le culot d’acides
nucléiques est remis doucement en suspension dans 50 µl d'H2O distillée stérile ou de TE
[pH 8]. Au cours d’une incubation de 30 min à 37°C, un traitement enzymatique à la Rnase
pancréatique (Rnase A 1 mg.ml-1) est appliqué aux acides nucléiques en solution, afin de
dégrader les ARNs présents dans l’extrait. L’ADN génomique ainsi extrait et traité peut alors
être stocké à -20°C.
II.5.1.2. A partir d’échantillons de tapis microbien
L’extraction d’ADN génomique des différents échantillons de tapis est réalisée à
l’aide d’un kit (UltraCleanTM
Soil DNA isolation kit, MoBio Laboratories) selon les
recommandations du fournisseur. Toutefois, l’addition d’EDTA (10 mM) est nécessaire lors
de la première étape de lyse cellulaire, permettant ainsi d’inactiver les nucléases présentes au
cours de l’extraction. Ce kit combine deux types différents de lyses cellulaires, une lyse
mécanique par broyage et une lyse enzymatique. L’ADN génomique d’un large spectre de
bactéries peut ainsi être extrait.
Les échantillons de granulosité plus importante, ont plutôt subit la lyse alternative du
kit commercial, proposée par le fournisseur. Cette méthode de lyse utilise le choc thermique
pour effectuer la lyse cellulaire plutôt que le broyage. Les ADNs génomiques ainsi extraits
peuvent alors être stockés à -20°C.
II.5.2. Réactions de polymérisation en chaîne (PCR)
La technique de PCR permet d’amplifier un fragment d’ADN à partir de deux amorces
oligonucléotidiques spécifiques (Mullis et al., 1986; Saiki et al., 1985 ). Elle repose sur la
synthèse enzymatique d’ADN par une Taq polymérase thermostable (Hot Start Taq
polymerase, Qiagen) à partir de deux amorces de polarités opposées et dont la séquence est
complémentaire de chacune des bornes du fragment à amplifier.
Uniquement dans le cas de la T-RFLP, des amorces fluorescentes portant en 5’ un
fluorochrome (phosphoramidites telles que TET : 5-tétra-chloro-fluorescéine ; HEX : 5-hexa-
chloro-fluorescéine ; FAM : 5-carboxy-fluorescéine) ont été utilisées.
51
II. Procédures expérimentales
II.5.2.1. PCR classique
ø Conditions de réaction
Le choix d’utiliser un mélange réactionnel commercial (Hot Start Taq master mix,
Qiagen) contenant au préalable, l’enzyme, le tampon de réaction, le MgCl2, et les
4 désoxyribonucléotides (dNTPs), permet d’éviter de nombreuses étapes de transferts de
produits et donc de diminuer les risques de contamination. L’utilisation a néanmoins été
optimisée à partir des recommandations du fournisseur (dilution au ¼), la Taq polymérase et
les dNTPs en excès entraînant des amplifications aspécifiques.
Chaque amplification est réalisée dans un volume final de 50 µl où sont réunis les
composants suivants : Hot Start Taq Master Mix dilué au ¼ (Taq polymérase 0,625 U ; MgCl2
0,375 mM ; Tampon réactionnel 1X ; dNTPs 50 µM) ; Oligonucléotides 1 & 2 (0,5 µM
chacun) ; MgCl2 (1,125 mM) ; 10 ng matrice d’ADN (ADNgénomique ou plasmide).
ø Conditions d’amplification
Un cycle de PCR est constitué de 3 étapes successives réalisées sur un thermocycler
automatisé (PTC-100 ou 200, MJ Research). Le programme d’amplification utilisé est le
suivant :
• Hot Start (dénaturation de l’ADN et activation de l’enzyme) : 95°C pendant 15 min.
• 35 cycles d’amplification :
a) dénaturation de la matrice d’ADN à 95°C pendant 1 min.
b) hybridation des amorces à la température d’hybridation appropriée
(50°C<Tm<60°C) pendant 30 s.
c) élongation des amorces par l’ADN polymérase à 72°C pendant 1 min.
• élongation finale à 72°C pendant 10 min.
L’analyse du rendement et de la spécificité des produits PCR est ensuite réalisée par
une électrophorèse sur gel d’agarose de 1 à 2 % en fonction de la taille des fragments
attendus.
52
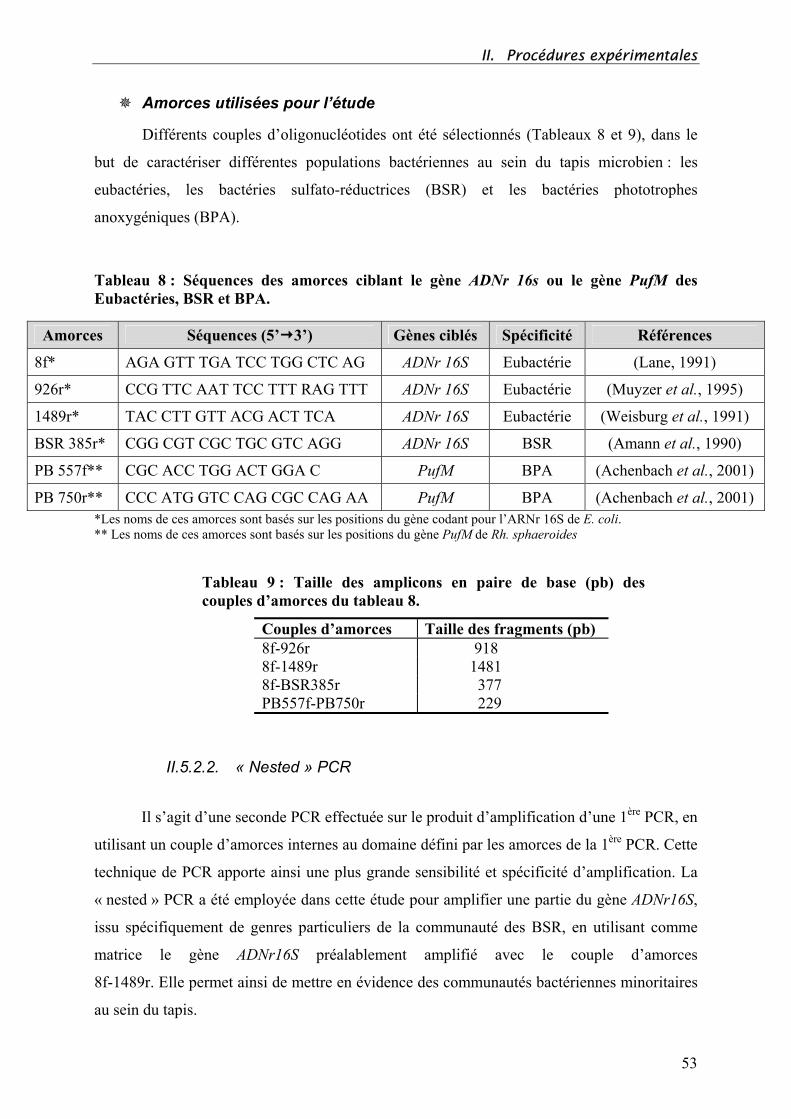
II. Procédures expérimentales
ø Amorces utilisées pour l’étude
Différents couples d’oligonucléotides ont été sélectionnés (Tableaux 8 et 9), dans le
but de caractériser différentes populations bactériennes au sein du tapis microbien : les
eubactéries, les bactéries sulfato-réductrices (BSR) et les bactéries phototrophes
anoxygéniques (BPA).
Tableau 8 : Séquences des amorces ciblant le gène ADNr 16s ou le gène PufM des
Eubactéries, BSR et BPA.
*Les noms de ces amorces sont basés sur les positions du gène codant pour l’ARNr 16S de E. coli.
Amorces Séquences (5’̂3’) Gènes ciblés Spécificité Références
8f* AGA GTT TGA TCC TGG CTC AG ADNr 16S Eubactérie (Lane, 1991)
926r* CCG TTC AAT TCC TTT RAG TTT ADNr 16S Eubactérie (Muyzer et al., 1995)
1489r* TAC CTT GTT ACG ACT TCA ADNr 16S Eubactérie (Weisburg et al., 1991)
BSR 385r* CGG CGT CGC TGC GTC AGG ADNr 16S BSR (Amann et al., 1990)
PB 557f** CGC ACC TGG ACT GGA C PufM BPA (Achenbach et al., 2001)
PB 750r** CCC ATG GTC CAG CGC CAG AA PufM BPA (Achenbach et al., 2001)
** Les noms de ces amorces sont basés sur les positions du gène PufM de Rh. sphaeroides
Tableau 9 : Taille des amplicons en paire de base (pb) des
couples d’amorces du tableau 8.
Couples d’amorces Taille des fragments (pb)
8f-926rriiiiiiiiiiii 918 8f-1489rriiiiiiiiiii 1481 8f-BSR385riiiiiiiiiiiiii 377 PB557f-PB750riiiiiiiiiiiiii 229
II.5.2.2. « Nested » PCR
Il s’agit d’une seconde PCR effectuée sur le produit d’amplification d’une 1ère PCR, en
utilisant un couple d’amorces internes au domaine défini par les amorces de la 1ère PCR. Cette
technique de PCR apporte ainsi une plus grande sensibilité et spécificité d’amplification. La
« nested » PCR a été employée dans cette étude pour amplifier une partie du gène ADNr16S,
issu spécifiquement de genres particuliers de la communauté des BSR, en utilisant comme
matrice le gène ADNr16S préalablement amplifié avec le couple d’amorces
8f-1489r. Elle permet ainsi de mettre en évidence des communautés bactériennes minoritaires
au sein du tapis.
53
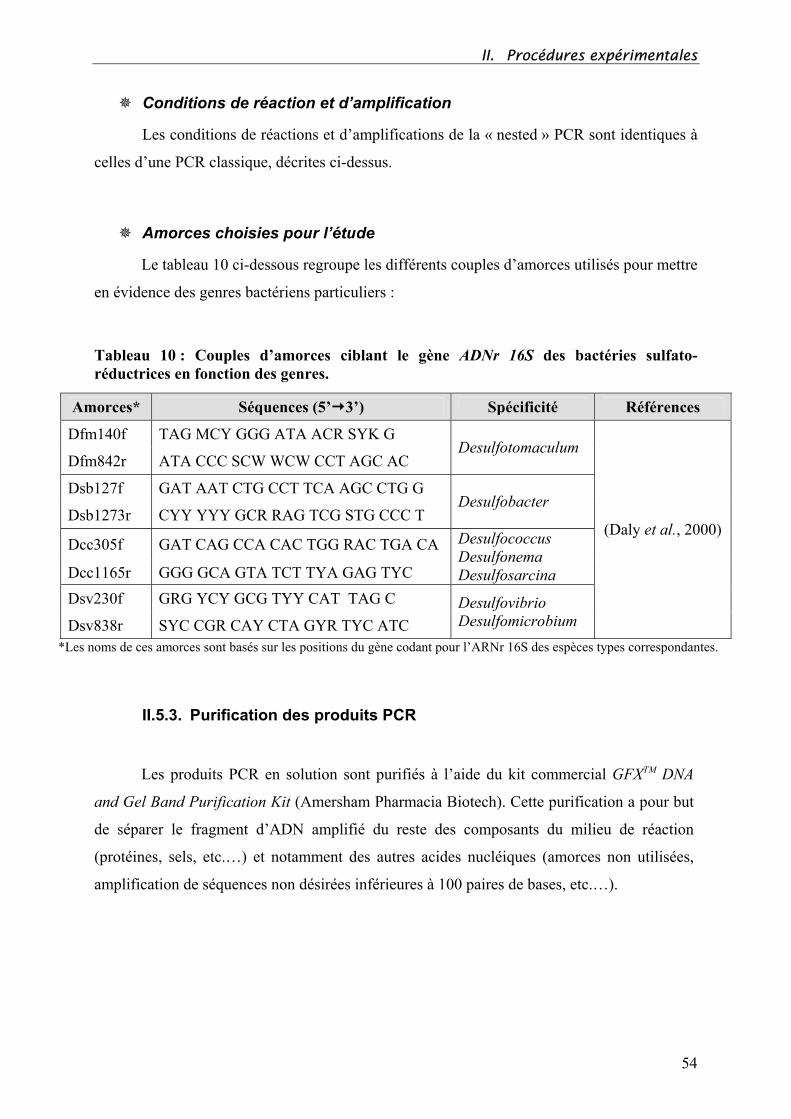
II. Procédures expérimentales
ø Conditions de réaction et d’amplification
Les conditions de réactions et d’amplifications de la « nested » PCR sont identiques à
celles d’une PCR classique, décrites ci-dessus.
ø Amorces choisies pour l’étude
Le tableau 10 ci-dessous regroupe les différents couples d’amorces utilisés pour mettre
en évidence des genres bactériens particuliers :
Tableau 10 : Couples d’amorces ciblant le gène ADNr 16S des bactéries sulfato-
réductrices en fonction des genres.
*Les noms de ces amorces sont basés sur les positions du gène codant pour l’ARNr 16S des espèces types correspondantes.
Amorces* Séquences (5’̂3’) Spécificité Références
Dfm140f TAG MCY GGG ATA ACR SYK G
Dfm842r ATA CCC SCW WCW CCT AGC AC Desulfotomaculum
Dsb127f GAT AAT CTG CCT TCA AGC CTG G
Dsb1273r CYY YYY GCR RAG TCG STG CCC T Desulfobacter
Dcc305f GAT CAG CCA CAC TGG RAC TGA CA
Dcc1165r GGG GCA GTA TCT TYA GAG TYC
Desulfococcus
Desulfonema
Desulfosarcina
Dsv230f GRG YCY GCG TYY CAT TAG C
Dsv838r SYC CGR CAY CTA GYR TYC ATC
Desulfovibrio
Desulfomicrobium
(Daly et al., 2000)
II.5.3. Purification des produits PCR
Les produits PCR en solution sont purifiés à l’aide du kit commercial GFXTM DNA
and Gel Band Purification Kit (Amersham Pharmacia Biotech). Cette purification a pour but
de séparer le fragment d’ADN amplifié du reste des composants du milieu de réaction
(protéines, sels, etc.…) et notamment des autres acides nucléiques (amorces non utilisées,
amplification de séquences non désirées inférieures à 100 paires de bases, etc.…).
54
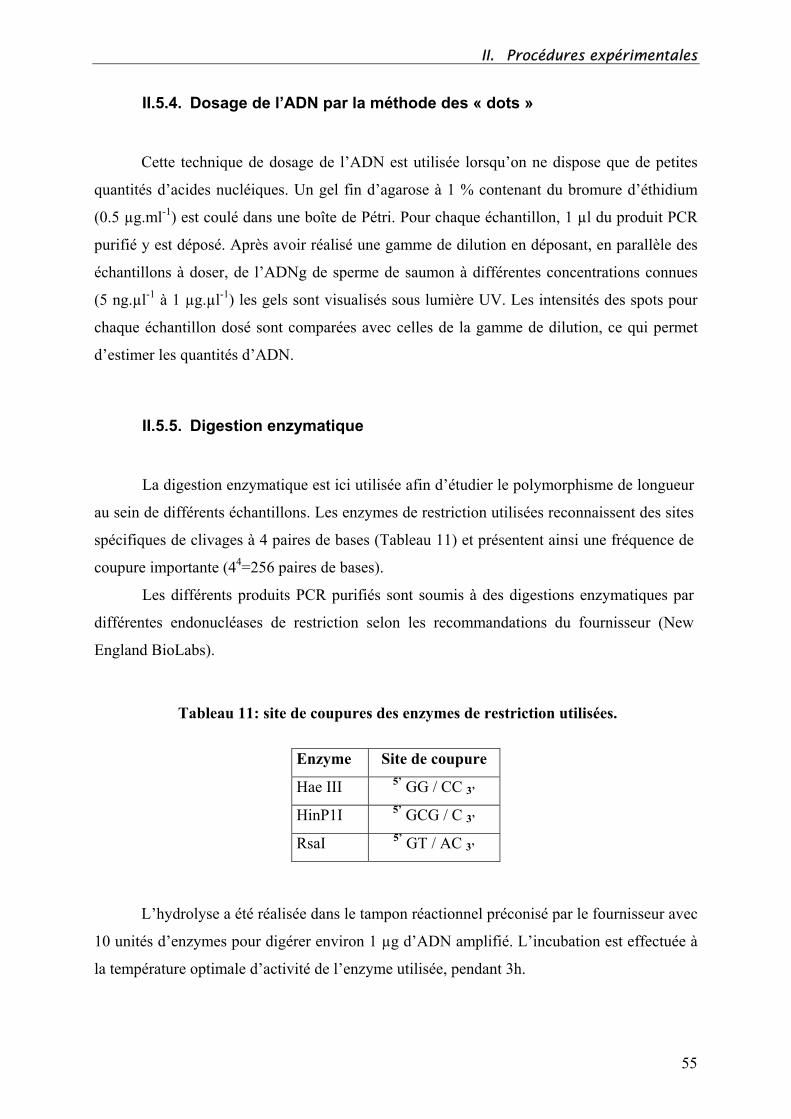
II. Procédures expérimentales
II.5.4. Dosage de l’ADN par la méthode des « dots »
Cette technique de dosage de l’ADN est utilisée lorsqu’on ne dispose que de petites
quantités d’acides nucléiques. Un gel fin d’agarose à 1 % contenant du bromure d’éthidium
(0.5 µg.ml-1) est coulé dans une boîte de Pétri. Pour chaque échantillon, 1 µl du produit PCR
purifié y est déposé. Après avoir réalisé une gamme de dilution en déposant, en parallèle des
échantillons à doser, de l’ADNg de sperme de saumon à différentes concentrations connues
(5 ng.µl-1 à 1 µg.µl-1) les gels sont visualisés sous lumière UV. Les intensités des spots pour
chaque échantillon dosé sont comparées avec celles de la gamme de dilution, ce qui permet
d’estimer les quantités d’ADN.
II.5.5. Digestion enzymatique
La digestion enzymatique est ici utilisée afin d’étudier le polymorphisme de longueur
au sein de différents échantillons. Les enzymes de restriction utilisées reconnaissent des sites
spécifiques de clivages à 4 paires de bases (Tableau 11) et présentent ainsi une fréquence de
coupure importante (44=256 paires de bases).
Les différents produits PCR purifiés sont soumis à des digestions enzymatiques par
différentes endonucléases de restriction selon les recommandations du fournisseur (New
England BioLabs).
Tableau 11: site de coupures des enzymes de restriction utilisées.
Enzyme Site de coupure
Hae III 5’ GG / CC 3’
HinP1I 5’ GCG / C 3’
RsaI 5’ GT / AC 3’
L’hydrolyse a été réalisée dans le tampon réactionnel préconisé par le fournisseur avec
10 unités d’enzymes pour digérer environ 1 µg d’ADN amplifié. L’incubation est effectuée à
la température optimale d’activité de l’enzyme utilisée, pendant 3h.
55
II. Procédures expérimentales
II.5.6. Electrophorèse
Après extraction, la séparation des ADN génomiques a été réalisée par migration
électrophorétique sur gel d’agarose (QA-Agarose, Q-Biogène) à 1 % (m/v) dans un tampon
TAE 1X (Tris-acétate 40 mM, EDTA 1 mM). La séparation des fragments d’ADN digérés a
été réalisée sur gel d’agarose haute résolution optimisé pour les petits fragments d’ADN
(Metaphor, Tebu-bio), à une concentration entre 2 et 4 % (m/v) en fonction de la taille des
fragments à séparer, dans un tampon TBE 1X (Tris-borate 89 mM, acide borique 89 mM,
EDTA 2 mM). Les ADNs sont visualisés par fluorescence au UV après avoir baigné les gels
d’agarose dans un bain de BET (bromure d’éthidium 0,5 µg.ml-1).
La migration des différents échantillons se fait en parallèle d’un marqueur de poids
moléculaire (Smart ladder échelle de 200 à 10000 pb ou Smart ladder low 20 bp échelle de
20 à 1000 pb, Eurogentec).
II.5.7. T-RFLP
II.5.7.1. Principe
La méthode de la T-RFLP (Terminal Restriction Fragment Length Polymorphism) a été
développée par (Liu et al., 1997). Après extraction des ADNs génomiques de chaque
échantillon et amplification par PCR avec des amorces fluorescentes spécifiques, les
communautés bactériennes ne sont plus représentées que par un mélange de gènes d’intérêts
amplifiés (les gènes ADNr 16S par exemple). La T-RFLP permet de mettre en évidence le
polymorphisme de taille des fragments terminaux de restriction (T-RFs), obtenus après
hydrolyse des produits PCR marqués avec des endonucléases de restriction. La longueur de
ces T-RFs varie d’une espèce à l’autre selon la position de la séquence nucléotidique
reconnue par l’enzyme. Les populations bactériennes peuvent ainsi être représentées par la
taille en paires de bases (pb) de leurs fragments de restriction terminaux respectifs.
56
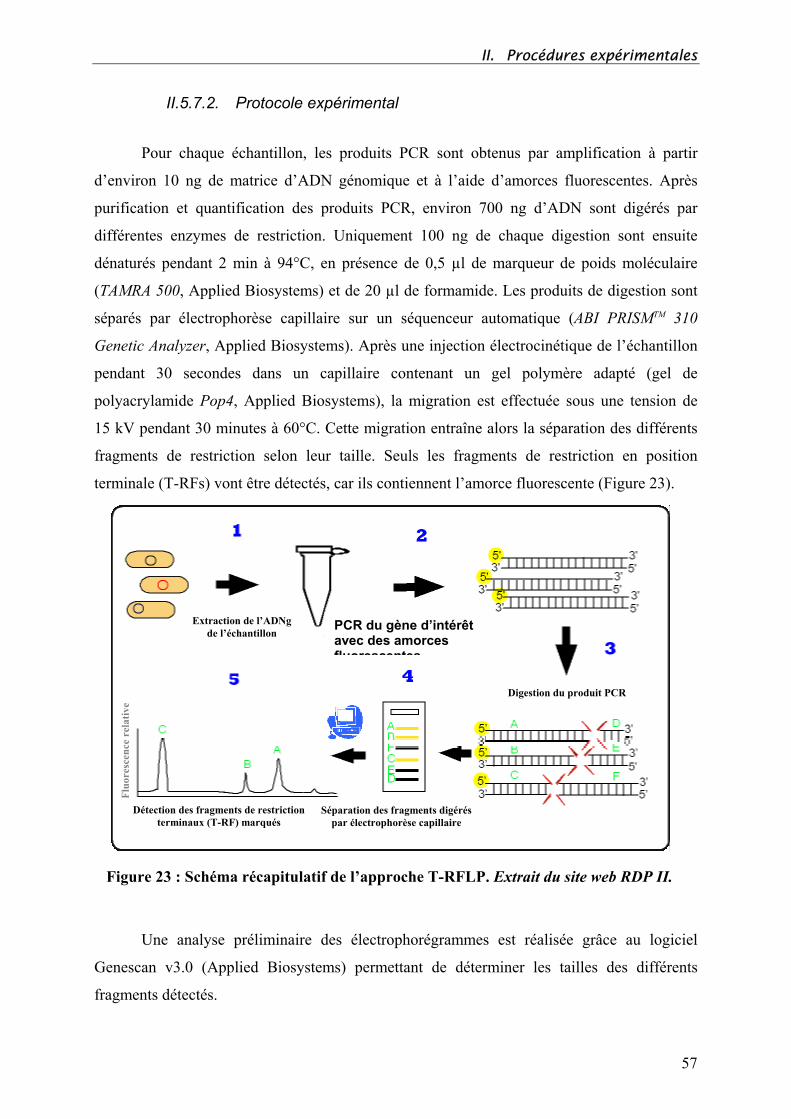
II. Procédures expérimentales
II.5.7.2. Protocole expérimental
Pour chaque échantillon, les produits PCR sont obtenus par amplification à partir
d’environ 10 ng de matrice d’ADN génomique et à l’aide d’amorces fluorescentes. Après
purification et quantification des produits PCR, environ 700 ng d’ADN sont digérés par
différentes enzymes de restriction. Uniquement 100 ng de chaque digestion sont ensuite
dénaturés pendant 2 min à 94°C, en présence de 0,5 µl de marqueur de poids moléculaire
(TAMRA 500, Applied Biosystems) et de 20 µl de formamide. Les produits de digestion sont
séparés par électrophorèse capillaire sur un séquenceur automatique (ABI PRISMTM 310
Genetic Analyzer, Applied Biosystems). Après une injection électrocinétique de l’échantillon
pendant 30 secondes dans un capillaire contenant un gel polymère adapté (gel de
polyacrylamide Pop4, Applied Biosystems), la migration est effectuée sous une tension de
15 kV pendant 30 minutes à 60°C. Cette migration entraîne alors la séparation des différents
fragments de restriction selon leur taille. Seuls les fragments de restriction en position
terminale (T-RFs) vont être détectés, car ils contiennent l’amorce fluorescente (Figure 23).
Flu
ore
scen
ce r
ela
tiv
e
Séparation des fragments digérés
par électrophorèse capillaire
Détection des fragments de restriction
terminaux (T-RF) marqués
Digestion du produit PCR
PCR du gène d’intérêt avec des amorces fluorescentes
Extraction de l’ADNg
de l’échantillon
Figure 23 : Schéma récapitulatif de l’approche T-RFLP. Extrait du site web RDP II.
Une analyse préliminaire des électrophorégrammes est réalisée grâce au logiciel
Genescan v3.0 (Applied Biosystems) permettant de déterminer les tailles des différents
fragments détectés.
57
II. Procédures expérimentales
Des digestions prédictives peuvent être réalisées sur le programme TAP-TRFLP du
site web Ribosomal Database Project II (RDP II : http://rdp.cme.msu.edu/html/analyses.html)
afin, si possible, d’associer une espèce bactérienne à une taille de T-RF observée (Maidak et
al., 1996 ; Maidak et al., 1997 ; Maidak et al., 1994 ; Maidak et al., 2001; Maidak et al., 2000
; Maidak et al., 1999 ).
II.5.7.3. Analyses statistiques
L’analyse des données de manière statistique vise à répartir, en un certain nombre de
groupes, les différents profils T-RFLP en fonction de leurs caractéristiques respectives
mesurées (T-RFs définis par la taille en pb, aire ou hauteur de l’intensité de fluorescence en
UF, etc.…). Le choix des groupes, aussi homogènes que possible, résulte d’un compromis
entre une description simple et suffisamment détaillée.
1) Traitement des données brutes correspondant à une série de transformation des valeurs
numériques pour chaque caractéristique mesurée. Cette standardisation s’effectue en plusieurs
étapes :
• Elimination du bruit de fond des profils T-RFLP, en délétant tous les T-RFs ayant
une hauteur d’intensité de fluorescence inférieure à 100 UF. La suppression de ces données
présente un faible taux d’erreurs sur l’analyse effectuée (Blackwood et al., 2003).
• Normalisation des quantités de fluorescence afin de permettre une comparaison des
différents profils T-RFLP entre eux. Cela consiste à ramener les hauteurs totales d’intensités
de fluorescence (IF) de chaque profil T-RFLP, à la plus petite somme d’IF observée. Les
hauteurs d’IF de chaque T-RF sont donc recalculées de manière proportionnelle à cette
somme minimale d’IF. Certaines valeurs (hauteurs d’IF), une fois normalisées, sont alors de
nouveau inférieures au seuil de détection de l’appareil (30 UF). Il convient donc de les
éliminer de l'analyse avant toute comparaison.
• Regroupement des T-RFs restants, pour un même profil, sur la base de leur taille en
pb. Les tailles en paire de base étant calculées par le logiciel Genescan v3.0 d’après la
méthode du « Local Southern » (relation entre la taille des fragments et leur mobilité), les
valeurs numériques obtenues sont des valeurs décimales. Il s’agit donc de regrouper les tailles
58
II. Procédures expérimentales
de T-RFs ayant des valeurs similaires (+ ou – 0,5 pb) et de définir une valeur moyenne entière
en pb. Les intensités de fluorescence correspondantes sont alors cumulées.
• Constitution d’une table variables / échantillons contenant les valeurs relatives des
intensités de fluorescence, pour chaque T-RF observé (variable) en fonction de tous les profils
T-RFLP (échantillons) à comparer. Ce tableau à deux entrées est ensuite soumis aux analyses
statistiques du logiciel MVSP v3.1 (Multi-Variate Statistical Package v3.1, Kovach
Computing Services) (Kovach, 1999).
2) Analyses statistiques des données grâce au logiciel MVSP v3.1
• Calcul de l’indice de similarité (Sij) entre tous les échantillons (sur la base de leurs
profils T-RFLP). Cet indice sera d’autant plus élevé que les caractéristiques (T-RFs) de ces
derniers seront éloignées. Nos données sont constituées de différentes variables qualitatives
(intensités de fluorescence relatives de chaque T-RF). Ces données peuvent être regroupées
par la méthode de la distance de Jaccard. Les effets des biais de la PCR peuvent être réduits
lors de l’analyse statistique par l’utilisation de cette méthode métrique qui prend en compte
uniquement la présence ou l’absence des T-RFs (Blackwood et al., 2003).
Soit : Sij = aij / (aij+bij+cij)
aij le nombre de T-RFs présents entre 2 échantillons i et j à comparer,
bij le nombre de T-RFs absents entre 2 échantillons i et j à comparer,
cij le nombre de T-RFs absents dans l’échantillon i et présent dans l’échantillon j.
• Classification hiérarchique ascendante par la méthode UPGMA (Unweighted
Pair Group Method with Arithmetic Mean). C’est une méthode de construction de
dendrogrammes obtenus à partir d’une distance ou dissimilarité entre 2 échantillons. Son
algorithme consiste à regrouper de manière séquentielle les 2 échantillons les plus proches
(sur la base de leur indice de Jaccard), et à réitérer ce processus jusqu’au regroupement
complet des échantillons comparés. Le profil en branche du dendrogramme obtenu illustre les
dissimilarités entre les différents échantillons regroupés.
• Statistique descriptive par des méthodes multifactorielles : AFC (Analyse Factorielle
des Correspondances) et ACC (Analyse Canonique des Correspondances ). Ces méthodes
ont pour but de décrire des données consignées dans un tableau (matrice) croisant des
59
II. Procédures expérimentales
échantillons (lignes) et des variables ou T-RFs (colonnes) mesurés sur ces échantillons.
L'étude s'effectue par réduction du nombre de variables en construisant de nouvelles variables
synthétiques obtenues en combinant les variables initiales (méthode factorielle).
AFC, méthode proposée par Benzécri ( 1976), elle permet l'analyse des données qualitatives
(tableaux de contingence, de présence-absence, etc…). Très brièvement, l’AFC va permettre
de réduire à un espace à deux ou trois dimensions, l’espace de représentation des éléments des
ensembles des échantillons (profils T-RFLP) et des variables (T-RFs), initialement à n et m
dimensions. Cette réduction sera opérée en fonction des proximités (similarité) entre les
éléments « profils T-RFLP » et « T-RFs ». Son algorithme est calculé à la manière d’une ACP
(Analyse des Composantes Principales), cependant la matrice de similarité produite est basée
sur le χ². Le résultat graphique est un diagramme de dispersion montrant un nuage de points
(échantillons) sur un plan de deux ou trois dimensions défini par des axes (composantes
principales) représentant les variables synthétiques et leurs importances (en pourcentages)
dans la distribution observée des échantillons.
ACC, méthode dérivée d’une analyse des correspondances, permettant d’incorporer des
données écologiques à l’analyse des correspondances (Ter Braak, 1986). Celle-ci consiste à
étudier les relations linéaires existant entre 2 groupes de caractères quantitatifs observés sur
un même ensemble d'individus. Le résultat graphique est un diagramme de dispersion
contenant : les variables environnementales dessinées sous forme de vecteurs émanant du
centre du graphe et un nuage de points (échantillons) sur un plan défini par des axes
représentant une combinaison linéaire entre les variables environnementales et les T-RFs. La
longueur et l’orientation de ces vecteurs sont proportionnelles à leurs influences dans la
distribution des échantillons.
II.5.8. RFLP
II.5.8.1. Principe
Le polymorphisme des gènes ADNr16S peut aussi être étudié, au sein d’une
population microbienne, en analysant les variations de leurs profils de restriction. Cette
méthode est connue sous le nom de RFLP (Restriction Fragment Length Polymorphism)
(Kiko et al., 1979). Préalablement, une banque de gène ADNr 16S, est réalisée sur les
60
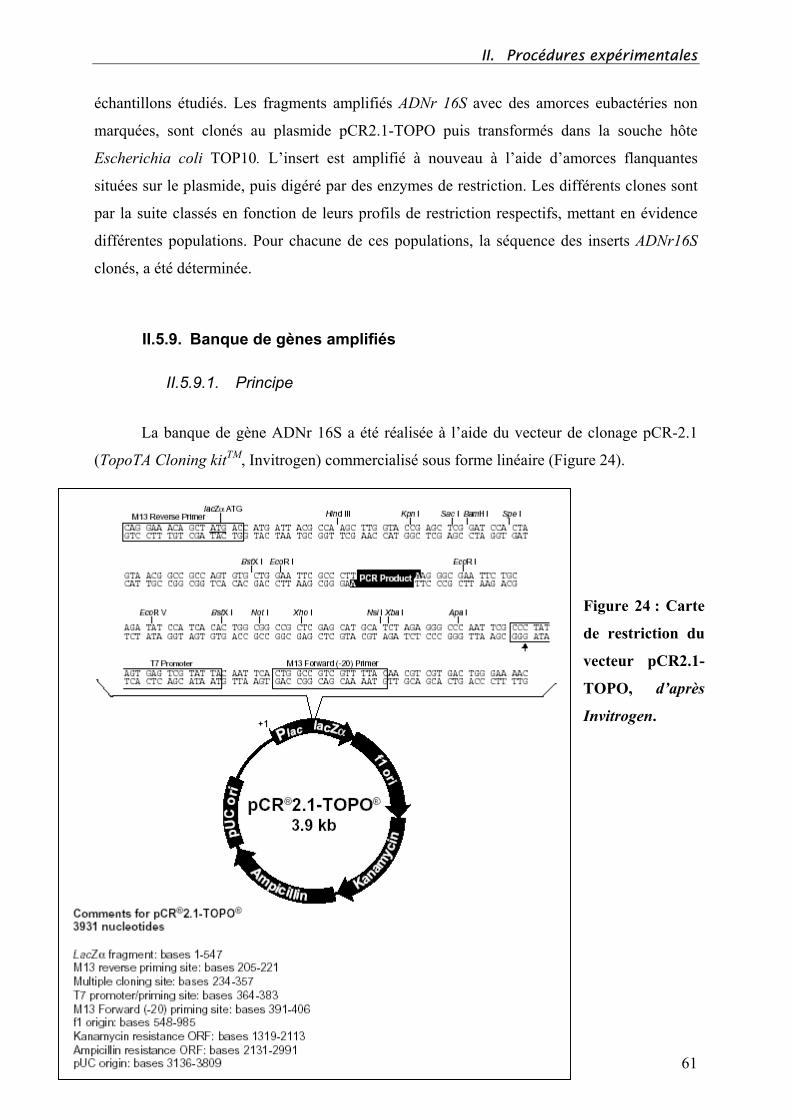
II. Procédures expérimentales
échantillons étudiés. Les fragments amplifiés ADNr 16S avec des amorces eubactéries non
marquées, sont clonés au plasmide pCR2.1-TOPO puis transformés dans la souche hôte
Escherichia coli TOP10. L’insert est amplifié à nouveau à l’aide d’amorces flanquantes
situées sur le plasmide, puis digéré par des enzymes de restriction. Les différents clones sont
par la suite classés en fonction de leurs profils de restriction respectifs, mettant en évidence
différentes populations. Pour chacune de ces populations, la séquence des inserts ADNr16S
clonés, a été déterminée.
II.5.9. Banque de gènes amplifiés
II.5.9.1. Principe
La banque de gène ADNr 16S a été réalisée à l’aide du vecteur de clonage pCR-2.1
(TopoTA Cloning kitTM, Invitrogen) commercialisé sous forme linéaire (Figure 24).
Figure 24 : Carte
de restriction du
vecteur pCR2.1-
TOPO, d’après
Invitrogen.
61
II. Procédures expérimentales
Il comprend, entre autres, deux gènes de résistance à des antibiotiques (kanamycine et
ampicilline), et lacZα qui est une partie du gène lacZ d’Escherichia coli codant pour la く-
galactosidase déficiente, sous contrôle du promoteur Plac inductible à l’IPTG.
Après transformation avec le plasmide recombinant d’une souche hôte (voir
II.3 Souches bactériennes utilisées) produisant une く-galactosidase déficiente, il y aura une
α-complémentation. La く-galactosidase résultante va alors dégrader le substrat X-Gal, présent
dans le milieu, et donner une coloration bleue aux clones non recombinants. Lorsque l’insert
est intégré au plasmide, la bactérie ne produira plus l’enzyme active, les clones positifs seront
blancs.
II.5.9.2. Ligation
Ce vecteur présente à chaque extrémité un résidu thymidine (T) supplémentaire en 3’,
et une enzyme Topoisomérase I liée de manière covalente au vecteur. Ceci permet une
ligation efficace entre le vecteur et les inserts provenant uniquement de produits PCR obtenus
avec la Taq polymérase, celle-ci ajoutant un résidu adénosine (A) en 3’ des fragments
amplifiés. La ligation se fait selon les recommandations du fournisseur.
II.5.9.3. Transformation
La transformation est effectuée par la méthode du choc thermique sur des cellules
E. coli TOP 10 (voir II.3 Souches bactériennes utilisées) chimiocompétentes, selon les
recommandations du fournisseur.
II.5.10. Séquençage
II.5.10.1. Séquençage automatique
Les réactions de séquençage d’ADN ont été réalisées selon la méthode de Sanger, à
l’aide du kit BigDye® Terminator v3.1 Cycle Sequencing Kit (Applied Biosystems) selon les
62
II. Procédures expérimentales
recommandations du fournisseur. Les produits des réactions de séquences sont ensuite
purifiés sur des colonnes Sephadex AutoSeq G-50 (Amersham Pharmacia Biotech).
L’électrophorèse capillaire a été effectuée sur un séquenceur automatique ABI PRISMTM 310
Genetic Analyzer (Applied Biosystems).
Une partie des déterminations de séquences a été effectuée chez un prestataire de
service de séquençage (Biofidal) à partir de clones étalés sur une boite de Pétri ou de produits
PCR non purifiés.
ø Méthode de Sanger
D’après Sanger et al. (1992), la réaction de séquençage est basée sur le principe d’une
réaction cyclique (dénaturation, hybridation, élongation). Le fragment à séquencer est utilisé
comme matrice d’une synthèse nucléotidique réalisée par une ADN polymérase. Cette
réaction est établie, dans un même tube, en présence des quatre précurseurs dNTP
(désoxyribonucléotides tri-phosphates) et d’une faible quantité des quatre analogues portant
quatre fluorochromes différents, les ddNTP (didésoxyribonucléotides tri-phosphates). Lors de
la polymérisation, ces derniers s’incorporent au hasard, ce qui arrête la synthèse. Les
fragments néosynthétisés, de longueurs variées, sont ensuite séparés en fonction de leur taille
par électrophorèse capillaire (séquenceur ABI PRISMTM 310 Genetic Analyzer, Applied
Biosystems). Il devient alors possible de déterminer pour chacun des quatre fluorochromes
utilisés la taille des fragments obtenus et d’en déduire la séquence nucléotidique du fragment
analysé.
II.5.10.2. Analyse des séquences
Les traitements des séquences brutes ont été réalisés à l’aide du logiciel Séquencher
v4.1.4. Les séquences nucléotidiques ont ensuite été comparées aux séquences contenues dans
les banques de données à l’aide du logiciel Blast (Basic Local Alignment Search Tool,
www.ncbi.nlm.gov/blast). Le logiciel Clustal W (www.infobiogen.fr) a permis l’alignement
des séquences. La construction d’arbres phylogénétiques à partir de ces séquences traitées a
été réalisée à l’aide du logiciel MEGA v2.1 (Kumar et al., 2001).
Une partie des séquences déterminées lors de cette étude a été déposée dans une
banque de données (Genbank).
63
III. Description de tapis microbiens
Chapitre III : Description de tapis microbiens
64

III. Description de tapis microbiens
III. Description de tapis microbiens
III.1. Introduction
Depuis une vingtaine d’années, les tapis microbiens photosynthétiques ont fait l’objet
de nombreuses études d’écologie descriptive afin de permettre une meilleure compréhension
de ces écosystèmes côtiers (Krumbein et al., 1977 ; Stal, 1994 ; Stal et al., 1985 ; van
Gemerden, 1993). A cette époque, les méthodes classiques comme la microbiologie et la
biogéochimie ont permis d’entrevoir la complexité de tels écosystèmes.
Ce chapitre vise à décrire deux tapis microbiens photosynthétiques différents : l’un
hypersalé, l’autre marin. Déjà présentés dans la littérature, l’analyse des tapis microbiens de
Camargue (Salins-de-Giraud) et des Iles Orcades (Ecosse) a été appréhendée de manière
intégrée, afin de mettre en lien les communautés bactériennes présentes et leurs rôles
écologiques au sein de ces écosystèmes complexes. Ainsi, les différents aspects de la
biodiversité et de l’écologie, ont été abordés par la combinaison d’approches variées
(moléculaire, microscopique, chimique et biogéochimique) permettant de caractériser à
l’échelle du micromètre la distribution des groupes fonctionnels majoritaires composant la
partie métaboliquement active de ces tapis.
Les tapis microbiens hypersalés représentent des écosystèmes particulièrement bien
adaptés aux habitats ayant des conditions de salinité fluctuantes. Les marais salants de Salins-
de-Giraud en Camargue abritent le développement de tapis microbiens au sein de ses
nombreux partènements. Les travaux de Caumette et al. (1994) ont pu décrire ces tapis issus
de bassins de très fortes salinités (entre 150 ‰ et 300 ‰) en abordant l’étude d’un point de
vue microbiologique et écologique. Ainsi, les cyanobactéries du genre Phormidium dominent
la surface de ce tapis, et recouvrent une couche de bactéries pourpres principalement
composée des genres Halochromatium et Halothiocapsa. Par la suite, plusieurs études
moléculaires ont permis d’approfondir cette première description des tapis de Camargue
(Mouné, 2000 ; Mouné et al., 2003; Mouné et al., 1999 ; Mouné et al., 2000 ), révélant une
diversité bactérienne bien plus importante qu’attendue.
En première partie de ce chapitre, les travaux présentés dans l’article “Characterization
of functional bacterial groups in a hypersaline microbial mat community (Salins-de-Giraud,
Camargue, France)”, concerne cette fois un tapis microbien issu de bassins de salinités
inférieures (de 70 ‰ à 110 ‰). La biodiversité des communautés bactériennes de ce tapis
65
III. Description de tapis microbiens
s’organise en une structure très fine, constituée verticalement de couches distinctes de
quelques micromètres, où s’agencent les populations bactériennes en fonction de leurs
caractéristiques physiologiques et des conditions environnementales. Les cyanobactéries
filamenteuses dominent la surface de ce tapis, essentiellement par la présence de Microcoleus
chthonoplastes. Les bactéries phototrophes pourpres et sulfato-réductrices présentent une
forte diversité qui s’organise le long des microgradients d’oxygène, de lumière et de sulfure.
Les tapis microbiens sont capables de se développer dans des habitats très divers, ainsi
ils ont été observés dans des zones intertidales tels que les plages des îles Orcades (Herbert,
1985). Cet écosystème stratifié, se développant annuellement sur ces sédiments, est dominé
par la bactérie sulfureuse pourpre Thiocapsa roseopersicina. Cette bactérie forme des
microcolonies distinctes solidement fixées aux grains de sable, permettant ainsi un maintien et
une cohésion du sédiment. Ce tapis microbien est pauvre en cyanobactéries, et exclut
totalement le développement de Microcoleus chtonoplastes en son sein (van Gemerden et al.,
1989a; van Gemerden et al., 1989b).
La seconde partie de ce chapitre, exposée dans l’article “Microbial mats on the Orkney
Islands revisited: microenvironment and microbial community composition”, a permis une
caractérisation plus complète des tapis photosynthétiques marins présents sur deux sites
différents, Waulkmill et Swanbister. L’analyse de biomarqueurs caractéristiques a ainsi révélé
la présence de micro-algues, diatomées, cyanobactéries et bactéries sulfato-réductrices. Les
méthanogènes majoritairement présentes sur les plages de Swanbister indiquent le rôle
probable de la méthanogénèse dans le cycle du carbone au sein de ces sédiments. L’analyse
microscopique par CLSM (Confocal Laser Scanning Microscopy) a montré une faible
diversité des cyanobactéries, filamenteuses et unicellulaires, au sein de ces tapis. Le tapis de
Swanbister a révélé par l’analyse des spectres d’irradiances scalaires une hétérogénéité
importante des bactéries phototrophes anoxygéniques, en terme de distribution verticale et de
densité. La T-RFLP et les mesures physico-chimiques ont montré une importante diversité
des bactéries pourpres et sulfato-réductrices, ainsi qu’une organisation verticale très fine liée
aux conditions environnementales. Les principaux facteurs qui influencent la structure des
communautés bactériennes sont l’oxygène et le sulfure ou d’autres composés sulfurés.
66
III. Description de tapis microbiens
III.2. Le tapis microbien hypersalé de Camargue (Salins-de-Giraud)
Ce travail a été soumis au journal FEMS Microbiology Ecology sous le titre :
Characterization of functional bacterial groups in a hypersaline microbial mat
community (Salins-de-Giraud, Camargue, France)
Par: Aude Fourçans1, Tirso García de Oteyza2, Andrea Wieland3, Antoni Solé4, Elia Diestra4, Judith van Bleijswijk5
, Joan O. Grimalt2, Michael Kühl3, Isabel Esteve4, Gerard Muyzer6, Pierre Caumette1 et Robert Duran1
ABSTRACT
A photosynthetic microbial mat was investigated in large pond of a Mediterranean
saltern (Salins-de-Giraud, Camargue, France) of water salinity from 70 ‰ to 110 ‰ (w/v).
Analysis of characteristic biomarkers (e.g., major microbial fatty acids, hydrocarbons,
alcohols and alkenones) revealed the presence of cyanobacteria as major components, in
addition to diatoms and other algae. Functional bacterial groups involved in the sulfur cycle
could be correlated to these biomarkers, i.e. sulfate-reducing, sulfur-oxidizing and anoxygenic
phototrophic bacteria. In the first 0.5 millimeters of the mat, a high rate of photosynthesis
showed the activity of oxygenic phototrophs in the surface layer. Ten different cyanobacterial
populations were detected with Confocal Laser Scanning Microscopy (CLSM): six
filamentous species, with Microcoleus chthonoplastes and Halomicronema excentricum as
dominant ones (73% of total counts); and four unicellular types affiliated to Microcystis,
Chroococcus, Gloeocapsa, and Synechocystis (27% of total counts). Denaturing Gradient Gel
Electrophoresis (DGGE) of PCR-amplified 16S rRNA gene fragments showed some
differences with the dominance of Microcoleus, Oscillatoria, and Leptolyngbya strains
(Halomicronema was not found here) and additional presence of Phormidium, Pleurocapsa
and Calotrix types. Spectral scalar irradiance measurements did not reveal a particular
zonation of cyanobacteria, purple or green bacteria in the first millimeter of the mat.
Terminal-Restriction Fragment Length Polymorphism (T-RFLP) analysis of PCR-amplified
16S rRNA gene fragments of bacteria depicted a high diversity and a fine-scale depth-
distribution of at least five different populations of anoxygenic phototrophs and at least three
ones of sulfate-reducing bacteria along the microgradients of oxygen and light inside the
microbial mat. 1Laboratoire d’Ecologie Moléculaire EA 3525, Université de Pau et des Pays de l’Adour, avenue de l’Université, BP 1155, F-64013 Pau Cedex, France. 2Department of Environmental Chemistry (ICER-CSIC), E-08034 Barcelona, Spain. 3Marine Biological Laboratory, University of Copenhagen, DK-3000 Helsingør, Denmark. 4Department of Genetics and Microbiology, Autonomous University of Barcelona, E-08193 Bellaterra, Spain .67 5Royal Netherlands Institute of Sea Research, Texel, The Netherlands. 6Department of Biotechnology, Delft University of Technology, NL-2628 BC Delft, The Netherlands
III. Description de tapis microbiens
INTRODUCTION
Photosynthetic microbial mats develop at the water-sediment interface in shallow
environments such as estuaries [1,2], sheltered sandy beaches [3,4], or hypersaline salterns
[5,6]. Most of these microbial mats are formed of horizontally stratified, multicolored and
cohesive thin layers, of several functional groups of microorganisms, such as cyanobacteria,
colorless sulfur bacteria, purple sulfur bacteria, or sulfate-reducing bacteria, distributed along
vertical microgradients of oxygen, sulfide and light [7,8].
Hypersaline mats from salterns represent interesting ecosystems adapted to fluctuating
salinity conditions. Microbial mats existing in the most hypersaline ponds of the salterns of
Salins-de-Giraud (Camargue, French Mediterranean coast) were described in ecological,
microbiological and recently molecular studies since more than ten years [6,9-11]. These
saline ponds with water salinity between 150 ‰ and 300 ‰ (w/v) contain microbial mats
similar to those previously described in other hypersaline habitats [5,12]. They are formed of
an upper layer of cyanobacteria belonging to the genus Phormidium, covering a purple layer
of phototrophic bacteria mainly composed of members of the genera Halochromatium [13]
and Halothiocapsa [14], well adapted to such high salinities. The molecular studies [11]
showed that the bacterial composition of these mats was more diverse as expected both in
Bacterial and in Archaeal groups.
In the present study, we investigated another mat from the same salterns growing in
ponds of lower salinity (70 ‰ to 110 ‰ (w/v)). This mat developed over several decades in
large areas used by the Saltern Company as water reservoirs for salt production. The
simultaneous use of different methods in terms of bacterial composition and
microenvironment, allowed a precise in situ analysis of the Camargue mat. In the mat, the
major bacterial groups were investigated by characteristic biomarkers, Confocal Laser
Scanning Microscopy (CLSM), by Denaturing Gradient Gel Electrophoresis (DGGE) and
Terminal Restriction Fragment Length Polymorphism (T-RFLP) analysis of PCR amplified
16S rRNA or functional gene fragments. In order to understand the bacterial occurrence and
distribution at the microscale level, all the microbiological results were related to
microenvironmental gradients determined by in situ microsensor measurements.
68
III. Description de tapis microbiens
MATERIALS AND METHODS
Sampling site description
The sampling site was located in a very large shallow pond at the saltern of Salins-de-
Giraud, close to the sand barrier and the sea coast (Camargue, France). This pond was used
for the storage of pre-concentrated seawater. In this pond of about 10 km2 area, the water
column never exceeded 20 cm depth and its salinity ranged from 70 ‰ to 110 ‰ (w/v). The
photosynthetic microbial mat covered a very large area of this pond and also of other adjacent
ponds, and was constituted of thin laminated cohesive layers of about 5 to 10 mm thick. Due
to its development over several decades, the whole mat was about 5 to 10 cm in total
thickness. The underlying sediment is mostly composed of a mixture of sand and clay.
Sampling procedure
All mat samples analyzed were collected in May 2000, by mean of plexiglas cores.
For biomarkers analysis, mat cores of 26 mm i.d. were immediately frozen until further
analysis. For Confocal Laser Scanning Microscopy, two cores (18 mm i.d.) were transferred
into small plastic tubes containing 2.5 % (v/v) glutaraldehyde in a phosphate buffer (0.2 M
adjusted to the appropriate salinity with NaCl), and stored at 4ºC awaiting further processing.
For DGGE and T-RFLP methods, the upper 10 mm of the mat cores (35 mm i.d.) were sliced
off aseptically, transferred to sterile Petri dishes, frozen in liquid nitrogen, and then stored at
-80°C.
Microsensor measurements of O2 and oxygenic photosynthesis profiles
Depth profiles of O2 and gross oxygenic photosynthesis distribution were measured in
May 2000. Microsensor measurements were done in situ from a small measuring platform
placed above the mat. A Clark-type O2 microsensor [15] connected to a picoammeter
(UniSense A/S, Denmark) was manually operated with a micromanipulator (Märzhäuser,
Germany) mounted on a heavy solid stand. Microsensor signals were recorded with a strip
chart recorder (Servogor, U.K.) operated via batteries. The O2 microsensor had a tip diameter
of 6 µm, a stirring sensitivity of ~0 % and a response time, t90, of 0.2 s. The O2 microsensor
was linearly calibrated on site from readings of microsensor current in the overlying water
and in the anoxic part of the mat (0 % O2). Dissolved O2 concentrations in the overlying water
were determined by Winkler titration [16]. Experimental light-dark shifts for in situ
measurements of oxygenic gross photosynthesis [17] were performed with a custom-made,
light-impermeable box, which was approached to the sensor avoiding physical contact and
thus disturbance of microsensor readings.
69
III. Description de tapis microbiens
Spectral scalar irradiance measurements with fiber-optic microprobes
Mat samples were collected in February 2001 for spectral scalar irradiance
measurements under controlled conditions. For this, a fiber-optic scalar irradiance microprobe
[18] was connected to a sensitive fiber-optic diode array spectrometer with a spectral range of
250-950 nm (PMA-11, Hamamatsu Photonics, Japan). Profiles of spectral scalar irradiance
were measured in the mat by stepwise inserting the microprobe with a motor-driven
micromanipulator (Märzhäuser, Germany; Oriel, USA) at a zenith angle of 140° relative to
the incident light beam. The downwelling spectral scalar irradiance at the mat surface was
measured by positioning the scalar irradiance microprobe over a black light trap at the same
position relative to the light field as the mat surface. Scalar irradiance spectra in the mat were
normalized to the downwelling spectral scalar irradiance at the mat surface. The attenuation
spectrum of scalar irradiance was calculated over discrete depth intervals from the scalar
irradiance profiles according to Kühl and Fenchel [19].
Analysis of fatty acids, hydrocarbons, alcohols and alkenones
The microbial mat samples were extracted after homogenization with methanol,
dichloromethane and n-hexane. Fatty acids were separated from the extracts after
saponification. Afterwards the neutral lipids were fractionated by column chromatography
with silica and alumina into different compound classes. Hydrocarbons and polar fractions
were analyzed by Gas Chromatography (GC) and Gas Chromatography Mass Spectrometry
(GC-MS) after derivatisation. The methodology was described in detail recently by Wieland
et al. [4].
Confocal laser scanning microscopy
The mat samples were analyzed with a microscope (Olympus BH2, Japan) and a confocal
laser microscope (Leica TCS 4d, Germany) equipped with an argon-krypton laser. For
confocal analysis, horizontal slices of defined dimensions were placed on cavity slides,
covered and sealed with cover slips and observed under an excitation beam of 568 nm.
Pigment fluorescence emission was detected with a 590 nm long pass filter. Different
512 × 512 pixel confocal images in two (optical sections) and three-dimensions (summa
projections and stereoscopic images) were obtained from these samples. The cyanobacteria
were identified using different morphological criteria according to Castenholz [20],
i.e. diameter (µm), cell division patterns, and the presence or absence of a sheath for
unicellular morphotypes. Presence of septation and gas vacuoles were also considered for
70
III. Description de tapis microbiens
filamentous cyanobacteria. In addition, the abundance of each cyanobacterial morphotype was
indicated.
DGGE analysis
Genomic DNA was extracted from the mat samples using the UltraClean Soil DNA
Isolation Kit (Mobio Laboratories) according to manufacturer’s protocol. Serial dilutions of
genomic DNA up to 10-4 were made in sterile water and stored at –20 °C. To specifically
amplify the 16S rRNA encoding gene fragments of oxygenic phototrophs, 1 or 2 µl of the
DNA dilutions were used as template in 50 or 100 µl PCR reactions using primer pair
CYA359F+GC/CYA781R and PCR conditions as described by Nübel et al. [21]. The two
different reverse primers CYA781RA and CYA781RC were added in separate PCR reactions.
DGGE was applied according to Schäfer and Muyzer [22] with conditions optimized for the
oxygenic phototrophs specific PCR fragments [21]. We used 1 mm thick 6%
acrylamide/bisacrylamide gels and an urea-formamide (UF) gradient of 20-80%. On top of the
gradient gel, an acrylamide gel without UF was cast to obtain good slots. Gels were run in
TAE buffer for 3.5 h at 200 V and at a constant temperature of 60°C. Subsequently, the gels
were stained in an ethidium bromide solution and inspected under UV illumination using a
Fluor-S Multi Imager (Bio-Rad). Contrast and brightness of the photographs were optimized
using Adobe PhotoShop software. DNA fragments separated by DGGE were excised from the
gel [23], re-amplified, purified using the Qiaquick Gel Extraction Kit (Qiagen), and then
sequenced. Purified bands were sequenced in two directions according to the Sanger reaction
using the Bigdye Terminator Cycle Sequencing Kit (Applied Biosystem) on an ABI PRISM
310 Genetic Analyzer. Close relatives of consensus sequences were searched in the GenBank
Nucleotide Database using BLAST search. Subsequently, new sequences and their closest
relatives (if not yet present in ARB) were added to ARB database and aligned using the
automatic alignment tool. Phylogenetic analysis was performed in ARB using several
different algorithms (e.g., maximum parsimony, neighbour-joining, maximum likelyhood).
The GeneBank accession numbers of each partial 16S rRNA sequencing clones (SdG1 to
SdG7) are AY393850 to AY393856, respectively.
T-RFLP analysis
The upper 2 mm of the mat cores were sliced with a cryomicrotome (MICROM GmbH,
Germany) at around 200 µm, and the third mm at around 500 µm vertical depth resolution.
These mat slices were grinded with liquid nitrogen in a mortar with a pestle and genomic
71
III. Description de tapis microbiens
DNA was extracted using the UltraClean Soil DNA Isolation Kit (MoBio Laboratories Inc.,
USA) according to the manufacturer. All extracted genomic DNA samples were stored at
-20°C until further processing. T-RFLP analysis was performed with different primer sets,
8f-926r [24,25], 8f-SRB385 [26], and pb557f-pb750r [27], according to the experimental
conditions described in Wieland et al. [4]. Respectively, these primer sets allowed targeting
the whole bacterial community, the sulfate-reducing bacteria (SRB), and the phototrophic
anoxygenic bacteria (PAB). Restriction enzymes used in T-RFLP analysis were HaeIII and
RsaI (New England Biolabs, UK), for analysis of the entire bacterial diversity, and HaeIII and
Hin6I for the SRB and PAB. Dominant T-RFs (terminal restriction fragments) were selected
by comparison of numerical values and electropherograms. From T-RF values, predicted
digestions were realized on the TAP-TRFLP program of the RDP (Ribosomal Database
Project) web site (http://rdp.cme.msu.edu/) [28] in order to assign the different T-RFs to a
certain genus or species. All depth T-RFLP profiles were compared, from tables assembling
T-RFs relatives values of each restriction enzyme by a Correspondence Factorial Analysis
(CFA). The CFA were realized with MVSP v3.12d software (Rockware Inc., UK) [29].
RESULTS Description and environmental conditions of the microbial mat
Structure of the microbial mat
The mat of several centimeters in thickness was composed of three distinct colored
layers. An upper brown-green colored layer was constituted of filamentous cyanobacteria
morphologically related to the genus Microcoleus, and of unicellular cyanobacteria similar to
the form-genus Synechocystis. Under this dense cyanobacterial layer, a thin purple layer was
visible, composed of purple non-sulfur bacteria morphologically resembling members of the
family Rhodospirillaceae and of Chromatiaceae-like purple sulfur bacteria (R. Guyoneaud,
personal communication). Beneath these two layers a black zone occurred with iron sulfide
precipitates, indicating intense sulfate-reduction activity. The physical and chemical
parameters measured in the sampling site (Table 1) were in general constant, although rapid
variations of the water salinity and the redox values within two days during the sampling
campaign could be observed. This was probably due to water exchanges managed by the
saltern company exposing the mat to environmental changes.
Depth profiles of O2, gross photosynthesis, and spectral scalar irradiance
High O2 consumption in the mat led to a low O2 concentration and O2 penetration in
situ during the night (5:32 h, 17°C, 94 ‰ (v/w)), confining the oxic zone to the top 0.2 mm of
72
III. Description de tapis microbiens
the mat (Fig. 1). In the afternoon (15:50 h, 30°C, 100 ‰ (v/w)), high rates of oxygenic
photosynthesis led to a strong increase of O2 concentration both in the overlying water and
within the mat. The O2 penetration depth in the mat increased to 2 mm. Gross oxygenic
photosynthesis was measurable in the top 0.6 mm of the mat. An important photosynthetic
activity at 0.3-0.6 mm depth indicated the presence and/or activities of oxygenic phototrophs
in the upper mat layers.
From measured spectral scalar irradiance profiles, distinct spectral regions of
pronounced absorption could be ascribed to the presence of different pigments (Fig. 2, upper
graph). The presence of cyanobacteria led to pronounced scalar irradiance minima at around
630 and 680 nm, corresponding to phycocyanin and chlorophyll a (Chl a) absorption. The
scalar irradiance minima in the region between 800 and 900 nm correspond to
bacteriochlorophyll a (Bchl a) absorption, indicating the presence of purple bacteria. A
shoulder at 740-750 nm indicated some absorption by Bchl c present in green photosynthetic
bacteria. In the spectral region of 400-550 nm, scalar irradiance was strongly attenuated due
to Chl a and carotenoid absorption. Absorption by Chl a, phycocyanin, Bchl a, and Bchl c
occurred in all mat layers within the top 0.8 mm of the mat, indicating a homogeneous
distribution of these photosynthetic groups. However, the spectral scalar irradiance in the
wavelength regions of Chl a, phycocyanin and carotenoid absorption were stronger attenuated
than wavelengths corresponding to Bchl a and Bchl c absorption (Fig. 2, lower graph),
indicating as expected a dominance of cyanobacteria in the surface layer of the mat.
Bacterial diversity in the top active layers of the microbial mat
Bacterial diversity estimated by biomarkers
Fatty acids were the major lipid compounds found in the microbial mat. Their
distribution essentially encompassed C14-C22 homologues, namely n-hexadec-9(Z)-enoic,
n-hexadecanoic, n-octadec-9(Z)-enoic, n-octadec-11(Z)-enoic, iso-pentadecanoic and anteiso-
pentadecanoic acids (Fig. 3a), typically representative of algal and bacterial communities.
C37-C38 di-, tri- and tetra-unsaturated alkenones were also found in this mat (Fig. 3b).
These compounds are specific of Hapthophyceae [30,31]. However, their occurrence cannot
be attributed to species typically found in pelagic environments and are probably related to
unknown species.
The sterol distribution of this mat showed minor proportions of sterols having the
unsaturated positions at ∆5, ∆22 and ∆5,22 (Fig. 3b), which could originate from cyanobacteria
[32-34], Chlorophyta [35,36], or diatoms [36-38]. The common diatom marker
73
III. Description de tapis microbiens
24-methylcholesta-5,24(28)-dien-3β-ol [36-38] was found in minor proportion, suggesting the
presence of diatoms probably in the surface layer of the mat.
However, the major feature of the sterol distribution from this mat was the high
relative abundance of 5α(H)-stanols. These compounds may originate from direct biogenic
inputs [30,33], including cyanobacteria [39], or from in situ hydrogenation processes [33,40].
The dominance of ∆5-stenols and 5α(H)-stanols is indicative of the prevalence of
hydrogenation processes. Cholestan-5β(H)-ol was also present in significant proportion. The
transformation of ∆5-stenols into 5α(H)- and 5β(H)-stanol mixtures generally occurs via
∆4-sten-3-ones [41,42] or, in highly reducing environments, by direct conversion [43]. The
concentrations of stanones and stenones were below their detection limit, which points to a
direct conversion between both compounds as the most likely mechanism.
n-Heptadecane and n-heptadecenes were the main hydrocarbons (Fig. 3c). These
compounds are generally found in cyanobacteria [34,44] or in phototrophic eukaryota [45].
Other hydrocarbons specific of cyanobacterial inputs, such as 9-methylhexadecane, were also
found in major proportion, indicating the dominance of cyanobacteria in this mat.
Phyt-1-ene, which occurred together with other phytene homologues, also constituted
one of the major hydrocarbon groups. These hydrocarbons are characteristic for methanogenic
bacteria [46] and may also be produced in the decomposition of phytol [47].
In addition to these hydrocarbons, a distribution of C23-C35 n-alkanes predominated by
the odd carbon numbered homologues, namely C29, C31 and C33, was found. This distribution
is representative for inputs from higher plants [48] and is currently found in microbial
sediments from coastal environments [49], probably reflecting the influence of wind
transported materials from nearby higher plants.
Diversity of oxygenic phototrophs
Confocal Laser Scanning Microscopy (CLSM) and molecular techniques were used to
identify the cyanobacteria of the Camargue microbial mat. Using CSLM, both filamentous
and unicellular cyanobacteria were found in the mat (Table 2; Fig. 4). Filamentous types were
the most abundant, accounting for 73 % of the total cyanobacteria present (Table 2a).
Microcoleus chthonoplastes (Fig. 4b) was dominating the filamentous cyanobacterial
community, as typically found in hypersaline mats [1,50,51]. Halomicronema excentricum
characterized by thin filaments and cylindrical shape (less than 1 µm wide trichomes) (Fig.
4c), was the second most frequent filamentous cyanobacterium, also typical of microbial mats
from man-made Solar ponds [52]. Another abundant (18 %) filamentous cyanobacterium (Fig.
74
III. Description de tapis microbiens
4e) with thin filaments and short trichomes could not be identified. Leptolyngbya sp.,
Limnothrix sp. and Pseudanabaena sp. filaments were also present like in other mats as well,
e.g. from the Ebro delta [1,50,51] and the Orkney Islands [4]. Unicellular cyanobacteria
Chroococcus sp., Microcystis sp. and members of Synechocystis and Gloeocaspsa groups
represented 27 % of the total cyanobacteria in the Camargue mat (Table 2b).
In addition to CLSM analysis, a molecular approach was used to describe the
oxygenic phototroph diversity. 16S rDNA PCR products, specific for cyanobacteria, were
separated by DGGE. Fifteen different bands were counted, of which the strongest fluorescent
were excised from the gel (bands 1 to 7 in Fig. 5a) and retrieved for DNA sequencing.
Phylogenetic analysis of these sequences (SdG1 to SdG7 in Fig. 5b) showed, that the pristine
hypersaline Camargue mat was dominated by the filamentous cyanobacteria genera
Microcoleus (SdG5 and 6 in Fig. 5b), Oscillatoria (SdG3 in Fig. 5b) and Leptolyngbya (SdG7
in Fig. 5b). Other cyanobacteria composing this mat were related to the unicellular
Pleurocapsa sp. (SdG1 in Fig. 5b), Calotrix sp. (SdG4 in Fig. 5b), and Phormidium sp. (SdG2
in Fig. 5b). In addition, a 16S rDNA sequence affiliated to the prymnesiophyte alga Isochrysis
was also obtained with the same cyanobacterial primers.
Diversity and community structure at a microscale level
The organization and composition of the bacterial community in the mat was
investigated by T-RFLP using an eubacterial primer set (8f-926r) [24,25], targeting a partial
sequence of the 16S rDNA gene. T-RFLP profiles so obtained, with around 35 T-RFs with the
HaeIII digestion (data not shown), corresponding to diverse phylogenetics groups or OTUs
(Operational Taxonomic Unit) were characteristic of each microlayer within the top three
millimeters of the mat, and of the underlying layer. A correspondance factorial analysis
(CFA) of each T-RFLP profiles for the restriction enzymes HaeIII and RsaI revealed a
particular distribution in three zones: a surface layer (0-0.2 mm), a large mid layer
(0.2-3 mm), and a deeper region (underlying layer) (Fig. 6a). This distribution was mostly
influenced by the first axis, which explains 27.8% of the variance particularly in the deep
third millimeter. Among the most influencing variables, (T-RFs or OTUs) of this deeper zone,
T-RFs 58 bp with RsaI enzyme could be related to Desulfomicrobium baculatum; and also
T-RFs 205 and 244 pb with HaeIII could be correlated to Desulfobulbus and Streptomyces
genera (Fig. 6b). In contrast, the second axis influenced particularly the structure of the
surface mat (0-0.2 mm) with 11.8% of the variance by the T-RFs of 125 bp (Rsa digest), and
of 200 bp and 297 bp (HaeIII digest), related to the genera Neisseria, Chloroflexus and
75
III. Description de tapis microbiens
Mycoplasma. All these OTUs seemed to play an important role in the observed vertical
organization of this mat.
In addition, the distribution of the bacterial communities involved in the sulfur cycle
of the mat was also investigated. In order to understand more precisely their putative role in
the structure of this mat, a T-RFLP approach was applied by targeting diverse functional
groups.
Sulfate-reducing bacteria (SRB) were accessed by their 16S rDNA encoding gene with
the primer pair 8f-385r [26], and combination of the results with the two restriction enzymes
HaeIII and Hin6I. In the same way, the CFA of this data set showed a specific distribution of
the SRB. Particularly two distinct SRB communities were characteristic of the third deeper
millimeter layer and of the layer at 1.6 millimeter (Fig. 7a). This later layer seemed to be
really independent, since the first axis with a high percentage of 40.7% explained alone the
distinct structure of the mid layer, characterized by many T-RFs, including mainly 200 and
270 bp (HaeIII). These T-RFs could be related to genera Desulfovibrio and Desulfobacter,
respectively (Fig. 7b). The second axis explained essentially with 14.8% the composition of
the third millimeter, mainly with T-RFs of 72 and 197 bp (HaeIII) and of 55 bp (Hin6I). The
first T-RF cited may possibly assimilate to some Desulfovibrio species.
Therefore, the SRB community was organized in a depth-dependent distribution in the
mat and was composed of at least three distinctive populations. The observed stratification is
probably influenced by the high oxygen penetration depth down to 2 millimeters, and by the
high oxygen concentration detected during the day more than 900 µM in the surface layer of
the mat (Fig. 1). The upper population developed in the uppermost 1.6 mm of the mat, could
therefore represent SRB highly tolerant to oxygen (Fig. 1). Beneath this depth, the oxygen
concentration strongly decreased, due to the absence of photosynthetic activity and high
oxygen consumption in this layer. Therefore, another populations of SRB could be detected in
this layer, probably adapted to such low oxygen conditions. Below in the totally anoxic mat, a
third SRB population probably more sensitive to the oxygen was present.
In addition to SRB communities, the phototrophic anoxygenic bacteria (PAB) were
also investigated in the same layers. Their presence in the mat was detected with the primer
pair pb557f-pb750r [27], targeting on the pufM gene, which encodes a subunit of the
photosynthetic center of purple sulfur and non-sulfur bacteria.
CFA on T-RFLP patterns of these PAB communities revealed the presence of five
distinct clusters in the mat organized in five layers through the top three millimeters (Fig. 8a).
The layers from 0.2 to 0.4 mm and from 0.4 to 1.8 mm were explained by the first axis,
76
III. Description de tapis microbiens
showing a high percentage (38.4%) of the variance and corresponding to some T-RFs
(199 pb, HaeIII) related to Halochromatium salexigens (Fig. 8b). The three other layers, from
0 to 0.2 mm, from 1.8 to 2 mm, and from 2.5 to 3 mm, were mostly influenced by the second
axis (12%). This included T-RFs (Hin6I) of 137 bp, corresponding to Roseospira marina, and
also 146 bp.
Measurements of the spectral scalar irradiance revealed the presence of purple bacteria
in surface layer of the mat, especially in the zone at 0.5-0.8 mm depth (Fig. 2). This confirms
the observation with T-RFLP, showing the presence of distinct populations at 0.4 to 1.8 mm.
In contrary, only few PAB were observed in the upper layer (0-0.4 mm) by these methods,
explaining maybe their particular position revealed through the CFA scatter plot (Fig. 8a). So,
the PAB developing at greater depths in the mat could be adapted to lower light intensities, as
compared to the PAB community of the surface layer, since light is strongly attenuated in the
mat (Fig. 2). Moreover, oxygen could also play a role in the stratification of the PAB,
discriminating populations of different tolerance to the presence of oxygen, especially in the
surface layer of the mat with high oxygen concentrations (Fig. 1).
DISCUSSION
The investigated photosynthetic microbial mat showed a nice spatial distribution of
different functional groups at the microscale level. As revealed by spectral scalar irradiance
(Fig. 2), by CLSM (Table 2), and by DGGE (Fig. 5), the cyanobacteria were the dominant
rather diverse photosynthetic microorganisms very active in the first millimeter of the mat.
Analyses of biomarkers (Fig. 3) corroborated these observations of a dominance of oxygenic
phototrophs, since major fatty acids (N-octadec-9(Z)-enoic acid) , alcohols (5α(H)-stanols),
and hydrocarbons (n-Heptadecane, n-heptadecenes, and 9-methylhexadecane) found in this
mat corresponded to cyanobacteria [53].
Identification of oxygenic phototrophs down to the genus or even species level was
done by Confocal Laser Scanning Microscopy (CLSM) and sequencing analysis
(PCR-DGGE-sequencing). Two dominant filamentous cyanobacteria Microcoleus sp. and
Leptolyngbya sp. were identified by both techniques. Other oxygenic phototrophs were either
identified by CLSM (Halomicronema, Limnothrix, Pseudanabaena, Synechocystis – group,
Gloeocapsa – group, Chroococcus, and Microcystis) or by sequencing analysis (Phormidium,
Calotrix, Pleurocapsa, Oscillatoria, and presumably a Prymnesiophyte alga).
As described previously [54-56], bacterial biodiversity depends on gradient salinity,
with a decreasing bacterial diversity when salinity increases. However, in this investigated
77
III. Description de tapis microbiens
halophilic microbial mat, the diversity of oxygenic phototrophs is quite important with the
dominance of Microcoleus chthonoplastes, a typical inhabitant of halophilic microbial mats
[57-59]. At higher salinity, other cyanobacterial morphotypes could be like Phormidium
dominant [6].
Within the mat, analysis of biomarkers revealed the presence of purple bacteria like
Rhodobacter and Ectothiorhodospira , and also of sulfate-reducing bacteria. Iso- and anteiso-
pentadecanoic acids are abundant in sulfate-reducing bacteria and sulfur-oxidizing bacteria
such as Thiomicrospira [60]. Cyclopropylnonadecanoic acid was also a major compound in
the distribution of fatty acids. This compound is abundant in purple phototrophic bacteria
such as Rhodobacter and Ectothiorhodospira where it occurs together with significant
amounts of n-octadec-11(Z)-enoic acid [60]. The ratio between these two acids (0.5) could be
related to the growth status of the microbial mat, with a high relative proportion of the
cyclopropyl acid being indicative of stationary growth [61]. The high abundance of iso- and
anteiso-pentadecanoic acids, as well as of cyclopropylnonadecanoic and n-octadec-11(Z)-
enoic acids likely reflects the dominance of two different populations exchanging hydrogen
sulfide, which could be sulfate-reducing and purple phototrophic bacteria, respectively.
By the use of specific primer sets, the T-RFLP allowed to distinguish photosynthetic
anoxygenic bacteria and sulfate-reducing bacteria organized in five and three distinct
populations among the first three millimeters of this mat, respectively (Fig. 7-8).
We could demonstrate the presence of Desulfobacter-like and Desulfovibrio-like
SRB, in the mid layer of the mat, corresponding to the fluctuating oxic and anoxic zone
during the diel cycle (Fig. 1). Many Desulfovibrio species were isolated from the oxic zone
of microbial mats, and were found to be able to tolerate and even to use lower extent oxygen
[62,63]. The 1.6 mm top layer, completely oxic during the day, was inhabited by an oxygen
tolerant SRB community, which could not be correlated by T-RFLP to any known SRB.
Previous molecular studies have described the presence of Desulfonema-like species in the
oxic surface layer of several microbial mats. They were found to be metabolically versatile
with a high affinity to oxygen [64,65]. In the deeper 3 mm layer, our study showed that one
SRB population was specific of the anoxic layer, indicating probably a high sensitivity to
oxygen. Thus, T-RFLP analysis illustrated a specific vertical stratification of the SRB
populations within the top 3 mm layers of the mat, that could be explained by their
behavioral responses to oxygen including aggregation, migration to anoxic zones, and
aerotaxis [62].
78
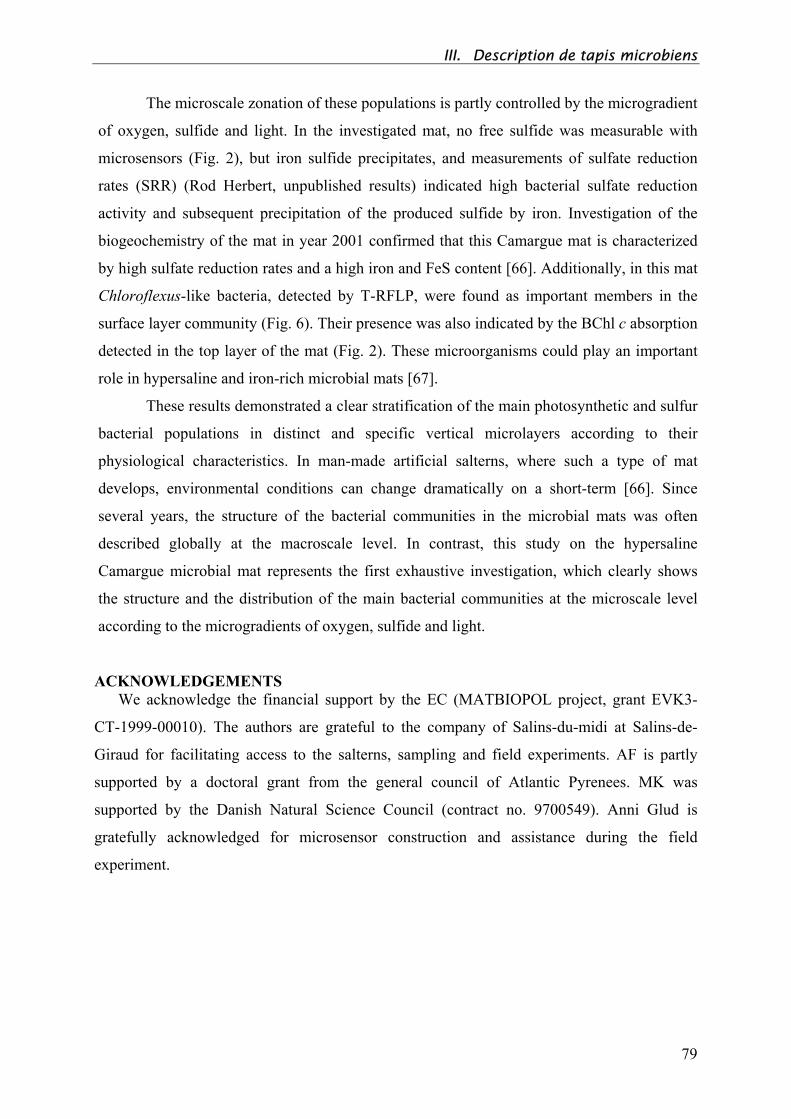
III. Description de tapis microbiens
The microscale zonation of these populations is partly controlled by the microgradient
of oxygen, sulfide and light. In the investigated mat, no free sulfide was measurable with
microsensors (Fig. 2), but iron sulfide precipitates, and measurements of sulfate reduction
rates (SRR) (Rod Herbert, unpublished results) indicated high bacterial sulfate reduction
activity and subsequent precipitation of the produced sulfide by iron. Investigation of the
biogeochemistry of the mat in year 2001 confirmed that this Camargue mat is characterized
by high sulfate reduction rates and a high iron and FeS content [66]. Additionally, in this mat
Chloroflexus-like bacteria, detected by T-RFLP, were found as important members in the
surface layer community (Fig. 6). Their presence was also indicated by the BChl c absorption
detected in the top layer of the mat (Fig. 2). These microorganisms could play an important
role in hypersaline and iron-rich microbial mats [67].
These results demonstrated a clear stratification of the main photosynthetic and sulfur
bacterial populations in distinct and specific vertical microlayers according to their
physiological characteristics. In man-made artificial salterns, where such a type of mat
develops, environmental conditions can change dramatically on a short-term [66]. Since
several years, the structure of the bacterial communities in the microbial mats was often
described globally at the macroscale level. In contrast, this study on the hypersaline
Camargue microbial mat represents the first exhaustive investigation, which clearly shows
the structure and the distribution of the main bacterial communities at the microscale level
according to the microgradients of oxygen, sulfide and light.
ACKNOWLEDGEMENTS
We acknowledge the financial support by the EC (MATBIOPOL project, grant EVK3-
CT-1999-00010). The authors are grateful to the company of Salins-du-midi at Salins-de-
Giraud for facilitating access to the salterns, sampling and field experiments. AF is partly
supported by a doctoral grant from the general council of Atlantic Pyrenees. MK was
supported by the Danish Natural Science Council (contract no. 9700549). Anni Glud is
gratefully acknowledged for microsensor construction and assistance during the field
experiment.
79
III. Description de tapis microbiens
2.0
1.5
1.0
0.5
0.0
-0.5
-1.0
0 300 600 900
Photosynthesis (nmol O2 cm-3 s-1)
O2 (5:32 h) O2 (15:50 h)
Concentration (µM)
Dep
th (
mm
)
0 5 10 15 20 25
Figure 1. In situ depth profiles of O2 and gross photosynthesis (bars) measured during the afternoon
(15:50 h) and night (5:32 h) in mats from a pre-concentration pond of the Salins-de-Giraud saltern.
80
III. Description de tapis microbiens
400 500 600 700 800 9000
2
4
6
8
Atte
nuat
ion
coef
fici
ent,
K0 (
mm
-1)
Wavelength (mm)
1
10
100
BChl c
Phycocyanin
Chl a
BChl a
0
0.2
0.4
0.5
0.6
0.7
0.8
Sca
lar
irra
dian
ce (
% o
f in
cide
nt ir
radi
ance
)
Figure 2. Depth profiles of spectral scalar irradiance in the Camargue mat normalized to the
downwelling spectral scalar irradiance at the mat surface (upper graph). Numbers indicate depth (mm).
Average attenuation spectrum of scalar irradiance over the depth interval of 0-0.8 mm (lower graph),
calculated from the profile shown in the upper graph. Broken lines indicate the standard deviations of
the attenuation coefficients, K0.
81
III. Description de tapis microbiens
0
100
%
5.000 7.500 10.000 12.500 15.000 17.500 20.000 22.500 25.000 27.500 30.000 32.500 35.000 37.500 40.000
C18
C10
C12
C13
C14
C15
a-C15
i-C15
C16:2
C16:1n-9
C16
i-C17
C17:1
C17
C18:1n-7
C18:2n-6
C18:1n-9
C20:4n-6
C20:5n-3
C20:1
C20C22
C24
branched C15
a-C14
i-C14
C23 C25
C26
cy-C19
a-C17
branched C17
40.000 42.000 44.000 46.000 48.000 50.000 52.000 54.000 56.000 58.000
rt0
100
%
0
100
%
C37:4C37:2
C37:3
C38:3
C38:2
C38:4
C27
- ∆0C
27- ∆5
C
27- ∆2
2C
27- ∆5
,22
C28
- ∆0
C29
- ∆0C28
- ∆5
C29
-∆5 C28
- ∆5,2
2
C29
-∆5,2
2
C28
-∆22
C29
-∆22
C28
-∆5,2
4(28
)
5 β−C
27- ∆0
27-n
or-5
β−C28
- ∆0
I
(b)
10.000 15.000 20.000 25.000 30.000 35.000 40.000 45.000 50.000
0
100
%
C18
C17
C17:1
Phy
tane
C19
C20 C21 C22
C23
C24
C25
C26
C27
C28
C29
C30
C31
C32
C33
C34 C35
P1
P3
P2
C16 C2 7
- 2-e
n e
C28
-2-e
ne
diploptene
C31
:2
C23:1
9-methylhexadecane
(c)
Figure 3. Gas chromatographic profiles showing the major (a) fatty acids, (b) alcohol and alkenone
fractions, (c) hydrocarbons (P1, P2, P3 phytenes) from Salins-de-Giraud microbial mat.
82
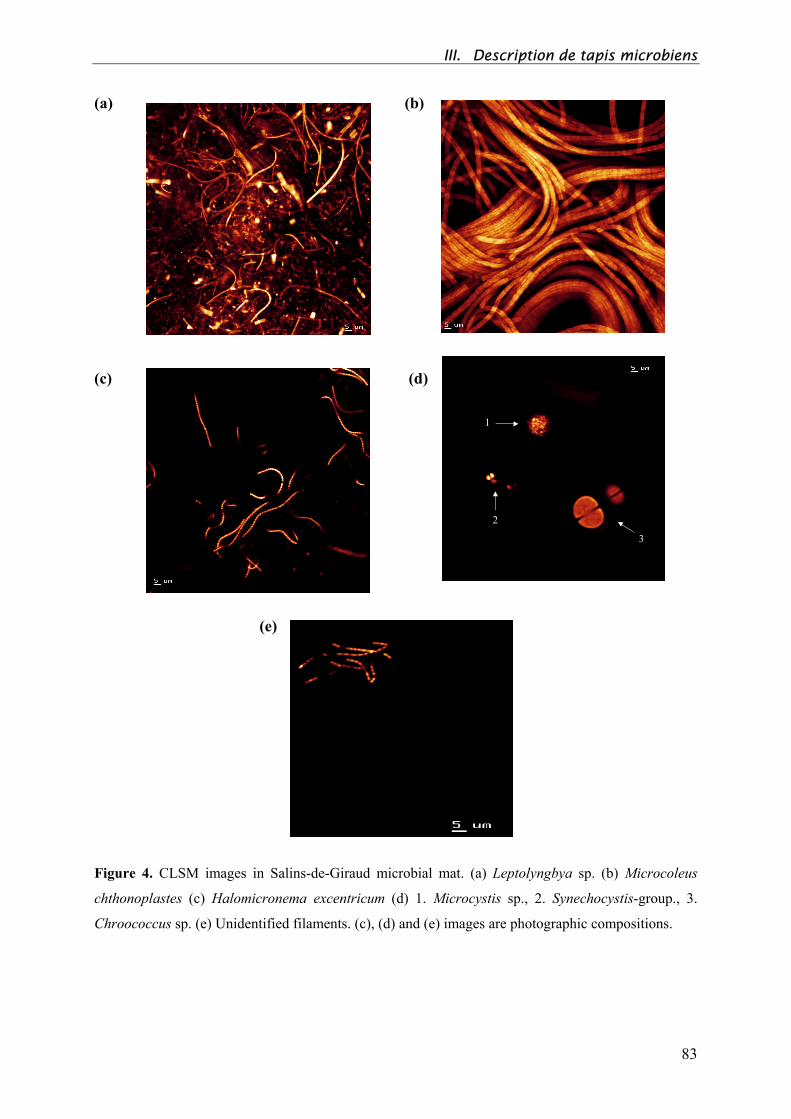
III. Description de tapis microbiens
(a) (b)
(c) (d)
83
(e)
a
b
3 2
1
c
Figure 4. CLSM images in Salins-de-Giraud microbial mat. (a) Leptolyngbya sp. (b) Microcoleus
chthonoplastes (c) Halomicronema excentricum (d) 1. Microcystis sp., 2. Synechocystis-group., 3.
Chroococcus sp. (e) Unidentified filaments. (c), (d) and (e) images are photographic compositions.
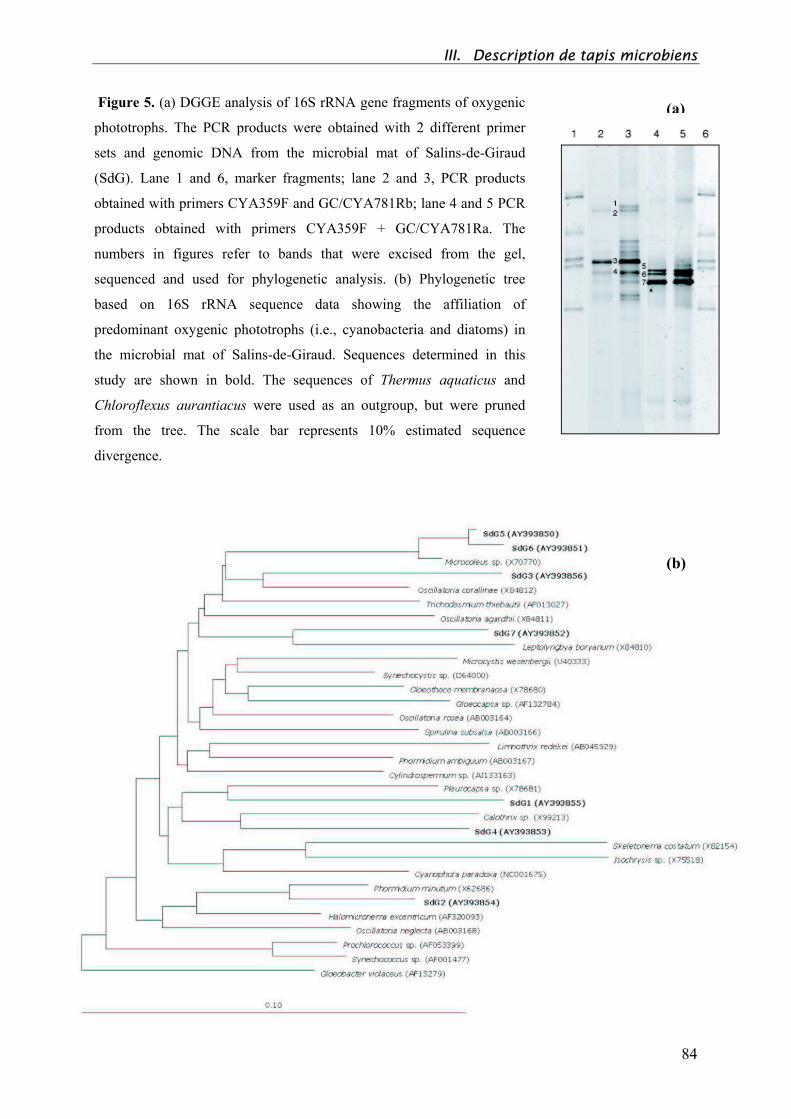
III. Description de tapis microbiens
Figure 5. (a) DGGE analysis of 16S rRNA gene fragments of oxygenic
phototrophs. The PCR products were obtained with 2 different primer
sets and genomic DNA from the microbial mat of Salins-de-Giraud
(SdG). Lane 1 and 6, marker fragments; lane 2 and 3, PCR products
obtained with primers CYA359F and GC/CYA781Rb; lane 4 and 5 PCR
products obtained with primers CYA359F + GC/CYA781Ra. The
numbers in figures refer to bands that were excised from the gel,
sequenced and used for phylogenetic analysis. (b) Phylogenetic tree
based on 16S rRNA sequence data showing the affiliation of
predominant oxygenic phototrophs (i.e., cyanobacteria and diatoms) in
the microbial mat of Salins-de-Giraud. Sequences determined in this
study are shown in bold. The sequences of Thermus aquaticus and
Chloroflexus aurantiacus were used as an outgroup, but were pruned
from the tree. The scale bar represents 10% estimated sequence
divergence.
(a)
(b)
84
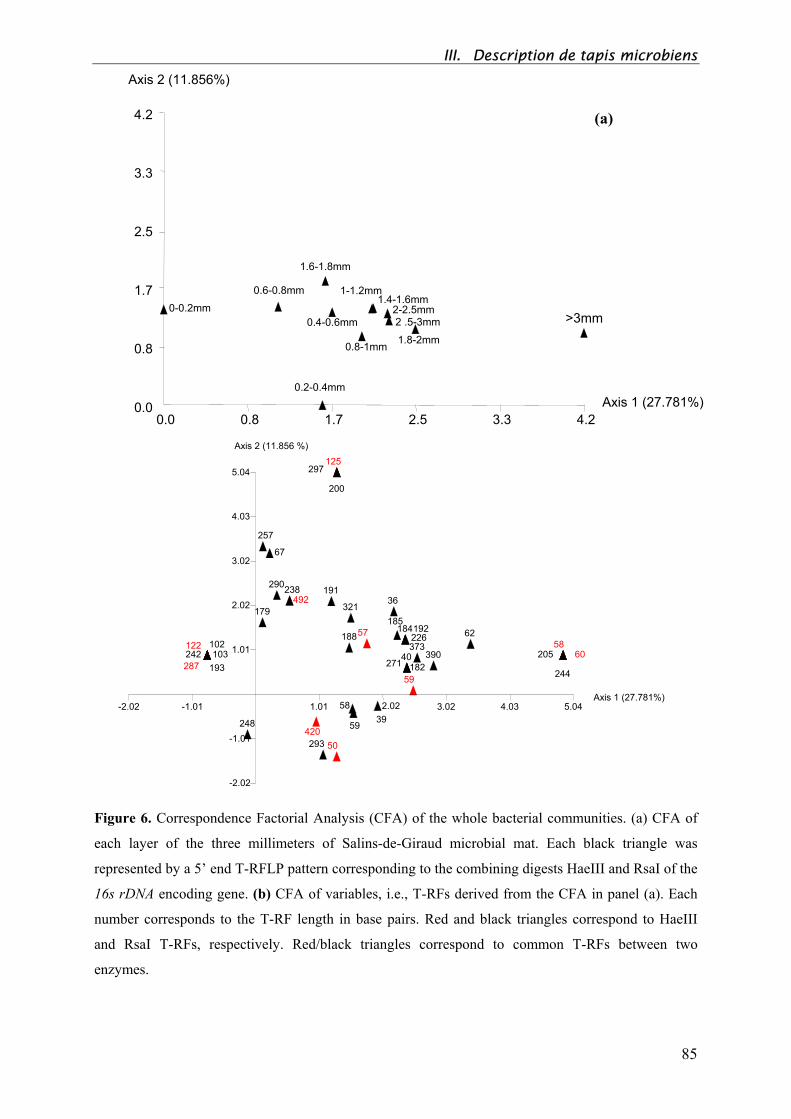
III. Description de tapis microbiens
85
Axis 2 (11.856%)
4.2 (a)
3.3
2.5
1.6-1.8mm
1.7
0.4-0.6mm
1-1.2mm 1.4-1.6mm
2-2.5mm 2 .5-3mm
0.6-0.8mm 0-0.2mm
>3mm 1.8-2mm
0.8-1mm 0.8
0.2-0.4mm
Axis 1 (27.781%) 0.0 0.0 0.8 1.7 2.5 3.3 4.2
Axis 2 (11.856 %)
5.04 4.03 3.02 2.02 1.01 -2.02 -1.01
5.04
4.03
3.02
2.02
1.01
-2.02
-1.01
390
321
293 420
257
248
244
205
200
193
191
188
179
2290
38 492
125 297
122 242 287
102 103
67
62
60
59
58
58
57
50
40271
184192226373
185
59 182
39
36
Axis 1 (27.781%)
Figure 6. Correspondence Factorial Analysis (CFA) of the whole bacterial communities. (a) CFA of
each layer of the three millimeters of Salins-de-Giraud microbial mat. Each black triangle was
represented by a 5’ end T-RFLP pattern corresponding to the combining digests HaeIII and RsaI of the
16s rDNA encoding gene. (b) CFA of variables, i.e., T-RFs derived from the CFA in panel (a). Each
number corresponds to the T-RF length in base pairs. Red and black triangles correspond to HaeIII
and RsaI T-RFs, respectively. Red/black triangles correspond to common T-RFs between two
enzymes.
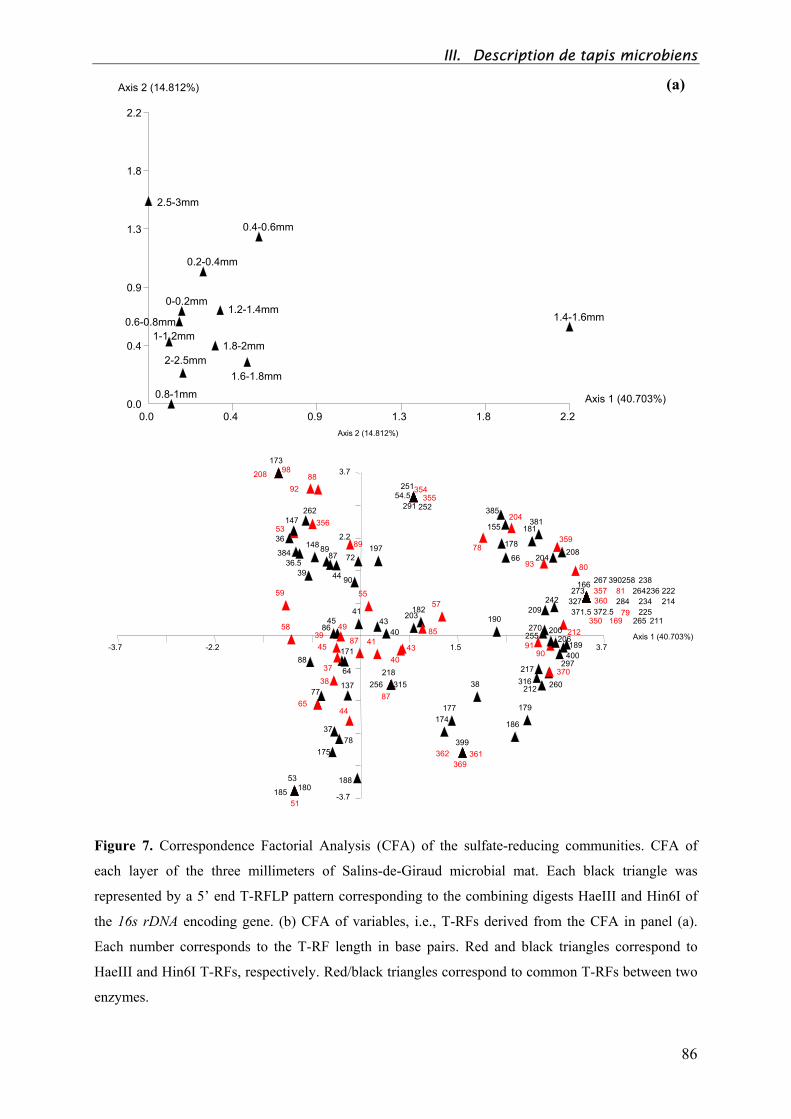
III. Description de tapis microbiens
86
(a) Axis 2 (14.812%)
2.2
1.8
2.5-3mm
1.3 0.4-0.6mm
0.2-0.4mm
0.9 0-0.2mm
1.2-1.4mm 1.4-1.6mm 0.6-0.8mm
1-1.2mm 0.4 1.8-2mm
2-2.5mm 1.6-1.8mm
0.8-1mm 0.0
0.0 Axis 1 (40.703%)
0.9 2.2 0.4 1.3 1.8
Axis 2 (14.812%)
Axis 1 (40.703%)
78
3.7 1.5 -3.7 -2.2
3.7
2.2
-3.7
369 362 361
359
357 360
356
208
204
93
92
89
88
87
87
85
80
78
65
59
58
57 55
51
49
45
44
43 41
40
38
37
399
385
315
262
260 256
255 91
90
270
251 354
291 54.5
252 355
242
218 217
212 316
209
208 204
197
190
188
186
185
182 203
181 381
179
178
177
175
174
173 98
171
166273
284 81
327
79 169 350
372.5 371.5
2390 267 58
211 225
265
234 2264 36
214 222
1206
212 200
89
297 370
400
155
137
90
88
77
72 66
64
53 180
45 86
39
43 41
40
38
37
36
147 53
39
384 36.5
87 89
148
44
238
Figure 7. Correspondence Factorial Analysis (CFA) of the sulfate-reducing communities. CFA of
each layer of the three millimeters of Salins-de-Giraud microbial mat. Each black triangle was
represented by a 5’ end T-RFLP pattern corresponding to the combining digests HaeIII and Hin6I of
the 16s rDNA encoding gene. (b) CFA of variables, i.e., T-RFs derived from the CFA in panel (a).
Each number corresponds to the T-RF length in base pairs. Red and black triangles correspond to
HaeIII and Hin6I T-RFs, respectively. Red/black triangles correspond to common T-RFs between two
enzymes.
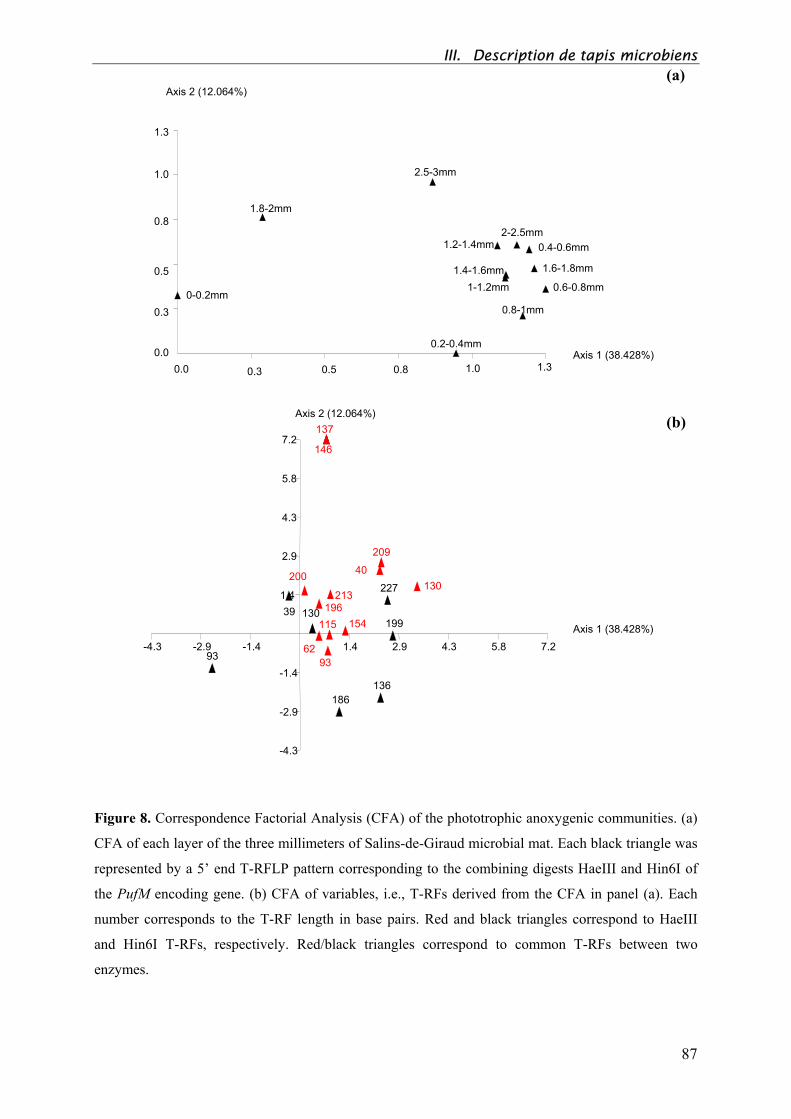
III. Description de tapis microbiens
(a) Axis 2 (12.064%)
1.31.00.80.50.3 0.0
1.3
1.0
0.8
0.5
0.3
0.0
2.5-3mm
2-2.5mm
1.8-2mm
1.6-1.8mm 1.4-1.6mm
1.2-1.4mm
1-1.2mm
0.8-1mm
0.6-0.8mm
0.4-0.6mm
0.2-0.4mm
0-0.2mm
Axis 1 (38.428%)
7.2 5.8 4.3 2.9 1.4 -4.3 -1.4
7.2
5.8
4.3
2.9
1.4
-4.3
-2.9
-1.4
209
200
196 213
154
146
137
130
93 62
40
227
199
186 136
130 115
93 -2.9
39
Axis 1 (38.428%)
Axis 2 (12.064%) (b)
Figure 8. Correspondence Factorial Analysis (CFA) of the phototrophic anoxygenic communities. (a)
CFA of each layer of the three millimeters of Salins-de-Giraud microbial mat. Each black triangle was
represented by a 5’ end T-RFLP pattern corresponding to the combining digests HaeIII and Hin6I of
the PufM encoding gene. (b) CFA of variables, i.e., T-RFs derived from the CFA in panel (a). Each
number corresponds to the T-RF length in base pairs. Red and black triangles correspond to HaeIII
and Hin6I T-RFs, respectively. Red/black triangles correspond to common T-RFs between two
enzymes.
87
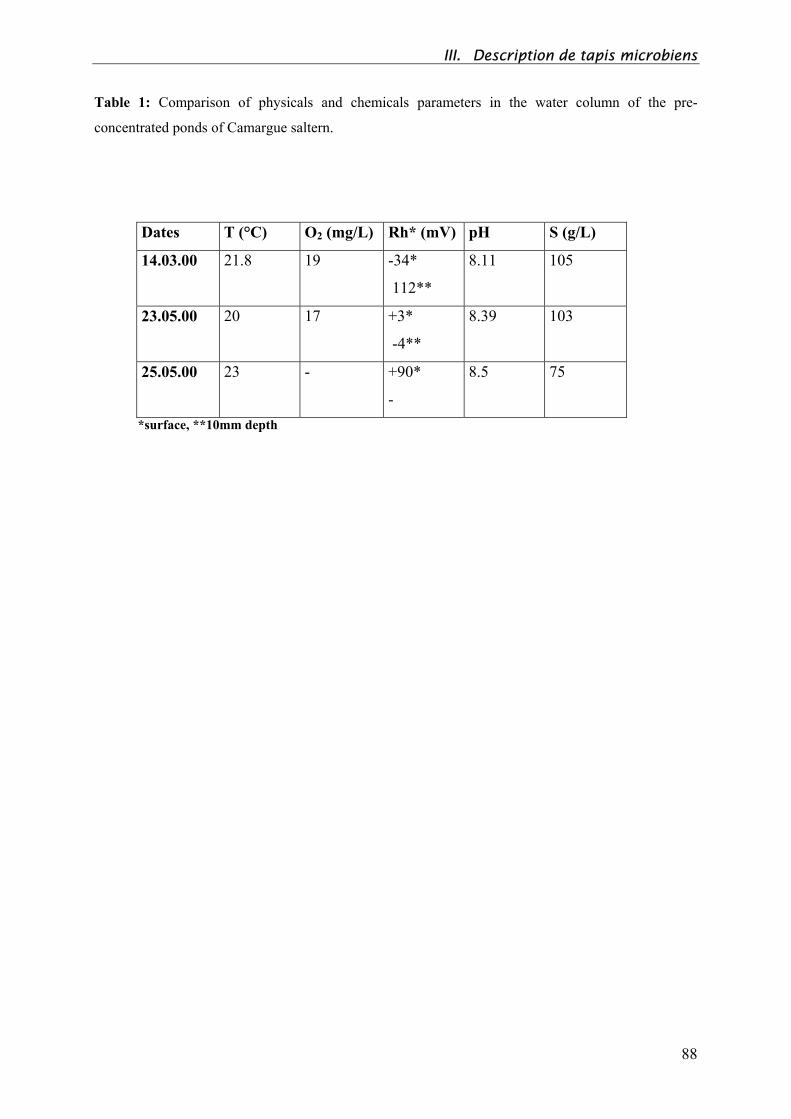
III. Description de tapis microbiens
Table 1: Comparison of physicals and chemicals parameters in the water column of the pre-
concentrated ponds of Camargue saltern.
Dates T (°C) O2 (mg/L) Rh* (mV) pH S (g/L)
14.03.00 21.8 19 -34*
112**
8.11 105
23.05.00 20 17 +3*
-4**
8.39 103
25.05.00 23 - +90*
-
8.5 75
*surface, **10mm depth
88
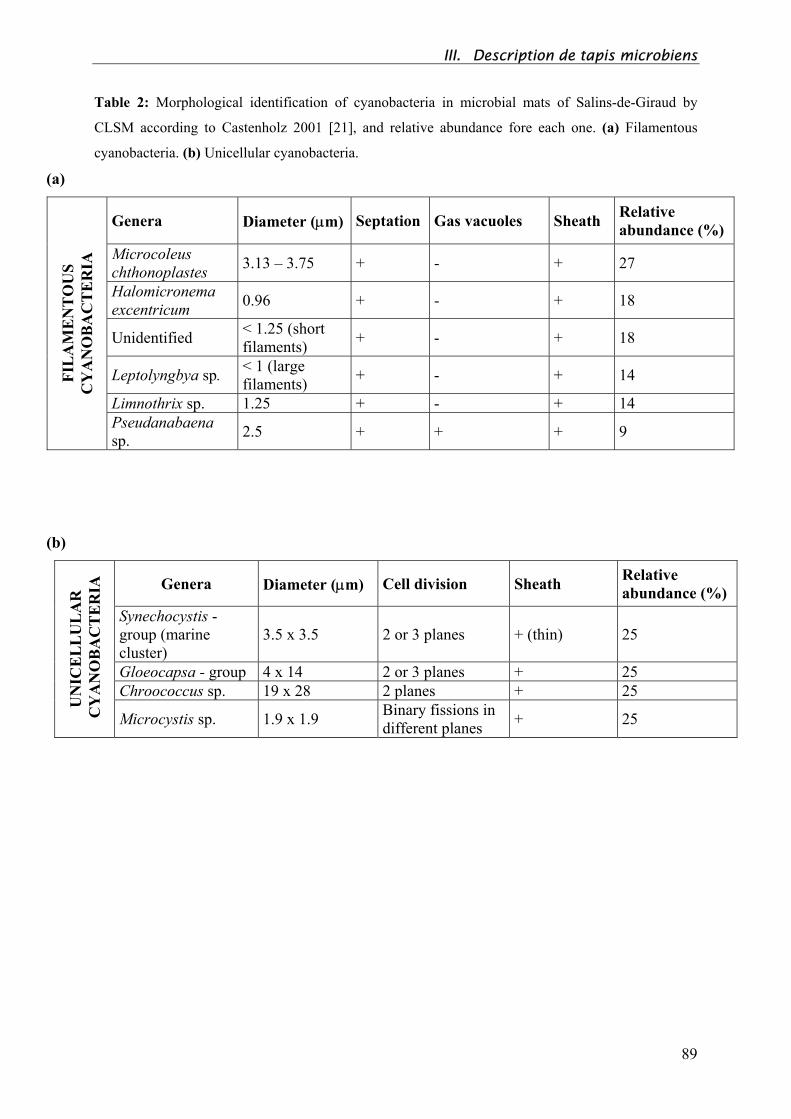
III. Description de tapis microbiens
Table 2: Morphological identification of cyanobacteria in microbial mats of Salins-de-Giraud by
CLSM according to Castenholz 2001 [21], and relative abundance fore each one. (a) Filamentous
cyanobacteria. (b) Unicellular cyanobacteria.
(a)
Genera Diameter (µm) Septation Gas vacuoles Sheath Relative
abundance (%)
Microcoleus
chthonoplastes 3.13 – 3.75 + - + 27
Halomicronema
excentricum 0.96 + - + 18
Unidentified < 1.25 (short filaments)
+ - + 18
< 1 (large filaments)
+ - + 14
Limnothrix sp. 1.25 + - + 14
FIL
AM
EN
TO
US
CY
AN
OB
AC
TE
RIA
Pseudanabaena
sp. 2.5 + + + 9
Leptolyngbya sp.
(b)
Genera Diameter (µm) Cell division Sheath Relative
abundance (%)
Synechocystis - group (marine cluster)
3.5 x 3.5 2 or 3 planes + (thin) 25
Gloeocapsa - group 4 x 14 2 or 3 planes + 25 Chroococcus sp. 19 x 28 2 planes + 25
UN
ICE
LL
UL
AR
CY
AN
OB
AC
TE
RIA
Microcystis sp. 1.9 x 1.9 Binary fissions in different planes
+ 25
89

III. Description de tapis microbiens
REFERENCES
[1] Esteve, I., Martínez, M., Mir, J. and Guerrero, R. (1992) Typology and structure of
microbial mats communities in Spain: A preliminary study. Limnetica 8, 185-195.
[2] Mir, J., Martínez-Alonso, M., Esteve, I. and Guerrero, R. (1991) Vertical stratification
and microbial assemblage of a microbial mat in the Ebro Delta (Spain). FEMS
Microbiol. Ecol. 86, 59-68.
[3] Van Gemerden, H., Tughan, C.S., De Witt, R. and Herbert, R.A. (1989) Laminated
microbial ecosystems on sheltered beaches in Scapa Flow, Orkney Islands. FEMS
Microbiol. Ecol. 62, 87-102.
[4] Wieland, A., Kuhl, M., McGowan, L., Fourçans, A., Duran, R., Caumette, P., Garcia
De Oteyza, T., Grimalt, J.O., Solé, A., Diestra, E., Esteve, I. and Herbert, R.A. (2003)
Microbial mats on the Orkney islands revisited: microenvironment and microbial
community composition. Microb. Ecol. sous presse.
[5] Giani, D., Seeler, J., Giani, L. and Krumbein, W.E. (1989) Microbial mats and
physicochemistry in a saltern in the Bretagne (France) and in a laboratory scale saltern
model. FEMS Microbiol. Ecol. 62, 151-162.
[6] Caumette, P., Matheron, R., Raymond, N. and Relexans, J.C. (1994) Microbial mats in
the hypersaline ponds of Mediterranean salterns (Salins-de-Giraud, France). FEMS
Microbiol. Ecol. 13, 273-286.
[7] Van Gemerden, H. (1993) Microbial mats : A joint venture. Mar. Geol. 113, 3-25.
[8] Revsbech, N.P., Jorgensen, B.B., Blackburn, T.H. and Cohen, Y. (1983)
Microelectrode studies of the photosynthesis and O2, H2S and pH profiles of a
microbial mat. Limnol. Oceanogr. 28, 1062-1074.
[9] Mouné, S., Caumette, P., Matheron, R. and Willison, J.C. (2003) Molecular sequence
analysis of prokaryotic diversity in the anoxic sediments underlying cyanobacterial
mats of two hypersaline ponds in Mediterranean salterns. FEMS Microbiol. Ecol. 44,
117-130.
[10] Mouné, S., Eatock, C., Matheron, R., Willison, J.C., Hirschler, A., Herbert, R. and
Caumette, P. (2000) Orenia salinaria sp. nov., a fermentative bacterium isolated from
anaerobic sediments of Mediterranean salterns. Int. J. Syst. Evol. Microbiol. 50 Pt 2,
721-729.
[11] Mouné, S., Manac'h, N., Hirschler, A., Caumette, P., Willison, J.C. and Matheron, R.
(1999) Haloanaerobacter salinarius sp. nov., a novel halophilic fermentative
bacterium that reduces glycine-betaine to trimethylamine with hydrogen or serine as
90
III. Description de tapis microbiens
electron donors; emendation of the genus Haloanaerobacter. Int. J. Syst. Bacteriol. 49
Pt 1, 103-112.
[12] Jørgensen, B.B. and Des Marais, D.J. (1988) Optical properties of benthic
photosynthetic communities: Fiber-optic studies of cyanobacterial mats. Limnol.
Oceanogr. 33, 99-113.
[13] Caumette, P., Baulaigue, R. and Matheron, R. (1988) Characterization of Chromatium
salexigens sp. nov., a halophilic Chromatiaceae isolated from Mediterranean salinas.
System. Appl. Microbiol. 10, 284-292.
[14] Caumette, P., Baulaigue, R. and Matheron, R. (1991) Thiocapsa halophila sp. nov., a
new halophilic phototrophic purple sulfur bacterium. Arch. Microbiol. 155, 170-176.
[15] Revsbech, N.P. (1989) An oxygen microelectrode with a guard cathode. Limnol.
Oceanogr. 34, 474-478.
[16] Grasshoff, K., Ehrhardt, M. and Kremling, K. (1983) Methods of seawater analysis,
Verlag Chemie, Weinheim.
[17] Revsbech, N.P. and Jørgensen, B.B. (1983) Photosynthesis of benthic microflora
measured with high spatial resolution by the oxygen microprofile method: Capabilities
and limitations of the method. Limnol. Oceanogr. 28, 749-756.
[18] Lassen, C., Ploug, H. and Jørgensen, B.B. (1992) A fibre-optic scalar irradiance
microsensor: application for spectral light measurements in sediments. FEMS
Microbiol. Ecol. 86, 247-254.
[19] Kuhl, M. and Fenchel, T. (2000) Bio-optical Characteristics and the Vertical
Distribution of Photosynthetic Pigments and Photosynthesis in an Artificial
Cyanobacterial Mat. Microb. Ecol. 40, 94-103.
[20] Castenholz, R.W. (2001) Phylum Bx. Cyanobacteria. Oxygenic Photosynthetic
Bacteria. In: Bergey's Manual of Systematic Bacteriology. The Archeae and the
Deeply Branching and Phototrophic Bacteria (2nd ed.). (Boone DR, C.R., Garrity GM,
ed.), pp. 473-599, Springer Verlag, New York.
[21] Nübel, U., Garcia-Pichel, F. and Muyzer, G. (1997) PCR primers to amplify 16S
rRNA genes from cyanobacteria. Appl. Environ. Microbiol. 63, 3327-3332.
[22] Schäfer, H. and Muyzer, G. (2001) Denaturing gradient gel electrophoresis in marine
microbial ecology. In: Methods in Microbiology (Paul, J.H., ed.), pp. 425-468,
Academic Press, London.
[23] Muyzer, G., Brinkhoff, T., Nübel, U., Santegoeds, C., Schäfer, H. and Wawer, C.
(1998) Denaturing gradient gel electrophoresis (DGGE) in microbial ecology. In:
91
III. Description de tapis microbiens
Molecular microbial ecology manual (Akkermans ADL, v.E.J., de Bruijn FJ (9eds),
ed.), pp. 1-27, Kluwer, Dordrecht.
[24] Lane, D.J. (1991) rRNA sequencing. In: Nucleic acid techniques in bacterial
systematics. (Stachenbradt E., G.M., (Eds), ed.), pp. 115-175, Wiley, Chichester.
[25] Weisburg, W.G., Barns, S.M., Pelletier, D.A. and Lane, D.J. (1991) 16S ribosomal
DNA amplification for phylogenetic study. J. Bacteriol. 173, 697-703.
[26] Amann, R., Binder, B., Olson, R., Chisholm, S., Devereux, R. and Stahl, D. (1990)
Combination of 16S rRNA-targeted oligonucleotide probes with flow cytometry for
analyzing mixed microbial populations. Appl. Environ. Microbiol. 56, 1919-1925.
[27] Achenbach, L.A., Carey, J. and Madigan, M.T. (2001) Photosynthetic and
phylogenetic primers for detection of anoxygenic phototrophs in natural environments.
Appl. Environ. Microbiol. 67, 2922-2926.
[28] Maidak, B.L., Cole, J.R., Lilburn, T.G., Parker, C.T., Jr., Saxman, P.R., Farris, R.J.,
Garrity, G.M., Olsen, G.J., Schmidt, T.M. and Tiedje, J.M. (2001) The RDP-II
(Ribosomal Database Project). Nucl. Acids. Res. 29, 173-4.
[29] Kovach, W.L. (1999) MVSP - a Multivariate Statistical Package for Windows.
Kovack Computing Services, Wales U.K.
[30] Volkman, J.R., Guillan, F.T., Johns, R.B. and Eglinton, G. (1981) Sources of neutral
lipids in a temperate intertidal sediment. Geochim. Cosmochim. Acta. 45, 1817-1828.
[31] Marlowe, I.T., Brassell, S.C., Eglinton, G. and Green, J.C. (1984) Long chain
unsaturated ketones and esters in living algae and marine sediments. Org. Geochem. 6,
135-141.
[32] Nes, W.R. and McKean, M.L. (1977) Biogeochemistry of Steroids and Other
Isoprenoids, University Park Press, Baltimore, MD.
[33] Nishimura, M. (1977) Origin of stanols in young lacustrine sediments. Nature 270,
711-712.
[34] Paoletti, C., Pushparaj, B., Florenzano, G., Capella, P. and Lercker, G. (1976)
Unsaponifiable matter of green and blue-green algal lipids as a factor of biochemical
differentiation of their biomasses: II. Terpenic alcohol and sterol fractions. Lipids 11,
266-271.
[35] Patterson, G.W. (1974) Sterols of some green algae. Comp. Biochem. Physiol. 47B,
453-457.
[36] Ballantine, J.A., Lavis, A. and Morris, R.J. (1979) Sterols of the phytoplankton -
effects of illumination and growth stage. Phytochem. 18, 1459-1466.
92
III. Description de tapis microbiens
[37] Orcutt, D.M. and Paterson, G.W. (1975) Sterol, fatty acid and elemental composition
of diatoms grown in chemically defined media. Comp. Biochem. Physiol. 50B, 579-
583.
[38] Kates, M., Tremblay, P., Anderson, R. and Volcani, B.E. (1978) Identification of the
free and conjugated sterol in a non-photosynthetic diatom, Nitzschia alba as 24-
methylene cholesterol. Lipids 13, 34-41.
[39] Kohlhase, M. and Pohl, P. (1988) Saturated and unsaturated sterols of nitrogen fixing
blue-green algae (Cyanobacteria). Phytochem. 27, 1735-1740.
[40] Gaskell, S.J. and Eglinton, G. (1975) Rapid hydrogenation of sterols in a
contemporary lacustrine sediment. Nature 254, 209-212.
[41] Edmunds, K.l.H., Brassell, S.C. and Eglinton, G. (1980) The short-term diagenetic fate
of 5a-cholestan-3b-ol: in situ radiolabelled incubation in algal mats. In: Advances in
Organic Geochemistry (Douglas, A.G. and J.R., M., eds.), pp. 427-434, Pergamon
Press, Oxford.
[42] Robinson, N., Eglinton, G., Brassell, S.C. and Cranwell, P.A. (1984) Dinoflagellate
origin for sedimentary 4a-methyl-steroids and 4a(H)-stanols. Nature 232, 327-330.
[43] Mermoud, F., Wunsche, L., Clerc, O., Gulaçar, F.O. and Buchs, A. (1984) Steroidal
ketones in the early diagenetic transformations of sterols in different types of
sediments. Org. Geochem. 6, 25-29.
[44] Han, J., McCarthy, E.D., Calvin, M. and Benn, M.H. (1968) Hydrocarbon constituents
of the blue-green algae Nostoc muscorum, Anacystis nudulans, Phormidium luridum
and Chlorogloea fritschii. J. Chem. Soc., 2785-2791.
[45] Blumer, M., Guillard, R.R.L. and Chase, T. (1971) Hydrocarbons of marine
phytoplankton. Mar. Biol. 8, 183-189.
[46] Tornabene, T.G., Langworthy, T.A., Holzer, G. and Oro, J. (1979) Squalenes,
phytanes and other isoprenoids as major neutral lipids of methanogenic and
thermoacidophilic "archaebacteria". J. Molec. Evol. 13, 73-83.
[47] Didyk, B.M., Simoneit, B.R.T., Brassell, S.C. and Eglinton, G. (1978) Organic
geochemical indicators of palaeoenvironmental conditions of sedimentation. Nature
272, 216-222.
[48] Eglinton, G. and Hamilton, R.J. (1967) Leaf epicuticular waxes. Science 156, 1322.
[49] Barbe, A., Grimalt, J.O., Pueyo, J.J. and Albaigés, J. (1990) Characterization of model
evaporitic environments through the study of lipid components. Org. Geochem. 16,
815-828.
93
III. Description de tapis microbiens
[50] Solé, A., Gaju, N. and Esteve, I. (2003) The Biomass Dynamics of Cyanobacteria in
an Annual Cycle Determined by Confocal Laser Scanning Microscopy. Scanning 25,
1-7.
[51] Solé, A., Gaju, N., Guerrero, R. and Esteve, I. (1998) Confocal laser scanning
microscopy of Ebro Delta microbial mats. Microsc. Anal. 29, 13-15.
[52] Abed, R.M., Garcia-Pichel, F. and Hernández-Mariné, M. (2002) Polyphasic
characterization of benthic, moderately halophilic, moderately thermophilic
cyanobacteria with very thin trichomes and the proposal of Halomicronema
excentricum gen. nov., sp. nov. Arch. Microbiol. 177, 361-370.
[53] Chuecas, L. and Riley, J.P. (1969) Component fatty acids of the total lipids of some
marine phytoplankton. J. Mar. Biol. Ass. U.K. 49, 97-116.
[54] Nubel, U., Garcia-Pichel, F., Clavero, E. and Muyzer, G. (2000) Matching molecular
diversity and ecophysiology of benthic cyanobacteria and diatoms in communities
along a salinity gradient. Environ. Microbiol. 2, 217-226.
[55] Benlloch, S., López-López, A., Casamayor, E.O., Ovreas, L., Goddard, V., Daae, F.L.,
Smerdon, G., Massana, R., Joint, I., Thingstad, F., Pedros-Alio, C. and Rodriguez-
Valera, F. (2002) Prokaryotic genetic diversity throughout the salinity gradient of a
coastal solar saltern. Environ. Microbiol. 4, 349-360.
[56] Casamayor, E.O., Massana, R., Benlloch, S., Ovreas, L., Diez, B., Goddard, V.J.,
Gasol, J.M., Joint, I., Rodríguez-Valera, F. and Pedrós-Alió, C. (2002) Changes in
archaeal, bacterial and eukaryal assemblages along a salinity gradient by comparison
of genetic fingerprinting methods in a multipond solar saltern. Environ. Microbiol. 4,
338-348.
[57] Karsten, U. (1996) Growth and organic osmolytes of geographically different isolates
of Microcoleus chthonoplastes (cyanobacteria) from benthic microbial mats :
Response to salinity change . J. Phycol. 32, 501-506.
[58] Guerrero, R., Urmeneta, J. and Rampone, G. (1993) Distribution of types of microbial
mats at the Ebro Delta, Spain. Biosystems 31, 135-44.
[59] Jonkers, H.M., Ludwig, R., De Wit, R., Pringault, O., Muyzer, G., Niemann, H.,
Finke, N. and De Beer, D. (2003) Structural and functional analysis of a microbial mat
ecosystem from a unique permanent hypersaline inland lake: 'La Salada de Chiprana'
(NE Spain). FEMS Microbiol. Ecol. 44, 175-189.
[60] Grimalt, J.O., de Witt, R., Teixidor, P. and Albaiges, J. (1992) Lipid biogeochemistry
of Phormidium and Microcoleus mats. Org. Geochem. 19, 509-530.
94
III. Description de tapis microbiens
[61] Navarrete, A., Urmeneta, J. and Guerrero, R. (2001) Physiological status and
community composition of microbial mats by signature lipid biomarkers. In:
MATBIOPOL. First Scientific Progress Report, pp. 111-116., Caumette, P. (coord).
[62] Cypionka, H. (2000) Oxygen respiration by Desulfovibrio species. Annu. Rev.
Microbiol. 54, 827-848.
[63] Cypionka, H., Widdel, F. and Pfennig, N. (1985) Survival of sulfate-reducing bacteria
after oxygen stress, and growth in sulfate-free oxygen-sulfide gradients. FEMS
Microbiol. Lett. 31, 39-45.
[64] Minz, D., Fishbain, S., Green, S.J., Muyzer, G., Cohen, Y., Rittmann, B.E. and Stahl,
D.A. (1999) Unexpected population distribution in a microbial mat community:
sulfate-reducing bacteria localized to the highly oxic chemocline in contrast to a
eukaryotic preference for anoxia. Appl. Environ. Microbiol. 65, 4659-4665.
[65] Minz, D., Flax, J.L., Green, S.J., Muyzer, G., Cohen, Y., Wagner, M., Rittmann, B.E.
and Stahl, D.A. (1999) Diversity of sulfate-reducing bacteria in oxic and anoxic
regions of a microbial mat characterized by comparative analysis of dissimilatory
sulfite reductase genes. Appl. Environ. Microbiol. 65, 4666-4671.
[66] Wieland, A., Zopfi, J., Benthien, M. and Kühl, M. (2003) Biogeochemistry of an iron-
rich hypersaline microbial mat (Camargue, France). Microb. Ecol. Submitted for
publication.
[67] Pierson, B.K. and Parenteau, M.N. (2000) Phototrophs in high iron microbial mats :
microstructure of mats in iron-depositing hot springs. FEMS Microbiol. Ecol. 32, 181-
196.
95
III. Description de tapis microbiens
III.3. Le tapis microbien marin des Iles Orcades (Ecosse)
Ce travail a été publié dans le journal Microbial Ecology 2003 46(4): 371-390 sous le titre:
Microbial mats on the Orkney Islands revisited: microenvironment and microbial
community composition
Par : Andrea Wieland1, Michael Kühl1, Laura McGowan2, Aude Fourçans3, Robert Duran3, Pierre Caumette3, Tirso García de Oteyza4, Joan O. Grimalt4, Antoni Solé5, Elia Diestra5, Isabel Esteve5, et Ron A. Herbert2
ABSTRACT
The microenvironment and community composition of microbial mats developing on
beaches in Scapa Flow (Orkney Islands) were investigated. Analysis of characteristic
biomarkers (major fatty acids, hydrocarbons, alcohols and alkenones) revealed the presence of
different groups of bacteria and microalgae in mats from Waulkmill and Swanbister beach,
including diatoms, Haptophyceae, cyanobacteria and sulfate-reducing bacteria. These
analyses also indicated the presence of methanogens, especially in Swanbister beach mats,
and therefore a possible role of methanogenesis for the carbon cycle of these sediments. High
amounts of algal lipids and slightly higher numbers (genera, abundances) of cyanobacteria
were found in Waulkmill Bay mats. However, overall only a few genera and low numbers of
unicellular and filamentous cyanobacteria were present in mats from Waulkmill and
Swanbister beach, as deduced from CLSM (confocal laser scanning microscopy) analysis.
Spectral scalar irradiance measurements with fiber-optic microprobes indicated a pronounced
heterogeneity concerning zonation and density of mainly anoxygenic phototrophs in
Swanbister Bay mats. By microsensor and T-RFLP (terminal restriction fragment length
polymorphism) analysis in Swanbister beach mats, the depth-distribution of different
populations of purple and sulfate-reducing bacteria could be related to the
microenvironmental conditions. Oxygen, but also sulfide and other (inorganic and organic)
sulfur compounds, seem to play an important role in the stratification and diversity of these
two major bacterial groups involved in sulfur cycling in Swanbister beach mats. 1Marine Biological Laboratory, University of Copenhagen, Strandpromenaden 5, DK-3000 Helsingør, Denmark, 2 Division of Environmental and Applied Biology, School of Life Sciences, University of Dundee, Dundee DD1 4HN, UK, 3Laboratoire d`Ecologie Moléculaire-Microbiologie, Université de Pau et des Pays de l`Adour, Avenue de l`Université, IBEAS, F-64000 Pau, France, 4Department of Environmental Chemistry (ICER-CSIC), Jordi Girona 18, E-08034 Barcelona, Spain, 5Department of Genetics and Microbiology, Autonomous University of Barcelona, E-08193 Bellaterra, Spain
96
III. Description de tapis microbiens
INTRODUCTION
Laminated microbial communities frequently develop in the upper intertidal zone of
sandy beaches and tidal flats (e.g., [79, 16, 87, 49]). After initial colonization and succession
of cyanobacteria [79], the mature states of these stratified phototrophic communities develop
into microbial mats, consisting of a thin top layer of sand and/or diatoms covering a dense
layer of filamentous cyanobacteria. Below the cyanobacteria, a distinct layer of purple sulfur
bacteria is often present with a reduced black layer of precipitated iron sulfides underneath
due to intensive sulfate reduction [84]. Sulfate-reducing bacteria are also present at high
numbers in the upper millimeters of the mats [88, 98]. Because of the macroscopically visible
lamination such coastal microbial mats were named colored sands or 'Farbstreifensandwatt'
[33]. Both cyanobacteria and anoxygenic phototrophs contribute to sediment binding and
stabilization of the sediment [28]. The dominant cyanobacterium is generally Microcoleus
chthonoplastes [79, 16, 84, 89], whereas the immotile Thiocapsa roseopersicina is often the
dominant purple sulfur bacterium [16, 87, 84].
Mass blooms of purple sulfur bacteria, mainly T. roseopersicina, have been observed
during summer in the intertidal zone of sheltered sandy beaches in Scapa Flow on the Orkney
Islands [31, 85, 86]. Three different laminated microbial mats were described [86],
distinguished by the position of the cyanobacterial layer, above or beneath the purple sulfur
bacterial layer or its complete absence and therefore exclusive development of purple sulfur
bacteria in the top layer of the sediment. Mats with a typical lamination pattern (see above)
were most common [86]. However, cyanobacteria were only present at relatively low
population densities and M. chthonoplastes was absent in all investigated mats [86].
The beaches of Scapa Flow are locally enriched in nitrogen-containing organic matter
due to decomposition of accumulated macro-algal debris [31, 86]. In Scapa Bay, additional
organic matter was supplied by discharges from local whiskey distilleries [86]. The high
organic carbon content of the sediments leads to availability of low molecular weight organic
substrates for sulfate-reducing bacteria, and the produced sulfide serves as an electron donor
for anoxygenic photosynthesis by purple sulfur bacteria [31]. Distinct micro-colonies formed
by the purple sulfur bacteria (mainly T. roseopersicina) can effectively bind sediment grains.
This aggregation leads to a reduction of erosion and, therefore, to a stabilization of the
sediment [85]. Although these aggregates may not be as effective as the cohesive structures of
cyanobacterial mats in stabilizing sandy sediments and preventing erosion, purple sulfur
bacteria and mainly T. roseopersicina were capable of rapidly recolonizing eroded sites on
beaches in Scapa Flow [85].
97

III. Description de tapis microbiens
Further characteristics of these sediment ecosystems dominated by purple sulfur
bacteria are the absence of chemolithotrophic sulfur bacteria, normally present in marine
microbial mats [88], and the almost permanent exposure of purple sulfur bacteria to O2 at the
sediment surface [85, 86].
In this study, the composition of the microbial community and the
microenvironmental conditions in microbial mats from Orkney Islands beaches was
investigated. This included determination of phototrophic populations with confocal laser
scanning microscopy (CLSM) and fiber-optic microprobe-based spectrometry in microbial
mats from Waulkmill and Swanbister beaches. Dominant groups of mat-inhabiting
microorganisms were determined by their characteristic biomarkers. Furthermore, the
stratification of major bacterial groups in relation to microenvironmental gradients was
investigated in Swanbister beach mats. For this, O2 and sulfur cycling was quantified by
controlled microsensor experiments in the laboratory and by sulfate reduction rate
measurements. The depth-zonation and diversity of the entire microbial community and of the
major bacterial groups involved in sulfur cycling in Swanbister beach mats was analyzed with
terminal restriction fragment length polymorphism (T-RFLP).
MATERIALS AND METHODS
Sampling
Sediment samples were taken in July 2000 at low tide with Plexiglas core tubes (53
mm i.d.) on beaches of Waulkmill and Swanbister Bay located in Scapa Flow, Orkney Islands
(a map with locations can be found in [86]). In situ temperature and salinity of remaining
stagnant seawater were 12-13°C and 40‰ at the time of sampling. Downwelling irradiance
around noon on clear and sunny days was >1100 µmol photons m-2 s-1. Sampled sediment
cores were transported to the laboratory of the Orkney County Council Marine Unit on
Orkney Island (Mainland), where microsensor measurements were performed under
controlled conditions.
Microsensor measurements
Clark-type O2 [72] and H2S [36, 50] microsensors connected to a picoammeter
(Unisense A/S, Denmark), and glass pH microelectrodes [74] connected to a high-impedance
mV-meter (WPI Inc., USA) were used for fine-scale measurements of O2 and sulfide
distribution in Swanbister beach mats. Oxygenic gross photosynthesis was quantified with the
light-dark shift method [73]. The O2 microsensor had a tip diameter of 10 µm, a stirring
sensitivity of ~1% and a response time, t90, of ~0.4 s. The H2S microsensor had a tip diameter
98
III. Description de tapis microbiens
of 40 µm and was coated with a black enamel paint to avoid light interference [50]. The
length and the tip diameter of the pH-sensitive glass of the pH microelectrode were 250 and
10 µm, respectively.
The O2 microsensor was linearly calibrated in the experimental set-up (see below) by a
two-point calibration using readings of microsensor current in the air saturated overlying
water (100% air saturation) and in the anoxic part of the mats (0% O2). Dissolved O2
concentrations of air saturated seawater at experimental temperatures and salinities were
calculated according to García and Gordon [27]. The pH microelectrode was calibrated in
standard buffer solutions (Radiometer, Denmark). The pH of the overlying water in the
experimental set-up was determined with a commercial pH meter calibrated in standard buffer
solutions (Radiometer, Denmark). The readings of the pH microelectrode in the overlying
water were adjusted to the measured pH of the seawater. The H2S microsensor was calibrated
in anoxic buffer solutions (0.2 M phosphate buffer, pH 7.5) of increasing sulfide
concentrations. A sample of each sulfide buffer solution was fixed in zinc acetate (5% w/v)
for subsequent spectrophotometric analysis of sulfide concentration after Fonselius [23] with
modifications, i.e. acidification of the samples to pH <1 with 6M HCl and determination of
the absorption of the formed complex at the second peak (750 nm) in the spectrum
(C. Steuckart, unpublished). Calculation of H2S and total sulfide (Stot) concentration profiles
from H2S and pH microsensor data was as described in Wieland and Kühl [97], using pK1
values calculated from experimental temperatures according to Hershey et al. [32].
Experimental microsensor set-up
Sediment cores were mounted in a flow chamber modified for insertion of whole
sediment cores [21]. A constant flow over the mat surface of aerated seawater from the
sampling site was generated with a submersible water pump (Aqua Clear, Germany)
connected to the flow chamber. Measurements were performed at room temperature
(21°C ± 1°C). The mat was illuminated with a fiber-optic halogen light source (KL 2500,
Schott, Germany) and the downwelling irradiance at the mat surface was quantified with an
underwater quantum irradiance meter (QSL-101, Biospherical Instruments, USA). The
microsensors were fixed together with the measuring tips in the same horizontal plane within
an area of ca. 0.5-1 cm2 of the mat surface in a motor-driven micromanipulator (Märzhäuser,
Germany; Oriel, USA) mounted on a heavy solid stand. Microsensor signals were recorded
with strip chart recorders (Servogor, U.K.; Kipp&Zonen, Netherlands) and with a computer
data acquisition system (LabView, National Instruments, USA) that also controlled the
99
III. Description de tapis microbiens
micromanipulator. Gross photosynthesis measurements in steps of 100 or 200 µm vertical
depth intervals were performed as described in Wieland and Kühl [97].
Spectral scalar irradiance measurements with fiber-optic microprobes
A fiber-optic scalar irradiance microprobe [52] was connected to a sensitive fiber-
optic diode array spectrometer with a spectral range of 250-950 nm (PMA-11, Hamamatsu
Photonics, Japan). Profiles of spectral scalar irradiance in the mats were measured by stepwise
inserting the microprobe with a motor-driven micromanipulator (Märzhäuser, Germany;
MICOS GmbH, Germany; Jenny Electronics AG, Switzerland) at a zenith angle of 135°
relative to the incident light beam. The mats were illuminated vertically with a fiber-optic
halogen light source (KL 2500, Schott, Germany). Measurements were performed at vertical
depth intervals of 200 µm. The downwelling spectral scalar irradiance at the mat surface was
measured by positioning the scalar irradiance microprobe over a black light trap at the same
position relative to the light field as the mat surface. Scalar irradiance spectra at various
depths in the mats were normalized to the downwelling scalar irradiance at the mat surface.
Attenuation spectra of scalar irradiance were calculated over discrete depth intervals from the
depth profiles of spectral scalar irradiance by
K0 = ln(E1/E2)/(z2-z1) (1)
where K0 is the vertical spectral attenuation coefficient for scalar irradiance, E1 and E2 are the
spectral scalar irradiance measured at depths z1 and z2 in the mat, where z2 > z1 [48].
Calculations
Diffusive O2 fluxes across the mat-water interface were calculated from O2 profiles
using Fick's first law of diffusion as described in Wieland and Kühl [96]. Areal rates of O2
consumption in the aphotic zone, Raphot, were calculated as the downward O2 flux, Js, at the
lower boundary of the photic zone:
Js = -φ Ds dC/dz (2)
where dC/dz is the linear concentration gradient, φ is the sediment porosity and Ds is the
sediment diffusion coefficient, which was calculated from the porosity and D0 according to
Ullman and Aller [83]. The D0 of O2 was taken from Broecker and Peng [8] and corrected for
experimental temperatures and salinities [53]. Fluxes of H2S were calculated according to Eq.
2 from the linear part of the profiles. The diffusion coefficient of H2S was estimated as
D0 (H2S) = 0.7573 D0 (O2) (Tables for seawater and gases, Unisense A/S, Denmark).
100
III. Description de tapis microbiens
Determination of sediment porosity
Sediment porosity (ml water cm-3) was determined (n = 5) on samples collected from
Swanbister Bay in July 2001 using a 2.5 cm diameter stainless steel corer. The cores were
sectioned using a sediment slicer to give the following four consecutive depth horizons:
0-5 mm, 5-10 mm, 10-20 mm and 20-30 mm. Porosity was measured as weight loss after
drying at 110°C for 24 hours.
Determination of sulfate reduction rates
Triplicate sediment cores (13 mm i.d.) were collected from Swanbister Bay in
truncated 5 ml disposable syringes and sealed with Suba seals (W. Freeman Ltd., U.K.).
Carrier-free 35SO42- (10 µl; Amersham Pharmacia Biotech, U.K.) was injected through the
Suba seal using a microliter syringe into each sediment core, giving an average activity of
50 kBq per cm3. To ensure even distribution of the isotope throughout the cores the isotope
was added progressively as the syringe needle was withdrawn. At the end of the 12 h
incubation period at ambient temperature (16°C) in the dark, the cores were sectioned to give
the following depth horizons: 0-10 mm, 10-20 mm and 20-30 mm. Each sediment section was
transferred to plastic bottles containing 5 ml of a 20% w/v zinc acetate solution to stop
biological activity and preserve sulfide. The samples were then frozen and stored until
required for analysis. Production of H235S was determined using the one-step distillation
method of Fossing and Jørgensen [24]. Sulfate reduction rates were calculated according to
the method of Isaksen and Finster [35]. Pore-water sulfate was determined according to the
method of Tabatabai [80].
Confocal laser scanning microscopy
Sediment cores (18 mm i.d.) were taken from Waulkmill and Swanbister Bay using
truncated 20 ml disposable syringes. The samples were transferred into small plastic
containers containing 2.5% glutaraldehyde in a phosphate buffer (0.2 M) adjusted to the
appropriate salinity with NaCl. The samples were fixed for 3 hours and then washed 2-3 times
with phosphate buffer. The samples were stored at 4°C until further analysis.
The samples were investigated with a compound microscope (Olympus BH2, Japan)
and a laser confocal microscope (Leica TCS 4d, Germany) equipped with an argon-krypton
laser. For confocal analysis, subsamples (slices) of defined dimension were placed in cavity
slides, covered and sealed with cover slips and observed under an excitation beam of 568 nm.
Pigment fluorescence emission was detected with a 590 nm long pass filter. Optical sections
101
III. Description de tapis microbiens
(every focal plane), optical series (all focal planes from each imaged area), summa images (all
optical series projected to one image), and stereoscopic images (one image in three
dimensions from every optical series) were obtained from these analyses. A volume data set
was generated by combining all optical sections.
After screening of the different cyanobacteria present in all images from each
sampling site, each type of cyanobacterium was identified after morphological criteria
according to Castenholz [10].
Analysis of fatty acids, hydrocarbons, alcohols and alkenones
Sediment cores (26 mm i.d.) were collected on Waulkmill and Swanbister beach and
stored frozen until further analysis. The upper 4 cm of the mat samples (approximately 10 g)
were homogenized with a mortar and extracted three times with methanol, dichloromethane
and n-hexane. Extracts were saponified with 30 ml of KOH (6% w/v) in methanol and the
neutral components were recovered by extraction with 3 × 30 ml of n-hexane. The alkaline
mixture was then acidified to pH 2 with 5 ml of HCl and the acidic compounds were
recovered by extraction with 3 × 30 ml of n-hexane. The neutral compounds were fractionated
in a column filled with silica (8 g, bottom) and alumina (8 g, top). These packings were
prepared previously by heating at 120°C and 350°C for 12 h, respectively. Milli-Q-water was
added to both adsorbents for deactivation (5%). Six fractions were obtained by successive
elution with 20 ml of n-hexane, 20 ml of n-hexane/dichloromethane (9:1), 40 ml of
n-hexane/dichloromethane (8:2), 40 ml of n-hexane/dichloromethane 75% (1:3), 20 ml of
dichloromethane/methanol (95:5) and 40 ml of dichloromethane/methanol (9:1). The two
most polar fractions were silylated after redissolution in 100 µl of dichloromethane and
addition of 100 µl bis-(trimethylsilyl)trifluoroacetamide (heating 1h at 60°C). The fatty acid
fractions were methylated before instrumental analysis using diazomethane, which was
synthesized as described elsewhere [91]. These fractions were dissolved in 100 µl of n-hexane
and diazomethane was added until the yellowish color remained.
Samples were analyzed by gas chromatography and flame ionization detection in a
Varian Star 3400 (Varian Inc., USA). A 30 m capillary column (0.25 mm i.d.) coated with
DB-5 (25 µm film thickness) was used with hydrogen as carrier gas. The oven was kept at
70°C for 1 min, heated to 140°C at 10°C/min, then to 310°C at 4°C/min and finally held at
310°C for 30 min. The temperature of the detector was 330°C. Analyses by gas
chromatography and mass spectrometric detection were performed with a Fisons MD-800
quadrupole mass analyzer (Thermo Instruments, U.K.). Samples were injected in splitless
102
III. Description de tapis microbiens
mode at 300°C into a 30 m capillary column (0.25 mm i.d.) coated with DB-5 (25 µm film
thickness). Helium was used as carrier gas and the temperature program was as described
above. Mass spectra were recorded in electron impact mode at 70 eV by scanning between
m/z 50-650 every second. Ion source and transfer line were kept at 300°C.
T-RFLP analysis
Sediment cores (35 mm i.d.) were taken with falcon tubes from Swanbister Bay. The
upper 10 mm of the sediment core was sliced off aseptically, transferred to sterile Petri-
dishes, frozen in liquid nitrogen, transported on dry ice and finally stored at –80°C until
further analysis.
The upper 2 mm of the mat cores were sliced with a cryomicrotome (MICROM
GmbH, Germany) at around 200 µm, and the third mm at around 500 µm vertical depth
resolution. From these mat slices, DNA was extracted with the UltraClean Soil DNA Isolation
Kit using the alternative lysis method (MoBio Laboratories Inc., USA). All extracted genomic
DNA samples were stored at -20°C until further processing.
The different primers used for T-RFLP analysis to assess the bacterial community
structure are listed in Table 1. For T-RFLP analysis, forward (f) and reverse (r) primers were
fluorescently labeled with TET and HEX (E.S.G.S. Cybergene group, France), respectively.
The PCR amplification mixture contained 12.5 µl hot start Taq polymerase mix (Qiagen,
Netherlands), 0.5 µl of each primer (20 µM) and 1 µl of DNA template. A final volume of
50 µl was adjusted with distilled water. Reactions were cycled in a PTC200 thermocycler
(MJ Research, USA) at 94°C for 15 min, followed by 35 cycles of 94°C for 1 min, Tm for
1.5 min, with Tm denoting the corresponding melting temperature for hybridization between
primers and template DNA, and 72°C for 1 min, with a final extension step at 72°C for
10 min. The amount of PCR product was determined by comparison to known concentrations
of standards (Smartlader, Eurogentec, Belgium). PCR products were purified with the GFX
PCR DNA purification kit (Amersham, U.K.).
Purified PCR products (600 to 700 ng) were digested with 12 units of enzyme HaeIII
or Hin6I (New England Biolabs, USA). The precise length of T-RFs from the digested PCR
products was determined by capillary electrophoresis (ABI prism 310, Applied Biosystems,
USA). About 50 ng of the digested DNA from each sample was mixed with 10 µl of
deionized formamide and 0.25 µl of TAMRA size standard and then denatured at 94°C for
2 min and immediately chilled on ice prior to electrophoresis. After an injection step of 10 s,
103
III. Description de tapis microbiens
electrophoresis was carried out for up to 30 min applying a voltage of 15 KV. T-RFLP
profiles were performed using GeneScan software (ABI).
Dominant T-RFs were selected by comparison of numerical values and
electropherograms. The clustering values were analyzed with the T-RFLP similarity matrix on
the RDP (Ribosomal Database Project) web site (http://rdp.cme.msu.edu/) [56]. The obtained
distance matrix was used to construct a dendrogram with MEGA version 2.1 [51] using the
UPGMA method (Unweighted Pair Group Method with Arithmetic Mean).
T-RFLP profiles were also compared by Canonical Correspondence Analysis (CCA)
according to Fromin et al. [25]. This test is based on the linear correlation between
community data (abundance of each T-RF) and environmental parameters in the mat at light
conditions (scalar irradiance at wavelengths of Chl a-(676 nm) and BChl a-(845 nm)
absorption, depth, and O2 concentration). The CCA were realized with MVSP v3.13d
software (Rockware Inc., U.K.).
RESULTS
Biomarkers in Waulkmill and Swanbister Bay mats
The major lipid compounds in both Waulkmill and Swanbister beach mats were fatty
acids, encompassing essentially C14-C22 homologues dominated by n-hexadec-9(Z)-enoic and
n-hexadecanoic acids (Fig. 1A, B). Other major compounds were n-octadec-9(Z)-enoic,
n-eicosapentenoic, n-tetradecanoic and n-pentadecanoic acids, which are generally
representative of algal and microbial contributions. N-octadec-9(Z)-enoic acid is abundant in
photosynthetic algae and cyanobacteria [11]. N-eicosapentenoic acid and other
polyunsaturated n-eicosane and n-docosane acids are specific of inputs from diatom species
[93]. Iso- and anteiso-pentadecanoic acids were the two main branched fatty acids present in
significant proportions. These compounds are abundant in sulfate-reducing bacteria and
sulfur-oxidizing bacteria such as Thiomicrospira [29].
The aliphatic hydrocarbon phyt-1-ene together with other phytene homologues
occurred in both mats, but their presence was more pronounced in the Swanbister mat
(Fig. 1C, D). These hydrocarbons are characteristic for methanogens [82] and may also be
produced during the decomposition of phytol [18]. The presence of an isoprenoid compound
specific of methanogenic origin, 2,6,10,15,19-pentamethylicosane [34, 75], in the Swanbister
mat (Fig. 1C) suggests that at least in this mat the occurrence of the phytanes is due to inputs
from these microorganisms. N-heptadecane and n-heptadecenes were major compounds in
both mats and especially abundant in the Waulkmill mat (Fig. 1D). These compounds are
104

III. Description de tapis microbiens
generally found in cyanobacteria [30, 67] or in phototrophic eukaryotes [7]. Other
hydrocarbons specific for algal inputs such as C25 highly branched isoprenoid alkenes
synthesized by diatoms [62] were also present in the Waulkmill mat. In addition to these
hydrocarbons, a distribution of C23-C35 n-alkanes predominated by the odd carbon numbered
homologues, namely C29, C31 and C33, representative for inputs from higher plants [20], were
found in both mats. This distribution can also be found in other sediments in coastal
environments [5], probably reflecting the influence of wind transported materials from nearby
higher plants.
A significant amount of phytol was found in the Waulkmill mat, representing
contributions from algae (Fig. 2). Other lipids of algal origin, like C37-C38 di-, tri- and tetra-
unsaturated alkenones specific for Haptophyceae [92, 57] and sterols were also present. The
sterol distribution in the Waulkmill mat was dominated by cholest-5-en-3く-ol and contains
minor proportions of 24-ethyl cholest-5-en-3く-ol, cholesta-5,24-dien-3く-ol, 24-methyl
cholesta-5,24(28)-dien-3く-ol and their homologues saturated at ∆5 (Fig. 2, upper graph).
Sterols unsaturated at positions ∆5, ∆22 and ∆5,22 can originate from cyanobacteria [67, 61,
63], green algae [68, 4] or diatoms [64, 41, 4]. 24-Methyl cholesta-5,24(28)-dien-3く-ol is a
common diatom marker [64, 41, 4] and its occurrence is consistent with the presence of
highly branched isoprenoid hydrocarbons.
Spectral scalar irradiance and cyanobacteria in Waulkmill Bay mats
From spectral scalar irradiance profiles the zonation of phototrophs in the mats could
be inferred due to the absorption characteristics of their pigments at specific wavelengths. In
the Waulkmill mat, three main wavelength regions of pronounced absorption could be
identified (Fig. 3). The pronounced minimum of scalar irradiance in the narrow region around
675 nm corresponds to Chl a-absorption, indicating the presence of cyanobacteria and/or
microalgae. A shoulder in the spectra measured over the upper 2 mm indicated some
absorption at ~625 nm due to the presence of phycocyanin. The presence of purple bacteria
throughout the upper millimeters of the mat was indicated by the pronounced minima in the
region from 760 to 900 nm and at around 590 nm corresponding to BChl a-absorption. The
scalar irradiance in these wavelength regions was already at 1 mm depth less than 50% of the
downwelling scalar irradiance at the mat surface and at 2.6 mm depth less than 1-2%. The
strong absorption by Chl a and BChl a indicates the presence of dense populations of
oxygenic and anoxygenic phototrophs in the upper 2.6 mm of the mat.
105
III. Description de tapis microbiens
Several different genera of filamentous and unicellular cyanobacteria were identified
(Table 2), with cyanobacteria of the genera Lyngbya and Oscillatoria, and of the
Pleurocapsa- and Gloeocapsa-group being the most abundant in the Waulkmill Bay mat as
observed with CLSM and light microscopy. Some cyanobacteria occurred only at certain
depths of the mat, whereas others were found in several or all mat slices investigated.
Spectral scalar irradiance and cyanobacteria in Swanbister Bay mats
In a Swanbister Bay mat, spectral scalar irradiance minima at characteristic Chl a- and
BChl a-absorption wavelengths were found (Fig. 4). Pronounced light scattering was detected
at the mat surface and in the uppermost mat layers. Wavelengths corresponding to
Chl a-absorption were more strongly attenuated in the Swanbister mat than wavelengths
corresponding to BChl a-absorption (Fig. 4), whereas in the Waulkmill mat both wavelength
regions were almost equally attenuated throughout the mat (Fig. 3).
Spectral scalar irradiance profiles in another mat sample from Swanbister Bay, which
was densely covered by purple bacteria and characterized by a pink-colored surface, showed a
much more pronounced BChl a-absorption (Fig. 5, upper graph). The spectral irradiance in
the wavelength regions of Chl a- and BChl a-absorption was already at a depth of
0.8 mm <10% of the downwelling spectral scalar irradiance. From these profiles, the average
attenuation spectrum of scalar irradiance over the depth interval of 0-0.8 mm was calculated
(Fig. 5, lower graph). The vertical spectral attenuation coefficient (K0) was highest in the
wavelength region between 400 and 550 nm, the region of carotenoid and Chl a-absorption.
The attenuation coefficient of BChl a-absorption wavelengths was higher than the attenuation
coefficient of Chl a-absorption, indicating higher densities of purple bacteria in this mat.
Thus, mats from Swanbister Bay were very heterogeneous and patchy concerning zonation
and population densities of oxygenic and especially anoxygenic phototrophs.
In Swanbister Bay mats covered by purple bacteria (pink surface), only a few genera
of cyanobacteria, i.e. mainly unicellular morphotypes of the Pleurocapsa-group and one
filamentous type, were found in low numbers (Table 3).
Microbial community structure of Swanbister Bay mats
To assess the microbial community structure of a Swanbister Bay mat the universal
primer pair 8f-926r targeting a partial sequence of the 16S rDNA gene of eubacteria was
applied. After digestion with two different restriction enzymes (HaeIII, Hin6I), the diversity
of the amplified 16S fragments was analyzed by T-RFLP. The structure of the T-RFLP
106
III. Description de tapis microbiens
profiles, as characterized by the number and distribution of major bands (peaks of highest
relative fluorescence intensity), varied from top to bottom of the mat (data not shown).
Depending on the restriction enzyme used, different dominant T-RFs were observed. Degrees
of similarity among the microbial communities of the different mat layers were quantified
with the T-RFLP profile matrix program (RDP). The resulting similarity dendrogram (not
shown) did not reveal any specific distribution of microbial communities in the analyzed mat
layers, most probably due to the fact that several bacterial species may have terminal
fragments of identical size.
More specific primers were used to analyze the sulfate-reducing and anoxygenic
phototrophic microbial community. The biodiversity of the sulfate-reducing bacteria (SRB)
was analyzed using the primers 8f-SRB385 and the combination of both restriction enzymes
(HaeIII, Hin6I). The resulting T-RFLP profiles contained almost 60 different peaks. In almost
all mat layers fragments of 64, 189, 190, 191, 193, 200, 204 bp were found after digestion
with HaeIII, as well as dominant fragments of 64, 87, 89, 92, 337, 348, 350, 352, 371 bp
using Hin6I (data not shown). Some T-RFs, however, showed a depth-dependent distribution,
as T-RFs obtained with HaeIII of 178, 181, 182, 209, 267, 314 and 317 bp were
predominating only in the upper mat layers, whereas T-RFs of 268, 312, 315 bp were
dominant in layers below 1 mm depth (data not shown). A similarity dendrogram was
obtained by comparing all T-RFs observed with the two different restriction enzymes in each
mat layer (Fig. 6A), which indicated a stratification of the SRB communities. The SRB
communities in the upper mat layer (0-1 mm) seemed to be related and formed a distinct
cluster, clearly differing from the ones at increasing depths. Two other closely related groups
were located between 1-1.6 mm and 2-3 mm depth, suggesting two different communities of
SRB in these depth horizons. Furthermore, populations of SRB in the layer at 1.6-2 mm depth
seem to form a really divergent cluster.
The T-RFLP patterns were analyzed by Canonical Correspondence Analysis to reveal
the variables, which influenced the organization of each SRB population. Using the averaged
microsensor O2 profile at 1312 µmol photons m-2 s-1 and scalar irradiance profiles at
Chl a-(676 nm) and BChl a-(845 nm) absorption wavelengths in the top 3 mm of the mat
(Figs. 4, 7C), this analysis showed that their dispersion was influenced mostly by irradiance
and O2 concentration (Fig. 6C). Two distinct groups appeared, one in the anaerobic zone and
one in the aerobic zone exposed to light. This analysis showed a distribution of different SRB
species with depth and thus that SRB were displayed according to depth.
107
III. Description de tapis microbiens
The biodiversity of purple anoxygenic phototrophic bacteria (PAB) was assessed by
using primers designed to target the pufM gene, which is encoding for a subunit of the
photosynthetic reaction center in purple sulfur and purple non-sulfur bacteria. T-RFLP
analysis of the amplified pufM fragments resulted in complex profiles containing about
30 peaks. Major T-RFs were observed, which allowed a comparison and distinction between
the different mat layers. In the upper mat layers fragment peaks of 129, 187, 201, and 203 bp
were found (HaeIII), whereas the bottom layers were characterized by fragment peaks of
215 and 225 bp (data not shown).
Similarity dendrograms showed delineation of the profiles into clusters, indicating a
stratification of purple phototrophic bacteria within the mat (Fig. 6B). Purple phototrophic
communities from 1.4-2 mm, and from 1-1.4/2-3 mm depth were closely related. These two
community clusters were less closely related to the community in the upper mat layers than to
the community below 3 mm depth. Furthermore, the similarity dendrogram also suggests that
there were significant differences between the anoxygenic phototrophic communities in the
uppermost mm of the mat.
Canonical correspondence analysis obtained from T-RFLP profiles showed that the
phototrophic communities of the upper layers were clearly influenced by irradiance. In
contrast, communities of the deep layers were negatively influenced by O2 penetration
(Fig. 6D). Surprisingly, predicted patterns of T-RFs from pufM sequences digested with
HaeIII or Hin6I obtained from the NCBI bank (data not shown) showed that the T-RFs
specific of the upper layers could correspond to aerobic heterotrophic alpha-proteobacteria,
like e.g. the genus Sphingomonas. Indeed, it has been recently demonstrated that this genus
possesses the pufM gene [6]. T-RFs from deep layers of the mat could correspond to predicted
T-RF patterns of purple sulfur bacteria from the genus Thiocystis and of purple non-sulfur
bacteria from the genus Rhodomicrobium. The general T-RF fingerprints observed within the
mat could be equivalent to predicted T-RF patterns of gamma-proteobacteria such as
members of the genera Rhodobacter or Allochromatium.
Microenvironment of Swanbister Bay mats
Profiles of O2, gross photosynthesis, pH and H2S were measured at different positions
in a Swanbister Bay mat incubated in darkness and at an irradiance of
1312 µmol photons m-2 s-1 (Fig. 7). During dark incubation, the average O2 penetration was
0.8 mm and steep gradients of both H2S and Stot developed below this depth (Fig. 7A). A
gradual decrease of pH was found in the dark incubated mat, accounting for a decrease of
108
III. Description de tapis microbiens
approximately 1 pH unit between the water and the mat at around 4 mm depth (Fig. 7B).
Sulfate reduction rates were lowest in the upper centimeter of dark incubated Swanbister Bay
mats and highest in the 1-2 cm depth interval (Table 4).
At an irradiance of 1312 µmol photons m-2 s-1, gross oxygenic photosynthesis
occurred in the upper 2.8 mm of the mat, leading to an increased O2 penetration of 4 mm and
a peak of O2 concentration at 1.6 mm depth (Fig. 7C). As calculated from the profiles of
spectral scalar irradiance measured in the same mat sample (Fig. 4), this O2 maximum
occurred in the depth layer of highest Chl a-absorption, as indicated by the depth profile of
the vertical attenuation coefficient, K0, at 676 nm. Below that zone, both O2 concentration and
K0 (676 nm) decreased, whereas the attenuation coefficient at 845 nm, indicative for BChl a-
absorption, increased. This indicates an increasing population density of BChl a-containing
anoxygenic phototrophic bacteria in the anoxic mat layer. The presence of a population of
anoxygenic phototrophs in the zone of highest O2 concentration and Chl a-absorption was
indicated by a peak of K0 (845 nm) in that zone, which was, however, less pronounced than
the peak of K0 (676 nm).
In the upper 5 mm of the light incubated mat, H2S was undetectable, only in one
position very low concentrations of H2S and sulfide were detected below 3 mm depth (data
not shown). Photosynthetic CO2 fixation led to an increase of pH in the upper 2 mm of the
mat by more than 0.5 pH unit, with the peak of pH located approximately in the layer of
maximal O2 concentration and K0 (676 nm). At increasing depths the pH decreased to pH 7.5
(Fig. 7D).
Oxygen and sulfide cycling as a function of irradiance in Swanbister Bay mats
In the same sediment core, O2, gross photosynthesis, H2S and pH profiles were
measured at a fixed position at increasing downwelling irradiances (Fig. 8). Oxygen
penetration increased in the mat with increasing irradiance from 0.8 mm during darkness to
1.4, 1.6, 2.2 and 2.6 mm at 43, 96, 183, and 349 µmol.photons.m-2.s-1, respectively. At an
irradiance of 96 µmol.photons.m-2.s-1, a net production of O2 was detected. The thickness of
the photic zone increased gradually from 0.5 mm at 43 µmol.photons.m-2.s-1 to 1.8 mm at
349 µmol photons m-2 s-1 (Fig. 8, upper panel). The increase of gross oxygenic photosynthesis
and of the photic zone thickness with irradiance led to a gradual increase of pH in the upper
mat layers (Fig. 8, lower panel). The pronounced pH maximum in the upper mat layer at
irradiances >43 µmol photons m-2 s-1 affected the corresponding Stot profiles (Fig. 8, upper
panel). Profiles of Stot were calculated from measured H2S and pH profiles. The Stot profiles at
109
III. Description de tapis microbiens
these irradiances showed a pronounced shoulder of Stot concentration, which was not present
in the corresponding H2S profiles and was probably caused by the curvature of the pH
profiles. Since H2S and pH profiles could not be measured at exactly the same position, the
unusual shape of the Stot profiles was most probably caused by a pronounced
microheterogeneity of the mat. These shoulders in the Stot profiles thus represent
overestimations of sulfide concentration and will not be discussed further. Compared to the
H2S profile in the dark incubated mat, the upper H2S boundary moved downwards in the mat
at irradiances >96 µmol.photons.m-2.s-1 (Fig. 8, upper panel).
A real rates of net oxygenic photosynthesis (Pn), calculated as the O2 flux across the
mat-water interface, rates of O2 consumption in the aphotic zone (Raphot) and of H2S
oxidation/production (H2S fluxes) increased with irradiance and saturated at higher
irradiances (Fig. 9). The determined H2S fluxes, however, strongly underestimate sulfide
fluxes, since pH tends to increase also in deeper layers at higher irradiance, which results in
calculation of higher sulfide concentrations from H2S data. Increasing H2S fluxes will
therefore translate to much stronger increases of sulfide fluxes.
DISCUSSION
Microbial community composition of Waulkmill and Swanbister Bay mats
In mats from both Waulkmill and Swanbister Bay, the presence of oxygenic
phototrophs was evident (Figs. 1-4, Table 2, 3). Biomarker and CLSM analysis revealed a
more pronounced abundance of cyanobacteria and high amounts of algal lipids (phytol,
sterols, alkenones, highly branched isoprenoid hydrocarbons, heptadecane and heptadecenes)
in Waulkmill Bay mats. This indicates high contributions of oxygenic phototrophs in
Waulkmill Bay mats, with specific contributions from diatoms and Haptophyceae. The latter
were most probably of planktonic origin, buried in the sediment after settling on the sediment
surface.
The bio-optical properties of two different Swanbister Bay mat samples revealed a
strong heterogeneity concerning the phototrophic community (Figs. 4, 5), indicating a
pronounced patchiness of the distribution of purple bacteria on Swanbister beach. A factor
influencing the distribution and population densities of purple sulfur bacteria can be the
availability of sulfide. The amount of sulfide present in the mat will limit the presence of
oxygenic phototrophs to species able to cope with temporary exposure to sulfide.
Environmental conditions on beaches in Scapa Flow are restrictive for the development of
cyanobacteria, as indicated by the low abundances and few genera found (Table 2, 3). The
110
III. Description de tapis microbiens
production of sulfide by sulfate-reducing bacteria is, among other environmental parameters,
controlled by the amount and quality of organic matter in the sediment (e.g., [78]). The main
sources of organic matter are decomposing macro-algae buried in the sediment [31], resulting
in a heterogeneous distribution of low molecular weight organic substrates for sulfate-
reducing bacterial activity.
A pronounced microheterogeneity of sulfate reduction and sulfide distribution was
found in Swanbister beach mats, as indicated by the standard deviations of measured sulfate
reduction rates and sulfide microprofiles (Table 4, Fig. 7A). Thus, a heterogeneous
distribution of sulfide could affect the distribution of the different phototrophs. A patchy
distribution of sites virtually covered by purple bacteria (pink surface) was observed on
Swanbister beach during sampling in July 2000, as well as a patchy distribution of macro-
algae growing on the beach or deposited on the sediment surface. Additional to organic matter
supply after decomposition, organic sulfur compounds like dimethylsulfide (DMS) and
dimethylsulfoniopropionate (DMSP) might be released from degrading macro-algae. Both
compounds are potential substrates for purple bacteria [39], including Thiocapsa
roseopersicina [90, 37, 38]. By providing such organic sulfur substrates, degrading macro-
algae could also directly enhance growth of purple sulfur bacteria in their nearby
surroundings, further contributing to their patchy distribution on these beaches.
Biomarker analysis showed that lipids reflecting the presence of methanogens
(phytenes and 2,6,10,15,19-pentamethylicosane), as well as fatty acids characteristic of
sulfate-reducing bacteria (iso- and anteiso-pentadecanoic acids) were abundant especially in
Swanbister Bay mats (Fig. 1). With our data we can, however, only speculate on the
biogeochemical importance of methanogens in the mat. As has been shown in salt marsh
sediments (e.g., [66, 76]), methane production in marine sediments is most probably due to
utilization of noncompetitive substrates like methylamines and DMS [43, 65]. Glycine
betaine, one of the most widespread compatible solutes [94], and the osmoregulatory
compound of marine algae, DMSP [42], present at high concentrations in microbial mats
[39, 89], are precursors of trimethylamine and DMS [65]. Thus, these compounds could
potentially play a role as substrates for methanogenesis in these mats.
Oxygen and sulfur cycling in Swanbister Bay mats
Microsensor data showed a gradual increase of both O2 concentration and penetration
with irradiance due to increasing oxygenic photosynthesis by cyanobacteria and microalgae in
Swanbister Bay mats (Fig. 8, 9). Furthermore, H2S fluxes tended to increase with irradiance
111
III. Description de tapis microbiens
(Fig. 9), indicating higher sulfide turnover rates in light conditions. These include both higher
production rates by sulfate reduction and higher sulfide consumption rates. Although
(aerobic) chemolithotrophic sulfide oxidation by T. roseopersicina may occur in light
conditions [70, 71], phototrophic oxidation (in the presence of O2) seem to be preferred due to
higher energetic yields by phototrophy than by chemotrophy [17, 84, 85]. The light-
dependency of the H2S fluxes (Fig. 9) further suggests that anoxygenic photosynthesis by
purple sulfur bacteria strongly affected net H2S consumption in light incubated Swanbister
beach mats.
Microsensor data on sulfide cycling underestimate sulfur cycling in microbial mats,
since fluxes calculated from microprofiles represent only net rates of sulfide turnover. As has
been shown in light-incubated cyanobacterial mats [9, 88, 77], sulfate reduction can occur in
the highly oxygenated surface layer. This activity, however, is not detectable with H2S
microsensors due to immediate reoxidation of the produced sulfide. Furthermore, other
reduced sulfur compounds, like polysulfides, elemental sulfur and thiosulfate, which are
present in Swanbister mats [86], may play a significant role in the sulfur cycle of these mats.
The dominant purple sulfur bacterium in these mats, T. roseopersicina, is characterized by a
high metabolic versatility [69, 84] and can use polysulfide [87], thiosulfate [17], and
intracellular elemental sulfur [70, 71].
Oxygen consumption rates in the aphotic zone (Raphot) increased with irradiance (Fig.
9). Although H2S fluxes underestimate sulfide fluxes especially in light conditions (see
Results), aerobic/oxic sulfide oxidation seemed not to have significantly contributed to Raphot
at higher irradiances. This points to a more important role of other O2-consuming processes,
like aerobic respiration. T-RFLP analysis together with predicted patterns of T-RFs supplied
from the NCBI Bank indicated the presence of aerobic, heterotrophic alpha-proteobacteria in
the upper layers of the mat, which could have contributed to O2 consumption in that zone. As
mentioned by Nagashima et al. [60], the detection of these non-phototrophic bacteria with the
primer set targeting specifically the pufM gene conserved among purple phototrophic bacteria
could be due to horizontal gene transfer. T-RFLP analysis also revealed the presence of
different communities of SRB in the uppermost layers of Swanbister Bay mats (Fig. 6A).
Sulfate-reducing bacteria are also characterized by their capacity for aerobic respiration
[47, 81] and could have directly contributed to O2 consumption in these mat layers.
112
III. Description de tapis microbiens
Communities of sulfate-reducing and purple bacteria in Swanbister Bay mats
The populations of purple bacteria within the upper millimeters of the Swanbister mat
(Figs. 4, 6B, 7C) experienced pronounced variations of microenvironmental conditions
between dark-light transitions (Fig. 8). A minor population in the surface layer experienced
highly oxic conditions during light periods and micro-oxic conditions during the night, with
sulfide being available only during the night at low concentrations (Figs. 7A, 8). Populations
in the depth interval between the surface layer and the permanently anoxic zone (Figs. 7C, 8)
were only exposed to sulfide during darkness. In light, these populations experience, at least
temporarily, simultaneously low O2 and sulfide concentrations, since the depth of the oxygen-
sulfide interface increased with increasing irradiance (Fig. 8). This condition is subsequently
followed by exposure to either solely O2 or sulfide at further increasing or decreasing
irradiances. Populations present below this transition zone always experienced sulfide, but
may have been light limited (Fig. 4). Thus, the full spectrum of metabolic versatility may be
used by different populations of T. roseopersicina zonated in the mats. This includes
chemolithotrophy during darkness using O2 and sulfide as substrates, degradation of storage
carbohydrates (glycogen) under anoxic dark conditions, photolithotrophy in the light in the
presence of only sulfide, both sulfide and O2, or in the presence of only O2 using intracellular
elemental sulfur or other external reduced sulfur compounds [69, 84].
A pronounced diversity and a depth-dependent distribution of purple bacteria was
found by T-RFLP analysis (Fig. 6B). From pufM T-RFLP profiles, a T-RF of 93 bp
(restriction enzyme HaeIII) was detected in all mat layers within the top 3 mm of the mat. The
sequences of the pufL and pufM genes of T. roseopersicina strain T. ork were recently
determined (A. Fourçans, R. Duran, P. Caumette (unpublished), accession number AJ544223)
and a predictive T-RF of 92 bp was found for the pufM gene of T. roseopersicina digested
with this restriction enzyme. So, the observed T-RF could correspond to the predominant
purple sulfur bacterium T. roseopersicina. The results also show that in Swanbister mats
different communities of anoxygenic phototrophs are zonated within the mat in response to
the microenvironmental conditions (Fig. 6D). The predominant T-RF of 214 bp obtained with
restriction enzyme Hin6I represents the dominating anoxygenic phototrophic community in
Swanbister beach mats, as deduced from the sequences and T-RFs of purple bacteria presently
available. Although predictive digestions made in silico on the RDP website (TAP: T-RFLP
Analysis Program) cannot be used for phylogenetic identification of communities based on
their T-RFs [58], this T-RF could be related to the species Allochromatium vinosum. The
presence of this major species seemed to be independent of depth, O2 and irradiance (Fig. 6D)
113
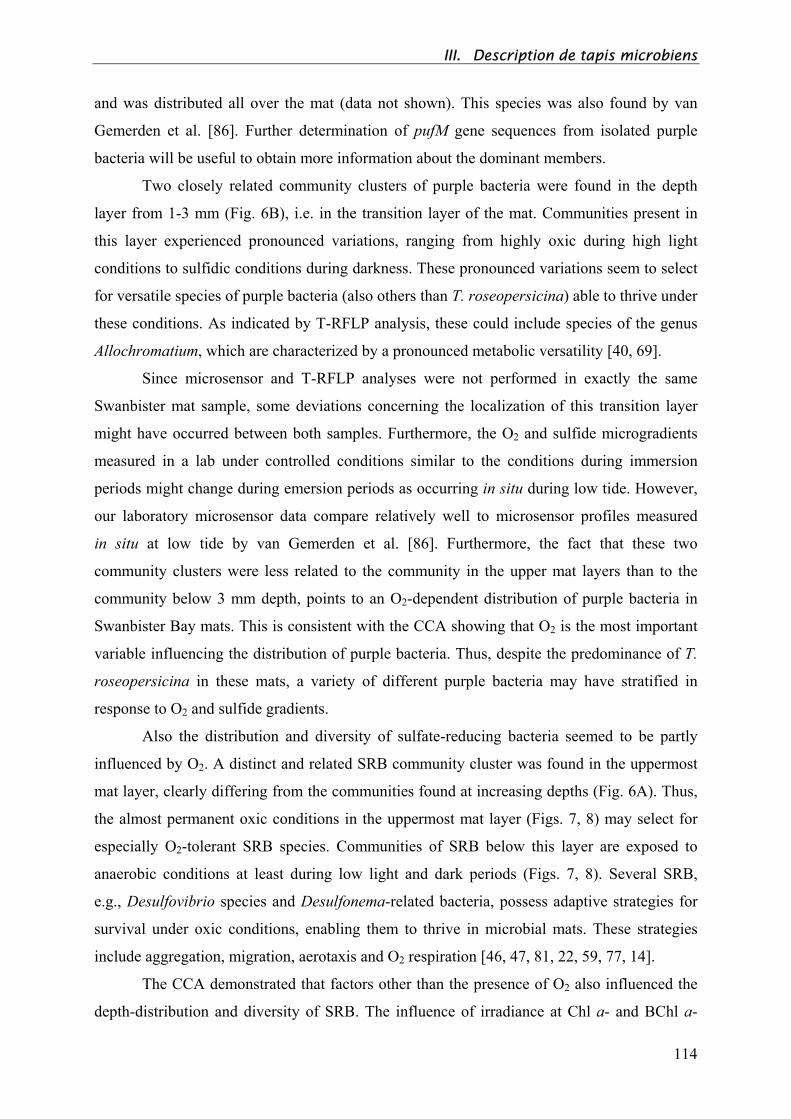
III. Description de tapis microbiens
and was distributed all over the mat (data not shown). This species was also found by van
Gemerden et al. [86]. Further determination of pufM gene sequences from isolated purple
bacteria will be useful to obtain more information about the dominant members.
Two closely related community clusters of purple bacteria were found in the depth
layer from 1-3 mm (Fig. 6B), i.e. in the transition layer of the mat. Communities present in
this layer experienced pronounced variations, ranging from highly oxic during high light
conditions to sulfidic conditions during darkness. These pronounced variations seem to select
for versatile species of purple bacteria (also others than T. roseopersicina) able to thrive under
these conditions. As indicated by T-RFLP analysis, these could include species of the genus
Allochromatium, which are characterized by a pronounced metabolic versatility [40, 69].
Since microsensor and T-RFLP analyses were not performed in exactly the same
Swanbister mat sample, some deviations concerning the localization of this transition layer
might have occurred between both samples. Furthermore, the O2 and sulfide microgradients
measured in a lab under controlled conditions similar to the conditions during immersion
periods might change during emersion periods as occurring in situ during low tide. However,
our laboratory microsensor data compare relatively well to microsensor profiles measured
in situ at low tide by van Gemerden et al. [86]. Furthermore, the fact that these two
community clusters were less related to the community in the upper mat layers than to the
community below 3 mm depth, points to an O2-dependent distribution of purple bacteria in
Swanbister Bay mats. This is consistent with the CCA showing that O2 is the most important
variable influencing the distribution of purple bacteria. Thus, despite the predominance of T.
roseopersicina in these mats, a variety of different purple bacteria may have stratified in
response to O2 and sulfide gradients.
Also the distribution and diversity of sulfate-reducing bacteria seemed to be partly
influenced by O2. A distinct and related SRB community cluster was found in the uppermost
mat layer, clearly differing from the communities found at increasing depths (Fig. 6A). Thus,
the almost permanent oxic conditions in the uppermost mat layer (Figs. 7, 8) may select for
especially O2-tolerant SRB species. Communities of SRB below this layer are exposed to
anaerobic conditions at least during low light and dark periods (Figs. 7, 8). Several SRB,
e.g., Desulfovibrio species and Desulfonema-related bacteria, possess adaptive strategies for
survival under oxic conditions, enabling them to thrive in microbial mats. These strategies
include aggregation, migration, aerotaxis and O2 respiration [46, 47, 81, 22, 59, 77, 14].
The CCA demonstrated that factors other than the presence of O2 also influenced the
depth-distribution and diversity of SRB. The influence of irradiance at Chl a- and BChl a-
114
III. Description de tapis microbiens
absorption wavelengths (Fig. 6C) could be the result of interactions between phototrophs and
SRB and might be considered as an indirect irradiance effect. The finding of some groups at
different depths was not directly correlated with O2 or sulfide gradients. Sulfate-reducing
bacteria are characterized by a pronounced metabolic versatility and are apparently able to
catalyze all reactions of a complete sulfur cycle [13, 14]. This includes the use of a variety of
electron acceptors like sulfite, sulfur, thiosulfate, nitrate, nitrite, O2, Fe(III), as well as their
ability to perform disproportionation and oxidation of diverse sulfur compounds (sulfur,
thiosulfate, sulfite), and aerobic respiration [3, 44, 19, 15, 12, 55, 45, 26, 95]. Thus, not only
the presence of O2 and the availability of organic substrates, but also the distribution of sulfur
compounds like thiosulfate, sulfur, and sulfite could influence the distribution of SRB in this
mat.
Microbial communities of coastal microbial mats on the Orkney Islands are apparently
more diverse than previously described. Furthermore, although mats on Swanbister beach
could be distinguished concerning population density and localization of the purple layer on
or below the mat surface (Figs. 4, 5), a clear differentiation between different microbial mats
as found and described earlier [86] was not possible in July 2000. In particular, sediments
populated only by purple bacteria and characterized by an absence of Chl a-containing
oxygenic phototrophs could not be found. This type of mat was previously described as one of
the three types of mat systems developing especially on Swanbister beach [86]. The
enforcement of strict waste discharge regulations has lead to improved waste water treatment
in the area over the last decade, which has significantly reduced the amount of organic matter
discharged onto the beaches. These changes have created environmental conditions less
favorable for the exclusive development of purple sulfur bacteria, which would also account
for the increased microbial diversity in these mat sediments.
ACKNOWLEDGEMENTS
We acknowledge the financial support by the EC (MATBIOPOL project, grant EVK3-
CT-1999-00010) and the Danish Natural Science Research Council (M.K., contract no.
9700549). The staff and especially Alex Simpson, Director of the Orkney County Council
Marine Unit laboratory, are gratefully acknowledged for providing excellent laboratory
facilities. Anni Glud is acknowledged for the construction of the microsensors.
115
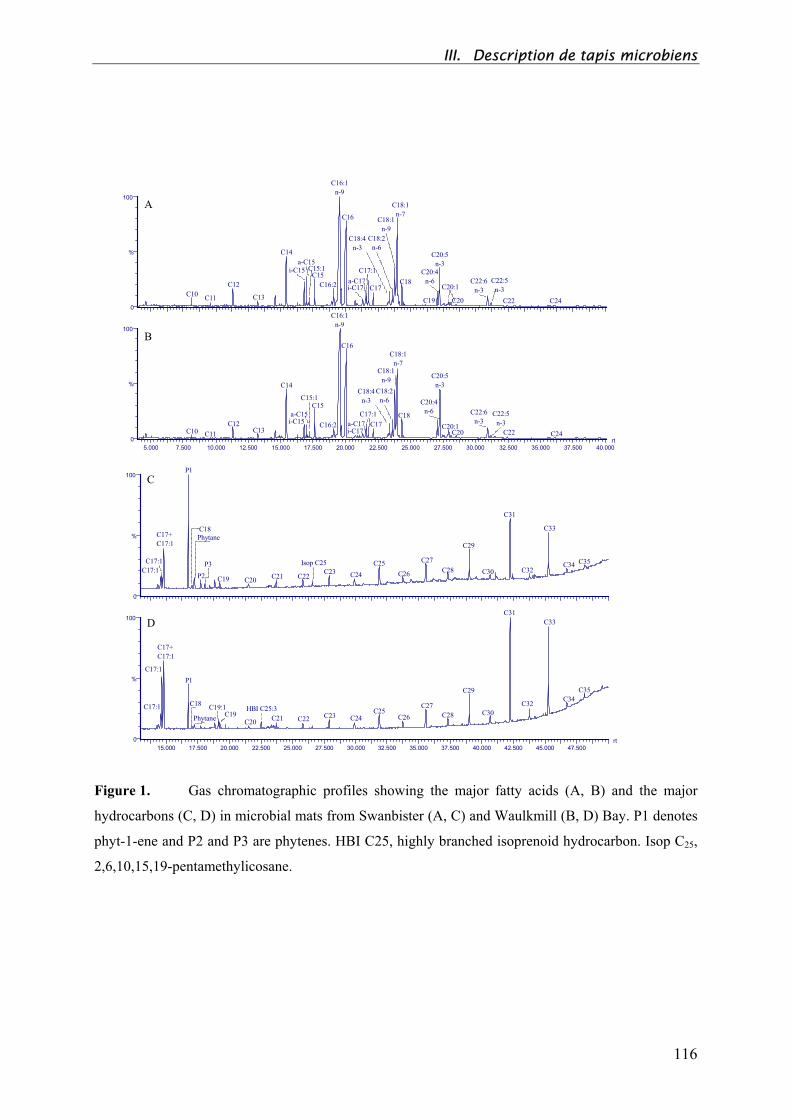
III. Description de tapis microbiens
5.000 7.500 10.000 12.500 15.000 17.500 20.000 22.500 25.000 27.500 30.000 32.500 35.000 37.500 40.000
rt0
100
%
0
100
%
C18
C10C11
C12
C13
C14
C15
a-C15i-C15
C16:2
C16:1n-9
C16
i-C17
C15:1
a-C17
C17:1
C17
C18:1n-7
C18:4n-3
C18:2n-6
C18:1n-9
C19
C20:4n-6
C20:5n-3
C20:1
C20
C22:5n-3
C22:6n-3
C22 C24
C18
C10 C11
C12C13
C14
C15a-C15
i-C15 C16:2
C16:1n-9
C16
i-C17
C15:1
a-C17C17:1
C17
C18:1n-7
C18:4n-3
C18:2n-6
C18:1n-9
C20:4n-6
C20:5n-3
C20:1C20
C22:5n-3
C22:6n-3
C22 C24
A
B
15.000 17.500 20.000 22.500 25.000 27.500 30.000 32.500 35.000 37.500 40.000 42.500 45.000 47.500
rt0
100
%
0
100
%C18
C17+C17:1
C17:1
C19:1
Phytane
C19 C20 C21 C22C23 C24
C25
C26
C27
C28
C29
C30
C31
C32
C33
C34 C35C17:1
C18
C17+C17:1
C17:1
PhytaneC19
C20 C21 C22 C23 C24C25
C26
C27C28
C29
C30
C31
C32
C33
C34C35
C17:1
P1
P1
P3
P2
Isop C25
HBI C25:3
C
D
Figure 1. Gas chromatographic profiles showing the major fatty acids (A, B) and the major
hydrocarbons (C, D) in microbial mats from Swanbister (A, C) and Waulkmill (B, D) Bay. P1 denotes
phyt-1-ene and P2 and P3 are phytenes. HBI C25, highly branched isoprenoid hydrocarbon. Isop C25,
2,6,10,15,19-pentamethylicosane.
116
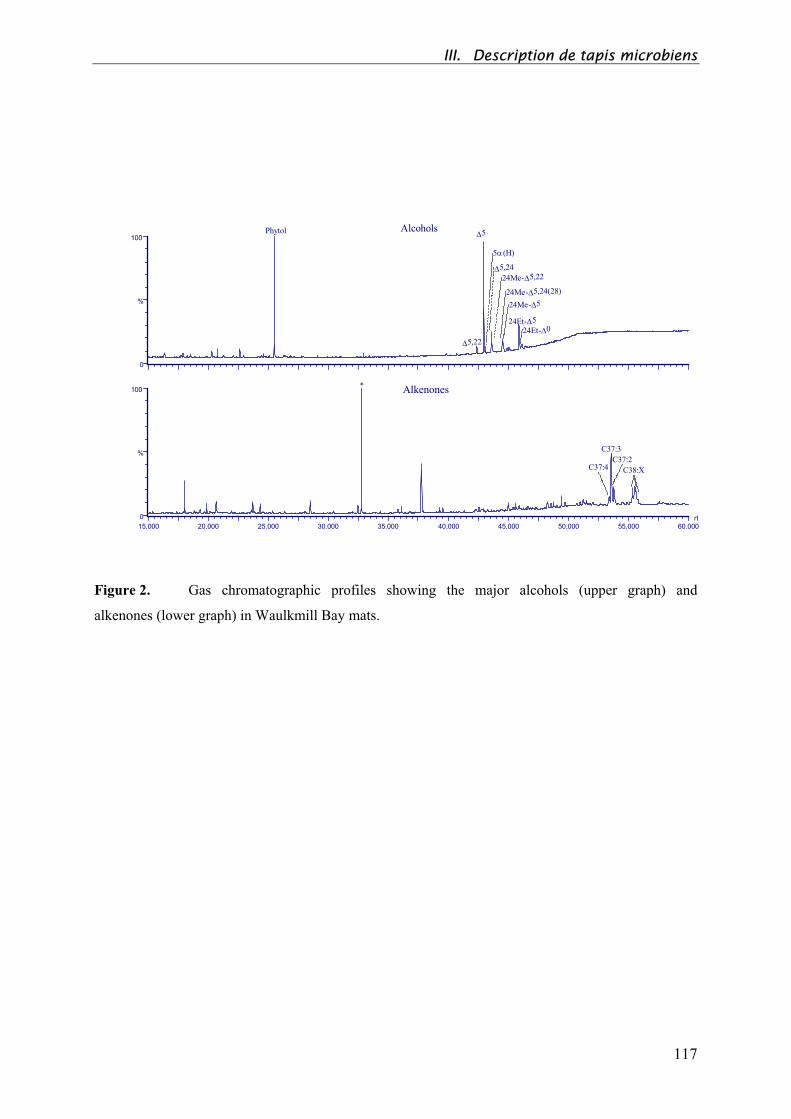
III. Description de tapis microbiens
15.000 20.000 25.000 30.000 35.000 40.000 45.000 50.000 55.000 60.000
rt0
100
%
0
100
%
Alcohols
Alkenones
∆5,22
24Me-∆5
24Et-∆5
24Me-∆5,24(28)
Phytol
*
∆5
α5 (H)
∆5,24 24Me-∆5,22
24Et-∆0
C37:4C37:2
C37:3
C38:X
Figure 2. Gas chromatographic profiles showing the major alcohols (upper graph) and
alkenones (lower graph) in Waulkmill Bay mats.
117
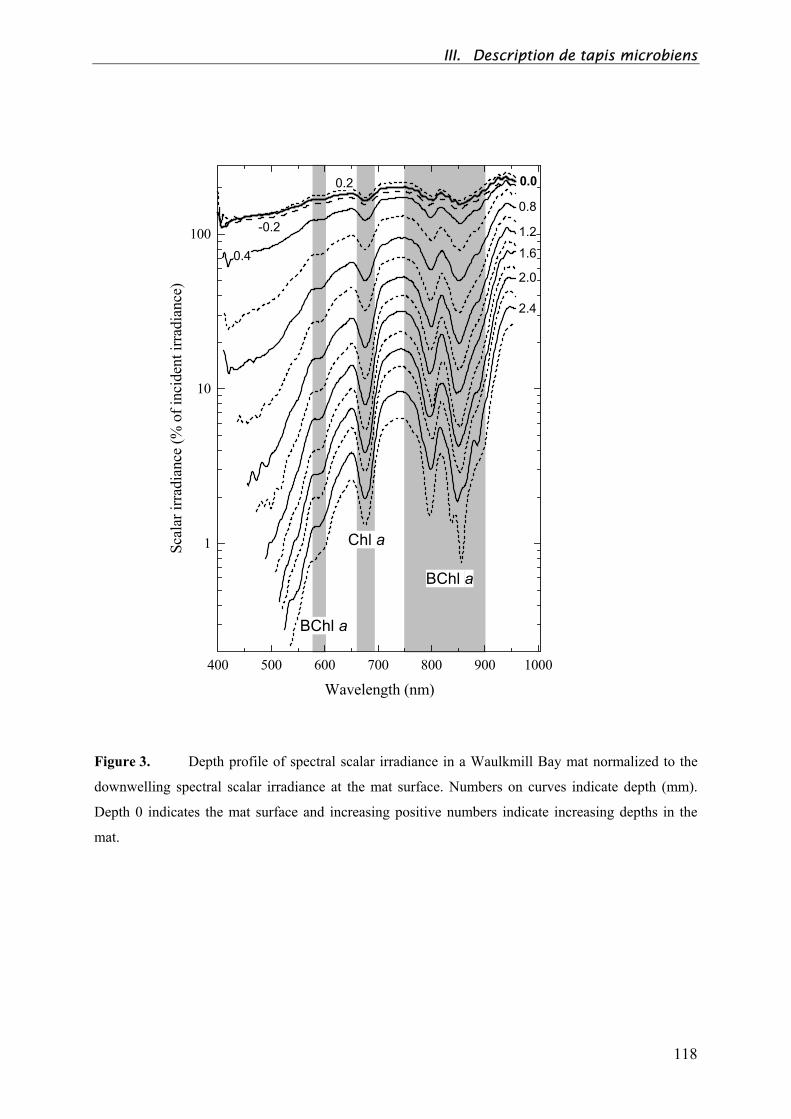
III. Description de tapis microbiens
400 500 600 700 800 900 1000
1
10
100 -0.2
0.2
2.4
2.0
1.6
BChl a
1.2
0.8
0.4
0.0
Chl a
BChl a
Scal
ar ir
radi
ance
(%
of
inci
dent
irra
dian
ce)
Wavelength (nm)
Figure 3. Depth profile of spectral scalar irradiance in a Waulkmill Bay mat normalized to the
downwelling spectral scalar irradiance at the mat surface. Numbers on curves indicate depth (mm).
Depth 0 indicates the mat surface and increasing positive numbers indicate increasing depths in the
mat.
118
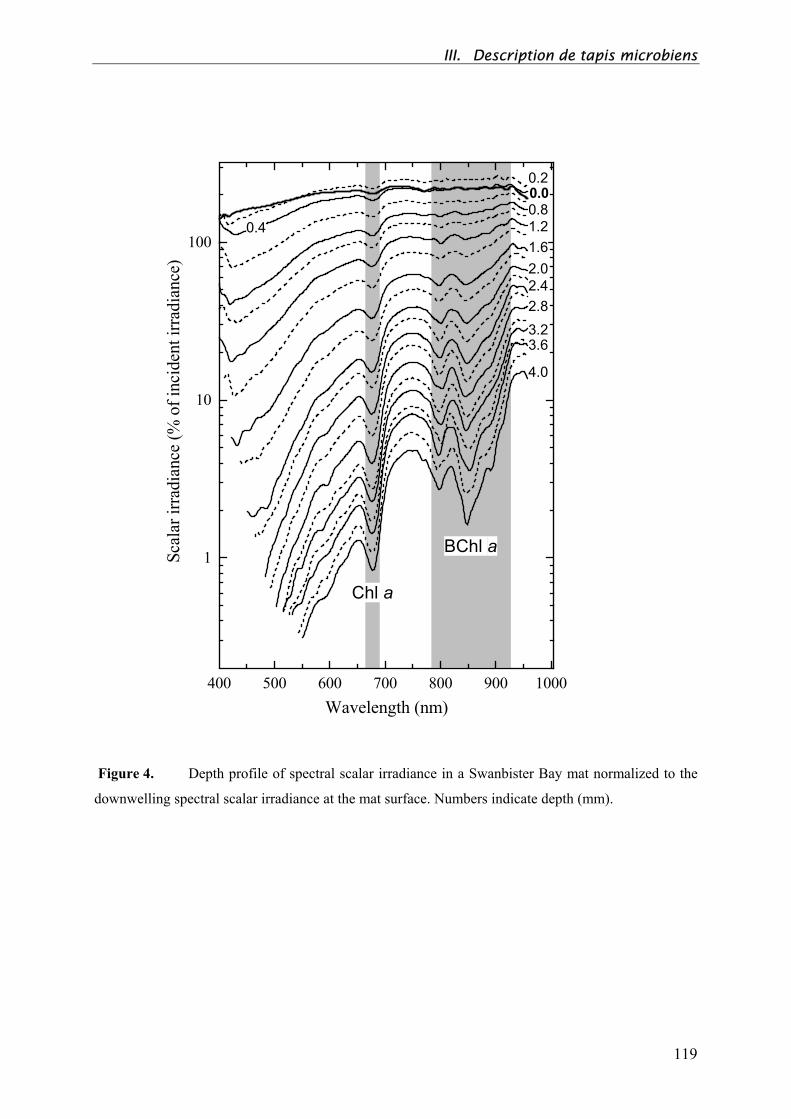
III. Description de tapis microbiens
400 500 600 700 800 900 1000
1
10
100
BChl a
Chl a
4.0
3.63.2
2.8
2.4
2.0
1.6
1.2
0.8
0.4
0.20.0
Scal
ar ir
radi
ance
(%
of
inci
dent
irra
dian
ce)
Wavelength (nm)
Figure 4. Depth profile of spectral scalar irradiance in a Swanbister Bay mat normalized to the
downwelling spectral scalar irradiance at the mat surface. Numbers indicate depth (mm).
119
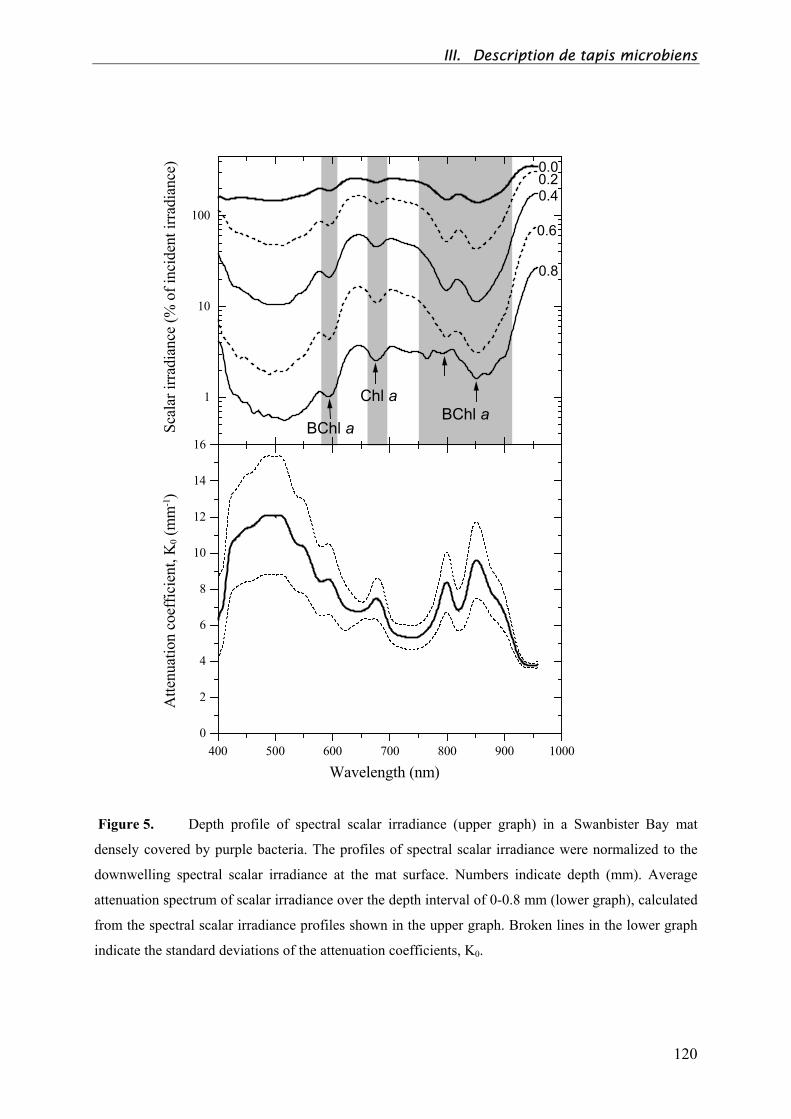
III. Description de tapis microbiens
1
10
100
BChl a
Chl aBChl a
0.8
0.6
0.40.20.0
Sca
lar
irra
dian
ce (
% o
f in
cide
nt ir
radi
ance
)
400 500 600 700 800 900 1000
0
2
4
6
8
10
12
14
16
Atte
nuat
ion
coef
fici
ent,
K0 (
mm
-1)
Wavelength (nm)
Figure 5. Depth profile of spectral scalar irradiance (upper graph) in a Swanbister Bay mat
densely covered by purple bacteria. The profiles of spectral scalar irradiance were normalized to the
downwelling spectral scalar irradiance at the mat surface. Numbers indicate depth (mm). Average
attenuation spectrum of scalar irradiance over the depth interval of 0-0.8 mm (lower graph), calculated
from the spectral scalar irradiance profiles shown in the upper graph. Broken lines in the lower graph
indicate the standard deviations of the attenuation coefficients, K0.
120
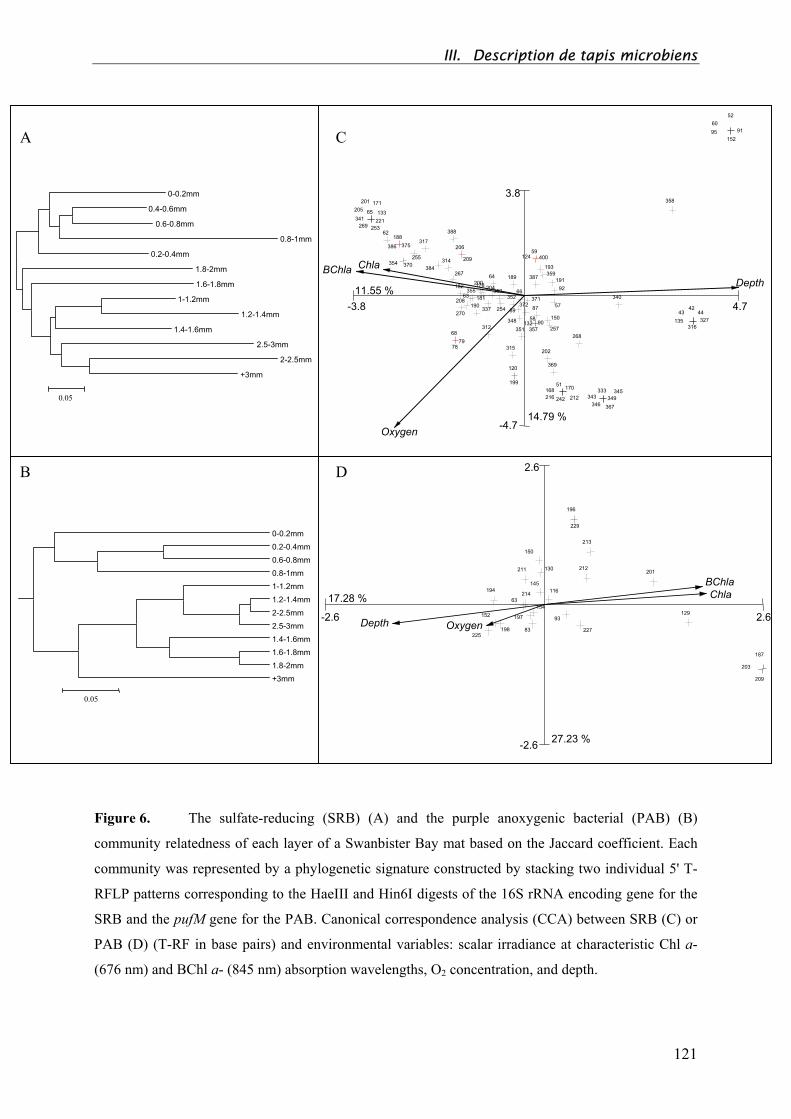
III. Description de tapis microbiens
0-0.2mm
17.28 %
27.23 %
Depth
Chla
BChla
2.6-2.6
2.6
-2.6
229
227
214
213
212 211
209
203
201
198
197
196
194
187
154
152
225
Oxygen
150
145
130
129
116
93
83
63
11.55 %
BChla
Depth
Chla
Oxygen
4.7-3.8
3.8
-4.7
400
388
387
386
384
375
372371
370
369
367
358
354
352
346
340
337
333 345
349 343
327
317
316
315
314
312
270
268
267
257
255
254
242 212
209
206
4350
20
202
201
199
193
359
191
190
189
188
182
181
170168
216
152
150 135
124
120
95
92
91
89 87
7978
68
66
64
62
65
269
341 221
253
205
171
133
60
59
5890132
357351
348
57
52
51
444342
14.79 %
355178200
63208
D
C
B
0.05
+3mm
1.8-2mm
1.6-1.8mm
1.4-1.6mm
2.5-3mm
2-2.5mm
1.2-1.4mm
1-1.2mm
0.8-1mm
0.6-0.8mm
0.2-0.4mm
0-0.2mm
A
0.05
+3mm
2-2.5mm
2.5-3mm
1.4-1.6mm
1.2-1.4mm
1-1.2mm
1.6-1.8mm
1.8-2mm
0.2-0.4mm
0.8-1mm
0.6-0.8mm
0.4-0.6mm
Figure 6. The sulfate-reducing (SRB) (A) and the purple anoxygenic bacterial (PAB) (B)
community relatedness of each layer of a Swanbister Bay mat based on the Jaccard coefficient. Each
community was represented by a phylogenetic signature constructed by stacking two individual 5' T-
RFLP patterns corresponding to the HaeIII and Hin6I digests of the 16S rRNA encoding gene for the
SRB and the pufM gene for the PAB. Canonical correspondence analysis (CCA) between SRB (C) or
PAB (D) (T-RF in base pairs) and environmental variables: scalar irradiance at characteristic Chl a-
(676 nm) and BChl a- (845 nm) absorption wavelengths, O2 concentration, and depth.
121
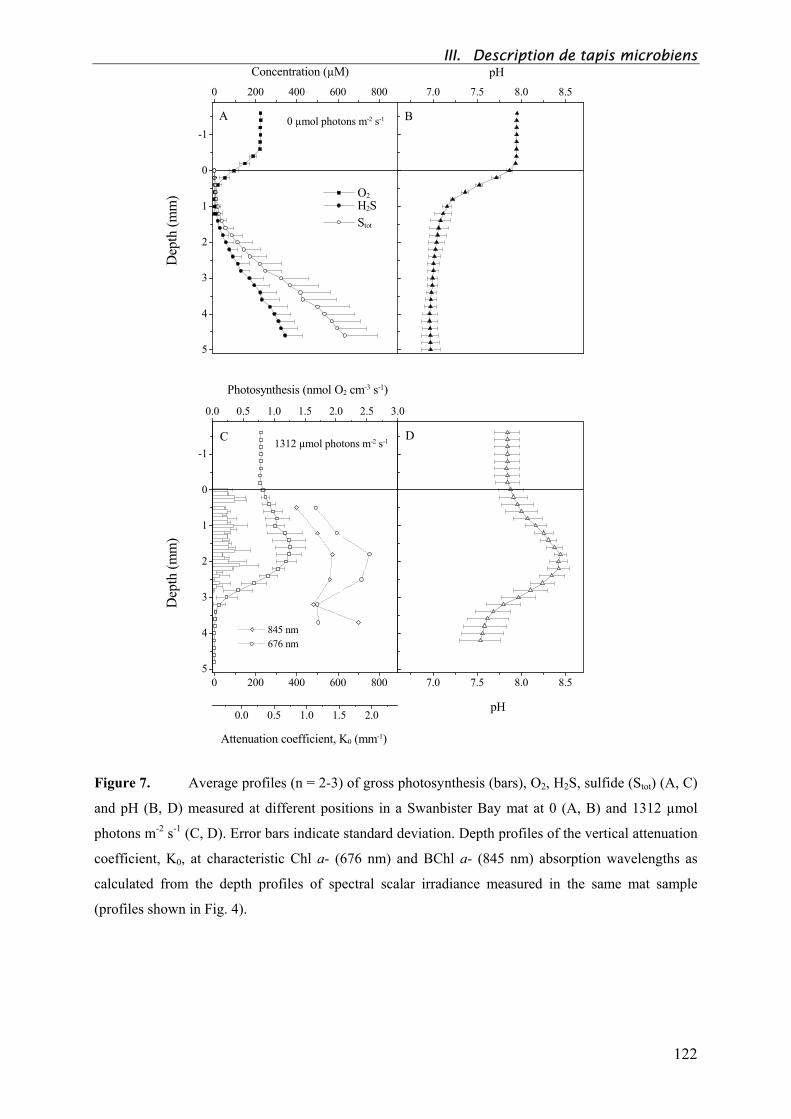
III. Description de tapis m
5
4
3
2
1
0
-1
0 200 400 600 800
Concentration (µM) pH
A
Attenuation coefficient, K0 (mm-1)
0 µmol photons m-2 s-1
Photosynthesis (nmol O2 cm-3 s-1)
pH
O2
H2S Stot
Dep
th (
mm
)
Dep
th (
mm
)
7.0 7.5 8.0 8.5
B
0 200 400 600 800
C1312 µmol photons m-2 s-1
0.0 0.5 1.0 1.5 2.0 2.5 3.0
7.0 7.5 8.0 8.5
D
5
4
3
2
1
0
-1
0.0 0.5 1.0 1.5 2.0
845 nm 676 nm
icrobiens
122
Figure 7. Average profiles (n = 2-3) of gross photosynthesis (bars), O2, H2S, sulfide (Stot) (A, C)
and pH (B, D) measured at different positions in a Swanbister Bay mat at 0 (A, B) and 1312 µmol
photons m-2 s-1 (C, D). Error bars indicate standard deviation. Depth profiles of the vertical attenuation
coefficient, K0, at characteristic Chl a- (676 nm) and BChl a- (845 nm) absorption wavelengths as
calculated from the depth profiles of spectral scalar irradiance measured in the same mat sample
(profiles shown in Fig. 4).
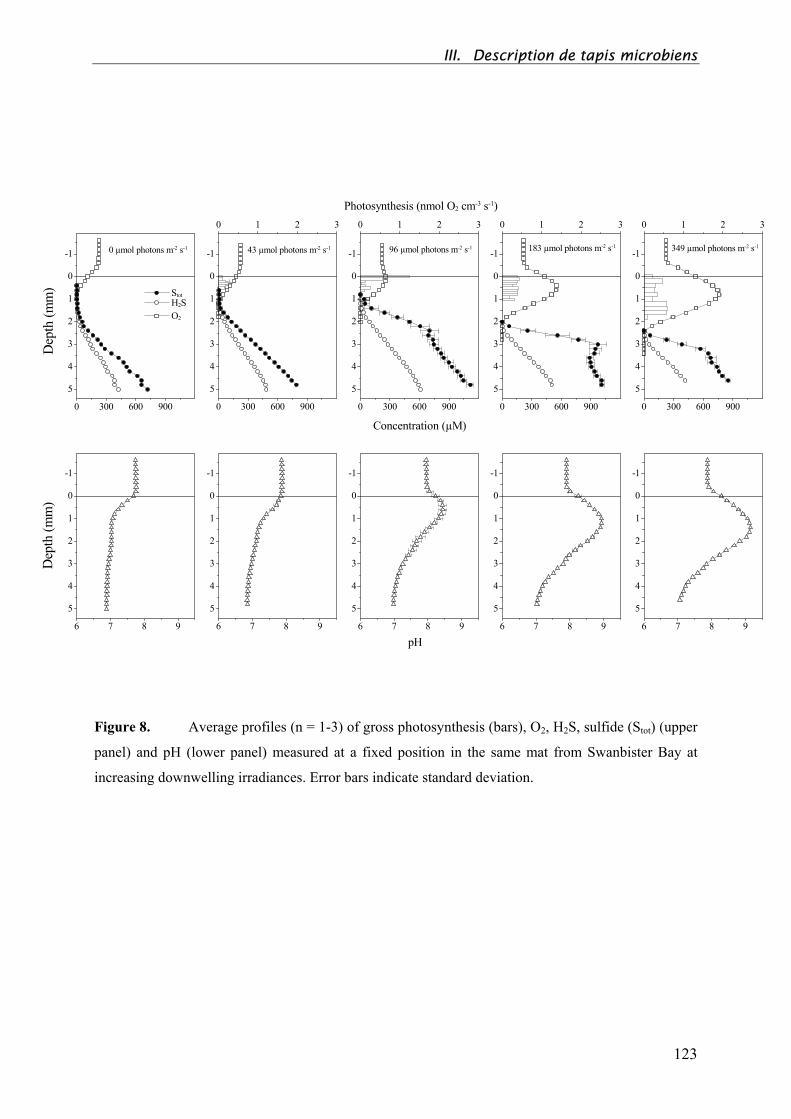
III. Description de tapis microbiens
5
4
3
2
1
0
-1
0 300 600 900
Dep
th (
mm
)
pH
Stot
H2S O2
0 µmol photons m-2 s-1
Photosynthesis (nmol O2 cm-3 s-1)
Concentration (µM)
Dep
th (
mm
)
5
4
3
2
1
0
-1
6 7 8 9
5
4
3
2
1
0
-1
0 300 600 900
43 µmol photons m-2 s-1
5
4
3
2
1
0
-1
6 7 8 9
5
4
3
2
1
0
-1
0 300 600 900
96 µmol photons m-2 s-1
0 1 2 3
5
4
3
2
1
0
-1
6 7 8 9
0 1 2 3
5
4
3
2
1
0
-1
0 300 600 900
183 µmol photons m-2 s-1
0 1 2 3
5
4
3
2
1
0
-1
6 7 8 9
5
4
3
2
1
0
-1
0 300 600 900
349 µmol photons m-2 s-1
0 1 2 3
5
4
3
2
1
0
-1
6 7 8 9
Figure 8. Average profiles (n = 1-3) of gross photosynthesis (bars), O2, H2S, sulfide (Stot) (upper
panel) and pH (lower panel) measured at a fixed position in the same mat from Swanbister Bay at
increasing downwelling irradiances. Error bars indicate standard deviation.
123
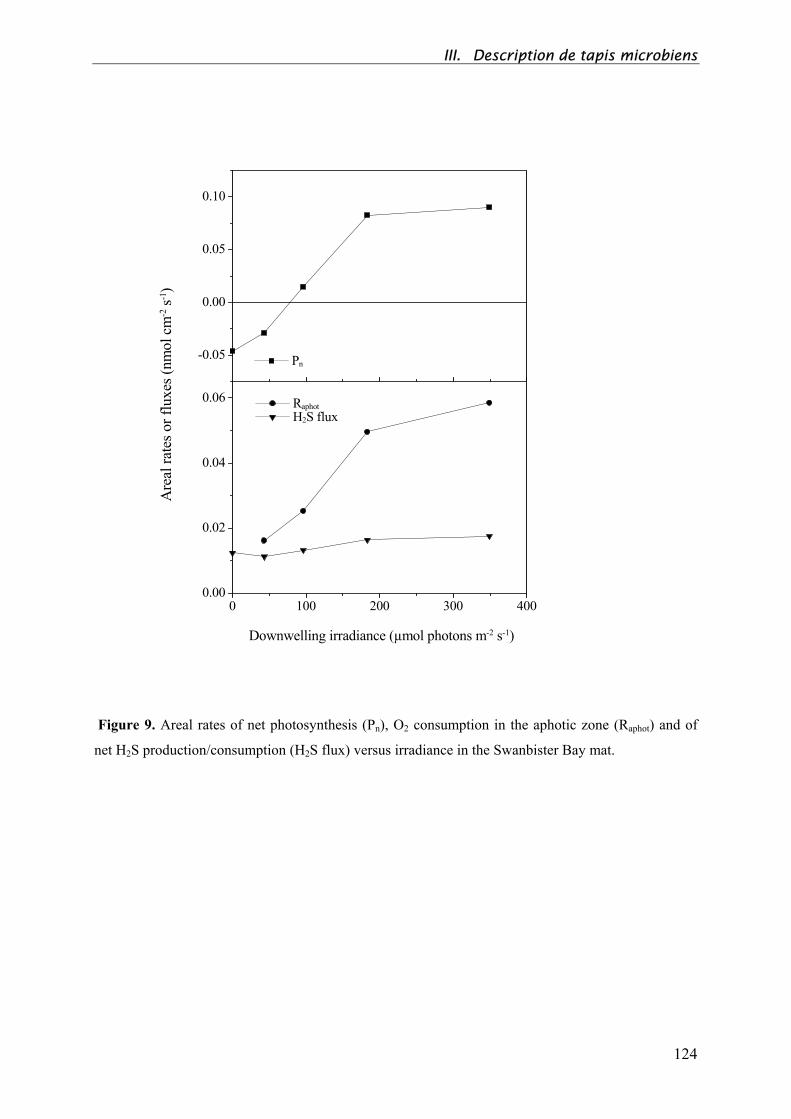
III. Description de tapis microbiens
-0.05
0.00
0.05
0.10
Pn
Are
al r
ates
or
flux
es (
nmol
cm
-2 s
-1)
0 100 200 300 4000.00
0.02
0.04
0.06 Raphot
H2S flux
Downwelling irradiance (µmol photons m-2 s-1)
Figure 9. Areal rates of net photosynthesis (Pn), O2 consumption in the aphotic zone (Raphot) and of
net H2S production/consumption (H2S flux) versus irradiance in the Swanbister Bay mat.
124
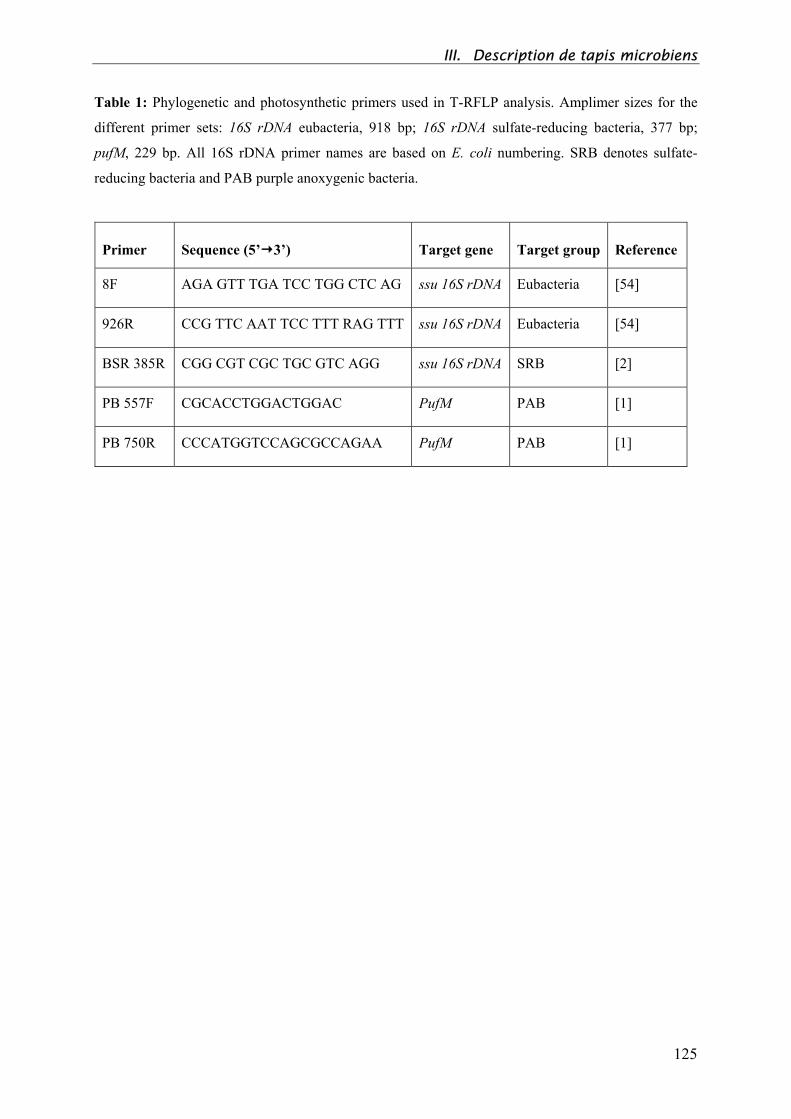
III. Description de tapis microbiens
Table 1: Phylogenetic and photosynthetic primers used in T-RFLP analysis. Amplimer sizes for the
different primer sets: 16S rDNA eubacteria, 918 bp; 16S rDNA sulfate-reducing bacteria, 377 bp;
pufM, 229 bp. All 16S rDNA primer names are based on E. coli numbering. SRB denotes sulfate-
reducing bacteria and PAB purple anoxygenic bacteria.
Primer
Sequence (5’̂3’)
Target gene
Target group
Reference
8F
AGA GTT TGA TCC TGG CTC AG
ssu 16S rDNA
Eubacteria
[54]
926R
CCG TTC AAT TCC TTT RAG TTT
ssu 16S rDNA
Eubacteria
[54]
BSR 385R
CGG CGT CGC TGC GTC AGG
ssu 16S rDNA
SRB
[2]
PB 557F
CGCACCTGGACTGGAC
PufM
PAB
[1]
PB 750R
CCCATGGTCCAGCGCCAGAA
PufM
PAB
[1]
125
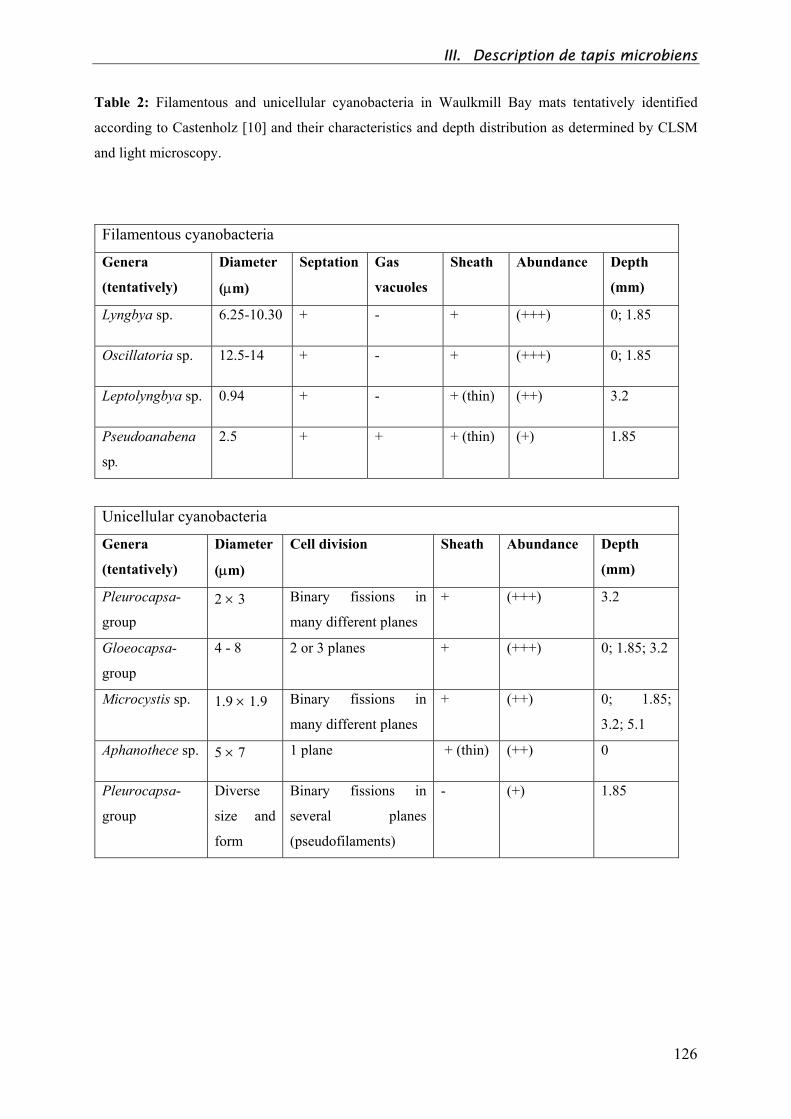
III. Description de tapis microbiens
Table 2: Filamentous and unicellular cyanobacteria in Waulkmill Bay mats tentatively identified
according to Castenholz [10] and their characteristics and depth distribution as determined by CLSM
and light microscopy.
F
(ten (µm) vacuo es
Lyngbya sp. 6.25-10.30 + - + (+++) 0; 1.85
Oscillatoria s p. 12.5-14 + - + (+++) 0; 1.85
Leptolyngbya - (thin) sp. 0.94 + + (++) 3.2
Pseudoanabe
.
(thin) na 2.5 + +
sp
+ (+) 1.85
ilamentous cyanobacteria
Genera
tatively)
Diameter Septation Gas
l
Sheath Abundance Depth
(mm)
Unicellular cyanobacteria
Genera
(tentatively)
Diameter
(µm)
Cell division Sheath Abundance Depth
(mm)
Pleurocapsa-
group
2 × 3 Binary fissions in
many different planes
+ (+++) 3.2
Gloeocapsa-
group
4 - 8 2 or 3 planes + (+++) 0; 1.85; 3.2
Microcystis sp. 1.9 × 1.9 Binary fissions in
many different planes
+ (++) 0; 1.85;
3.2; 5.1
Aphanothece sp. 5 × 7 1 plane + (thin) (++) 0
Pleurocapsa-
group
Diverse
size and
form
Binary fissions in
several planes
(pseudofilaments)
- (+) 1.85
126
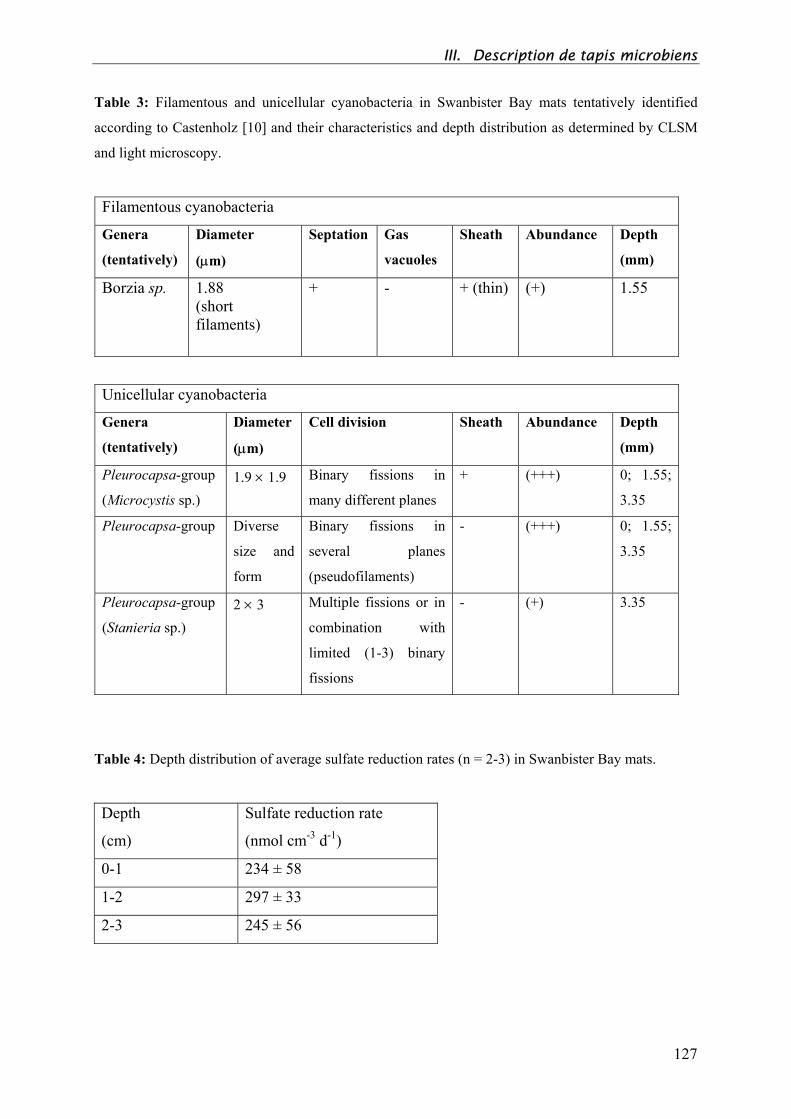
III. Description de tapis microbiens
Table 3: Filamentous and unicellular cyanobacteria in Swanbister Bay mats tentatively identified
according to Castenholz [10] and their characteristics and depth distribution as determined by CLSM
and light microscopy.
Filamentous cyanobacteria
Genera Diameter
(tentatively) (µm
Septation Gas
uoles
Sheath Abundance Depth
) vac (mm)
Borzia sp. 1.8(shfila
+ - + (thin) (+) 8 ort ments)
1.55
Unicellular cyan bacter
o ia
Genera
(tentatively)
Diameter
(µm)
Cell division Sheath Abundance Depth
(mm)
Pleurocapsa-group
(Microcystis sp.)
1.9 × 1.9 Binary fissions in
many different planes
+ (+++) 0; 1.55;
3.35
Pleurocapsa-group Diverse
n
m
Binary fissions in
plane
(pseudofilaments)
- (+++) 0; 1.55;
size a
for
d several s 3.35
Pleurocapsa-g
(Stanie
roup
ria sp.)
3
ith
-3) binar
fissions
- .35 2 × Multiple fissions or in
combination w
limited (1 y
(+) 3
able 4: Depth dis ibution erage su tes (n = 2- ) in Sw Bay
Depth Sulfate
(nm
reduction rate
cm-3 d-1)
T tr of av lfate reduction ra 3 anbister mats.
(cm) ol
0-1 234 ± 58
1-2 297 ± 33
2-3 245 ± 56
127
III. Description de tapis microbiens
REFERENCES
. Achenbach LA, Carey J, Madigan MT (2001) Photosynthetic and phylogenetic primers
for detection of a
1
noxygenic phototrophs in natural environments. Appl Environ Microbiol
67:2922-2926
2. Olson RJ, Chisholm SW, Devereux R, Stahl DA (1990)
ination of 16S rRNA-targeted oligonucleoti es cy for
m icrobial populations. A ron Microbiol 56:1919-192
3. yp (1987) A vel type f energy m m olving fer tion of
inorganic su
4. Ballantine JA, Lavis A, Morris RJ (1979) Sterols of the phytoplankton - effects of
illumination and growth stage. Phytochemistry 18:1459-1466
5. Barbe A, Grimalt JO, Pueyo JJ, Albaigés J (1990) Characterization of model evaporitic
environments through the study of lipid components. Org Geochem 16:815-828
6. Béjà O, Suzuki MT, Heidelberg JF, Nelson WC, Preston CM, Hamada T, Eisen JA,
Fraser CM, DeLong EF (2002) Unsuspected diversity among marine aerobic anoxygenic
tu 30
7. Blumer M, Guill f marine phytoplankton. Mar
Biol 8:183-189
8. e (197 ween ai sea. Tellu 21-35
9. E, Des Marais DJ ction in microbial mats. Science
251:1471-1473
10. Castenholz RW (2001) Phylu yanobacteria. Oxygenic photosynthetic bacteria. In:
Boone DR, Castenholz RW (eds) Bergey´s manual of systematic bacteriology. The
Archea and the deeply branching and phototrophic bacteria, vol. 1, Springer, Berlin, pp
11. Chuecas L, Riley JP (1969) Component fatty acids of the total lipids of some marine
oplankton. J M 116)
12 leman ML, Hedrick DB, Lovley DR, White DC, Pye K (1993) Reduction of Fe(III) in
diments by sulphate-reducing bacteria. Nature 361:436-438
13 ypionka H (1994 etabolic capacities of sulfate-reducing bacteria, and their
tivities in micro In: Stal LJ, Caumette P (eds.) Microbial Mats: Structure,
Development and Environmental Significance, NATO ASI Series G vol. 35, Springer,
Berlin, pp 367-376
Amann RI, Binder BJ,
Comb
analyzing
de prob with flow tometry
ixed m ppl Envi 5
Bak F, C ionka H
lphur compounds. Nature 326:891-892
no o etabolis inv menta
phototrophs. Na re 415:6
ard RRL, C
-633
hase T (1971) Hydrocarbons o
Broecker WS, P ng T-H 4) Gas exchange rates
(1991) Aerobic sulfate redu
m BX. C
bet r and s 26:
Canfield D
473-599
phyt ar Biol Ass UK 49(97-
. Co
se
. C ) Novel m
ac bial mats.
128
III. Description de tapis microbiens
14. Cypionka H (2000) Oxygen respiration by Desulfovibrio species. Annu Rev Microbiol
15.
inorganic sulfur compounds coupled to reduction of O2 or nitrate by
16.
s 23:271-
17. hic growth of the phototrophic sulfur
18. 78) Organic geochemical
19. a. FEMS
20.
21. (1999) Photosynthesis and the dynamics of oxygen
r 44:1936-1948
23. 983) Determination of hydrogen sulphide. In: Grasshoff K, Ehrhardt M,
24.
25. , Hamelin J, Tarnawski S, Roesti D, Jourdain-Miserez K, Forestier N, Teyssier-
nviron Microbiol 4:634-643
44:129-134
28.
urple sulphur bacteria. Nature 330:244-246
54:827-848
Dannenberg S, Kroder M, Dilling W, Cypionka H (1992) Oxidation of H2, organic
compounds and
sulfate-reducing bacteria. Arch Microbiol 158:93-99
de Wit R, Jonkers HM, van den Ende FP, van Gemerden H (1989) In situ fluctuations of
oxygen and sulphide in marine microbial sediment ecosystems. Neth J Sea Re
281
de Wit R, van Gemerden H (1987) Chemolithotrop
bacterium Thiocapsa roseopersicina. FEMS Microbiol Ecol 45:117-126
Didyk BM, Simoneit BRT, Brassell SC, Eglinton G (19
indicators of palaeoenvironmental conditions of sedimentation. Nature 272:216-222
Dilling W, Cypionka H (1990) Aerobic respiration in sulfate-reducing bacteri
Microbiol Lett 71:123-128
Eglinton G, Hamilton RJ (1967) Leaf epicuticular waxes. Science 156:1322
Epping EHG, Khalili A, Thar R
consumption in a microbial mat as calculated from transient oxygen microprofiles.
Limnol Oceanog
22. Eschemann A, Kühl M, Cypionka H (1999) Aerotaxis in Desulfovibrio. Environ
Microbiol 1:489-495
Fonselius SH (1
Kremling K (eds) Methods of seawater analysis, Verlag Chemie, Weinheim, pp 73-80
Fossing H, Jørgensen BB (1989) Measurement of bacterial sulfate reduction in sediments:
evaluation of a single-step chromium reduction method. Biogeochemistry 8:205-222
Fromin N
Cuvelle S, Gillet F, Aragno M, Rossi P (2002) Statistical analysis of denaturing gel
electrophoresis (DGE) fingerprinting patterns. E
26. Fuseler K, Krekeler D, Sydow U, Cypionka H (1996) A common pathway of sulfide
oxidation by sulfate-reducing bacteria. FEMS Microbiol Lett 1
27. García HE, Gordon LI (1992) Oxygen solubility in seawater: Better fitting equations.
Limnol Oceanogr 37:1307-1312
Grant J, Gust G (1987) Prediction of coastal sediment stability from photopigment
content of mats of p
129
III. Description de tapis microbiens
29. Grimalt JO, de Wit R, Teixidor P, Albaiges J (1992) Lipid biogeochemistry of
Phormidium and Microcoleus mats. Org Geochem 19:509-530
32. hey JP, Plese T, Millero FJ (1988) The pK1* for the dissociation of H2S in various
33. dwattes. Kieler
34. lysis
rass Zostera
36. ühl M (1996) An amperometric microsensor for the
37. Bruin S, van Gemerden H (1998a) Turnover of
psa
39.
inosum. Arch
41. R, Volcani BE (1978) Identification of the free and
30. Han J, McCarthy ED, Calvin M, Benn MH (1968) Hydrocarbon constituents of the blue-
green algae Nostoc muscorum, Anacystis nidulans, Phormidium luridum and Chlorogloea
fritschii. J Chem Soc C:2785-2791
31. Herbert RA (1985) Development of mass blooms of photosynthetic bacteria on sheltered
beaches in Scapa Flow, Orkney Islands. Proc Roy Soc Edinburgh 87B:15-25
Hers
ionic media. Geochim Cosmochim Acta 52:2047-2051
Hoffmann C (1942) Beiträge zur Vegetation des Farbstreifen-San
Meeresforschungen Sonderheft 4:85-108
Holzer G, Oro J, Tornabene TG (1979) Gas chromatographic-mass spectrometric ana
of neutral lipids from methanogenic and thermoacidophilic bacteria. J Chromatogr
186:795-809
35. Isaksen M, Finster K (1996) Sulfate reduction in the root zone of the sea g
noltii on the intertidal flats of a coastal lagoon (Arcachon, France). Mar Ecol Prog Ser
137:187-194
Jeroschewski P, Steuckart C, K
determination of H2S in aquatic environments. Anal Chem 68:4351-4357
Jonkers HM, de
dimethylsulfoniopropionate (DMSP) by the purple sulfur bacterium Thiocapsa
roseopersicina M11: ecological implications. FEMS Microbiol. Ecol 27:281-290
38. Jonkers HM, Jansen M, Van der Maarel MJEC, van Gemerden H (1999) Aerobic
turnover of dimethyl sulfide by the anoxygenic phototrophic bacterium Thioca
roseopersicina. Arch Microbiol 172:150-156
Jonkers HM, Koopmans GF, van Gemerden H (1998b) Dynamics of dimethyl sulfide in a
marine microbial mat. Microb Ecol 36:93-100
40. Kämpf C, Pfennig N (1980) Capacity of Chromatiaceae for chemotrophic growth.
Specific respiration rates of Thiocystis violacea and Chromatium v
Microbiol 127:125-135
Kates M, Tremblay P, Anderson
conjugated sterol in a non-photosynthetic diatom, Nitzschia alba, as 24-methylene
cholesterol. Lipids 13:34-41
130
III. Description de tapis microbiens
42. Kelly DP, Smith NA (1990) Organic sulfur compounds in the environment. Adv Microb
Ecol. 11:345-385
43. King GM (1984) Utilisation of hydrogen, acetate and "noncompetitive" substrates by
methanogenic bacteria in marine sediments. Geomicrobiol J 3:275-306
Krämer M, Cypionka H (1989) Sul44. fate formation via ATP sulfurylase in thiosulfate- and
45. esulfovibrio
46. hen Y (1997) A sulfate-reducing
-375
48. chel T (2000) Bio-optical characteristics and the vertical distribution of
49. nsen BB (1992) Spectral light measurements in microbenthic phototrophic
52. fibre-optic scalar irradiance microsensor:
54. ng H, Forney LJ (1997) Characterization of microbial diversity
55. 94) Novel processes for anaerobic sulfate production from
elemental sulfur by sulfate-reducing bacteria. Appl Environ Microbiol 60:2394-2399
sulfite-disproportionating bacteria. Arch Microbiol 151:232-237
Krekeler D, Cypionka H (1995) The preferred electron acceptor of D
desulfuricans CSN. FEMS Microbiol Ecol 17:271-278
Krekeler D, Sigalevich P, Teske A, Cypionka H, Co
bacterium from the oxic layer of a microbial mat from Solar Lake (Sinai), Desulfovibrio
oxyclinae sp. nov. Arch Microbiol 167:369
47. Krekeler D, Teske A, Cypionka H (1998) Strategies of sulfate-reducing bacteria to escape
oxygen stress in a cyanobacterial mat. FEMS Microbiol Ecol 25:89-96
Kühl M, Fen
photosynthetic pigments and photosynthesis in an artificial cyanobacterial mat. Microb
Ecol 40:85-93
Kühl M, Jørge
communities with a fiber-optic microprobe coupled to a sensitive diode array detector.
Limnol Oceanogr 37:1813-1823
50. Kühl M, Steuckart C, Eickert G, Jeroschewski P (1998) A H2S microsensor for profiling
biofilms and sediments: application in an acidic lake sediment. Aquat Microb Ecol
15:201-209
51. Kumar S, Tamura K, Jakobsen IB, Nei M (2001) MEGA2: Molecular evolutionary
genetics analysis software, Bioinformatics
Lassen C, Ploug H, Jørgensen BB (1992) A
Application for spectral light measurements in sediments. FEMS Microbiol Ecol 86:247-
254
53. Li Y-H, Gregory S (1974) Diffusion of ions in sea water and in deep-sea sediments.
Geochim Cosmochim Acta 38:703-714
Liu WT, Marsh TL, Che
by determining terminal restriction fragment length polymorphisms of genes encoding
16S rRNA. Appl Environ Microbiol 63:4516-4522
Lovley DR, Phillips EJP (19
131
III. Description de tapis microbiens
56. Maidak BL, Cole JR, Lilburn TG, Parker CTJ, Saxman PR, Farris RJ, Garrity GM, Olsen
GJ, Schmidt TM, Tiedje JM (2001) The RDP-II (Ribosomal Database Project). Nucleic
57. saturated ketones
58. riction fragment length
ssimilatory sulfite reductase genes. Appl
60. l transfer of genes
61.
Press, Baltimore.
90-96
iochem Physiol 50B:579-583
unities, American Society for Microbiology, Washington D.C., pp 180-190
s. Nature 296:143-145
ns. Lipids 11:266-271
Acids Res 29:173-174
Marlowe IT, Brassell SC, Eglinton G, Green JC (1984) Long chain un
and esters in living algae and marine sediments. Org Geochem 6:135-141
Marsh TL, Saxman P, Cole J, Tiedje J (2000) Terminal rest
polymorphism analysis program, a web-based research tool for microbial community
analysis. Appl Environ Microbiol 66:3616-3620
59. Minz D, Flax JL, Green SJ, Muyzer G, Cohen Y, Wagner M, Rittmann BE, Stahl DA
(1999) Diversity of sulfate-reducing bacteria in oxic and anoxic regions of a microbial
mat characterized by comparative analysis of di
Environ Microbiol 65:4666-4671
Nagashima KVP, Hiraishi A, Shimada K, Matsuura K (1997) Horizonta
coding for the photosynthetic reaction centers of purple bacteria. J Mol Evol 45:131-136
Nes WR, McKean ML (1977) Biogeochemistry of steroids and other isoprenoids.
University Park
62. Nichols PD, Volkman JK, Palmisano AC, Smith GA, White DC (1988) Occurrence of an
isoprenoid C25 diunsaturated alkene and high neutral lipid content in Antarctic sea-ice
diatom communities. J Phycol 24:
63. Nishimura M, Koyama T (1977) The occurrence of stanols in various living organisms
and the behaviour of sterols in contemporary sediments. Geochim Cosmochim Acta
41:379-385
64. Orcutt DM, Paterson GW (1975) Sterol, fatty acid and elemental composition of diatoms
grown in chemically defined media. Comp B
65. Oremland RS, King GM (1989) Methanogenesis in hypersaline environments. In: Cohen
Y, Rosenberg E (eds) Microbial mats: Physiological ecology of benthic microbial
comm
66. Oremland RS, Marsh LM, Polcin S (1982) Methane production and simultaneous sulfate
reduction in anoxic, salt marsh sediment
67. Paoletti C, Pushparaj B, Florenzano G, Capella P, Lercker G (1976) Unsaponifiable
matter of green and blue-green algal lipids as a factor of biochemical differentiation of
their biomass: II. Terpenic alcohol and sterol fractio
68. Patterson GW (1974) Sterols of some green algae. Comp Biochem Physiol 47B:453-457
132
III. Description de tapis microbiens
69. Pfennig N, Trüper HG (1992) The family Chromatiaceae. In: Balows A, Trüper HG,
Dworkin M, Harder W, Schleifer K-H (eds) The Prokaryotes, Springer, Berlin, pp 3200-
3221
70. Pringault O, de Wit R, Caumette P (1996) A benthic gradient chamber for culturing
phototrophic sulfur bacteria on reconstituted sediments. FEMS Microbiol Ecol 20:237-
71.
imental benthic gradients. Microb Ecol
72.
73. 3) Photosynthesis of benthic microflora measured with
26:409-414
Microbiol 43:987-996
brio oxyclinae
78.
79. benthic
80. s. Sulfur Institute Journal
81.
ar Lake (Sinai,
250
Pringault O, de Wit R, Kühl M (1999) A microsensor study of the interaction between
purple sulfur and green sulfur bacteria in exper
37:173-184
Revsbech NP (1989) An oxygen microelectrode with a guard cathode. Limnol Oceanogr
34:474-478
Revsbech NP, Jørgensen BB (198
high spatial resolution by the oxygen microprofile method: Capabilities and limitations of
the method. Limnol Oceanogr 28:749-756
74. Revsbech NP, Jørgensen BB (1986) Microelectrodes: Their use in microbial ecology.
Adv. Microb Ecol 9:293-352
75. Schouten S, van der Maarel MEJ, Huber R, Sinninghe Damsté JS (1997) 2,6,10,15,19-
Pentamethylicosenes in Methanolobus bombayensis, a marine methanogenic archaeon
and Methanosarcina mazei. Org Geochem
76. Senior E, Lindstrom EB, Banat I, Nedwell DB (1982) Sulfate reduction and
methanogenesis in the sediment of a saltmarsh on the east coast of the United Kingdom.
Appl Environ
77. Sigalevich P, Meshorer E, Helman Y, Cohen Y (2000) Transition from anaerobic to
aerobic growth conditions for the sulfate-reducing bacterium Desulfovi
results in flocculation. Appl Environ Microbiol 66:5005-5012
Skyring GW (1987) Sulfate reduction in coastal ecosystems. Geomicrobiol J 5:295-374
Stal LJ, van Gemerden H, Krumbein WE (1985) Structure and development of a
marine microbial mat. FEMS Microbiol Ecol 31:111-125
Tabatabai MA (1974) Determination of sulfate in water sample
10:11-14
Teske A, Ramsing NB, Habicht K, Fukui M, Küver J, Jørgensen BB, Cohen Y (1998)
Sulfate-reducing bacteria and their activities in cyanobacterial mats of Sol
Egypt). Appl Environ Microbiol 64:2943-2951
133
III. Description de tapis microbiens
82. Tornabene TG, Langworthy TA, Holzer G, Oro J (1979) Squalenes, phytanes and other
isoprenoids as major neutral lipids of methanogenic and thermoacidophilic
"archaebacteria". J Molec Evol 13:73-83
84. emerden H (1993) Microbial mats: a joint venture. Mar Geol 113:3-25
ol 62:111-118
n sheltered beaches in Scapa Flow, Orkney Islands. FEMS Microbiol Ecol
87.
bial mat. FEMS Microbiol Ecol 86:283-294
91. l organic chemistry, Longman, New York
d
: from single cells to global climate. FEMS Microbiol Rev 24:263-290
83. Ullman WJ, Aller RC (1982) Diffusion coefficients in nearshore marine sediments.
Limnol Oceanogr 27:552-556
van G
85. van Gemerden H, de Wit R, Tughan CS, Herbert RA (1989a) Development of mass
blooms of Thiocapsa roseopersicina on sheltered beaches on the Orkney Islands. FEMS
Microbiol Ec
86. van Gemerden H, Tughan CS, de Wit R, Herbert RA (1989b) Laminated microbial
ecosystems o
62:87-102
Visscher PT, Nijburg JW, van Gemerden H (1990) Polysulfide utilization by Thiocapsa
roseopersicina. Arch Microbiol 155:75-81
88. Visscher PT, Prins RA, van Gemerden H (1992) Rates of sulfate reduction and thiosulfate
consumption in a marine micro
89. Visscher PT, Quist P, van Gemerden H (1991) Methylated sulfur compounds in microbial
mats: in situ concentrations and metabolism by a colorless sulfur bacterium. Appl Environ
Microbiol 57(6):1758-1763
90. Visscher PT, van Gemerden H (1991) Photo-autotrophic growth of Thiocapsa
roseopersicina on dimethyl sulfide. FEMS Microbiol Lett 81:247-250
Vogel AI (1978) Textbook of practica
92. Volkman JK, Eglinton G, Corner EDS, Sargent JR (1980) Novel unsaturated straight-
chain C37-C39 methyl and ethyl ketones in marine sediments and a coccolithophore
Emiliania huxleyi. Adv Org Geochem 1979:219-227
93. Volkman JK, Jeffrey SW, Nichols PD, Rogers GI, Garland CD (1989) Fatty acids an
lipid composition of 10 species of microalgae used in mariculture. J Exp Mar Biol Ecol
128:219-240
94. Welsh DT (2000) Ecological significance of compatible solute accumulation by micro-
organisms
95. Widdel F (1988) Microbiology and ecology of sulfate- and sulfur-reducing bacteria. In:
Zehnder AJB (ed) Biology of anaerobic microorganisms, John Wiley, New York, pp 469-
585
134

III. Description de tapis microbiens
96. Wieland A, Kühl M (2000a) Irradiance and temperature regulation of oxygenic
photosynthesis and O2 consumption in a hypersaline cyanobacterial mat (Solar Lake,
Egypt). Mar Biol 137:71-85
97. Wieland A, Kühl M (2000b) Short-term temperature effects on oxygen and sulfide
cycling in a hypersaline cyanobacterial mat (Solar Lake, Egypt). Mar Ecol Prog Ser
l 2:417-427
196:87-102
98. Wieringa EBA, Overmann J, Cypionka H (2000) Detection of abundant sulphate-
reducing bacteria in marine oxic sediment layers by a combined cultivation and molecular
approach. Environ Microbio
135

IV. Dynamique verticale des populations bactériennes en fonction des fluctuations physico-chimiques d’un cycle nycthéméral
136
Chapitre IV : Dynamique verticale des populations
bactériennes en fonction des fluctuations physico-
chimiques d’un cycle nycthéméral

IV. Dynamique verticale des populations bactériennes en fonction des fluctuations physico-chimiques d’un cycle nycthéméral
IV. Dynamique verticale des populations en fonction des
fluctuations physico-chimiques d’un cycle nycthéméral
.1. IntroductionIV
Les tapis microbiens correspondent à une stratification verticale fine de différents
microorganismes. Cette structure est le résultat à la fois de microgradients verticaux de
lum ais aussi des groupes bactériens fonctionnels qui la
com breux métabolismes bactériens cohabitent donc sur ces quelques
millimètres de tapis, tels que les photosynthèses oxygénique ou anoxygénique, la fermentation
et la sulfato-réduction (van Gemerden, 1993).
Quotidiennement, les gradients physico-chimiques fluctuent au sein du tapis en terme
de distribution et de concentration (Revsbech et al., 1983). Ainsi les variations de pH, de
lum posent aux bactéries
présentes des stress réguliers auxquels elles doivent s’adapter. Différentes stratégies sont alors
u
ba
la respiration aérobie ou bien de la photosynthèse oxygénique à la photosynthèse
anoxygénique ( formant des
agrégats ou en s’associant à des particules. Des bactéries physiologiquement différentes
peuvent aussi s’associer en formant des consortiums stables par un recyclage mutuel de leurs
intermédiaires métaboliques respectifs (Bield and Pfennig, 1978; Cypionka et al., 1985 ;
Fukui et al., 1999).
La migration reste un processus majeur d’adaptation des bactéries leurs permettant de
fuir les conditions défavorables ou bien de rechercher les conditions environnementales
optimales à leurs croissances (Bebout and Garcia-Pichel, 1995 ; García-Pichel et al., 1994 ;
Krekeler et al., 1998 ; Pringault and Garcia-Pichel, 2003 ; Teske et al., 1998; Thar and Kuhl,
2001). Les bactéries mobiles contrôlent leurs déplacements en réponse à différents stimuli
tels que les composés chimiques, la lumière ou le potentiel redox. Ces différents
comportements entrent en jeu dans les phénomènes dits d’énergie-tactisme, incluant l’aéro-
tactisme, le photo-tactisme, le redox-tactisme, le chimio-tactisme vers les sources de carbone
et le tactisme vers les accepteurs d’électrons (Alexandre and Zhulin, 2001; Alexandre et al.,
2004; Taylor et al., 1999).
ière, d’oxygène, et de sulfure, m
posent. De nom
ière, de salinité, de concentrations en oxygène et en sulfures im
tilisées par celles-ci afin d’échapper à ces fortes variations répétées. Ainsi, certaines
ctéries présentent des métabolismes versatiles capables de passer de la sulfato-réduction à
Moezelaar et al., 1996). D’autres bactéries se protègent en
137

IV. Dynamique verticale des populations bactériennes en fonction des fluctuations physico-chimiques d’un cycle nycthéméral
Ce chapitre propose l’étude de la distribution spatio-temporelle de différents groupes
fonctionnels des tapis microbiens, au cours d’un cycle nycthéméral, afin d’appréhender leurs
portements. com
Le premier article “Vertical shift of phototrophic bacterial communities during a diel
cycle in a cyanobacterial microbial mat (Salins-de-Giraud, Camargue, France) s’est focalisé
ur l’étude des microorganismes phototrophes du tapis microbien, à savoir les cyanobactéries
et les
e tapis au cours des 24h. La T-RFLP a permis
de décr
fosarcina et Desulfococcus. De plus, cette étude décrit la présence de
bactéri
s
bactéries phototrophes anoxygéniques pourpres. Deux méthodes différentes, mais
adaptées aux microorganismes étudiés, ont été utilisées. Ainsi la CLSM (Confocal Laser
Scanning Microscopy) a mis en évidence la diversité modérée en cyanobactéries du tapis de
Camargue (six types différents) mais surtout la dominance de l’espèce filamenteuse
Microcoleus chthonoplastes. Cette dernière montre une distribution en fonction du cycle
nycthéméral suggérant son déplacement dans l
ire la forte diversité, l’organisation très fine des bactéries pourpres anoxygéniques et
leurs réarrangements existants au sein du tapis, en fonction du cycle nycthéméral et des
gradients physico-chimiques. La dynamique de ces bactéries phototrophes ainsi mise en
évidence montre aussi la complexité de leurs comportements, l’existence de compétitions
spatiales ou métaboliques et le rôle écologique important de l’énergie tactisme dans
l’organisation verticale du tapis microbien.
La seconde partie de ce chapitre intitulée “Hypersaline microbial mat: Vertical
migration of sulfate reducing bacteria along a diel cycle” décrit le comportement du groupe
fonctionnel des bactéries sulfato-réductrices. La T-RFLP combinée au criblage d’une banque
de gènes ADNr 16S par RFLP et au séquençage des clones intéressant a permis de mettre en
évidence la dynamique importante des sulfato-réducteurs et tout particulièrement des genres
Desulfonema, Desul
es appartenant au genre Desulfotignum, présentant un profil de migration vertical net
fuyant la lumière et l’oxygène du jour pour les profondeurs anoxiques du tapis.
138
IV. Dynamique verticale des populations bactériennes en fonction des fluctuations physico-chimiques d’un cycle nycthéméral
IV.2. Bactéries photosynthétiques
Ce travail a été soumis au journal “Environmental Microbiology” sous le titre :
Vertical shift of phototrophic bacterial communities during a diel cycle in a
cyanobacterial microbial mat (Salins-de-Giraud, Camargue, France).
Par : Aude Fourçans1, Antoni Solé2, Elia Diestra2, Isabel Esteve2, Pierre Caumette1 et Robert Duran
SUMMARY
The spatio-temporal distribution of oxygenic and anoxygenic phototrophic
communities from a photosynthetic microbial mat (Salins-de-Giraud, Camargue, France) were
investigated during a diel cycle. This study was performed in order to appreciate the impact of
fluctuating environmental parameters (light, temperature, pH, H2S and oxygen) on the
structure of this hypersaline mat. Confocal Laser Scanning Microscopy (CLSM) revealed the
dominance of Microcoleus chthonoplastes and moderate cyanobacterial diversity in
comparison to others already described
1
hypersaline mats. Five others cyanobacterial
phyloty
xyphototroph
diversity, a fine depth scaling structure of the microbial mat, and important dynamic
behaviors of all these phototrophic communities.
1 Laboratoire d’Ecologie Moléculaire EA 3525, Université de Pau et des Pays de l’Adour, avenue de l’Université, BP 1155, F-64013 Pau Cedex, France 2 Department of Genetics and Microbiology, Autonomous University of Barcelona, E-08193 Bellaterra, Spain
pes were observed, which are, considering their decreasing abundance,
Halomicronema excentricum, an unidentified filamentous bacterium, Pseudanabaena sp., and
two unicellular cyanobacteria from the Gloeocapsa and Pleurocapsa-groups. All these
microorganisms showed a specific spatio-temporal distribution in the mat. Furthermore, the
biomass determination of Microcoleus chthonoplastes allowed investigating its dynamic
revealing its vertical migration during the diel cycle. T-RFLP was applied to investigate
anoxygenic phototrophic communities by analyzing their specific PufM gene encoding for a
photosynthetic center subunit. By this approach, we depicted a highly ano
139
IV. Dynamique verticale des populations bactériennes en fonction des fluctuations physico-chimiques d’un cycle nycthéméral
INTRODUCTION
Microbial mats are cohesive microbial communities growing at solid-aqueous interfaces, in
nvironments as diverse as intertidal coastal sediments (Esteve et al., 1992; Guerrero et al.,
t al., 2004), or
ermal springs (Ferris et al., 1996). Mainly dominated by phototrophic, oxygenic and
anoxygenic, microorganisms, they are composed of laminated microbial communities in few
hese chemical gradients are influenced by the mutual activities of benthic microorganisms
Cyanobacteria, located at the surface layer, have been described as main primary producers in
icrobial mats. They are very important in the stabilization as their filaments, on
otile bacteria are able to control their spatial position with respect to various stimuli such as
hemicals, light, and redox potential by variety of mechanisms. In microbial mats aerotaxis,
hemotactic behavior in response to oxygen has been found to be the main mechanism
g bacteria
(Krekeler et al., 1998). Phototaxis is often described as the main tactic response in
e
1993), hypersaline ponds (Giani et al., 1989; Caumette et al., 1994; Fourçans e
th
scale where sharp gradients of electron acceptors are established near the surface layers.
T
that are strongly light dependent.
m
intercrossing, form a complex network throughout the mat (D'Amelio et al., 1987). Among
cyanobacteria, the gliding bacterium Microcoleus chthonoplastes was described as dominant
in hypersaline environments (García-Pichel et al., 1994; Fourçans et al., 2004), marine
intertidal microbial mats (Stal and Krumbein, 1985; Stal, 1994), and in hot deserts (Campbell,
1979). On the other hand, phototrophic sulfur bacteria of the anoxic zone take part in the
energy flow of the mat as “secondary” primary producers. They perform - simultaneously to
the detoxification of H2S provided by sulfate-reducers - a photoassimilation of CO2 produced
by the cyanobacteria (Pfennig, 1975).
Daily, the chemical gradients dramatically change exposing bacteria to extremely variable
environmental conditions including light, temperature, pH, sulfur concentration and oxygen
availability (Revsbech et al., 1983; van Gemerden, 1993). By migration, bacteria escape from
extreme conditions and therefore can benefit of optimal habitats for their development (Taylor
et al., 1999; Alexandre et al., 2004). This migration process has been reported in some mats
for several microorganisms such as sulfur-oxidizing bacteria (García-Pichel et al., 1994),
sulfate-reducing bacteria (Teske et al., 1998) and especially for cyanobacteria (Whale and
Walsby, 1984; Nelson et al., 1986a; Richardson and Castenholz, 1987; Richardson, 1996;
Teske et al., 1998).
M
c
c
guiding Beggiatoa spp. to the sulfide oxygen interface (Nelson et al., 1986b). In contrast,
aerotaxis also contributes by a negative effect to the deal of sulfate reducin
140
IV. Dynamique verticale des populations bactériennes en fonction des fluctuations physico-chimiques d’un cycle nycthéméral
cyanobacteria (García-Pichel et al., 1994; Bebout and Garcia-Pichel, 1995), but others sensing
icrobial mat from Salins-de Giraud along a diel cycle.
easurements (O2, H2S, pH) over a diel cycle
led with falcon tubes. The upper 10 mm of the mat core was sliced off
distribution of microbial communities for each depth was first performed using the
mechanisms have been proposed to participate to the overall behavior of cyanobacteria in the
mat. Recently the phenomenon of hydrotaxis was described as a new energy-dependent
reaction for cyanobacteria (Garcia-Pichel and Pringault, 2001; Pringault and Garcia-Pichel,
2003). Similarly, complex behavior of purple sulfur bacteria could be explained by
chemotaxis and photoresponses as described for Marichromatium gracile (Thar and Kuhl,
2001).
The spatio-temporal distribution of anoxygenic and oxygenic phototrophic communities was
investigated in the Camargue m
Different approaches based on pigment properties of these phototrophic communities allowed
their precise in situ distribution. Cyanobacteria were identified and quantified with Confocal
Laser Scanning Microscopy (CLSM), while anoxyphototrophs were investigated by a
Terminal Restriction Fragment Length Polymorphism (T-RFLP) analysis of PCR amplified
pufM gene.
EXPERIMENTAL PROCEDURES
General information
This analysis was realized on the microbial mat of the Salins-de Giraud saltern during June of
the year 2001, in parallel of in situ microsensor m
(Wieland et al., 2003). This mat presents range salinity between 70 ‰ to
110 ‰ (w/v) (Fourçans et al., 2004).
Sampling procedure
Microbial mats were sampled from a very large shallow pond at the saltern of Salins-de-
Giraud, close to the sand barrier and seacoast in the Camargue area, France. Several samples
were collected at different times (9:40, 15:00h, 18:00h, 22:00h, 4:00h, and 7:30h) over a diel
cycle from 11 to 12 June 2001.
For T-RFLP analysis, at time 15:00h, 4:00h, and 22:00h triplicates samples of mat cores (35
mm i.d.) were samp
aseptically, transferred into sterile Petri dishes, frozen in liquid nitrogen, transported on dry
ice and finally stored at –80°C until further analysis. This froze samples mat were sliced, with
a cryomicrotome, at about 100 µm thick for the 2 first millimeters, and 200 µm thick for the 2
next millimeters. Genomic DNA was extracted from these different slices and vertical
141
IV. Dynamique verticale des populations bactériennes en fonction des fluctuations physico-chimiques d’un cycle nycthéméral
T-RFLP method, and secondly by cloning and sequencing terminal restriction fragments
(T-RFs). According to the results of microsensor measurements (Wieland et al., 2003) we
choose to analyze samples for only 11 slices along the fourth millimeters, to characterize
bacterial communities.
For CLSM analysis, one core (18 mm) from each time in the diel cycle was transferred into
small plastic tubes containing 2,5 % (v/v) glutaraldehyde in a phosphate buffer (0,2 M
adjusted to the appropriate salinity with NaCl), and stored at 4ºC waiting further processing.
depth in each subsample.
e cyanobacteria diversity in every mat subsample by CLSM was
e were determined.
ere erased from them. A black line, one pixel line has also
The different mat samples were analyzed by means of a Leica True Confocal Scanner TCS 4d
(Leica Laser-Technik GmbH, Heidelberg, Germany) equipped with an argon-krypton laser.
This study used the main features of this microscope facilitating observation of cyanobacteria
in microbial mats (Solé et al., 2001a). Subsamples were cut in vertical slices of defined
dimensions taking to account the need to preserve the vertical stratification of the mat.
Confocal images from three replicates, optical series and summa projections, were taken at
every 250 µm
Cyanobacteria characterization
Characterization of th
realized directly on-screen in continuous mode and from the confocal images obtained.
Cyanobacteria identification in the Salins-de-Giraud microbial mats by CLSM has been
described in a general sense in (Fourçans et al., 2004). After cyanobacteria identification, the
profiles of abundance for each of thes
Biomass estimation of Microcoleus chthonoplastes
CLSM suma projection images corresponding to the different time profiles (three replicates
each 250 µm depth) were transformed to binary images (black/white) using Adobe Photoshop
6.0 for Windows. In these images M. chthonoplastes black contours were selected from
among cyanobacteria, which w
been erased to avoid white areas between the black contours being subsequently considered as
a M. chthonoplastes. Morphological data of the perimeter and area for every M.
chthonoplastes outline were obtained through the UTHSCSA Image Tool 3.0, an image
processing and analysis program, and exported to a Microsoft Excel 97 book. Values for
length, width and biovolume were calculated in accordance with the expressions described in
(Solé et al., 2001a). The quotient between the biovolume of M. chthonoplastes and the
volume of sediment analyzed was multiplied by a factor of 310 fg C / µm3 to convert these
142
IV. Dynamique verticale des populations bactériennes en fonction des fluctuations physico-chimiques d’un cycle nycthéméral
data to biomass. Average biomass data from every depth and for each profile studied was
calculated. Results were expressed in µg C / cm2 sediment. Finally, the dynamics of the
M. chthonoplastes biomass, including space and time, were determined.
T-RFLP (Terminal Restriction Fragment Length Polymorphism) analysis
From each mat slice, genomic DNA was extracted with the UltraClean Soil DNA Isolation
Kit (MoBio Laboratories,USA), according to the recommended of the supplier; except in the
first step where 10mM EDTA were added to avoid degradation of genomic DNA. All
extracted genomic DNA samples were stored at -20°C until further processing. For T-RFLP
analysis (Liu et al., 1997), we target specifically the purple anoxygenic phototrophs with the
primers set pb557f-pb750r, which amplifies a pufM DNA gene fragment (Achenbach et al.,
2001). For T-RFLP analysis, Forward (f) and reverse (r) primers were fluorescently labeled
with TET and HEX respectively. Restriction enzyme used in T-RFLP analysis was HaeIII
(New England Biolabs, UK). T-RFs (terminal restriction fragments) superior to
00 fluorescent units and present in each triplicate were selected. Predicted digestions were
known in order to assign the different T-RFs to a certain
ll depth T-RFLP profiles were next compared, from tables assembling T-RF relative values
ctorial Analysis (CFA). The CFA were
Through CLSM, three filamentous cyanobacteria were essentially observed (Figure 1):
Microcoleus chthonoplastes, Halomicronema excentricum, together with an unidentified
bacterium forming filaments of 0.96 µm diameter. Confocal image of the most abundant
cyanobacteria showed bundles with several trichomes oriented in parallel with cells longer
1
realized on all PufM sequences
genus or species. A Correspondence Factorial Analysis (CFA) compared all depth T-RFLP
profiles, from tables assembling T-RFs relative values. The CFA were realized with
MVSP v3.12d software (Rockware Inc., UK; (Kovach, 1999).
Statistical analysis
A
of each restriction enzyme, by a Correspondence Fa
realized with MVSP v3.12d software (Rockware Inc., UK; (Kovach, 1999).
Canonical Correspondence Analysis (CCA), performed with MVSP v3.12d software
(Rockware Inc., UK), were realized from data of T-RFLP profiles, biomass of Microcoleus
chthonoplastes estimated by CLSM, and environmental parameters (oxygen, pH, H2S, Stot)
measured in a previous study on the diel cycle (Wieland et al., 2003).
RESULTS
Communities of oxygenic phototrophic bacteria in Camargue mat
143
IV. Dynamique verticale des populations bactériennes en fonction des fluctuations physico-chimiques d’un cycle nycthéméral
than wide characteristic of Microcoleus chthonoplastes (Figure 2). This bacterial species was
widely distributed in the mat independently of the daytime.
Halomicronema excentricum, a filamentous cyanobacterium described in high salinity
nvironments, was found broadly distributed overall the mat during the day while it was
cteria showed an
found completely different,
. chthonoplastes reached its maximum concentration at 0.5 mm (1.32 mgC/cm2 sediment),
elsewhere. At 22:00h, after sunset M. chthonoplastes filaments were
mainly localized between 0 and 1.5 mm, and decreased under this depth and was practically
undetected from 2.25 mm. At 4:00h, M. chthonoplastes filaments were well distributed
throughout the 3 mm of the microbial mat. Finally at 7:30h, the distribution of
M. chthonoplastes was similar to that described at 9:40h, i.e. a maximum biomass
(0.88 mgC/cm sediment – 0.83 mgC/cm sediment) between 0.75 mm and 1 mm, a
concentration of 0.65 mgC/cm sediment at 1.75 mm depth, and 0.28 mgC/cm sediment at
2.5 mm.
t
e
found at the surface during the night. The unidentified filamentous cyanoba
ubiquitous distribution with a favorite location on the deep zone around the 2 last mm.
Additionally, Pseudanabaena sp. filaments have been located only in the morning (9:40 h) at
the depth 3.25 mm. Unicellular cyanobacteria of the Gloeocapsa-group have been observed at
different location, 0.5 and 2 mm (15:00 h), 0.25 mm (22:00 h) and 0.75 mm (4:00 h). Finally,
the Pleurocapsa-group has only been found at 4:00 h at different depths throughout the 4 mm
analyzed.
Since M. chthonoplastes was found to be the most abundant cyanobacteria, its spatio-temporal
distribution within the mat was determined by biomass analysis during a diel cycle (Figure 3).
At 9:40h, it was distributed mainly in three areas with the maximum biomass
(0.99 mgC/cm2 sediment) observed around the first mm. Two others zones, at 1.75 mm depth
presenting a biomass of 0.61 mgC/cm2 sediment, and at 2.5 mm (0.74 mgC/cm2 sediment)
were observed. At 15:00h, the filaments were principally distributed in two areas at the upper
layer (0.25 mm) with a concentration of 0.78 mgC/cm2 sediment, and at 1.75 mm depth
(0.72 mgC/cm2 sediment). At 18:00h the distribution was
M
while it was absent
2 2
2 2
Communities of anoxygenic phototrophic bacteria in Camargue ma
The distribution of the anoxygenic phototrophic bacteria (PAB) within the mat was analyzed
along a diel cycle by the T-RFLP method targeting the functional pufM gene encoding for a
subunit of the photosynthetic center of purple bacteria (Achenbach et al., 2001). (Wieland et
144
IV. Dynamique verticale des populations bactériennes en fonction des fluctuations physico-chimiques d’un cycle nycthéméral
al., 2003) described an opposite physico-chemical gradient on two hours (15:00h and 4:00h)
of a diel cycle that it was interesting to investigate in terms of PAB diversity.
s, but located differently within the 4 millimeters of the mat. Indeed,
stribution of the PAB communities in the mat depending on the nycthemeral cycle
igure 5) emphasizing three distinct clusters. Communities from each layer of the 4:00h mat
0.3-0.4 mm and
T-RFLP profiles revealed an important diversity of the PAB communities within the mat,
with 24 different OTUs (Operational Taxonomic Unit) detected only for the digestion HaeIII.
From T-RFLP profiles obtained at each depth, all relative abundances of each T-RF were
summarized in the histograms presented in Figure 4. The observed bacterial communities of
the mat stratification were completely distinct, between the day afternoon and the night.
Specific T-RFs were observed in function of the nycthemeral cycle, i.e., at 15:00h the
fragments of 93, 119, 167, 202, 225 bp (Figure 4a); and at 4:00h fragments of 36, 46, 90, 125,
132, 156, 177, 197, 212 bp (Figure 4b). Moreover, we could remark some common OTUs at
both hour
T-RFs 104 bp settled the oxic zone (0-0.4 mm) at 15:00h, although always abundant (about
75 % of the layer) in the top layer (0.3-0.4 mm) at 4:00h, it was found in anoxic zones
1.2-1.3 mm and 3.4-4 mm. Interestingly, at an intermediate hour (22:00h), its zonation was
also seen in an intermediate state at 0 to 1.6 mm representing 8 % of the population in each
layer (data not shown). In the same way, the OTUs 137 and 192 bp showed a clustering inside
the mat during the night. Since T-RF 137 bp, largely present in the 4 mm of the mat during
the day, was only observed in a mid anoxic layer (1.2-1.3 mm) at 4:00h. Identically, at 15:00h
the T-RF 192 bp was present in an oxic zonation between 0.9-1.6 mm, and at 4:00h it was just
confined in the anoxic 1.5-1.6 mm. HaeIII predictive digestion of all pufM sequences
available correlated the OTU 137 bp to the purple non sulfur bacteria Roseospira marina. In
contrary, the OTUs 114, 148, 187 bp were detected only in anoxic area during the day, while
they were located into the surface or spread overall the mat in the night. Finally, terminal
fragments 117, 129, 199, and 228 bp were homogeneously developed within the 4 mm,
independently of the diel cycle. The OTU 129 bp could be related to the chemotrophic
bacteria Erythrobacter litoralis.
Factorial correspondence analysis (CFA) done on T-RFLP data showed clearly a different
spatial di
(F
were grouped, except those from the two layers
1.2-1.3 mm. These PAB communities were contrariwise close to a second cluster formed by
almost communities from the layers of the 15:00h mat. The communities of the deep layer
(3.4-3.6 mm) of the day mat appeared to be really independent from the others two groups,
145

IV. Dynamique verticale des populations bactériennes en fonction des fluctuations physico-chimiques d’un cycle nycthéméral
mainly influenced by the axis 2 showing a variance of 11.82 %. Among T-RFs corresponding
to the axis 2, the T-RF 199 bp (HaeIII) could be related to the purple sulfur bacteria
rom a potentially toxic environment using sheaths (Decho,
Halochromatium salexigens and to a purple non sulfur bacterium recently isolated from this
marsh (data not shown).
The mat of 4:00h is most influenced by OTUs 114, 129 and 132 bp composing inter alia the
axis 1, and OTU 148 bp composing the axis 2. The mat of 15:00h is contrariwise impacted by
others OTUs composing axis 1 and 2, corresponding to the fragments 129, 137, 202, 228 bp
and 117, 199 bp respectively, that could not be correlated to known PAB species.
DISCUSSION
Organization of phototrophic communities in the mat during the diel cycle
Dominance of Microcoleus chthonoplastes
The Salins-de-Giraud microbial mat presented restrained cyanobacteria diversity in
comparison to other studied mats, probably due to the fact that salinity favors lower diversity
(Fourçans et al., 2004). M. chthonoplastes, Halomicronema excentricum and a still
unidentified bacterium were detected as majority forms within the cyanobacteria community.
M. chthonoplastes presents great metabolic diversity, and is able to live in hypersaline
environments (Caumette et al., 1994). Halomicronema excentricum develops in hypersaline
environments since it was described in the Solar Lake (Eilat, Israel) microbial mats (Abed et
al., 2002). Further studies are needed to understand the ecophysiology of the still unidentified
filaments. Figure 3 illustrates the tendency of M. chthonoplastes to locate in the first few
millimeters of the mat during the day, as it carries out an oxygenic photosynthesis.
M. chthonoplastes was also detected in anoxic zones during the day that is consistent with its
ability to develop through anoxygenic photosynthesis (De Wit and Van Gemerden, 1987).
Previous studies have proved that low concentration of sulfide (974 µM) is growth-inhibiting
for M. chthonoplastes (De Wit and Van Gemerden, 1987), notwithstanding that this bacterium
has the ability to protect itself f
1990). In the night, mainly at 4.00h, M. chthonoplastes was found uniformly distributed in the
mat enriched in sulfur (Wieland et al., 2003), probably because of its capacity to carry out
alternative metabolisms. Indeed, (Moezelaar et al., 1996) have demonstrated its aptitude to
ferment carbohydrates in the dark, using sulfur as an electron acceptor, and producing sulfide.
Similarly, studies on the pigmented zone of the Ebro Delta (Spain) microbial mats during an
annual cycle revealed that M. chthonoplastes was the dominant cyanobacterium of the first
few millimeters (oxic zone) with maximum biomass in May 1997 (6,55 mgC/cm2 sediment),
146
IV. Dynamique verticale des populations bactériennes en fonction des fluctuations physico-chimiques d’un cycle nycthéméral
although its spatial distribution demonstrated its considerable metabolic versatility (Solé et al.,
2003).
Anoxyphototrophs communities changes during the diel cycle
Indeed, the
venness index calculated from T-RFLP profiles revealed diversity in PAB lower in night
ay (15:00h) with respective values of 0.789 and 0.907. This visible impact on
hysico-chemical
nd th
OTUs (117, 129, 199, 228 bp) keeping constant zonation in the 4 mm of the mat suggested a
promoted. Furthermore, comparison of the PAB mat structure with previous studies (Fourçans
Dynamic of the microbial mat along a diel cycle
T-RFLP fingerprints of the PAB communities based on the analysis of their own pufM
gene allowed to estimate their biodiversity inside the mat in a spatial way at a microscale
level (Fourçans et al., 2004). Considering the active four millimeters of the mat, the PAB
showed strong changes in diversity at different period of the nycthemeral cycle.
E
(4:00h) than in d
the bacterial diversity could be explained by the existence of variable p
gradients. (Wieland et al., 2003) have characterized the biogeochemistry of the Camargue mat
over a diel cycle, describing two opposite periods. Firstly, in the afternoon a clearly defined
upper oxic zone of 1.5 mm was followed by an anoxic part from the 2 to the 4 millimeter.
Secondly, in the night the oxic upper 0.5 mm of the mat was overlapped with sulfide while the
deeper zone (0.5 mm-4 mm) became completely anoxic. Comparison of T-RFLP fingerprints
revealed common and specific populations of PAB between night and afternoon. The
predominance of specific OTUs in each hour, 93, 119, 167, 202, 225 bp (15:00h) and 36, 46,
90, 125, 132, 156, 177, 197, 212 bp (4:00h), suggested an adaptation of the bacterial
metabolic type in function of the diel environmental conditions. Moreover, some common
PAB differently located in each hour (104, 114, 137, 148, 187, 192 bp) indicated their vertical
migration to optimal or tolerable conditions of growth. Thus, when sulfide reaches the mat in
night, bacteria able to versatile metabolism such as purple non sulfur bacteria supporting few
concentration of sulfide (less than 3mM) (Pfennig, 1975) could be favored. For, example, the
motile purple non sulfur bacteria Roseospira marina (HaeIII T-RF of 137 bp), able to tolerate
the sulfide concentration found in this mat, could be preserved. In contrast, the fact that others
metabolic switch. Close to the oxygen-sulfide interface, the development of some purple
sulfur bacteria as small-size Chromatiaceae tolerating microoxic conditions could be
et al., 2004) revealed little differences suggesting a real dynamic of the populations in
function of seasonal conditions.
147
IV. Dynamique verticale des populations bactériennes en fonction des fluctuations physico-chimiques d’un cycle nycthéméral
A canonical correspondence analysis (CCA) was realized including biogeochemical
data (O2, pH, H2S, Stot, measured in parallel of sampling) from (Wieland et al., 2003),
iomass of M. chthonoplastes, and T-RFLP data on PAB, in order to evaluate parameters
ure 6). CCA revealed a PAB
commu
in oxic and anoxic conditions in the laboratory illustrated
eir capacity to use alternative metabolisms (data not shown). Sulfide toxicity is also well
b
influencing the spatial distribution of PAB over a diel cycle (Fig
nity structure in the afternoon (15:00h) mainly influenced by the sulfide rather in
depth than in surface. Indeed, in contrast to the night oxygen and sulfide gradients were well
defined in the afternoon showing an oxygen-sulfide interface. Oxygen, pH, and biomass of
M. chthonoplastes influenced negatively the structure of the PAB rather in depth than in
surface. Active photosynthesis of cyanobacteria in mat surface in day promotes an increase of
the pH up to 9.4 along the first 1.5 mm (Wieland et al., 2003). The decreasing of pH to 6.8
during the night due to lack of photosynthesis (Wieland et al., 2003) could favor the presence
of phototrophic bacteria such as green sulfur bacteria like Chlorobiaceae (van Gemerden and
Beeftink, 1981). The predominance of M. chthonoplastes in different zones of this mat could
also act as a PAB competitor. During the night, the influence of sulfide on PAB structure was
less strong than in the noon since it only reached the mat surface but kept regular
concentration. Similarly in day, the biomass of M. chthonoplastes influenced strongly the
PAB diversity independently of their spatial distribution, suggesting either a spatial or a
metabolic competition with PAB since it is able to perform anoxygenic photosynthesis. The
absence of oxygenic photosynthesis during the night will explain the poor concentration of
oxygen in the mat and the decrease of pH, and consequently their impact on PAB structure
and diversity was less strong in night than in day.
The very steep and diel fluctuating gradient of electrons donors and acceptors across
this microbial mat seems to induce a large change on the distribution of oxyphototrophic
bacteria. (García-Pichel et al., 1994) already described the behavior of some cyanobacteria
gliding to optimal conditions in hypersaline microbial mat mainly in response to light. From
early morning to dusk, blue-green cyanobacteria such as Oscillatoria and Spirulina spp. have
shown downward migration into the mat to avoid photodamage and photosynthesis inhibition
by high level of irradiance. Similar studies showed the orientation abilities of
M. chthonoplastes in a diel cycle in natural habitats such as Ebro Delta microbial mats (Solé
et al., 2001b). However, others taxis mechanisms such as aero- or sulfide-taxis probably in
association with phototaxis may contribute to the overall cyanobacteria distribution across the
mat. Microcoleus cultures grown
th
148
IV. Dynamique verticale des populations bactériennes en fonction des fluctuations physico-chimiques d’un cycle nycthéméral
known to inhibit oxygenic photosynthesis (Oren et al., 1979), although cyanobacteria can vary
in sulfide tolerance (Cohen et al., 1986). Recently, (Miller and Bebout, 2004) described a
Microcoleus strain (from a Baja California Sur microbial mat) able to perform oxygenic
photosynthesis (reduced by 50 %) in presence of 29 µM total soluble sulfide. In Camargue
mats, the distribution of M. chthonoplastes biomass suggests that two populations may coexist
emphasizing its metabolic versatility. A population highly sensitive to sulfide located in mat
area without sulfide and a second population tolerant to high sulfide concentration (around
200 µM) observed around the second millimeters.
Throughout the diel cycle, T-RFLP brought out different behavior of
anoxyphototrophs. Several phototrophic bacteria, referred to detected T-RF, were observed in
different mat location during the studied period. T-RF 104 bp, downward migrating from
oxic non-sulfur zone in day to sulfur anoxic zone when night occurred, acted as versatile
metabolic bacteria. In the same way T-RFs 117, 129, 199, and 228 bp, homogeneously
existing across the mat independently of the diel cycle period, could be related to such
flexible metabolism. They could be associated to microorganisms able of chemotrophy, or
fermentation in dark oxic or microoxic conditions, like some purple non sulfur bacteria,
small-size Chromatiaceae, Ectothiorhodospiraceae, or aerobic anoxygenic phototrophic
bacteria (Pfennig and Truper, 1983; Yurkov and Beatty, 1998). Another phenomenon was
observed for some bacterial OTUs (T-RF 137 and 192 bp) performing a spatial clustering
from oxic to a precise anoxic zone of the mat at night, suggesting an aggregation of the
population in a narrow zone. The marine purple non sulfur bacteria Roseospira marina (T-RF
137 bp) was described by (Guyoneaud et al., 2002) as highly motile and unable to respire or
ferment under dark anoxic conditions. The aggregation could be considered as a behavior to
protect the cell integrity. Oxygen is toxic for obligate anoxyphototrophic bacteria; therefore
these bacteria react by a negative chemotactic response (Armitage et al., 1979). This could be
the behavior of T-RFs 114, 148 and 187 bp keeping only anoxic zonation in the mat whatever
the diel cycle period.
In conclusion, the phototrophic bacterial structure within the Camargue mat showed a
great dynamic during a diel cycle induced by several fluctuating environmental stimuli.
Energy taxis seems to have an important ecological role on the vertical stratification of
bacterial communities through the microbial mat.
149

IV. Dynamique verticale des populations bactériennes en fonction des fluctuations physico-chimiques d’un cycle nycthéméral
ACKNOWLEDGMENTS
We acknowledge the financial support by the EC (MATBIOPOL project, grant
EVK3-CT-1999-00010). The authors are grateful to the Company of Salins-du-midi at Salins-
de-Giraud for facilitating access to the salterns, sampling and field experiments. AF is partly
supported by a doctoral grant from the general council of Atlantic Pyrenees. Hervé
REMIGNON from ENSAT (Toulouse- France) is gratefully thanked for the technical support.
150
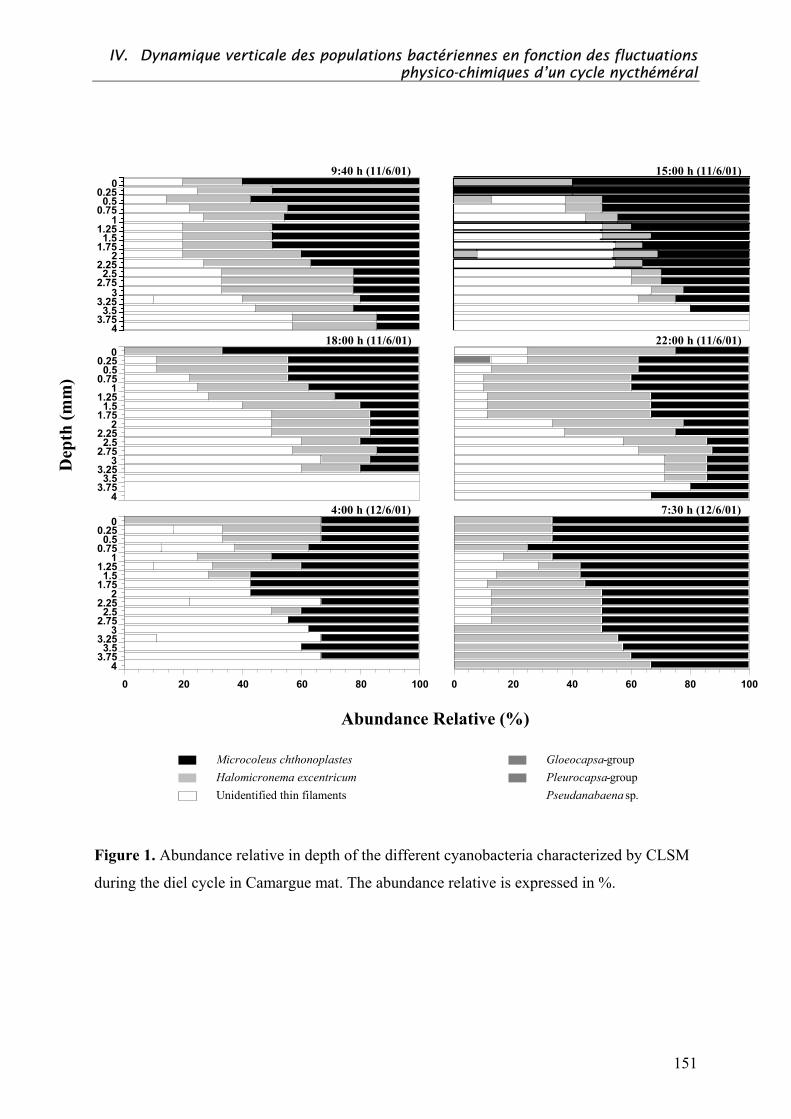
IV. Dynamique verticale des populations bactériennes en fonction des fluctuations physico-chimiques d’un cycle nycthéméral
151
Figure 1. Abundance relative in depth of the different cyanobacteria characterized by CLSM
during the diel cycle in Camargue mat. The abundance relative is expressed in %.
22:00 h (11/6/01)0
0.25 0.5 0.75 1
1.25 1.5 1.75 2
2.25 2.5 2.75 3
3.25 3.5 3.75 4
0 20 40 60 80 100
0 0.25 0.5 0.75 1
1.25 1.5 1.75 2
2.25 2.5 2.75 3
3.25 3.5 3.75 4
0 20 40 60 80 100
0 0.25 0.5 0.75 1
1.25 1.5 1.75 2
2.25 2.5 2.75 3
3.25 3.5 3.75 4
Microcoleus chthonoplastes
Halomicronema excentricum
Unidentified thin filaments
Gloeocapsa - group Pleurocapsa - group Pseudanabaena sp .
Abundance Relative (%)
9:40 h (11/6/01)
7:30 h (12/6/01)4:00 h (12/6/01)
18:00 h (11/6/01)
15:00 h (11/6/01)
Dep
th (
mm
)

IV. Dynamique verticale des populations bactériennes en fonction des fluctuations physico-chimiques d’un cycle nycthéméral
gure 2. Confocal image of Microcoleus chthonoplastes forming bundles of filaments.
Fi
152
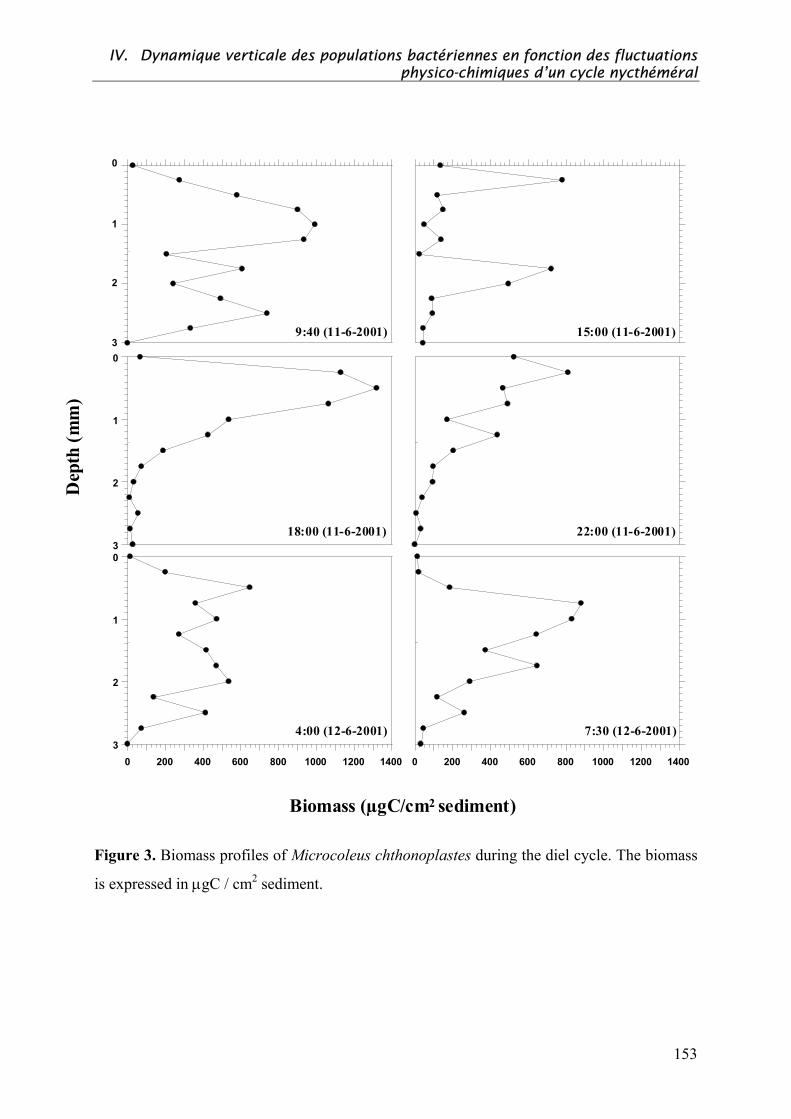
IV. Dynamique verticale des populations bactériennes en fonction des fluctuations physico-chimiques d’un cycle nycthéméral
153
Figure 3. Biomass profiles of Microcoleus chthonoplastes during the diel cycle. The biomass
is expressed in µgC / cm2 sediment.
0
1
2
3
0
1
2
0 200 400 600 800 1000 1200 1400
1
2
3
0 200 400 600 800 1000 1200 1400
Biomass (µgC/cm2 sediment)
9:40 (11-6-2001) 15:00 (11-6-2001)
7:30 (12-6-2001)4:00 (12-6-2001)
18:00 (11-6-2001) 22:00 (11-6-2001)
Dep
th (
mm
)
3
0
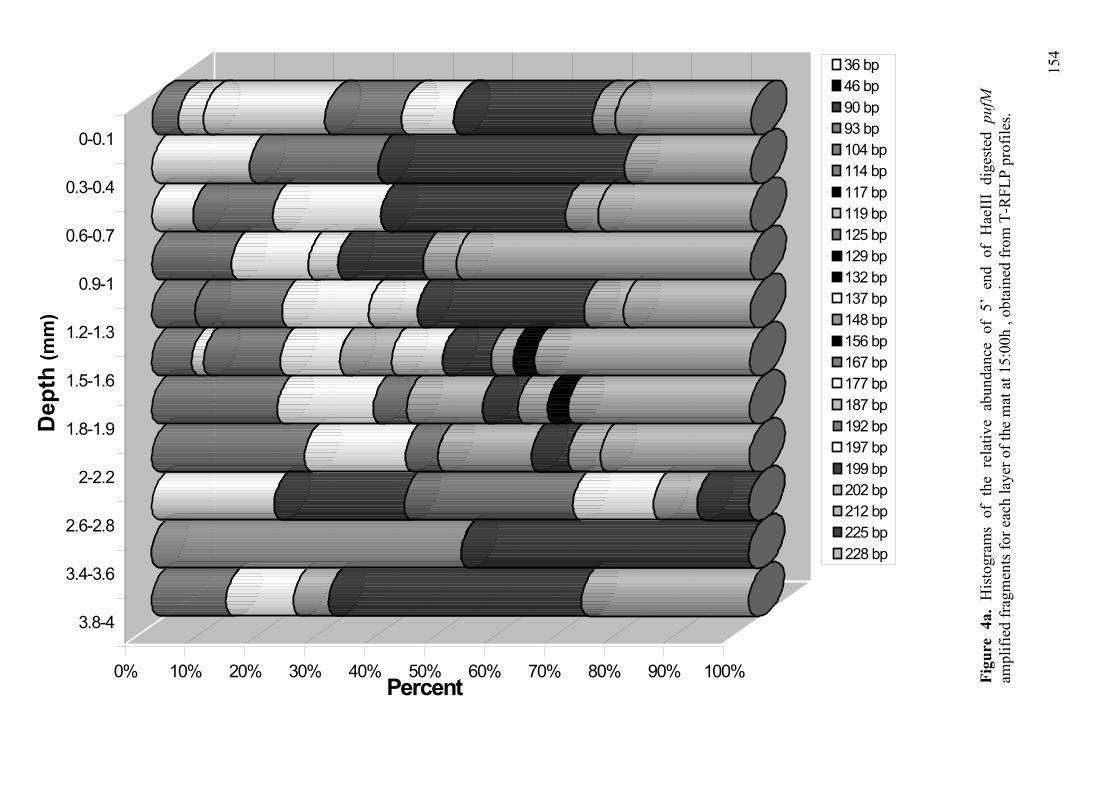
154
Fig
ure
4
a.
His
tog
ram
s o
f th
e re
lati
ve
abu
nd
ance
o
f 5
’ en
d
of
Hae
III
dig
este
d pufM
amp
lifi
ed f
rag
men
ts f
or
each
lay
er o
f th
e m
at a
t 1
5:0
0h
, o
bta
ined
fro
m T
-RF
LP
pro
file
s.
0% 10% 20% 30% 40% 50% 60% 70% 80% 90% 100%Percent
0-0.1
0.3-0.4
0.6-0.7
0.9-1
1.2-1.3
1.5-1.6
1.8-1.9
2-2.2
2.6-2.8
3.4-3.6
3.8-4
De
pth
(m
m)
36 bp
46 bp
90 bp
93 bp
104 bp
114 bp
117 bp
119 bp
125 bp
129 bp
132 bp
137 bp
148 bp
156 bp
167 bp
177 bp
187 bp
192 bp
197 bp
199 bp
202 bp
212 bp
225 bp
228 bp
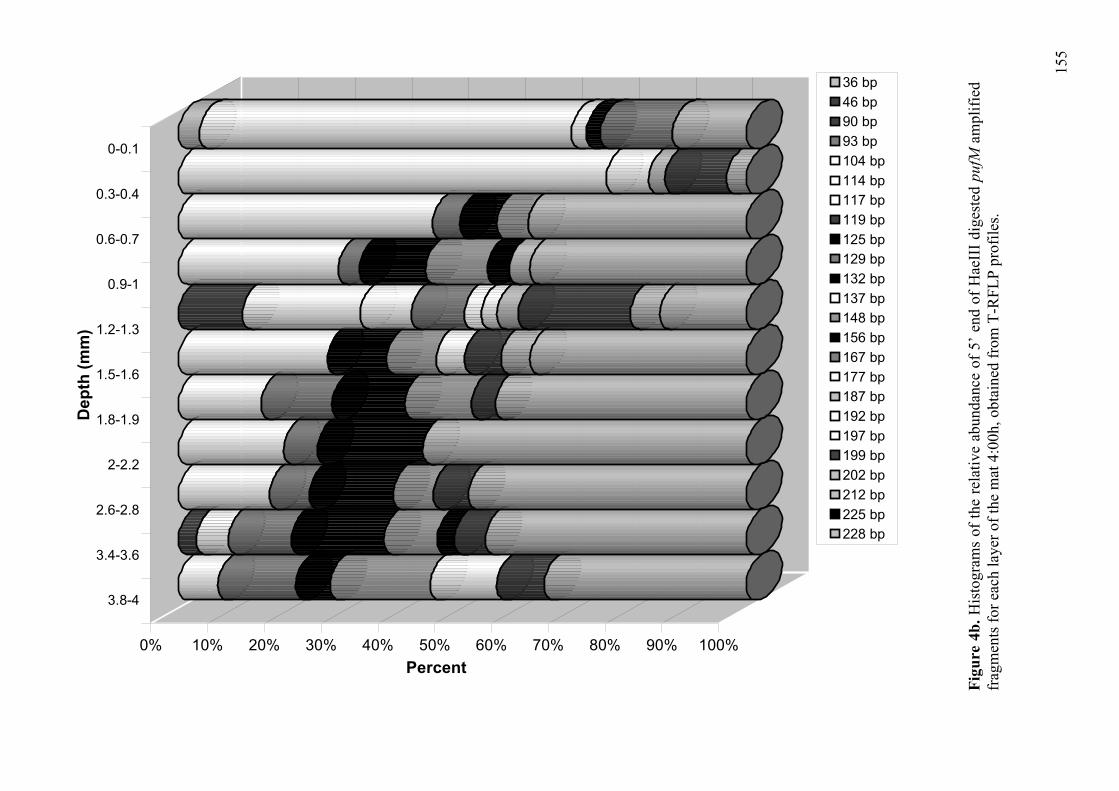
155
Fig
ure
4b
. H
isto
gra
ms
of
the
rela
tiv
e ab
un
dan
ce o
f 5
’ en
d o
f H
aeII
I d
iges
ted
pufM
am
pli
fied
frag
men
ts f
or
each
lay
er o
f th
e m
at 4
:00
h,
ob
tain
ed f
rom
T-R
FL
P p
rofi
les.
0% 10% 20% 30% 40% 50% 60% 70% 80% 90% 100%
Percent
0-0.1
0.3-0.4
0.6-0.7
0.9-1
1.2-1.3
1.5-1.6
1.8-1.9
2-2.2
2.6-2.8
3.4-3.6
3.8-4
Dep
th (
mm
)36 bp
46 bp
90 bp
93 bp
104 bp
114 bp
117 bp
119 bp
125 bp
129 bp
132 bp
137 bp
148 bp
156 bp
167 bp
177 bp
187 bp
192 bp
197 bp
199 bp
202 bp
212 bp
225 bp
228 bp
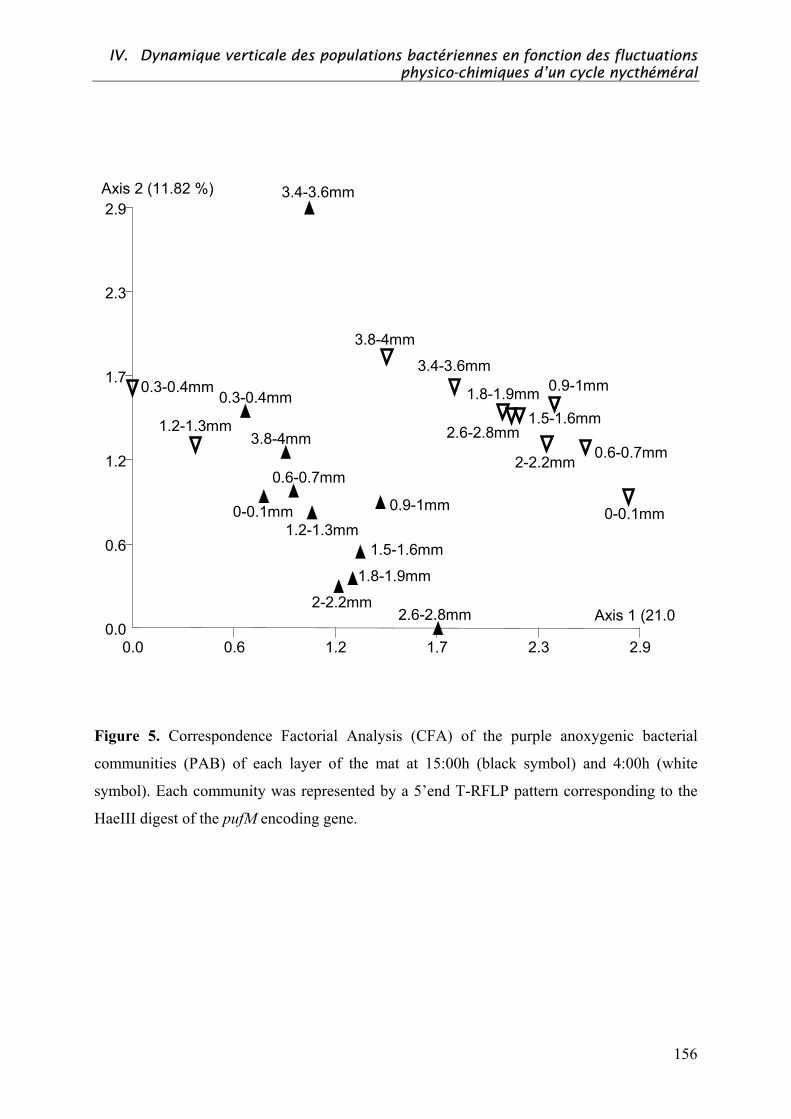
IV. Dynamique verticale des populations bactériennes en fonction des fluctuations physico-chimiques d’un cycle nycthéméral
igur 5. C espo ence actor l An ysis FA) f the urple anoxy
7%)7%)
Axis 2 (11.82 %)
Axis 1 (21.0
0-0.1mm
0.3-0.4mm
0.6-0.7mm
0.9-1mm
1.2-1.3mm
1.5-1.6mm
1.8-1.9mm
2-2.2mm2.6-2.8mm
3.4-3.6mm
3.8-4mm
0-0.1mm
0.3-0.4mm
0.6-0.7mm
0.9-1mm
1.2-1.3mm1.5-1.6mm
1.8-1.9mm
2-2.2mm
2.6-2.8mm
3.4-3.6mm
3.8-4mm
0.0
0.6
1.2
1.7
2.3
2.9
0.0 0.6 1.2 1.7 2.3 2.9
Axis 2 (11.82 %)
Axis 1 (21.0
0-0.1mm
0.3-0.4mm
0.6-0.7mm
0.9-1mm
1.2-1.3mm
1.5-1.6mm
1.8-1.9mm
2-2.2mm2.6-2.8mm
3.4-3.6mm
3.8-4mm
0-0.1mm
0.3-0.4mm
0.6-0.7mm
0.9-1mm
1.2-1.3mm1.5-1.6mm
1.8-1.9mm
2-2.2mm
2.6-2.8mm
3.4-3.6mm
3.8-4mm
0.0
0.6
1.2
1.7
2.3
2.9
0.0 0.6 1.2 1.7 2.3 2.9
F e orr nd F ia al (C o p genic bacterial
ommunities (PAB) of each layer of the mat at 15:00h (black symbol) and 4:00h (white
c
symbol). Each community was represented by a 5’end T-RFLP pattern corresponding to the
HaeIII digest of the pufM encoding gene.
156
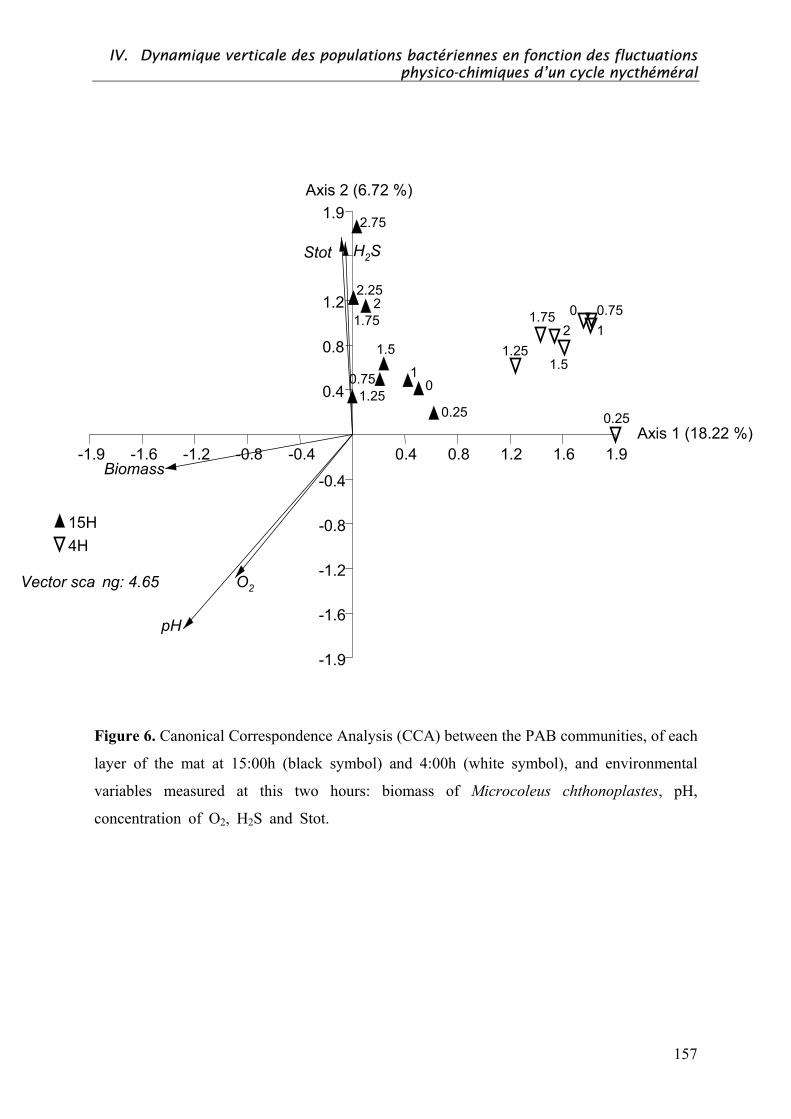
IV. Dynamique verticale des populations bactériennes en fonction des fluctuations physico-chimiques d’un cycle nycthéméral
lili
Figure 6. Canonical Correspondence Analysis (CCA) between the PAB communities, of each
layer of the mat at 15:00h (black symbol) and 4:00h (white symbol), and environmental
variables measured at this two hours: biomass of Microcoleus chthonoplastes, pH,
concentrationaofaO2,aH2SaandaStot.
15H
4H
Axis 2 (6.72 %)
Axis 1 (18.22 %)
0
0.25
0.751
1.25
1.5
1.75
22.25
2.75
0
0.25
0.75
1
1.251.5
1.752
-0.4
-0.8
-1.2
-1.6
-1.9
0.4
0.8
1.2
1.9
-0.4-0.8-1.2-1.6-1.9 0.4 0.8 1.2 1.6 1.9
O2
H2SStot
pH
Biomass
Vector sca ng: 4.65
15H
4H
Axis 2 (6.72 %)
Axis 1 (18.22 %)
0
0.25
0.751
1.25
1.5
1.75
22.25
2.75
0
0.25
0.75
1
1.251.5
1.752
-0.4
-0.8
-1.2
-1.6
-1.9
0.4
0.8
1.2
1.9
-0.4-0.8-1.2-1.6-1.9 0.4 0.8 1.2 1.6 1.9
O2
H2SStot
pH
Biomass
Vector sca ng: 4.65
157
IV. Dynamique verticale des populations bactériennes en fonction des fluctuations physico-chimiques d’un cycle nycthéméral
REFERENCES
bed, R.M., García-Pichel, F., and Hernández-Mariné, M. (2002) Polyphasic characterization
of benthic, moderately halophilic, moderately thermophilic cyanobacteria with very thin
trichomes and the proposal of Halomicronema excentricum gen. nov., sp. nov. Arch.
icrobiol. 177: 361-370.
chenbach, L.A., Carey, J., and Madigan, M.T. (2001) Photosynthetic and phylogenetic
rimers for detection of anoxygenic phototrophs in natural environments. Appl. Environ.
icrobiol. 67: 2922-2926.
lexandre, G., Greer-Phillips, S., and Zhulin, I.B. (2004) Ecological role of energy taxis in
icroorganisms. FEMS Microbiol. Rev. 28: 113-126.
rmitage, J.P., Keighley, P., and Evans, M.C.W. (1979) Chemotaxis in photosynthetic
acteria. FEMS Microbiol. Lett. 6: 99-102.
ebout, B., and Garcia-Pichel, F. (1995) UV B-induced vertical migrations of cyanobacteria
in a microbial mat. Appl. Environ. Microbiol. 61: 4215-4222.
Campbell, S.E. (1979) Soil stabilization by a prokaryotic desert crust: implications for
Precambrian land biota. Orig. Life 9: 335-348.
Caumette, P., Matheron, R., Raymond, N., and Relexans, J.C. (1994) Microbial mats in the
ypersaline ponds of Mediterranean salterns (Salins-de-Giraud, France). FEMS Microbiol.
col. 13: 273-286.
ohen, Y., Jorgensen, B.B., Padan, E., and Shilo, M. (1986) Adaptation to hydrogen sulfide
f oxygenic and anoxygenic photosynthesis among cyanobacteria. Appl. Environ. Microbiol.
1: 398-407.
'Amelio, E.D., Cohen, Y., and Des Marais, D.J. (1987) Association of a new type of gliding,
Decho, A.W. (1990) Microbial exopolymer secretions in ocean environments: their role(s) in
food webs and marine process. Oceanogr. Mar. Biol. Ann. Rev. 28: 73-153.
Esteve, I., Martínez, M., Mir, J., and Guerrero, R. (1992) Typology and structure of microbial
mats communities in Spain: A preliminary study. Limnetica 8: 185-195.
Ferris, M.J., Muyzer, G., and Ward, D.M. (1996) Denaturing gradient gel electrophoresis
profiles of 16S rRNA-defined populations inhabiting a hot spring microbial mat community.
Appl. Environ. Microbiol. 62: 340-346.
A
M
A
p
M
A
m
A
b
B
h
E
C
o
5
D
filamentous, purple phototrophic bacterium inside bundles of Microcoleus chthonoplastes in
hypersaline cyanobacterial mats. Arch. Microbiol. 147: 213-220.
De Wit, R., and Van Gemerden, H. (1987) Oxidation of sulfide to thiosulfate by Microcoleus
chtonoplastes. FEMS Microbiol. Lett. 45: 7-13.
158
IV. Dynamique verticale des populations bactériennes en fonction des fluctuations physico-chimiques d’un cycle nycthéméral
Fourçans, A., García de Oteyza, T., Wieland, A., Solé, A., Diestra, E., van Bleijswijk, J. et al.
n desert
.
60:
and in a laboratory scale saltern model.
. (1993) Distribution of types of microbial mats
-Rea, A., Willison, J. et al.
oastal
ats: emended description of the genus
) MVSP - a Multivariate Statistical Package for Windows. In. Wales
stress in a cyanobacterial mat. FEMS Microbiol. Ecol. 25: 89-96.
lfidic Habitats. Appl. Environ. Microbiol. 70:
duction in the
(2004) Characterization of functional bacterial groups in a hypersaline microbial mat
community (Salins-de-Giraud, Camargue, France). FEMS Microbiol. Ecol. in press.
Garcia-Pichel, F., and Pringault, O. (2001) Microbiology. Cyanobacteria track water i
soils. Nature 413: 380-381
García-Pichel, F., Mechling, M., and Castenholz, R.W. (1994) Diel migrations of
microorganisms within a benthic, hypersaline mat community. Appl. Environ. Microbiol.
1500-1511.
Giani, D., Seeler, J., Giani, L., and Krumbein, W.E. (1989) Microbial mats and
physicochemistry in a saltern in the Bretagne (France)
FEMS Microbiol. Ecol. 62: 151-162.
Guerrero, R., Urmeneta, J., and Rampone, G
at the Ebro Delta, Spain. Biosystems 31: 135-144.
Guyoneaud, R., Moune, S., Eatock, C., Bothorel, V., Hirschler
(2002) Characterization of three spiral-shaped purple nonsulfur bacteria isolated from c
lagoon sediments, saline sulfur springs, and microbial m
Roseospira and description of Roseospira marina sp. nov., Roseospira navarrensis sp. nov.,
and Roseospira thiosulfatophila sp. nov. Arch. Microbiol. 178: 315-324.
Kovach, W.L. (1999
U.K.: Kovack Computing Services.
Krekeler, D., Teske, A., and Cypionka, H. (1998) Strategies of sulfate-reducing bacteria to
escape oxygen
Liu, W.T., Marsh, T.L., Cheng, H., and Forney, L.J. (1997) Characterization of microbial
diversity by determining terminal restriction fragment length polymorphisms of genes
encoding 16S rRNA. Appl. Environ. Microbiol. 63: 4516-4522.
Miller, S.R., and Bebout, B.M. (2004) Variation in Sulfide Tolerance of Photosystem II in
Phylogenetically Diverse Cyanobacteria from Su
736-744.
Moezelaar, R., Bijvank, S.M., and Stal, L. (1996) Fermentation and sulfur re
mat-building cyanobacterium Microcoleus chthonoplastes. Appl. Environ. Microbiol.: 1752-
1758.
159
IV. Dynamique verticale des populations bactériennes en fonction des fluctuations physico-chimiques d’un cycle nycthéméral
Nelson, D.C., Revsbech, N.P., and Jorgensen, B.B. (1986a) Microoxic-anoxic niche of
Beggiatoa spp. : microelectrode survey of marine and freshwater strains. Appl. Environ
Microbiol. 52: 161-168.
.
sp. in oxygen-sulfide microgradients. Appl. Environ. Microbiol.
a (blue-green algae) and tobacco chloroplasts. Biochimica et Biophysica Acta
ciated with black-band disease of corals. Microb. Ecol.
f cyanobacteria in an annual
y as a tool to determine cyanobacteria biomass in microbial mats. J. Microscopy
oleus chthonoplastes filaments in Ebro delta microbial mats by means of CLSM.
Biology of the Cell 93: 348.
Nelson, D.C., Jorgensen, B.B., and Revsbech, N.P. (1986b) Growth pattern and yield of a
chemoautotrophic Beggiatoa
52: 225-233.
Oren, A., Padan, E., and Malkin, S. (1979) Sulfide inhibition of Photosystem II in
cyanobacteri
(BBA) - Bioenergetics 546: 270-279.
Pfennig, N. (1975) The phototrophic bacteria and their role in the sulfur cycle. Plant and Soil
43: 1-16.
Pfennig, N., and Truper, H.G. (1983) Taxonomy of phototrophic green and purple bacteria: a
review. Ann Microbiol (Paris) 134B: 9-20.
Pringault, O., and Garcia-Pichel, F. (2003) Hydrotaxis of cyanobacteria in desert crusts.
Microb. Ecol. 12: 12.
Revsbech, N.P., Jorgensen, B.B., Blackburn, T.H., and Cohen, Y. (1983) Microelectrode
studies of the photosynthesis and O2, H2S and pH profiles of a microbial mat. Limnol.
Oceanogr. 28: 1062-1074.
Richardson, L.L. (1996) Horizontal and vertical migration patterns of Phormidium
corallyticum and Beggiatoa spp. asso
32: 323-335.
Richardson, L.L., and Castenholz, R.W. (1987) Diel vertical movements of the
cyanobacterium Oscillatoria terebriformis in a sulfide-rich microbial mat. Appl. Environ.
Microbiol. 53: 2142-2150.
Solé, A., Gaju, N., and Esteve, I. (2003) The biomass dynamics o
cycle determined by confocal laser scanning microscopy. Scanning 25: 1-7.
Solé, A., Gaju, N., Mendez-Alvarez, S., and Esteve, I. (2001a) Confocal laser scanning
microscop
204: 258-261.
Solé, A., Munill, X., Llirós, M., Diestra, E., and Esteve, I. (2001b) Migration studies of
Microc
160
IV. Dynamique verticale des populations bactériennes en fonction des fluctuations physico-chimiques d’un cycle nycthéméral
Stal, L.J. (1994) Microbial mats in coastal environments. In Microbial Mats. Stal, L.J., a
Caumette, P. (eds). Berlin Heidelberg: Springer-Verlag, pp. 21-32.
Stal, L.J., and Krumbein,
nd
W.E. (1985) Isolation and characterization of cyanobacteria from a
cteria. Annu. Rev. Microbiol. 53: 103-128.
ohen, Y.
iol. 64: 2943-2951.
d sulfide. Appl. Environ. Microbiol. 67: 5410-5419.
) Coexistence of Chlorobium and Chromatium in
by, A.E. (1984) Motility of the cyanobacterium Microcoleus
ich
Camargue, France). Microb. Ecol. in press.
icrobiol
marine microbial mat. Bot. Mar. 28: 351-365.
Taylor, B.L., Zhulin, I.B., and Johnson, M.S. (1999) Aerotaxis and other energy-sensing
behavior in ba
Teske, A., Ramsing, N.B., Habicht, K., Fukui, M., Kuver, J., Jørgensen, B.B., and C
(1998) Sulfate-reducing bacteria and their activities in cyanobacterial mats of solar lake
(Sinai, Egypt). Appl. Environ. Microb
Thar, R., and Kuhl, M. (2001) Motility of Marichromatium gracile in response to light,
oxygen, an
van Gemerden, H. (1993) Microbial mats : A joint venture. Mar. Geol. 113: 3-25.
van Gemerden, H., and Beeftink, H.H. (1981
a sulfide-limited continuous culture. Arch. Microbiol. 129: 32-34.
Whale, G.F., and Wals
chthonoplastes in mud. Phycol. J. 19: 117-123.
Wieland, A., Zopfi, J., Benthien, M., and Kühl, M. (2003) Biogeochemistry of an iron-r
hypersaline microbial mat (
Yurkov, V.V., and Beatty, J.T. (1998) Aerobic anoxygenic phototrophic bacteria. M
Mol Biol Rev 62: 695-724.
161
IV. Dynamique verticale des populations bactériennes en fonction des fluctuations physico-chimiques d’un cycle nycthéméral
IV.3. Bactéries sulfato-réductrices
Cet article est en préparation sous le titre :
Hypersaline microbial mat: vertical migration of sulfate reducing bacteria along a diel
cycle.
Par : Aude Fourçans1, Anthony Ranchou-Peyruse
1, Pierre Caumette
1 et Robert Duran
1
The spatio-temporal distribution of sulfate-reducing bacteria was investigated in the
microbial mat of Camargue (Salins-de-Giraud) over a diel cycle. This study was performed in
order to appreciate the impact of fluctuating environmental parameters (light, temperature,
pH, H S and oxygen) on the bacterial communities structure of this hypersaline mat. T-RFLP
analysis on the 16S rDNA gene revealed an important dynamic of all eubacteria developing
inside the four millimeters of the microbial mat. The combination of T-RFLP and 16S rDNA
libraries analysis revealed similar conclusions concerning diel behavior of sulfate-reducing
bacteria. Three genera Desulfococcus, Desulfonema, and Desulfosarcina showed two major
movements in the mat. Three distinct OTUs migrated downward in the mat at daytime, while
eight others OTUs moved upward. Particularly, Desulfonema sp. (T-RF 110 bp) and
Desulfosarcina variabilis (T-RF 286 bp) were among the species migrating upward. In the
same way, when we focused on the genus Desulfobacter two OTUs showed different
behaviors. The OTU (157 bp) affiliated to new species of Desulfobacter stayed immobile
independently of the diel microgradients. While the OTU (306 bp) related to the recently
described Desulfotignum genus, showed a vertical downward migration to sulfidic zone when
light and oxygen penetrate the first millimeter. Thus the results suggest that the migration is
probably controlled by aero- and chemotaxis mechanisms.
1Laboratoire d`Ecologie Moléculaire EA 3525, Université de Pau et des Pays de l`Adour,
avenue de l`Université, BP 1155, F-64013 Pau Cedex, France
ABSTRACT
2
162
IV. Dynamique verticale des populations bactériennes en fonction des fluctuations physico-chimiques d’un cycle nycthéméral
INTRODUCTION
fine vertically laminated structures where sharp
nvironmental micro-gradients influence the distribution of few functional groups of
microorganisms (van Gemerden, 1993). This kind of ecosystems develops under habitats as
alterns (Caumette et al., 1994; Fourçans et al., 2004b; Giani et al., 1989), intertidal
,
000). The development of a microbial mat is a result of bacterial growth and its
activities. Among diverse metabolic processes coexisting in hypersaline
microb
rçans et al., 2004b). Phototrophic
ommunities, oxygenic and anoxygenic, of this mat exhibited dynamic behavior in response
diel microgradients changes (Fourçans et al., 2004a). Furthermore during the same diel
ycle, Wieland et al. (2003a) established that inside this studied mat sulfate reduction rates
ere significantly higher in day than in night. With all these informations, the analysis of the
b
eters. The main objective of
Microbial mats are described as
e
diverse as hot springs (Ferris et al., 1997; Ramsing et al., 2000; Ruff-Roberts et al., 1994),
s
sediments (Wieland et al., 2003b) or alkaline lake (Namsaraev et al., 2003; Sorokin et al.
2
corresponding
ial mats, dissimilatory sulfate reduction is the dominant process of anaerobic carbon
mineralization independently of depth and oxygen presence (Canfield & Des Marais, 1991;
Fründ & Cohen, 1992; Jørgensen, 1994).
Due to the compact nature of a microbial mat, coexistence of all biological activities
generate microgradients inside the mat (Revsbech et al., 1983). During the diel cycle, these
gradients dramatically change, exposing bacteria to extremely variable conditions. Migration
into the mat is one of the strategies developed by some microorganisms to fight against
perpetual variations of environmental conditions (light, temperature, pH, sulfur concentration,
and oxygen availability). By this mechanism bacteria escape from extreme conditions and
therefore can benefit of optimal conditions for their development. This migration process has
been described for several bacteria (Nelson et al., 1986; Richardson, 1996; Richardson &
Castenholz, 1987; Teske et al., 1998; Whale & Walsby, 1984).
Camargue microbial mat of Salins-de-Giraud have been fully described since ten years
(Caumette et al., 1994; Fourçans et al., 2004a; Fourçans et al., 2004b; Mouné et al., 2003;
Wieland et al., 2003a). This mat is characterized by high iron content (Wieland et al., 2003a)
and a high bacterial diversity, where purple and sulfate-reducing bacteria are organized in fine
scale depth vertical distribution along microgradients (Fou
c
to
c
w
acterial communities structures would be of special interest to describe bacterial behavior in
response to diel fluctuation of different physico-chemical param
163
IV. Dynamique verticale des populations bactériennes en fonction des fluctuations physico-chimiques d’un cycle nycthéméral
this study is to characterize the spatial distribution of sulfate-reducing communities within
amargue microbial mat along the diel cycle. As preliminary approach, using T-RFLP
Fragment Length Polymorphism) method we investigated the whole
eubacte
2 2
nitrogen, transported on dry
ice and
distribution of microbial communities for each depth was first performed using the T-RFLP
millimeters were analyzed to characterize bacterial communities.
C
(Terminal Restriction
rial population. Then, we constructed 16S rDNA libraries, and in combination with
T-RFLP analysis we fully described the behavior of SRB communities. Few genera of these
communities including Desulfococcus, Desulfonema, Desulfosarcina and Desulfobacter
involved in the sulfur cycle, were especially considered.
MATERIAL AND METHODS
General informations
This analysis was realized on the microbial mat of the Salins-de-Giraud saltern over a diel
cycle in June of the year 2001. In parallel, in situ microsensor measurements (O , H S, pH)
were realized ((Wieland et al., 2003a). This mat presents salinity between 70 ‰ to 110 ‰
(w/v) (Fourçans et al., 2004b).
Sampling procedure
Microbial mats were sampled from a very large shallow pond at the saltern of Salins-de-
Giraud, close to the sand barrier and seacoast in the Camargue area, France. Several samples
were collected at different times (9:40, 15:00h, 18:00h, 22:00h, 4:00h, and 7:30h) over a diel
cycle from 11 to 12 June 2001.
For T-RFLP analysis, at time 15:00h, 4:00h, and 22:00h triplicates samples of mat cores (35
mm i.d.) were sampled with falcon tubes. The upper 10 mm of the mat core was sliced off
aseptically, transferred into sterile Petri dishes, frozen in liquid
finally stored at –80°C until further analysis. These frozen mat samples were sliced,
with a cryomicrotome, at about 100 µm thick for the 2 first millimeters, and 200 µm thick for
the 2 next millimeters. Genomic DNA was extracted from these different slices and vertical
method, and secondly by cloning and sequencing. According to the results of microsensor
measurements (Wieland et al., 2003a), samples for only 11 slices within the fourth
T-RFLP analysis (terminal restriction fragment length polymorphism)
164
IV. Dynamique verticale des populations bactériennes en fonction des fluctuations physico-chimiques d’un cycle nycthéméral
From each mat slice, genomic DNA was extracted with the UltraClean Soil DNA Isolation
Kit (MoBio Laboratories,USA), according to the recommendations of the supplier; except for
the first step where 10mM EDTA were added to avoid degradation of genomic DNA. All
extracted genomic DNA samples were stored at -20°C until further processing. For T-RFLP
analysis (Liu et al., 1997), the 16S rRNA encoding genes of bacterial population were
amplified using fluorescent-labeled primers.
Different primers were used to assess the eubacterial community structure of the mat (Table
). To target the whole eubacterial community, a “direct” PCR reaction with the eubacterial
; Weisburg et al., 1991) was performed, amplifying a large
encoding gene (16S rDNA gene). In the same way, to obtain
to detect SRB (Sulfate-Reducing Bacteria) present in lower
umbers in the four millimeters of the mat. The first set (DCC305F-DCC1165R) targets
rDNA gene of the three genera Desulfococcus, Desulfonema,
on Fragments) superior to 100 fluorescent units and present in
1
primer pair 8f-1489r (Lane, 1991
part of the 16S rRNA
fingerprints of sulfate-reducing bacterial populations, different couples of primers (Table1)
targeting few genera of sulfate-reducing bacteria were used (Daly et al., 2000). A “nested”
PCR amplification was performed using amplified DNA of the “direct” PCR (obtained with
eubacterial primers) as template
n
specifically the 16S
Desulfosarcina. And the second pair (DSB127F- DSB1273R) was described to target only the
genus Desulfobacter. Forward (f) primers were fluorescently labeled with TET fluorochrome.
Restriction enzymes used in T-RFLP analysis were HaeIII or Hin6I (New England Biolabs,
UK). T-RFs (Terminal Restricti
each triplicate were selected. The clustering values were analyzed with the T-RFLP similarity
matrix on the RDP (Ribosomal Database Project) web site (http://rdp.cme.msu.edu/; Maidak
et al., 2001). The obtained distance matrix was used to construct a dendrogram with MEGA
version 2.1 (Kumar et al., 2001) by the Neighbour Joining (NJ) method. Predicted digestions
were realized on 16S rDNA database of RDP web site using the program TAP-TRFLP.
16S rDNA library construction and analysis
Genomic DNA from mat slices was used to amplify the 16S rDNA gene with the
Desulfobacter spp. primers (unlabeled) presented in Table1. These PCR products were cloned
in E. coli with the Topo TA cloning kit (Invitrogen). For each slice analyzed, de novo PCR
roduct of the insert from one hundred clones were digested with HaeIII or Hin6I enzymes.
oresis with a high-
p
Restriction profiles were analyzed on a 2.5% agarose gel electroph
165
IV. Dynamique verticale des populations bactériennes en fonction des fluctuations physico-chimiques d’un cycle nycthéméral
resolution agarose (Metaphor, Tebu-bio). The comparison of all these restriction profiles
allows the evaluation of major populations in each slice.
16S rDNA Sequences
Topo PCR2.1 vector (Invitrogen) containing 16S rDNA PCR products were extracted from
Eubacterial distribution in the mat over a diel cycle
and day (15:00h) conditions. T-RFLP profiles (data not shown) revealed high numbers of
when environmental physico-chemical conditions are opposite. Communities of the deep
layer (3.8–4 mm) were completely different between the considered times since they
structure of night layers from 1.5-2.2 mm was close to that of the day layers of 0.3-0.7 mm.
ulfate-reducing bacteria distribution over a diel cycle
Distribution of Desulfococcus, Desulfonema and Desulfosarcina genera
Desulfonema, and Desulfosarcina, with specific primers (Table 1). From these less complex
Three OTUs (101, 122, and 127 bp) of these genera were observed in deepest layers at 15:00h
than at 4:00h. However, SRB OTUs of 101 and 127 bp kept in anoxic zones inside the mat
clones. From these plasmids, whole sequences of the 16S rDNA genes were determined by
primer walking (Biofidal, France). All 16S rDNA sequences were aligned on clustalX
software (Thompson et al., 1997) with 16S rDNA sequences of type strains. From this
alignment, phylogenetic tree was constructed by the NJ method with Mega v2.1 software
(Kumar et al., 2001).
RESULTS
The distribution of mat eubacterial communities is represented by a similarity dendrogram
(Figure 1) obtained from complex T-RFLP profiles performed on each slice of night (4:00h)
OTUs (Operational Taxonomic Units), lower at 4:00h (38 T-RFs) than at 15:00h (50 T-RFs).
This dendrogram shows clearly a different distribution of eubacterial communities in the mat
presented 85 % of divergence. On the other hand, eubacterial communities of the night layers
from 2.6 to 4 mm were closely related to day layers from 1.5 to 2.2mm. Likewise, eubacteria
S
In order to observe precisely the spatio-temporal distribution of sulfate-reducing bacteria over
a diel cycle, we performed the T-RFLP analysis targeting only the genera Desulfococcus,
T-RFLP patterns, we have summarized in Figure 2 only the common HaeIII
T-RFs (same OTUs obtained at each hour) in order to compare their localization in each layer.
166
IV. Dynamique verticale des populations bactériennes en fonction des fluctuations physico-chimiques d’un cycle nycthéméral
while the SRB OTU of 122 bp was observed in oxic surface layer during the night and in
deepest anoxic layer when day occurred. Inversely, eight SRB OTUs (108, 109, 110, 121,
94, 280, and 286 bp) were present in upper layers during the afternoon than during the night.
or several of them they often presented a zonation in oxic layer at 15:00h and anoxic at
tions of 16S rDNA sequences available indicated that OTU of 110 bp
wo major interesting SRB populations (Figure 3). Indeed, OTU of 157
p (HaeIII digestion) was localized along the 4 mm of the mat in both night and day
ndependently of the presence of oxygen. Contrariwise, a second OTU of 306 bp
1.6 mm of the mat during the night at
e
f the mat, the major SRB population was present at 37 %, and was related by predictive
bp. The SRB population related to
. In the same layer at
1
F
4:00h. Predictive diges
could correspond to Desulfonema, and OTU of 286 bp to Desulfosarcina variabilis.
Distribution of Desulfobacter genus
Another primer set targeting only species of the genus Desulfobacter (Daly et al., 2000) was
used to investigate their spatio-temporal distribution in the mat over a diel cycle. T-RFLP
fingerprints revealed t
b
conditions, i
(HaeIII digestion) was observed precisely in the 0-
4:00h, and at noon only on the 1.2-4 mm of the mat, i.e., in the anoxic zone. Predictive HaeIII
T-RFLP patterns of SRB 16S rDNA sequences showed that the OTU of 157 bp could
correspond to all Desulfobacter species so far described. Moreover, the OTU of T-RF 306 bp
could correspond to another genus recently described, Desulfotignum (Kuever et al., 2001),
close to Desulfobacter genus.
To confirm these results and further characterize these two populations, 16S rDNA libraries
were constructed allowing the inventory of the SRB inhabiting the first and last slices of the
mat at 4:00h and 15:00h. Clones of the libraries were grouped in function of their HaeIII and
Hin6I RFLP patterns. The comparison of all the restriction profiles obtained is summarized on
a histogram representing share of each diverse population (Figure 4). At 4:00h in the surfac
o
HaeIII digestion to the previously observed OTU of 306
the OTU of 157 bp was also present in this layer but less abundant (11%)
noon (15:00h), proportions of these populations were inverted, since major SRB population
corresponded to OTU of 157 bp (49.5%), while SRB OTU of 306 bp was minor (4.5%). The
same observation was done for the deep layer (3.8-4 mm) in the night, showing OTU of 157
bp also dominant in comparison to the OTU of 306 bp. In this same layer at day, restriction
profiles revealed that SRB OTU of 306 bp was again the most important population.
167
IV. Dynamique verticale des populations bactériennes en fonction des fluctuations physico-chimiques d’un cycle nycthéméral
To further characterize the Desulfobacter communities observed in these layers, 16S rDNA
sequences of clones corresponding to these 2 communities were determined. As expected all
the clones sequenced were affiliated to the genus Desulfobacter (Figure 5). However, in
accordance with T-RFLP results, clones A4-1-70 and A15-30-10 corresponding to the OTU
of 306 bp were affiliated to the genus Desulfotignum showing 96 and 94 % similarity
respectively. The phylogenic analysis of clones related to the OTU of 157 bp revealed the
resence of several species within this SRB population. Clone A4-1-6 was closely related to
A15-1-2, A15-30-22, and A4-30-2 may constitute new
since they were always located in anoxic zone. Moreover they
itions of
the mid layer (1.5-2.2 mm), characterized by light, absence of oxygen and sulfide, favor
anoxygenic photosynthesis of these phototrophic bacteria. When night occurred, they
p
the genus Desulfotignum while clone
taxa since they could not be related to Desulfotignum or Desulfobacter species.
DISCUSSION
T-RFLP analysis based on the 16S rDNA gene allowed assessing the spatio-temporal
distribution of the whole eubacterial communities in the Camargue mat during a diel cycle.
Within the four millimeters of the mat, these communities showed an important complex
dynamic probably in response to fluctuating physico-chemical gradients that have already
been observed (Wieland et al., 2003a). Similar behaviors were observed between the night
and day, since eubacteria composing mid layers (1.5-2.2 mm) of the mat in the afternoon
showed a downward migration to deep layers (2.6-4 mm) in the night. These populations
might be intolerant to oxygen,
tolerate higher concentration of sulfide in night than in day. Another cluster showed the same
movement in the mat from the surface oxic zone (0.3-0.7 mm) in day to the anoxic and
sulfidic zone (1.5-2.2 mm) in night. Environmental conditions of all these locations were
really different, therefore these behaviors suggested a metabolic shift of bacteria composing
these layers, and/or the search of optimal conditions by following the appropriate electron
acceptor or carbon source. The first movement could correspond to the behavior of some
sulfate-reducing bacteria aerotolerant attracted by oxygen as described for Desulfovibrio that
could switch from sulfate-reduction in deep anoxic zone to an active aerobic respiration in
mat surface (Krekeler et al., 1997). This process could play a role of protection of the
integrity of anoxic environment removing oxygen from oxic zone and then favoring the
development of obligate anaerobic bacteria (Krekeler et al., 1998; Krekeler et al., 1997). The
second behavior observed could correspond to the movement of versatile bacteria as the
motile purple non sulfur Rhodobacter sphaeroides. Indeed during the day the cond
168
IV. Dynamique verticale des populations bactériennes en fonction des fluctuations physico-chimiques d’un cycle nycthéméral
orientated by chemotaxis towards chemoattractant as organic acids, and switch their
metabolism to heterotrophic pathway (Jeziore-Sassoon et al., 1998).
These complex dynamic patterns of the observed eubacterial diversity suggested that specific
functional populations were involved in these different movements. In order to understand
these processes, the study was focused mainly on sulfate-reducing bacteria. Considering the
sub-group Desulfonema, Desulfosarcina, and Desulfococcus, T-RFLP patterns showed that
some SRB went down into the mat at noon when oxygen penetration was optimal and sulfide
content left surface layers of the mat. Some others SRB reached the mat surface during the
day in spite of the high oxygen concentration; they could be correlated to a high sulfate-
duction rate inside mat surface since it was six times higher in afternoon than in night
2003a). The OTU of 110 bp that could correspond to Desulfonema species
re
(Wieland et al.,
revealed little upward movement in noon; its resultant zonation was for great part in oxic
layers. Filamentous Desulfonema species were previously described in oxic area of mats
(Minz et al., 1999a; Minz et al., 1999b; Teske et al., 1998). Previous reports have
demonstrated that this gliding bacterium was able to aggregate in order to survive under
periodic exposure to oxic conditions, indicating probably the formation of anoxic micro-
niches (Fukui et al., 1999; Sigalevich et al., 2000b).
The analysis of the sub-group Desulfobacter revealed the behavior of two major populations.
T-RFLP and DNA sequences analysis of 16S rDNA clones libraries showed important shift of
these populations into the mat over a diel cycle. Numbers of sulfate-reducing bacteria have
been described to be able to survive in diverse oxic zones (Minz et al., 1999a; Minz et al.,
1999b; Teske et al., 1998; Wieland et al., 2003b; Wieringa et al., 2000) and respire using
oxygen as Desulfovibrio spp. (Cypionka, 2000; Krekeler et al., 1998; Sigalevich et al., 2000a)
and few Desulfobacter species (Cypionka et al., 1985; Dannenberg et al., 1992). In this mat,
one OTU (157 bp) was detected both in night and in day all over the 4 mm of the mat.
Fluctuating environmental conditions did not seem to disturb the distribution of this OTU,
particularly when the penetration of oxygen occurred in high concentration at the mat surface.
This OTU, related to all species of the genus Desulfobacter so far described, showed a high
tolerance to oxygen since it was located at the mat surface at 15:00h with oxygen
concentration up to 907 µM (Wieland et al., 2003a). Although this genus was described as
strictly anaerobic bacteria (Widdel and Pfennig, 1981) some members could form clumps
allowing them to tolerate oxygen. Phylogenetic analysis of 16S rDNA sequences revealed that
this SRB community could correspond to new species of the Desulfobacteriaceae family.
169

IV. Dynamique verticale des populations bactériennes en fonction des fluctuations physico-chimiques d’un cycle nycthéméral
Vertical migrating behavior was observed for a second OTU corresponding to the
T-RF of 306 bp. Indeed it moved downward from surface layers of the mat which are weakly
control the bacterial migration.
oxic (around 16 µM) and sulfide rich (up to 123 µM) during the night to deepest sulfidic and
anoxic zones of the mat containing up to 359 µM of total sulfide during the day (Wieland et
al., 2003a). Both predictive digestions and 16S rDNA sequences analysis permitted to affiliate
this OTU to the recently described genus Desulfotignum (Kuever et al., 2001). The two
species of this genus (Kuever et al., 2001; Schink et al., 2002) were characterized as strict
anaerobes, non-spore forming bacteria. Only the type strain Desulfotignum balticum has been
described as motile bacteria. The negative aerotactic behavior showed by this OTU was
consistent with the anaerobic and motile characteristics of the genus Desulfotignum, despite
that it was able to tolerate low concentrations of oxygen. Moreover, this observation could be
correlated to great increase of the sulfate reduction rate (up to 6 to 10 times) in deep layers
during the afternoon (Wieland et al., 2003a) suggesting that chemotaxis to sulfide could also
play an important role as cell attractant as already demonstrated (Cypionka, 2000).
Therefore, this study demonstrated the dynamic behavior of the sulfate-reducing bacteria
within the few active metabolic millimeters of the Camargue microbial mat. The diel
fluctuation of electron acceptors microgradients may
ACKNOWLEDGMENTS
We acknowledge the financial support by the EC (MATBIOPOL project, grant EVK3-CT-
1999-00010). The authors are grateful to the Company of Salins-du-midi at Salins-de-Giraud
for facilitating access to the salterns, sampling and field experiments. AF is partly supported
by a doctoral grant from the general council of Atlantic Pyrenees. Hervé REMIGNON from
ENSAT (Toulouse- France) is gratefully thanked for the technical support.
170
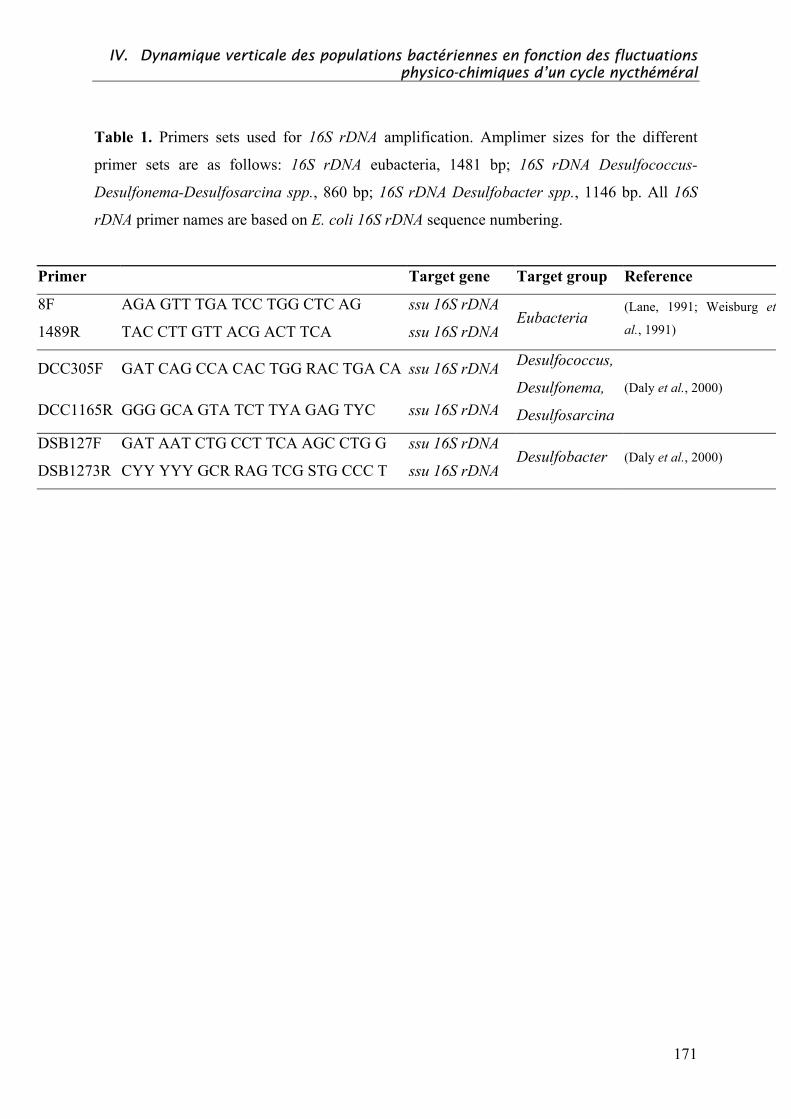
IV. Dynamique verticale des populations bactériennes en fonction des fluctuations physico-chimiques d’un cycle nycthéméral
Table 1. Primers sets used for 16S rDNA amplification. Amplimer sizes for the different
primer sets are as follows: 16S rDNA eubacteria, 1481 bp; 16S rDNA Desulfococcus-
Desulfonema-Desulfosarcina spp., 860 bp; 16S rDNA Desulfobacter spp., 1146 bp. All 16S
rDNA primer names are based on E. coli 16S rDNA sequence numbering.
Sequence (5’̂3’) Target gene Target group Reference
AGA GTT TGA TCC TGG CTC AG ssu 16S rDNA
TAC CTT GTT ACG ACT TCA ssu 16S rDNA
(Lane, 1991;
al., 1991)
5R GGG GCA GTA TCT TYA GAG TYC ssu 16S rDNA
Desulfococcus,
Desulfonema,
Desulfosarcina
(Daly et al., 20
F GAT AAT CTG CCT TCA AGC CTG G ssu 16S rDNA
3R CYY YYY GCR RAG TCG STG CCC T ssu 16S rDNA Desulfobacter (D
Primer
8F
1489R Eubacteria
Weisburg et
DCC305F GAT CAG CCA CAC TGG RAC TGA CA ssu 16S rDNA
DCC116
00)
DSB127
DSB127aly et al., 2000)
171

IV. Dynamique verticale des populations bactériennes en fonction des fluctuations physico-chimiques d’un cycle nycthéméral
2.6-2.8mm
3.8-4mm
2.6-2.8mm
3.8-4mm
Figure 1. Dendrogram of Eubacterial communities showing the relatedness of each layer of
the Camargue mat based on the Jaccard coefficient. It was constructed by stacking two
individual 5’end T-RFLP patterns corresponding to the HaeIII, and Hin6I digests. Branches of
the dendrogram related to 15:00h mat layers are represented by thin lines and those related to
4:00h thick lines.
1.5-1 1.5-1 mm mm
2-2.2mm
0-0.1mm
0.6- 0.6-
m
0.3-0.4mm 0.3-0.4mm
2-2.2mm2-2.2mm
2-2.2mm
0-0.1mm
m
1.8- .9mm
1.2-1.3mm
172
3.4-3.6mm
1.8-1.9mm .6
0.7mm
0.9-1m
0.6-0.7mm
3.4-3.6mm
1.8-1.9mm .6
0.7mm
0.9-1m
0.6-0.7mm
1.5-1.6mm
1
0.3-0.4mm
0.9-1mm
1.2-1.3mm
0-0.1mm
2.6-2.8mm
3.4-3.6mm
3.8-4mm
0.1
IV. Dynamique verticale des populations bactériennes en fonction des fluctuations physico-chimiques d’un cycle nycthéméral
172
Figure 1. Dendrogram of Eubacterial communities showing the relatedness of each layer of
the Camargue mat based on the Jaccard coefficient. It was constructed by stacking two
individual 5’end T-RFLP patterns corresponding to the HaeIII, and Hin6I digests. Branches of
the dendrogram related to 15:00h mat layers are represented by thin lines and those related to
4:00h thick lines.
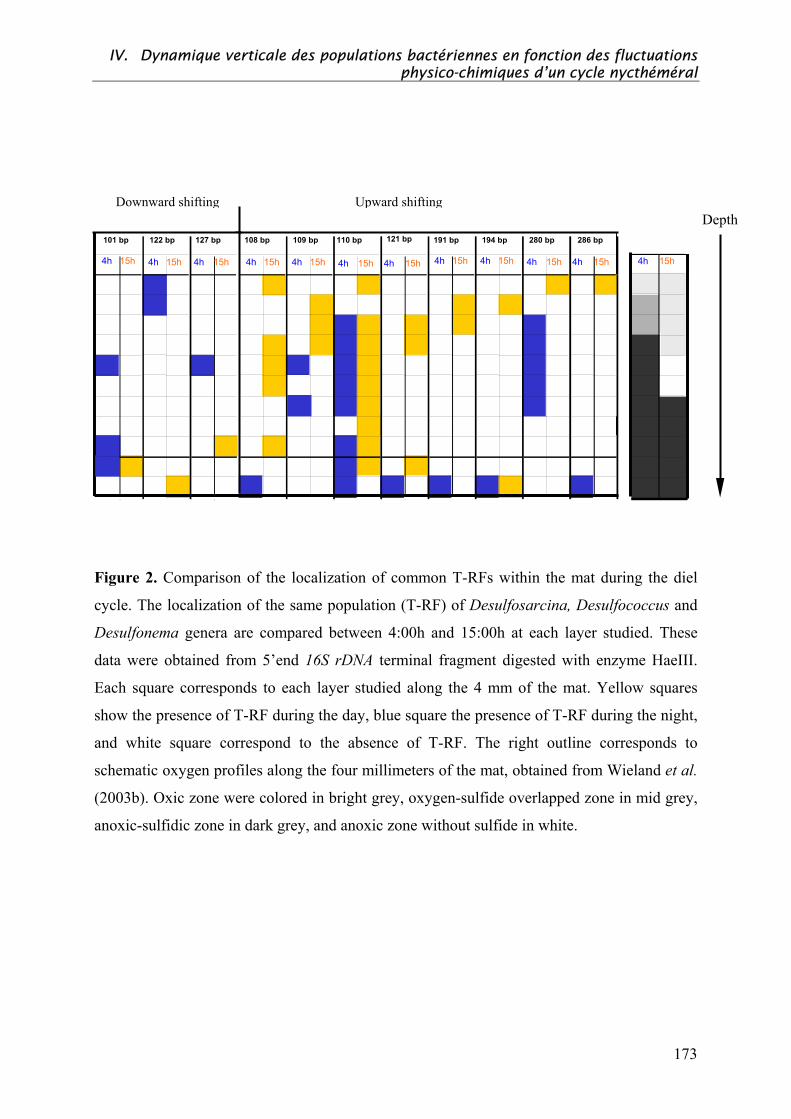
IV. Dynamique verticale des populations bactériennes en fonction des fluctuations physico-chimiques d’un cycle nycthéméral
191 280 bp 286 bp 110 bp 121 bp 108 bp 109 bp
4h 15h
122 bp 127 bp 101 bp
4h 15h 4h 15h 4h 15h 4h 15h 4h 15h 4h 15h 4h 4h 15h 4h 15h 4h 15h
Depth
Downward shifting Upward shifting
15h 4h 15h
bp 194 bp
Figure 2. Comparison of the localization of common T-RFs within the mat during the diel
ycle. The localization of the same population (T esulfosarcina, Desulfococcus and
esulfonema genera are compared between 4:00h and 15:00h at each layer studied. These
ata were obtained from 5’end 16S rDNA terminal fragment digested with enzyme HaeIII.
e were colored in bright grey, oxygen-sulfide overlapped zone in mid grey,
anoxic-sulfidic zone in dark grey, and anoxic zone without sulfide in white.
-RF) of Dc
D
d
Each square corresponds to each layer studied along the 4 mm of the mat. Yellow squares
show the presence of T-RF during the day, blue square the presence of T-RF during the night,
and white square correspond to the absence of T-RF. The right outline corresponds to
schematic oxygen profiles along the four millimeters of the mat, obtained from Wieland et al.
(2003b). Oxic zon
173
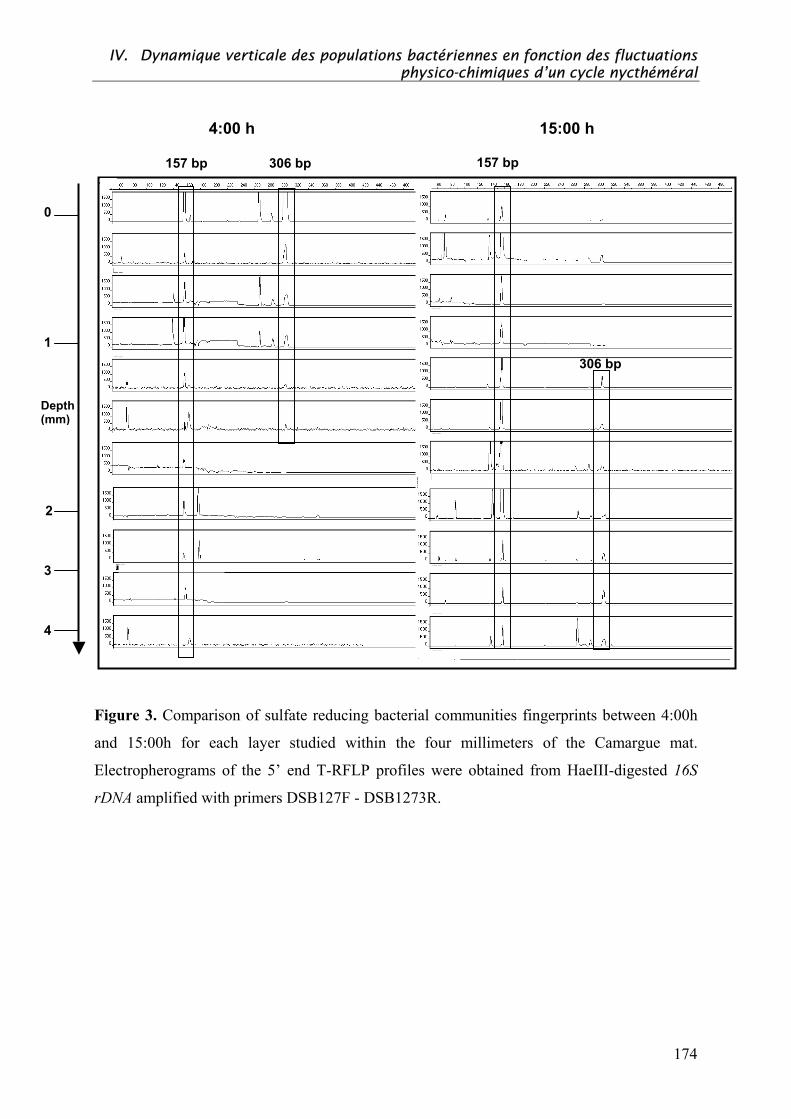
IV. Dynamique verticale des populations bactériennes en fonction des fluctuations physico-chimiques d’un cycle nycthéméral
Figure 3. Comparison of sulfate reducing bacterial communities fingerprints between 4:00h
and 15:00h for each layer studied within the four millimeters of the Camargue mat.
Electropherograms of the 5’ end T-RFLP profiles were obtained from HaeIII-digested 16S
rDNA amplified with primers DSB127F - DSB1273R.
4:00 h 15:00 h
Depth (mm)
0
1
2
3
4
306 bp
157 bp 306 bp 157 bp
174
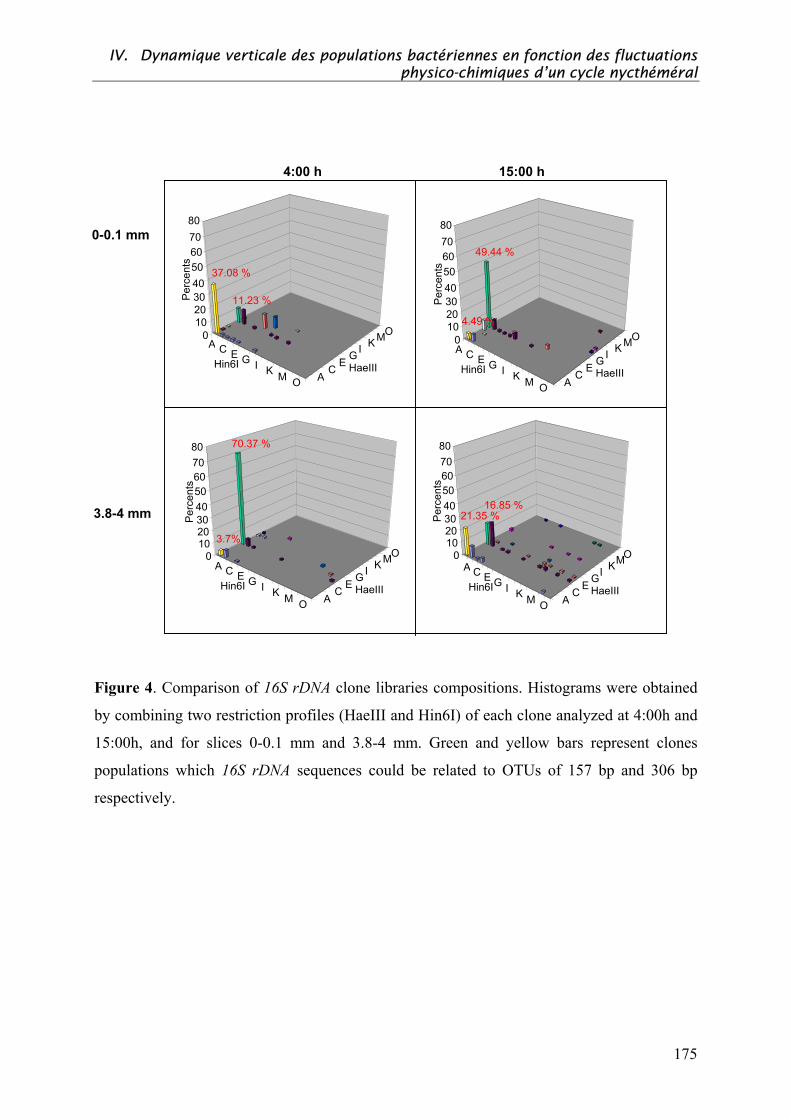
IV. Dynamique verticale des populations bactériennes en fonction des fluctuations physico-chimiques d’un cycle nycthéméral
3
0-0.1 mm
.8-4 mm
49.44 %
4.49 %
70.37 %
3.7%
A CE
GI
KM
OA
CE
G I
K M
O
16.85 %21.35 %
0
102030
40
50
60
70
80P
erc
en
ts
Hin6I HaeIII
11.23 %
37.08 %
0 h
0
10 20 30
40
50
60
70
80
Pe
rce
nts
0
10
20
30
40
50
60
70
80
Pe
rce
nts
0
10
20
30
40
50
60
70
80
Pe
rce
nts
A CE
G I
K M
O A
CE
GI
KM
O
Hin6I HaeIII
A C E
G I
K M
O A
CE
GI
KM
O
Hin6I HaeIII
AC
EG
IK
MO
A C
K M
O
Hin6I E G
I
HaeIII
15:04:00 h
Figure 4. Comparison of 16S rDNA clone libraries compositions. Histograms were obtained
by combining two restriction profiles (HaeIII and Hin6I) of each clone analyzed at 4:00h and
15:00h, and for slices 0-0.1 mm and 3.8-4 mm. Green and yellow bars represent clones
populations which 16S rDNA sequences could be related to OTUs of 157 bp and 306 bp
respectively.
175
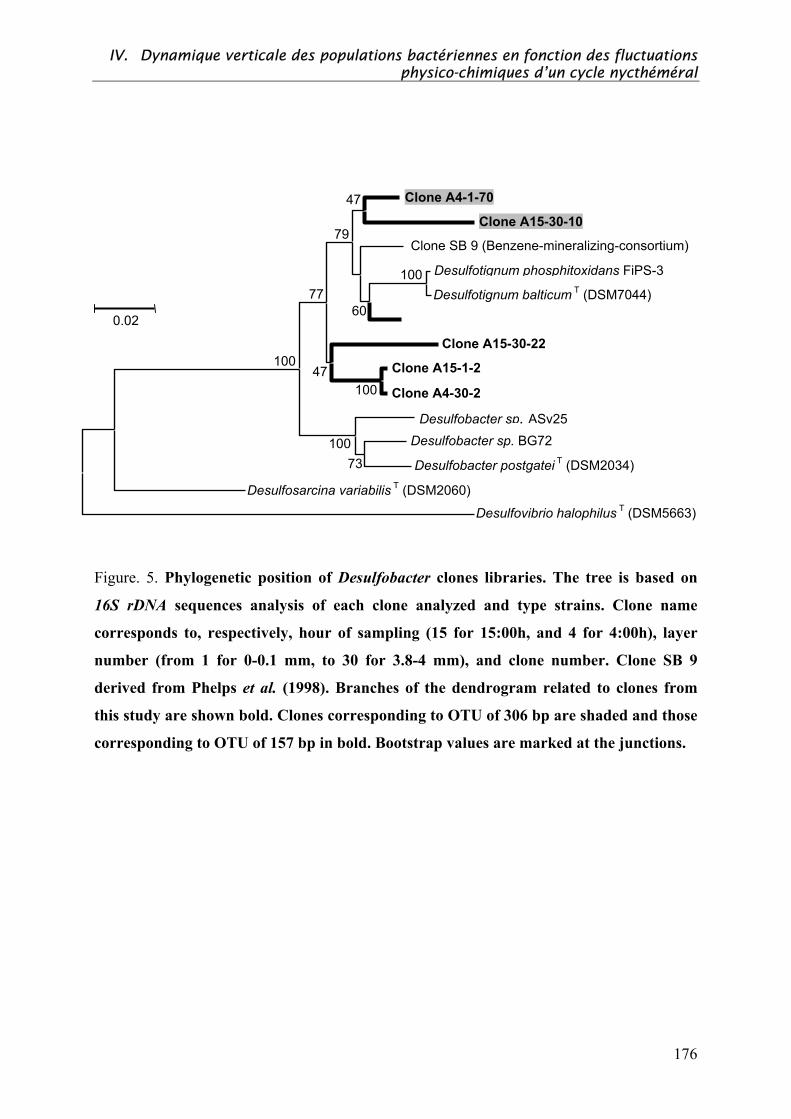
IV. Dynamique verticale des populations bactériennes en fonction des fluctuations physico-chimiques d’un cycle nycthéméral
Clone A4-1-70
Clone A15-30-10
Clone A15-30-22
Clone A15
Desulfobacter sp. ASv25
Desulfobacter sp. BG72 Desulfobacter postgatei
T (DSM2034)
Desulfosarcina variabilis
T (DSM2060)
73
100
100
100
100
77
47
60
79
0.02
lfotignum balticum T
(DSM7044)
ulfotignum phosphitoxidans FiPS-3
Clone A4-30-2
lfovibrio halophilus
T (DSM5663)
Clone SB 9 (Benzene-mineralizing-consortium)
Desu
De
Des
su
47 -1-2
Figure. 5. Phylogenetic position of Desulfobacter clones libraries. The tree is based on
6S rDNA sequences analysis of each clone analyzed and type strains. Clone name
orresponds to, respectively, hour of sampling (15 for 15:00h, and 4 for 4:00h), layer
umber (from 1 for 0-0.1 mm, to 30 for 3.8-4 mm), and clone number. Clone SB 9
1
c
n
derived from Phelps et al. (1998). Branches of the dendrogram related to clones from
this study are shown bold. Clones corresponding to OTU of 306 bp are shaded and those
corresponding to OTU of 157 bp in bold. Bootstrap values are marked at the junctions.
176
IV. Dynamique verticale des populations bactériennes en fonction des fluctuations physico-chimiques d’un cycle nycthéméral
REFERENCES
anfield, D. E. & Des Marais, D. J. (1991). Aerobic sulfate reduction in microbial mats.
cience 251, 1471-1473.
aumette, P., Matheron, R., Raymond, N. & Relexans, J. C. (1994). Microbial mats in the
ypersaline ponds of Mediterranean salterns (Salins-de-Giraud, France). FEMS Microbiology
cology 13, 273-286.
ypionka, H. (2000). Oxygen respiration by De w of
icrobiology 54, 827-848.
y a, H., Widdel, F. & Pfennig, N. (1985). Survival of sulfate-reducing bacteria after
xygen stress, and growth in sulfate-free oxygen- FEMS Microbiology
etters 31, 39-45.
aly, K., Sharp, R. J. & McCarthy, A. J. pment of oligonucleotide probes
nd PCR primers for detecting phylogenetic subgroups of sulfate-reducing bacteria.
icrobiology 146, 1693-1705.
annenberg, S., Krod . (1992). Oxidation of H2, organic
ompounds and inorganic sulfur compounds coupled to reduction of O2 or nitrate by sulfate
ducing-bacteria. Archives of Microbiology 158, 93-99.
,
rimalt, J. O., Kühl, M., Esteve, I., Muyzer, G., Caumette, P. & Duran, R. (2004b).
Characterization of functional bacterial groups in a hypersaline microbial mat community
(Salins-de-Giraud, Camargue, France). FEMS Microbiology Ecology in press.
Fründ, C. & Cohen, Y. (1992). Diurnal cycles of sulfate reduction under oxic conditions in
cyanobacterial mats. Applied and Environmental Microbiology 58, 70-77.
Fukui, M., Teske, A., Aßmus, B., Muyzer, G. & Widdel, F. (1999). Physiology,
phylogenetic relationships, and ecology of filamentous sulfate-reducing bacteria (genus
desulfonema). Archives of Microbiology 172, 193-203.
C
S
C
h
E
C sulfovibrio species. Annual Revie
M
C pionk
o sulfide gradients.
L
D (2000). Develo
a
M
D er, M., Dilling, W. & Cypionka, H
c
re
Ferris, M. J., Nold, S. C., Revsbech, N. P. & Ward, D. M. (1997). Population structure and
physiological changes within a hot spring microbial mat community following disturbance.
Applied and Environmental Microbiology 63, 1367-1374.
Fourçans, A., Solé, A., Diestra, E., Esteve, I., Caumette, P. & Duran, R. (2004a). Vertical
shift of phototrophic bacterial communities during a diel cycle in Salin de Giraud microbial
mat (Camargue, France). en préparation.
Fourçans, A., García de Oteyza, T., Wieland, A., Solé, A., Diestra, E., van Bleijswijk, J.
G
177
IV. Dynamique verticale des populations bactériennes en fonction des fluctuations physico-chimiques d’un cycle nycthéméral
Giani, D., Seeler, J., Giani, L. & Krumbein, W. E. (1989). Microbial mats and
ogy 62, 151-162.
-239.
cle. FEMS Microbiology Ecology 13, 303-312.
alevich, P., Teske, A., Cohen, Y. & Cypionka, H. (1997). A sulfate-
alushko, A. & Drzyzga, O. (2001). Reclassification of
chniques in bacterial systematics.,
iction fragment length polymorphisms of genes
mmunity: sulfate-
n, Y., Wagner, M., Rittmann, B. E.
& Stahl, D. A. (1999b). Diversity of sulfate-reducing bacteria in oxic and anoxic regions of a
physicochemistry in a saltern in the Bretagne (France) and in a laboratory scale saltern model.
FEMS Microbiology Ecol
Jeziore-Sassoon, Y., Hamblin, P. A., Bootle-Wilbraham, C. A., Poole, P. S. & Armitage,
J. P. (1998). Metabolism is required for chemotaxis to sugars in Rhodobacter sphaeroides.
Microbiology 144, 229
Jørgensen, B. B. (1994). Sulfate reduction and thiosulfate transformations in a cyanobacterial
mat during a diel oxygen cy
Krekeler, D., Teske, A. & Cypionka, H. (1998). Strategies of sulfate-reducing bacteria to
escape oxygen stress in a cyanobacterial mat. FEMS Microbiology Ecology 25, 89-96.
Krekeler, D., Sig
reducing bacterium from the oxic layer of a microbial mat from Solar Lake (Sinai),
Desulfovibrio oxyclinae sp. nov. Archives of Microbiology 167, 369-375.
Kuever, J., Konneke, M., G
Desulfobacterium phenolicum as Desulfobacula phenolica comb. nov. and description of
strain SaxT as Desulfotignum balticum gen. nov., sp. nov. Int J Syst Evol Microbiol 51, 171-
177.
Kumar, S., Tamura, K., Jakobsen, I. B. & Nei, M. (2001). MEGA2: molecular
evolutionary genetics analysis software. Bioinformatics 17, 1244-1245.
Lane, D. J. (1991). rRNA sequencing. In Nucleic acid te
pp. 115-175. Edited by G. M. Stachenbradt E., (Eds): Wiley, Chichester.
Liu, W. T., Marsh, T. L., Cheng, H. & Forney, L. J. (1997). Characterization of microbial
diversity by determining terminal restr
encoding 16S rRNA. Applied and Environmental Microbiology 63, 4516-4522.
Maidak, B. L., Cole, J. R., Lilburn, T. G., Parker, C. T., Jr., Saxman, P. R., Farris, R. J.,
Garrity, G. M., Olsen, G. J., Schmidt, T. M. & Tiedje, J. M. (2001). The RDP-II
(Ribosomal Database Project). Nucleic Acids Research 29, 173-174.
Minz, D., Fishbain, S., Green, S. J., Muyzer, G., Cohen, Y., Rittmann, B. E. & Stahl, D.
A. (1999a). Unexpected population distribution in a microbial mat co
reducing bacteria localized to the highly oxic chemocline in contrast to a eukaryotic
preference for anoxia. Applied and Environmental Microbiology 65, 4659-4665.
Minz, D., Flax, J. L., Green, S. J., Muyzer, G., Cohe
178
IV. Dynamique verticale des populations bactériennes en fonction des fluctuations physico-chimiques d’un cycle nycthéméral
microbial mat characterized by comparative analysis of dissimilatory sulfite reductase genes.
Applied and Environmental Microbiology 65, 4666-4671.
Mouné, S., Caumette, P., Matheron, R. & Willison, J. C. (2003). Molecular sequence
, V. M., Namsaraev, B. B., Buriukhaev, S. P. & Iurkov, V. V.
d and
iology Ecology 27,
bacterial mat. Applied and Environmental Microbiology 66, 1038-1049.
l mat. Limnology and
rns of Phormidium
ents of the
bution of cultivated and
o phosphate.
analysis of prokaryotic diversity in the anoxic sediments underlying cyanobacterial mats of
two hypersaline ponds in Mediterranean salterns. FEMS Microbiology Ecology 44, 117-130.
Namsaraev, Z. B., Gorlenko
(2003). [The structure and biogeochemical activity of the phototrophic communities from the
Bol'sherechenskii alkaline hot spring]. Mikrobiologiia 72, 228-238.
Nelson, D. C., Revsbech, N. P. & Jorgensen, B. B. (1986). Microoxic-anoxic niche of
Beggiatoa spp. : microelectrode survey of marine and freshwater strains. Applie
Environmental Microbiology 52, 161-168.
Phelps, C. D., Kerkhof, L. J. & Young, L. Y. (1998). Molecular characterization of a
sulfate-reducing consortium which mineralizes benzene. FEMS Microb
269-279.
Ramsing, N. B., Ferris, M. J. & Ward, D. M. (2000). Highly ordered vertical structure of
Synechococcus populations within the one-millimeter-thick photic zone of a hot spring
cyano
Revsbech, N. P., Jorgensen, B. B., Blackburn, T. H. & Cohen, Y. (1983). Microelectrode
studies of the photosynthesis and O2, H2S and pH profiles of a microbia
Oceanography 28, 1062-1074.
Richardson, L. L. (1996). Horizontal and vertical migration patte
corallyticum and Beggiatoa spp. associated with black-band disease of corals. Microbial
Ecology 32, 323-335.
Richardson, L. L. & Castenholz, R. W. (1987). Diel vertical movem
cyanobacterium Oscillatoria terebriformis in a sulfide-rich microbial mat. Applied and
Environmental Microbiology 53, 2142-2150.
Ruff-Roberts, A. L., Kuenen, J. G. & Ward, D. M. (1994). Distri
uncultivated cyanobacteria and Chloroflexus-like bacteria in hot spring microbial mats. Appl
Environ Microbiol 60, 697-704.
Schink, B., Thiemann, V., Laue, H. & Friedrich, M. W. (2002). Desulfotignum
phosphitoxidans sp. nov., a new marine sulfate reducer that oxidizes phosphite t
Arch Microbiol 177, 381-391.
179
IV. Dynamique verticale des populations bactériennes en fonction des fluctuations physico-chimiques d’un cycle nycthéméral
Sigalevich, P., Baev, M. V., Teske, A. & Cohen, Y. (2000a). Sulfate reduction and possible
aerobic metabolism of the sulfate- reducing bacterium Desulfovibrio oxyclinae in a chemostat
A. & Gorlenko, V. M.
ukui, M., Kuver, J., Jorgensen, B. B. & Cohen,
n, J., Gibson, T., Plewniak, F., Jeanmougin, F. & Higgins, D. (1997). The
, 3-25.
. E. (1984). Motility of the cyanobacterium Microcoleus
. I. Isolation of new sulfate-reducing bacteria enriched with acetate
l, M. (2003a). Biogeochemistry of an iron-rich
lé, A., Diestra, E., Esteve, I. & Herbert, R. A. (2003b).
coculture with Marinobacter sp. Strain MB under exposure to increasing oxygen
concentrations. Applied and Environmental Microbiology 66, 5013-5018.
Sigalevich, P., Meshorer, E., Helman, Y. & Cohen, Y. (2000b). Transition from Anaerobic
to Aerobic Growth Conditions for the Sulfate-Reducing Bacterium Desulfovibrio oxyclinae
Results in Flocculation. Applied and Environmental Microbiology 66, 5005-5012.
Sorokin, D. I., Turova, T. P., Kuznetsov, B. B., Briantseva, I.
(2000). [Roseinatronobacter thiooxidans Gen. Nov., sp. Nov., a new alkaliphilic aerobic
bacteriochlorophyll-alpha-containing bacteria from a soda lake]. Mikrobiologiia 69, 89-97.
Teske, A., Ramsing, N. B., Habicht, K., F
Y. (1998). Sulfate-reducing bacteria and their activities in cyanobacterial mats of solar lake
(Sinai, Egypt). Applied and Environmental Microbiology 64, 2943-2951.
Thompso
CLUSTAL_X windows interface: flexible strategies for multiple sequence alignment aided by
quality analysis tools. Nucleic Acids Research 25, 4876-4882.
van Gemerden, H. (1993). Microbial mats : A joint venture. Marine Geology 113
Weisburg, W. G., Barns, S. M., Pelletier, D. A. & Lane, D. J. (1991). 16S ribosomal DNA
amplification for phylogenetic study. Journal of Bacteriology 173, 697-703.
Whale, G. F. & Walsby, A
chthonoplastes in mud. Phycol. J. 19, 117-123.
Widdel, F. & Pfennig, N. (1981). Studies on dissimilatory sulfate-reducing bacteria that
decompose fatty acids
from saline environments. Description of Desulfobacter postgatei gen. nov., sp. nov. Archives
of Microbiology 129, 395-400.
Wieland, A., Zopfi, J., Benthien, M. & Küh
hypersaline microbial mat (Camargue, France). Microbial Ecology in press.
Wieland, A., Kuhl, M., McGowan, L., Fourçans, A., Duran, R., Caumette, P., Garcia De
Oteyza, T., Grimalt, J. O., So
Microbial mats on the Orkney islands revisited: microenvironment and microbial community
composition. Microbial Ecology 46, 371-390.
180

IV. Dynamique verticale des populations bactériennes en fonction des fluctuations physico-chimiques d’un cycle nycthéméral
Wieringa, E. B., Overmann, J. & Cypionka, H. (2000). Detection of abundant sulphate-
reducing bacteria in marine oxic sediment layers by a combined cultivation and molecular
approach. Environmental Microbiology 2, 417-427.
181
V. Adaptation des populations bactériennes face à une pollution d’hydrocarbures
Chapitre V : Adaptation des populations
bactériennes face à une pollution
d’hydrocarbures
182


V. Adaptation des populations bactériennes face à une pollution d’hydrocarbures
V. Adaptation des populations bactériennes face à une pollution
d’hydrocarbures
.1. IntroductionV
Depuis plusieurs décennies, l’essor de l’industrie a entraîné l’utilisation massive de
pétrole comme source d’énergie ou matière première pour la production de produits
chi iques divers. En conséquence, des risques nouveaux pour l’environnement sont apparus,
par le biais des rejets de résidus toxiques accidentels ou non, mais aussi dus au transport
ma e intensif de produits pétroliers des pays producteurs vers les pays utilisateurs. Les
conséquences écologiques et économiques suite à de nombreux accidents pétroliers (Amoco
Cadiz, Erika, Prestige, pollution pétrolière du golfe Arabo-Persique suite à la Guerre du
Koweït, etc.), ont entraîné la recherche vers l’étude intensive des processus de bio-
réhabilitation.
Le pétrole brut est essentiellement composé d’hydrocarbures, parmi lesquels les
hydrocarbur altènes
(Harayama et al. ontrent des
propriétés toxiques, mutagènes et carcinogènes. Dans l’environnement, et plus
particulièrement dans les milieu mènes intervenant dans le
devenir des hydrocarbures sont soit abiotiques (évaporation, dissolution, dispersion, photo-
oxydation et sédimentation) soit biotiques (biodégradation). Parmi ces processus, l’activité
des microorganismes joue un rôle important soit direct par des réactions de biodégradation
soit indirect en modifiant les conditions du milieu (Leahy and Colwell, 1990; Swannell et al.,
1996).
Les tapis microbiens sont considérés comme des écosystèmes compacts parfaitement
organisés dans lesquels l’activité métabolique de chaque composante bactérienne dépend de
l’activité des autres membres de la communauté (van Gemerden, 1993). Ainsi, comme
production et consommation de matière organique ne sont séparées que de quelques microns à
quelques millimètres, les tapis microbiens présentent un énorme potentiel métabolique
pouvant être exploité pour des processus de bio-réhabilitation. En effet, pendant la guerre du
Golfe, il a été démontré que les tapis microbiens pouvaient jouer un rôle important dans la
biodégradation du pétrole des zones côtières contaminées (Höpner et al., 1996).
m
ritim
es saturés, les hydrocarbures aromatiques, les résines, et les asph
, 1999). Ces composés sont fortement nocifs, puisqu’ils m
x marins, les principaux phéno
183
V. Adaptation des populations bactériennes face à une pollution d’hydrocarbures
Les connaissances actuelles sur la biodégradation des hydrocarbures proviennent
principalement de l’étude de souches hydrocarbonoclastes en cultures pures (Rabus and
ddel, 1995; Harms et al.Wi , 1999; Galushko et al., 1999). Cependant les études récentes de
tapis microbiens pollués portant sur la dynamique des communautés, la diversité bactérienne,
et leurs potentiels de dégradation, participent à une meilleure compréhension des processus de
égradations biotiques (Abed et al., 2002; Grotzschel et al., 2002).
la couche de polluants, et le niveau de l’eau de mer par rapport aux zones
analysé
de (Bretagne). L’étude a été réalisée en polluant ces tapis maintenus en microcosme
puis en
d
Ce chapitre porte sur l’étude de l’impact du pétrole sur les populations bactériennes
issues de tapis microbiens, ainsi que de leurs capacités d’adaptation et donc de dégradation de
ces hydrocarbures.
La première partie de ce chapitre, détaillée dans l’article intitulé “Dégradation of Erika
fuel oil”, concerne l’étude de l’impact du pétrole brut de l’Erika sur les microorganismes du
tapis microbien des marais salants de Guérande (Bretagne), et de leurs potentiels de
dégradation. L’analyse chimique par GC/MS du site pollué a mis en évidence l’influence des
paramètres environnementaux dans la dégradation naturelle de ce pétrole, entre autres
l’épaisseur de
es. Les tapis de Guérande maintenus en microcosme au laboratoire et pollués durant 3
mois avec le pétrole de l’Erika ont été analysé par T-RFLP. Cette analyse de la biodiversité
moléculaire des eubactéries et des bactéries anoxygéniques phototrophes a permis de décrire
l’impact réel de la pollution sur les communautés du tapis. Ainsi la succession de différentes
communautés bactériennes révèle les capacités d’adaptation de ces écosystèmes face à ce
stress.
Le deuxième article de ce chapitre “T-RFLP and functional analyses of bacterial
communities changes in microbial mats following petroleum exposure” décrit l’impact de
pétroles bruts sur deux tapis microbiens hypersalés : Salins-de-Giraud (Camargue) et
Guéran
suivant la diversité bactérienne au cours du temps par T-RFLP. Ainsi, les genres
Chloroflexus, Burkholderia, Desulfovibrio et Cytophaga ont été observés comme faisant
partie des OTUs les mieux adaptées à cette pollution. En parallèle, le potentiel métabolique de
dégradation des hydrocarbures des différentes communautés de ces tapis a été appréhendé par
l’étude de la diversité des gènes codant pour les dioxygénases. Ces enzymes impliquées dans
la dégradation des hydrocarbures montrent dans cette étude une grande diversité, suggérant
que les tapis microbiens possèdent un potentiel de dégradation important.
184
V. Adaptation des populations bactériennes face à une pollution d’hydrocarbures
V.2. Tapis microbien de Guérande soumis à une pollution par le
pétrole de l’Erika
Ce travail a été soumis au journal “Aquatic Living Ressources” sous le titre :
Degrad
nave1, Ronan Jézéquel2, Aude Fourçans
ation of Erika fuel oil
Par : Sylvain Borde 1, Héléne Budzinski3, François
Xavier 2 2 1 1 1
1 1
ng the degradation capacities of microbial mats. To further understand the
biodeg
Cedre. 715 rue Alain Colas. CS 41836. 29218 Brest Cedex 1. France.
Merlin , Tangi Fourel , Marisol Goñi-Urriza , Rémy Guyoneaud , Régis Grimaud ,
Pierre Caumette , Robert Duran
ABSTRACT
Since March 2001, samples of remaining oil from Erika wreck were collected along the
Atlantic coastline in order to assess the natural degradation. Four years after the wreckage, the
chemical analyses of the oil revealed the influence of the environmental parameters on the
degradation kinetics. Among the diverse parameters controlling the fate of crude oil in the
environment, biodegradation by microorganisms is known to play an important role. To
investigate the role of microorganisms on Erika fuel oil degradation, microbial mats from
Guérande salterns were maintained in slurries containing the contaminant. From these slurries
experiments, a low biodegradation by microorganisms of the Erika fuel oil could be suspected
indicati
radation processes biodiversity studies were conducted. Microbial mats from Guérande
salterns were maintained in microcosms to evaluate the impact of Erika fuel oil on bacterial
communities. Molecular analysis based on 16S rRNA and pufM encoding genes allowed to
determine fingerprints on eubacterial and purple anoxygenic phototrophic bacterial (PAB)
communities respectively. These studies revealed bacterial diversity and communities
changes showing the adaptation of microorganisms to oil pollution.
1 Laboratoire d'Ecologie Moléculaire EA3525, Université de Pau, BP 1155 F64013 Pau cedex France 2
3 Laboratoire de Physico-Toxico-Chimie - UMR 5472 CNRS, Université Bordeaux I, 351, crs de la Libération 33405 Talence
France
185
V. Adaptation des populations bactériennes face à une pollution d’hydrocarbures
INTRODUCTION
December 1999 the noIn late rth of the French Atlantic coast was injured by an oil spill
llowing the wreck of the Maltese oil tanker Erika. Crude oil is composed mainly by
enes [8], which
re highly noxious, compounds as they exhibit toxic, mutagenic, and carcinogenic properties
[3, 4]. Previous studies on the impact of oil spills report persistent effects during five to more
position of 90% of heavy residues and 10% of a
ght fraction, the Erika heavy fuel oil was found to be more resistant to natural degradation
um
al
ntrol different mechanisms such as photo and chemical
xidations, evaporation, dilution, sedimentation, and microbial activities. Among these
érande, Brittany, France)
sing slurry experiments, and (3) to estimate the Erika fuel impact on these microbial
tructures by culture independent molecular analysis.
fo
hydrocarbons, such as saturated hydrocarbons, aromatics, resins and asphalt
a
than ten years [12, 24]. According to its com
li
processes than light crude oils [19]. After the contamination the fate of petrole
hydrocarbon compounds in the environment depends on both physico-chemical and biologic
environmental variables that co
o
processes, biodegradation by microorganisms is known to play an important role [14, 25].
Hydrocarbons differ in their susceptibility to microbial attack and generally degrade in the
following order of decreasing susceptibilities: n-alkanes > branched alkanes > low-molecular-
weight aromatics > cyclic alkanes [14]. For efficient remediation after oil spills, we need to
evaluate kinetics and relative rates of natural degradation and estimate the active role played
by microorganisms. For this purpose it is important to understand the behavior of microbial
populations responsible for degrading crude oil. In coastal zone, photosynthetic microbial
mats develop at the water-sediment interface [2, 27]. Since these vertically laminated
structures show important bacterial diversity that present high metabolic potential for
hydrocarbons degradation, they could be considered as relevant models to study crude oil
impact on bacterial communities [1].
The specific aims of this research were: (1) to assess the kinetics of natural degradation
processes of the Erika fuel oil according to the environmental parameters by monitoring in
situ the fate of hydrocarbon compounds, (2) to evaluate the degradation capacities of bacterial
communities present in microbial mats from the polluted area (Gu
u
s
186
V. Adaptation des populations bactériennes face à une pollution d’hydrocarbures
MATERIALS AND METHODS
lumina column (saturates and aromatics were eluted
m 50°C (1 min) to 300°C (20 min) at
°C.min-1. The carrier gas was Helium at a constant flow of 1 ml.min-1. The capillary column
used was an HP 5 MS (Hewlett-Packard, Palo Alto, CA, USA) :
60 m x 0,25 mm ID x 0,25 mm film thickness. The GC was coupled to an HP 5973 Mass
Selective Detector (MSD) (Electronic Impact: 70 eV, voltage: 1200V). Saturates and PAHs
Monitoring natural degradation of Erika fuel oil
To assess the natural degradation of the Erika fuel oil according to the environmental
conditions, Cedre employees involved during the cleaning operations were asked to propose
polluted areas following two main criteria: (1) area where no human cleaning operations were
performed and (2) area with enough pollutant remaining to allow sampling round during
several years. More than 75 sites were suggested for this study. After a survey of these
selections, 21 sites were definitely selected and samples collected. For each site, samples were
collected in triplicate, in various area according to solar - waves exposure and substrate
nature. Samples were then frozen and stored at –20°C until analysis.
Sample extraction
For oil-sediment samples extraction, approximate 50 mg of the samples were weighed,
dissolved in methylene chloride in a sonication bath during 10 minutes. The solvent was
filtered through sodium sulfate then evaporated using a rotavapor. For mud samples
extraction, a preliminary step before oil extraction was to evaporate the water at 40°C during
4 hours. The same procedure as cited above was then used. For sand samples extraction,
approximate 150 ml of sand was mixed with sodium sulfate. Oil was then extracted using a
soxhlet with methylene chloride during 4 hours.
Hydrocarbon composition analysis
Approximate 30 mg of the samples were purified through low-pressure liquid
chromatography on an open silica-a
simultaneously with a mixture pentane / methylene chloride 80/20). Solvent was then
evaporated to 2 ml and the sample analyzed by gas chromatography equipped with a mass
spectrometry detection (GC/MS). The GC was an HP 6890N (Hewlett-Packard, Palo Alto,
CA, USA) equipped with a split/splitless injector (Pulsed Splitless time: 1 min, flow
50 ml.min-1). The injector temperature was maintained at 270 °C. The interface temperature
was 290°C and the GC temperature gradient was fro
5
187
V. Adaptation des populations bactériennes face à une pollution d’hydrocarbures
quantification were done using Single Ion Monitoring mode with the molecular ion of each
he salt concentration of
eawater up to those at which NaCl precipitates. The mean day light temperature in the area is
rainfall of 800 to 900 mm per year [7]. A freshly taken microbial mat
cosm taken randomly, were sub-sampled in
asteur micropipettes and then stored immediately at
the T-RFLP method on two mixed sub-samples.
compound at 1.4 cycles/s.
Quantification was performed with respect to an internal reference, the
17α (H), 21く(H)-hopane (m/z=191). This “biomarker” (non-biodegraded, non-photooxidazed,
non-volatile and non-water-soluble) is currently used as a conserved internal marker within
the oils to follow the disappearance of other components within the oils [11, 21, 23].
Microbial mat sampling and microcosms experiment set up
Guérande microbial mats were collected from a saltern near La Baule (Bretagne, France).
Salterns provide environments of various salinities, ranging from t
s
11°C to 12°C, with
sample was cut into pieces of equal size (20 cm2) and placed in glass tubes without water.
Half mat samples were not contaminated (control mats) and the remaining mat samples were
contaminated with Erika fuel oil. Approximately equal amounts of oil (200 to 300 mg) were
added on the surfaces of contaminated mats before adding synthetic seawater (salinity 70 ‰).
Microbial mats microcosms were maintained at room temperature under a cycle of 16 h
daylight / 8 h dark. Samples were taken every 15 days during 3 months. At each time, one
contaminated microcosm and one control micro
P
-80°C. Biodiversity was estimated by
Genomic DNA extraction
Mixed community DNA was extracted from microbial mat fractions with the Ultraclean soil
DNA isolation kit (Mo Bio Laboratories, Solana Beach, California), by using the
recommended protocol with minor modifications as previously described [22].
PCR amplification and purification
Optimization of PCR was performed for each sample by adjusting the amount of genomic
DNA extract used to obtain a strong band on an agarose gel, without visible non-specific
product. PCR was performed using a reaction mixture of 200 µM each desoxynucleoside
triphosphate (Qiagen), 1.5 mM MgCl2, 1.25 U of Taq polymerase (Qiagen), 1X PCR Buffer
(Qiagen), and 0.2 µM each primer. The first primers used were the general eubacterial primer
188
V. Adaptation des populations bactériennes face à une pollution d’hydrocarbures
8-27F [13], and the universal primer 1472-1489R [18] amplifying specifically the 16S
ribosomal gene. To assess specifically purple bacteria, pufM gene coding for the
for 30
econds, primer annealing at 55°C for 30 seconds, and extension at 72°C for 30 seconds. A
programmed numbers of cycles
n ABI
RISM 310 Genetic Analyzer (Applied Biosystems). The 5’ terminal fragments were
the hexachlorofluorescein molecule (hex) attached to the forward
orescence was
igher than 100 for at least one sample. Statistical analyses were done with a hierarchical
r group method using arithmetic averages (UPGMA).
photosynthetic center was targeted with the primers: PB557F and PB750R [16]. Forward
primers, 8-27F and PB557F were hexachlorofluorescein labeled. PCR (50µl) was performed
in a MJ Research PTC-100 thermocycler by using an initial denaturation step of 95°C for 3
minutes, followed by 24 cycles of a program consisting of denaturation at 95°C
s
final extension at 72°C for 7 minutes was performed after the
were completed. PCR products were then purified using the GFX DNA and Gel Band
Purification kit (Amersham Biosciences) as directed by the supplier.
Restriction enzyme digestion and products purification
After a quantification of the purified PCR product by the “dots method”, 300 ng of amplified
DNA was mixed in a final volume of 30 µl of restriction enzyme mix containing
10 U of restriction enzyme (HaeIII) in 1X reaction buffer (New England BioLabs), were
incubated for 3 h at 37°C.
T-RFLP analysis
Three microliters of the restricted PCR product was mixed with 1 µl of TAMRA500 size
standard (Applied Biosystems Instruments, Foster City, California). DNA fragments were
separated by size by capillary electrophoresis at 15,000 Volts for 30 minutes on a
P
visualized by excitation of
primer. The gel image was captured and analyzed by using Genescan version 3.1 analysis
software (ABI). Negative controls (no genomic DNA) were conducted with every PCR and
run on Genescan gels. Data sets were constructed by using peak which flu
h
cluster analysis; the unweighted-pai
Those statistical analyses were done with MVSP software (Multi-Variate Statistical Package
3.1, Kovach Computing Services).
189
V. Adaptation des populations bactériennes face à une pollution d’hydrocarbures
In vitro Erika fuel oil biodegradation
To estimate the biodegradation potential of Guérande microbial mats, slurry experiments were
conducted. Slurries consisted of grounded microbial mats maintained in synthetic seawater
contaminated with Erika fuel oil (0.16 – 0.24 g.l-1). Abiotic controls were done with sterilized
microbial mats. Slurries were incubated in aerobic conditions at 30°C with shaking at 180
rpm under continuous light exposure. Samples were collected through the three months
incubation period. Hydrocarbons composition of Erika fuel oil was analyzed as previously
described [17].
RESULTS
Monitoring the natural degradation of Erika fuel oil
Bourgneuf“ (Vendée-France) (Fig.
), Benzothiophenes (parent and alkyl homologues) (Fig. 2C) and
hrysenes (parent and alkyl homologues) (Fig. 2D) were obtained.
ith the other samples characterized by thin layer of pollutant, less
n period, modifications of Erika fuel oil composition were
bserved in both biotic and abiotic conditions (data not shown). However, although the results
howed an important variation, a biotic degradation could be suspected. Phenanthrene and
ibezothiophene derivatives compounds were among the most biodegraded hydrocarbons.
High molecular weight compounds were less biodegraded.
The results presented in this study were from “Baie de
1A). Samples were collected in various areas according to solar-waves exposure and substrate
nature (Fig. 1B). Table 1 shows the characteristics of the sampling sites. For each sample
collected since March 2001, relative abundances (Hopane Unit) of n-alkanes
(Fig. 2A), n-C30 (Fig. 2B
C
In comparison w
n-alcanes degradation was observed for boulder breakwater samples (thick patches of oil at
the surface and under rocks). Moreover, n-alkanes and n-C30 abundances increased in these
samples. n-alkanes were degraded at a similar rate for samples 1, 4 and 5 despite the different
level at which they were collected. Degradation of light PAHs (Benzothiophene) (Fig. 2C)
was similar for all the samples. Heaviest PAHs such as Chrysenes (Fig. 2D) were degraded at
different rates according to the environmental conditions: supratidal samples were more
degraded than intertidal ones. Fig. 2D shows that the depletion of chrysenes was more
important for the samples collected at a supratidal level (samples 4 and 5) compared to
intertidal samples.
Evaluation of Erika fuel oil degradation capacities of Guérande microbial mats
Through the three months incubatio
o
s
d
190
V. Adaptation des populations bactériennes face à une pollution d’hydrocarbures
Impact of Erika fuel oil on bacterial communities of Guérande microbial mats
the 75th day formed a separate cluster to the other samples (Fig. 3).
urple anoxygenic phototroph community structure changes were analyzed by
eting pufM genes specific to these bacterial populations. T-RFLP fingerprints
the detection of 26 OTUs (Fig. 4). As
h of 200 bp increased in
ng of the fate of Erika fuel oil indicated that n-alkanes were less degraded
thick patches of oil at the surface and under rocks than in samples characterized by thin
e related to
T-RFLP analysis using specific primers targeting eubacterial 16S rRNA encoding genes
allowed to obtain fingerprints with 22 operational taxonomic units (OTUs) revealing an
important diversity. Although the bacterial communities structure changed through the
experimental period in both contaminated and uncontaminated microcosms, the comparison
between the different conditions showed that the evolution was different depending to the
presence of the pollutant. Cluster analysis from the T-RFLP data showed that control samples
from the 30th to
P
T-RFLP targ
showed an abundant bacterial diversity characterized by
observed with eubacterial community structure analysis, biodiversity changes were observed
in both contaminated and uncontaminated microcosms during the experimental period.
However the evolution of some bacterial populations was found to be different according to
experimental conditions. Between the 15th and the 45th days, OTU with length of
132 base pairs (bp) was less developed in presence of Erika fuel oil rather than in control
microcosms. In contrast during the same period OTU with lengt
contaminated microcosms while no changes were observed in uncontaminated conditions.
From the 60th day to the end of the experiment (90th day), OTU with length of 82 bp was also
increased in polluted mats. Comparison between the community fingerprints was obtained by
cluster analysis (Fig. 5). Two main clusters were observed, cluster I with initial samples (from
t0 to t15) and cluster II with samples of the rest of experiment. In cluster I contaminated
sample Bt15 was separated from the other three samples. Similarly, contaminated sample
Bt30 was found to be isolated in cluster II.
DISCUSSION
The in situ monitori
in
layers of pollutant. Thus these results suggested that n-alkanes degradation could b
the thickness of the pollutant layer. Moreover, the “increases” of n-alkanes and
n-C30 abundances for samples from thick patches of oil were also due to the pollutant layer as
all the processes of natural degradation are most effective on thin films of oil. The fact that
samples characterized by a thin layer of pollutant showed that n-alkanes were degraded at
191
V. Adaptation des populations bactériennes face à une pollution d’hydrocarbures
similar rates whatever the level at which they were collected suggest that biodegradation was
cted. The
stions of pufM genes could relate OTU 200 bp to
o different bacterial types: Erythrobacter sp, or the purple sulfur bacteria Halochromatium
01. Therefore more pufM gene sequence data would be useful to improve the
probably the most significant process in the degradation of this compounds. Degradation of
light PAHs (Benzothiophene) was related to evaporation, dissolution, and biodegradation
processes, which are effective for all light compounds. Heaviest PAHs such as Chrysenes,
known to be photosensitive compounds [6], were degraded at different rates according to the
environmental light conditions.
Thus monitoring analysis revealed that the natural degradation was dependent of both the
pollutant thickness and the level from the seawater at which the samples were colle
degradation rate increase as the pollutant layer decreases and supratidal samples appears to be
the most degraded. Nevertheless, although the assessment of natural degradation by using
relative abundance of n-alkanes and PAH could be useful to establish which natural
degradation process occur during an oil weathering, it does not show the “total” degradation
of the pollutant since n-alkanes and PAH represent less than 4% of the Erika fuel oil [20].
Clustering analysis of T-RFLP fingerprints of eubacterial communities indicated that
contaminated communities differ from uncontaminated communities suggesting that Erika
fuel oil disturbs bacterial communities structure. Similar results have been previously reported
showing the impact of toxic compounds to bacterial communities [1, 15]. To further analysis
the impact of the Erika fuel oil on microbial mats, we focus our investigation on purple
anoxygenic phototrophic bacterial (PAB) communities that play an important metabolic role
in microbial mats [27]. Among this PAB community, T-RFLP fingerprints showed that a
PAB population was sensitive to pollutant, i.e., OTU 132 bp related by predictive digestion of
pufM genes to some purple non sulfur bacteria such as Rhodoplanes elegans or Rubrivivax
gelatinosus. Other PAB populations (OTUs 82 and 200 bp) were capable to survive and/or
utilize toxic contamination; predictive dige
tw
salexigens SG32
characterization of PAB populations by T-RFLP analysis. Furthermore, the impact on these
OTUs was observed at different periods indicating that the microbial mats adapted in several
steps by a succession of different communities. These observations were supported by
clustering analysis that showed two main periods. First, a hydrocarbon impact during the first
month characterized by a high divergence between contaminated and uncontaminated
communities at t15 and t30 was observed. This first impact on PAB community would
probably due to both hydrocarbon toxicity and opaqueness character of Erika fuel oil.
192
V. Adaptation des populations bactériennes face à une pollution d’hydrocarbures
Second, for the rest of the experiment similarity between contaminated and uncontaminated
PAB communities was found to increase progressively. In accordance with the appearance of
the contaminated microcosms and the degradation results, these observations suggested that
opaqueness and toxicity due to Erika fuel oil were less important. The observed Erika fuel oil
modification could be explained by both abiotic and/or biotic degradations. Our degradation
results indicated that biodegradation by microorganisms could be suspected. These results are
consistent with preliminary observation demonstrating the low biodegradability of the Erika
fuel oil [19]. However previous studies demonstrated that microorganisms produce surfactants
that facilitate hydrocarbon solubilization and degradation [5, 10, 26]. It was also demonstrated
that microbial mats from different origins were found to be rich in microorganisms with high
biodegradative potential [1, 9]. To further understand biodegradation by microbial mats, it
will be interesting to isolate key microorganisms and fully explore their potentials to degrade
hydrocarbons.
ACKNOWLEDGEMENTS
We acknowledge the financial support by the Ministère de l’Ecologie et du Développement
Durable (MEDD - LIT’EAU/Erika project, N° 01/1213857). The authors are grateful to the
Salines de Guérande for facilitating access to the salterns, sampling and field experiments. SB
and AF are partly supported by a doctoral grant from the Aquitaine region and the Conseil
Général des Pyrénées Atlantiques respectively. We are grateful to Arnaud Verbaere for
technical assistance for T-RFLP analysis and Alexia De Brondeau for slurry experiments.
193
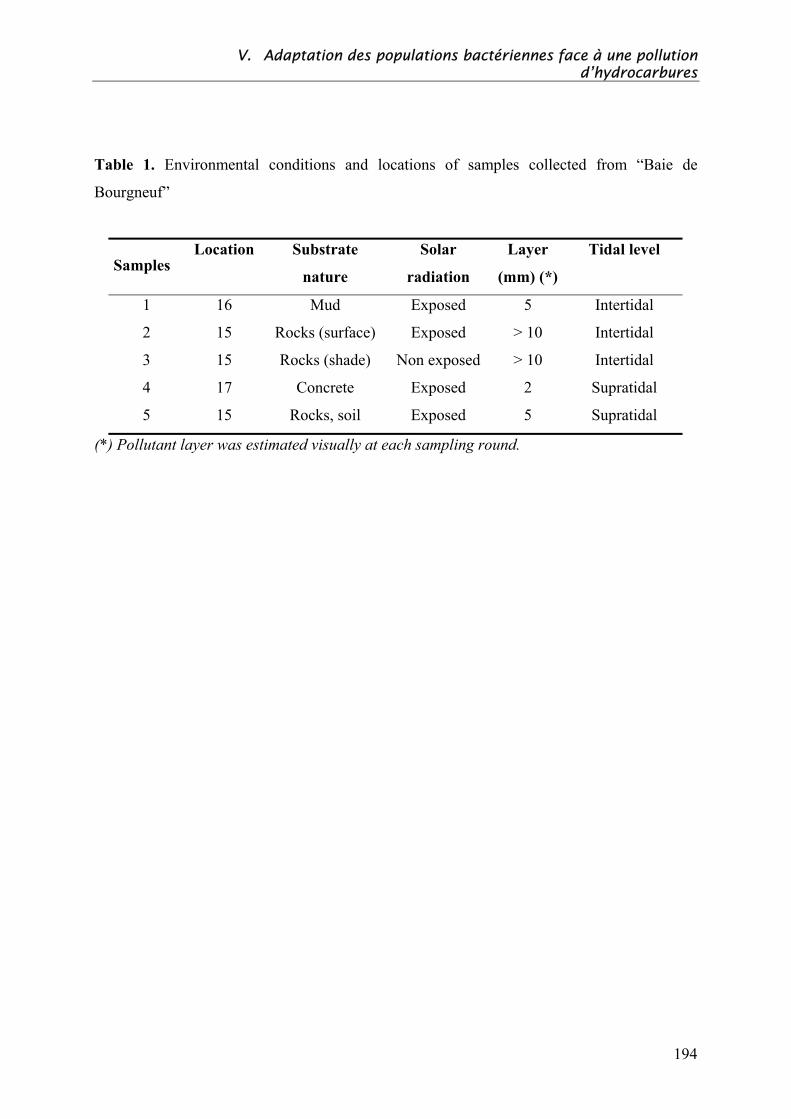
V. Adaptation des populations bactériennes face à une pollution d’hydrocarbures
Table 1. Environmental conditions and locations of samples collected from “Baie de
Bourgneuf”
Samples Location Substrate
nature
Solar
radiation
Layer
(mm) (*)
Tidal level
1 16 Mud Exposed 5 Intertidal
2 15 Rocks (surface) Exposed > 10 Intertidal
3 15 Rocks (shade) Non exposed > 10 Intertidal
4 17 Concrete Exposed 2 Supratidal
5 15 Rocks, soil Exposed 5 Supratidal
(*) Pollutant layer was estimated visually at each sampling round.
194
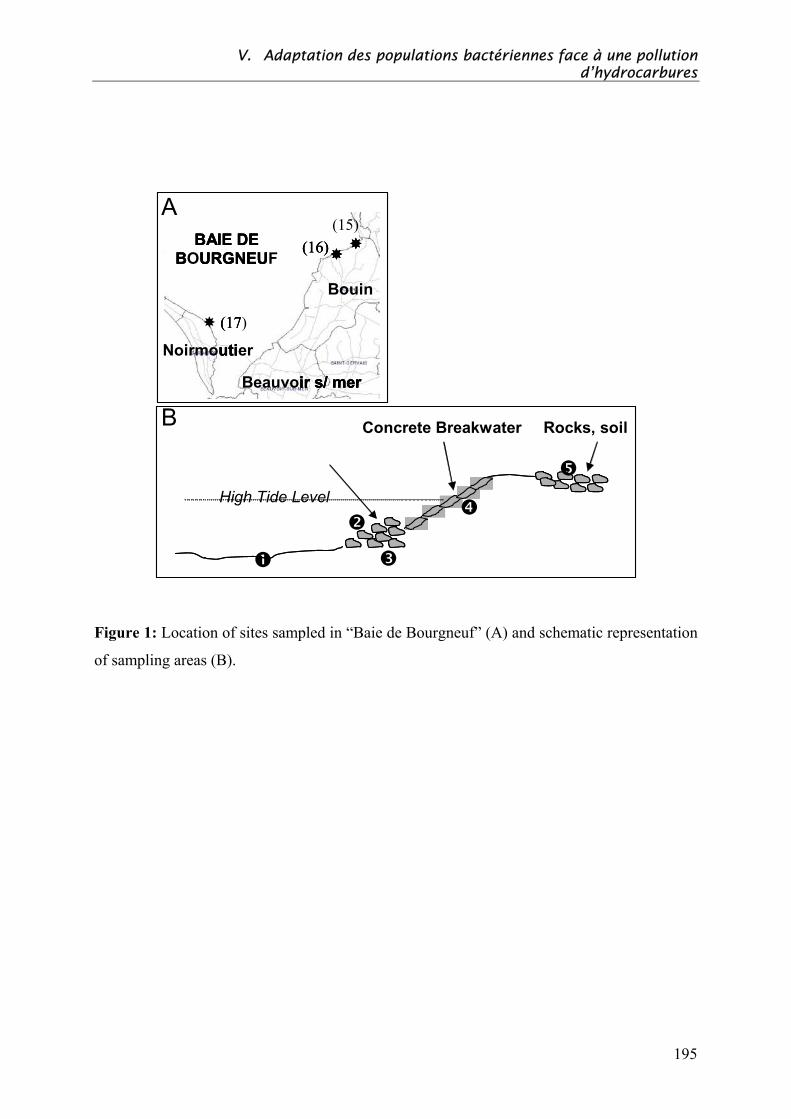
V. Adaptation des populations bactériennes face à une pollution d’hydrocarbures
Figure 1: Location of sites sampled in “Baie de Bourgneuf” (A) and schematic representation
of sampling areas (B).
Boulder BreakwaterBoulder Breakwater
O F
Noirmo er
Bouin
Beauvo
ı )
(15)
High Tide Level
Concrete Breakwater
‒Rocks, soil
A
B
‹›fi
fl
O F
Noirmo er
Bouin
Beauvo
ı )
(15)
O F
Noirmo er
Bouin
Beauvo
ı )
(15)
High Tide Level
Concrete Breakwater
‒Rocks, soil
A
B
‹›fi
fl
BAIE DE
URGNEUB
uti
ir s/ mer
ı ı(16)
(17
BAIE DE
URGNEUB
uti
ir s/ mer
ı ı(16)
(17
BAIE DE
URGNEUB
uti
ir s/ mer
ı ı(16)
(17
195
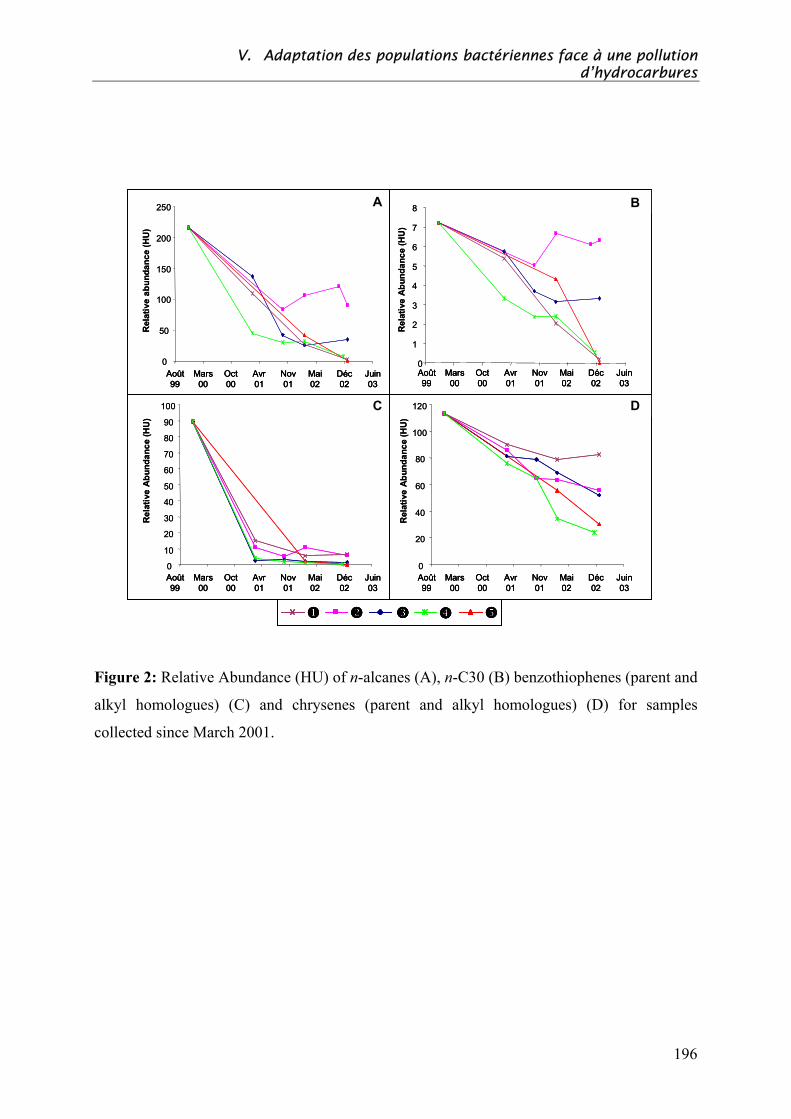
V. Adaptation des populations bactériennes face à une pollution d’hydrocarbures
A B
C D
yx {w z
0
50
100
150
200
250
Août
99
Mars
00
Oct
00
Avr
01
Nov
01
Mai
02
Déc
02
Juin
03
Rela
tive
ab
un
da
nc
e(H
U)
0
10
20
30
40
50
60
70
80
90
100
Rela
tive
Ab
un
da
nc
e(H
U)
0
1
2
3
4
5
6
7
8
Rela
tive
Ab
un
da
nc
e(H
U)
0
20
40
60
80
100
120R
ela
tive
Ab
un
da
nc
e(H
U)
Août
99
Mars
00
Oct
00
Avr
01
Nov
01
Mai
02
Déc
02
Juin
03
Août
99
Mars
00
Oct
00
Avr
01
Nov
01
Mai
02
Déc
02
Juin
03
Août
99
Mars
00
Oct
00
Avr
01
Nov
01
Mai
02
Déc
02
Juin
03
A B
C D
yx {w zyx {w zyyx {w z
0
50
100
150
200
250
Août
99
Mars
00
Oct
00
Avr
01
Nov
01
Mai
02
Déc
02
Juin
03
Août
99
Mars
00
Oct
00
Avr
01
Nov
01
Mai
02
Déc
02
Juin
03
Rela
tive
ab
un
da
nc
e(H
U)
0
10
20
30
40
50
60
70
80
90
100
Rela
tive
Ab
un
da
nc
e(H
U)
0
1
2
3
4
5
6
7
8
Rela
tive
Ab
un
da
nc
e(H
U)
0
20
40
60
80
100
120R
ela
tive
Ab
un
da
nc
e(H
U)
Août
99
Mars
00
Oct
00
Avr
01
Nov
01
Mai
02
Déc
02
Juin
03
Août
99
Mars
00
Oct
00
Avr
01
Nov
01
Mai
02
Déc
02
Juin
03
Août
99
Mars
00
Oct
00
Avr
01
Nov
01
Mai
02
Déc
02
Juin
03
Août
99
Mars
00
Oct
00
Avr
01
Nov
01
Mai
02
Déc
02
Juin
03
Août
99
Mars
00
Oct
00
Avr
01
Nov
01
Mai
02
Déc
02
Juin
03
Août
99
Mars
00
Oct
00
Avr
01
Nov
01
Mai
02
Déc
02
Juin
03
Figure 2: Relative Abundance (HU) of n-alcanes (A), n-C30 (B) benzothiophenes (parent and
lkyl homologues) (C) and chrysenes (parent and alkyl homologues) (D) for samples
ollected since March 2001.
a
c
196
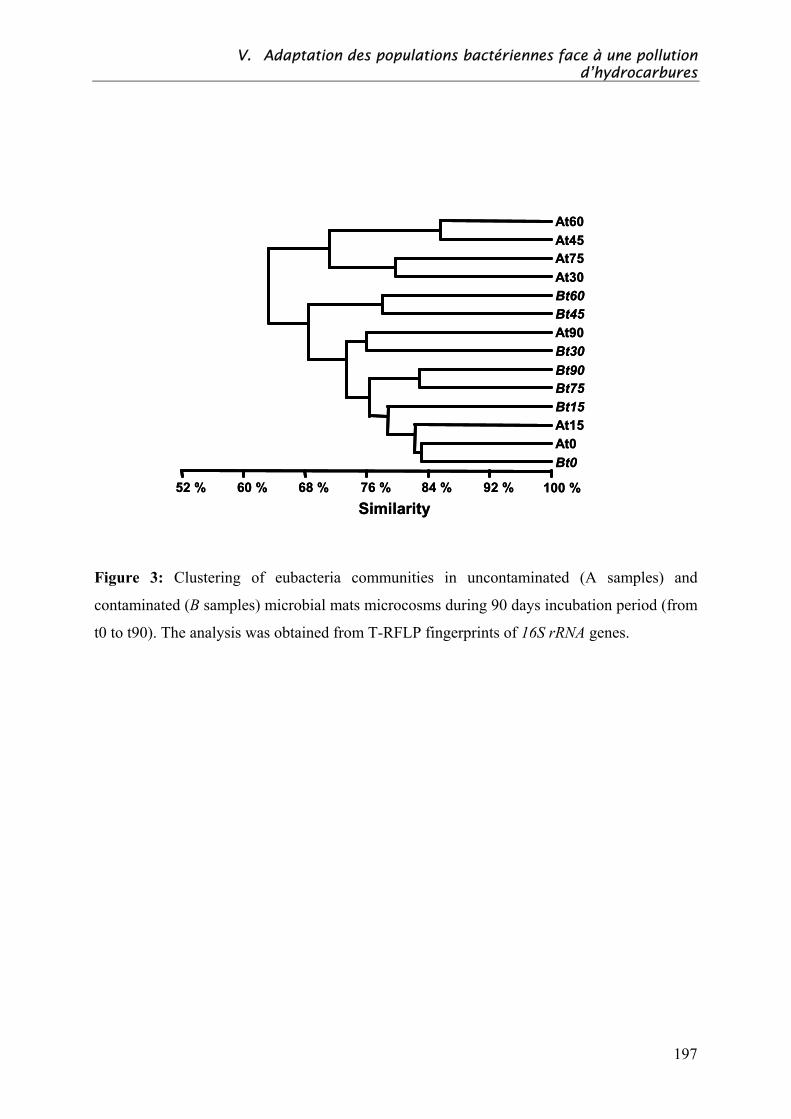
V. Adaptation des populations bactériennes face à une pollution d’hydrocarbures
Figure 3: Clustering of eubacteria communities in uncontaminated (A samples) and
contaminated (B samples) microbial mats microcosms during 90 days incubation period (from
t0 to t90). The analysis was obtained from T-RFLP fingerprints of 16S rRNA genes.
Similarity
Bt0
At0
At15
Bt15
Bt75
Bt90
Bt30
At90
Bt45
Bt60
At30
At75
At45
At60
52 % 60 % 68 % 76 % 84 % 92 % 100 %
Similarity
Bt0
At0
At15
Bt15
Bt75
Bt90
Bt30
At90
Bt45
Bt60
At30
At75
At45
At60
52 % 60 % 68 % 76 % 84 % 92 % 100 %
197

V. Adaptation des populations bactériennes face à une pollution d’hydrocarbures
Length
(bp)
Length
(bp)
Length
(bp)
Length
(bp)
Figure 4: T-RFLP fingerprints of phototroph purple anoxygenic bacteria communities in
uncontaminated (A) and contaminated (B) microbial mats microcosms during 90 days
incubation period. 5’ terminal restriction fragments were obtained after pufM gene enzymatic
digestion by HaeIII. Arrows show OTUs discussed in the text. bp : base pairs
400300200100
Flu
ore
scence
A. Uncontaminated microcosms
400300200100
B. Contaminated microcosms
t = 0 day
t = 15 days
t = 30 days
t = 45 days
t = 60 days
t = 75 days
t = 90 days
82 bp82 bp
132 bp 132 bp 200 bp200 bp
400300200100
Flu
ore
scence
A. Uncontaminated microcosms
400300200100
B. Contaminated microcosms
t = 0 day
t = 15 days
t = 30 days
t = 45 days
t = 60 days
t = 75 days
t = 90 days
82 bp82 bp
132 bp 132 bp 200 bp200 bp
198

V. Adaptation des populations bactériennes face à une pollution d’hydrocarbures
igure 5: Clustering of phototroph purple anoxygenic bacteria communities in
ncontaminated (A samples) and contaminated (B samples) microbial mats microcosms
At0
At15
Bt0
Bt15
At30
Bt75
At45
At60
At90
Bt60
Bt90
At75
Bt45
Bt30
52 % 60 % 68 % 76 % 84 % 92 % 100 %
Similarity
Cluster I
Cluster II
At0
At15
Bt0
Bt15
At30
Bt75
At45
At60
At90
Bt60
Bt90
At75
Bt45
Bt30
52 % 60 % 68 % 76 % 84 % 92 % 100 %
Similarity
Cluster I
Cluster II
F
u
during 90 days incubation period (from t0 to t90). The analysis was obtained from T-RFLP
fingerprints of pufM genes.
199
V. Adaptation des populations bactériennes face à une pollution d’hydrocarbures
REFERENCES
] Abed, R.M., Safi, N.M., Koster, J., de Beer, D., El-Nahhal, Y., Rullkotter, J. and Garcia-
ichel, F., 2002. Microbial diversity of a heavily polluted microbial mat and its community
hanges following degradation of petroleum compounds. Appl. Environ. Microbiol. 68(4),
674-1683.
[2] Caumette, P., Matheron, R., Raymond, N. and Relexans, J.C., 1994. Microbial mats in the
hypersaline ponds of Mediterranean salterns (Salins-de-Giraud, France). FEMS Microbiol.
Ecol. 13, 273-286.
[3] Churchill, S.A., Harper, J.P. and Churchill, P.F., 1999. Isolation and characterization of a
Mycobacterium species capable of degrading three - and four-ring aromatic and aliphatic
hydrocarbons. Appl. Environ. Microbiol. 65(2), 549-552.
[4] Coates, J.D., Woodward, J., Allen, J., Philp, P. and Lovley, D.R., 1997. Anaerobic
degradation of polycyclic aromatic hydrocarbons and alkanes in petroleum-contaminated
marine harbor sediments. Appl. Environ. Microbiol. 63(9), 3589-3593.
[5] Desai, J.D. and Banat, I.M., 1997. Microbial production of surfactants and their
commercial potential. Microbiol. Mol. Biol. Rev. 61(1), 47-64.
[6] Garrett, R.M., Pickering, I.J., Haith, C.E. and Prince, R.C., 1998. Photooxidation of crude
oils. Environ. Sci. Technol. 32, 3719-3723.
] Giani, D., Seeler, J., Giani, L. and Wolfgang, E.K., 1989. Microbial mats and
. Microbiol. Biotechnol. 1(1), 63-70.
] Hoffmann, L., 1996. Recolonisation of the intertidal flats by microbial mats after the Gulf
War oil spill. In: Krupp, F., Abuzinada, A.H. and Nader, I.A. (Eds.) A marine wildlife
sanctuary for the Arabian Gulf: environmental research and conservation following the 1991
Gulf War oil spill. Riyad, Saudi Arabia, and Seneckenberg Research Institue, Frankfurt,
Germany, pp. 96-115.
[10] Hua, Z., Chen, J., Lun, S. and Wang, X., 2003. Influence of biosurfactants produced
by Candida antarctica on surface properties of microorganism and biodegradation of n-
alkanes. Water Res. 37(17), 4143-4150.
[11] Jézéquel, R. Menot, L. Merlin, F-X. Prince, R.C., 2003. Natural Cleanup of Heavy
Fuel Oil on rocks: an in situ Experiment. Mar. Poll. Bull. 46(8), 983-990.
[1
P
c
1
[7
physiochemistry in a saltern in the Bretagne (France) and in a laboratory scale saltern model.
FEMS Microbiol. Ecol. 62, 151-162.
[8] Harayama, S., Kishira, H., Kasai, Y. and Shutsubo, K., 1999. Petroleum biodegradation in
marine environments. J. Mol
[9
200

V. Adaptation des populations bactériennes face à une pollution d’hydrocarbures
[12] Jones, D.A., Plaza, J., Watt, I. and Al Sanei, M., 1998. Long-term (1991-1995)
ic acid techniques in bacterial systematics. Wiley, Chichester, pp. 115-175.
n, S.J., Stephen, J.R., Venosa, A.D., Davis, G.A., Chang, Y.J. and White,
D.O. and Achenbach, L.A., 2000.
carbon 13C/12C ratio
pill. J. Chromatogr A. 923(1-
.O. and Jannasch, H.W., 1995. Phylogenetic
ancient sediments. Englewood Cliffs, NJ: Prentice-Hall.
ane as a conserved
monitoring of the intertidal biota of Saudi Arabia after the 1991 Gulf War Oil Spill. Mar. Poll.
Bulletin. 36(6), 472-489.
[13] Lane, D.J., 1991. 16S/23S rRNA sequencing. In: Stackenbradt, E. and Goodfellow, M.
(Eds.) Nucle
[14] Leahy, J.G. and Colwell, R.R., 1990. Microbial degradation of hydrocarbons in the
environment. Microbiol. Rev. 54(3), 305-315.
[15] MacNaughto
D.C., 1999. Microbial population changes during bioremediation of an experimental oil spill.
Appl. Environ. Microbiol. 65(8), 3566-3574.
[16] Madigan, M.T., Carey, J.C., Milford, A.D., Jung,
New anoxygenic phototrophs from alkaline/cold environments.10th International symposium
on phototrophic prokaryotes, Barcelona, Spain, August 26-31.
[17] Mazeas, L. and Budzinski, H., 2001. Polycyclic aromatic hydro
measurement in petroleum and marine sediments application to standard reference materials
and a sediment suspected of contamination from the Erika oil s
2), 165-176.
[18] Muyzer, G., Teske, A., Wirsen, C
relationships of Thiomicrospira species and their identification in deep-sea hydrothermal vent
samples by denaturing gradient gel electrophoresis of 16S rDNA fragments. Arch. Microbiol.
164(3), 165-172.
[19] Oudot, J., 2000. [Biodegradability of Erika fuel oil]. C R Acad Sci III. 323(11), 945-
950.
[20] Oudot, J., Jézéquel, R., Le Floch, S. and Merlin, F-X, 2002. [Biodégradabilité du fuel
de l’Erika], Proceedings of the 3rd R&D Forum on High-density Oil Spill Response, Brest,
France. p. 228-234.
[21] Peters K.E. and Moldowan J.M., 1993. The Biomarker Guide; Interpreting molecular
fossils in petroleum and
[22] Precigou, S., Goulas, P. and Duran, R., 2001. Rapid and specific identification of
nitrile hydratase (NHase)-encoding genes in soil samples by polymerase chain reaction.
FEMS Microbiol. Lett. 204(1), 155-161.
[23] Prince, R.C., Elmendorf, D.L., Lute, J.R., Hsu, C.S., Haith, C.E., Senius, J.D.,
Dechert, G.J., Douglas, G.S. and Butler, E.L., 1994. 17 α (H),21く (H)-hop
201
V. Adaptation des populations bactériennes face à une pollution d’hydrocarbures
internal marker for estimating the biodegradation of crude oil. Environ. Sci. Technol. 28, 142-
145.
[24] Southward, A.J., 1978. Recolonization of rocky shores in Cornwall after use of toxic
.
ats: A joint of venture. Mar. Geol. 113, 3-25.
dispersants to clean up the Torrey Canyon spill. Journal of Fisheries Research Board, Canada.
35, 682-706.
[25] Swannell, R.P., Lee, K. and McDonagh, M., 1996. Field evaluations of marine oil spill
bioremediation. Microbiol Rev. 60(2), 342-365
[26] Van Dyke, M.I., Lee, H. and Trevors, J.T., 1991. Applications of microbial
surfactants. Biotechnol. Adv. 9(2), 241-252.
[27] Van Gemerden, H., 1993. Microbial m
202
V. Adaptation des populations bactériennes face à une pollution d’hydrocarbures
V.3. Tapis microbien de Camargue soumis à une pollution par
différents pétroles
Ce travail a été soumis au journal “Ophelia” sous le titre :
T-RFLP and functional analyses of bacterial communities changes in microbial mats
i
follow ng petroleum exposure.
Par : Sylvain Bordenave1, Aude Fourçans1, Sophie Blanchard1, Marisol Goni-Urriza1, Pierre
Caumette1 et Robert Duran1
ABSTRACT
Microbial mats from Salins-de-Giraud (Camargue, France) and Guérande (Bretagne, France)
were maintained in microcosm to determine the impact of crude oil contamination on
bacterial communities. Terminal Restriction Fragment Length Polymorphism (T-RFLP)
analyses revealed noticeable changes in the eubacterial community structures concomitant
with petroleum degradation. The results demonstrate clearly different periods with a
succession of different bacterial populations. OTUs with T-RFs that could be related to
Chloroflexus, Burkholderia, Desulfovibrio and Cytophaga genera were found among the
populations well adapted to crude oil exposure. To further evaluate the metabolic ability to
degrade hydrocarbons of such oil contaminated microbial communities, we studied the
diversity of the genes encoding two enzymes known to be involved in hydrocarbon
compounds degradation: the naphthalene and phenanthrene dioxygenases. This analyses
indicated that although the diversity of PAH dioxygenases encoding genes was important
after a three month period of contamination, they were mainly represented by only three
different types. Thus the combined analysis of the taxonomic diversity (16S rRNA encoding
gene analysis) and the functional diversity (dioxygenases analysis) indicated that microbial
community within saline microbial mats plays a role in hydrocarbon degradation.
1 Laboratoire d’Ecologie Moléculaire, Université de Pau BP1155 - 64013 Pau cedex, France
203
V. Adaptation des populations bactériennes face à une pollution d’hydrocarbures
INTRODUCTION
During the last decades, the extensively use of petroleum has increased the risk to release
ompounds such as hydrtoxic c ocarbons into the environment. Among the mechanisms
ontrolling the fate of hydrocarbons after contamination, biodegradation by microorganisms is
and Colwell, 1990; Narro et al.,
992; Abed et al., 2002). Most of our knowledge on oil biodegradation has been collected
from isolated bacterial strains or consortia (Kanaly et al., 2000; Kanaly et al., 2002; Rios-
a et al., 1980). Improvement of bioremediation of polluted
ites requests in situ knowledge on microbial diversity and communities dynamic (Kasai et
exposed to accidental oil spillages and other improper practices,
icrobial mats develop at the water-sediment interface (Van Gemerden, 1993; Caumette et
ce these vertically laminated structures show important bacterial diversity that
functional
iodiversity studies (Brezna et al., 2003; Olsen et al., 1986; Haddad et al., 2001; Feng et al.,
999; Kang et al., 1998; Khan et al., 2001; Contzen et al., 2000).
wo types of hypersaline microbial mats from different environments, Camargue
(Mediterranean French coast) and Guérande (Bretagne, Atlantic French coast), were
c
known to play an important role (Hoffman, 1996; Leahy
1
Hernandez et al., 2003; Cernigli
s
al., 2001; Macnaughton et al., 1999; Nogales et al., 2001).
In coastal zone, particularly
m
al., 1994). Sin
present high metabolic potential for hydrocarbons degradation, they could be considered as
relevant models to study crude oil impact on bacterial communities (Abed et al., 2002).
Characterization of bacterial communities and their response to pollutants is now possible
with recently developed culture-independent molecular techniques. These methods are
suitable for bacterial fingerprinting based on either taxonomic (16S rRNA encoding gene) or
functional analyses (Blackwood et al., 2003; Liu et al., 1997; Muyzer et al., 1993; Dahllöf et
al., 2002; Stach et al., 2002; Moser et al., 2001). For the taxonomic approach, the T-RFLP
(Terminal-Restriction Fragment Length Polymorphism) is a useful method to follow the
bacterial communities adaptation since a high number of samples could be analyzed rapidly.
For the functional purpose, genes involved in hydrocarbon degradation such as dioxygenases
encoding genes are of special interest since their expression products play a key role in
polyaromatic hydrocarbons degradation. Naphthalene and phenanthrene dioxygenases that
catalyze the first step of Polycyclic Aromatic Hydrocarbons (PAH) degradation by
introducing alcohol groups into the aromatic ring have been extensively studied (Ensley et al.,
1982; Resnick et al., 1996). In consequence a large number of nucleic acid sequences of these
genes have been obtained allowing the development of molecular tools for
b
1
T
204
V. Adaptation des populations bactériennes face à une pollution d’hydrocarbures
maintained in microcosms to evaluate the impact of crude oil exposure on microbial
ment (salinity 70 to 110 ‰) under
product. PCR was performed using a reaction mixture of 200 µM each desoxynucleoside
communities. Changes on communities’ structure on the studied mats were followed by
Terminal Restriction Fragment Length Polymorphism (T-RFLP) targeting 16S rRNA
encoding genes. For the estimation of degradation capacities of the Camargue mat, a
molecular method based on diversity analyses of dioxygenases encoding genes using specific
primers has been developed.
MATERIALS AND METHODS
Microbial mat sampling and microcosms experiment set up
Camargue microbial mats develop in a hypersaline environ
Mediterranean climatic conditions with temperatures from 3 to 25°C and annual rainfall of
750 to 1000 mm (Caumette et al., 1994). Guérande microbial mats from a saltern near La
Baule (Bretagne, France) providing environments of various salinities, ranging from the salt
concentration of sea-water up to those at which NaCl precipitates (Giani et al., 1989). The
mean day light temperature in the area is 11°C to 12°C, with rainfall of 800 to
900 mm per year. Microbial mats from Salins-de-Giraud (Camargue, France) and Guérande
(Bretagne, France) were maintained in microcosms at room temperature with sterilized
synthetic seawater (salinity 70 ‰). A cycle of 16 H daylight / 8 H dark was applied.
Approximately equal amounts of Maya oil (200 to 300 mg) were added on the surfaces of
contaminated mats before adding synthetic seawater.
At different times of incubation, samples were taken randomly on microcosms with Pasteur
micropipettes and conserved immediately at -80°C. Biodiversity was evaluated by the T-
RFLP method and dioxygenases encoding genes diversity by RFLP method.
Genomic DNA extraction
Mixed community DNA was extracted from microbial mat fractions with the Ultraclean soil
DNA isolation kit (Mo Bio Laboratories), by using the recommended protocol with minor
modifications as previously described (Precigou et al., 2001).
PCR amplification and purification
Optimization of PCR was performed for each sample by adjusting the amount of genomic
DNA extract used to obtain a strong band on an agarose gel, without visible non-specific
205

V. Adaptation des populations bactériennes face à une pollution d’hydrocarbures
triphosphate (Qiagen), 1.5 mM MgCl2, 1.25 U of Taq polymerase (Qiagen), 1X PCR Buffer
(Qiagen), and 0.2 µM each primer. The first primers used were the general eubacterial primer
8-27F (Lane, 1991), and the universal primer 1472-1489R (Muyzer et al., 1995) amplifying
specifically the 16S ribosomal gene. Forward primers 8-27F were hexachlorofluorescein
labeled. PCR (50µl) was performed in a MJ Research PTC-100 thermocycler by using an
initial denaturation step of 95°C for 3 minutes, followed by 24 cycles of a program consisting
f denaturation at 95°C for 30 seconds, primer annealing at 52°C for 30 seconds, and
seconds. A final extension at 72°C for
f cycles were completed. PCR
s). The 5’
were conducted
ith every PCR and run on Genescan gels.
cted by using peak which fluorescence was higher than
stimating dioxygenases encoding genes diversity in microbial mats
H dioxygenases encoding genes in the microcosm mats
TACCACGTBGGTTGGAC and FRT3B: CATGTCTTTTTCKACVATGGC). This set of
o
extension at 72°C for 30
7 minutes was performed after the programmed numbers o
products were then purified by using the GFX DNA and Gel Band Purification kit
(Amersham Biosciences) as directed by the supplier.
Restriction enzyme digestion and products purification
300 ng of amplified DNA were digested with 10 U of HaeIII restriction enzyme (New
England BioLabs) in a final volume of 30 µl 37°C during 3h.
T-RFLP analysis
Restricted PCR product was mixed with 0.5 µl of TAMRA500 size standard (Applied
Biosystems). DNA fragments were separated by size by capillary electrophoresis at 15,000
Volts for 30 minutes on an ABI PRISM 310 Genetic Analyzer (Applied Biosystem
terminal fragments were visualized by excitation of the hexachlorofluorescein molecule (hex)
attached to the forward primer. The gel image was captured and analyzed by using Genescan
version 3.1 analysis software (ABI). Negative controls (no genomic DNA)
w
Data sets were constru
100 Fluorescence units for at least one sample. Statistical analyses (canonical analysis) were
done with MVSP software (Multi-Variate Statistical Package 3.1, Kovach Computing
Services).
E
Diversity of the α subunit of the PA
were analyzed using degenerated primers designed for this experiment (FRT6A:
206
V. Adaptation des populations bactériennes face à une pollution d’hydrocarbures
degenerated primers was used to amplify dioxygenases genes from DNA extracted before and
after the contamination with crude oil. Then, the PCR products were cloned in E. coli (Topo
cloning kit, Invitrogen). Inserts were amplified using specific vector primers and analyzed by
HaeIII endonuclease restriction. Some of the inserts showing different restriction patterns
were sequenced.
RESULTS
Changes of bacterial communities in Camargue microbial mat during crude oil
contamination
Through the three months period of contamination, T-RFLP profiles of the eubacterial
community (16S rRNA encoding gene) were obtained at different incubation times. In these
acterial fingerprints, biodiversity was represented by detected terminal restriction fragments
operational taxonomic unit (OTU).
m the contaminated mat were
und more variable than those obtained from the uncontaminated control. Quite important
he fingerprints were observed in contaminated microcosms during the
th
TU of T-RF 314 bp was found specifically in the th
rd
th th
was observed at the 103rd day of incubation; three new OTUs with length of 221,
85, and 346 bp were detected.
b
(T-RFs or peaks); each of them could be associated to an
According to the different incubation periods, approximately twenty OTUs could be
considered for each sample (Figure 1). T-RFLP profiles fro
fo
modifications of t
incubation period. Some OTUs, as for example the T-RF with length of 35 bases pairs (bp),
were detected during all the incubation period on T-RFLP profiles while others were found
specifically on few profiles. OTUs with length of 291 bp and 62 bp were not observed
respectively after the 3 and 12 first days of incubation. In contrast, from the 12 day of
incubation new OTUs with length of 146, 200, and 314 bp were detected. OTUs with length
of 146 and 200 bp T-RFs were then found in all the profiles obtained until the end of
incubation period (103 days) whereas the O
12 day profile. After 30 days of incubation a new OTU of T-RF 213 bp was detected and
remained until the 103 day of incubation. It is noteworthy that the T-RFLP profiles were not
modified between the 30 and the 40 day of incubation. An important change of the T-RFLP
fingerprint
2
207
V. Adaptation des populations bactériennes face à une pollution d’hydrocarbures
Changes of bacterial communities in Guérande microbial mat during crude oil
contamination
T-RFLP analysis allowed following the whole eubacterial community (16S rRNA encoding
gene) changes in Guérande mat microcosms during the three months contamination period
(Figure 2). At each sampling time T-RFLP fingerprints were characterized by twenty-two
ain OTUs that were considered for our analyses. These analyses showed that bacterial
changes occurred in both contaminated and uncontaminated microcosms.
e oil. For example, between the 30th and the 75th day the abundance of the
by combining cloning, Restriction Fragment Length
olymorphism (RFLP) analyses and sequencing. The analyses of dioxygenases diversity in
e Camargue microbial mat after 30 days crude oil exposure showed the presence of different
FLP patterns allowing the distribution of dioxygenases encoding genes in ten groups (Figure
). The identity as dioxygenases encoding sequences of each pattern was demonstrated by
m
communities
However the modifications observed were found different according to the presence or the
absence of crud
OTU with length of 376 bp remained stable on control mats while it decreased in polluted
mts. Although T-RFLP fingerprints of Guérande microbial mats showed low variations,
succession of bacterial populations during crude oil exposure was revealed with statistical
analyses. Correspondence analyses (CA) based on T-RFLP data showed that bacterial
communities were separated in three main clusters (Figure 3A). From both contaminated and
uncontaminated mats, bacterial communities of the first 15 days (At0, Bt0, At15 and Bt15)
were grouped in a first cluster with those of the last day of incubation (At90 and Bt90).
Between the 30th and the 75th days, two other clusters were obtained separating bacterial
communities from contaminated mats to those from uncontaminated mats. The cluster formed
by the control samples was explained by the first axis, showing a high percentage (34,5%) of
the variance corresponding to some OTUs (376 and 225 bp) that could not be identified
(Figure 3B). The cluster formed by the contaminated samples was mostly influenced by the
second axis (23,8%). This included OTUs with length of 199 bp corresponding to
Desulfovibrio sp. and 238 bp that could be related to several bacterial strains.
Estimating dioxygenases encoding genes diversity in microbial mats
For the analyses of dioxygenases diversity by PCR based method, several couples of primers
were designed and tested. Among them, the couple FRT6A-FRT3B amplifying a
413 bp PCR product was selected in order to determine the dioxygenases diversity in
contaminated microbial mats
P
th
R
4
208
V. Adaptation des populations bactériennes face à une pollution d’hydrocarbures
DNA sequencing. The main three groups corresponded to 85% (40, 25, and 20% respectively)
of the whole detected genes. The other seven groups were found to be equally represented.
th th
rd
rd
ciated to crude
il exposure in laboratory experiments (Abed et al., 2002). The fact that some photosynthetic
since light is no more
filamentous green bacteria in hydrocarbons degradation by a photoheterotrophic growth
DISCUSSION
In the present study we used molecular based methods to monitor the impact of crude oil
exposure on microbial communities. Microbial mats were maintained in microcosms under
controlled conditions. During the contamination period changes on the petroleum composition
were observed (data not shown). Although the degradation of petroleum composition could be
attributed mainly to physico-chemical processes, chemical analysis showed that
biodegradation by microorganisms could also be suspected (data not shown). From this
experimental set up, biodiversity of the whole eubacterial community changes were found
following hydrocarbon pollution.
In Camargue mat microcosms three principal periods were observed. Briefly, during the first
period (0 to 12 days) several sensitive bacterial populations (OTUs) were eliminated, then a
transient period (between the 30 and 40 days) revealed the domination of other OTUs, and
finally at the 103 day we observed the development of a novel dominant bacterial
populations. During the first 12 days the fingerprint changes showed the first impact of the
contamination on microbial community. This result indicated both the bacterial adaptation to
pollutant and sensitivity of some OTUs. The sensitive OTU with length of 291 bp was no
more detected after the 3 day suggesting that this OTU was one of the first affected by the
contamination. Interestingly, this OTU could be related to cyanobacteria species with
Ribosomal Data Project (RDP; http://rdp.cme.msu.edu/html/) analyses. This result is
consistent with previous observation of cyanobacteria species elimination asso
o
species were the first affected in our experiment was not surprising
available through the oil layer and petroleum compounds are known to inhibit cyanobacteria
metabolism (Megharaj et al., 2000; Radwan and Al-Hasan, 2000). In contrast during this first
period, new OTUs became conspicuous in the fingerprints. Because microbial communities
within contaminated ecosystems tend to be dominated by organisms capable of utilizing
and/or surviving toxic contamination (Macnaughton et al., 1999), the marked rise of bacterial
species presumes their important role in hydrocarbons biodegradation. Among them, the OTU
with length of 200 bp could be related with RDP to the genus Chloroflexus. Similar
observations have been reported in a recent study showing the possible role of these
209
V. Adaptation des populations bactériennes face à une pollution d’hydrocarbures
(Abed et al., 2002). During the second period, between 30 and 40 days of incubation, a
stability of the bacterial community structure of Camargue microbial mat was observed
dicating that these populations were well adapted to both presence of crude oil and
ditions. This suggested that the dominant OTUs found in these fingerprints
erial populations during crude oil exposure of Guérande
in
experimental con
might play a role in hydrocarbons degradation. The third period, at the 103rd day of
incubation, showed an important change in the bacterial community structure within the mat
revealing the presence of three novel dominant OTUs of 221, 285, and 346 bp. These OTUs
could be related to genera containing known hydrocarbon-degrading bacteria such as
Burkholderia (221 bp) and Cytophaga (285 bp). Thus these important changes could be
explained in part by the adaptation of the bacterial communities to the metabolites formed and
the new physico-chemical conditions resulting from the degradation of crude oil.
Similarly, the succession of bact
microbial mats allowed showing the adaptation of bacterial communities in response to
hydrocarbons pollutions. This impact was particularly observed between the 30th and 75th day
since bacterial communities from contaminated and uncontaminated mats formed two distinct
clusters. During this period of incubation, CA showed that noticeable OTUs in contaminated
microcosm could be related to Desulfovibrio sp.. Species of this sulfate-reducing bacterium
genus have been isolated from contaminated sites (Richardson et al., 2002; Wu et al., 2002;
Watts et al., 2001) suggesting a possible role of such bacteria in hydrocarbon degradation.
The diversity of genes encoding naphthalene and phenanthrene dioxygenases was analyzed at
the 30th day of incubation period when Camargue microbial mat showed stable and therefore
adapted community. Obviously, the detection of diverse PAH dioxygenase genes demonstrate
that Camargue microbial mat possesses a potential for PAH degradation. The fact that three
dominants PAH dioxygenase genes were detected would suggest that these genes play an
important role in hydrocarbons degradation. Therefore, bacterial species possessing these
genes could be considered to be well adapted to crude oil exposure under the experimental
conditions.
In conclusion the impact of crude oil contamination on the studied microbial mats was
characterized by successive changes of bacterial communities with the replacement of
sensitive species by more adapted or resistant species. These modifications are probably
correlated to the evolution of direct and indirect pollutant effects. Furthermore, such alteration
of the community composition could also be useful as a bioindicator of hydrocarbons
210
V. Adaptation des populations bactériennes face à une pollution d’hydrocarbures
pollutions. To further understand biodegradation by microbial mats, it will be interesting to
isolate key microorganisms and fully explore their potentials to degrade hydrocarbons.
ACKNOWLEDGEMENTS
We acknowledge the financial support by the EC (MATBIOPOL project, grant EVK3-CT-
1999-00010) and the Ministère de l’Ecologie et du Développement Durable (MEDD -
LIT’EAU/Erika project, N° 01/1213857). The authors are grateful to the Salines de Guérande
and the company of Salins du Midi at Salins-de-Giraud for facilitating access to the salterns,
sampling and field experiments. SB and AF were partly supported by a doctoral grant from
the Aquitaine region and the Conseil Général des Pyrénées Atlantiques respectively.
211
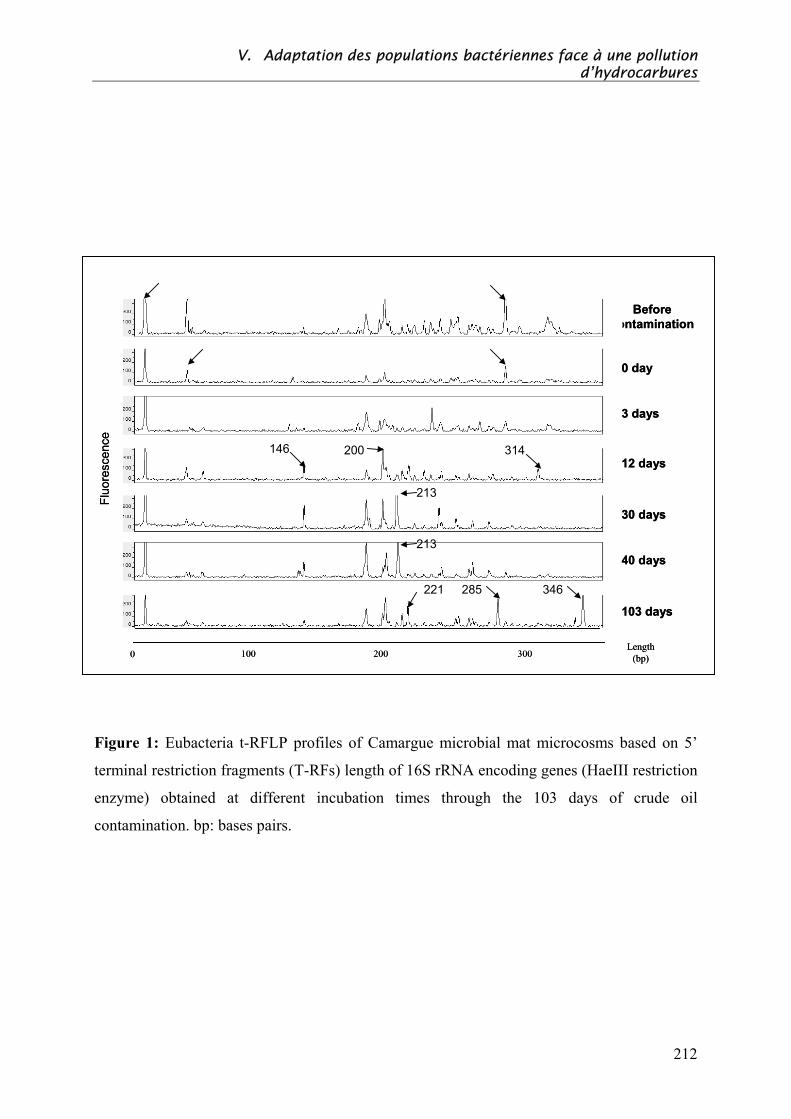
V. Adaptation des populations bactériennes face à une pollution d’hydrocarbures
Before
contamination
62
35 291
291
Before
contamination
62
35 291
291
Figure 1: Eubacteria t-RFLP profiles of Camargue microbial mat microcosms based on 5’
terminal restriction fragments (T-RFs) length of 16S rRNA encoding genes (HaeIII restriction
enzyme) obtained at different incubation times through the 103 days of crude oil
contamination. bp: bases pairs.
103 days
3 days
12 days
30 days
40 days
0 day
Flu
ore
scence
146 200
213
221 285 346
314
213
300200100Length
(bp)0
103 days
3 days
12 days
30 days
40 days
0 day
Flu
ore
scence
146 200
213
221 285 346
314
213
300200100Length
(bp)0
212
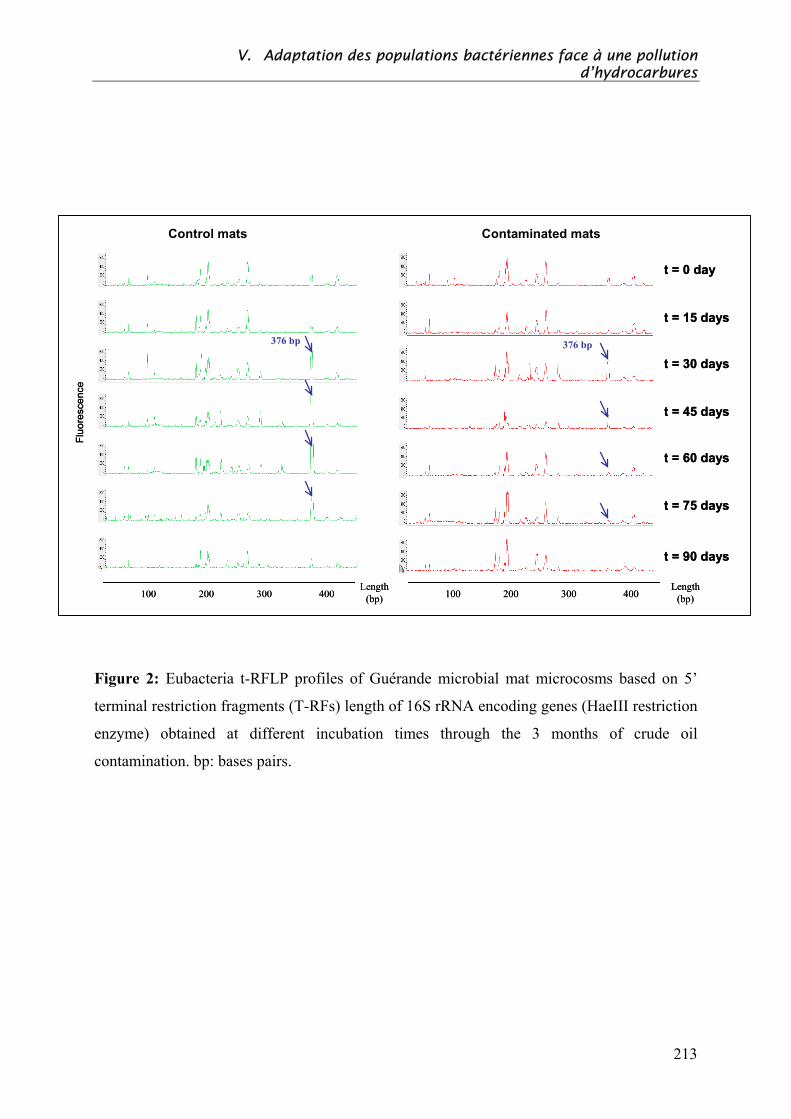
V. Adaptation des populations bactériennes face à une pollution d’hydrocarbures
400300200100
Flu
ore
sce
nce
Length(bp)
376 bp
Control mats
400300200100Length
(bp)
Contaminated mats
t = 0 day
t = 15 days
t = 30 days
t = 45 days
t = 60 days
t = 75 days
t = 90 days
376 bp
400300200100
Flu
ore
sce
nce
Length(bp)
376 bp
Control mats
400300200100Length
(bp)
Contaminated mats
t = 0 day
t = 15 days
t = 30 days
t = 45 days
t = 60 days
t = 75 days
t = 90 days
376 bp
Figure 2: Eubacteria t-RFLP profiles of Guérande microbial mat microcosms based on 5’
rminal restriction fragments (T-RFs) length of 16S rRNA encoding genes (HaeIII restriction te
enzyme) obtained at different incubation times through the 3 months of crude oil
contamination. bp: bases pairs.
213
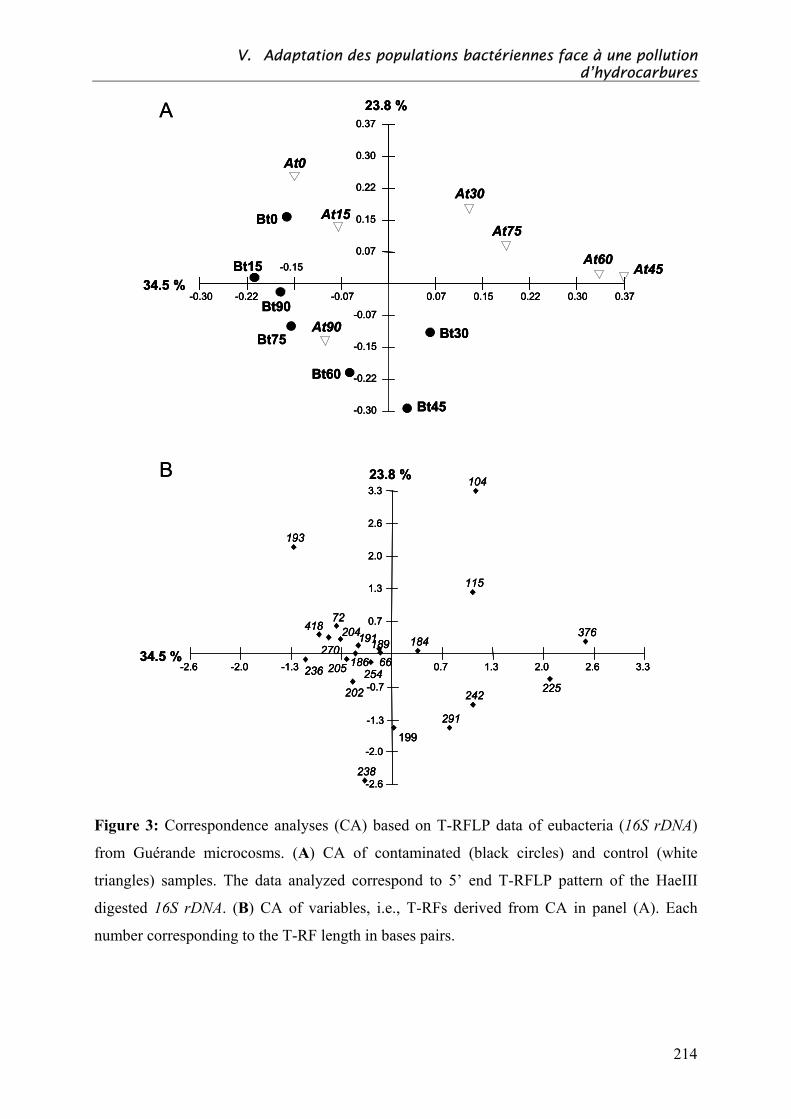
V. Adaptation des populations bactériennes face à une pollution d’hydrocarbures
23.8 %
34.5 %
At0
At15
At30
At45At60
At75
At90
Bt0
Bt15
Bt30
Bt45
Bt60
Bt75
Bt90-0.07
-0.15
-0.22
-0.30
0.07
0.15
0.22
0.30
0.37
-0.07
-0.15
-0.22-0.30 0.07 0.15 0.22 0.30 0.37
23.8 %
34.5 % 66
72
104
115
184
186
189191
193
202
204
238
270
291
376418
-2.0
-2.6
0.7
1.3
2.0
2.6
3.3
-1.3-2.0-2.6 0.7 1.3 2.0 2.6 3.3
-1.3
A
B
23.8 %
34.5 %
At0
At15
At30
At45At60
At75
At90
Bt0
Bt15
Bt30
Bt45
Bt60
Bt75
Bt90-0.07
-0.15
-0.22
-0.30
0.07
0.15
0.22
0.30
0.37
-0.07
-0.15
-0.22-0.30 0.07 0.15 0.22 0.30 0.37
23.8 %
34.5 %
At0
At15
At30
At45At60
At75
At90
Bt0
Bt15
Bt30
Bt45
Bt60
Bt75
Bt90-0.07
-0.15
-0.22
-0.30
0.07
0.15
0.22
0.30
0.37
-0.07
-0.15
-0.22-0.30 0.07 0.15 0.22 0.30 0.37
23.8 %
34.5 % 66
72
104
115
184
186
189191
193
202
204
238
270
291
376418
-2.0
-2.6
0.7
1.3
2.0
2.6
3.3
-1.3-2.0-2.6 0.7 1.3 2.0 2.6 3.3
-1.3
23.8 %
34.5 % 66
72
104
115
184
186
189191
193
202
204
238
270
291
376418
-2.0
-2.6
0.7
1.3
2.0
2.6
3.3
-1.3-2.0-2.6 0.7 1.3 2.0 2.6 3.3
-1.3
A
B
214
Figure 3: Correspondence analyses (CA) based on T-RFLP data of eubacteria (16S rDNA)
from Guérande microcosms. (A) CA of contaminated (black circles) and control (white
triangles) samples. The data analyzed correspond to 5’ end T-RFLP pattern of the HaeIII
digested 16S rDNA. (B) CA of variables, i.e., T-RFs derived from CA in panel (A). Each
number corresponding to the T-RF length in bases pairs.
199
205
225
236
242
254-0.7
199
205
225
236
242
254-0.7
199
205
225
236
242
254-0.7
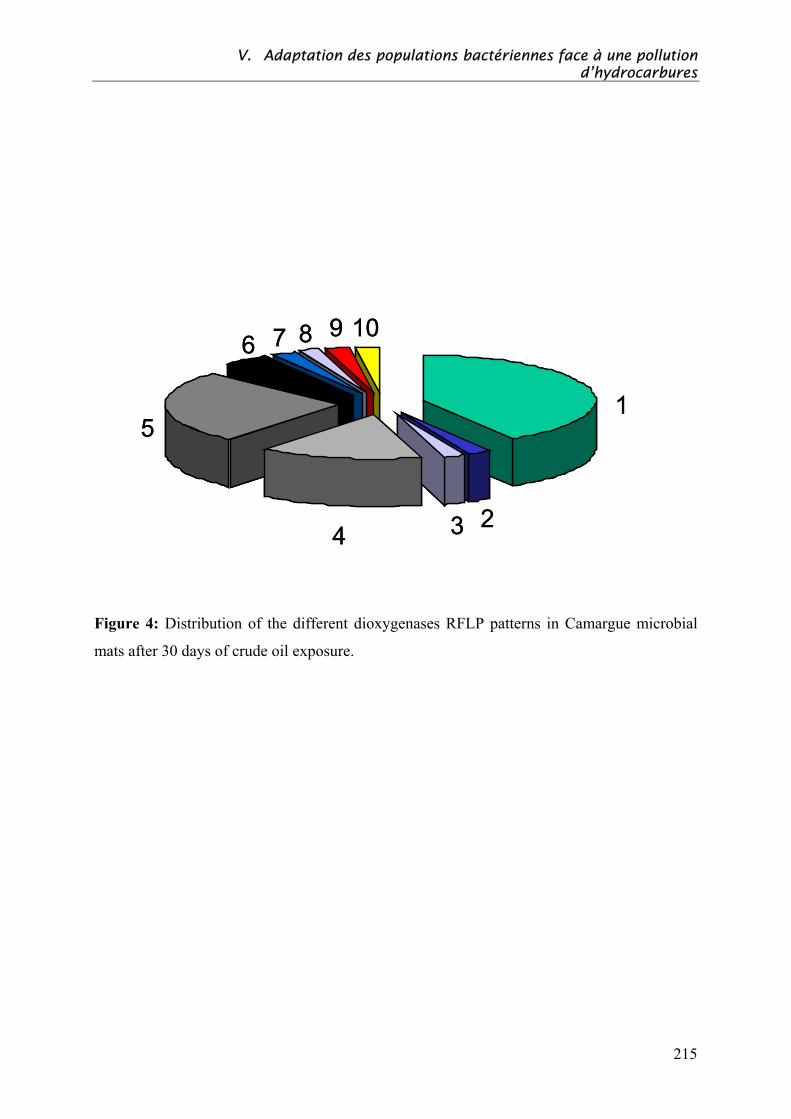
V. Adaptation des populations bactériennes face à une pollution d’hydrocarbures
1
234
5
6 7 8 9 10
1
234
5
6 7 8 9 10 Figure 4: Distribution of the different dioxygenases RFLP patterns in Camargue microbial
ats after 30 days of crude oil exposure. m
215
V. Adaptation des populations bactériennes face à une pollution d’hydrocarbures
REFERENCES
bed, R.M., Safi, N.M., Koster, J., de Beer, D., El-Nahhal, Y., Rullkotter, J. and Garcia-
ichel, F. 2002. Microbial diversity of a heavily polluted microbial mat and its community
hanges following degradation of petroleum compounds. Appl. Environ. Microbiol. 68(4):
674-1683.
l-Hasan, R.H., Al-Bader, D.A., Sorkhoh, N.A. and Radwan, S.S. 1998. Evidence for n-
lkane consumption and oxidation by filamentous cyanobacteria from oil-contaminated coasts
f the Arabian Gulf. Mar. Biol. 130: 521-527.
lackwood, C.B., Marsh, T., Kim, S.H. and Paul, E.A. 2003. Terminal restriction fragment
ngth polymorphism data analysis for quantitative comparison of microbial communities.
ppl. Environ. Microbiol. 69(2): 926-932.
rezna, B., Khan, A.A. and Cerniglia, C.E. 2003. Molecular characterization of dioxygenases
om polycyclic aromatic hydrocarbon-degrading Mycobacterium spp. FEMS Microbiol. Lett.
23(2): 177-183.
aumette, P., Matheron, R., Raymond, N. and Relexans, J.-C. 1994. Microbial mats in the
ypersaline ponds of Mediterranean salterns (Salins-de-Giraud, France). FEMS Microbiol.
col. 13: 273-286.
erniglia, C.E., Van Baalen, C. and Gibson, D.T. 1980. Oxidation of biphenyl by the
yanobacterium, Oscillatoria sp., strain JCM. Arch. Microbiol. 125(3): 203-207.
grading bacterium Agrobacterium radiobacter strain
2. J. Bacteriol. 182(21): 6123-6129.
ahllof, I. 2002. Molecular community analysis of microbial diversity. Curr. Opin.
Biotechnol. 13(3): 213-217.
Ensley, B.D., Gibson, D.T. and Laborde, A.L. 1982. Oxidation of naphthalene by a
multicomponent enzyme system from Pseudomonas sp. strain NCIB 9816. J. Bacteriol.
149(3): 948-954.
Feng, Y., Khoo, H.E. and Poh, C.L. 1999. Purification and characterization of gentisate 1,2-
dioxygenases from Pseudomonas alcaligenes NCIB 9867 and Pseudomonas putida NCIB
9869. Appl. Environ. Microbiol. 65(3): 946-950.
Giani, D., Seeler, J., Giani, L. and Wolfgang, E.K. 1989. Microbial mats and physiochemistry
in a saltern in the Bretagne (France) and in a laboratory scale saltern model. FEMS Microbiol.
Ecol. 62: 151-162.
A
P
c
1
A
a
o
B
le
A
B
fr
2
C
h
E
C
c
Contzen, M. and Stolz, A. 2000. Characterization of the genes for two protocatechuate 3, 4-
dioxygenases from the 4-sulfocatechol-de
S
D
216
V. Adaptation des populations bactériennes face à une pollution d’hydrocarbures
Haddad, S., Eby, D.M. and Neidle, E.L. 2001. Cloning and expression of the benzoate
Krupp, F., Abuzinada, A.H. and Nader, I.A. (Eds.) A marine wildlife sanctuary
1-796.
ill accident.
quence, and expression of genes encoding a polycyclic
Colwell, R.R. 1990. Microbial degradation of hydrocarbons in the
fragment length polymorphisms of genes
dioxygenase genes from Rhodococcus sp. strain 19070. Appl. Environ. Microbiol. 67(6):
2507-2514.
Hoffmann, L. 1996. Recolonisation of the intertidal flats by microbial mats after the Gulf War
oil spill. In:
for the Arabian Gulf: environmental research and conservation following the 1991 Gulf War
oil spill. Riyad, Saudi Arabia, and Seneckenberg Research Institue, Frankfurt, Germany, pp.
96-115.
Kanaly, R.A., Bartha, R., Watanabe, K. and Harayama, S. 2000. Rapid mineralization of
benzo[a]pyrene by a microbial consortium growing on diesel fuel. Appl. Environ. Microbiol.
66(10): 4205-4211.
Kanaly, R.A., Harayama, S. and Watanabe, K. 2002. Rhodanobacter sp. strain BPC1 in a
benzo[a]pyrene-mineralizing bacterial consortium. Appl. Environ. Microbiol. 68(12): 5826-
5833.
Kang, B.S., Ha, J.Y., Lim, J.C., Lee, J., Kim, C.K., Min, K.R. and Kim, Y. 1998. Structure of
catechol 2,3-dioxygenase gene from Alcaligenes eutrophus 335. Biochem. Biophys. Res.
Commun. 245(3): 79
Kasai, Y., Kishira, H., Syutsubo, K. and Harayama, S. 2001. Molecular detection of marine
bacterial populations on beaches contaminated by the Nakhodka tanker oil-sp
Environ. Microbiol. 3(4): 246-255.
Khan, A.A., Wang, R.F., Cao, W.W., Doerge, D.R., Wennerstrom, D. and Cerniglia, C.E.
2001. Molecular cloning, nucleotide se
aromatic ring dioxygenase from Mycobacterium sp. strain PYR-1. Appl. Environ. Microbiol.
67(8): 3577-3585.
Lane, D.J. 1991. 16S/23S rRNA sequencing. In: Stackenbradt, E. and Goodfellow, M. (Eds.)
Nucleic acid techniques in bacterial systematics. Wiley, Chichester, pp. 115-175.
Leahy, J.G. and
environment. Microbiol. Rev. 54(3): 305-315.
Liu, W.T., Marsh, T.L., Cheng, H. and Forney, L.J. 1997. Characterization of microbial
diversity by determining terminal restriction
encoding 16S rRNA. Appl. Environ. Microbiol. 63(11): 4516-4522.
217
V. Adaptation des populations bactériennes face à une pollution d’hydrocarbures
MacNaughton, S.J., Stephen, J.R., Venosa, A.D., Davis, G.A., Chang, Y.J. and White, D.C.
1999. Microbial population changes during bioremediation of an experimental oil spill. Appl.
Environ. Microbiol. 65(8): 3566-3574.
rading bacteria. Appl. Microbiol. Biotechnol. 55(5): 609-618.
ng for 16S rRNA. Appl. Environ. Microbiol. 59(3): 695-700.
ring gradient gel electrophoresis of 16S rDNA fragments. Arch. Microbiol. 164(3):
ne cyanobacterium Agmenellum quadruplicatum PR-6. Appl.
ribosomal DNA and 16S rRNA to study the bacterial
osomal RNA approach. Annu. Rev. Microbiol. 40: 337-365.
tion. FEMS
ollution and cyanobacteria. In: B. A. Whitton
c oxidation of fluorene,
dibenzofuran, and dibenzothiophene by naphthalene dioxygenase from Pseudomonas sp.
strain NCIB 9816-4. Appl. Environ. Microbiol. 62(11): 4073-4080.
Megharaj, M., Singleton, I., McClure, N.C. and Naidu, R. 2000. Influence of petroleum
hydrocarbon contamination on microalgae and microbial activities in a long-term
contaminated soil. Arch. Environ. Contam. Toxicol. 38(4): 439-445.
Moser, R. and Stahl, U. 2001. Insights into the genetic diversity of initial dioxygenases from
PAH-deg
Muyzer, G., de Waal, E.C. and Uitterlinden, A.G. 1993. Profiling of complex microbial
populations by denaturing gradient gel electrophoresis analysis of polymerase chain reaction-
amplified genes codi
Muyzer, G., Teske, A., Wirsen, C.O. and Jannasch, H.W. 1995. Phylogenetic relationships of
Thiomicrospira species and their identification in deep-sea hydrothermal vent samples by
denatu
165-172.
Narro, M.L., Cerniglia, C.E., Van Baalen, C. and Gibson, D.T. 1992. Metabolism of
phenanthrene by the mari
Environ. Microbiol. 58(4): 1351-1359.
Nogales, B., Moore, E.R., Llobet-Brossa, E., Rossello-Mora, R., Amann, R. and Timmis,
K.N. 2001. Combined use of 16S
community of polychlorinated biphenyl-polluted soil. Appl. Environ. Microbiol. 67(4): 1874-
1884.
Olsen, G.J., Lane, D.J., Giovannoni, S.J., Pace, N.R. and Stahl, D.A. 1986. Microbial ecology
and evolution: a rib
Precigou, S., Goulas, P. and Duran, R. 2001. Rapid and specific identification of nitrile
hydratase (NHase)-encoding genes in soil samples by polymerase chain reac
Microbiol. Lett. 204(1): 155-161.
Radwan, S.S. and Al-Hasan, R.H. 2000. Oil p
and M. Potts (Eds.) The ecology of cyanobacteria. Kluwer Academic Publishers, Dordrecht,
The Netherlands, pp. 307-319.
Resnick, S.M. and Gibson, D.T. 1996. Regio- and stereospecifi
218
V. Adaptation des populations bactériennes face à une pollution d’hydrocarbures
Richardson, R.E., Bhupathiraju, V.K., Song, D.L., Goulet, T.A. and Alvarez-Cohen, L. 2002.
Phylogenetic characterization of microbial communities that reductively dechlorinate TCE
based upon a combination of molecular techniques. Environ. Sci. Technol. 36(12): 2652-2662.
degrading microbial
ive analysis
y catalyzes the reductive dechlorination of polychlorinated biphenyls with doubly
Rios-Hernandez, L.A., Gieg, L.M. and Suflita, J.M. 2003. Biodegradation of an alicyclic
hydrocarbon by a sulfate-reducing enrichment from a gas condensate-contaminated aquifer.
Appl. Environ. Microbiol. 69(1): 434-443.
Stach, J.E. and Burns, R.G. 2002. Enrichment versus biofilm culture: a functional and
phylogenetic comparison of polycyclic aromatic hydrocarbon-
communities. Environ. Microbiol. 4(3): 169-182.
Van Gemerden, H. 1993. Microbial mats: A joint of venture. Mar. Geol. 113: 3-25.
Watts, J.E., Wu, Q., Schreier, S.B., May, H.D. and Sowers, K.R. 2001. Comparat
of polychlorinated biphenyl-dechlorinating communities in enrichment cultures using three
different molecular screening techniques. Environ. Microbiol. 3(11): 710-719.
Wu, Q., Watts, J.E., Sowers, K.R. and May, H.D. 2002. Identification of a bacterium that
specificall
flanked chlorines. Appl. Environ. Microbiol. 68(2): 807-812.
219

Conclusions et perspectives
Conclusions et perspectives
220

Conclusions et perspectives
Conclusions et Perspectives:
Les travaux menés au cours de ces trois années de recherche ont été centrés sur le suivi
de la diversité bactérienne de tapis microbiens soumis à des stress environnementaux.
L’objectif de cette étude était donc de décrire à la fois l’organisation spatiale des tapis
microbiens en terme de diversité des populations bactériennes, mais aussi de mettre en
évidence la dynamique de cette structure hautement organisée en réponse à des stress
récurrents que sont la salinité et les variations journalières des microgradients d’oxygène et de
sulfure ou ponctuels comme les déversements de polluants.
Cette étude a été abordée par T-RFLP, approche moléculaire permettant le traitement
et la comparaison d’un grand nombre d’échantillons. En effet, cette méthode a permis de
décrire à une très petite échelle, de l’ordre d’une centaine de micromètres, la biodiversité
bactérienne présente au sein de différents tapis microbiens et de mettre ainsi en évidence leurs
fines organisations structurales. La comparaison des empreintes bactériennes ainsi obtenues a
révélé une dynamique de la structure bactérienne de ces écosystèmes, autant sur le plan spatial
que temporel, face à l’influence de gradients physico-chimiques verticaux ou de pollutions
accidentelles. De plus, par le biais de collaborations au sein du projet MATBIOPOL, l’apport
d’approches pluridisciplinaires a permis de compléter cette étude et d’aborder cette structure
bactérienne en tant qu’écosystème dynamique capable de s’adapter aux conditions
environnementales fluctuantes.
Dans un premier temps, la description de deux tapis microbiens photosynthétiques a
été effectuée, à l’échelle du micromètre, en combinant différentes approches d’analyses. La
biodiversité bactérienne des différentes communautés eubactéries, bactéries phototrophes
anoxygéniques pourpres et bactéries sulfato-réductrices a été analysée par ribotypage
moléculaire à l’aide de la T–RFLP, voire de la DGGE. Les résultats de ces approches
moléculaires ont été corrélés à ceux des analyses biogéochimiques, des analyses de
microscopie (CLSM), et des analyses des biomarqueurs lipidiques. L’alliance de ces
différents résultats a permis de mettre en lien les communautés bactériennes présentes et leurs
rôles écologiques au sein de ces écosystèmes complexes.
Le tapis microbien hypersalé des marais salants de Camargue révèle ainsi une
organisation très fine, constituée de couches verticales distinctes de quelques micromètres, où
s’agencent les populations bactériennes en fonction de leurs caractéristiques physiologiques et
221
Conclusions et perspectives
des conditions environnementales. La surface de ces tapis est totalement dominée par les
cyanobactéries filamenteuses, principalement Microcoleus chthonoplastes. De plus, la
distribution des bactéries phototrophes pourpres et sulfato-réductrices est fonction des
gradients mesurés de sulfure, d’oxygène et de lumière.
Le tapis photosynthétique marin des Iles Orcades montre une structure différente,
dominée par les bactéries pourpres, très diversifiées et principalement représentées par le
genre Thiocapsa. Les cyanobactéries y sont plus faiblement représentées. Comme pour le
tapis microbien précédent, la structure de la diversité bactérienne des anoxyphototrophes et
des sulfato-réducteurs est très finement organisée le long de gradients physico-chimiques.
Ainsi, l’analyse de ces deux écosystèmes microbiens a permis de mettre en évidence
l’observation générale d’une fine structure des populations bactériennes au sein des tapis,
quelle que soit la nature de ces populations. Cette organisation verticale se révèle être le reflet
des divers métabolismes bactériens mis en jeu dans ces écosystèmes, induits par les
conditions environnementales de l’habitat. Les principales populations fonctionnelles
bactériennes composant ces tapis microbiens sont généralement comparables, cependant en
terme de diversité leur variabilité se situe au niveau de leurs abondances et de leurs richesses
en espèces. Dans notre étude, la salinité et les conditions climatiques, fort différentes entre les
marais salants de Camargue et les plages des Iles Orcades, influeraient donc beaucoup sur le
développement de certaines espèces bactériennes.
La seconde partie de cette étude s’est portée sur l’analyse de la distribution spatio-
temporelle de groupes fonctionnels bactériens composant le tapis microbien de Camargue au
cours d’un cycle nycthéméral. En effet, la fine organisation verticale des tapis microbiens
observée, décrite dans le chapitre précédent, montre une structuration particulière des
communautés bactériennes en fonction des conditions environnementales. Les microgradients
verticaux d’oxygène, de sulfure, et de lumière présents au sein des tapis, fluctuent de manière
importante au cours d’un cycle jour / nuit. Il s’agissait donc d’observer l’influence de ces
facteurs physico-chimiques sur la localisation de ces communautés. Les comportements des
principaux groupes fonctionnels composant ces tapis microbiens photosynthétiques, à savoir,
les cyanobactéries, les bactéries anoxygéniques pourpres et les bactéries sulfato-réductrices,
ont été mis en évidence par leur signature moléculaire ADNr 16S via l’approche de la T-
RFLP.
Ceci a permis de montrer des comportements adaptatifs chez ces différentes
populations. La composition et la structure du tapis microbien de Camargue, en terme de
222
Conclusions et perspectives
diversité et d’abondance, que ce soit pour les communautés photosynthétiques ou les
communautés sulfato-réductrices, est très différente au cours du cycle jour / nuit. Ceci révèle
un fort impact des paramètres physico-chimiques sur la distribution verticale des bactéries du
tapis. Ainsi, dues aux variations des microgradients au sein du tapis, différentes réponses des
microorganismes à ce stress ont été observées : allant de la tolérance aux fluctuations,
l’agrégation entre bactéries, à la mise en place de métabolismes versatiles permettant une
meilleure adaptation de celles-ci. Néanmoins, le principal effet observé est la migration d’un
grand nombre de ces microorganismes afin de se localiser où les conditions de croissance sont
optimales ou de fuir les toxicités éventuelles. De ce fait, parmi les sulfato-réducteurs le genre
Desulfotignum a montré une nette migration verticale vers le fond du tapis en journée, suivant
ainsi le déplacement de la zone anoxique et fuyant l’oxygène riche en surface, du à une
photosynthèse oxygénique active des cyanobactéries. Cette réponse adaptative par migration
suggère fortement des mécanismes plus complexes d’«Energy» tactisme.
L’analyse de l’impact d’hydrocarbures sur les tapis microbiens de Guérande et de
Camargue a été le troisième point abordé dans ce travail. L’effet de différents pétroles sur la
biodiversité et donc la composition en communautés bactériennes de ces deux tapis
microbiens a pu être étudié par la mise en place de microcosme. Ceci a permis le maintien de
tapis microbiens en conditions contrôlées de pH, de salinité et de luminosité ; et de les incuber
en présence de pétroles donnés.
Ainsi, l’influence des paramètres environnementaux sur la dégradation naturelle de ces
pétroles a pu être démontrée. De plus, l’impact réel de la pollution sur les communautés du
tapis a été observé, puisque l’étude a montré une adaptation séquentielle des différentes
communautés bactériennes au cours de la période de pollution. En effet, au fur et à mesure
des modifications de la composition des pétroles, différentes communautés bactériennes se
succèdent révélant les capacités d’adaptation de ces écosystèmes face à ce stress
d’hydrocarbures. Dans un premier temps, les communautés bactériennes sensibles aux
hydrocarbures deviennent minoritaires, puis les communautés capables de résister et ou de
dégrader les hydrocarbures présents deviennent majoritaires. Bien que les analyses chimiques
aient montré l’évolution des pétroles, la dégradation par les micro-organismes n’a pu être
clairement mise en évidence dans ces systèmes. Toutefois, l’analyse de la diversité des gènes
codant pour les dioxygénases montre une grande diversité suggérant que les tapis microbiens
possèdent un potentiel de dégradation important.
223
Conclusions et perspectives
A la suite de cette étude, il apparaît que les microorganismes présents dans les tapis
microbiens peuvent adopter différentes attitudes face à des stress environnementaux variés.
Par conséquent, les microorganismes semblent posséder un panel de réponses adaptatives très
diverses. Au cours de cette étude, différentes réponses ont pu être observées :
• Vis à vis d’un stress salin, les microorganismes sélectionnés par leur résistance et
participant à la structuration des tapis microbiens sont des organismes taxonomiquement
différents ayant des aptitudes halotolérantes à halophiles.
• Différents comportements sont induits par chimiotactisme tels que l’agrégation des
bactéries entre elles afin de mieux résister aux mauvaises conditions environnantes.
• Chez les bactéries possédant des métabolismes versatiles, d’autres voies
métaboliques mieux adaptées aux nouvelles conditions de l’habitat peuvent être mises en
place.
• Le déplacement reste un comportement majeur d’adaptation chez les
microorganismes. Les mécanismes permettant le déplacement sont également très variés. En
effet, ils peuvent mettre en œuvre des flagelles, des systèmes de vacuoles de gaz ou des
systèmes de glissement. Cette réponse est souvent régie par l’«Energy» tactisme guidant la
migration de ces microorganismes vers des niches adaptées.
• Lorsque la pollution par des hydrocarbures constitue un stress environnemental
chronique, elle induit aussi une sélection de microorganismes, soit tolérants aux
hydrocarbures, soit capables de les dégrader possédant des activités hydrocarbonoclastes.
Afin d’approfondir ce travail et d’essayer de répondre aux diverses questions amenées
par les observations faites au cours de ces recherches, il serait judicieux de compléter cette
étude descriptive par des approches fonctionnelles.
224
Conclusions et perspectives
225
En effet, l’analyse in situ de l’expression de gènes impliqués dans l’«Energy»
tactisme, dans le métabolisme de dégradation des hydrocarbures ou bien dans
l’osmorégulation, pourrait apporter de nombreuses informations. Les techniques de FISH
(Fluorescence In Situ Hybrization), micro-arrays (ou puce ADN), RT-PCR (Reverse
Transcription Polymerase Chain Reaction) pourraient être mises en œuvre pour suivre ces
différentes réponses. Ceci permettrait une meilleure compréhension des mécanismes mis en
jeux lors des réponses bactériennes face aux stress, et d’appréhender plus en détails la réponse
dynamique de ces écosystèmes que sont les tapis microbiens.

Références bibliographiques
Références bibliographiques
226

Références bibliographiques
Références bibliographiques
Abed, R. M., Safi, N. M., Koster, J., de Beer, D., El-Nahhal, Y., Rullkotter, J. and
García-Pichel, F. (2002). Microbial diversity of a heavily polluted microbial mat and its
community changes following degradation of petroleum compounds. Applied and
Environmental Microbiology 68, 1674-1683.
Achenbach, L. A., Carey, J. and Madigan, M. T. (2001). Photosynthetic and phylogenetic
primers for detection of anoxygenic phototrophs in natural environments. Applied and
Environmental Microbiology 67, 2922-2926.
Adler, J. (1988). Chemotaxis : old and new. Botanica Acta 101.
Aeckersberg, F., Bak, F. and Widdel, F. (1991). Anaerobic oxidation of saturated
hydrocarbons to CO2 by new type of sulfate-reducing bacterium. Archives of Microbiology
156, 5-14.
Alexandre, G. and Zhulin, I. B. (2001). More Than One Way To Sense Chemicals. Journal
of Bacteriology 183, 4681-4686.
Alexandre, G., Greer-Phillips, S. and Zhulin, I. B. (2004). Ecological role of energy taxis
in microorganisms. FEMS Microbiology Reviews 28, 113-126.
Amann, R.,
Combination of 16S rRNA-targeted oligonucleotide probes with flow cytometry for analyzing
mixed micro
Barton, L. L. and Tomei, F. A. (1995). Characteristics and activities of sulfate-reducing
acteria. In Sulfate-Reducing Bacteria, pp. 1-32. Edited by L. L. Barton. New York: Peplum
y throughout the salinity gradient of a coastal
solar saltern. Environmental Microbiology 4, 349-360.
Benzécri, J. P. (1976). L'analyse des données, l'analyse des correspondances. Paris.
Bield, H. and Pfennig, N. (1978). Growth yields of green sulfur bacteria mixed cltures with
sulfur and sulfate-reducing bacteria. Archives of Microbiology 117, 9-16.
Binder, B., Olson, R., Chisholm, S., Devereux, R. and Stahl, D. (1990).
bial populations. Applied and Environmental Microbiology 56, 1919-1925.
b
press.
Bebout, B. and Garcia-Pichel, F. (1995). UV B-induced vertical migrations of cyanobacteria
in a microbial mat. Appl. Environ. Microbiol. 61, 4215-4222.
Benlloch, S., López-López, A., Casamayor, E. O., Ovreas, L., Goddard, V., Daae, F. L.,
Smerdon, G., Massana, R., Joint, I., Thingstad, F., Pedros-Alio, C. and Rodriguez-
Valera, F. (2002). Prokaryotic genetic diversit
227

Références bibliographiques
Blackwood, C. B., Marsh, T., Kim, S.-H. and Paul, E. A. (2003). Terminal Restriction
Fragment Length Polymorphism Data Analysis for Quantitative Comparison of Microbial
Communities. Applied and Environmental Microbiology 69, 926-932.
Blankenship, R. E. and Hartman, H. (1998). The origin and evolution of oxygenic
photosynthesis. Trends in Biochemical Sciences 23, 94-97.
Brambilla, E., Hippe, H., Hagelstein, A., Tindall, B. J. and Stackebrandt, E. (2001). 16S
rDNA diversity of cultured and uncultured prokaryotes of a mat sample from Lake Fryxell,
McMurdo Dry Valleys, Antarctica. Extremophiles 5, 23-33.
Canfield, D. E. and Des Marais, D. J. (1991). Aerobic sulfate reduction in microbial mats.
Science 251, 1471-1473.
Canfield, D. E. and Des Marais, D. J. (1993). Biogeochemical cycles of carbon, sulfur, and
free oxygen in a microbial mat. Geochimica et Cosmochimica Acta 57, 3971-3984.
Canosa, I., Sanchez-Romero, J. M., Yuste, L. and Rojo, F. (2000). A positive feedback
mechanism controls expression of AlkS, the transcriptional regulator of the Pseudomonas
oleovorans alkane degradation pathway. Molecular Microbiology 35, 791-799.
Casamayor, E. O., Massana, R., Benlloch, S., Ovreas, L., Diez, B., Goddard, V. J., Gasol,
J. M., Joint, I., Rodríguez-Valera, F. and Pedrós-Alió, C. (2002). Changes in archaeal,
bacterial and eukaryal assemblages along a salinity gradient by comparison of genetic
fingerprinting methods in a multipond solar saltern. Environmental Microbiology 4, 338-348.
Castenholz, R. W. (1994). Microbial mats research: The recent past and new perspectives. In
Microbial Mats, pp. 3-18. Edited by L. J. Stal and P. Caumette. Berlin Heidelberg: Springer-
Verlag.
Castro, H. F., Williams, N. H. and Ogram, A. (2000). Phylogeny of sulfate-reducing
bacteria. FEMS Microbiology Ecology 31, 1-9.
Caumette, P., Baulaigue, R. and Matheron, R. (1988). Characterization of Chromatium
salexigens sp. nov., a halophilic Chromatiaceae isolated from Mediterranean salinas.
Systematic and Applied Microbiology 10, 284-292.
Caumette, P., Baulaigue, R. and Matheron, R. (1991). Thiocapsa halophila sp. nov., a new
halophilic phototrophic purple sulfur bacterium. Archives of Microbiology 155, 170-176.
Caumette, P., Matheron, R., Raymond, N. and Relexans, J. C. (1994). Microbial mats in
the hypersaline ponds of Mediterranean salterns (Salins-de-Giraud, France). FEMS
Microbiology Ecology 13, 273-286.
Cohen, Y. (2002). Bioremediation of oil by marine microbial mats. International
Microbiology 5, 189-193.
228
Références bibliographiques
Cypionka, H. (2000). Oxygen respiration by Desulfovibrio species. Annual Review of
Microbiology 54, 827-848.
Cypionka, H., Widdel, F. and Pfennig, N. (1985). Survival of sulfate-reducing bacteria after
detecting phylogenetic subgroups of sulfate-reducing bacteria.
w type of
fur bacteria in
ebs and marine processes. Oceanography and Marine Biology Reviews 137, 1369-
, K. (1993). Metabolism of dibenzothiophene
lar and ultra violet radiation on motility,
ities. Applied and Environmental Microbiology 67, 190-
oxygen stress, and growth in sulfate-free oxygen-sulfide gradients. FEMS Microbiology
Letters 31, 39-45.
Dade, W. B., Davis, J. D., Nichols, P. D., Nowell, A. R. M., Thistle, D., Trexler, M. B. and
White, D. C. (1990). Effects of bacterial exopolymer adhesion on the entrainment of sand.
Geomicrobiological Journal 8, 1-16.
Daly, K., Sharp, R. J. and McCarthy, A. J. (2000). Development of oligonucleotide probes
and PCR primers for
Microbiology 146, 1693-1705.
D'Amelio, E. D., Cohen, Y. and Des Marais, D. J. (1987). Association of a ne
gliding, filamentous, purple phototrophic bacterium inside bundles of Microcoleus
chthonoplastes in hypersaline cyanobacterial mats. Archives of Microbiology 147, 213-220.
De Wit, R. and Caumette, P. (1994). Diversity of and interactions among sul
microbial mats. In Microbial Mats, pp. 379-391. Edited by L. J. Stal and P. Caumette. Berlin
Heidelberg: Springer-Verlag.
de Wit, R., van den Ende, F. P. and van Gemerden, H. (1995). Mathematical simulation of
the interactions among cyanobacteria, purple sulfur bacteria and chemotrophic sulfur bacteria
in microbial mat communities. FEMS Microbiology Ecology 17, 117-135.
Decho, A. W. (1990). Microbial exopolymer secretions in ocean environments : their role(s)
in food w
1374.
Denome, S., Stanley, D., Olson, E. and Young
and naphthalene in Pseudomonas strains: complete DNA sequence of an upper naphthalene
catabolic pathway. Journal of Bacteriology 175, 6890-6901.
Donkor, V. and Häder, D. P. (1991). Effects of so
photomovement and pigmentation in filamentous, gliding cyanobacteria. FEMS Microbiology
Ecology 86, 159-168.
Dunbar, J., Ticknor, L. O. and Kuske, C. R. (2001). Phylogenetic specificity and
reproducibility and new method for analysis of terminal restriction fragment profiles of 16S
rRNA genes from bacterial commun
197.
229
Références bibliographiques
Duque, E., Segura, A., Mosqueda, G. and Ramos, J. L. (2001). Global and cognate
regulators control the expression of the organic solvent efflux pumps TtgABC and TtgDEF of
new pathways in Alcanivorax sp. strain MBIC 4326. . Applied and
affecting Terminal Restriction Fragment Length
, J. and Guerrero, R. (1992). Typology and structure of
l
y of sulfate-reducing bacteria. In Sulfate-reducing bacteria, pp.
gel electrophoresis
ayor, S., Wild, M., Boyes, A. and Williams, P. (1998). A gene cluster encoding steps
iddel, F. (1999). Physiology,
Anaerobic degradation of
t soils. Nature 413, 380-381.
Pseudomonas putida. Molecular Microbiology 39, 1100-1106.
Dutta, T. and Harayama, S. (2001). Biodegradation of n-alkylcycloalkanes and n-
alkylbenzenes via
Environmental Microbiology 67, 1970-1974.
Egert, M. and Friedrich, M. W. (2003). Formation of pseudo-Terminal Restriction
Fragments, a PCR-related bias
Polymorphism analysis of microbial community structure. Applied and Environmental
Microbiology 69, 2555-2562.
Esteve, I., Martínez, M., Mir
microbial mats communities in Spain: A preliminary study. Limnetica 8, 185-195.
Farnleitner, A. H., Kreuzinger, N., Kavka, G. G., Grillenberger, S., Rath, J. and Mach,
R. L. (2000). Comparative analysis of denaturing gradient gel electrophoresis and tempora
temperature gradient gel electrophoresis in separating Escherichia coli uidA amplicons
differing in single base substitutions. Lett Appl Microbiol 30, 427-431.
Fauque, G. D. (1995). Ecolog
217-241. Edited by L. L. Barton. New York: Peplum press.
Fenchel, T. (2002). Microbial behavior in a heterogeneous world. Science 296, 1068-1071.
Ferris, M. J., Muyzer, G. and Ward, D. M. (1996). Denaturing gradient
profiles of 16S rRNA-defined populations inhabiting a hot spring microbial mat community.
Applied and Environmental Microbiology 62, 340-346.
Fuenm
in conversion of naphthalene to gentisate in Pseudomonas sp. strain U2. Journal of
Bacteriology 180, 2522-2530.
Fukui, M., Teske, A., Aßmus, B., Muyzer, G. and W
phylogenetic relationships, and ecology of filamentous sulfate-reducing bacteria (genus
desulfonema). Archives of Microbiology 172, 193-203.
Galushko, A., Minz, D., Schink, B. and Widdel, F. (1999).
naphthalene by a pure culture of a novel type of marine sulphate-reducing bacterium.
Environmental Microbiology 1, 415-420.
Garcia-Pichel, F. and Pringault, O. (2001). Microbiology. Cyanobacteria track water in
deser
230
Références bibliographiques
García-Pichel, F., Mechling, M. and Castenholz, R. W. (1994). Diel migrations of
microorganisms within a benthic, hypersaline mat community. Applied and Environmental
Microbiology 60, 1500-1511.
Geissdorfer, W., Kok, R., Ratajczak, A., Hellingwerf, K. and Hillen, W. (1999). The
genes rubA and rubB for alkane degradation in Acinetobacter sp. strain ADP1 are in an
operon with estB, encoding an esterase, and oxyR. Journal of Bacteriology 181, 4292-4298.
, E., Zablen, L. B., Gupta, R. and Woese, C. (1979). A
). a new
r reply 6342-6343.
microbial community structure.
distinct monooxygenases for alkane
d Shutsubo, K. (1999). Petroleum biodegradation
R., Aeckersberg, F., Minz, D., Rossello-Mora, R. and
Widdel, F. (1999). Anaerobic oxidation of o-xylene, m-xylene, and homologous
Giani, D., Seeler, J., Giani, L. and Krumbein, W. E. (1989). Microbial mats and
physicochemistry in a saltern in the Bretagne (France) and in a laboratory scale saltern model.
FEMS Microbiology Ecology 62, 151-162.
Gibson, J. E., Stackebrandt
phylogenetic analysis of the purple photosynthetic bacteria. Current Microbiology 3, 59-64.
Gloe, A., Pfennig, N., Brockmann, H. and Trowitchzsch, W. (1975
bacteriochlorophyll from brown-colored Chlorobiaceae. Archives of Microbiology 102, 103-
109.
Grant, A. and Ogilvie, L. A. (2003). Terminal restriction fragment length polymorphism
data analysis. Applied and Environmental Microbiology 69, 6342; autho
Grant, A. and Ogilvie, L. A. (2004). Name that microbe: rapid identification of taxa
responsible for individual fragments in fingerprints of
Molecular Ecology Notes 4, 133-136.
Grossman, A. R., Bhaya, D., Apt, K. E. and Kehoe, D. M. (1995). Light-harvesting
complexes in oxygenic photosynthesis: diversity, control, and evolution. Annu Rev Genet 29,
231-288.
Grotzschel, S., Koster, J., Abed, R. M. and de Beer, D. (2002). Degradation of petroleum
model compounds immobilized on clay by a hypersaline microbial mat. Biodegradation 13,
273-283.
Guerrero, R., Urmeneta, J. and Rampone, G. (1993). Distribution of types of microbial
mats at the Ebro Delta, Spain. Biosystems 31, 135-144.
Hamamura, N., Yeager, C. and Arp, D. (2001). Two
oxidation in Nocardiodes sp. strain CF8. Applied and Environmental Microbiology 67, 4992-
4998.
Harayama, S., Kishira, H., Kasai, Y. an
in marine environments. Journal of Molecular and Microbiological Biotechnology 1, 63-70.
Harms, G., Zengler, K., Rabus,
231
Références bibliographiques
alkylbenzenes by new types of sulfate-reducing bacteria. Appl Environ Microbiol 65, 999-
1004.
Herbert, R. (1985). Development of mass blooms of photosynthetic bacteria on sheltered
.,
la sp. nov. and emendation of the genus
ss ? A marine wildlife sanctuary for the Arabian gulf., 85-95.
w
e, a novel Mo-Fe-S enzyme. Journal of Bacteriology
oxic interface environments. Philosophical Transactions of the Royal Society of
fur bacteria in cyanobacterial mats. FEMS Microbiology Ecology 38, 179-186.
ts. Limnology and Oceanography 33,
microbial benthic microbial : microelectrode and SEM studies of four cyanobacterial
f
beaches in Scapa Flow, Orkney Islands. Proceedings of the Royal Society of Edinburgh 87,
15-25.
Hirschler-Rea, A., Matheron, R., Riffaud, C., Moune, S., Eatock, C., Herbert, R. A
Willison, J. C. and Caumette, P. (2003). Isolation and characterization of spirilloid purple
phototrophic bacteria forming red layers in microbial mats of Mediterranean salterns:
description of Halorhodospira neutriphi
Halorhodospira. International Journal of Systematic and Evolutionary Microbiology 53, 153-
163.
Höpner, T., Yousef, M., Berthe-Corti, L., Felzmann, H., Struck, H. and AL-Thukair, A.
(1996). Cyanobacterial mats on oil-polluted sediments - start of a promising self-remediation
proce
Imhoff, J. F. (1992). Taxonomy, phylogeny and general ecology of anoxygenic phototrophic
bacteria. In Photosynthetic bacteria, pp. 53-92. Edited by N. H. Mann and N. G. Carr. Ne
York: Peplum Press.
Johnson, H., Pelletier, D. and Spormann, A. (2001). Isolation and characterization of
anaerobic ethylbenzene dehydrogenas
183, 4536-4542.
Jørgensen, B. B. (1982). Ecology of the bacteria of the sulphur cycle with special reference
to anoxic-
London. serie B, Biological sciences 298, 543-561.
Jørgensen, B. B. and Des Marais, D. J. (1986). Competition for sulfide among colorless and
purple sul
Jørgensen, B. B. and Des Marais, D. J. (1988). Optical properties of benthic photosynthetic
communities: Fiber-optic studies of cyanobacterial ma
99-113.
Jørgensen, B. B., Revsbech, N. P. and Cohen, Y. (1983). Photosynthesis and structure of
benthic
communities. Limnology and Oceanography 28, 1075-1093.
Kaine, B. P., Gupta, R. and Woese, C. R. (1983). Putative introns in tRNA genes o
prokaryotes. Proc Natl Acad Sci U S A 80, 3309-3312.
232
Références bibliographiques
Kaplan, C. W. and Kitts, C. L. (2003). Variation between observed and true Terminal
Restriction Fragment length is dependent on true TRF length and purine content. Journal of
netic Assignment Tool for Analysis of Terminal Restriction Fragment Length
om, J., Dennis, J. J., Zylstra, G. J. and de Bont, J. A. M. (1998b). Active efflux of
apping of the restriction
M. and Gray, M. R. (2002). Selective transport and accumulation of
nd characterization of a chromosomal gene cluster, pah, that encodes the
ene dehydrogenase, a novelhydrocarbon-
. Applied and Environmental Microbiology 65, 5636-5638.
s of sulfate-reducing bacteria to
. Solar Lake (Sinai), 4. Stromatolitic
cyanobacteria mats. Limnology and Oceanography 22, 635-656.
Microbiological Methods 54, 121-125.
Kent, A. D., Smith, D. J., Benson, B. J. and Triplett, E. W. (2003). Web-Based
Phyloge
Polymorphism Profiles of Microbial Communities. Applied and Environmental Microbiology
69, 6768-6776.
Kieboom, J., Dennis, J. J., de Bont, J. A. M. and Zylstra, G. J. (1998a). Identification and
molecular characterization of an efflux pump involved in Pseudomonas putida S12 solvent
tolerance. Journal of Biology and Chemistry 273, 85-91.
Kiebo
organic solvents by Pseudomonas putida S12 is induced by solvents. Journal of Bacteriology
184, 6769-6772.
Kiko, H., Niggemann, E. and Ruger, W. (1979). Physical m
fragments obtained from bacteriophage T4 dC-DNA with the restriction endonucleases SmaI,
KpnI and BglII. Mol Gen Genet 172, 303-312.
Kim, I. S., Foght, J.
alkanes by Rhodococcus erythropolis S_14He. Biotechnol. Bioeng. 80, 650-659.
Kiyohara, H., Torigoe, S., Kaida, N., Asaki, T., Iida, T., Hayashi, H. and Takizawa.N.
(1994). Cloning a
upper pathway for phenanthrene and naphthalene utilization by Pseudomonas putida OUS82.
Journal of Bacteriology 176, 2439-2443.
Kniemeyer, O. and Heider, J. (2001). Ethylbenz
oxidizing molybdenum/iron-sulfur/heme enzyme. Journal of Biology and Chemistry 276,
21381-21386.
Koike, K., Ara, K., Adachi, S., Takigawa, P., Mori, H., Inoue, S., Kimura, Y. and Ito, S.
(1999). Regiospecific internal desaturation of aliphatic compounds by a mutant Rhodococcus
strain. . :
Kovach, W. L. (1999).MVSP - a Multivariate Statistical Package for Windows. Wales U.K.:
Kovack Computing Services.
Krekeler, D., Teske, A. and Cypionka, H. (1998). Strategie
escape oxygen stress in a cyanobacterial mat. FEMS Microbiology Ecology 25, 89-96.
Krumbein, W. E., Cohen, Y. and Shilo, M. (1977)
233
Références bibliographiques
Kruschel, C. and Castenholz, R. W. (1998). The effect of solar UV and visible irradiance on
the vertical movements of cyanobacteria in microbial mats of hypersaline waters. FEMS
Microbiology Ecology 27, 53-72.
Kühl, M. (1992). Spectral light measurments in microbenthic phototrophic communities with
a fiber-optic microbrobe coupled to a sensitive diode array detector. Limnology and
Oceanography 37, 1813-1823.
Kühl, M. and Fenchel, T. (2000). Bio-optical Characteristics and the Vertical Distribution of
, M. (2001). MEGA2: molecular
ion of genes encoding naphthalene dioxygenase of Pseudomonas putida
Eds): Wiley, Chichester.
. The phn genes of Burkholderia sp. strain RP007
and Colwell, R. R. (1990). Microbial degradation of hydrocarbons in the
obiology Letters 166, 35-
Cheng, H. and Forney, L. J. (1997). Characterization of
Research 24, 82-85.
Photosynthetic Pigments and Photosynthesis in an Artificial Cyanobacterial Mat. Microbial
Ecology 40, 94-103.
Kumar, S., Tamura, K., Jakobsen, I. B. and Nei
evolutionary genetics analysis software. Bioinformatics 17, 1244-1245.
Kurkela, S., Lehvaslaiho, H., Palva, E. and Teeri, T. (1988). Cloning, nucleotide sequence,
and characterizat
strain NCIB9816. Gene 73, 355-362.
Lane, D. J. (1991). rRNA sequencing. In Nucleic acid techniques in bacterial systematics.,
pp. 115-175. Edited by G. M. Stachenbradt E., (
Larsen, H. (1986). Halophilic and halotolerant microorganisms-an overview and historical
perspective. FEMS Microbiology Letters 39, 3-7.
Lassen, C., Ploug, H. and Jørgensen, B. B. (1992). A fibre-optic scalar irradiance
microsensor: application for spectral light measurements in sediments. FEMS Microbiology
Ecology 86, 247-254.
Laurie, A. and Lloyd-Jones, G. (1999)
constitute a divergent gene cluster for polycyclic aromatic hydrocarbon catabolism. Journal of
Bacteriology 181, 531-540.
Leahy, J. G.
environment. Microbiological Reviews 54, 305-315.
Leuthner, B. and J., H. (1998). A two-component system involved in regulation of
anaerobic toluene metabolism in Thauera aromatica. . :. FEMS Micr
41.
Liu, W. T., Marsh, T. L.,
microbial diversity by determining terminal restriction fragment length polymorphisms of
genes encoding 16S rRNA. Applied and Environmental Microbiology 63, 4516-4522.
Maidak, B. L., Olsen, G. J., Larsen, N., Overbeek, R., McCaughey, M. J. and Woese, C.
R. (1996). The Ribosomal Database Project (RDP). Nucleic Acids
234
Références bibliographiques
Maidak, B. L., Olsen, G. J., Larsen, N., Overbeek, R., McCaughey, M. J. and Woese, C.
R. (1997). The RDP (Ribosomal Database Project). Nucleic Acids Research 25, 109-111.
Maidak, B. L., Larsen, N., McCaughey, M. J., Overbeek, R., Olsen, G. J., Fogel, K.,
urn, T. G., Parker, C. T., Jr., Saxman, P. R., Farris, R. J.,
, J. R., Lilburn, T. G., Parker, C. T., Jr., Saxman, P. R., Stredwick,
c Acids Research 28,
. J., Overbeek, R., Pramanik, S., Schmidt, T. M.,
ubtilis. Journal of industrial Microbiology
rfactant production and their new applications. Applied and
J. (1980). The microbial community in the layered sediments at
nal of Bacteriology 183, 4202-4209.
Blandy, J. and Woese, C. R. (1994). The Ribosomal Database Project. Nucleic Acids
Research 22, 3485-3487.
Maidak, B. L., Cole, J. R., Lilb
Garrity, G. M., Olsen, G. J., Schmidt, T. M. and Tiedje, J. M. (2001). The RDP-II
(Ribosomal Database Project). Nucleic Acids Research 29, 173-174.
Maidak, B. L., Cole
J. M., Garrity, G. M., Li, B., Olsen, G. J., Pramanik, S., Schmidt, T. M. and Tiedje, J.
M. (2000). The RDP (Ribosomal Database Project) continues. Nuclei
173-174.
Maidak, B. L., Cole, J. R., Parker, C. T., Jr., Garrity, G. M., Larsen, N., Li, B., Lilburn,
T. G., McCaughey, M. J., Olsen, G
Tiedje, J. M. and Woese, C. R. (1999). A new version of the RDP (Ribosomal Database
Project). Nucleic Acids Research 27, 171-173.
Makkar, R. S. and Cameotra, S. S. (1998). Production of biosurfactant at mesophilic and
thermophilic conditions by a strain of Bacillus s
and Biotechnology 20, 48-52.
Makkar, R. S. and Cameotra, S. S. (2002). An update on the use of unconventional
substrates for biosu
Microbiological Biotechnology 58, 428-434.
Margulis, L., Barghoorn, E. S., Ashendorf, D., Banerjee, S., Chase, D., Francis, S.,
Giovannoni, S. and Stolz,
Laguna Figueroa, Baja California, Mexico: Does it have Precambrian analogues?
Precambrian Research 11, 93-123.
Marín, M. M., Smits, T. H. M., van Beilen, J. B. and Rojo, F. (2001). The alkane
hydroxylase gene of Burkholderia cepacia RR10 is under catabolite repression control.
Jour
Marsh, T. L. (1999). Terminal restriction fragment length polymorphism (T-RFLP): an
emerging method for characterizing diversity among homologous populations of
amplification products. Current Opinion in Microbiology 2, 323-327.
235
Références bibliographiques
Marsh, T. L., Saxman, P., Cole, J. and Tiedje, J. (2000). Terminal restriction fragment
length polymorphism analysis program, a web-based research tool for microbial community
gyof benthic microbial communities., pp. 239-245. Edited by Cohen
nt Pudosa", NE Spain).
de Marseille.
ution in a microbial mat community: sulfate-
S. J., Muyzer, G., Cohen, Y., Wagner, M., Rittmann, B. E.
gy 65, 4666-4671.
Stal, L. (1996). Fermentation and sulfur reduction in the
. Hydrocarbon degradation in soils and methods for
u: Université de Pau et
des Pays de l'Adour.
analysis. Applied and Environmental Microbiology 66, 3616-3620.
Marshall, K. C. (1989). Cyanobacterial-heterotrophic bacterial interactions. In Microbial
mats : physiological ecolo
and E. Rosenberg. Washington DC, USA: ASM edition.
Martinez, A., Pibernat, I., Figueras, J. and Garcia-Gil, J. (1997). Structure and
composition of freshwater microbial mats from a sulfur spring ("Fo
Microbiologia 13, 45-56.
Matheron, R. (1976).Contribution à l'étude écologique, systématique et physiologique des
Chromatiaceae et des Chlorobiaceae isolées de sédiments marins., pp. 193. Marseille:
Université
Mengoni, A., Grassi, E. and Bazzicalupo, M. (2002). Cloning method for taxonomic
interpretation of T-RFLP patterns. Biotechniques 33, 990-992.
Minz, D., Fishbain, S., Green, S. J., Muyzer, G., Cohen, Y., Rittmann, B. E. and Stahl,
D. A. (1999a). Unexpected population distrib
reducing bacteria localized to the highly oxic chemocline in contrast to a eukaryotic
preference for anoxia. Applied and Environmental Microbiology 65, 4659-4665.
Minz, D., Flax, J. L., Green,
and Stahl, D. A. (1999b). Diversity of sulfate-reducing bacteria in oxic and anoxic regions of
a microbial mat characterized by comparative analysis of dissimilatory sulfite reductase
genes. Applied and Environmental Microbiolo
Mir, J., Martínez-Alonso, M., Esteve, I. and Guerrero, R. (1991). Vertical stratification
and microbial assemblage of a microbial mat in the Ebro Delta (Spain). FEMS Microbiology
Ecology 86, 59-68.
Moezelaar, R., Bijvank, S. M. and
mat-building cyanobacterium Microcoleus chthonoplastes. Applied and Environmental
Microbiology, 1752-1758.
Morgan, P. and Watkinson, R. J. (1994)
soil biotreatment. Critical Review in Biotechnology 8, 305-333.
Mouné, S. (2000).Analyse de la biodiversité bactérienne des sédiments anoxiques de milieux
hypersalés (marais salants de Salins-de-Giraud, France), pp. 192. Pa
236
Références bibliographiques
Mouné, S., Caumette, P., Matheron, R. and Willison, J. C. (2003). Molecular sequence
analysis of prokaryotic diversity in the anoxic sediments underlying cyanobacterial mats of
two hypersaline ponds in Mediterranean salterns. FEMS Microbiology Ecology 44, 117-130.
gen or serine as electron donors;
Matheron, R., Willison, J. C., Hirschler, A., Herbert, R. and
gy 50 Pt 2, 721-729.
in reaction. Cold Spring Harb
ctrophoresis
f polymerase chain reaction-
microspira species and their identification in deep-sea hydrothermal vent
, Nübel, U., Santegoeds, C., Schäfer, H. and Wawer, C. (1998).
croelectrode survey of marine and freshwater strains. Applied and
Environmental Microbiology 52, 161-168.
Mouné, S., Manac'h, N., Hirschler, A., Caumette, P., Willison, J. C. and Matheron, R.
(1999). Haloanaerobacter salinarius sp. nov., a novel halophilic fermentative bacterium that
reduces glycine-betaine to trimethylamine with hydro
emendation of the genus Haloanaerobacter. International Journal of Systematic Bacteriology
49 Pt 1, 103-112.
Mouné, S., Eatock, C.,
Caumette, P. (2000). Orenia salinaria sp. nov., a fermentative bacterium isolated from
anaerobic sediments of Mediterranean salterns. International Journal of Systematic and
Evolutionnary Microbiolo
Mullis, K., Faloona, F., Scharf, S., Saiki, R., Horn, G. and Erlich, H. (1986). Specific
enzymatic amplification of DNA in vitro: the polymerase cha
Symp Quant Biol 51, 263-273.
Muyzer, G. (1999). DGGE/TGGE a method for identifying genes from natural ecosystems.
Curr Opin Microbiol 2, 317-322.
Muyzer, G. and Smalla, K. (1998). Application of denaturing gradient gel ele
(DGGE) and temperature gradient gel electrophoresis (TGGE) in microbial ecology. Antonie
Van Leeuwenhoek 73, 127-141.
Muyzer, G., de Waal, E. C. and Uitterlinden, A. G. (1993). Profiling of complex microbial
populations by denaturing gradient gel electrophoresis analysis o
amplified genes coding for 16S rRNA. Appl Environ Microbiol 59, 695-700.
Muyzer, G., Teske, A., Wirsen, C. O. and Jannasch, H. W. (1995). Phylogenetic
relationships of Thio
samples by denaturing gradient gel electrophoresis of 16S rDNA fragments. Arch Microbiol
164, 165-172.
Muyzer, G., Brinkhoff, T.
Denaturing gradient gel electrophoresis (DGGE) in microbial ecology. In Molecular
microbial ecology manual, pp. 1-27. Edited by v. E. J. Akkermans ADL, de Bruijn FJ (9eds).
Kluwer, Dordrecht.
Nelson, D. C., Revsbech, N. P. and Jørgensen, B. B. (1986a). Microoxic-anoxic niche of
Beggiatoa spp. : mi
237
Références bibliographiques
Nelson, D. C., Jørgensen, B. B. and Revsbech, N. P. (1986b). Growth pattern and yield of a
chemoautotrophic Beggiatoa sp. in oxygen-sulfide microgradients. Applied and
Environmental Microbiology 52, 225-233.
Nicholson, J. A. M., Stolz, J. F. and Pierson, B. K. (1987). Structure of a microbiol mat at
Great Sippewissett Marsh, Cape Cod, Massachusetts. FEMS Microbiology Letters 45, 343-
364.
Nubel, U., Bateson, M. M., Madigan, M. T., Kuhl, M. and Ward, D. M. (2001). Diversity
and Distribution in Hypersaline Microbial Mats of Bacteria Related to Chloroflexus spp.
. International Journal of Systematic and
benthic cyanobacteria and diatoms in communities along a
, A., Tailliez, P. and Delacroix-Buchet, A. (2002).
cia, J. L. and Mah, R. A. (1994). Anaerobic bacteria from
dy of microbial
eviews 24, 591-599.
n, R. K. (2002). Bacterial Chemotaxis toward Environmental Pollutants:
Appl. Environ. Microbiol. 67, 4365-4371.
Nübel, U., García-Pichel, F. and Muyzer, G. (2000a). The halotolerance and phylogeny of
cyanobacteria with tightly coiled trichomes (Spirulina Turpin) and the description of
Halospirulina tapeticola gen. nov., sp. nov
Evolutionnary Microbiology 50, 1265-1277.
Nübel, U., García-Pichel, F., Clavero, E. and Muyzer, G. (2000b). Matching molecular
diversity and ecophysiology of
salinity gradient. Environmental Microbiology 2, 217-226.
Ogier, J. C., Son, O., Gruss
Identification of the bacterial microflora in dairy products by temporal temperature gradient
gel electrophoresis. Appl Environ Microbiol 68, 3691-3701.
Ollivier, B., Caumette, P., Gar
hypersaline environments. Microbiological Reviews 58, 27-38.
Osborn, A. M., Moore, E. R. and Timmis, K. N. (2000). An evaluation of terminal-
restriction fragment length polymorphism (T- RFLP) analysis for the stu
community structure and dynamics. Environmental Microbiology 2, 39-50.
Overmann, J. and van Gemerden, H. (2000). Microbial interactions involving sulfur
bacteria: implications for the ecology and evolution of bacterial communities. FEMS
Microbiology R
Overmann, J., Fischer, U. and Pfennig, N. (1992). A new purple sulfur bacterium from
saline littoral sediments, Thiorhodovibrio winogradskyi gen. nov. and sp. nov. Archives of
Microbiology 157, 329-335.
Pandey, G. and Jai
Role in Bioremediation. Applied and Environmental Microbiology 68, 5789-5795.
238
Références bibliographiques
Panke, S., Meyer, A., Huber, C., Witholt, B. and Wubbolts, M. (1999). An alkane-
responsive expres ion system for the production of fine chemicals. Applied and
Environmental Microbiology 65, 2324-2332
s
.
nography 34, 223-234.
hototrophic bacteria, 8th ed. In Bergey's manual
trophic green and purple bacteria:
reat Sippewissett Salt Marsh,
onversion studies with substrate analogues of toluene in
1 is encoded by alkM and belongs to a new family or bacterial
Rehm, H. J. and Reiff, I. (1982). Regulation der mikrobiellen alkanoxidation mit hinblick
auf die produktbildung. Acta Biotechnolology 2, 127-138.
Paterson, D. M. (1989). Shorts-trems changes in the erodibility of intertidal cohesive
sediments related to the migratory behaviour of epipelic diatoms. Limnology and
Ocea
Pfennig, N. (1967). Photosynthetic bacteria. Annual Review of Microbiology 21, 285-324.
Pfennig, N. (1975). The phototrophic bacteria and their role in the sulfur cycle. Plant and Soil
43, 1-16.
Pfennig, N. (1989). Ecology of Phototrophic purple and green sulfur bacteria. In Autotrophic
Bacteria, pp. 97-116. Edited by H. G. Schlegel and B. Bowien. Berlin: Science Technique
Publisher, Madison and Springer Verlag.
Pfennig, N. and Trüper, H. G. (1974). The p
of determinative bacteriology, pp. 24-64. Edited by R. E. Buchanan and N. E. Gibbons.
Baltimore: Wiliams and Wilkins Co.
Pfennig, N. and Truper, H. G. (1983). Taxonomy of photo
a review. Ann Microbiol (Paris) 134B, 9-20.
Pfennig, N. and Trüper, H. (1992). The family Chromatiaceae. New-York: Springer-
Verlag,.
Pierson, B., Oesterle, A. and Murphy, G. L. (1987). Pigments, light penetration, and
photosynthetic activity in the multi-layered microbial mats of G
Massachusetts. FEMS Microbiology Letters 45, 365-376.
Pinkart, H. C. and White, D. C. (1997). Phospholipid biosynthesis and solvent tolerance in
Pseudomonas putida strains. Journal of Bacteriology 179, 4219-4422.
Pringault, O. and Garcia-Pichel, F. (2003). Hydrotaxis of cyanobacteria in desert crusts.
Microbial Ecology 12, 12.
Rabus, R. and Widdel, F. (1995). C
a sulfate-reducing bacterium, strain Tol2. Arch Microbiol 164, 448-451.
Ratajczak, A., Geibdorfer, W. and Hillen, W. (1998). Alkane hydroxylase from
Acinetobacter sp. strain ADP
integral-membrane hydrocarbon hydroxylases. Applied and Environmental Microbiology 64,
1175-1179.
239
Références bibliographiques
Revsbech, N. P., Jorgensen, B. B., Blackburn, T. H. and Cohen, Y. (1983). Microelectrode
studies of the photosynthesis and O2, H2S and pH profiles of a microbial mat. Limnology and
Oceanography 28, 1062-1074.
Richardson, L. L. (1996). Horizontal and vertical migration patterns of Phormidium
corallyticum and Beggiatoa spp. associated with black-band disease of corals. Microbial
Ecology 32, 323-335.
Rojas, A., Duque, E., Mosqueda, G., Golden, G., Hurtado, A., Ramos, J. L. and A., S.
nas putida DOT-T1E. Journal of Bacteriology 183, 3967-3973.
f sickle cell anemia. Science 230, 1350-1354.
Escherichia coli. Journal of Bacteriology 182,
., Nicklen, S. and Coulson, A. R. (1992). DNA sequencing with chain-terminating
Microbiology 139, 100-101.
fovibrio oxyclinae in a
Environmental Microbiology 66, 5013-5018.
erium Desulfovibrio
Microbiology 67, 4353-4357.
(2001). Three efflux pumps are required to provide efficient tolerance to toluene in
Pseudomo
Romagnoli, S., Packer, H. L. and Armitage, J. P. (2002). Tactic Responses to Oxygen in
the Phototrophic Bacterium Rhodobacter sphaeroides WS8N. Journal of Bacteriology 184,
5590-5598.
Saiki, R. K., Scharf, S., Faloona, F., Mullis, K. B., Horn, G. T., Erlich, H. A. and
Arnheim, N. (1985). Enzymatic amplification of beta-globin genomic sequences and
restriction site analysis for diagnosis o
Saito, A., Iwabuchi, T. and Harayama, S. (2000). A novel phenanthrene dioxygenase from
Nocardioides sp. strain KP7: expression in
257-261.
Sanger, F
inhibitors. 1977. Biotechnology 24, 104-108.
Siefert, E. and Pfennig, N. (1984). A convenient method to prepare neutral sulfide solution
for cultivation of phottotrophic sulfur bacteria. Archives of
Sigalevich, P., Baev, M. V., Teske, A. and Cohen, Y. (2000a). Sulfate reduction and
possible aerobic metabolism of the sulfate- reducing bacterium Desul
chemostat coculture with Marinobacter sp. Strain MB under exposure to increasing oxygen
concentrations. Applied and
Sigalevich, P., Meshorer, E., Helman, Y. and Cohen, Y. (2000b). Transition from
anaerobic to aerobic growth conditions for the sulfate- reducing bact
oxyclinae results in flocculation. Applied and Environmental Microbiology 66, 5005-5012.
Simon, M., Bonner, J., McDonald, T. and Autenrieth, R. (1999). Bioaugmentation for the
enhanced bioremediation of petroleum in a wetland. Polycyclic Aromatic Hydrocarbons 14-
15:231-239.
240
Références bibliographiques
Simon, M., Osslund, T., Saunders, R., Ensley, B., Suggs, S., Harcourt, A., Suen, W.,
Cruden, D., Gibson, D. and Zylstra, G. (1993). Sequence of genes encoding naphthalene
dioxygenase in Pseudomonas putida strains G7 and NCIB 9816-4. Gene 127, 31-37.
l Mats, pp. 21-32.
rine microbial mat. FEMS Microbiology Letters 31, 111-125.
cimobilis
ation. Microbiological Reviews 60, 342-365.
iology 53, 103-128.
logia
ensen, B. B. and
t,
Smith, M. R. (1994). The physiology of aromatic hydrocarbon degrading bacteria. in
Biochemistry of microbial degradation. pp. 347-372. Edited by C. Ratledge. Kluwer:
Academic Publisher.
Stackebrandt, E. and Woese, C. R. (1984). The phylogeny of prokaryotes. Microbiol Sci 1,
117-122.
Stal, L. J. (1994). Microbial mats in coastal environments. In Microbia
Edited by L. J. Stal and P. Caumette. Berlin Heidelberg: Springer-Verlag.
Stal, L. J., van Gemerden, H. and Krumbein, W. E. (1985). Structure and development of
a benthic ma
Story, S. P., Parker, S. H., Kline, J. D., Tzeng, T. R. J., Mueller, J. G. and Kline, E. L.
(2000). Identification of four structural genes and two putative promoters necessary for
utilization of naphthalene, phenanthrene, and fluoranthene by Sphingomonas pau
var. EPA505. Gene 260, 155-169.
Swannell, R. P., Lee, K. and McDonagh, M. (1996). Field evaluations of marine oil spill
bioremedi
Taylor, B. L., Zhulin, I. B. and Johnson, M. S. (1999). Aerotaxis and other energy-sensing
behavior in bacteria. Annual Review of Microb
Teal, T. H., Chapman, M., Guillemette, T. and Margulis, L. (1996). Free-living
spirochetes from Cape Cod microbial mats detected by electron microscopy. Microbio
12, 571-584.
Ter Braak, C. J. F. (1986). Canonical correspondence analysis : a new eigenvector technique
for multivariate direct gradient analysis. Ecology 67, 1167-1179.
Teske, A., Ramsing, N. B., Habicht, K., Fukui, M., Kuver, J., Jørg
Cohen, Y. (1998). Sulfate-reducing bacteria and their activities in cyanobacterial mats of
solar lake (Sinai, Egypt). Applied and Environmental Microbiology 64, 2943-2951.
Thar, R. and Kuhl, M. (2001). Motility of Marichromatium gracile in response to ligh
oxygen, and sulfide. Applied and Environmental Microbiology 67, 5410-5419.
Tissot, B. P. and Welte, D. H. (1984). Petroleum formation and occurence. Berlin,
Heidelberg, New York.
241
Références bibliographiques
Treadway, S., Yanagimachi, K., Lankenau, E., Lessard, P., Stephanopoulos, G. and
Sinskey, A. (1999). Isolation and characterization of indene bioconversion genes from
Rhodococcus strain I24. Applied and Microbiological Biotechnology 51, 786-793.
Trotha, R., Reichl, U., Thies, F. L., Sperling, D., Konig, W. and Konig, B. (2002).
Adaptation of a fragment analysis technique to an automated high- throughput multicapillary
electrophoresis device for the precise qualitative and quantitative characterization of
V., Zaitsev, G. M., Lobanok, A. G. and Salkinoja-Salonen, M. S. (1999). Effect
sters and flanking
ed beaches in Scapa Flow, Orkney Islands. FEMS
rbert, R. A. (1989b). Development of
th on crude oil. Journal of industrial Microbiology and Biotechnology 25, 155-
ent Advances in Petroleum
, J., Des Marais, D. J. and Schopf, J. W. (1992b). A general
comparison of microbial mats and microbial stromatolites: bridging the gap between the
microbial communities. Electrophoresis 23, 1070-1079.
Tsitko, I.
of Aromatic Compounds on Cellular Fatty Acid Composition of Rhodococcus opacus.
Applied and Environmental Microbiology 65, 853-855.
van Beilen, J., Panke, S., Lucchini, S., Franchini, A., Rothlisberger, M. and Witholt, B.
(2001). Analysis of Pseudomonas putida alkane degradation gene clu
insertion sequences: evolution and regulation of the alk genes. Microbiology 147, 1621-1630.
van Gemerden, H. (1993). Microbial mats : A joint venture. Marine Geology 113, 3-25.
van Gemerden, H., Tughan, C. S., de Wit, R. and Herbert, R. A. (1989a). Laminated
microbial ecosystems on shelter
Microbiology Letters 62, 87-101.
van Gemerden, H., de Wit, R., Tughan, C. S. and He
mass blooms of Thiocapsa roseopersicina on sheltered beaches on the Orkney Islands. FEMS
Microbiology Ecology 62, 111-118.
Van Hamme, J. D. and Ward, O. P. (2000). Development of a method for the application of
solid-phase microextraction to monitor the biodegradation of volatile hydrocarbons during
bacterial grow
162.
Van Hamme, J. D., Singh, A. and Ward, O. P. (2003). Rec
Microbiology. Microbiology and Molecular Biology Reviews 67, 503–549.
Walter, M. R. (1976). Stromatolites. In Developments in Sedimentology 20, pp. 790.
Amsterdam: Elsevier.
Walter, M. R., Grotzinger, J. P. and Schopf, J. W. (1992a). Proterozoic stromatolites. In he
proterozoic biosphere: a multidisciplinary study, pp. 253-260. Edited by J. W. Schopf and C.
Klein. Cambridge: Cambridge University Press.
Walter, M. R., Bauld
242
Références bibliographiques
modern and the fossil. In The proterozoic biosphere: a multidisciplinary study, pp. 335-338.
Edited by J. W. Schopf and C. Klein. Cambridge: Cambridge University Press.
Weisburg, W. G., Barns, S. M., Pelletier, D. A. and Lane, D. J. (1991). 16S ribosomal
enzoesäure durch neu isolierte arten
ate- and sulfur reducing bacteria. In
L., Fourçans, A., Duran, R., Caumette, P., Garcia De
K. and Serdar, C. (1988). Genetics of naphthalene catabolism in pseudomonads CRC.
f the
DNA amplification for phylogenetic study. Journal of Bacteriology 173, 697-703.
Whitman, B. E., Lueking, D. R. and Mihelcic, J. R. (1998). Naphthalene uptake by a
Pseudomonas fluorescens isolate. Canadian Journal of Microbiology 44, 1086-1093.
Widdel, F. (1980).Anaerober abbau von fettsäuren und b
sulfat-reduzierender bakterien. In Insitut für Mikrobiologie, pp. 443. Göttingen: Göttingen
University.
Widdel, F. (1988). Microbiology and ecology of sulf
Biology of Anaerobic microorganisms, pp. 469-585. Edited by A. J. B. Zehnder. New York:
Wiley, J. and sons.
Widdel, F. and Bak, F. (1992). Gram-negative mesophilic sulfate-and sulfur-reducing
bacteria. New York: Springer-Verlag.
Wieland, A. and Kühl, M. (2000). Short-term temperature effects on oxygen and sulfide
cycling in a hypersaline cyanobacterial mat (Solar Lake, Egypt). Marine Ecology Progress
Series 196, 87-102.
Wieland, A., Zopfi, J., Benthien, M. and Kühl, M. (2004). Biogeochemistry of an iron-rich
hypersaline microbial mat (Camargue, France). Microbial Ecology in press.
Wieland, A., Kuhl, M., McGowan,
Oteyza, T., Grimalt, J. O., Solé, A., Diestra, E., Esteve, I. and Herbert, R. A. (2003).
Microbial mats on the Orkney islands revisited: microenvironment and microbial community
composition. Microbial Ecology 46, 371-390.
Yen,
Critical Review in Microbiology 15, 247-268.
Yuste, L. and Rojo, F. (2001). Role of the crc gene in catabolic repression oPseudomonas putida Gpo1 alkane degradation pathway. Journal of Bacteriology 183, 6197-6206.
243


![Infections bactériennes des muqueuses - érosions syphilitiquescochlea.iurc.montp.inserm.fr/enseignement/cycle_2/MIB/Ressources... · [dermo-hypodermite] Infections bactériennes](https://static.fdocuments.net/doc/165x107/5fd2700fcc816f59bc461057/infections-bactriennes-des-muqueuses-rosions-dermo-hypodermite-infections.jpg)