
Dynamicsurrounds A - Proceedings of the National Academy ... · PDF fileSpecifically,...
5
Proc. Nati. Acad. Sci. USA Vol. 89, pp. 8547-8551, September 1992 Neurobiology Dynamic surrounds of receptive fields in primate striate cortex: A physiological basis for perceptual completion? (monkey/visual cortex/receptive-field structure/optic disk/visual psychophysics) MARIO FIORANI, JR.*t, MARCELLO G. P. ROSA*4, RICARDO GATrASS*§, AND CARLOS EDUARDO ROCHA-MIRANDA* *Departamento de Neurobiologia, Instituto de Bioffsica Carlos Chagas Filho, Universidade Federal do Rio de Janeiro, Rio de Janeiro RJ 21941, Brazil; and §Laboratory of Neuropsychology, National Institute of Mental Health, Bethesda, MD 20892 Communicated by Mortimer Mishkin, June 11, 1992 (received for review March 20, 1992) ABSTRACT Visual receptive fields (RFs) were mapped inside and outside the cortical representation of the optic disk in the striate cortex (area V1) of anesthetized and paralyzed Cebus monkeys. Unexpectedly, most cells were found to be binocularly driven, and the RFs mapped with contralateral-eye stimulation progressed in a topographically appropriate fash- ion as the optic disk sector was crossed. Activation of these neurons by the contralateral eye was shown to depend on stimulation of the parts of the retina around the optic disk. Outside the optic disk representation, a similar effect was demonstrated by obstructing the "classical" RF with masks 5-10 times larger in size. In all cases, visual stimuli presented around the mask could be used to accurately interpolate the position of the hidden RF. These properties reflect, at a cellular level, the process of "filling in" that allows for completion of the visual image across natural and artificially induced scoto- mas. In the past decade, the notion that receptive fields (RFs) in adult sensory cortex have stable boundaries was challenged by a series of experiments that demonstrated changes in RF size and location after chronic (1-3) or acute (4) deafferen- tation. In the visual cortex, similar modifications have been seen after retinal lesions (5-7). In addition, even in the normal animal the portion of the visual field capable of modifying cellular activity has been shown to be far more extensive than the "classical" RF. Specifically, responses to stimulation within RFs of neurons in primate visual areas V1, V2, V3A, V4, and MT are modifiable by stimulation of normally silent RF peripheries with patterns differing in texture, wavelength, spatial frequency, direction of motion, and speed of motion from the pattern presented to the RF itself (6, 8-13). Re- sponses in area V2 can be induced by illusory contours formed by visual patterns presented outside the classical RF (14) and the boundaries of excitatory RFs in area V4 vary depending on spatial attention (15). Except for the modula- tion of responses by stimulation of silent peripheries with patterns differing in speed of motion (6), most of these effects seemed to be absent in the primary visual area (V1), thus contributing to the hypothesis that RFs of neurons in V1 have stable boundaries and responses. The retinal blind spot, corresponding to the optic disk, is devoid of photoreceptors. Thus, although most parts of the central visual field are usually viewed binocularly, the parts corresponding to the optic disk of one eye are viewed only through the opposite eye. Nonetheless, unless specific tests are applied, no gap in the visual field is noticed under monocular viewing. The blind spot is imperceptibly "filled in" to match the color, texture, and brightness of the regions of the visual field immediately surrounding the optic disk (16). This process of filling in is usually referred to as the completion phenomenon (16,17). This phenomenon may also account for the unawareness of other "blind" regions of the retina, such as those overlaid by large retinal vessels (angio- scotomata, ref. 18) and those produced by retinal lesions or lesions in the visual pathway (19, 20). We report on a multi- and single-unit analysis of the visual responses of neurons in the parts of area V1 corresponding to the natural and artificially produced blind regions. We pro- vide evidence that neurons within the cortical representation of the optic disk can interpolate RF position based on the stimuli that extend beyond the boundaries of the blind sector. These properties therefore mirror, at a cellular level, the perceptual completion phenomenon. Moreover, we show that the ability to interpolate RF position across large dis- tances is also present in neurons in other parts of V1 as well. In these neurons, masking of the classical RF uncovers further excitatory regions that increase the effective excit- atory RF length by up to 10 times. A preliminary report on these data was published in abstract (21). MATERIALS AND METHODS Multi- and single-unit responses were recorded from area V1 in four adult monkeys (Cebus apella). A detailed description of the animal preparation and recording procedures has been published (22). Briefly, at least 1 week before the first recording session the animal was anesthetized with ketamine (30 mg/kg) and Saffan and surgically implanted with a cranial prosthesis capable of holding the head in a modified stereo- taxic holder without further pressure points. Recording ses- sions were subsequently carried out twice a week. During the sessions, the animals were anesthetized with nitrous oxide/ oxygen, 7:3, paralyzed with a continuous infusion of pancu- ronium bromide (0.1 mg/kg per hr), and artificially ventilated through a tracheal cannula. Electrocardiogram, body tem- perature, and end-tidal CO2 values were continuously mon- itored and kept within the physiological range. After 6-8 hr of recording the infusion of pancuronium was discontinued, and the animal was returned to its cage after recovering spontaneous breathing and consciousness. Recordings were made by using varnish-coated tungsten microelectrodes inserted through the dura mater. Three- hundred twenty-eight multi-unit (MU) recordings were used to map the representation of the visual field in the cortex, and 165 single-unit recordings were used for quantitative analysis of RF properties in V1. The borders and the centers of the Abbreviations: MU, multi-unit; RF, receptive field; MURF, MU RF; PSTH, peristimulus-time histogram; V1, primary visual cortex. tTo whom reprint requests should be addressed. tPresent address: Vision, Touch and Hearing Research Centre, University of Queensland, QLD 4072, Australia. 8547 The publication costs of this article were defrayed in part by page charge payment. This article must therefore be hereby marked "advertisement" in accordance with 18 U.S.C. §1734 solely to indicate this fact.
-
Upload
nguyennguyet -
Category
Documents
-
view
219 -
download
4
Transcript of Dynamicsurrounds A - Proceedings of the National Academy ... · PDF fileSpecifically,...

Proc. Nati. Acad. Sci. USAVol. 89, pp. 8547-8551, September 1992Neurobiology
Dynamic surrounds of receptive fields in primate striate cortex: Aphysiological basis for perceptual completion?
(monkey/visual cortex/receptive-field structure/optic disk/visual psychophysics)
MARIO FIORANI, JR.*t, MARCELLO G. P. ROSA*4, RICARDO GATrASS*§,AND CARLOS EDUARDO ROCHA-MIRANDA**Departamento de Neurobiologia, Instituto de Bioffsica Carlos Chagas Filho, Universidade Federal do Rio de Janeiro, Rio de Janeiro RJ 21941, Brazil; and§Laboratory of Neuropsychology, National Institute of Mental Health, Bethesda, MD 20892
Communicated by Mortimer Mishkin, June 11, 1992 (received for review March 20, 1992)
ABSTRACT Visual receptive fields (RFs) were mappedinside and outside the cortical representation of the optic diskin the striate cortex (area V1) of anesthetized and paralyzedCebus monkeys. Unexpectedly, most cells were found to bebinocularly driven, and the RFs mapped with contralateral-eyestimulation progressed in a topographically appropriate fash-ion as the optic disk sector was crossed. Activation of theseneurons by the contralateral eye was shown to depend onstimulation of the parts of the retina around the optic disk.Outside the optic disk representation, a similar effect wasdemonstrated by obstructing the "classical" RF with masks5-10 times larger in size. In all cases, visual stimuli presentedaround the mask could be used to accurately interpolate theposition of the hidden RF. These properties reflect, at a cellularlevel, the process of "filling in" that allows for completion ofthe visual image across natural and artificially induced scoto-mas.
In the past decade, the notion that receptive fields (RFs) inadult sensory cortex have stable boundaries was challengedby a series of experiments that demonstrated changes in RFsize and location after chronic (1-3) or acute (4) deafferen-tation. In the visual cortex, similar modifications have beenseen after retinal lesions (5-7). In addition, even in the normalanimal the portion of the visual field capable of modifyingcellular activity has been shown to be far more extensive thanthe "classical" RF. Specifically, responses to stimulationwithin RFs of neurons in primate visual areas V1, V2, V3A,V4, and MT are modifiable by stimulation of normally silentRF peripheries with patterns differing in texture, wavelength,spatial frequency, direction of motion, and speed of motionfrom the pattern presented to the RF itself (6, 8-13). Re-sponses in area V2 can be induced by illusory contoursformed by visual patterns presented outside the classical RF(14) and the boundaries of excitatory RFs in area V4 varydepending on spatial attention (15). Except for the modula-tion of responses by stimulation of silent peripheries withpatterns differing in speed ofmotion (6), most of these effectsseemed to be absent in the primary visual area (V1), thuscontributing to the hypothesis that RFs of neurons in V1 havestable boundaries and responses.The retinal blind spot, corresponding to the optic disk, is
devoid of photoreceptors. Thus, although most parts of thecentral visual field are usually viewed binocularly, the partscorresponding to the optic disk of one eye are viewed onlythrough the opposite eye. Nonetheless, unless specific testsare applied, no gap in the visual field is noticed undermonocular viewing. The blind spot is imperceptibly "filledin" to match the color, texture, and brightness of the regions
of the visual field immediately surrounding the optic disk(16). This process of filling in is usually referred to as thecompletion phenomenon (16,17). This phenomenon may alsoaccount for the unawareness of other "blind" regions of theretina, such as those overlaid by large retinal vessels (angio-scotomata, ref. 18) and those produced by retinal lesions orlesions in the visual pathway (19, 20).We report on a multi- and single-unit analysis of the visual
responses of neurons in the parts of area V1 corresponding tothe natural and artificially produced blind regions. We pro-vide evidence that neurons within the cortical representationof the optic disk can interpolate RF position based on thestimuli that extend beyond the boundaries ofthe blind sector.These properties therefore mirror, at a cellular level, theperceptual completion phenomenon. Moreover, we showthat the ability to interpolate RF position across large dis-tances is also present in neurons in other parts of V1 as well.In these neurons, masking of the classical RF uncoversfurther excitatory regions that increase the effective excit-atory RF length by up to 10 times. A preliminary report onthese data was published in abstract (21).
MATERIALS AND METHODSMulti- and single-unit responses were recorded from area V1in four adult monkeys (Cebus apella). A detailed descriptionof the animal preparation and recording procedures has beenpublished (22). Briefly, at least 1 week before the firstrecording session the animal was anesthetized with ketamine(30 mg/kg) and Saffan and surgically implanted with a cranialprosthesis capable of holding the head in a modified stereo-taxic holder without further pressure points. Recording ses-sions were subsequently carried out twice a week. During thesessions, the animals were anesthetized with nitrous oxide/oxygen, 7:3, paralyzed with a continuous infusion of pancu-ronium bromide (0.1 mg/kg per hr), and artificially ventilatedthrough a tracheal cannula. Electrocardiogram, body tem-perature, and end-tidal CO2 values were continuously mon-itored and kept within the physiological range. After 6-8 hrof recording the infusion of pancuronium was discontinued,and the animal was returned to its cage after recoveringspontaneous breathing and consciousness.Recordings were made by using varnish-coated tungsten
microelectrodes inserted through the dura mater. Three-hundred twenty-eight multi-unit (MU) recordings were usedto map the representation of the visual field in the cortex, and165 single-unit recordings were used for quantitative analysisof RF properties in V1. The borders and the centers of the
Abbreviations: MU, multi-unit; RF, receptive field; MURF, MU RF;PSTH, peristimulus-time histogram; V1, primary visual cortex.tTo whom reprint requests should be addressed.tPresent address: Vision, Touch and Hearing Research Centre,University of Queensland, QLD 4072, Australia.
8547
The publication costs of this article were defrayed in part by page chargepayment. This article must therefore be hereby marked "advertisement"in accordance with 18 U.S.C. §1734 solely to indicate this fact.

Proc. Natl. Acad. Sci. USA 89 (1992)
MU RF (MURF) were mapped for each eye at every 50-100A.m along each penetration passing close to the optic diskrepresentation in V1. Single neurons isolated with an ampli-tude-waveform discriminator were continuously monitoredwith a Nihon-Koden (V10) memory oscilloscope. Usingoriented bars, we first determined the orientation selectivityand ocular dominance of each single unit. Using a personalcomputer-based data-acquisition system, we then con-structed peristimulus-time histograms (PSTHs) to flashingand moving bars with and without neutral masks of varioussizes placed on the back ofthe tangent screen centered on theRF geometrical center. Size and location of the RFs weredetermined with PSTHs to long bars in the optimal andorthogonal to the optimal orientations, moving at differentposition offsets relative to the RF center. The trial-by-trialsingle-unit data were used to perform the quantitative anal-ysis illustrated in Figs. 3 and 4. Outlines of the optic diskswere mapped at the beginning of the session by using areversible ophthalmoscope. To monitor position of the eyesduring the experiment, a small mirror (0.5-mm diameter) wasglued to the rim of hard contact lenses used to focus the eyeson the surface of the tangent screen. The mirror was used toreflect a low-intensity laser beam onto the surface ofa screen.Position ofthe laser source was kept constant, and the lenseswere allowed to attach to the cornea by the drying lachrymalfilm. Thirty minutes later, any eye movement clearly dis-placed the laser reflection on the screen. Eye position wasroutinely checked at the beginning and end of each quanti-tative analysis and each penetration. Three types of stimuliwere used: three-dimensional bars, rear-projected stimuli,and computer-generated stimuli. Initially, characteristics ofthe responses and visual topography ofMU clusters and cellsin the optic disk representation were qualitatively evaluatedby presenting long, opaque-colored bars on the surface of atransparent hemispheric screen. The qualitative evaluationwas followed by quantitative analysis of single-unit responseproperties with the personal computer-based data-acquisi-tion system. In most experiments we used a computer-drivenoptical bench that presented black-and-white bars and edgesonto a Polacoat tangent screen located 1.14 m from theanimal. In later experiments, a 48-cm Super VGA colormonitor driven by a graphic board was used instead. Stimulusillumination was set at 22.6 cd/m2, and background was setat 10.8 cd/M2. A low contrast was deliberately chosen toreduce possible effects of stray light. Masking was achievedby inserting opaque gray cardboard squares of several sizes,which covered the classical RF as well as neighboring partsof the visual field. Data from 43 single neurons that hadcomplete sets of histograms for both eyes, for different masksizes, and for bars of different sizes and locations were usedfor statistical analysis (t test).
After 3 weeks ofrecordings, the animals were monocularlyenucleated under ketamine/Saffan anesthesia. A survivaltime of 18 days was allowed before perfusion. All monkeyswere perfused with 3% (wt/vol) paraformaldehyde/phosphate-buffered saline, and every section was treated forcytochrome oxidase (23) to reveal the limits of the corticaloptic disk representation (22), the electrode tracks, and theelectrolytic lesions (4 AuA, 5 sec) used as markers.
RESULTSDimensions of the optic disk in the Cebus monkey average6.00 x 4.50 of the visual field (24), whereas MURFs at asimilar eccentricity (150) seldom exceed 2-3° per side in areaV1 (25). We, therefore, expected that tangential penetrationscrossing the cortical representation of the optic disk in V1would yield sites responsive only to the stimulation of theipsilateral eye and that the boundaries of the blind regioncould be mapped in detail. Instead, by using long bars as
stimuli and MU recordings, we found that most sites re-sponded to both eyes and that a visual topography waspreserved, even for the eye contralateral to the hemisphereunder study (Fig. 1), in spite ofthe absence ofphotoreceptorsin this part of the retina. However, the responses elicited bystimulation of the ipsilateral eye were invariably stronger,and the progression of contralateral-eye RFs showed a largerdegree of scatter. Surprised by these observations, we de-cided to test (i) whether the same phenomenon could beobserved at the single-unit level, and (ii) whether the con-tralateral responses could be due to the stimulation ofregionsof the visual field remote from the RF itself, in the mannerillustrated in Fig. 2. Fig. 2A shows that sweeping bars longerthan the diameter of the optic disk induced responses alongrestricted portions of the visual space (stars). In poorlyoriented units, the location of the excitatory regions definedan interpolated RF (shown in black). In orientation-selectiveunits, only RF width could be defined. Masking of the wholeOD with opaque cardboard changed neither location of theinterpolated RF nor strength of the responses (Fig. 2B).Sweeping bars restricted to one side of the OD (Fig. 2C)yielded either poor responses or no activation at all in someof these neurons, hereafter called completion neurons. Inother units, the sum of the responses to separate stimulationof each side ofthe optic disk was comparable to the responseelicited by a full bar, indicating the existence of a discontin-uous RF for the contralateral eye. As detailed below, thesetwo kinds of responses seen in the natural blind spot may notnecessarily indicate the existence of separate classes of cellsbecause some units behaved in either way, depending on theextent of an artificial, mask-induced blind region. Finally, alarge mask covering the surround of the optic disk, butleaving the optic disk itself uncovered, abolished the re-sponses (Fig. 2D). These tests argue against stray light as asource of artifact. In general, these observations reveal the
CONTRA 'PSI
36
HM
1 Projection ofOD contra
FIG. 1. Location of ipsilateral eye MURF centers (Right) andcontralateral eye interpolated MURF centers (Left) recorded alonga tangential penetration through the roof of the calcarine sulcus.Nasal limits ofthe projection ofthe optic disk (OD) in the visual fieldare shown by dashed lines, and the corresponding part of the visualfield of the opposite eye is shown in small dots. Numbers indicateRFs for each eye recorded in sites 50-100 Am apart. Site 10 yieldedresponses to the contralateral eye only. HM, horizontal meridian;IPSI and CONTRA refer to the eye ipsi- and contralateral to thehemisphere under study, respectively.
8548 Neurobiology: Fiorani et al.

Proc. Natl. Acad. Sci. USA 89 (1992) 8549
A
C
' 0 E
POOR RESPONSES
Mask.................../..................................
....... .................................................. ....................
NO RESPONSE
FIG. 2. Summary of neuronal responses (A-D) in the optic diskrepresentation to oriented bars (left, vertical; right, horizontal) andmasks of different shapes (B, D). Stars and dashed lines indicatelocations where stimulation with long bars elicited responses. Stip-ples indicate masked regions, and arrows indicate direction ofmotionof oriented bars (shown in black). IRF, interpolated RF (blacksquares).
ability of V1 neurons to interpolate RF position in a blindregion based on stimulation of regions of the visual fieldremote from the RF itself, hereafter referred to as dynamicsurrounds.
Fig. 3A illustrates the responses of a cell located in layerIVb inside the histologically reconstructed optic disk repre-
sentation. The mean response rate is shown for each eye
separately as a function of size of the natural and mask-induced blind regions. In every test, a sweeping bar pro-
truded at least 100 beyond the mask. Length ofthe classicallymapped RF of this cell for the ipsilateral eye, based onmeasurements taken from PSTHs, was -1° (white arrow-
head). Nonetheless, this unit responded well above sponta-neous activity under contralateral-eye stimulation when thenatural blind spot was left uncovered (far left). Adding squaremasks up to 150 per side still did not prevent this cell fromresponding, provided that coherent motion between the twoprotruding bar tips was achieved (Fig. 3B). Noteworthy is thefact that a reversal in the ocular dominance of the cell isapparent as larger masks are added. Although the responsesto the ipsilateral eye are more than twice as strong as theinterpolated contralateral responses in the mask-free condi-tion, the interposition of masks 7.5° or more per side revealsa stronger response for the contralateral eye, and for masksbeyond 12.50 per side only a contralateral response is appar-ent. Thus, the ocular dominance of the dynamic surrounddoes not necessarily follow that of the classical RF. This unitshowed above-background contralateral-eye responses tohalf-bar stimulation of either side of the optic disk in themask-free condition (data not shown), thus qualifying ashaving a ",discontinuous RE" property. However, Fig. 3Bshows that when larger masks were used, a true completion
80
70
80
a 50
C.)Z 40LU0aLuz 30
a 20
10
* - -_-U - -_-I I 1
2.5 5 4 7.5 10 12.5
MASK SIZE (degrees per side)
6A B Al BAB
04z
IL
01A B A+B AB
FIG. 3. (A) Mean response rate of a V1 cell for 10 presentationsof the stimulus under different masking conditions. A-A, *-*,Responses to ipsilateral and contralateral eye, respectively, in pairedtrials. The lower (dashed) lines show the mean spontaneous activitywhen each eye is opened separately. Size of the ipsilateral classicalRF is shown by an outlined arrow, and the diameter of the optic diskis shown by a filled arrow. (B) Black bars show the mean responsefrequency ofthe same neuron to stimulation over a mask 15° per side;open bars show the mean spontaneous activity in paired trialswithout stimulation. The sum (bars A+B) of the activities to thepresentation of partial slits (bars A or B) is smaller than themagnitude of the response to a full slit (bars AB). OD, optic disk.Stars indicate above-background activity (P < 0.01).
property was revealed. This specific cell was sharply tunedfor orientation, and the orientation selectivity curves for theclassical RF (mapped through ipsilateral-eye stimulation) andofthe interpolated RE (mapped through the contralateral eye)showed similarly located peaks and bandwidths. Nine out of43 single neurons had interpolated REs inside the blind spot,and 4 out of 9 single neurons showed completion properties.
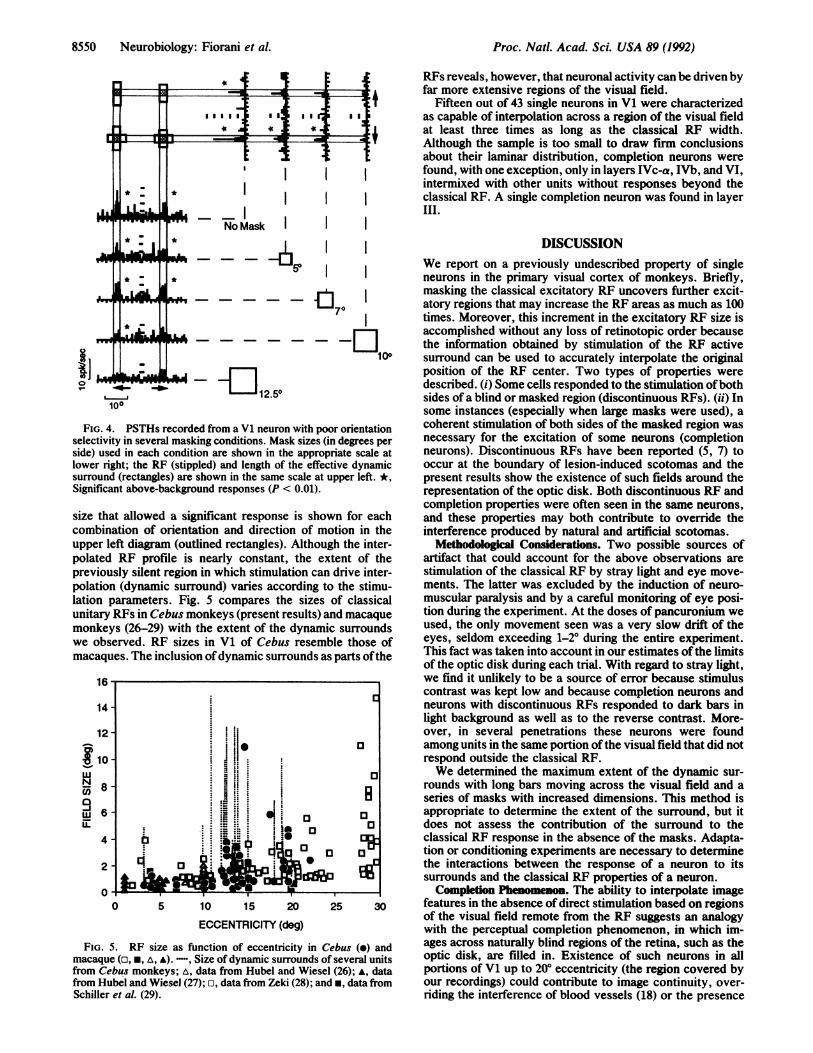
Fig. 4 shows response properties of a single neuron withpoor orientation selectivity for which the RF was located at140 eccentricity in the lower visual field away from the opticdisk. PSTHs are shown for moving bars in the best (hori-zontal PSTHs) and orthogonal (vertical PSTHs) stimulusorientations. In spite of the restricted RF dimensions (stip-pled squares at upper left, based on the response envelopesin the no mask condition), the cell responded significantlywhen masks up to 100 per side were used. The largest mask
Neurobiology: Fiorani et al.
8550 Neurobiology: Fiorani et al.
'2I1I
C I
* I
No IWo Mask
*-
I I
Lopr==:Mn= ;or:Mr !T
I II II
I
RFs reveals, however, that neuronal activity can be driven byfar more extensive regions of the visual field.
Fifteen out of 43 single neurons in V1 were characterizedas capable of interpolation across a region of the visual fieldat least three times as long as the classical RF width.Although the sample is too small to draw firm conclusionsabout their laminar distribution, completion neurons werefound, with one exception, only in layers IVc-a, IVb, and VI,intermixed with other units without responses beyond theclassical RE. A single completion neuron was found in layerIII.
DISCUSSION
Fisele4side,lowesumSign
sizecorupppolapreipolelaticunitmoiwemac
9
wN
9u,iL
FimacfromfromSchi
_U LASSg|Wereport on a previously undescribed property of single5***neurons in the primary visual cortex of monkeys. Briefly,masking the classical excitatory RF uncovers further excit-
1 v-1- LJ70atory regions that may increase the RF areas as much as 10070 times. Moreover, this increment in the excitatory RF size is.d.At.Ll , | go-accomplished without any loss of retinotopic order because
.y.......
-Li the information obtained by stimulation of the RF active10° surround can be used to accurately interpolate the original-F--Iit,Hi position of the RF center. Two types of properties were-W< ,1. described. (i) Some cells responded to the stimulation ofboth
sides of a blind or masked region (discontinuous REs). (ii) In100 some instances (especially when large masks were used), a[G. 4. PSTHs recorded from a V1 neuron with poor orientation coherent stimulation of both sides of the masked region wasctivity in several masking conditions. Mask sizes (in degrees per necessary for the excitation of some neurons (completionused in each condition are shown in the appropriate scale at neurons). Discontinuous RFs have been reported (5, 7) to
ir right; the RF (stippled) and length of the effective dynamic occur at the boundary of lesion-induced scotomas and theound (rectangles) are shown in the same scale at upper left. *, present results show the existence of such fields around theificant above-background responses (P < 0.01). representation of the optic disk. Both discontinuous RF and
completion properties were often seen in the same neurons,that allowed a significant response is shown for each and these properties may both contribute to override the
ibination of orientation and direction of motion in the interference produced by natural and artificial scotomas.er left diagram (outlined rectangles). Although the inter- Methodological Considerations. Two possible sources ofated RF profile is nearly constant, the extent of the artifact that could account for the above observations areviously silent region in which stimulation can drive inter- stimulation of the classical RF by stray light and eye move-ation (dynamic surround) varies according to the stimu- ments. The latter was excluded by the induction of neuro-3n parameters. Fig. 5 compares the sizes of classical muscular paralysis and by a careful monitoring of eye posi-Lary RFs in Cebus monkeys (present results) and macaque tion during the experiment. At the doses of pancuronium weikeys (26-29) with the extent of the dynamic surrounds used, the only movement seen was a very slow drift of theobserved. RF sizes in V1 of Cebus resemble those of eyes, seldom exceeding 1-2° during the entire experiment.
This fact was taken into account in our estimates of the limits.1aques. The inclusion ofdynamic surrounds as parts ofthe of the optic disk during each trial. With regard to stray light,16 we find it unlikely to be a source of error because stimulus
contrast was kept low and because completion neurons and14- . _ neurons with discontinuous RFs responded to dark bars in
light background as well as to the reverse contrast. More-12- over, in several penetrations these neurons were found;t.|ij||ao among units in the same portion of the visual field that did not10- j:l. respond outside the classical RF.
We determined the maximum extent of the dynamic sur-8- . IE'. 3 . rounds with long bars moving across the visual field and a*8a'.5t. ;, n series of masks with increased dimensions. This method is6 1 *:-ii i, o ° |appropriate to determine the extent of the surround, but it
,.*.a,,.toi o does not assess the contribution of the surround to the4A..-Jo.:"O l IS n i classical RF response in the absence of the masks. Adapta-**a*5C°tion or conditioning experiments are necessary to determine
2 - a o Hi * zX * )the interactions between the response of a neuron to its5" IJ=JICC1JJ surrounds and the classical RF properties of a neuron.
0 Completion Phenomenon. The ability to interpolate image0 5 10 15 20 25 30 features in the absence of direct stimulation based on regions
ECCENTRICITY (dog)of the visual field remote from the RF suggests an analogyECCENTICITY (dog.) with the perceptual completion phenomenon, in which im-
1G. 5. RF size as function of eccentricity in Cebus (o) and ages across naturally blind regions of the retina, such as theaque (n,*, a,*). -, Size of dynamic surrounds of several units optic disk, are filled in. Existence of such neurons in alliCebus monkeys; A, data from Hubel and Wiesel (26); A, data portions of V1 up to 200 eccentricity (the region covered byHubel and Wiesel (27); J, data from Zeki (28); and*, datafrom our recordings) could contribute to image continuity, over-
iller etal. (29). riding the interference of blood vessels (18) or the presence
.
-I-
*
'a
Proc. Nad. Acad Sci. USA 89 (1992)
1I
r4
1r-

Proc. Natl. Acad. Sci. USA 89 (1992) 8551
of other natural or lesion-induced scotomas (19, 20). Theprocedure of masking the visual field around a RF hasobvious and important qualitative differences from using aregion naturally devoid of photoreceptors, but in the presentstudy both procedures yielded comparable results. In aparalyzed preparation, such as the one we used, any staticboundary (as the border ofthe masks) will gradually fade, andthe corresponding portion of the visual field will be filled inby the pattern in the background (17). Absence ofvisual inputgenerated inside the masked region may be regarded asqualitatively similar to that generated by a lesion either in theretina or in the visual pathways and, therefore, filled in by asimilar process. The interpolation responses seem to repre-sent a mechanism different from that demonstrated by Pe-terhans and von der Heydt (14) for illusory contour-drivenactivity in neurons in V2. Interpolation responses occur overa much wider area of the visual field than do illusorycontour-driven responses, and these former responses arepresent in area V1, which lacks the local mechanism de-scribed by Peterhans and von der Heydt for V2. Moreover,on psychophysical grounds, illusory contours are apparent,even when the subject is free to move its eyes, whereascompletion requires steady fixation or image stabilization.We hypothesize that the properties described here are rele-vant for completion but not to the perception of illusorycontours, which may rely on activity of extrastriate neurons.In addition, our findings indicate that perceptual completionmay rely on activity at the level of single neurons in theprimary visual cortex.
Possible Sources of the Interpolation Response. The largeextent of the dynamic surrounds and the restricted arboriza-tion of geniculostriate fibers (27) make it unlikely that thispathway alone is responsible for generating interpolationresponses. At an eccentricity of 150, the cortical magnifica-tion factor of V1 of Cebus is -0.7 mm per degree (25), and,therefore, to overcome the gap generated by a mask 150 perside, portions ofV1 more than 5 mm away would have to sendinputs to the completion neuron (7.5° to each side). Intrinsicconnections of monkey striate cortex are reported to spanseveral millimeters (30), and the longest intrinsic axons mayhave the necessary coverage for generating long-range inter-polations. In a recent study, Gilbert and Wiesel (7) observedacute and chronic changes in RF position and extent afterretinal lesions and attributed such changes to the intrinsicconnections of V1. In this context, the dynamic unmasking ofactive surrounds seen in these experiments indicates thateven under normal physiological conditions these intrinsicconnections may contribute to the delineation of RF extent.Some of the largest RFs recorded in V1, specifically thosefrom layer VI, approach the size of the dynamic surrounds(Fig. 5) and, therefore, may contribute to generating thecompletion responses in the upper layers. Alternatively, themassive extrastriate feedback projections to striate cortex(31) could be important in generating interpolation responses.Neuronal RFs in areas such as MT and V4 are normallysimilar in size to the dynamic surrounds of V1 neurons atcomparable eccentricities and, therefore, can integrate infor-mation across much larger portions of the visual field.
We thank Drs. Mortimer Mishkin, Michael Calford, Aglai P. B.Sousa, and Robert Desimone for helpful comments on the manu-script. Financial support was from Conselho Nacional de Desen-volvimento Cientifico e Tecnol6gico (CNPq), Financiadora de Es-tudos e Projetos (FINEP), and FundaqAo de Amparo a Pesquisa doEstado do Rio de Janeiro (FAPERJ).
1. Rasmusson, D. D. (1982) J. Comp. Neurol. 205, 313-326.2. Merzenich, M. M., Kaas, J. H., Wall, J. T., Sur, M. & Felle-
man, D. J. (1983) Neuroscience 10, 639-665.3. Pons, T. P., Garraghty, P. E., Ommaya, A. K., Kaas, J. H.,
Taub, E. & Mishkin, M. (1991) Science 252, 1857-1860.4. Calford, M. B. & Tweedale, R. (1988) Nature (London) 332,
446-448.5. Kaas, J. H., Krubitzer, L. A., Chino, Y. M., Langston, A. L.,
Polley, E. H. & Blair, N. (1990) Science 248, 229-231.6. Heinen, S. J. & Skavenski, A. A. (1991) Exp. Brain Res. 83,
670-674.7. Gilbert, C. D. & Wiesel, T. N. (1992) Nature (London) 356,
150-152.8. Zeki, S. M. (1983) Neuroscience 9, 767-781.9. Allman, J. M., Miezin, F. & McGuiness, E. (1985) Annu. Rev.
Neurosci. 8, 407-430.10. Tanaka, K., Hikosaka, K., Saito, H., Yukie, M., Fukada, Y. &
Iwai, E. (1986) J. Neurosci. 6, 134-144.11. Desimone, R. & Schein, S. J. (1987) J. Neurophysiol. 57,
835-867.12. Allman, J. M. (1990) in Signal and Sense: Local and Global
Order in Perceptual Maps, eds. Eldeman, G. M., Gall, C. M.& Cowan, M. (Wiley-Liss, New York) pp. 131-141.
13. Gaska, J. P., Jacobson, L. D. & Pollen, D. A. (1988) VisionRes. 27, 1687-1692.
14. Peterhans, E. & von der Heydt, R. (1989) J. Neurosci. 9,1749-1763.
15. Moran, J. & Desimone, R. (1985) Science 229, 782-784.16. Helmholtz, H. (1963) Handbook of Physiological Optics (Op-
tical Soc. of America, Dover, DE).17. Ramachandran, V. S. & Gregory, R. L. (1991) Nature (Lon-
don) 350, 699-702.18. Le Grand, Y. (1967) Form and Space Vision (Indiana Univ.
Press, Bloomington).19. Bender, M. B. & Teuber, H. L. (1946) Arch. Neurol. Psychi-
atry 55, 627-658.20. Weiskrantz, L. (1986) Blindsight, A Case Study and Implica-
tions (Oxford Psychology Series, Oxford).21. Fiorani, M., Jr., Gattass, R., Rosa, M. G. P. & Rocha-Mi-
randa, C. E. (1990) Soc. Neurosci. Abstr. 16, 1219.22. Rosa, M. G. P., Gattass, R., Fiorani, M., Jr., & Soares,
J. G. M. (1992) Exp. Brain Res. 88, 249-264.23. Wong-Riley, M. T. T. (1979) Brain Res. 171, 11-28.24. Rosa, M. G. P., Gattass, R. & Fiorani, M., Jr. (1988) Exp.
Brain Res. 72, 645-648.25. Gattass, R., Sousa, A. P. B. & Rosa, M. G. P. (1987) J. Comp.
Neurol. 259, 529-548.26. Hubel, D. H. & Wiesel, T. N. (1968) J. Physiol. (London) 195,
215-243.27. Hubel, D. H. & Wiesel, T. N. (1974) J. Comp. Neurol. 158,
295-306.28. Zeki, S. M. (1983) Proc. R. Soc. London B 217, 449-470.29. Schiller, P. H., Finlay, B. L. & Volman, S. F. (1976) J. Neu-
rophysiol. 39, 1288-1319.30. Rockland, K. S. & Lund, S. J. (1983) J. Comp. Neurol. 216,
303-318.31. Sousa, A. P. B., Pinon, M. C. G. P., Gattass, R. & Rosa,
M. G. P. (1991) J. Comp. Neurol. 308, 665-682.
Neurobiology: Fiorani et al.


