Dynamics of Ride Sharing Competition · This paper studies the dynamics of ride-sharing...
36
Dynamics of Ride Sharing Competition Cassey Lee ISEAS – Yusof Ishak Institute Email: [email protected] ISEAS Economics Working Paper No. 2017-05 July 2017 Abstract This paper studies the dynamics of ride-sharing competition. Ride-sharing is modelled as a spatial two-sided market with heterogeneous passengers and drivers, both located on a Salop (1979) circle. The model is simulated to study four aspects of ride-sharing competition:(i) price distribution and dynamics, (ii) strategic pricing, (iii) fixed pricing vs. surge pricing, and (iv) information-sharing. Dynamic platform competition in a spatial setting can generate distinct and persistent bands of fluctuating prices. Space and stochastic luck can mitigate winner-take-all effects in price competition. Platforms adopting fixed pricing can compete with platform with surge pricing provided the former are not set too high. However, space and stochastic luck can also render the outcomes of such competition uncertain. Information sharing eliminates price fluctuations by pooling information on demand. The complexity of ride-sharing implies that the impact of policy interventions cannot be known in advance in some cases. Keywords: Ride-Sharing, Two-Sided Markets, Spatial Competition, Dynamic Pricing JEL Classification: L11, L13, L86 30 Heng Mui Keng Terrace, Singapore 119614 6778 0955 6778 1735 [email protected] www.iseas.edu.sg No. 2017-05
Transcript of Dynamics of Ride Sharing Competition · This paper studies the dynamics of ride-sharing...
Dynamics of Ride Sharing Competition
Cassey Lee
ISEAS – Yusof Ishak Institute
Email: [email protected]
ISEAS Economics Working Paper No. 2017-05
July 2017
Abstract
This paper studies the dynamics of ride-sharing competition. Ride-sharing is modelled as a spatial
two-sided market with heterogeneous passengers and drivers, both located on a Salop (1979)
circle. The model is simulated to study four aspects of ride-sharing competition:(i) price
distribution and dynamics, (ii) strategic pricing, (iii) fixed pricing vs. surge pricing, and (iv)
information-sharing. Dynamic platform competition in a spatial setting can generate distinct and
persistent bands of fluctuating prices. Space and stochastic luck can mitigate winner-take-all
effects in price competition. Platforms adopting fixed pricing can compete with platform with
surge pricing provided the former are not set too high. However, space and stochastic luck can
also render the outcomes of such competition uncertain. Information sharing eliminates price
fluctuations by pooling information on demand. The complexity of ride-sharing implies that the
impact of policy interventions cannot be known in advance in some cases.
Keywords: Ride-Sharing, Two-Sided Markets, Spatial Competition, Dynamic Pricing
JEL Classification: L11, L13, L86
30 Heng Mui Keng Terrace, Singapore 119614
6778 0955 6778 1735 [email protected] www.iseas.edu.sg
No. 2017-05

Dynamics of Ride Sharing Competition
Cassey Lee
“We are not setting the price. The market is setting the price. We have algorithms
to determine what that market is.”
Travis Kalanick, Former CEO, Uber1
1 Introduction
Ride-sharing services has had significant and disruptive impact on publictransport in many countries in recent years. Even though ride-sharing ser-vices per-se are not new, having existed intermittently in the US during the1940s and 1970s, the advent and confluence of new technologies has led toa rapid and sustained growth of such services in many countries since late2000s.2 Today, the ride-sharing services market is still evolving. Platformssuch as Uber, Didi Chuxing, Grab and Lyft continue to fine-tune their busi-ness model and pricing practices as well as cope with new regulations. Often,these new regulations have varied across countries. In some countries, suchas Japan, ride-sharing services have been outright prohibited. In other coun-tries, such as Singapore, regulators have embraced ride-sharing markets buthave gradually increased regulatory oversight. The varied responses observedacross many countries clearly suggest that transport regulators are still strug-gling to make sense of the ride-sharing market. The regulatory challengeshave been compounded by the nascent nature of the research literature onride-sharing.
The goal of this study is to provide insights into the nature and dynamicsof competition in the ride-sharing market.3. The importance of such anendeavour cannot be underestimated as policymakers and regulators haveexpressed difficulties in applying insights from the research literature to theirwork (Auer and Petit, 2015).
1“Uber boss says surging prices rescue people from the snow”, WIRED, 17 December2013.
2See Hahn and Metcalfe (2017) for a brief discussion of the historical evolution ofride-sharing services.
3Rysman (2009, p.125) defines a two-sided market as a market in which: “(1) two setsof agents interact through an intermediary or platform, and (2) the decisions of each setof agents affects the outcomes of the other set of agents, typically through an externality.”
1

In this study, a series of computer simulations are undertaken using a stochas-tic ride-sharing model in a spatial setting. The distributions of market pricesare examined within the context of a decentralized market in spatial set-ting. The effects of pricing strategies adopted by competing platforms willbe compared. This include competition between platforms using fixed andsurge pricing. As information on demand and supply conditions is a key issue,this study will also explore the impact of rival platforms sharing informationon demand conditions.
The outline of this paper is as follows. Section 2 will provide a brief descrip-tion of the ride-sharing. Section 3 will discuss the theoretical and empiricalliterature relevant to ride-sharing. This leads to a discussion of the specifictopics to be investigated in Section 4. The structure of the model and sim-ulation implementation are described in Section 5. Section 6 discusses thesimulation results. Section 7 concludes.
2 Ride-Sharing
Ride-sharing is essentially a ‘match-making’ service implemented using adigital platform (such as Uber, Didi Chuxing, Grab and Lyft) that matchesindependent drivers with passengers. This matching enables drivers to pro-vide rides (taxing services) to passengers for a fee (Figure 1).4 This is madepossible by the use of mobile applications (apps) created by the platformsthat can geographically locate both passengers and independent drivers.
The process of ride-sharing can be described as follows:
• Step 1: A passenger use his/her ride-sharing mobile app to request fora ride by inputting and sending a signal to a platform (Grab/Uber)which contains information on the trip’s origin and destination.
• Step 2: The platform’s mobile app instantaneously computes a fareand sends the offer fare to the passenger. This fare is computed basedthe demand (number of ride requests) and supply (number of drivers)around the passenger’s location.
• Step 3: The passenger has the option of accepting or rejecting the fare.If he or she accepts the proposed fare, this decision is conveyed to theplatform.
4Ride-sharing is also part of the “sharing economy”. See Sundararajan (2016).
2

• Step 4: The accepted proposed set of trip and fare is then transmittedto the nearest driver (also identified and computed algorithmically).
• Step 5: The driver has the option of accepting or declining the proposedset of trip-fare. If the driver accepts the offer, he/she will then receiveinstruction on how to reach and pickup the passenger.5
• Step 6: The transaction ends when the destination is reached. Boththe passenger and driver are given the opportunity to rate the qualityof their experiences.
Figure 1: Match Making in Ride-Sharing
A key element in ride-sharing is the dynamic pricing of fares that are im-plemented using a “surge pricing” algorithm that reduces the gap betweendemand and supply. This algorithm has been described by Uber’s consul-tants and researchers as one that “assigns a simple multiplier that multipliesthe standard fare in order to derive the surged fare” (Hall et al., 2015, p.1).The surge algorithm kicks in when there is a significant amount of demandfor rides compared to supply (available drivers within a location). The ratio-nale underlying the surge algorithm is two-fold. First, on the demand-side,when there is excessive demand - higher prices will ensure that only pas-sengers with a high valuation of a ride (hence, a higher willingness to pay)
5If he/she declines the offer, the platform will send the offer to another driver. Thisprocess will loop for a fixed number. If no driver accepts, the passenger will be informedthat no drivers are available and is advised to wait/re-book.
3

will obtain a ride. This brings about, it is argued, an efficient allocation ofresources as such resources go to its highest valued use. Second, the higherprice will attract more drivers to (i) start driving (propensity) and (ii) driveto location with high-demand (intensity). The result is an increase in thesupply of drivers in the location with high demand. The demand and supplyresponses to surge pricing act to reduce the gap between demand and supply.
The size of the multiplier in surge pricing has been reported to exceed two(2x) and even reach 9.9x in some cases.6 The surge pricing algorithm can besuspended by platforms in situations when its implementation could provokepublic anger such as in the cases of terror attack or rail breakdown. Morerecently, Uber has re-designed its apps by removing the display of multi-plier factor (which has irritated riders). In its place, the estimated fare iscalculated and offered (though this is still be based on surge pricing).
Another important aspect of ride-sharing is its two-sided nature - passengers(buyers) on the one side and drivers (sellers) on the others. The ride-sharingplatform is a two-sided platform in which network effects at both end areimportant. For passengers, the greater availability of cars at a given platformwould attract them to use the platform due to lower prices (smaller excessdemand gap) and shorter waiting time. Similarly, the greater the number ofpassengers that have signed up to a given platform, the more attractive theplatform will be to drivers due to greater probability of picking up passengers(lower idle time).
Finally, ride-sharing is a two-sided market with “multi-homing” on the de-mand and supply sides. On the demand side, passengers can download morethan one car-hailing apps (e.g. Grab and Uber) and use them to compareprices (arbitrage)and availability. Similarly, drivers can sign-up to more thanone platform, choosing which platform to use depending on various factors -financial incentives offered as well as network effects (probability of pickingup passengers).
In response to these factors, platforms have strategically implemented pro-grams aimed at increasing the cost of passengers and drivers from switchingfrom one platform to another. For passengers, platform have offered dis-counted fares and loyalty programs (accumulated points that can redeemed
6In the aftermath of the terror attack in London in June 2017, Uber’s surge price inthe vicinity was reported to be around 2.1x. See “Uber criticized for surge pricing afterLondon terror attack”, CNN Tech, 4 June 2017. The 9.9x surge occurred at Miami Beachduring the 2016 New Year celebrations. See “Uber Users Are Complaining About PriceyNew Year’s Eve Rides”, TIME, 2 January 2016.
4

for free rides). More recently, the introduction of post-paid programs (creditcard top up, often with the chance of getting a quota of free rides) has thepotential of encouraging loyalty to a platform because consumers have al-ready paid ex-ante for rides. For drivers, incentive programs based on thenumber of passengers served (trips) during a given time window (peak hoursduring weekdays and/or weekends) make it difficult for drivers to use morethan one platform (which will incure the risk of not achieving the targets inthese incentive programs).
Finally, ride sharing is a complex market. Even though the mechanismsused in matching passengers with riders can be simple, the decentralized andspatial nature of the interactions between riders and passengers can produceunexpected outcomes. This dimension has not been fully explored yet - atask this study aims to undertake by modelling ride sharing as a complexsystem with heterogeneous agents interacting in a decentralized manner.
3 Related Literature
The research literature on ride-sharing is at a nascent stage even thoughthe recent re-emergence of ride-sharing has been around for more than fiveyears. The pace of research on this topic has been constrained both by dataavailability and theoretical developments. Both empirical and theoreticalliterature are reviewed in this section. This then provides the opportunityto discuss how the present study contributes to the literature.
3.1 Empirical Literature
In the domain of empirical research, most of the few studies that haveemerged involved participation by researchers from ride-sharing companies -primarily, Uber (e.g. Hall et al. (2015), Cohen et al. (2016) and Castillo et al.(2017)). The empirical literature on ride-sharing has primarily focused on afew key topics such as surge pricing, consumer surplus, capacity utilization,and traffic congestion.
One of the earliest study on Uber’s surge pricing was Hall et al. (2015). Thestudy, which involved researchers from Uber, primarily focused on explain-ing the impact of Uber’s surge pricing on reducing the gap between supplyand demand (see earlier discussions). High-frequency data on demand (riderequests and users opening Uber’s app) and supply (number of drivers in the
5

area experiencing surge in demand) from Uber were used in the study. Thestudy provided evidence on the impact of surge pricing on allocating rides tothose who value them more during the surge period. However, the authorswere more reluctant to claim that surge pricing had a strong positive impacton the supply of drivers because the change in supply could itself be inducedby drivers’ expectation/knowledge of increase in demand (thus resulting indouble counting or over estimation of the causal effects).
The earlier findings on surge pricing by Hall et al. (2015) were somewhat sup-ported by the study by Chen et al. (2015) which did not use data from Uberdirectly. Chen et al. (2015) found that surge pricing did have a strong andnegative effect on passenger demand but a weaker and positive effect on carsupply. Furthermore, even though there is some regularity in the occurrenceof price surge (e.g. during rush hours on weekdays), the surge multiplierscould not be forecasted. The study also found that the spatial dynamics ofride-sharing is complex - whilst the spatial concentration of drivers can bepredicted (around CBDs and tourist attractions), the relationship betweencar density and estimated waiting time is not straight forward.
A more recent study that used data from Uber is Castillo et al. (2017). Thestudy argued that surge pricing can help prevent a “wild goose chase” -an equilibrium outcome that has a low number of idle drivers resulting indeficient matching and long pickup lines. In the absence of surge pricing,a high uniform would be needed to reduce demand - one that is even moreharmful to consumers than surge pricing.
There are a number of other empirical studies on ride-sharing that do notfocus directly on surge pricing. One such study is that of Cramer and Krueger(2016) which compared capacity utilization by taxi drivers and Uber drivers.The authors found that, on average, UberX drivers has 30 percent highercapacity utilization (measured in time) compared to taxi drivers. This gapis even larger - at 50 percent - if capacity utilization is measured in terms ofmileage. Several explanations were offered to explain these findings: (i)moreefficient driver-passenger matching technology, (ii) higher number of ride-sharing drivers than taxi drivers, (iii) inefficient taxi licensing regulationsthat restricts taxi operations geographically, and (iv) flexible labour supplymodel in ride-sharing services. The authors also highlight two additionalimplications of the differences in capacity utilization between ride-sharingdrivers and taxi drivers: (i) ride-sharing drivers can charge lower fares thantaxis and earn the same amount of revenue, and (ii) ride-sharing can lowertraffic congestion and fuel consumption.
6

More recent studies have begun the examine the impact of ride-sharing onsocial welfare. One aspect of social welfare is consumer surplus. Using datafrom Uber, the study by Cohen et al. (2016) estimated consumer surplus tobe around USD2.88 billion in 2015 for four major cities in the US. Anotheraspect of social welfare is traffic congestion. Using a natural experimentapproach, Li et al. (2017) found evidence of ride-sharing reducing trafficcongestion. This was done by comparing the level of traffic congestion in 101urban areas in the US namely before and after the entry of Uber.
3.2 Theoretical Literature
On the theoretical front, at least two strands of literature are relevant to theanalysis of ride-sharing markets. The first strand is the literature on two-sided markets or platforms.7 The early literature on two-sided markets datesback to the seminal contributions of Caillaud and Jullien (2003), Rochet andTirole (2003) and Armstrong (2006). The early works have primarily focusedon the actions of the platform (market intermediary). These actions pertainto price level and price structure. The latter refers to the setting of pricesat both ends of a two-sided market in such a way as to maximize output(efficiency) by charging more on one side compared to the other side. Thisis determined by a number of factors, namely: (1) the relative size of cross-group elasticities, (2) fixed fees or royalties, and (3) presence of single ormulti-homing. The more recent literature has focused on a number of topicssuch as platform ownership structure, asymmetric networks on both sides ofthe market, and cross-subsidization on both sides. Even though the empir-ical literature on ride-sharing has not drawn explicitly from the theoreticalliterature, the latter remain useful. Collectively, this body of literature canbe used to provide a more formal approach to characterizing ride-sharing andfor analyzing factors that affect the pricing strategies adopted by platforms inride-sharing. These include ride-sharing incentives on both the demand side(discounted fairs and loyalty membership) and supply side (trip-based bonusincentives) that are clearly related to network effects. Similarly, switchingcost can be interpreted as an important strategic variable to enhance networkeffects.
Beyond the above insights from the two-sided market literature, more recenttheories could provide further insights into ride-sharing. These are theories ofdynamic platform competition and theories of spatial platform competition.
7For a general treatment, see Rysman (2009), Evans (2011), Evans and Schmalensee(2016) and Einav et al. (2016)
7

In an early work by Chen and Tse (2008), dynamic platform competition ismodelled as a differential game involving the growth of platform users. Theyfind that a two-sided market is likely to be dominated by a single platform(winner take all) when multi-homing tendency is high and in the absence ofmarket segmentation. In Dou and Wu (2016), dynamic platform competitionis studied using a multi-period symmetric duopoly platform model. In theirstudy, platforms subsidize buyers and sellers in the initial period but thesubsidies are reduced on one-side in subsequent stages. Platforms can alsogain competitive advantage at the early stage by importing external users(piggybacking) and subsidizing them. The importance of platforms taking anearly market lead in dynamic competition (network effects) is also examinedby Halaburda et al. (2016). An interesting result from the paper is thepresence of multiple equilibria in infinite time horizon models in which eitherlow or high quality platforms can dominate. The authors also extended theirmodel to incorporate stochastic change in qualities. In such models, higherquality platforms will only prevail when platforms are more forward looking(less myopic). Another study that looks at dynamic and stochastic pricecompetition with network effects is Cabral (2011). Even though the studydoes not focus on platform competition per se, findings from the study isuseful to understand network effects in dynamic competition. One interestingresult from the study is that when network effects are sufficiently strong, thestationary distribution of market shares is typically bimodal in which thesystem is mostly in a state where the large network has a high market share.
Finally, another group of theoretical work that is relevant to this study isthat which attempts to model platform competition spatially. One of thefirst paper to do this is Raalte and Webers (1998) which studied competitionbetween two platforms (intermediaries) using commission fee in a one-stage(static) spatial setting. In their model, the two platforms are located di-ametrically opposed to each other along a Salop (1979) circle. Two typesof agents with different densities are distributed uniformly along the circle.The equilibrium outcome is one in which: (i) each platform has an equalshare of the two types of agents, and (ii) one type of agent is charge zerofee. The Salop (1979) circle is also used in the study by Kodera (2010) whichstudied how the equilibrium price is affected by cross-group network effects.If such effects are larger on the sellers’ side, competition amongst platformsfor buyers will be more intense (hence lower prices on the buyers’ side). Inthe presence of free market entry, network effects will result in a sub-optimalnumber of platforms.
8

3.3 Lessons and Guidance from the Literature
There are clearly some differences between the empirical and theoretical liter-ature. In the empirical literature on ride-sharing, the main focus has clearlybeen on the nature and impact of surge pricing. The empirical studies havealso mostly examined the impact from the operation of one platform, namelyUber. This is due to market structure and data constraints.
In the case of the theoretical literature, the seminal works on two-side plat-forms pre-dates the entry of Uber (2009). These and subsequent works focuson two-sided platforms in general and especially on pricing strategies (leveland structure) in the presence of network effects. Network effects are clearlyimportant in ride-sharing but this does not appear to be a key issue in theempirical literature. This is because it has focused primarily on one platform(Uber) rather than two platform competition (Grab vs. Uber). This raisesthe interesting question of how network effects are related to surge pricing.A platform may lower prices/fares (subsidize) to enhance market share andin the process increase the more demand for riders.
The literature survey also indicates that most of the models in the literatureare static and non-spatial in nature (Table 1). There are a few dynamicmodels of platform competition but these are primarily non-spatial in nature.Thus, more research is needed on dynamic and spatial models of two-sidedplatform competition.
Table 1: Types of Two-Platform Models(Example of Studies)
Static DynamicNon-Spatial Rochet and Tirole (2003) Chen and Tse (2008)Spatial Raalte and Webers (1998) ?
What is to be gained by studying two platform models that are both dynamicand spatial? There are some clues from the literature on dynamic game-theoretic spatial models (Lindgren, 1997). Complete dominance of a strategy(winner take all scenario) may not take place in dynamic spatial models. Thiscould be particularly true for models with stochastic elements (as hinted inthe study by Cabral (2011)). These could explain the empirical findingson the complex nature of the relationship between driver/car density andwaiting time.
9

Finally, one important aspect that is not discussed nuch in the literature isthe distribution of prices.8 This is important in a spatial competition settingwhere prices vary over time and space due to changes in demand-supplyconditions. By incorporating these elements, this study hopes to contributetowards extending the research literature on the dynamics of spatial two-platform competition in general, and on ride-sharing more specifically.
4 Dynamics of Competition in Ride-Sharing
The general goal of this study is to examine the dynamics of competitionin ride-sharing in a spatial setting. This section explicates which aspects ofride-sharing competition will be examined and why.
4.1 Price Distribution and Dynamics
Price is a key variable in the study of markets. In ride-sharing, demandand supply conditions change continuously over time and across space (loca-tions). Even though prices are set in a centralized manner by each platformusing a specific algorithm or formula, there is no single price at each momentin period. Rather, what is observed is a distribution of prices across timeand different locations. Is the distribution of prices Gaussian (normal - ain Figure 2), heavy-tailed (b), lepto-kurtic (c) or bi-modal (c)? An under-standing of the distribution of these prices is important for any assessmentof the distribution of welfare effects. The impact of surge pricing will dependon what the distribution of prices look like. An examination of the dynamicsof price change in a spatial setting might also reveal interesting features. Doprices at different locations vary randomly or do they tend to converge?
8There is now an emerging interests in micro pricing data e.g. Cavallo and Rigobon(2011), Cavallo (2015), and Rigobon (2015)
10

Figure 2: Statistical DistributionsSource: http://www.dummies.com/education/science/biology/
the-symmetry-and-shape-of-data-distributions-often-seen-in-biostatistics/
4.2 Strategic Pricing
Pricing strategies is a key feature in the theoretical literature. This can takethe form of setting lower prices (subsidize) to take advantage of networkeffects. This strategy is often observed in ride-sharing when there is intensecompetition between two or more platforms.9 For example, in a market withtwo platforms i = (A,B), what would be the effects of adopting the followingsurge pricing strategies with different discount factor δ at location j?:
pi,j = f(Demandj − Supplyi,j) (1)
At what discount level would a platform completely dominates the market(winner take all scenario)?
9”Fare cuts by Uber, Grab will hurt sector: Taxi body”, Straits Times, 24 April 2016;“Price War Sees Uber Lose $2.7m A Day In China”, Sky News, 18 February 2016.
11
4.3 Fixed Pricing vs. Surge Pricing
One market competition scenario that is not often discussed in the researchliterature is one in which a platform uses surge pricing while its rival usesa fixed price (or metered fare). Surge pricing is a form of dynamic pricingthat takes into account current demand and supply conditions at a givenlocation. For fixed pricing, prices are fixed and do not vary over time asdemand and supply conditions change. The co-existence of fixed and surgepricing is not only a theoretical possibility. In many markets, both pricingapproaches co-exists with ride-sharing adopting surge pricing whilst taxisadopting fixed (metered) pricing. How will the two platforms with differentpricing approaches fare in such situations? This, of course, depend on thelevel of price at which the fixed prices are levied. This raises the issue of thepossibility and usefulness of conceptualizing an “sustainable price” that canbe used for fixed pricing that will ensure taxis’ survivability.
To study this problem, two types of simulations are carried out:
• Pure Fixed Pricing - in which both platforms adopt fixed pricing
• Fixed Pricing and Surge Pricing - in which one platform adopts fixedpricing while the other adopts surge pricing.
4.4 Information Sharing
Another topic that will be examined is the impact of information sharingbetween rival platforms. This is related to (but is not identical) to theissue of monopoly and mergers that recur in the research literature. In acompetitive setting, rival platforms set prices based on the demand at agiven location and its own supply condition (number of its drivers). This isexpressed earlier, for platform i at location j as:
pi,j = f(Demandj − Supplyi,j) (2)
When information is shared, prices at location j are set based on the collectivedemand and supply at the location:
pi,j = f(Demandj − Supplyj) (3)
The result would be as if both platform offering identical prices with con-sumer choosing randomly between the two. The two platforms may still havedifferent market shares due to the different locational distributions of theirdrivers.
12

5 Ride-Sharing Model
5.1 Description of Model
This section provides a description of the ride-sharing model that will besimulated in this study. The ride-sharing market is modelled as a two-sidedmarket that comprises three types of agents, namely, (i) drivers that use theplatforms to provide taxing services; and (ii) passengers that use the servicesprovided by the drivers through the platforms; and (iii) platforms that matchdrivers with passengers.
Assume that there are two platforms (i = 1, 2) in the market providingplatforms for ride-sharing. These platforms serve to match drivers with pas-sengers. The two platforms can set the price p that drivers can charge theirpassengers.
It is assumed that the total number of drivers in the market is fixed at N . Adriver can only sign-up with one platforms (single homing).10 The numberof cars using platform i is given by ni. Thus, at any one time, the followingconstraint is met:
n1 + n2 = N (4)
The Salop (1979) circle is used to model space in the model with a totalof y locations. In the first period, the N drivers from both platforms arerandomly distributed across the y locations. It is further assumed that thereare C passengers in the market which are also randomly distributed acrossthe y locations along the circle.
For simplicity, it is assumed that a driver can only travel if they can pick up apassenger. Otherwise the driver will remain stationary in that period. Thus,the number of passengers can be - (i) less than, (ii) equal to, or (ii) more than- the number of drivers at each location. The number of passengers that canactually travel at a given location is constrained by the number of availablecars at that location. Similarly, the number of drivers that can travel froma given location will depend on the number of passengers at that location.
10In reality, drivers can sometimes sign-up with two platforms even though this is oftendiscouraged contractually and via incentive mechanisms (e.g. drivers can only accumulateenough rides if the trips they make are allocated to one platform).
13

During each period (an iteration in the simulations), a passenger j plans totravel distance xj in a one-way (single direction) along the circle. The mini-mum distance is zero (not travelling) and the maximum distance of travel isassumed to be half of the locational circumference of the circle (y). Thus,
Max xj =y
2(5)
The planned distance of travel by each passenger xj (trip distance) is gen-erated via a uniform random draw from a set comprising zero and positiveinteger numbers:
xj = Rand (X) (6)
where X = [0, 1, 2, ..., y/2] with xj = 0 indicating that passenger j will nottravel.
In order to travel, a passenger has to use the service of a driver from oneof the two platforms. Passengers are assumed to multi-home - they canchoose either one of the platform in each period. Let cj be the number ofpassenger choosing to use the service of cars under platform i. Thus,
c1 + c2 = C (7)
In this model, it is assumed that a passenger will choose to use the platformoffering the lowest price i.e. Min(p1, p2).
11
It is assumed that each platform is only aware of its own distribution of carsat each location and not those under the other platform. Platform i willset its price based on the market demand and its own supply conditions ateach location. To approximate surge pricing, the pricing formula used byplatform i at a given location s depends on excess demand for platform i atthat location:
pi,s = 1 +cs − ni,s
C/2(8)
where cs is the number of passengers at location s, ni,s is the number ofdrivers under platform i at location s and C total number of passengers.
The intuition behind the above equation is that when there are more driversthan passengers at a given location, higher prices are offered. Each platformwill allocate one driver to each passenger. If both platform offer the same
11In this model, the reservation price of consumers are not modelled explicitly. We canassume that underlying the passenger’s decision-making is a reservation price (vj). Forconsumers that choose to travel (i.e. xj > 0), Min [p1, p2] ≤ vj .
14

price - a consumer will randomly choose one of them. For simplicity, it isassumed that the surge pricing at a given location that comes about from highexcess demand do not increase the supply of drivers at that location. Thiscould be a reasonable simplification as existing empirical studies tend to finda relatively weak supply response to surge pricing (see earlier discussions).
5.2 Implementation of Simulations
The following is the sequence of the algorithm for the simulations:
• Step 1: Distributions are generated for the locations of of drivers(n1, n2) and passengers (cj).
• Step 2: Distributions are generated for the travel destination for eachpassenger (xj).
• Step 3: The prices for each platform at each location (pi,s) are computedusing the price formula (equation 8).
• Step 4: The set of passengers that can travel is generated based on theavailability of passengers and drivers at each location.
• Step 5: Each passenger that can travel is assigned a driver from one ofthe platform based on which platform’s price is lower. In cases whereboth platforms’ prices are identical (due to equal number of drivers),the passenger’s choice is randomized.
• Step 6: The locations of passengers and drivers are updated (comple-tion of trips).
• Step 7: The sequences of Step 2 to Step 6 is iterated in a loop togenerate a sequence of movements by passengers and drivers.
The base-line simulations were implemented using Mathematica using thefollowing parameters:
• Number of total drivers for the two platforms: 40 (or 20 each)
• Number of passengers: 60
• Number of location: 10
• Number of iterations (period): 100
15

6 Simulation Results
Four classes of simulations were carried out corresponding to the four topicsdiscussed in the earlier section. The results from the simulations are reportedand discussed below.
6.1 Price Distribution and Dynamics
The price algorithm used in this study’s simulations is based on an excessdemand function (see equation 8). When supply matches demand, the priceis equal to one (1). The model is simulated with two identical platforms -they have the same number of drivers and price-setting function. However,the distribution of cars under each platform across the locations are different.
In the simulations, prices do fluctuate at the various locations due to mis-matches between demand and supply. Interestingly, whilst there may becases where prices do fluctuate around a single band (Figure 3), there arecases when prices can bifurcate into two (Figure 4) or three (Figure 5)distinct bands. This takes place while the market shares of the two platformfluctuates in every period (panel c in Figures 3-5) and despite both having acumulatively equal market share (due to the identical/symmetric platforms).Thus, in a fully competitive two-platform market, prices can bifurcate andpersist - the latter exhibiting path-dependence.
Another take-away from these simulations is the need to re-evaluate the no-tion of a single equilibrium price or a single equilibrium price distribution.Even though prices are set in a centralized manner by each platform, theeffective price - defined as prices that are accepted by passengers - are de-centralized at each location.
16

20 40 60 80 100
0.2
0.4
0.6
0.8
1.0
1.2
1.4
(a) Price by Location
0.8 0.9 1.0 1.1 1.2 1.3 1.4
50
100
150
200
250
(b) Distribution of Prices
20 40 60 80 100
15
16
17
18
19
20
(c) Number of Trips by Platform
20 40 60 80 100
500
1000
1500
(d) Cumulative Trips by Platform
Figure 3: Simulation Results: Baseline 1
17

20 40 60 80 100
0.9
1.0
1.1
1.2
1.3
(a) Price by Location
0.9 1.0 1.1 1.2 1.3
50
100
150
200
250
(b) Distribution of Prices
20 40 60 80 100
15
16
17
18
19
20
(c) Number of Trips by Platform
20 40 60 80 100
500
1000
1500
(d) Cumulative Trips by Platform
Figure 4: Simulation Results: Baseline 2
18

20 40 60 80 100
0.9
1.0
1.1
1.2
1.3
1.4
(a) Price by Location
0.9 1.0 1.1 1.2 1.3 1.4
50
100
150
(b) Distribution of Prices
20 40 60 80 100
15
16
17
18
19
20
(c) Number of Trips by Platform
20 40 60 80 100
500
1000
1500
(d) Cumulative Trips by Platform
Figure 5: Simulation Results: Baseline 3
19

6.2 Strategic Pricing
The literature on platform competition often discusses the use of price reduc-tion (subsidy) as a strategy to increase market share which potentially leadsto a complete dominance situation (winner take all). As the passengers in themodel base their decisions on price alone, the winner take all is an obviousoutcome. What is less certain, however, is the extent of price reduction byone platform that is needed to achieve compete dominance. Furthermore,the spatial distribution of drivers also implies that even when the prices ofa platform is lower than another, the former may not have available cars orhave very few cars at a given location compared to the demand level.
Simulations are undertaken for a few scenarios in which one of the plat-form reduces its price by applying a discount factor on the pricing formula.Different sizes of discount (5%, 10%, 20%) are applied. The results are asfollows.
(a) 5% Price Discount
From the simulations, a price reduction of 5% by one of the platform is clearlyinsufficient to completely dominate the market. Thus, space does mitigatethe effects of price competition to some extent. However, the platform withlower prices does have a distinct but small advantage over its rival. This canbe seen in panel (d) in Figure 6 - the blue line (platform with lower price)is above the orange line.
(b) 10% Price Discount
When a platform offers an even higher discount - 10% in this case - the marketshare of the firm increases in a more stark manner. The market shares ofboth platforms continue to fluctuate in each period but the platform with thelower price has a higher market share in most periods (panel (c) in Figure
7). The longer-run advantage of the firm with lower prices is even more clear(panel (d) in Figure 7).
(c) 20% Price Discount
With an extreme level of discount, the winner take all scenario materializes(Figure 8). The platform with lower prices (by 20%) completely dominatesthe market. Prices at the different location become fixed at different levels.Note that in this scenario, only drivers that are under the platform withlower price is picking up passengers and moving. This fixed price level out-
20

come could be due to a significant number of passengers (almost half) are nolonger served by the market (see panels (c) and (d) in Figure 8). However,the winner take all scenario is not a given. In some simulations, the platformwith lower prices can survive, though with a significantly lower market share(Figure 9). In other words, “luck matters” in a stochastic world.
20 40 60 80 100
0.9
1.0
1.1
1.2
1.3
(a) Price by Location
1.0 1.1 1.2 1.3
50
100
150
200
250
300
(b) Distribution of Prices
20 40 60 80 100
15
16
17
18
19
20
(c) Number of Trips by Platform
20 40 60 80 100
500
1000
1500
(d) Cumulative Trips by Platform
Figure 6: Simulation Results: 5% Price Discount
21

20 40 60 80 100
0.9
1.0
1.1
1.2
1.3
(a) Price by Location
0.9 1.0 1.1 1.2 1.3 1.4
50
100
150
200
(b) Distribution of Prices
20 40 60 80 100
5
10
15
20
(c) Number of Trips by Platform
20 40 60 80 100
500
1000
1500
2000
(d) Cumulative Trips by Platform
Figure 7: Simulation Results: 10% Price Discount
22

20 40 60 80 100
0.80
0.85
0.90
0.95
1.00
1.05
1.10
1.15
(a) Price by Location
0.9 1.0 1.1 1.2
50
100
150
200
(b) Distribution of Prices
20 40 60 80 100
5
10
15
20
(c) Number of Trips by Platform
20 40 60 80 100
500
1000
1500
(d) Cumulative Trips by Platform
Figure 8: Simulation Results: 20% Price Discount - Winner Take All
23

20 40 60 80 100
0.8
0.9
1.0
1.1
(a) Price by Location
0.8 0.9 1.0 1.1
100
200
300
400
500
(b) Distribution of Prices
20 40 60 80 100
5
10
15
20
(c) Number of Trips by Platform
20 40 60 80 100
500
1000
1500
(d) Cumulative Trips by Platform
Figure 9: Simulation Results: 20% Price Discount - Luck Matters
24

6.3 Fixed Pricing vs. Surge Pricing
Taxi platforms and ride-sharing platforms often co-exist and compete in ride-hailing markets. In these markets, taxi and ride-sharing platforms oftenadopt different pricing approaches. As discussed earlier, two scenarios aresimulated: (i) pure fixed pricing - when all firms adopt fixed pricing, (ii)mixed market where one platform adopts fixed pricing while the other adoptssurge pricing.
(i) Pure Fixed Pricing
When prices are fixed at zero excess demand, the outcome is predictable.One single price prevail (p = 1) with fluctuating market share and bothfirms having equal cumulative market share over time (Figure 10).
20 40 60 80 100
0.5
1.0
1.5
2.0
(a) Price by Location
1.2 1.4 1.6 1.8 2.00
200
400
600
800
1000
(b) Distribution of Prices
20 40 60 80 100
15
16
17
18
19
20
(c) Number of Trips by Platform
20 40 60 80 100
500
1000
1500
(d) Cumulative Trips by Platform
Figure 10: Simulation Results: Pure Fixed Pricing
25

(i) Mixed Pricing
The more interesting case is the one with mixed market pricing. It is obviousthat it matters at what level is the price fixed. In the first simulation, thefixed price is set at p = 1. The simulation results clearly indicate that thefixed price at p = 1 is lower than the prices set via surge pricing. This isevidence by the higher market share of the platform using fixed pricing (blueline in Figure 11).
20 40 60 80 100
0.9
1.0
1.1
1.2
1.3
1.4
1.5
(a) Price by Location
1.0 1.1 1.2 1.3 1.4 1.5
50
100
150
(b) Distribution of Prices
20 40 60 80 100
5
10
15
20
(c) Number of Trips by Platform
20 40 60 80 100
500
1000
1500
(d) Cumulative Trips by Platform
Figure 11: Simulation Results: Mixed Pricing I
(Fixed Price, p = 1.00)
26
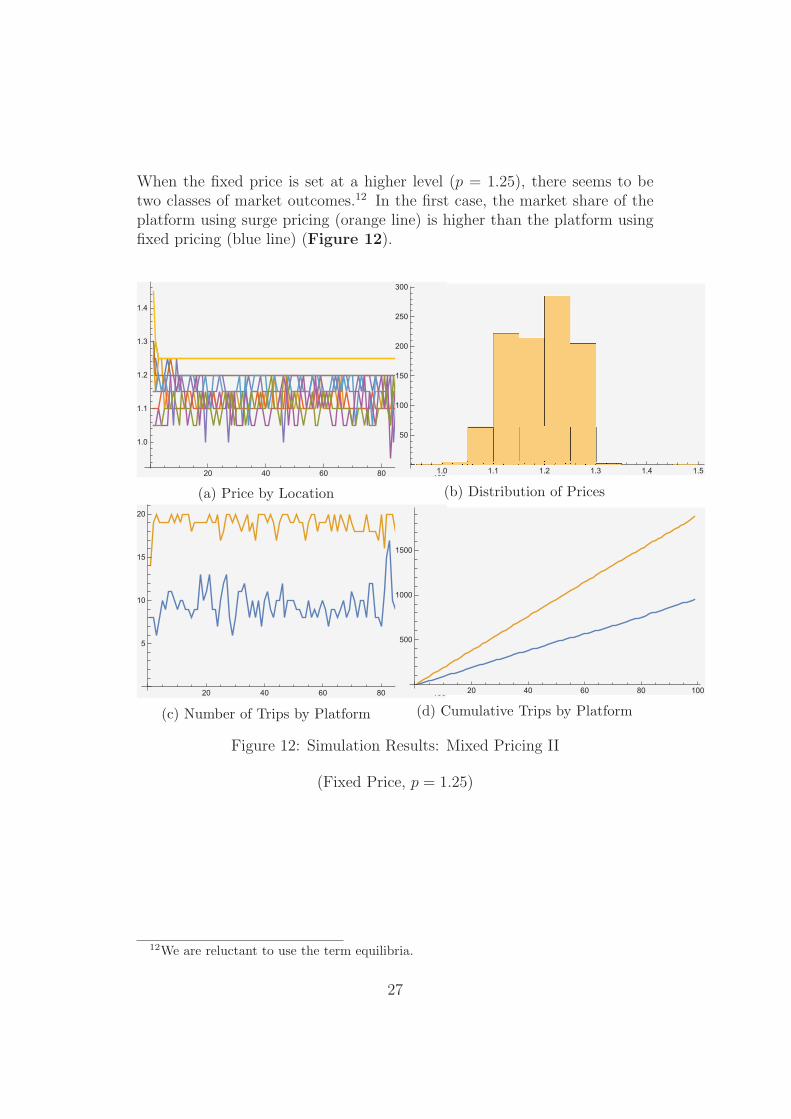
When the fixed price is set at a higher level (p = 1.25), there seems to betwo classes of market outcomes.12 In the first case, the market share of theplatform using surge pricing (orange line) is higher than the platform usingfixed pricing (blue line) (Figure 12).
20 40 60 80 100
1.0
1.1
1.2
1.3
1.4
(a) Price by Location
1.0 1.1 1.2 1.3 1.4 1.5
50
100
150
200
250
300
(b) Distribution of Prices
20 40 60 80 100
5
10
15
20
(c) Number of Trips by Platform
20 40 60 80 100
500
1000
1500
(d) Cumulative Trips by Platform
Figure 12: Simulation Results: Mixed Pricing II
(Fixed Price, p = 1.25)
12We are reluctant to use the term equilibria.
27

However, in the second case, some simulations show that the advantages ofusing surge pricing do not always persist over time. The platform using surgepricing can lose market share over time, eventually losing its lead to the plat-form using fixed pricing (orange line in panel (c) and (d) in Figure 13).
20 40 60 80 100
0.9
1.0
1.1
1.2
1.3
1.4
(a) Price by Location
1.0 1.1 1.2 1.3 1.4
50
100
150
200
250
(b) Distribution of Prices
20 40 60 80 100
5
10
15
20
(c) Number of Trips by Platform
20 40 60 80 100
200
400
600
800
(d) Cumulative Trips by Platform
Figure 13: Simulation Results: Mixed Pricing III
(Fixed Price, p = 1.25)
28

What if the fixed price is set significantly higher (e.g. at p = 1.5)? We wouldexpect that the platform setting a high fixed price will become completelyuncompetitive. This is indeed the case in some simulations (Figure 14).
20 40 60 80 100
1.0
1.1
1.2
1.3
1.4
(a) Price by Location
1.1 1.2 1.3 1.4 1.5
50
100
150
200
250
300
(b) Distribution of Prices
20 40 60 80 100
5
10
15
20
(c) Number of Trips by Platform
20 40 60 80 100
500
1000
1500
(d) Cumulative Trips by Platform
Figure 14: Simulation Results: Mixed Pricing IV
(Fixed Price, p = 1.30)
29

However, though not as frequent, there are simulations that indicate that thecompetitive gap between the two platforms may decline over time (Figure15). This can be attributed to what we term earlier as stochastic luck. How-ever, the market share of the platform with high fixed price is relatively low.Over time, even the market share of the platform using surge pricing declinesto a low level. These two trends in market share seem to suggest that themarket could converge over time to a situation where the market only servesa small number of passengers.
20 40 60 80 100
1.0
1.1
1.2
1.3
1.4
1.5
1.6
(a) Price by Location
1.0 1.1 1.2 1.3 1.4 1.5 1.6 1.7
50
100
150
200
250
(b) Distribution of Prices
20 40 60 80 100
5
10
15
20
(c) Number of Trips by Platform
20 40 60 80 100
100
200
300
400
500
600
700
(d) Cumulative Trips by Platform
Figure 15: Simulation Results: Mixed Pricing V
(Fixed Price, p = 1.30)
30

To sum up, the mixed pricing simulations indicate that in spatial marketswith stochastic elements, there are a number of potential outcomes - eachoccurring with different probabilities. Whilst we eschew the term “multipleequilibria”, but there is some parallel here between this concept and what isobserved from the simulations. Perhaps, a more appropriate characterizationis that of a complex system that can move along a number of several possibletrajectories depending on various factors such as initial conditions, stochasticshocks and parameters of the system (in this case, the price level fixed).
6.4 Information Sharing
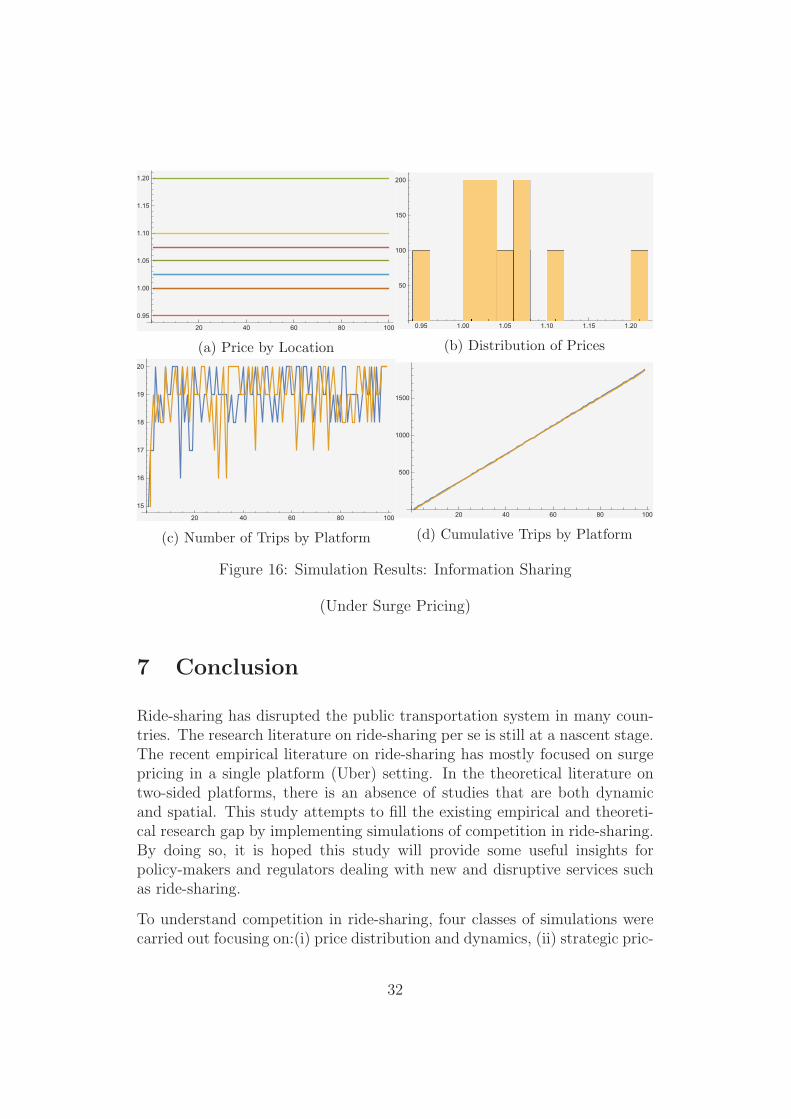
In the literature on two-sided markets, comparisons are sometime made be-tween two-sided platform competition and a monopoly. One possible ap-proach to mimicking the monopoly platform model is for rival platforms toagree on sharing information on the total cars available (under both plat-forms) at each location and use that as a basis for setting prices. Resultsfrom the simulations on information sharing suggests that whilst the marketshare of platform fluctuate over time, prices become stationary at the dif-ferent locations. However unlike other situations where the outcome is alsostationary prices, the number of total trips are much higher on average.
31
20 40 60 80 100
0.95
1.00
1.05
1.10
1.15
1.20
(a) Price by Location
0.95 1.00 1.05 1.10 1.15 1.20
50
100
150
200
(b) Distribution of Prices
20 40 60 80 100
15
16
17
18
19
20
(c) Number of Trips by Platform
20 40 60 80 100
500
1000
1500
(d) Cumulative Trips by Platform
Figure 16: Simulation Results: Information Sharing
(Under Surge Pricing)
7 Conclusion
Ride-sharing has disrupted the public transportation system in many coun-tries. The research literature on ride-sharing per se is still at a nascent stage.The recent empirical literature on ride-sharing has mostly focused on surgepricing in a single platform (Uber) setting. In the theoretical literature ontwo-sided platforms, there is an absence of studies that are both dynamicand spatial. This study attempts to fill the existing empirical and theoreti-cal research gap by implementing simulations of competition in ride-sharing.By doing so, it is hoped this study will provide some useful insights forpolicy-makers and regulators dealing with new and disruptive services suchas ride-sharing.
To understand competition in ride-sharing, four classes of simulations werecarried out focusing on:(i) price distribution and dynamics, (ii) strategic pric-
32

ing, (iii) fixed pricing vs. surge pricing, and (iv) information-sharing. Thesimulations on price distributions and dynamics indicate that even when amarket is competitive in the symmetric sense (identical platforms), pricescan bifurcate into two or more distinct bands of prices for different locations.The decentralized determination of prices (by location) also imply that itmight be more useful to study the distribution of prices rather that focusingon an “equilibrium price”. In the simulations on strategic pricing, the settingof lower prices can lead to a complete dominance by the platform with lowerprices. However, the spatial and stochastic nature of the model can mitigatethis “winner take all” effect. This can be due to “stochastic luck” - randomshocks that produces spatial distributions that favour a disadvantaged plat-form. The competitive dynamics of markets with ride-sharing (surge pricing)co-existing with taxi services (fixed price) can be complex. The market out-comes depend on the level of the fixed prices. In some cases, the advantagesof surge pricing can be eroded over time. Platforms with extremely highfixed prices may continue to get passengers (due to stochastic luck) but theirvolume of trips are very small. Finally, information sharing reduces pricefluctuations as information on market demand is pooled.
Overall, spatial and stochastic elements in two-sided markets such as ride-sharing make such markets complex. These markets can have a number ofpossible dynamic trajectories each with different outcome probabilities. Thisimplies that the impact of policy interventions cannot be known in advancein some cases.
33
References
Armstrong, M. (2006). Competition in Two-Sided Markets. RAND Journalof Economics, 37(3), 668–691.
Auer, D. and Petit, N. (2015). Two-Sided Markets and the Challenge ofTurning Economic Theory into Antitrust Policy. Antitrust Bulletin, 60(4),426–461.
Cabral, L. (2011). Dynamic Price Competition with Network Effects. Reviewof Economic Studies, 78, 83–111.
Caillaud, B. and Jullien, B. (2003). Chicken & Egg: Competition AmongIntermediation Service Providers. RAND Journal of Economics, 34(2),309–328.
Castillo, J. C., Knoepfle, D., and Weyl, E. (2017). Surge Pricing Solves theWild Goose Chase. Mimeo.
Cavallo, A. (2015). Scraped Data and Sticky Prices. NBER Working PaperNo.21490.
Cavallo, A. and Rigobon, R. (2011). The Distribution of the Size of PriceChanges. NBER Working Paper No.16760.
Chen, K. and Tse, E. (2008). Dynamic Platform Competition in Two-SidedMarkets. Mimeo.
Chen, L., Mislove, A., and Wilson, C. (2015). Peaking Beneath the Hood ofUber. mimeo.
Cohen, P., Hahn, R., Hall, J., Levitt, S., and Metcalfe, R. (2016). Using BigData to Estimate Consumer Surplus: The Case of Uber. NBER WorkingPaper No.22627.
Cramer, J. and Krueger, A. B. (2016). Disruptive Change in the Taxi Busi-ness: The Case of Uber. American Economic Review: Papers & Proceed-ings, 106(5), 177–182.
Dou, Y. and Wu, D. (2016). Dynamic Platform Competition: Optimal Pric-ing and Piggybacking under Network Efects. Mimeo.
Einav, L., Farronato, C., and Levin, J. (2016). Peer-to-Peer Markets. AnnualReview of Economics, 8, 615–635.
34

Evans, D. (2011). Platform Economics: Essays on Multi-Sided Business.Competition Policy International, Cambridge MA.
Evans, D. and Schmalensee, R. (2016). Matchmakers: The New Economicsof Multisided Business. HBR Press, Boston MA.
Hahn, R. and Metcalfe, R. (2017). The Ridesharing Revolution: EconomicSurvey and Synthesis. mimeo.
Halaburda, H., Jullien, B., and Yehezkel, Y. (2016). Dynamic Competitionwith Network Externalities: Why History Matters. Toulouse School ofEconomics, Working Paper No.TSE-636.
Hall, J., Kendrick, C., and Nosko, C. (2015). The Effects of Uber’s SurgePricing: A Case Study. Mimeo.
Kodera, T. (2010). Spatial Competition Among Multiple Platforms. Eco-nomics Bulletin, 30(2), 1561–1525.
Li, Z., Hong, Y., and Zhang, Z. (2017). An Empirical Analysis of On-DemandRide-Sharing and Traffic Congestion. Proceedings of the 50th InternationalConference on System Sciences.
Lindgren, K. (1997). Evolutionary Dynamics in Game-Theoretic Models. InW. Arthur, S. Durlauf, and D. Lane, editors, The Economy as An EvolvingComplex System II, Redwood City CA. Addison Wesley.
Raalte, C. and Webers, H. (1998). Spatial Competition with IntermediatedMatching. Journal of Economic Behavior & Organization, 34, 477–488.
Rigobon, R. (2015). Macroeconomics and Online Prices. Economia, pages199–213.
Rochet, J.-C. and Tirole, J. (2003). Platform Competition in Two-SidedMarkets. Journal of European Economic Association, 1(4), 990–1029.
Rysman, M. (2009). The Economics of Two-Sided Markets. Journal ofEconomic Perspectives, 23(3), 125–143.
Salop, S. C. (1979). Monopolistic Competition with Outside Goods. BellJournal of Economics, 10, 141–156.
Sundararajan, A. (2016). The Sharing Economy. MIT Press, Cambridge,MA.
35