DYNAMICS OF BOVINE TUBERCULOSIS - Michigan · 6.2 Historical determinants of the location of...
36
DYNAMICS OF BOVINE TUBERCULOSIS IN WILD WHITE-TAILED DEER IN MICHIGAN Michigan Department of Natural Resources Wildlife Division Report No. 3363 March 2002 Graham J. Hickling Printed by Authority of: P.A. 451 of 1994 Total Number of Copies Printed: .......…..200 Cost per Copy:................................…...$2.10 Total Cost: ...................................... .$420.00 Michigan Department of Natural Resources IC 2578-49 (03/08/2002)
Transcript of DYNAMICS OF BOVINE TUBERCULOSIS - Michigan · 6.2 Historical determinants of the location of...

DYNAMICS OF BOVINE TUBERCULOSIS IN WILD WHITE-TAILED DEER IN MICHIGAN
Michigan Department of Natural Resources Wildlife Division Report No. 3363 March 2002 Graham J. Hickling
Printed by Authority of: P.A. 451 of 1994 Total Number of Copies Printed: .......…..200 Cost per Copy:................................…...$2.10 Total Cost: ...................................... .$420.00 Michigan Department of Natural Resources
IC 2578-49 (03/08/2002)

i
Equal Rights for Natural Resource Users The Michigan Department of Natural Resources (MDNR) provides equal opportunities for employment and access to Michigan’s natural resources. Both State and Federal laws prohibit discrimination on the basis of race, color, national origin, religion, disability, age, sex, height, weight or marital status under the Civil Rights Acts of 1964, as amended (MI PA 453 and MI PA 220, Title V of the Rehabilitation Act of 1973 as amended, and the Americans with Disabilities Act). If you believe that you have been discriminated against in any program, activity, or facility, or if you desire additional information, please write the MDNR, HUMAN RESOURCES, PO BOX 30028, LANSING MI 48909-7528, or the MICHIGAN DEPARTMENT OF CIVIL RIGHTS, STATE OF MICHIGAN PLAZA BUILDING, 1200 6TH STREET, DETROIT MI 48226, or the OFFICE FOR DIVERSITY AND CIVIL RIGHTS, US FISH AND WILDLIFE SERVICE, 4040 NORTH FAIRFAX DRIVE, ARLINGTON VA 22203. For information or assistance on this publication, contact: MDNR, WILDLIFE DIVISION, P.O. BOX 30444, LANSING, MI 48909-7944, http://www.michigandnr.com. This publication is available in alternative formats upon request. TTY: Michigan Relay Center 1-800-649-3777
About the author: Dr Graham Hickling is a wildlife scientist based at Lincoln University in the South Island of New Zealand. He completed a B.Sc. Honors in Zoology in 1980 and that year took up a position as research scientist with the New Zealand Forest Research Institute. His research there focused on management of deer in recreational hunting areas. In 1983 he was awarded a National Research Advisory Council Postgraduate Fellowship to undertake a Ph.D. in Zoology at The University of Western Ontario, where he studied supplemental feeding of wild white-tailed deer in Ontario and the winter ecology of small mammals in the Canadian Rocky Mountains. Upon his return to New Zealand in 1987, he transferred to the newly established Landcare Research Institute as research manager of the Institute’s ‘Wildlife reservoirs of bovine tuberculosis’ program. In 1991 he was appointed to the New Zealand Animal Health Board’s Technical Advisory Committee, which coordinates farmer-funded research on issues relating to bovine tuberculosis. In 1993 Dr Hickling moved to an academic post at Lincoln University, where he teaches wildlife management and mammalian population biology. He is past Vice-President of the Australasian Wildlife Management Society and is on the editorial board of The New Zealand Journal of Ecology. He has authored or co-authored more than 50 refereed scientific papers and numerous reports, and has supervised 30 postgraduate theses.

1
1. SUMMARY 1.1 Project and aims
In mid-2001, the author of this report was invited to undertake an exploratory analysis of Michigan Department of Natural Resources’ data on bovine tuberculosis (TB) infection in wild white-tailed (Odocoileus virginianus) in the northeastern Lower Peninsula of the state. The aims of this analysis were:
• to quantify the geographic spread of tuberculous deer in Michigan; • to investigate key factors influencing the prevalence of disease in the core of the infected area; • to interpret the results in light of overseas experience with wildlife TB, with a view to
recommending how current management of the disease might be enhanced. 1.2 Goals of bovine TB management in Michigan
With regard to livestock, the immediate goal of the Michigan’s Bovine Tuberculosis Strategic Plan is to achieve USDA approval of Michigan’s application for ‘split-state’ status, whereby there will be a ‘modified accredited’ TB zone in the northeastern Lower Peninsula and a ‘modified accredited advanced’ TB zone in the Upper Peninsula and the remainder of the Lower Peninsula. The longer-term goal is to support the USDA’s strategy for achieving TB accredited free status for the nation as a whole. With regard to wildlife, the goal of the strategy is commonly understood to be eradication of the disease. The current wording of the strategy is ‘to reduce the prevalence of bovine TB in wildlife to an undetectable level’. 1.3 Key findings of the analysis
• Bovine tuberculosis in Michigan’s deer is concentrated within a high-prevalence core area, where the disease appears to be self-sustaining. Small numbers of infected deer are present in counties well outside of the core area but under present conditions bovine TB is unlikely to be self-sustaining in those counties.
• Over the period 1995-2000 there has been no significant change in core area prevalence, nor is there any evidence of significant expansion or contraction of the infected area. Consequently, natural movement of wild white-tailed deer does not at present pose a significant risk of spreading bovine tuberculosis elsewhere in Michigan, or to other states.
• Within the core area, variation in bovine TB prevalence among townships is positively correlated with differences in deer density and the extent of human provision of supplemental foodstuffs1 for the deer in those townships.
• Since 1995, concern over TB spread has led to an approximate one-third reduction in deer density and an approximate three-quarters reduction in food supplementation activity within the core area. A preliminary modeling exercise suggests that these positive outcomes of the current management regime will reduce TB prevalence in core-area deer from the present 2.6 percent to around 0.5 percent, although it may require a decade or more to achieve the full reduction. With current management, complete eradication of bovine TB infection from the wild deer herd seems unlikely.
• Two alternative strategies that would enhance the prospects for eradication of bovine TB from the wild deer herd are:
• reducing deer densities by an additional 40-50 percent, while maintaining current compliance with the regulations restricting food supplementation; or
• holding deer densities at or below their current level, while enforcing a complete ban on food supplementation activities.
• In recent years, an estimated 2.2 cattle herds per annum have contracted bovine TB through contact with Michigan deer. Modeling of the infection risk that deer pose to cattle suggests that current deer management actions are unlikely to restore Michigan’s ‘accredited free’ TB status. Further reduction in deer numbers and food supplementation, together with actions by the agriculture community that assist in keeping wild deer and livestock apart, would improve the prospects of achieving this goal.
1 Throughout this report, ‘food supplementation’ refers to activities of sufficient scale to be visible from survey aircraft,
regardless of whether the intention of the humans involved was to ‘feed’ or ‘bait’ wild deer.

2
2. CONTENTS Page
1. Summary
1
2. Contents
2
3. Introduction
3
4. Background to the problem
4
4.1 Bovine TB in the US and Michigan 4 4.2 Goals and objectives of bovine TB management in Michigan 6 4.3 Comparison with New Zealand’s objectives for managing wildlife
tuberculosis
8
5. Spatial distribution of bovine TB among white-tailed deer in Michigan’s northeastern Lower Peninsula
9
5.1 Initial infection and geographic expansion of bovine TB in Michigan deer 9 5.2 Implications for disease surveillance in fringe areas 14
6. Factors influencing the prevalence of bovine TB among deer within the core area of infection
16
6.1 Introduction 16 6.2 Historical determinants of the location of Michigan’s bovine TB outbreak 16 6.3 Current factors influencing the distribution of bovine TB within the core area
18
7. The likely outcome of current and future management interventions
24
7.1 Introduction 24 7.2 The McCarty and Miller model 24 7.3 The core-area regression model 7.4 Implications for cattle reactor rates 7.5 Prospects for eradication of bovine TB in Michigan
26 27 29
8. Acknowledgements
30
9. References
30
10. Appendix – Timeline of recent changes in legislation relating to deer hunting, feeding and baiting in Michigan’s northeastern Lower Peninsula.
33

3
3. INTRODUCTION Bovine tuberculosis (TB) is a bacterial disease caused by Mycobacterium bovis, which infects domestic livestock and wildlife in many parts of the world. In developed countries, vigorous eradication campaigns over the past century have brought the disease close to eradication. For example, the State of Michigan in the 1950s was producing more than 30 percent of the USA’s TB-reactor cattle (Frye 1995), yet by 1979 good progress towards eradication enabled the state to declare accredited freedom1 from bovine TB. In 1975, a wild white-tailed deer (Odocoileus virginianus) infected with bovine TB was shot by a hunter in Alcona County, in the northeastern Lower Peninsula of Michigan. A second infected deer, also shot by a hunter, was identified in 1994 in Alpena County, about nine miles from the 1975 case. Subsequent surveys in the surrounding area revealed further cases of infection among wild deer, captive cervids and domestic cattle. By the end of 2000, 338 white-tailed deer, one elk (Cervus elaphus), 23 carnivores, one captive cervid facility and 11 herds of domestic cattle (9 beef and two dairy) in the northeastern Lower Peninsula had been identified as being infected with the disease (Figure 1).
Figure 1. Locations of bovine TB-infected livestock and wild cervids (338 deer, 1 elk) identified from 1994 - 2000 within the counties of Michigan’s northeastern Lower Peninsula.
1 At that time, accredited freedom was defined as 0 percent prevalence of TB-infected herds, with no more than one
infected herd disclosed in a 48 month consecutive period (APHIS 1999)

4
This resurgence of bovine TB in Michigan during the mid- to late-1990s led to expanded disease surveillance of wildlife and livestock in the affected area. By the end of 2000, Michigan Department of Natural Resources (DNR) staff had compiled a database on the disease status of 62,563 deer sampled from 83 counties throughout the state. Various ancillary datasets on deer abundance, the locations of supplemental feed and bait piles, and other factors relevant to the problem were also held by the DNR. In mid-2001, the author of this report was invited by the DNR to undertake an exploratory analysis of the available data with a view to better understanding of the dynamics of bovine TB among deer in the infected area. The specific aims of this analysis were:
• to quantify the geographic spread of tuberculous deer in mid-Michigan; • to investigate key factors influencing the prevalence of disease in the core of the infected area; • to interpret the results in light of overseas experience with wildlife TB so as to recommend how
current management of the disease situation might be enhanced. The analysis was done while the author was a visiting researcher at the DNR’s Rose Lake Wildlife Disease Laboratory, while on sabbatical leave from his position as Senior Lecturer in Wildlife Management at Lincoln University, New Zealand. To achieve a timely output from the project, the analyses have been first reported in this DNR Wildlife Division report, with a view to subsequent peer-reviewed publication of the key findings. The analysis does not address the dynamics of bovine TB in wildlife other than deer and elk. The carnivores and other wild species found infected in the state are considered to be spillover hosts that make no significant contribution to the persistence of bovine TB in the northeastern Lower Peninsula (Bruning-Fann et al. 2001). Tuberculosis infection in these species is likely to disappear if the disease problem in the cervid species can be resolved (see Morris and Pfeiffer 1995 for a more thorough discussion of reservoir and spillover hosts).
4. BACKGROUND TO THE PROBLEM 4.1 Bovine TB in the US and Michigan Bovine tuberculosis originated in European breeds of cattle. At the end of the nineteenth century, bovine tuberculosis was widespread among livestock both in Europe and in regions colonized by European settlers. For example, when the official Bovine TB Eradication Program began in the United States in 1917, 5 percent of the cattle checked reacted positively to a tuberculin test (Frye 1995). At that time tuberculosis was the most common cause of death and incapacity in the human population, with many of these cases attributed to drinking raw milk from tuberculous cows. In the United States, as in most developed countries, test-and-slaughter procedures with concurrent slaughterhouse surveillance and cattle movement control provided a highly effective means of controlling the disease in livestock. Over the first 13 years of the U.S. program, the national reactor rate dropped by 64 percent (Frye 1995). Progress was somewhat less satisfactory in Michigan, which suffered a resurgence of disease in the 1950s. Michigan’s program then intensified and by the 1960s the number of reactor cattle being detected in the state was declining rapidly (Fig. 2). Thereafter, the herd testing effort

5
abated and surveillance increasingly came to rely upon slaughterhouse inspection. Ongoing progress with the eradication effort allowed Michigan to declare itself bovine TB ‘accredited free’ in 1979.
0
2000
4000
6000
1959 1960 1961 1962 1963 1964 1965 1966
Fiscal year
No.
of r
eact
or c
attle
Figure 2. Declining annual incidence of TB-reactor cattle in Michigan during the early- to mid-1960s (adapted from MDA 1968).
In North America, as in other countries, some wildlife have contracted bovine TB infection through contact with diseased livestock. Prior to the mid-1990s the extent of bovine TB in Michigan’s wildlife was unstudied, however the disease is thought to have been rare in wild species during the past century. Indeed, prior to 1995 there had been only eight cases of bovine TB reported in wild deer from North America (references in Schmitt et al. 1997) – these were considered to have arisen from exposure of those deer to infected cattle, bison, captive elk or feral swine. In Michigan, the first reported case of bovine TB in a wild white-tailed deer was an infected 9.5-yr-old doe taken by a hunter in November 1975, in Alcona County in the northeastern Lower Peninsula. A Michigan Department of Agriculture investigation at that time noted that there were no livestock near to where the deer had been taken. No follow-up survey of wildlife in the area was undertaken at the time (Schmitt et al. 1997). In the fall of 1994, a second deer with bovine TB was identified in Alpena County, nine miles from the location of the 1975 case. In the spring of 1995, some of the livestock in the vicinity of this second case were tested for bovine TB, but no evidence of infection was found. Wildlife surveys were conducted in the spring and fall of 1995, with the latter surveys detecting further cases of infected deer. Since then, annual deer surveys during the fall harvest, and additional non-harvest survey work, have steadily increased the number of deer carcasses inspected and the extent of area under surveillance. These surveys have revealed that the bulk of infection within Michigan’s wild deer population is concentrated within a high-prevalence ‘core area’ of 15-20 townships on the shared boundary of Alpena, Alcona, Oscoda and Montmorency counties in the northeastern Lower Peninsula. Michigan’s cattle industry numbers c.1,050,000 head of cattle, of which only about 21,400 head (2 percent) are located in these core-area counties (BTEPC 2001). In 1996, the Centers for Epidemiology and Animal Heath published an assessment of the risk to livestock posed by Michigan’s TB-infected deer (CEAH 1996). This analysis, which assumed that infected deer were confined to a core area 14 by 14 miles in size, concluded that there was only a 12 percent likelihood that one or more cattle would be infected by these wild deer over a 25-year period. This risk soon proved to have been

6
underestimated, as cases of bovine TB infection began emerging among livestock in the counties around the core area (Table 1). The precise risk that infected deer pose to cattle remains uncertain, as there were associations (i.e., cattle transfers and shared fence-lines) among several of the infected herds such that some reactors may have become infected as a result of cattle-cattle, rather than deer-cattle, transmission. As a consequence of this resurgence in livestock TB, Michigan lost its bovine TB accredited-free status in June 2000 and is currently designated as ‘modified accredited’. This change in status has focused attention on the option of ‘split state status’, whereby APHIS has the ability to permit the establishment within a state of two zones that differ in their TB accreditation status. An initial attempt to establish two such zones in Michigan was stalled by the discovery in 1999 of TB-infected deer in counties well beyond the core-area. By 2001, four infected deer had been found at least 40 miles beyond these boundaries and an additional eight had been found at least 20 miles beyond them (DNR unpublished data). Table 1. Annual changes in the number of bovine TB herd breakdowns among livestock on Michigan’s northeastern Lower Peninsula for the period 1994 – 2001 (United States Department of Agriculture, unpublished data).
Year No. and type(s) of herd No. of animals TB-positive1
/ total no. in infected herds County
1994 0 - - 1995 0 - - 1996 0 - - 1997 1 deer (captive) 14 / 262 Presque Isle 1998 1 beef 1 / 20 Alpena 1999 3 beef 13 / 415 Alcona, Presque Isle 2000 5 beef 2, 2 dairy 9 / 914 Presque Isle, Alpena,
Alcona, Montmorency 2001 8 beef 3 42 / 431 Alpena, Alcona
1 Positive on histology and/or culture 2 Associations exist among four of these herds and one of the 2001 beef herds 3 Associations exist among three of these herds 4.2 Goals and objectives of bovine TB management in Michigan The fundamental goal of bovine TB management is to protect the health of humans along with their associated livestock and wildlife. In practice, procedures such as milk pasteurization and meat inspection mean that the risk to humans of bovine TB infection from domestic animals is extremely low in most developed countries. In such countries, even those groups considered most at risk of contracting infection from contact with wildlife (i.e., wildlife biologists and hunters) have negligible rates of infection (Coleman & Livingstone 2000, O’Brien et al. 2000). Consequently, the pressing reasons for bovine TB management in Michigan are economic and political.

7
At the federal level, it is considered that U.S. competitiveness in international markets would be enhanced if bovine TB was eradicated permanently. The U.S. Department of Agriculture’s stated intention is therefore ‘to eradicate bovine tuberculosis from the domestic livestock population of the United States by December 31, 2003’ (APHIS 2000). This implies that all States need to achieve, and maintain, tuberculosis accredited free status (APHIS 1999). Consequently, there is federal pressure for Michigan to eradicate tuberculosis from its wildlife population so as to prevent transmission of the disease from wildlife to domestic livestock. At the State level, Michigan’s loss of accredited free status in 2000 is predicted to cost between $22 and $74 million if it continues for a 5-year period (APHIS 2000). Recognizing this risk, Governor Engler in 1998 issued an Executive Directive to eradicate bovine TB from the state. With regard to livestock, the immediate goal of the State’s Bovine Tuberculosis Strategy is to achieve USDA recognition of zoning in Michigan, whereby there will be a ‘modified accredited’ zone in the northeastern Lower Peninsula and a ‘modified accredited advanced’ zone in the Upper Peninsula and the remaining counties of the Lower Peninsula (BTEPC 2001). APHIS (1999) specifies that to maintain modified accredited status Michigan needs to ensure there are no more than 10 infected herds disclosed in the state or zone over a 12 month period. The requirements for transitioning to, and remaining at, higher bovine TB status levels are shown in Figure 3.
r
FigremandminEra
Modified accredited
ure ain J. imudica
Modified accredited advanced
3. USDA requirin, or transition tVanTiem, pers. cm standards set tion’.
Accredited free
r
ements for a Zone co, various Bovine Tuomm.). At each leveby the ‘Uniform Meth
Less than 3 infected herdsin the past 24 months
ontaining berculosisl, the Zonods and R
0 herds infected in the past 60 months*
2 herds infected inthe past 48 months
10 or fewer herds infected in the past yea
Up to 3 herds infected in each of the last 2 years
0 or 1 herd infected in the past yea
* Or 24 months if: all infected herds are depopulated and: the Zone was previously ‘accredited free’
fewer than 10,000 herds to Status levels (APHIS 1999 e must also comply with the ules – Bovine Tuberculosis

8
With regard to wildlife, the strategy aims to eradicate the disease from the state’s wildlife populations. Based on the recommendations of a special State Committee that reviewed the problem (Peyton 1997), the State’s original strategy set as its specific objectives for wildlife:
• a prevalence1 of infected deer within the TB core area2 of less than 1 percent by the fall of 2003; • 0 percent prevalence outside of the core area by 2003; • elimination of the disease from the wild herd by 2010.
A draft Memorandum of Understanding (MoU) regarding criteria for split state status in Michigan has, however, proposed that this wording be replaced with a stated goal of ‘moving towards bringing the prevalence of bovine tuberculosis down to an undetectable level’ in wildlife3. To achieve these livestock- and wildlife-related objectives, Michigan has implemented a range of management activities that address three aspects of the problem:
• reducing within- and between-herd transmission of infection by livestock (through herd testing and depopulation, restrictions on livestock movement and slaughterhouse surveillance);
• reducing transmission of infection from wildlife to cattle (through increased harvesting to reduce wildlife population numbers, and changes in farm management practices such as fencing and feed storage);
• reducing, and if possible eradicating, bovine TB infection in wildlife (through population reduction and restrictions on practices such as human provision of supplemental food that may increase the risk of disease transmission among wildlife by causing them to congregate – see Appendix).
4.3 Comparison with New Zealand’s objectives for managing wildlife tuberculous
The ongoing wildlife surveillance effort in Michigan has revealed a disease situation that has strong parallels with the wildlife tuberculosis problems faced by other countries. For example, in New Zealand bovine TB was first detected in wildlife in the 1950s and was identified in the key reservoir species – brushtail possums (Trichosurus vulpecula) – in 1967. Since then, the area known to contain infected wildlife populations has expanded rapidly and by 2001 encompassed c.30 percent of New Zealand’s land area. In response to this dramatic spread, managers implemented a national disease control strategy with objectives broadly similar to those being pursued in Michigan. With disease being so widespread in New Zealand wildlife, it is believed that it will require a very long-term effort to manage the problem there. Consequently, the third of Michigan’s stated objectives (i.e., reducing bovine TB infection in wildlife) has in New Zealand been divided into three sub-objectives that differ in timeframe:
• To prevent further geographic spread of disease (short term); • To ‘roll back’ the current broad distribution of disease into small core areas (medium term); • To reduce disease transmission within the core areas to the point at which the disease is no
longer self-sustaining, with a view to its eventual eradication (long term).
1 These objectives, and all analyses presented in this report, refer to the prevalence of disease detectable by
standard DNR surveillance procedures (i.e., visual inspection of the body cavity in the field; necropsy and macroscopic inspection of head and/or body organs in the laboratory; and submission of suspect tissue for histology and culture: O’Brien et al. 2001). This procedure likely underestimates true prevalence and so research is underway to determine the extent of underestimation (D. O’Brien, pers. comm.).
2 Peyton was referring here to the ‘old’ boundaries of DMU452 – see Section 5.1 3 This wording is problematic, because detection is contingent on survey effort and the minimum acceptable level of
survey effort is not specified. Although it is certainly not the intent of the MoU, it could be argued that the most cost-effective way to achieve this goal would be to reduce the amount of effort put into deer surveys.

9
These sub-objectives are relevant to the Michigan situation, and have been used as a framework for the analyses presented in this report. These begin, in Section 5, with an examination of recent changes in the distribution of tuberculous deer to determine whether bovine TB is spreading geographically within Michigan. Section 6 investigates the dynamics of the disease within the core area of infection. Finally, Section 7 considers how managers might best reduce disease transmission within the core area and discusses the prospects for eradication of bovine TB from Michigan’s wildlife and livestock.
5. SPATIAL DISTRIBUTION OF BOVINE TB AMONG WHITE-TAILED DEER IN MICHIGAN’S NORTHEASTERN LOWER PENINSULA
5.1 Initial infection and geographic expansion of bovine TB in Michigan deer As described above, the 1994 case of bovine TB was a 4.5-yr-old buck white-tailed deer in south-western Alpena county. Its location, only 9 miles from the 1975 case of bovine TB in a 9.5-year-old doe, prompted surveys of the area’s wildlife in the spring and fall of 1995. The latter survey detected 15 further cases of bovine TB in 354 deer harvested by hunters within a 10-mile radius of the 1994 case (i.e., a 4.2 percent prevalence; Schmitt et al. 1997). Additional survey work done after the fall 1995 hunting season produced a revised estimate of 26 cases in 750 deer by 15 July 1996 (i.e., a 3.5 percent prevalence; CEAH 1996). Subsequently, there have been annual fall harvest surveys and additional non-harvest survey work, which have steadily increased the intensity and extent of area under surveillance. In recent years, bovine TB survey work has been based on carcass inspection and necropsy of the lymph nodes of deer heads submitted to DNR staff at check stations. Carcasses come from throughout the state, which is divided into a more-or-less regular grid of 6 mile by 6 mile ‘townships’. To ensure robust sample sizes for analysis, three equal time periods (1995 - 1996, 1997 - 1998 and 1999 - 2000) were defined and the raw data pooled by township. Bovine TB prevalence in the northeastern Lower Peninsula was then analyzed graphically and statistically. An important question for managers is whether or not bovine TB is spreading out from the core area within which infection was first identified. Initially, the core was designated on maps as being ‘an area extending c.5 miles out from the locations of tuberculous deer identified in the 1995 surveys, with boundaries defined by readily-identifiable highways’ (S. Schmitt, pers. comm). Subsequent surveys have determined that infected deer are present throughout, and far beyond, this core area. Nevertheless, disease prevalence is much lower in the outlying counties, so the core area designation1 has proven useful as a focus for management activities. At first glance, inspection of the locations of tuberculous wild deer identified from 1995 through to 2000 (Figs 4a, c and e) gives the impression that spread is indeed occurring. What must be appreciated, however, is that the intensity of survey work outside of the boundaries of DMU452 increased dramatically over that period (Figs 4b, d and f). To address this issue of changing survey effort, geographic change in disease prevalence (i.e., the proportion of inspected heads, body tissues and carcasses that were TB-positive) was assessed. 1 In 2000 the boundary of Deer Management Unit (DMU) 452 was adjusted so that it would formally designate an area of intensified, TB-related deer management. The boundaries of this ‘new’ DMU452, which lies somewhat east of the equivalent boundaries of the ‘old’ DMU452 that is referred to in pre-2000 reports, are intended to encompass the core area of infection.

10
Detailed mapping of prevalence is problematic because local-area prevalence estimates are often variable due to small denominators (i.e. the numbers of deer inspected) in some sampling units (Elliot et al. 2001). To address this problem, the first step taken in the analysis was calculation of bovine TB prevalence for each township in the northeastern Lower Peninsula using pooled survey data for the six years 1995-2000. A smoothed contour map was then generated to help visualize the disease prevalence of the region (Fig. 5). This map demonstrates that DMU452 is indeed centered on the part of the northeastern Lower Peninsula where the prevalence of bovine TB in deer peaks at over 2 percent. Prevalence declines rapidly with increasing distance from the center of the infected area; it has roughly halved around the boundaries of DMU452 and has dropped by a further order of magnitude, to about 0.2 percent, at a distance of 20-40 miles from DMU452. Contour maps are a useful way to visualize the distribution of disease, but are less suited to formal statistical analysis. As the drop-off in prevalence was reasonably uniform in all directions (termed ‘isotropy’ in spatial analysis) the problem was shifted from two dimensions to one by calculating the distance each township lay from the mathematical centroid1 of the diseased area ( in Fig. 5).
1 It is probably no coincidence that this centroid coincides with the location of the 1994 tuberculous buck that is considered the ‘index case’ of the current disease outbreak

11
No. of TB-positive deer
1997-98
c)
0
25
1995-96
a)
0
25
1999-00
e)
0
25f)
No. of deer inspected
0
350
d)
0
350
b)
0
350
Figure 4. Numbers of TB-positive deer, and total number of deer (i.e., heads, tissues and/or carcasses) inspected for disease in Michigan’s northeastern Lower Peninsula, plotted by the location of each township from which hunters reported taking deer during the period 1995 - 2000. Note the different y-axis scales on the two sets of graphs.

12
Figure 5. Prevalence map of bovine TB in wild deer in Michigan’s northeastern Lower Peninsula for the period 1995 - 2000. The unshaded area had a prevalence of less than 0.2 percent, so the presence or absence of diseased deer in any particular township in that area is uncertain. Solid contour lines indicate increments of 0.2 percent disease prevalence and were generated from a rectangular grid of township-level prevalence estimates, using the ‘inverse distance to a power’ procedure in Surfer (Golden Software, Inc. 1999; power = 3, smoothing = 1). Thin black lines indicate county boundaries and the heavy black line indicates the 2001 boundary of DMU452. The white star and dotted contour line indicate the infected area’s mathematical centroid and the 0.02 percent prevalence contour, respectively; these are discussed further in the text.

13
When the relationship between disease prevalence and distance from the core area is compared at 2-years intervals (Figures 6 a,b,c) it is evident that there has been minimal change in the spatial distribution of disease over the period 1995-2000. Small numbers of tuberculous deer have been found at increasing distance from the core area in recent years, but since they came from townships not previously surveyed they cannot be interpreted as evidence that the infected area has expanded over the 6-year period. These analyses confirm that during all three time-periods there is a distinct peak in bovine TB prevalence within the core area, with prevalence declining rapidly with increasing distance from the core area’s centroid. Peak prevalence in the townships immediately adjacent to the centroid averaged 2.60 percent from 1995 - 2000 and did not vary significantly between years over that period (one-way ANOVA on log-transformed data; F2,9 = 0.11, P = 0.90). A two-way ANOVA reveals no significant Year*Distance interaction (F6,167 = 0.17, P = 0.98) which indicates that the rate at which prevalence declines with distance has also unchanged. The distance effect itself is highly significant (F3, 173 = 38.1, P < 0.0001).
1999-2000
1997-98
1995-96
Not surveyed
Not surveyed
84
72
60
483624
12 0
2.00
1.00
0.00
3.00
2.00
1.00
0.00
3.00
2.00
1.00
0.00
3.00
Bov
ine
Tb p
reva
lenc
e (%
)
Distance from the infected area’s centroid (miles) (miles)
Figure 6. Bovine TB prevalence, at biennial intervals, among deer in townships at increasing distance from the core of the infected area shown in Figure 5. The infected area was considered to be centered on the southeastern corner of Township 29N05E. Raw prevalence data were log-transformed for statistical analysis, and back-transformed for graphical presentation.

14
These data suggest that there has been no significant spread of disease outwards from the heart of the core area over the past 6 years. The simplest explanation for this finding is that the system is essentially in a steady state (rather than in a phase of pronounced outbreak or expansion of disease). A possible model for the system is that deer abundance and behavior in the core area are such that the disease is self-sustaining there, and thus the core area acts as a ‘source’ of newly-infected deer. Some of these deer cross-infect other individuals that they meet during dispersal, migration or normal home-range activity (in northeastern Michigan most male white-tailed deer disperse, typically moving 5 – 10 km from their natal range; S. Winterstein pers. comm., Garner 2001). The disease consequently spreads outwards into areas that then act as a negative ‘sink’ within which the disease dissipates. This implies that outside of the core area, the characteristics of the deer-habitat-human system are such that the threshold for persistence of bovine TB infection in deer is not met. The 6-year timeframe for which data are available is of course too short to be entirely confident of this explanation. Nevertheless, the data to date do suggest that there is little risk that natural movement of deer will spread bovine TB elsewhere in Michigan or to adjacent states. This has obvious implications for Michigan's application to the USDA for ‘split state status’. Past expansion of the infected area appears to have been relatively uniform in all directions and the number of infected animals known to have moved any significant distance is low (Fig. 5), so it is unlikely that there will be any statistically-significant habitat or density predictors of the prevalence of bovine TB in the areas surrounding DMU452. Such predictors are most likely to be evident within the high-prevalence core area itself – a preliminary search for such predictors is the focus of Section 6. 5.2 Implications for disease surveillance in fringe areas The DNR’s standard maps of bovine TB distribution (e.g. Fig. 1) have been interpreted by policy-makers as implying that some, but not all, counties in the northeastern Lower Peninsula have infected populations of deer. Designation of a county as ‘infected’ has practical implications; for example, deer baiting and the feeding of deer or elk are banned in such counties1 (DNR 2001). In contrast, research staff are keenly aware that 'gaps' in the map of counties considered to have wildlife disease may primarily reflect the difficulty in reliably sampling these low-prevalence populations with the resources available, rather than a genuine absence of infection. To illustrate this point, consider the eight counties that lie on the western fringe of the infected area, only two of which (Emmet and Antrim) have to date been a source of infected deer submitted during DNR surveys. True prevalence remains uncertain for these counties, however the spatial analysis presented in Figure 5 suggests that the 0.02 percent prevalence contour passes through all eight counties2. Based on this prevalence contour, Table 2 presents calculations of the likely number of tuberculous deer in these counties and the consequent likelihood of the DNR detecting infected individuals in any given year’s check-station survey.
The calculations summarized in Table 2 predict that there are, in a given year, about 30 tuberculous deer spread through these fringe counties. Given the DNR’s current sampling intensity (see BTECP 2001), there is currently less than a one-in-five (20 per cent) chance of detecting an infected animal in any
1 Except within DMU452, where baiting was permitted in 2001 (DNR 2001). 2 This is consistent with the 1995-2000 field survey data, whereby a total of 9115 carcasses from these counties were
inspected and two tuberculous deer found (a 0.022 percent prevalence).

15
particular county in a given year. There is, however, a better-than-average chance (63 percent) of detecting infection somewhere in the 8 fringe counties in a given year.
To have a better-than-average chance of detecting infection in a specific county, 4 – 8 years of successive surveys at current sampling intensity would be needed (Table 2). To be 95 percent sure of detecting disease in that county would require 15-30 years of surveys, which is obviously impracticable.
The key prediction of this analysis is that TB deer are more widespread, albeit in very low numbers, than is implied by the DNR’s maps of infected counties (e.g. Fig. 1). ‘Gaps’ in the distribution of these counties are more likely to reflect the prohibitive effort needed to sample these low-prevalence areas effectively than a true absence of disease. As discussed in Section 5.1, conditions in these counties may not be suitable for persistence of self-sustaining bovine TB infection, in which case the presence of small numbers of infected deer will not necessarily be the precursor to outbreaks of disease in those counties. Table 2. Estimated bovine TB prevalence, and estimated number of tuberculous deer present, in eight counties that fringe of the TB-infected core area of the northeastern Lower Peninsula. The probability of detecting at least one infected deer in one survey is shown, based on the DNR’s current targets for the number of deer to be checked annually in each county. The number of annual surveys required for the DNR to be 50 percent confident of detecting a tuberculous deer in that county is also shown.
County TB 1
(%) Buck
popn.2 Doe
popn.2 Estimated no. of TB
bucks
Estimated no. of TB
does
Check station target3
% bucks in checked sample4
Annual prob. of detecting at least
one TB deer5
No. of annual surveys
required6
Cheboygan 0.03 3500 7600 1.2 1.9 500 59% 14% 5
Emmet 0.02 2700 5600 0.6 0.9 375 66% 8% 5
Charlevoix 0.03 3200 6900 1.1 1.7 375 58% 11% 6
Antrim 0.03 3200 6200 1.1 1.5 375 55% 11% 6
Kalkaska 0.03 4000 7000 1.4 1.7 375 62% 9% 8
Missaukee 0.02 4200 11600 0.9 1.9 300 58% 10% 7
Roscommon 0.03 4800 14100 2.3 3.5 500 59% 14% 5
Ogemaw 0.04 5900 11900 2.7 3.9 500 58% 18% 4
ALL 8 COUNTIES: 12 17 63% 1
1 Estimated from the disease prevalence contours shown in Figure 5. 2 Unpublished DNR data, J. Urbain, pers. comm. 3 As specified in BTECP (2001). 4 Unpublished DNR data, D. O’Brien, pers. comm. 5 Calculated by combining the probabilities for detecting an infected buck or doe, with these probabilities calculated using the binomial relationship P[x>0] = 1- (1-p)n where p is disease prevalence and n is the number of deer inspected (from Bhattacharyya & Johnson 1977: pp. 145-151). 6 Calculated by finding the lowest integer n for which the following is true: (1-P)n < 0.5, where P is the probability of detecting at least one TB deer in a given year and n is the number of years for which surveys are run.

16
6. FACTORS INFLUENCING THE PREVALENCE OF BOVINE TB
AMONG DEER WITHIN THE CORE AREA OF INFECTION 6.1 Introduction As discussed previously, annual fall harvest surveys and additional non-harvest surveys have revealed that the bulk of bovine TB infection within Michigan’s wild deer population is concentrated within the high-prevalence ‘core area’ of 15-20 townships on the shared boundary of Alpena, Alcona, Oscoda and Montmorency counties. This section discusses historical and current factors that may help to explain the distribution of infection within what has come to be termed DMU452. 6.2 Historical determinants of the location of Michigan’s bovine TB outbreak Bovine TB in Michigan’s deer is presumed to have arisen by cross-infection from tuberculous cattle; sporadic examples of such cross-infection have been documented elsewhere in the US. In the 1950s, Michigan led the US in the number of cattle testing positive for bovine TB and it is not implausible that such cross-infections may have occurred repeatedly1 in the state in past decades. Mycobacterium bovis in present-day livestock and wildlife in Michigan is, however, confined to a single geographic locus of infection associated with the core area described in Section 5. Within this locus only one genetic strain of the bacteria has been identified. Since it is unlikely that this area was the only place in Michigan where cattle-deer cross-infection occurred, the current distribution of disease is suggestive of unique environmental and management factors that facilitated the persistence of bovine TB among deer in this part of the northeastern Lower Peninsula. Elsewhere in the state, where these predisposing factors were less evident, small pockets of infection among deer may well have been present in the past but ultimately have not persisted. This is consistent with observations elsewhere in the US, and overseas, that wild cervids are rarely maintenance hosts for bovine TB. There are habitat and management features associated with the core area that would seem to favor persistence and spread of wildlife disease. At the heart of the area lies a large hunt club, established in the mid-1880s. The club’s initial purpose was to protect deer from the unregulated harvest that had decimated deer populations in the region. The site for the club was chosen in part because its cut-over forest and swamp habitats held higher deer numbers than elsewhere in the area. There was also good access to the site from the south, either by boat via Alpena or by rail, and the soils were sandy and relatively unsuited to agriculture - which held down the purchase price of the land. The establishment of this first hunt club, and the abundant deer in its vicinity, encouraged development of numerous additional clubs in the area (particularly in the 1930s-1950s, by which time the area was coming to be referred to as ‘club country’). Protection from unregulated hunting, and early deer habitat enhancement, mean that deer numbers have been high in the area for decades. By the 1950s biological surveys were indicating that antler beam diameters were lower in this area than in most other parts of the
1 Repeated cross-infection from cattle to wildlife is apparent overseas. In New Zealand, for example, wildlife infected with bovine TB are present in several widely-separated regions, with genetic typing of the M. bovis from these populations indicating that several strains of tuberculosis are present. This situation is assumed to be a consequence of multiple cross-infection events occurring between cattle and wildlife during the middle decades of the past century, while the disease was still prevalent in New Zealand cattle.

17
state (H. Hill, pers. comm.), suggesting that the deer in the area were exceeding the natural carrying capacity of the habitat and were coming under physiological stress. In response to shortage of natural browse, supplemental feeding programs began to be implemented by some hunt clubs. Deer feeding was not unique to this area of Michigan, but began early in this part of the state (for example in the 1920s and 1930s at the large club mentioned previously) and may have been more intensive than elsewhere. Some clubs obtained large areas of land that were then hunted by a relatively small membership; this combination of active feeding and light hunting pressure would have ensured that deer density remained high. Further, some well-established clubs1 could afford permanent winter caretakers, who began implementing substantial winter feeding programs years before affordable snowmobiles made this a feasible proposition for smaller clubs. McCarty and Miller (1998) suggested that bovine TB in the core area could have arisen from a single cattle-deer cross-infection event during the 1950s - a time when cattle were being grazed within the boundaries of what is now DMU452. Despite this long (assumed) history of TB in the deer population, it is generally believed that TB prevalence in the infected area did not reach high levels until the early 1990s. The basis for this belief is that by 1995 hunters had themselves reported to authorities several ‘abnormal’ deer that proved to be tuberculous - hunter-reported TB cases of this type would have been expected earlier than the mid-1990s if bovine TB had been prevalent at late-1990s levels for many years (S. Schmitt, pers. comm). This increase in disease prevalence appears to have been triggered by escalation in the extent and scale of food supplementation in club country in the 1980s and 1990s. Very large amounts of animal feed began to be trucked into the forests, with the sale of deer feed and bait growing to become an economically significant part of the local economy. During this period additional clubs were becoming involved in both winter feeding and baiting of deer, as these practices came to be regarded as ‘traditional’ in the area. The members of clubs that did not feed and bait increasingly came to believe that their hunting was at risk because deer were moving to the feed and bait piles that were appearing on their neighbors’ land – such clubs felt forced into a tit-for-tat escalation of what they came to term ‘defensive baiting’. Increasing participation in bow hunting, which had not traditionally been favored in the area, brought with it additional pressure for baiting so that deer could be attracted close enough for the hunters to obtain clean shots. Changing lifestyles meant hunters felt they had less time available for hunting, and that baiting would increase their hunting success during the limited time they had in the area. Perhaps counter-intuitively, bovine TB emerged during a decade in which deer abundance was declining. Independent fecal-pellet-group and sex-age-kill indices of deer abundance (Figure 7) both suggest that deer densities in the core area peaked around 1989 - 1992 (probably at around 50 - 60 deer per square mile; T. Carlson, pers. comm.) and have subsequently declined by about a third. The precise extent and reasons for this decline are subject to debate. High deer numbers in the late 1980s were causing increasing concern about damage to agriculture on surrounding lands and so the number of antlerless deer permits being issued was increased. This is probably the main reason why the population has since declined, however weather patterns and maturation of deer habitat may also have contributed. The emergence of bovine TB prompted the introduction of a system of unlimited antlerless permits within DMU452 in the late 1990s, and this has further reduced deer numbers.
1 Several of which are located in townships that in the late 1990s had the highest levels of TB within the core area -
see Section 6.3.

18
0
5
10
15
20
25
30
1982
1984
1986
1988
1990
1992
1994
1996
1998
2000
Inde
x of
abu
ndan
ce
Figure 7. Annual changes in fecal pellet (blue) and sex-age-kill (white) indices of deer abundance in the core area (DNR unpublished data).
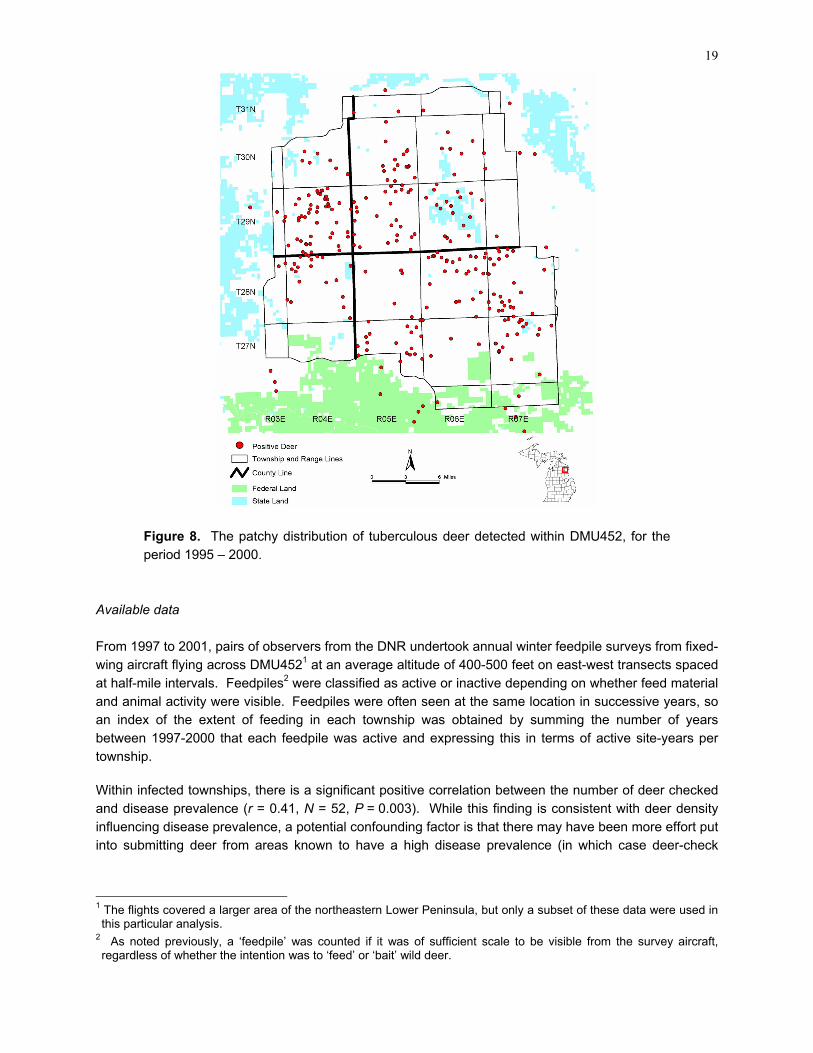
To summarize, the key implication of this brief review is that there is a historical basis for the hypothesis (presented in Section 5.1) that the core area is a region where the rate of increase of bovine TB infection is positive – so that the disease persists and spreads. In contrast, outside of the core these predisposing conditions are less pronounced (because of presumed differences in land ownership, deer food supplementation, and hunting pressure) so that the disease has a negative rate of increase and is thus not self-sustaining. If this model is correct, the infected deer found in the fringe counties can be regarded as a spillover from the core area, which is thus responsible for maintaining low-level infection across a large part of the northeastern Lower Peninsula. 6.3 Current factors influencing the distribution of bovine TB within the core area Tuberculous deer are not spread evenly within DMU452 (Figure 8). An obvious question is whether there are biological or management factors that help predict this variation. There has been considerable speculation that high deer densities might be one of these factors - and concern that food supplementation might be another (because of the spatial and temporal crowding of deer that occurs around feed and bait piles; Garner 2001). Therefore, an analysis was undertaken to determine whether deer density and supplemental feeding activity were indeed significant predictors of the variation in disease prevalence evident within the townships of DMU452.
19
Figure 8. The patchy distribution of tuberculous deer detected within DMU452, for the period 1995 – 2000.
Available data From 1997 to 2001, pairs of observers from the DNR undertook annual winter feedpile surveys from fixed-wing aircraft flying across DMU4521 at an average altitude of 400-500 feet on east-west transects spaced at half-mile intervals. Feedpiles2 were classified as active or inactive depending on whether feed material and animal activity were visible. Feedpiles were often seen at the same location in successive years, so an index of the extent of feeding in each township was obtained by summing the number of years between 1997-2000 that each feedpile was active and expressing this in terms of active site-years per township. Within infected townships, there is a significant positive correlation between the number of deer checked and disease prevalence (r = 0.41, N = 52, P = 0.003). While this finding is consistent with deer density influencing disease prevalence, a potential confounding factor is that there may have been more effort put into submitting deer from areas known to have a high disease prevalence (in which case deer-check
1 The flights covered a larger area of the northeastern Lower Peninsula, but only a subset of these data were used in this particular analysis.
2 As noted previously, a ‘feedpile’ was counted if it was of sufficient scale to be visible from the survey aircraft, regardless of whether the intention was to ‘feed’ or ‘bait’ wild deer.

20
tallies would not be a reliable indicator of deer abundance). Consequently, deer fecal-pellet-group surveys were used to obtain a deer density index independent of surveillance effort and hunting pressure. From 1996 to 2000, DNR staff undertook annual spring counts of deer fecal pellet groups in the 16 townships shown in Figure 9. Counts were undertaken in square mile ‘sections’ that were randomly allocated within three deer-habitat strata. The number of sections assigned to each stratum was dependent on its area and the variability in pellet density expected from past survey results (H. Hill, pers. comm.). Within each section, a two-person crew counted the number of pellet groups on a randomly-located course consisting of five 72.6’ x 12’ plots spaced 8 chain (528 feet) apart. The number of courses counted in a township ranged from 8 to 57.
Figure 9. Location of townships that provided data for the analysis of factors affecting bovine TB prevalence in DMU452. Green townships (N = 16) were surveyed annually for fecal pellets from 1996 to 2000, and aerially surveyed for feedpiles from 1997 to 2001. Yellow townships (N = 9) provided additional feedpile data but no fecal pellet data. Deer from all townships were examined for bovine TB infection at roadside check-stations during the 1995 – 2000 fall hunts. The white star indicates the centroid of the TB-infected area mapped in Figure 5.
The index generated from these data was based on the mean number of new pellet groups counted on each course in a given township during the five years of aerial survey. No attempt was made to correct for sampling stratification or repeat sampling, in part because the number of courses varied markedly between townships. To obtain an index that was readily interpreted, pellet group counts were converted to deer density estimates using the following equation (H. Hill, pers. comm.): Deer per sq. mile = (Mean no. of groups per course) x 50 x 640 (Days from leaf fall) x 13.37 x 5 With the exception of the leaf-fall parameter (which ranged from 166 days in 2000 to 203 days in 1996; H. Hill, pers. comm.) this equation simply multiplies the original index by a constant that allows for

21
estimated daily defecation rate (13.37 pellet groups) and the relative areas of a course and a section. Multiplying the index by a constant in this way did not affect its statistical significance in subsequent analyses. The value of deer density (from the pellet data) and feeding activity (from the aerial surveys) as predictors of townships with a high prevalence of bovine TB infection in deer was examined using univariate and multiple linear regression (procedure GLM in Systat 9; SPSS 1999). Statistical significance was assessed using one-tailed tests, as there was an a priori expectation that both slope coefficients in the regression would have positive values (i.e., that above-average deer densities and feed site indices would both be associated with high bovine TB prevalence). Relationship between deer density, feed site indices, and bovine TB prevalence A preliminary check of the data revealed a significant positive correlation between the pellet group indices for each township and the number of deer brought into check stations from that township (r = 0.54, N = 16, P = 0.03). This provides reassurance that carcass tallies and pellet group counts both provide meaningful information on variation in deer abundance within DMU452. Deer density and the extent of supplemental feeding were both significantly related to disease prevalence, with the effect of supplemental feeding being somewhat more pronounced (Fig. 10).
T
< 0.001 P= 0.38 2 R = 0.006P 2 = 0.39 R
B p
reva
lenc
e ( %
)
8
7
6
5
4
3
2
1
0
8 a)
7
6
5
4
3
2
1
0
b) 1.5 2 2.5 0 0.5 10 20 40 60 80
Active feedsites per township Deer per sq. mile Figure 10. Relationship between deer TB prevalence (1995-2000) and a) deer density and b) the number of active feedpiles in the townships of DMU452. Trend lines were fitted using univariate linear regression, excluding one outlier (Township 29N04E, shown as ◊). Significance differs in the two figures because deer pellet count data were not available for some townships, so that the number of datapoints available for the two analyses differed (N = 15 and 24, respectively).
Inspection of Figure 10 indicates that the data from township 29N04E were a poor fit to the relationship evident in the data from the other townships. Both the pellet group index and the aerial feed site counts were below-average for this township, which was surprising given that the township ranked second-

22
highest in DMU452 in terms of the number of deer carcasses submitted to check stations. Deer densities in that township are thought to have been well above average in the late 1990s (E. Carlson, pers. comm.). The reasons for the atypical data from this township, which has the highest TB prevalence of any in the core area, are unclear and require further investigation. The deer density and feedsite density estimates were not significantly correlated (r = 0.11, N = 15, P = 0.69), so it was valid to consider both factors simultaneously in a multivariate regression. Both factors remained statistically significant and together accounted for 55% of the variation in TB prevalence evident within DMU452 (Fig. 11, Table 3). No significant Density*Feeding interaction was found (t = 0.17, N = 15, P = 0.87).
Figure 11. The relationship between deer abundance, extent of supplemental feeding, and deer TB prevalence in 15 townships within DMU452, 1995-2000.
Table 3. Multiple linear regression analysis for the effect of deer density (deer per square mile estimated from pellet group counts) and food supplementation (the number of active feed sites seen during aerial survey) on mean prevalence of bovine TB in deer in 15 townships within DMU452. P-values for the coefficients are for 1-tailed tests, as there was an a priori expectation that both relationships would have positive slopes.
Effect Coefficient Std. Error Student’s t P
Constant -1.272 0.879 -1.45 0.174
Feed site index 1.246 0.592 2.10 0.028
Deer density 0.041 0.014 2.97 0.006

23
It is apparent that tuberculous deer are far more prevalent on hunt club and private land (where access for hunting is restricted and food supplementation has been common) than on nearby State and Federal lands where there has been less feeding and baiting and where hunting pressure is greater. This effect has not been analyzed statistically, because it was difficult to determine whether some areas should be classified as hunt club or private land. Nevertheless, the effect is pronounced, particularly along a part of the western boundary of DMU452, were >70 tuberculous deer have been identified from the private and hunt club land to the east of Highway M-33, compared with only 2 from the western side which is predominantly State land (Figure 12). The numbers of deer that have been inspected is high (>400 in all townships) and visual inspection of the area (e.g. Fig. 13) does not reveal any striking difference in vegetation type on the two sides of the highway that would explain such a pronounced difference in disease prevalence.
Figure 12. Distribution of known tuberculous deer (red dots) on State Land (blue shading) and private/hunt club land (white and yellow shading, respectively) in the vicinity of Highway M-33 (red line) on the western edge of DMU452. For each of these townships, at least 400 deer carcasses have been checked for bovine TB.
Figure 13. An aerial view looking south down Highway M-33 on Michigan’s northeastern Lower Peninsula in the fall of 2001. From this angle, the private and hunt club land to the east of the highway appears on the left-hand side of the image.

24
7. THE LIKELY OUTCOME OF CURRENT AND FUTURE
MANAGEMENT INTERVENTIONS 7.1 Introduction This final section considers the likely outcomes of current management actions with respect to disease levels in wild deer, cattle herd infection rates, and the overall objectives of Michigan’s bovine tuberculosis eradication program. Prediction of future developments requires that assumptions be made about future trends in current data. Whether or not these assumptions are formalized within a mathematical model, the outcomes of such extrapolations are always speculative and need to be interpreted with caution. 7.2 The McCarty and Miller model Predicting future trends in wild deer tuberculosis in Michigan was first attempted by McCarty and Miller (1998), who suggested that bovine TB prevalence would increase progressively in the infected area in coming decades, despite any foreseeable management interventions aimed at reducing deer abundance or disease transmission. By extrapolating from an observed TB prevalence of 3.1 percent in 1995 (a figure slightly lower than that calculated in CEAH 1996) these authors predicted prevalence in future years under various management scenarios (Table 4). Table 4. Predicted prevalence of bovine TB in deer in the core 200 square mile infected area for 1999-2000, from McCarty and Miller’s (1998) extrapolations of the 3.1 percent bovine TB prevalence measured by DNR surveys in 1995.
Hypothetical management regime since 1995 Predicted prevalence in 1999-2000 (%)
No change from historical practices 5.1
Adult deer survival reduced by 10% 4.8
Lateral transmission between deer reduced by 10% 4.5
Survival and transmission both reduced by 10% 4.1 In 1999-2000, the actual number of bovine TB cases found among the 1501 deer surveyed from the relevant 200 square mile area was only 45, giving an observed prevalence of 3.0 percent. This is very significantly lower than the ‘no change’ prediction in Table 4 (χ2 = 14.1, P < 0.0001) and significantly lower than the other three modeled scenarios (all P < 0.05). Note that this discrepancy would have been even greater had McCarty and Miller based their extrapolations on the CEAH (1996) estimate of 3.5 percent prevalence in 1995. Rather than the predicted increase, the analysis reported in Section 5.1 suggests there has been no measurable trend in prevalence in the township within 6 miles of the disease centroid over the past 6 years (see Figure 6). There are two possible explanations for this failure to meet the model’s predictions. First, it may be that bovine TB prevalence was not increasing in the area in 1995, but rather had been constant at a level of around 3 percent for a number of years. As discussed in Section 6.2, the fact that hunters had not been reporting infected deer prior to 1995 tends to count against this explanation.

25
Alternatively, it may be that management actions taken in the late 1990s (i.e., reduction in deer density and restrictions on food supplementation) were effective in halting further increase in TB prevalence. Two lines of argument support this latter suggestion. First, an examination of age-specific prevalence data reveals an apparent decline in TB prevalence among yearlings in 1999 and 2000 (S. Schmitt, pers. comm.), which is the age class within which the benefits of successful management should first become apparent. Second, the structure of the McCarty and Miller model is somewhat unusual in that the predicted number of newly-infected individuals is largely independent of the abundance of susceptible deer, except at very low population densities. A more usual ‘mass-action’ model of TB transmission, of the type used to successfully model bovine TB in New Zealand possums (Barlow 1991, Caley et al. 1999), assumes that the number of new infections is directly proportional to the abundance of susceptible deer (Fig. 14). Thus McCarty and Miller’s model is likely to be conservative with regard to the potential benefit of management actions that reduce deer numbers.
0
5
10
15
20
25
30
35
0 100 200 300 400 500 600 700
Total number of deer in area
New
ly-in
fect
ed d
eer e
ach
year
McCarty & MillerMass-action
Figure 14. Relationship between host abundance and the number of individuals that become newly infected with bovine TB in a hypothetical deer population, as predicted by McCarty and Miller’s (1998) model and by a mass-action model with I = 10 infectious deer and β = 2 infection contacts per year.

26
7.3 The core-area regression model An alternative approach to predicting the likely outcome of current deer management actions is to use the statistical relationship evident between deer density, supplemental feeding activity and disease prevalence (Table 3) to construct a mathematical model of how changes in deer density and/or feeding might affect future prevalence in DMU452. To model the current status of the area, it was assumed that recent changes in deer hunting permit regulations have led to a one-third reduction in deer numbers since 1995 (from Figure 7). The aerial survey tally of active feed and bait sites seen within DMU 452 averaged 132 for 1997-1998 compared with 34.7 for 1999-2001 (after feeding restrictions were fully introduced; E. Carlson unpublished data), so the extent of feeding activity was assumed to have declined by three-quarters since the mid-1990s. The predicted effects of these changes are shown in Table 5, which also considers what further action would be needed to address the goal of complete eradication of bovine TB from the deer population. Table 5. Predicted changes in prevalence of bovine TB (±SE) in wild deer in DMU452 under four alternative management scenarios, calculated using the linear regression model coefficients shown in Table 3. Because the dynamics of tuberculosis in deer are relatively slow, overseas experience suggests that at least a decade may be required for TB prevalence to decline to the predicted level.
Management scenario Deer abundance (deer / sq.mile)
Extent of food supplementation1
(active feed sites / township)
Resulting TB prevalence 2
(%)
1. Status during disease outbreak (mid-1990s)
50 3 1.5 4 2.6 (± 0.4)
2. Current status (early 2000s)
Deer density reduced by one- third, food supplementation reduced by three-quarters
32 3
0.4 4
0.5 (± 0.5)
3. TB eradication option 1
Maintain current deer density, but enforce a complete ban on food supplementation
32
0.0
0.0 (± 0.7)
4. TB eradication option 2
Tolerate the current level of food supplementation, but halve current deer density
18
0.4
0.0 (± 0.6)
1 Food supplementation here refers to amounts of feed or bait large enough to be visible during a standard DNR aerial survey, regardless of whether the hunters’ intention was to ‘feed’ or ‘bait’ the deer. Small amounts of bait, not visible from the air, may also contribute to increased risk of disease transmission but as yet there are no data available on this aspect of the problem.
2 Predicted from the linear regression model shown in Table 3. 3 Estimated from the DNR’s sex-age-kill and pellet group survey data (see Figure 7). 4 Estimated from unpublished DNR aerial survey data (see text).

27
The analysis summarized in Table 5 predicts that current management actions may be sufficient, over time, to reduce the prevalence of bovine TB in the core area’s wild deer by c.80% to around 0.5 percent prevalence. Current management appears, however, insufficient to eradicate tuberculosis from the wild deer population. Eradication of bovine TB from wildlife would be more likely if there was a further 40-50 percent reduction in deer abundance, or an enforced ban on provision of supplemental foodstuffs to deer. 7.4 Implications for cattle reactor rates As discussed in Section 2, a major objective of wildlife TB management in Michigan is to support the State’s application to the USDA for ‘split state’ status and, in the longer term, to support the USDA’s goal of achieving ‘accredited free’ status for the nation as a whole. Since current deer management may over time have a positive result in terms of reduced prevalence of infection (see Table 5), there is an obvious need to consider the extent to which this might assist the State in meeting its cattle-related objectives. To do this, an estimate of the current annual incidence of herd infection due to deer-cattle interaction is required. Table 1 presents raw data on recent herd infections in the 5-county area, but it is likely that some of these were not directly attributable to deer but rather to movement of infected cattle between farms, or cattle-cattle transmission. Further, since the prevalence of bovine TB in wild deer has not varied significantly in the vicinity of the disease centroid since 1995 (Fig. 6) the increasing rate of herd infection probably reflects intensified herd testing, rather than increased transmission from deer. Therefore, the deer-related cattle herd infection rate was estimated by invoking the following three assumptions (which have been used successfully when modeling possum-cattle disease transmission in New Zealand; Hickling & Efford 1996, Caley et al. 1999):
• that the detection of new cattle herd infections lags changes in deer prevalence by 1 year (so that 1996-2001 herd-test data correspond to 1995-2000 deer prevalence data);
• that the underlying herd infection rate has been constant over that period; • that infection of several ‘associated’ herds represents a single deer-cattle transmission event
followed by cattle movement or cattle-cattle transmission. These assumptions lead to an estimated mean annual herd infection rate of 2.17 (i.e., 0 herds in 1996 and 1997, 1 in 1998, 3 in 1999, 4 in 2000 and 5 in 2001). Since deer TB prevalence is low, there should be a more-or-less linear relationship between the abundance of tuberculous deer in an area and the consequent herd infection rate (see Hickling and Efford 1996 for further discussion of this point). The effects of predicted changes in deer numbers and disease prevalence on herd infections can thus be explored using binomial probability theory (Bhattacharyya & Johnson 1977: pp. 145-151). There are several target infection rates that are relevant for this analysis (summarized earlier in Figure 3). For example, APHIS (1999) indicates that for a State, or Zone within a State, to move in status from ‘modified accredited’ to ‘modified accredited advanced’ there must be less than three infected herds disclosed within a consecutive 24 month period. To move from there on to ‘accredited free’ status requires the State or Zone to disclose no infected herds for a period of between 2 and 5 years, with the precise duration dependent on the past status of the area and what management steps (e.g., herd depopulation) are taken. APHIS (1999) further indicates that for a State or Zone to retain its ‘accredited free’ status, it must disclose no more than one infected herd in a consecutive 48-month period.

28
Deer TB prevalence is so low outside of the 5-county area (< 0.2%, see Figure 5) that deer-related cattle herd infections are highly unlikely in that region. Within the 5-county area, infected herds have a mean herd size of 102 (USDA unpublished data). There are c.21400 head of cattle in that region (BTEPC 2001), which implies there are c.210 herds ‘at risk’ from tuberculous deer. Given the observed herd infection rate of 2.17, this implies that the annual probability of an ‘at risk’ herd becoming infected is: p = (2.17 ÷ 210) = 0.0103. At this rate, there would be only a 20 percent chance that the proposed Modified Accredited Zone would disclose less than three herds in a 24-month period and thus be eligible to advance to Modified Accredited Advanced status. However, Table 5 suggests that current management in the core area may eventually reduce the abundance of tuberculous deer by about 80% (i.e., from 2.6 percent to 0.5 percent). If the herd infection rate changes proportionally, p would be predicted to fall to (0.0103 x 0.5 ÷ 2.6) = 0.002. At this much lower rate of herd infection, the proposed Modified Accredited Zone would have an excellent chance of progressing to Modified Accredited Advanced status (Figure 15). Achieving ‘accredited free’ status would remain a challenge, however, as this requires that no herds become infected for 2 - 5 years. And even if accredited free status were achieved, it may prove difficult to maintain given a predicted 50 percent chance that two or more herds will become infected over a 48 month period.
FignorasstranTB
1 The releva
Probability Probability Probability Probability
Modified accredited
ure theaumpsmi
stat
nt bin
P th that that that
Modified accredited advanced
15. Predicted chstern Lower Penition (see text) thassion by 80 perceus levels were sho
omial equations (de
at a given herd will b0 of 210 herds will be≥ 2 of 210 herds will < 3 of 210 herds will
Accredited free
r
ances1 of the proponsula progressing tt management of tnt in the coming dewn earlier, in Figur
rived from Bhattacha
e infected within x year infected within x yearsbe infected within x yeabe infected within x yea
95%
sed Modifieo an improhe wild deecade. The re 3.
ryya & Johns
s = 1 - (1 - = (1 - P)2
rs = 1 – ((1rs = (1 - P)2
12%*
50%
10 or fewer herds infected in the past yea
Up to 3 herds infected in each of the last 2 years
0 or 1 herd infected in the past 12 months
dver eq
on
p10 - 10
* or 43% if all infected herds are depopulated, as the requirement is then for 0 herds over 24 months, rather than 60 months
Accredited Zone in Michigan’s d bovine TB status, under the herd will reduce deer-cattle TB uirements for moving between
1977: pp. 145-151) are:
)x
P)210 + 210 x (1 - P)209 x P) + 210 x (1 - P)209 x P + 21945 x (1 - P)208 x P2

29
7.5 Prospects for eradication of bovine TB in Michigan Current management of the bovine TB problem is subject to vigorous debate. Although considered prudent by researchers, the current restrictions on feeding and baiting of deer in the ‘infected’ counties (see Appendix) are unpopular among some within the hunting community. In mid-September 2001, the Natural Resources Commission re-approved limited baiting within DMU452 on an experimental basis. This action was undertaken at the request of hunters, who argued that the use of bait as a hunting tool would assist them to increase their harvest and thus combat bovine TB. The experimental regulations introduced to enable an evaluation of the effects of this baiting on the harvest of deer within DMU452 rekindled controversy among hunters and the agriculture community. The analyses presented in Sections 7.3 and 7.4 suggest that Michigan is at present unlikely to succeed in eradicating bovine tuberculosis from its wild deer population − depending on the precise criterion that the State will need to meet, the likelihood of restoring bovine TB accredited free status for the State’s livestock could be as low as 12 percent. Furthermore, the slow dynamics of the disease means that any success could be at least a decade away. Progress towards bovine TB eradication will require further accommodations by both the hunting and agricultural communities − and patience. One example of an affordable program that would accelerate progress towards bovine TB eradication would be to implement, for a minimum of 10 years, the following actions within the 5-county area:
• maintain deer numbers at or below their current level, with a strict ban on food supplementation; • reduce the value of the current indemnity farmers have for infection in their herd, so as to
encourage greater self-help efforts (such as improved fencing and feed storage practices) that reduce contact between livestock and wildlife;
• provide state and/or federal subsidies to assist in these on-farm activities, in recognition of the public good that would accrue from restoring the State’s TB accredited-free status;
• encourage a shift to an alternative land use on those farms in the 5-county area that are considered most at-risk of intractable infection from tuberculous wildlife (in other words, consider the possibility that there are parts of the northeastern Lower Peninsula where cattle farming is simply unwise in the foreseeable future).
Tuberculous wildlife do not appear to be increasing in either prevalence or geographic extent in Michigan at the present time. The State’s current bovine TB strategy is likely responsible for that encouraging result. Nevertheless, until there is general acceptance within the main stakeholder groups of the need for a more aggressive approach to this disease problem, the stated goals of Michigan’s bovine TB eradication strategy seem unlikely to be achieved.

30
8. ACKNOWLEDGEMENTS This analysis was undertaken while the author was on sabbatical leave from the Department of Soil, Plant and Ecological Sciences at Lincoln University, New Zealand. The Michigan Department of Natural Resources, and in particular the staff at the Michigan DNR’s Rose Lake Wildlife Disease Laboratory, provided extensive support throughout the project. Particular thanks are due to Dr Steve Schmitt for encouragement to undertake this project, for arranging meetings and site visits, and for many productive discussions regarding the analysis. Dr Dan O’Brien and Jean Fierke provided access to the main deer TB database and helped with its interpretation. Stephanie Hogle drafted the maps and assisted with computing and GIS issues during the study. Melinda Raths provided photographic material for the report and associated presentations and Tim Lyon helped prepare the final report. Elaine and Tom Carlson hosted a valuable site visit to DMU452 and provided much additional information, including access to aerial survey data. Dr Harry Hill and John Urbain provided the deer density and pellet group data, together with advice on its interpretation. Rebecca Humphries and Dale Rabe approved and helped support the project. Outside of the DNR, Bridget Patrick, Scott Winterstein and Colleen Bruning-Fann provided information and advice that was much appreciated. The members of the Leer Ranch hunt club hosted us for an evening in DMU452 and contributed a valuable local perspective on the TB problem. MSU student Sarah Cook extracted relevant files for me from the DNR’s pellet survey database. Thank you all. Despite the help of all those mentioned above, the Michigan DNR emphasized that it saw value in receiving an independent report on Michigan’s current wildlife TB situation. Consequently, any errors of fact, calculation or interpretation in this document are entirely the author’s responsibility.
9. REFERENCES APHIS 1999. Bovine tuberculosis eradication: uniform methods and rules. Animal and Plant Health
Inspection Service, United States Department of Agriculture, Report 91-45-001. 34pp. APHIS 2000. The comprehensive strategic plan for the eradication of bovine tuberculosis. Unpublished
report, Animal and Plant Health Inspection Service, United States Department of Agriculture. Barlow, N.D. 1991. Control of endemic bovine Tb in New Zealand possum populations: results from a
simple model. Journal of Applied Ecology 28: 777 – 793. Bhattacharyya, G. K.; Johnson, R.A. 1977. Statistical concepts and methods. John Wiley & Sons, New
York, NY. Bruning-Fann, C.S.; Schmitt, S.M.; Fitzgerald, S.D.; Fierke, J.S.; Friedrich, P.D.; Kaneene, J.B.; Clarke,
K.A.; Butler, K.L.; Payeur, J.B.; Whipple, D.L.; Cooley, T.M.; Miller, J.M.; Muzo, D.P. 2001. Bovine tuberculosis in free-ranging carnivores from Michigan. Journal of Wildlife Diseases 37: 58-64.

31
BTEPC 2001. Bovine tuberculosis in Michigan: Draft strategic plan. Unpublished report, Bovine Tuberculosis Eradication Project Committee, Lansing MI. 19pp.
Caley, P.; Hickling, G.J.; Cowan, P.E.; Pfeiffer, D.U. 1999. Effects of sustained control of brushtail
possums on levels of Mycobacterium bovis infection in cattle and brushtail possum populations from Hohotaka, New Zealand. New Zealand Veterinary Journal 47: 133-142.
CEAH 1996. Assessing the risks associated with M. bovis in Michigan free-ranging white-tail deer.
Unpublished CADIA Technical Report 01-96. Centers for Epidemiology and Animal Health, Fort Collins, CO.
CEAH 1999. Risks associated with M. bovis in Michigan free-ranging white-tailed deer: an update to the
1996 report. Centers for Epidemiology and Animal Health, Fort Collins, CO. Coleman, J; Livingstone, P. 2000. Fewer possums: less bovine Tb. Pp. 220-231 in Montegue, T.L. (Ed.)
The brushtail possum. Manaaki Whenua Press, Lincoln. DNR 2001. Michigan hunting and trapping guide. Michigan Department of Natural Resources, Lansing,
MI. 48pp. Elliot, P., Wakefield, J.C., Best, N.G. and Briggs, D.J. 2001. Spatial epidemiology: methods and
applications. Oxford University Press, Oxford. Frye, G.H. 1995. Bovine tuberculosis eradication: the program in the United States. Pp. 119-129 in
Thoen, C.O and Steele, J.H. (Eds) Mycobacterium bovis infection in animals and humans. Iowa State University Press, Ames, I0.
Garner, M.S.; 2001. Movement patterns and behavior at winter feeding and fall baiting stations in a
population of white-tailed deer infected with bovine tuberculosis in the northeastern Lower Peninsula of Michigan. Ph.D. dissertation, Michigan State University, East Lansing MI. 270pp.
Golden Software, Inc. 1999. Surfer 7 User’s guide. Golden Software, Inc. Golden CO. 619pp. Hickling, G.J., Efford, M.G.E. 1996. Assessing the risk of bovine tuberculosis infection in New Zealand
cattle herds in Tb Vector Risk Areas (VRAs). In Fletcher, D.J., Manley, B.F.J. (eds) Statistics in ecology and environmental monitoring. Pp. 79-90. University of Otago Press, Dunedin.
McCarty, C.W.; Miller, M.W. 1998. A versatile model of disease transmission applied to forecasting
bovine tuberculosis dynamics in white-tailed deer populations. Journal of Wildlife Diseases 34: 722-730.
MDA (1968) Twenty-second biennial report. Michigan Department of Agriculture, Lansing, MI. Morris, R.S; Pfeiffer D.U. 1995. Directions and issues in bovine tuberculosis epidemiology and control in
New Zealand. New Zealand Veterinary Journal 43: 256-265.

32
O’Brien, D.J.; Raths, M.K.; Schmitt, S.M. 2000. Occupational safety issues related to bovine tuberculosis surveillance in wildlife. Unpublished Michigan Department of Natural Resources Report, Lansing, MI.13pp.
O’Brien, D.J.; Fitzgerald, S.D.; Lyon, T.J.; Butler, K.L.; Fierke, J.S.; Clarke, K.R.; Schmitt, S.M.; Cooley,
T.M.; Berry, D.E. 2001. Tuberculosis lesions in free-ranging white-tailed deer in Michigan. Journal of wildlife diseases 37: 608-613.
O’Brien, D.J.; Schmitt, S.M.; Fierke, J.S.; Hogle, S.A.; Winterstein, S.R.; Cooley, T.M.; Moritz, W.E.;
Butler, K.L.; Fitzgerald, S.D.; Berry, D.E.; Kaneene, J.B. (2001). Some epidemiological aspects of Mycobacterium bovis in free-ranging white-tailed deer, Michigan, 1995-2000. Preventative Veterinary Medicine (accepted).
Payton, R.B. 1997. Recommendations for elimination of bovine tuberculosis in free-ranging white-tailed
deer in Michigan. Unpublished report, Department of Fisheries and Wildlife, Michigan State University, East Lansing, MI. 58pp.
Schmitt, S.M.; Fitzgerald, S.D.; Cooley, T.M.; Bruning-Fann, C.S.; Sullivan, L.; Berry, D.; Carlson, T.;
Minnis, R.B.; Payeur, J.B.; Sikarskie, J. 1997. Bovine tuberculosis in free-ranging white-tailed deer from Michigan. Journal of Wildlife Diseases 33: 749-758.
SPSS, Inc. 1999. Systat 9 for Windows. SPSS Inc., Chicago, IL.

33
10. APPENDIX – Timeline of recent changes in legislation relating to deer hunting, feeding and baiting in Michigan’s northeastern Lower Peninsula.
Year Legislation / Amendments Implications for hunting Implications for feeding and baiting
1996 WCO Am.1 12-1998: DMU 452 created. 9/1/96
More liberal hunting permits in Deer Management Unit (DMU) 452
Letter to hunt clubs in DMU 452 seeking voluntarily cessation of supplemental feeding of deer.
1997 More liberal hunting permits in DMU 452
Disease Control Permits issued
Letter to hunt clubs in DMU 452 seeking voluntarily cessation of supplemental feeding of deer.
1998 Executive Directive from Gov. Engler: calls for strategy to eliminate bovine TB in Michigan. 1/29/98
Moratorium on new captive cervid herds. 2/11/98
ERA Order1998-01: feeding banned by Michigan Department of Agriculture (MDA) in an Enforced Restriction Area (ERA) bordered by I-75, M-55 and the shoreline of Lake Huron; set measures to limit access of wild deer to livestock feed. 3/12/98
WCO Am 2: deer baiting parameters set. 3/12/98
WCO Am. 6: DMU 452 expanded to encompass 5-county area. 5/15/98
Wildlife Rehabilitation Am.: no rehabilitation of deer from DMU 452.
More liberal hunting permits in DMU 452: antlerless licenses available over-the-counter (1 per day)
Disease Control Permits issued
Early and late antlerless seasons in DMU 452
In the ERA, feeding banned by the Director of Agriculture, and baiting limited to 5 gallons by the Natural Resources Commission (NRC)
1999 House Bills 4427, 4428, 4429: regulation of captive cervids becomes an MDA responsibility
House Bill 4499: NRC given authority to set restrictions on feeding of deer and elk. 5/26/99
WCO Am. 11: baiting of deer in ERA prohibited as a condition for granting TB zoning for the agriculture industry
WCO Am. 14: parameters set for feeding of deer and elk. 10/1/99
Wildlife Division Issue Review Paper 5: Baiting 2/26/99
Wildlife Division Briefing Paper: Deer and Elk Feeding Issues
More liberal hunting permits in DMU 452: unlimited antlerless licenses available over-the-counter
Disease Control Permits issued
Early and late antlerless seasons in DMU 452
In the ERA, NRC prohibits feeding/baiting of deer/elk
Restricted baiting allowed in other areas of state at 5 gallons
1 Wildlife Conservation Order Amendment
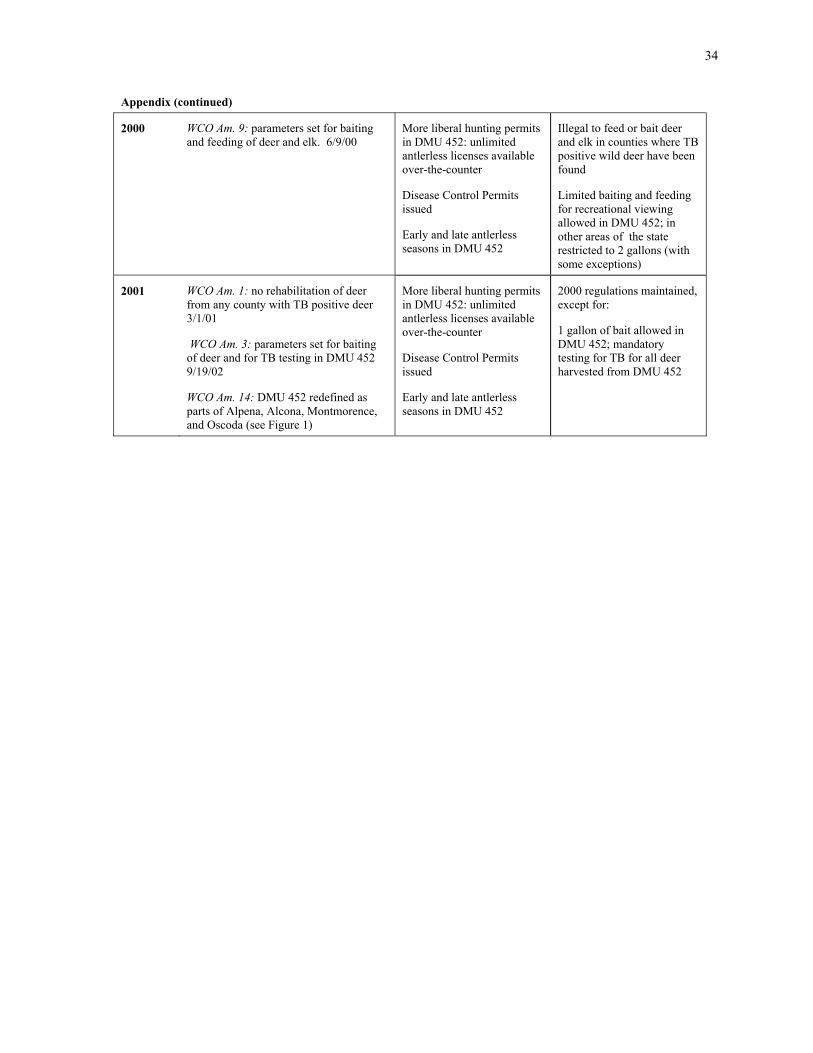
34
Appendix (continued)
2000 WCO Am. 9: parameters set for baiting and feeding of deer and elk. 6/9/00
More liberal hunting permits in DMU 452: unlimited antlerless licenses available over-the-counter
Disease Control Permits issued
Early and late antlerless seasons in DMU 452
Illegal to feed or bait deer and elk in counties where TB positive wild deer have been found
Limited baiting and feeding for recreational viewing allowed in DMU 452; in other areas of the state restricted to 2 gallons (with some exceptions)
2001 WCO Am. 1: no rehabilitation of deer from any county with TB positive deer 3/1/01
WCO Am. 3: parameters set for baiting of deer and for TB testing in DMU 452 9/19/02
WCO Am. 14: DMU 452 redefined as parts of Alpena, Alcona, Montmorence, and Oscoda (see Figure 1)
More liberal hunting permits in DMU 452: unlimited antlerless licenses available over-the-counter
Disease Control Permits issued
Early and late antlerless seasons in DMU 452
2000 regulations maintained, except for:
1 gallon of bait allowed in DMU 452; mandatory testing for TB for all deer harvested from DMU 452