Dynamics and Collective State of Ordered Magnetic ...
11
University of New Orleans University of New Orleans ScholarWorks@UNO ScholarWorks@UNO Chemistry Faculty Publications Department of Chemistry 2012 Dynamics and Collective State of Ordered Magnetic Dynamics and Collective State of Ordered Magnetic Nanoparticles in Mesoporous Systems Nanoparticles in Mesoporous Systems Jose M. Vargas University if New Orleans, [email protected] Abhishek Srivastava University of New Orleans, [email protected] Ezra Garza University of New Orleans, [email protected] Amin Yourdkhani University of New Orleans, [email protected] Gabriel Caruntu University of New Orleans, [email protected] See next page for additional authors Follow this and additional works at: https://scholarworks.uno.edu/chem_facpubs Part of the Chemistry Commons Recommended Citation Recommended Citation J. Appl. Phys.112, 094309 (2012); This Article is brought to you for free and open access by the Department of Chemistry at ScholarWorks@UNO. It has been accepted for inclusion in Chemistry Faculty Publications by an authorized administrator of ScholarWorks@UNO. For more information, please contact [email protected].
Transcript of Dynamics and Collective State of Ordered Magnetic ...

University of New Orleans University of New Orleans
ScholarWorks@UNO ScholarWorks@UNO
Chemistry Faculty Publications Department of Chemistry
2012
Dynamics and Collective State of Ordered Magnetic Dynamics and Collective State of Ordered Magnetic
Nanoparticles in Mesoporous Systems Nanoparticles in Mesoporous Systems
Jose M. Vargas University if New Orleans, [email protected]
Abhishek Srivastava University of New Orleans, [email protected]
Ezra Garza University of New Orleans, [email protected]
Amin Yourdkhani University of New Orleans, [email protected]
Gabriel Caruntu University of New Orleans, [email protected]
See next page for additional authors
Follow this and additional works at: https://scholarworks.uno.edu/chem_facpubs
Part of the Chemistry Commons
Recommended Citation Recommended Citation J. Appl. Phys.112, 094309 (2012);
This Article is brought to you for free and open access by the Department of Chemistry at ScholarWorks@UNO. It has been accepted for inclusion in Chemistry Faculty Publications by an authorized administrator of ScholarWorks@UNO. For more information, please contact [email protected].

Authors Authors Jose M. Vargas, Abhishek Srivastava, Ezra Garza, Amin Yourdkhani, Gabriel Caruntu, and Leonard Spinu
This article is available at ScholarWorks@UNO: https://scholarworks.uno.edu/chem_facpubs/39

Dynamics and collective state of ordered magnetic nanoparticles inmesoporous systemsJosé M. Vargas, Abhishek Srivastava, Ezra Garza, Amin Yourdkhani, Gabriel Caruntu et al. Citation: J. Appl. Phys. 112, 094309 (2012); doi: 10.1063/1.4764018 View online: http://dx.doi.org/10.1063/1.4764018 View Table of Contents: http://jap.aip.org/resource/1/JAPIAU/v112/i9 Published by the American Institute of Physics. Related ArticlesQuantum confinement of Bi2S3 in glass with magnetic behavior AIP Advances 3, 022123 (2013) Structure, magnetic, and electronic properties of hydrogenated two-dimensional diamond films Appl. Phys. Lett. 102, 073114 (2013) Thermally activated magnetization switching in a nanostructured synthetic ferrimagnet J. Appl. Phys. 113, 063914 (2013) Probing nanowire edge roughness using an extended magnetic domain wall Appl. Phys. Lett. 102, 062409 (2013) Reversal process of a magnetic vortex core under the combined action of a perpendicular field and spin transfertorque Appl. Phys. Lett. 102, 062401 (2013) Additional information on J. Appl. Phys.Journal Homepage: http://jap.aip.org/ Journal Information: http://jap.aip.org/about/about_the_journal Top downloads: http://jap.aip.org/features/most_downloaded Information for Authors: http://jap.aip.org/authors
Downloaded 05 Mar 2013 to 137.30.164.204. Redistribution subject to AIP license or copyright; see http://jap.aip.org/about/rights_and_permissions

Dynamics and collective state of ordered magnetic nanoparticlesin mesoporous systems
Jos�e M. Vargas,1 Abhishek Srivastava,1,2 Ezra Garza,1,2 Amin Yourdkhani,1,3
Gabriel Caruntu,1,3 and Leonard Spinu1,2,a)
1Advanced Materials Research Institute, University of New Orleans, New Orleans, Louisiana 70148, USA2Department of Physics, University of New Orleans, New Orleans, Louisiana 70148, USA3Department of Chemistry, University of New Orleans, New Orleans, Louisiana 70148, USA
(Received 20 June 2012; accepted 9 October 2012; published online 5 November 2012)
In this paper we present a study of superparamagnetic and superspin glass states of magnetic
nanoparticles confined in mesoporous templates. Characterization utilizes dynamic magnetization
techniques, ac susceptibility, and ferromagnetic resonance, in addition to dc magnetization curves.
In order to differentiate between the intrinsic and collective properties, we considered three
magnetic nanoparticles systems with comparable size, shape, and crystallinity but with different
intrinsic magnetocrystalline anisotropy. Further, confinement effects were studied by considering
three different geometries of nanoparticles. The effect of the geometrical confinement and intrinsic
anisotropy of the nanoparticles are discussed based on known theoretical predictions. VC 2012American Institute of Physics. [http://dx.doi.org/10.1063/1.4764018]
I. INTRODUCTION
Collective phenomena in nanostructured magnetic mate-
rials have attracted considerable attention in the last few
years in both fundamental research and technological appli-
cations.1–4 Mainly, due to the requirements of miniaturiza-
tion needed in magnetic recording media, antennas, and
transducers, new magnetic features emerge and these phe-
nomena will dominate the magnetic properties of the whole
system, such as isotropic or anisotropic interactions, strong
interparticle coupling, and geometrical or structural shape
anisotropy induced by the host or substrates.5,6 Therefore, if
the thermal effects are significant, the magnetic nanopar-
ticles (NPs) that build up the whole system cannot be mod-
elled as a collection of isolated single magnetic domains,
following the ideal Stoner-Wohlfarth or N�eel-Brown
model.7,8 In the presence of magnetic interactions, the as-
sembly of magnetic nanoparticles is a complicated many
body problem governed by an energy landscape which is far
more complex than the double-well potential corresponding
to isolated magnetic monodomain particles.9 Thus, the mac-
roscopic properties cannot be predicted by models based
only in individual particles, and a more complex modelling
will be required taking into account multiple particle interac-
tions and structural and geometrical arrangement.10,11 The
thermal magnetic relaxation process has been studied
exhaustively since the works of Dormann-Fiorani12,13 and
M�rup et al.14 in powder, flocculated, and isolated nanopar-
ticles in a polymer matrix with random orientation. In all
cases, the interaction effects and collective phenomena were
discussed based on phenomenological models with correc-
tions of the Arrhenius law or the Stoner-Wohlfarth model.
Parker and co-workers15 studied the low-temperature super-
spin-glass behavior of a concentrated frozen ferrofluid made
of c�Fe2O3 nanoparticles, and they found that the scaling
laws normally applied to atomic spin glasses are also valid
for superspin-glass samples, with good agreement between
the scaling parameters for the ac and dc relaxation curves.
Also, the superparamagnetism (SPM) phenomena of individ-
ual monodomain magnetic NPs can be affected by the
geometrical and texturization properties of the host. For
example, when magnetic particles are embedded in a ferro-
magnetic or antiferromagnetic matrix, stabilization is
induced by the magnetic interaction between the particles
and the host, which can shift the SPM limit to higher temper-
atures.16,17 Regarding collective states, Butera et al.18 stud-
ied a multilayer system by alternating layers of Py
(Fe20Ni80) film and Fe3O4 NPs, following the sequence
ðPy=NPs=PyÞN . In this case, through dc-magnetization and
ferromagnetic resonance experiments, a magnetic signal
related to the collective state can be resolved. In the most ba-
sic form, isotropic collective effects in random oriented NP
systems can also be expected due to dipolar interactions in
powder and NPs embedded into polymer hosts. More
recently, with the aim to grow multifunctional nanostruc-
tured systems, magnetic particles infiltrated into nanotubes
and mesoporous hosts showed another striking source of ani-
sotropy induced by the geometry and structure of the pores
and nanotubes.19–21 This cooperative phenomena between
the columns of magnetic NPs supported within the nanotubes
or porous host open a new degree of freedom to tune the
magnetic properties of the whole system. For example, Oli-
vetti et al.19 studied iron-oxide NPs injected in porous anodic
alumina (pore size of 20 nm and 100 nm), where the arrange-
ment of particles in regular nanostructures of this type leads
to the emergence of new properties, governed by the simulta-
neous presence of three relevant scales: particle size, pore di-
ameter, and the scale of the geometrical arrangement of the
template pores. Tolbert et al.20 studied cobalt NPs infiltrated
in hexagonal mesoporous silica, where the filling fraction
effect on the magnetic properties were discussed in detail. In
particular, they showed that at the nanoscale, confinement ofa)Electronic mail: [email protected].
0021-8979/2012/112(9)/094309/8/$30.00 VC 2012 American Institute of Physics112, 094309-1
JOURNAL OF APPLIED PHYSICS 112, 094309 (2012)
Downloaded 05 Mar 2013 to 137.30.164.204. Redistribution subject to AIP license or copyright; see http://jap.aip.org/about/rights_and_permissions

single-domain magnetic NPs in the one-dimensional pores of
hexagonal mesoporous silica results in constructive magnetic
interactions, and a “more coercive material is formed due to
anisotropic ferromagnetic interparticle coupling within the
chains of nanocrystals.” Similar fabrication procedures were
conducted by Jung et al.21 using FePt NPs embedded in the
nanochannels of an anodic alumina template, where after
annealing at 700 �C, the ordered fct FePt polycrystalline
nanostructure had high magnetic anisotropy and thus large
coercivity up to 1.1 T at room temperature.
While studying the properties of confined magnetic
nanoparticles, one of the most relevant factors is the relation-
ship between the intrinsic anisotropy of the NPs and external
anisotropy induced by the shape/geometrical arrangement of
the template pores. Thus, it is conceivable that the collective
behavior of the confined NPs can be tuned by a control of
the intrinsic properties of NPs and their spatial arrangement.
In the previous reports this connection between intrinsic and
assembly magnetic properties was studied mainly by using
static measurement techniques as field and temperature de-
pendent magnetization curves. In this paper we present a
study of superparamagnetic and superspin glass (SSG) states
of magnetic nanoparticles confined in mesoporous templates
using dynamic magnetization techniques as ac susceptibility
and ferromagnetic resonance (FMR) in addition to dc mag-
netization curves. In order to differentiate between the intrin-
sic and collective properties in our study, we considered
three magnetic nanoparticles systems with comparable size,
shape, and crystallinity but with different intrinsic magneto-
crystalline anisotropies. In addition, the confinement effects
were studied by considering three different geometries of
nanoparticles. Specifically, we considered Fe3O4, MnFe2O4,
and CoFe2O4 ferrite single magnetic domain NPs with size
near to 10 nm, infiltrated into AAO templates with 297 nm
porous size and thickness of 50 lm, and infiltrated in an non-
magnetic AAO-BTO nanotubes with 197 nm internal porous
size and same length. The effect of the geometrical confine-
ment and intrinsic anisotropy of the NPs are discussed based
on the known theoretical predictions.
II. EXPERIMENTAL
The inverse spinel ferrite NPs were synthesized using a
modified high temperature thermal decomposition method
published elsewhere.22 In a typical synthesis, 1 mmol of
FeðacÞ2 and 0.5 mmol transition metal acetate MðacÞ2(M¼Mn, Fe, Co) and 6 mmols of oleic acid were added to
15 ml benzyl ether in a three-neck round bottom flask and kept
under vigorous stirring. To promote the dissolution of the ace-
tate salts and eliminate the hydrating water molecules the ini-
tial solution was heated rapidly to 150 �C and maintained at
this temperature for 15 min. The temperature was subsequently
increased to 275 �C. After 30 min, the reaction was stopped by
removing the heat source and allowing the solution to cool
down naturally to room temperature. The resulting powders
were recovered from the solution by magnetic separation and
then washed several times with ethanol and acetone, separated
again, and extracted in hexane. For the complete removal of
the excess benzyl ether, this purification protocol was repeated
three times. Oleic acid-capped magnetic nanocrystals were iso-
lated and then dispersed in various non-polar solvents (chloro-
form, hexane, etc.) yielding brown clear colloids which are
stable against aggregation for months at room temperature.
Commercial porous alumina membranes (Whatman Anodisc)
with thickness of ð50 6 1Þ lm and mean pore-size of
ð297 6 50Þ nm were used in this study. The membrane poros-
ity is 41%, according to estimations made on the basis of the
membrane imaging. For simplicity the anodic aluminum oxide
template are abbreviated AAO. Nanotubes of barium titanate
(BaTiO3) were grown inside of AAO template from aqueous
solutions using a simple, inexpensive, reproducible, and envi-
ronmentally friendly procedure. The deposition solution is pre-
pared by dissolving ammonium hexafluorotitanate and barium
nitrate in a boric acid solution at a pH of 2.5. The blend is kept
at the temperature of 40 �C for 12 h. After annealing at 750 �Cin air, the resulting nanotubes are polycrystalline cubic
BaTiO3. The typical lengths of BaTiO3 nanotubes are 50 lm,
with an average internal diameter of approximately 197 nm,
which is defined by the pore diameter and thickness of the
AAO template. Hence, the average BaTiO3 wall-thickness
value is near 50 nm (see structural results below). In this
case, the BaTiO3 was labeled as BTO. Three batches of sam-
ples were prepared by the infiltration method, using the
Fe3O4; MnFe2O4, and CoFe2O4 colloidal NPs samples. The
first batch of samples corresponds to the powder NPs of each
ferrite composition, respectively. For their preparation, a polar
solvent (ethanol) was added to the as-prepared colloidal solu-
tion of NPs in hexane (50–50 in volume), and after mixed, the
samples were centrifuged at 3000 rpm for 10 min. A pellet of
NPs was extracted from each respective vial and dried in nor-
mal air conditions. The batch of powder samples were labeled
as PO-ferrite. The second batch of samples corresponds to the
infiltrated AAO template with each ferrite NPs. Hence, the par-
ticles were impregnated into pores by mixing 3 ml of the origi-
nal synthesis solution with AAO template. After 24 h, the
AAO and ferrite mixture was filtered. The composite was
washed with hexane while a few drops of oleic acid were
added to remove any particles from the AAO surface. The
sample was washed quickly with dry methanol to passivate the
particle surfaces and dried in an oven (100�C) over 24 h. Tak-
ing into account the hole mean diameter and thickness of the
AAO template, the diameter-to-length aspect ratio is�1 : 200.
As reported by Tolbert et al.,20 it is worth mentioning that this
infiltration method leads AAO densely filled with ferrite par-
ticles. The batch of infiltrated AAO samples was labeled as
AAO-Fe3O4; AAO-MnFe2O4, and AAO-CoFe2O4, respec-
tively. The third batch is associated with the infiltrated non-
magnetic BTO nanotubes supported in the AAO template with
each of the respective ferrite NPs. To infiltrate the nanotubes,
the same procedure (mentioned above for the AAO), was con-
ducted. In this particular structural condition, the same geo-
metrical arrangement of holes was kept intact, with the same
length and center-to-center hole distance but with different
wall-thickness and internal diameter. Taking into account the
mean diameter and thickness of the AAO template, the diame-
ter-to-length aspect ratio is �1 : 300. The batch of infiltrated
BTO nanotubes, supported in the AAO template, was
labeled as BTO-Fe3O4; BTO-MnFe2O4, and BTO-CoFe2O4,
094309-2 Vargas et al. J. Appl. Phys. 112, 094309 (2012)
Downloaded 05 Mar 2013 to 137.30.164.204. Redistribution subject to AIP license or copyright; see http://jap.aip.org/about/rights_and_permissions

respectively. The particle size and geometrical arrangement of
ferrite NPs into the AAO and BTO templates were analyzed
with a JEOL JEM 2010 (200 kV) transmission electron micro-
scope (TEM) and a Carl Zeiss 1530 VP FESEM (10 kV) scan-
ning electron microscope (SEM). The dc-magnetic properties
were measured using a commercial superconducting quantum
interference device (SQUID) magnetometer in a temperature
range of T¼ 4 K-300 K and field strength up to H670 kOe.
The complex magnetic susceptibility v ¼ v0 þ jv00 of these
samples was measured as a function of temperature from 4 to
300 K for frequencies ranging from � ¼ 10 Hz to 10 kHz in
the ac-option of the quantum design physical property mea-
surement system (PPMS). Ferromagnetic resonance (FMR)
experiments at � ¼ 9:87 GHz (X-band) and at room tempera-
ture were conducted using a Bruker EMX300 spectrometer.
III. RESULTS AND DISCUSSION
A. Structural characterization
Figure 1(a) shows the schematic representation of the
PO, AAO, and BTO samples, respectively. Fig. 1(b) shows
the TEM image of the MnFe2O4 colloidal NPs, where they
evidenced a clearly high-quality crystalline order with homo-
geneous cubic-faceted shape. Similar results were obtained
for the Fe3O4 and CoFe2O4 NPs.23 The histograms of parti-
cle size distribution were built counting 200 particles for
each sample (figure not shown) and fitted with a Gaussian
function, f ðDÞ / expð� ðD� �DÞ22r2 Þ, where �D is the center peak
position and r is the linewidth of the distribution. The mean
particle sizes were determined with the values of
8:061:5 nm ðCoFe2O4 NPÞ; 9:560:9 nm ðMnFe2O4 NPÞ, and
6:960:8 nm ðFe3O4 NPÞ. Figures 1(c) and 1(d) correspond to
the cross-section and top-view SEM images of the AAO
template, respectively. The AAO pores showed circular
shape with mean size of ð297650Þ nm and interspace wall-
thickness of 60 nm. Due to the limited quality in pore-size
dispersion, the pores are localized randomly in a close-
packing geometrical arrangement following a short-range,
hexagonal-like order (Fig. 1(d)). Figures 1(f) and 1(g) show
the cross-section SEM images of the infiltrated AAO tem-
plate and BTO nanotubes, respectively, where it is possible
to observe that the full length of the cavities was filled with
ferrite nanoparticles. The BTO nanotubes are grown inside
of the AAO pores, with a wall thickness value of 50 nm,
which it gives an internal diameter value of 197 nm (Fig.
1(e)). For the powder ferrite NPs, the saturation magnetiza-
tion, MS, was estimated from the adjusted magnetization vs
field curves at 300 K, by the Langevin formula.23 Table I
summarizes the structural and magnetic data of the ferrite
FIG. 1. (a) Schematic representation, cross-section, of the PO, AAO, and
BTO samples. (b) TEM image of the MnFe2O4 NPs. (c),(d) SEM images, in
cross-section and top-view, of the AAO template, respectively. (e) SEM
image of the BTO nanotubes into the AAO template. (f),(g) SEM images,
cross-section, of AAO and BTO infiltrated samples with MnFe2O4 NPs,
respectively.
TABLE I. Structural and dc-magnetic properties. The errors are indicated in brackets. u is the hole internal diameter of AAO or BTO host, v is the average dis-
tance between the outside walls of the tubes, and L is the membrane thickness. SQ is the squareness of the magnetization loops.
NP sizePorous template Dc-parameters
Sample DTEM ðnmÞ u (nm) v (nm) L ðlmÞ HC ðOeÞ SQ MS ðerg=cm3Þa
PO-Fe3O4 6.9 (0.8) ��� ��� ��� 173 0.18 83.7 (8.3)
PO-MnFe2O4 9.5 (0.9) ��� ��� ��� 237 0.36 78.0 (8.1)
PO-CoFe2O4 8.0 (1.5) ��� ��� ��� 14123 0.70 68.3 (7.0)
AAO-Fe3O4 6.9 (0.8) 297 (50) 60 (7) 50 (1) 139 0.28 ���AAO-MnFe2O4 9.5 (0.9) 297 (50) 60 (7) 50 (1) 339 0.40 ���AAO-CoFe2O4 8.0 (1.5) 297 (50) 60 (7) 50 (1) 10136 0.70 ���BTO-Fe3O4 6.9 (0.8) 197 (37) 160 (20) 50 (1) 190 0.32 ���BTO-MnFe2O4 9.5 (0.9) 197 (37) 160 (20) 50 (1) 390 0.50 ���BTO-CoFe2O4 8.0 (1.5) 197 (37) 160 (20) 50 (1) 10368 0.70 ���
aBulk saturation magnetization values of 92 emu/g ðFe3O4Þ, 80 emu/g ðMnFe2O4Þ, and 75 emu/g ðCoFe2O4Þ.24
094309-3 Vargas et al. J. Appl. Phys. 112, 094309 (2012)
Downloaded 05 Mar 2013 to 137.30.164.204. Redistribution subject to AIP license or copyright; see http://jap.aip.org/about/rights_and_permissions

NPs, AAO template, and BTO nanotubes into the AAO
template.
B. Dc-magnetic characterization
For the three powder samples the dc-magnetization
curves were measured and presented elsewhere,23 where
non-hysteresis effects were observed at room temperature
(figure not shown). The magnetization loops at T¼ 4 K cor-
respond to the case of soft (Fe3O4), intermediate (MnFe2O4),
and hard (CoFe2O4) magnetic monodomain anisotropic
materials (Fig. 2). Similar shaped magnetization loops were
obtained for the infiltrated AAO and BTO ferrite samples,
where the magnetic field was applied along the axis of the
nanochannels. Moreover, it is important to emphasize the
systematic change in the squareness, Mr=MS, of the hystere-
sis loops calculated using the remanent and saturation mag-
netization and change in coercive fields, HC, values that can
be clearly observed for the three batches of samples: (i) In
the case of Fe3O4 samples, the infiltrated-BTO sample shows
the largest HC. An intermediate value of HC was measured
for the PO sample, and a lower value was obtained for the
infiltrated-AAO sample (Table I). (ii) For the MnFe2O4 sam-
ples, compared with the iron-oxide batch, the infiltrated-
BTO sample shows the largest value of HC. However, the
infiltrated-AAO sample showed the intermediate value of
HC, and a lower value was obtained for the PO sample (Ta-
ble I). (iii) In the case of CoFe2O4 samples one observes
rectangular-shaped magnetization loops with very high HC
values for the PO sample. The loops for CoFe2O4 infiltrated
AAO and BTO samples have almost the same HC value
lower than the PO sample (see values summarized in
Table I). These dc-magnetization curves can be explained by
taking into account the interplay between the individual and
collective/cooperative magnetic contributions as the intrinsic
magnetocrystalline anisotropy of the ferrite nanoparticles,
the dipolar interaction between them, and the induced
“needle” anisotropy due to the geometrical aspect-ratio of
these samples. This is discussed in more details in the next
sections.
C. Ferromagnetic resonance (X-band)
To confirm the cooperative and texturization phenomena
on these ferrite samples, angular dependent X-band
(9.87 GHz) FMR experiments were conducted at room tem-
perature. Due to the intrinsic characteristics of the FMR
technique, these experiments allowed us to get a local mea-
surement of the effective anisotropy, resolving different
anisotropy contributions with high accuracy. Figure 3
shows the FMR spectra for the AAO-Fe3O4 (Fig. 3 (left)),
BTO-Fe3O4 (Fig. 3 (right)), and PO-Fe3O4 samples. In the
case of the AAO and BTO infiltrated samples, the measure-
ments were done with the magnetic field along the nanotubes
(Hk) and perpendicular to the nanotubes (H?). The PO sam-
ple was used as the control sample, with the Fe3O4 nanopar-
ticles in random orientation. Clear evidence of the
cooperative phenomena and geometrical confinement influ-
ence of the AAO template and BTO nanotubes can be
observed in the shape of the FMR absorption-derivative sig-
nals. These results are the clear fingerprint of textured sam-
ples and the relative strength of the intrinsic magnetic
moments. To reinforce this conclusion, these results can be
compared with the systematic study of the “textured sample
effect” that was reported previously by Zysler et al.,25 where
FIG. 2. Magnetization loops measured at T¼ 4 K for the three batches of
ferrite samples, PO, AAO, and BTO.
FIG. 3. X-band (9.87 GHz), FMR spectra of the Fe3O4 NPs infiltrated into
the AAO and BTO hosts. The measurements were done with magnetic field
parallel (k) and perpendicular (?) to the nanochannels. For reference con-
trol, the spectrum of the PO sample is added in both cases.
094309-4 Vargas et al. J. Appl. Phys. 112, 094309 (2012)
Downloaded 05 Mar 2013 to 137.30.164.204. Redistribution subject to AIP license or copyright; see http://jap.aip.org/about/rights_and_permissions
colloidal nanoparticles were frozen under external bias mag-
netic field. In this previous study, the majority of the anisot-
ropy axes of the particles are aligned along the direction of
the external magnetic field, and the assembly can be modeled
as a system with a single anisotropy axis. Moreover, it was
observed that the shape of the FMR spectra and their angular
variation for the textured nanoparticle samples are strongly
dependent on the particle-size and intrinsic magnetocrystal-
line anisotropy. In spite of this fact, in our measurements one
observes that the experimental shift of the FMR line, corre-
sponding to the change of the geometry from Hk to H? is
smaller than the theoretically expected one due to the intrin-
sic demagnetization field. For example, Ramos et al.26
reported the angular variation of the FMR spectra for contin-
uous Ni nanowires where the magnitude of the effective ani-
sotropy field is consistent with the structural data given by
HA ¼ 2MSð1� 3f Þ, where f is the filling factor. This appa-
rent reduction of local anisotropy in our samples can be
explained by the fact that inside of each nanotube of AAO or
BTO, the nanoparticles are not in a coalescent state, and the
local anisotropy axis of these particles is randomly oriented,
more likely with flocculate condition of nanoparticles. Simi-
lar results were obtained for the infiltrated samples of
AAO-MnFe2O4; BTO-MnFe2O4, and PO-MnFe2O4 samples
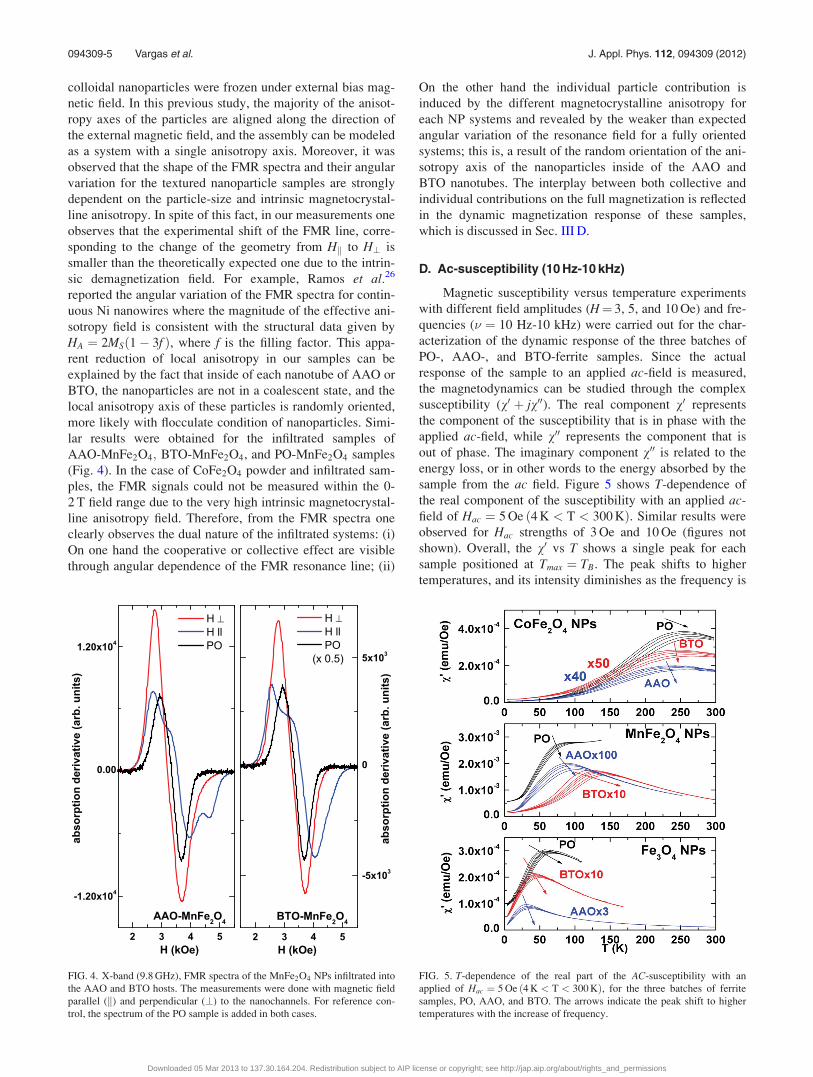
(Fig. 4). In the case of CoFe2O4 powder and infiltrated sam-
ples, the FMR signals could not be measured within the 0-
2 T field range due to the very high intrinsic magnetocrystal-
line anisotropy field. Therefore, from the FMR spectra one
clearly observes the dual nature of the infiltrated systems: (i)
On one hand the cooperative or collective effect are visible
through angular dependence of the FMR resonance line; (ii)
On the other hand the individual particle contribution is
induced by the different magnetocrystalline anisotropy for
each NP systems and revealed by the weaker than expected
angular variation of the resonance field for a fully oriented
systems; this is, a result of the random orientation of the ani-
sotropy axis of the nanoparticles inside of the AAO and
BTO nanotubes. The interplay between both collective and
individual contributions on the full magnetization is reflected
in the dynamic magnetization response of these samples,
which is discussed in Sec. III D.
D. Ac-susceptibility (10 Hz-10 kHz)
Magnetic susceptibility versus temperature experiments
with different field amplitudes (H¼ 3, 5, and 10 Oe) and fre-
quencies (� ¼ 10 Hz-10 kHz) were carried out for the char-
acterization of the dynamic response of the three batches of
PO-, AAO-, and BTO-ferrite samples. Since the actual
response of the sample to an applied ac-field is measured,
the magnetodynamics can be studied through the complex
susceptibility (v0 þ jv00). The real component v0 represents
the component of the susceptibility that is in phase with the
applied ac-field, while v00 represents the component that is
out of phase. The imaginary component v00 is related to the
energy loss, or in other words to the energy absorbed by the
sample from the ac field. Figure 5 shows T-dependence of
the real component of the susceptibility with an applied ac-
field of Hac ¼ 5 Oe ð4 K < T < 300 KÞ. Similar results were
observed for Hac strengths of 3 Oe and 10 Oe (figures not
shown). Overall, the v0 vs T shows a single peak for each
sample positioned at Tmax ¼ TB. The peak shifts to higher
temperatures, and its intensity diminishes as the frequency is
FIG. 4. X-band (9.8 GHz), FMR spectra of the MnFe2O4 NPs infiltrated into
the AAO and BTO hosts. The measurements were done with magnetic field
parallel (k) and perpendicular (?) to the nanochannels. For reference con-
trol, the spectrum of the PO sample is added in both cases.
FIG. 5. T-dependence of the real part of the AC-susceptibility with an
applied of Hac ¼ 5 Oe ð4 K < T < 300 KÞ, for the three batches of ferrite
samples, PO, AAO, and BTO. The arrows indicate the peak shift to higher
temperatures with the increase of frequency.
094309-5 Vargas et al. J. Appl. Phys. 112, 094309 (2012)
Downloaded 05 Mar 2013 to 137.30.164.204. Redistribution subject to AIP license or copyright; see http://jap.aip.org/about/rights_and_permissions

increased from � ¼ 10 Hz to 10 kHz. This effect is directly
related with the frequency dependence of the blocking tem-
perature of magnetic monodomain NPs, as the samples are
cooled down.7,8 Moreover, the rates of the peak shift with
frequency are different for the three types of samples (the
arrows in Fig. 5 suggest the rate of the peak-position shift as
the frequency increase). In particular, comparing the v0 vs Tplots for Fe3O4; MnFe2O4, and CoFe2O4 samples one
observes that the susceptibility peaks as function of fre-
quency are located in different temperature ranges, this being
a direct correlation with the intrinsic anisotropy values.7,8
Two criteria have often been used for comparing the fre-
quency dependence of TB, namely, C1 ¼ DTB
TBDlog10�, independ-
ent of any model, and C2 ¼ TB�T0
TB, where T0 is the
characteristic temperature of the Vogel-Fulcher law
described below. This law is phenomenological and without
physical meaning near T0, but C2 can be useful for compar-
ing the TB trends among these samples. Figure 6 shows the
variation of the TB in the classical plot of Log10ðsÞ vs 1=TB
for the three batches of samples, which in terms of the super-
paramagnetic N�eel model (N�eel 1949), the linear fit corre-
sponds to the Arrhenius law
lnss0
� �¼ EB
kBT; (1)
where in a first approach s0 is a constant (10�9 s
< s0 < 10�12 s) and EB is the energy barrier of the NPs.
Hence, EB ¼ K �V , where K is the effective anisotropy con-
stant. Therefore, the values of EB and K were calculated
from these experimental results. The parameters are summar-
ized in Table II (batch of Fe3O4 samples), Table III (batch of
MnFe2O4 samples), and Table IV (batch of CoFe2O4
samples).
Although the fitted straight-lines in Fig. 6 seem to be in
good agreement with the experimental data, the Arrhenius
law output fit parameters have no physical significance.
Specifically, the s0 values are much smaller than the physi-
cally accepted ones and EB values are relatively high com-
pared with the reference values27,28 of EB ¼ 303 K (Fe3O4,
using K ¼ 2:43� 105 erg=cm3), EB ¼ 280 K (MnFe2O4,
using K ¼ 8:5� 104 erg=cm3), and EB ¼ 3885 K (CoFe2O4,
using K ¼ 2:0� 106 erg=cm3). Consequently the experimen-
tally observed variation of ac susceptibility for all samples is
not consistent with a simple superparamagnetic blocking
behavior of independent particles.
Dormann and Fiorani proved that in the case of cluster-
like particles the interaction effect cannot be neglected,
where different scaling laws based in phenomenological
models and N�eel theory for intermediate and strong interact-
ing systems were tested.12,13 Following the same work of
Dormann and co-workers in order to treat the interaction and
collective effects, in this paper we analyze the ac
FIG. 6. The dynamic response of the magnetization, in the plot of log10ðsÞagainst 1=TB, for the three batches of samples, where the linear fit corre-
sponds to the Arrhenius law model.
TABLE II. Fe3O4 samples: C1; C2, and fit parameters coming from the
Arrhenius, Fulcher, and power laws.
Sample Arrhenius Fulcher Power law
PO-Fe3O4 s0 ¼ 10�15 s s0 ¼ 10�10 s s�0 ¼ 4:1� 10�6 s
EB ¼ 1825:7 K EB ¼ 602:2 K z� ¼ 10:7
��� T0 ¼ 26:2 K Tg ¼ 39:4 K
C1 ¼ 0:08 C2 ¼ 0:61 ���BTO-Fe3O4 s0 ¼ 10�13 s s0 ¼ 10�10 s s�0 ¼ 4:8� 10�7 s
EB ¼ 1073:7 K EB ¼ 443:5 K z� ¼ 7:4
��� T0 ¼ 18:0 K Tg ¼ 33:6 K
C1 ¼ 0:10 C2 ¼ 0:63 ���AAO-Fe3O4 s0 ¼ 10�11 s s0 ¼ 10�10 s s�0 ¼ 3:4� 10�6 s
EB ¼ 597:3 K EB ¼ 497:7 K z� ¼ 4:1
��� T0 ¼ 2:1 K Tg ¼ 26:1 K
C1 ¼ 0:16 C2 ¼ 0:94 ���
TABLE III. MnFe2O4 samples: C1; C2, and fit parameters coming from the
Arrhenius, Fulcher, and power laws.
Sample Arrhenius Fulcher Power law
PO-MnFe2O4 s0 ¼ 10�15 s s0 ¼ 10�10 s s�0 ¼ 10�6 s
EB ¼ 2881:0 K EB ¼ 657:8 K z� ¼ 2:6
��� T0 ¼ 59:3 K Tg ¼ 93:2 K
C1 ¼ 0:08 C2 ¼ 0:44 ���BTO-MnFe2O4 s0 ¼ 10�13 s s0 ¼ 10�10 s s�0 ¼ 8:1� 10�7 s
EB ¼ 2298:2 K EB ¼ 1245:1 K z� ¼ 8:6
��� T0 ¼ 56:2 K Tg ¼ 92:8 K
C1 ¼ 0:09 C2 ¼ 0:60 ���AAO-MnFe2O4 s0 ¼ 10�12 s s0 ¼ 10�10 s s�0 ¼ 1:0 s
EB ¼ 1927:0 K EB ¼ 1101:0 K z� ¼ 12:4
��� T0 ¼ 24:0 K Tg ¼ 37:2 K
C1 ¼ 0:11 C2 ¼ 0:76 ���
094309-6 Vargas et al. J. Appl. Phys. 112, 094309 (2012)
Downloaded 05 Mar 2013 to 137.30.164.204. Redistribution subject to AIP license or copyright; see http://jap.aip.org/about/rights_and_permissions
susceptibility data using the Vogel-Fulcher and power laws
coming from the spin-glass literature.12,13
The observed slowing down of relaxation process in our
samples can be addressed by the Vogel-Fulcher law describ-
ing a divergence of the relaxation time at finite temperature
T0. The Vogel-Fulcher law is given by
s ¼ s0expEB
kBðT � T0Þ
� �; (2)
and it is valid only if T � T0, where T0 is a temperature pro-
portional to the power of the internal molecular field and
increases with the interaction strength. Hence, for T0 ¼ 0, it
gives the Arrhenius law. Taking into account Eq. (2), the
obtained fitted parameters are summarized in Table II (batch
of Fe3O4 samples), Table III (batch of MnFe2O4 samples), and
Table IV (batch of CoFe2O4 samples) and can be compared
with the parameters coming from the Arrhenius law discussed
above. Also, the parameters C1 and C2 are indicated in each ta-
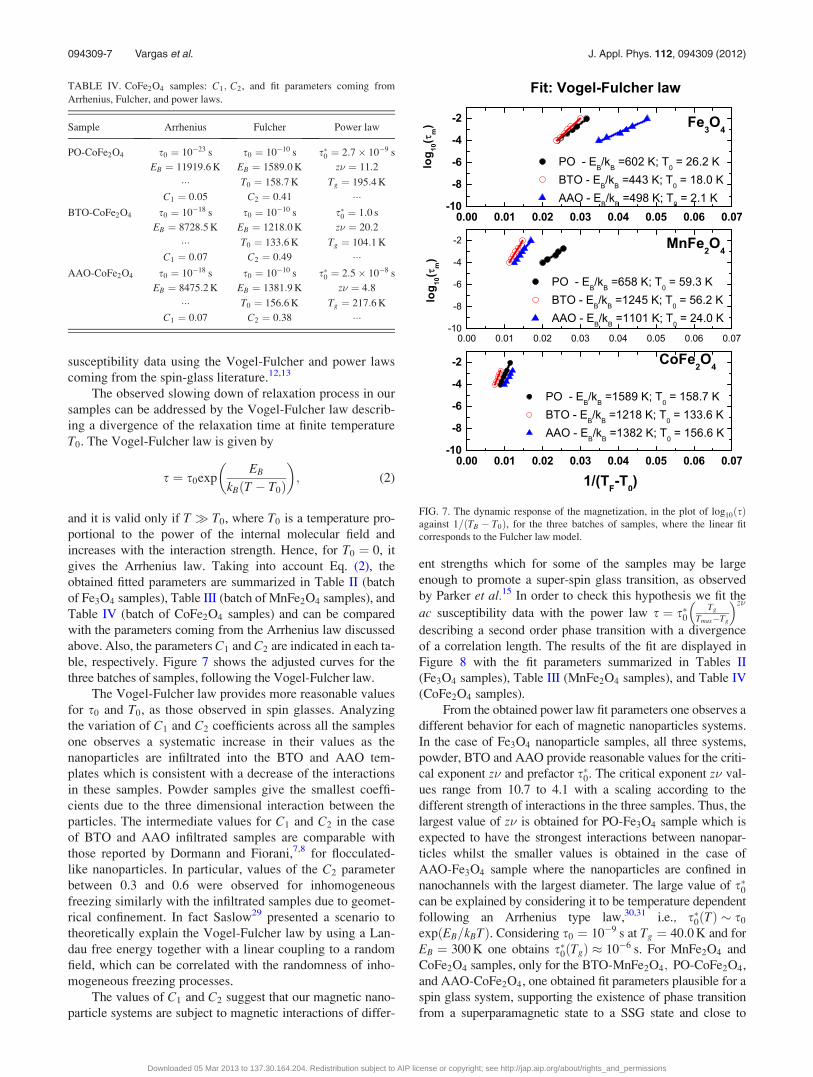
ble, respectively. Figure 7 shows the adjusted curves for the
three batches of samples, following the Vogel-Fulcher law.
The Vogel-Fulcher law provides more reasonable values
for s0 and T0, as those observed in spin glasses. Analyzing
the variation of C1 and C2 coefficients across all the samples
one observes a systematic increase in their values as the
nanoparticles are infiltrated into the BTO and AAO tem-
plates which is consistent with a decrease of the interactions
in these samples. Powder samples give the smallest coeffi-
cients due to the three dimensional interaction between the
particles. The intermediate values for C1 and C2 in the case
of BTO and AAO infiltrated samples are comparable with
those reported by Dormann and Fiorani,7,8 for flocculated-
like nanoparticles. In particular, values of the C2 parameter
between 0.3 and 0.6 were observed for inhomogeneous
freezing similarly with the infiltrated samples due to geomet-
rical confinement. In fact Saslow29 presented a scenario to
theoretically explain the Vogel-Fulcher law by using a Lan-
dau free energy together with a linear coupling to a random
field, which can be correlated with the randomness of inho-
mogeneous freezing processes.
The values of C1 and C2 suggest that our magnetic nano-
particle systems are subject to magnetic interactions of differ-
ent strengths which for some of the samples may be large
enough to promote a super-spin glass transition, as observed
by Parker et al.15 In order to check this hypothesis we fit the
ac susceptibility data with the power law s ¼ s�0Tg
Tmax�Tg
� �z�
describing a second order phase transition with a divergence
of a correlation length. The results of the fit are displayed in
Figure 8 with the fit parameters summarized in Tables II
(Fe3O4 samples), Table III (MnFe2O4 samples), and Table IV
(CoFe2O4 samples).
From the obtained power law fit parameters one observes a
different behavior for each of magnetic nanoparticles systems.
In the case of Fe3O4 nanoparticle samples, all three systems,
powder, BTO and AAO provide reasonable values for the criti-
cal exponent z� and prefactor s�0. The critical exponent z� val-
ues range from 10.7 to 4.1 with a scaling according to the
different strength of interactions in the three samples. Thus, the
largest value of z� is obtained for PO-Fe3O4 sample which is
expected to have the strongest interactions between nanopar-
ticles whilst the smaller values is obtained in the case of
AAO-Fe3O4 sample where the nanoparticles are confined in
nanochannels with the largest diameter. The large value of s�0can be explained by considering it to be temperature dependent
following an Arrhenius type law,30,31 i.e., s�0ðTÞ � s0
expðEB=kBTÞ. Considering s0 ¼ 10�9 s at Tg ¼ 40:0 K and for
EB ¼ 300 K one obtains s�0ðTgÞ 10�6 s. For MnFe2O4 and
CoFe2O4 samples, only for the BTO-MnFe2O4; PO-CoFe2O4,
and AAO-CoFe2O4, one obtained fit parameters plausible for a
spin glass system, supporting the existence of phase transition
from a superparamagnetic state to a SSG state and close to
FIG. 7. The dynamic response of the magnetization, in the plot of log10ðsÞagainst 1=ðTB � T0Þ, for the three batches of samples, where the linear fit
corresponds to the Fulcher law model.
TABLE IV. CoFe2O4 samples: C1; C2, and fit parameters coming from
Arrhenius, Fulcher, and power laws.
Sample Arrhenius Fulcher Power law
PO-CoFe2O4 s0 ¼ 10�23 s s0 ¼ 10�10 s s�0 ¼ 2:7� 10�9 s
EB ¼ 11919:6 K EB ¼ 1589:0 K z� ¼ 11:2
��� T0 ¼ 158:7 K Tg ¼ 195:4 K
C1 ¼ 0:05 C2 ¼ 0:41 ���BTO-CoFe2O4 s0 ¼ 10�18 s s0 ¼ 10�10 s s�0 ¼ 1:0 s
EB ¼ 8728:5 K EB ¼ 1218:0 K z� ¼ 20:2
��� T0 ¼ 133:6 K Tg ¼ 104:1 K
C1 ¼ 0:07 C2 ¼ 0:49 ���AAO-CoFe2O4 s0 ¼ 10�18 s s0 ¼ 10�10 s s�0 ¼ 2:5� 10�8 s
EB ¼ 8475:2 K EB ¼ 1381:9 K z� ¼ 4:8
��� T0 ¼ 156:6 K Tg ¼ 217:6 K
C1 ¼ 0:07 C2 ¼ 0:38 ���
094309-7 Vargas et al. J. Appl. Phys. 112, 094309 (2012)
Downloaded 05 Mar 2013 to 137.30.164.204. Redistribution subject to AIP license or copyright; see http://jap.aip.org/about/rights_and_permissions
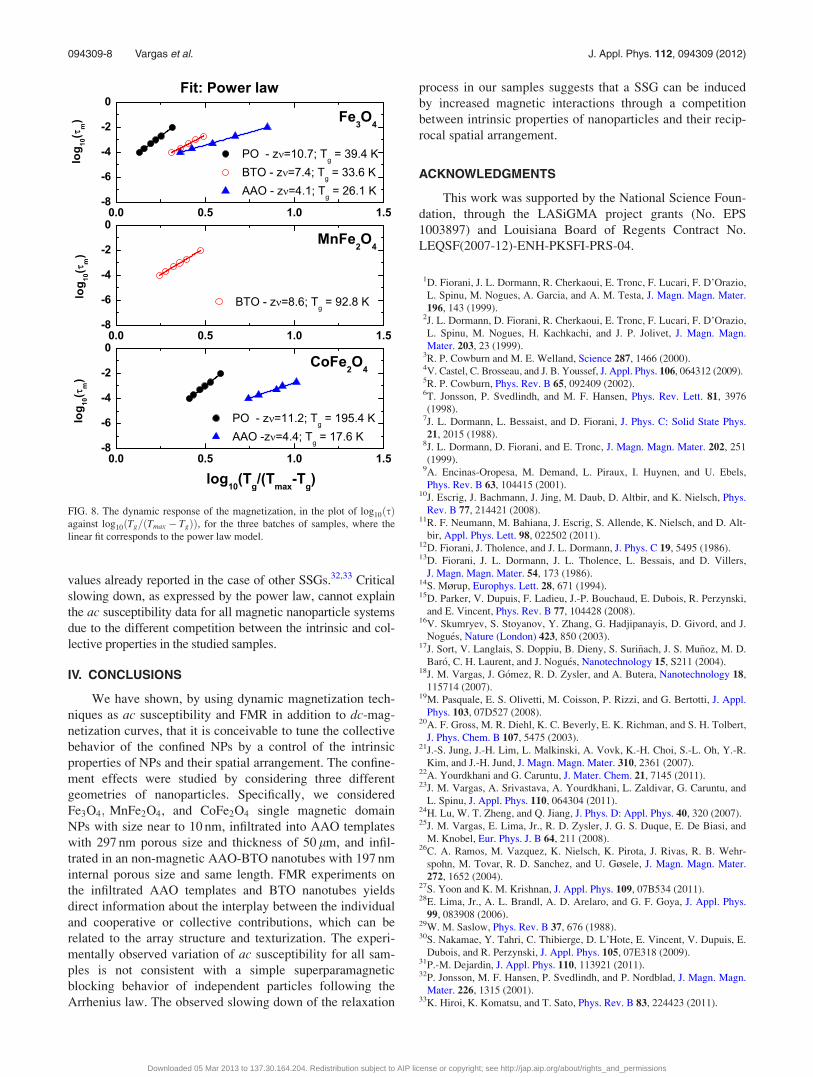
values already reported in the case of other SSGs.32,33 Critical
slowing down, as expressed by the power law, cannot explain
the ac susceptibility data for all magnetic nanoparticle systems
due to the different competition between the intrinsic and col-
lective properties in the studied samples.
IV. CONCLUSIONS
We have shown, by using dynamic magnetization tech-
niques as ac susceptibility and FMR in addition to dc-mag-
netization curves, that it is conceivable to tune the collective
behavior of the confined NPs by a control of the intrinsic
properties of NPs and their spatial arrangement. The confine-
ment effects were studied by considering three different
geometries of nanoparticles. Specifically, we considered
Fe3O4; MnFe2O4, and CoFe2O4 single magnetic domain
NPs with size near to 10 nm, infiltrated into AAO templates
with 297 nm porous size and thickness of 50 lm, and infil-
trated in an non-magnetic AAO-BTO nanotubes with 197 nm
internal porous size and same length. FMR experiments on
the infiltrated AAO templates and BTO nanotubes yields
direct information about the interplay between the individual
and cooperative or collective contributions, which can be
related to the array structure and texturization. The experi-
mentally observed variation of ac susceptibility for all sam-
ples is not consistent with a simple superparamagnetic
blocking behavior of independent particles following the
Arrhenius law. The observed slowing down of the relaxation
process in our samples suggests that a SSG can be induced
by increased magnetic interactions through a competition
between intrinsic properties of nanoparticles and their recip-
rocal spatial arrangement.
ACKNOWLEDGMENTS
This work was supported by the National Science Foun-
dation, through the LASiGMA project grants (No. EPS
1003897) and Louisiana Board of Regents Contract No.
LEQSF(2007-12)-ENH-PKSFI-PRS-04.
1D. Fiorani, J. L. Dormann, R. Cherkaoui, E. Tronc, F. Lucari, F. D’Orazio,
L. Spinu, M. Nogues, A. Garcia, and A. M. Testa, J. Magn. Magn. Mater.
196, 143 (1999).2J. L. Dormann, D. Fiorani, R. Cherkaoui, E. Tronc, F. Lucari, F. D’Orazio,
L. Spinu, M. Nogues, H. Kachkachi, and J. P. Jolivet, J. Magn. Magn.
Mater. 203, 23 (1999).3R. P. Cowburn and M. E. Welland, Science 287, 1466 (2000).4V. Castel, C. Brosseau, and J. B. Youssef, J. Appl. Phys. 106, 064312 (2009).5R. P. Cowburn, Phys. Rev. B 65, 092409 (2002).6T. Jonsson, P. Svedlindh, and M. F. Hansen, Phys. Rev. Lett. 81, 3976
(1998).7J. L. Dormann, L. Bessaist, and D. Fiorani, J. Phys. C: Solid State Phys.
21, 2015 (1988).8J. L. Dormann, D. Fiorani, and E. Tronc, J. Magn. Magn. Mater. 202, 251
(1999).9A. Encinas-Oropesa, M. Demand, L. Piraux, I. Huynen, and U. Ebels,
Phys. Rev. B 63, 104415 (2001).10J. Escrig, J. Bachmann, J. Jing, M. Daub, D. Altbir, and K. Nielsch, Phys.
Rev. B 77, 214421 (2008).11R. F. Neumann, M. Bahiana, J. Escrig, S. Allende, K. Nielsch, and D. Alt-
bir, Appl. Phys. Lett. 98, 022502 (2011).12D. Fiorani, J. Tholence, and J. L. Dormann, J. Phys. C 19, 5495 (1986).13D. Fiorani, J. L. Dormann, J. L. Tholence, L. Bessais, and D. Villers,
J. Magn. Magn. Mater. 54, 173 (1986).14S. M�rup, Europhys. Lett. 28, 671 (1994).15D. Parker, V. Dupuis, F. Ladieu, J.-P. Bouchaud, E. Dubois, R. Perzynski,
and E. Vincent, Phys. Rev. B 77, 104428 (2008).16V. Skumryev, S. Stoyanov, Y. Zhang, G. Hadjipanayis, D. Givord, and J.
Nogu�es, Nature (London) 423, 850 (2003).17J. Sort, V. Langlais, S. Doppiu, B. Dieny, S. Suri~nach, J. S. Mu~noz, M. D.
Bar�o, C. H. Laurent, and J. Nogu�es, Nanotechnology 15, S211 (2004).18J. M. Vargas, J. G�omez, R. D. Zysler, and A. Butera, Nanotechnology 18,
115714 (2007).19M. Pasquale, E. S. Olivetti, M. Coisson, P. Rizzi, and G. Bertotti, J. Appl.
Phys. 103, 07D527 (2008).20A. F. Gross, M. R. Diehl, K. C. Beverly, E. K. Richman, and S. H. Tolbert,
J. Phys. Chem. B 107, 5475 (2003).21J.-S. Jung, J.-H. Lim, L. Malkinski, A. Vovk, K.-H. Choi, S.-L. Oh, Y.-R.
Kim, and J.-H. Jund, J. Magn. Magn. Mater. 310, 2361 (2007).22A. Yourdkhani and G. Caruntu, J. Mater. Chem. 21, 7145 (2011).23J. M. Vargas, A. Srivastava, A. Yourdkhani, L. Zaldivar, G. Caruntu, and
L. Spinu, J. Appl. Phys. 110, 064304 (2011).24H. Lu, W. T. Zheng, and Q. Jiang, J. Phys. D: Appl. Phys. 40, 320 (2007).25J. M. Vargas, E. Lima, Jr., R. D. Zysler, J. G. S. Duque, E. De Biasi, and
M. Knobel, Eur. Phys. J. B 64, 211 (2008).26C. A. Ramos, M. Vazquez, K. Nielsch, K. Pirota, J. Rivas, R. B. Wehr-
spohn, M. Tovar, R. D. Sanchez, and U. G�sele, J. Magn. Magn. Mater.
272, 1652 (2004).27S. Yoon and K. M. Krishnan, J. Appl. Phys. 109, 07B534 (2011).28E. Lima, Jr., A. L. Brandl, A. D. Arelaro, and G. F. Goya, J. Appl. Phys.
99, 083908 (2006).29W. M. Saslow, Phys. Rev. B 37, 676 (1988).30S. Nakamae, Y. Tahri, C. Thibierge, D. L’Hote, E. Vincent, V. Dupuis, E.
Dubois, and R. Perzynski, J. Appl. Phys. 105, 07E318 (2009).31P.-M. Dejardin, J. Appl. Phys. 110, 113921 (2011).32P. Jonsson, M. F. Hansen, P. Svedlindh, and P. Nordblad, J. Magn. Magn.
Mater. 226, 1315 (2001).33K. Hiroi, K. Komatsu, and T. Sato, Phys. Rev. B 83, 224423 (2011).
FIG. 8. The dynamic response of the magnetization, in the plot of log10ðsÞagainst log10ðTg=ðTmax � TgÞÞ, for the three batches of samples, where the
linear fit corresponds to the power law model.
094309-8 Vargas et al. J. Appl. Phys. 112, 094309 (2012)
Downloaded 05 Mar 2013 to 137.30.164.204. Redistribution subject to AIP license or copyright; see http://jap.aip.org/about/rights_and_permissions


![Magnetic and Electrical Properties of Ordered 112-type ...stimulated the research of doped 112-ordered cobaltites [4]. In fact, the magnetic and electron transport properties of this](https://static.fdocuments.net/doc/165x107/60fb518726804f50287e01d2/magnetic-and-electrical-properties-of-ordered-112-type-stimulated-the-research.jpg)
![Magnetic and Thermodynamic Properties of the …cond-mat/0001317v1 [cond-mat.dis-nn] 21 Jan 2000 Magnetic and Thermodynamic Properties of the Collective Paramagnet−Spin Liquid Pyrochlore](https://static.fdocuments.net/doc/165x107/5af837da7f8b9a44658c1798/magnetic-and-thermodynamic-properties-of-the-cond-mat0001317v1-cond-matdis-nn.jpg)