Using Dyninst to Dynamically Control Memory Reference Tracing
Upload
jenette-millerCategory
view
41download
1description
Dynamic Tuning of Parallel Programs
with DynInst
Anna Morajko, Tomàs Margalef, Emilio LuqueUniversitat Autònoma de Barcelona
Paradyn/Condor Week, March 2002
UAB2
Content
• Our goals - dynamic performance tuning
• Steering loop
Dynamic tracing
Performance analysis
Dynamic tuning
• DynInst
• Application development framework
• Conclusions and future work
UAB3
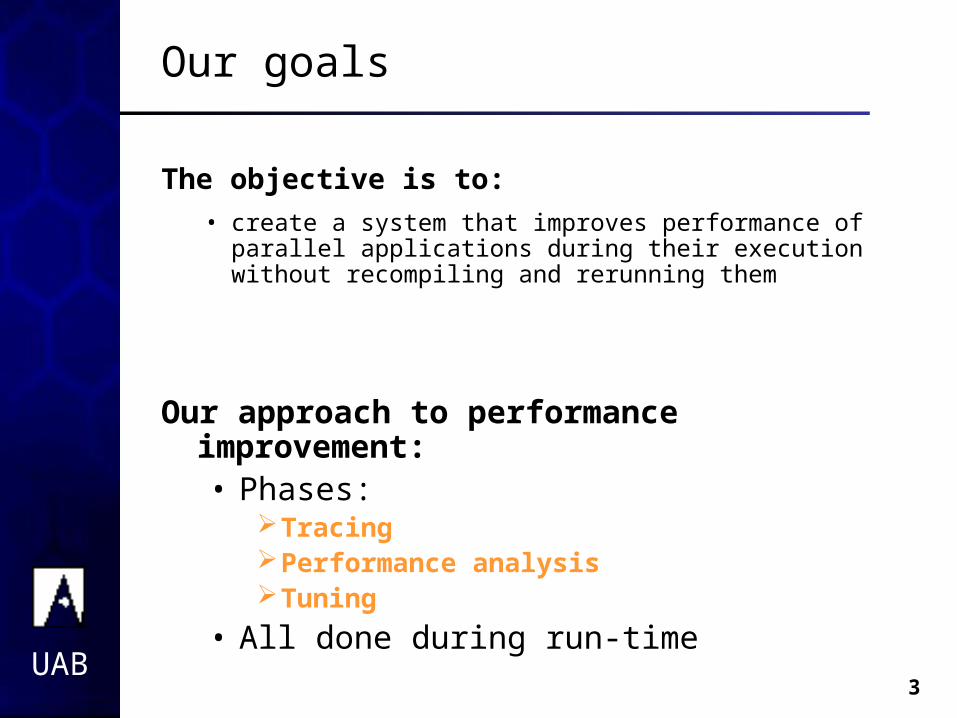
The objective is to:
• create a system that improves performance of parallel applications during their execution without recompiling and rerunning them
Our goals
Our approach to performance improvement:• Phases:
TracingPerformance analysisTuning
• All done during run-time
UAB4
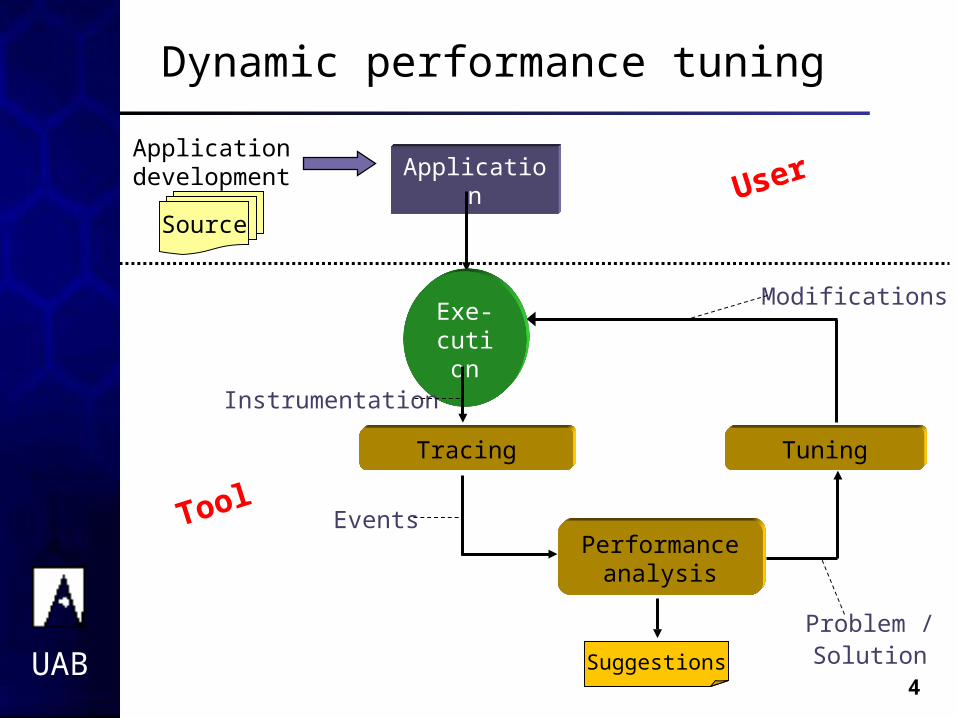
Dynamic performance tuning
Suggestions
ApplicationUser
TuningTracing
Exe-cutio
n
Tool
SolutionProblem /
EventsPerformance
analysis
Modifications
Instrumentation
Application development
Source
UAB5
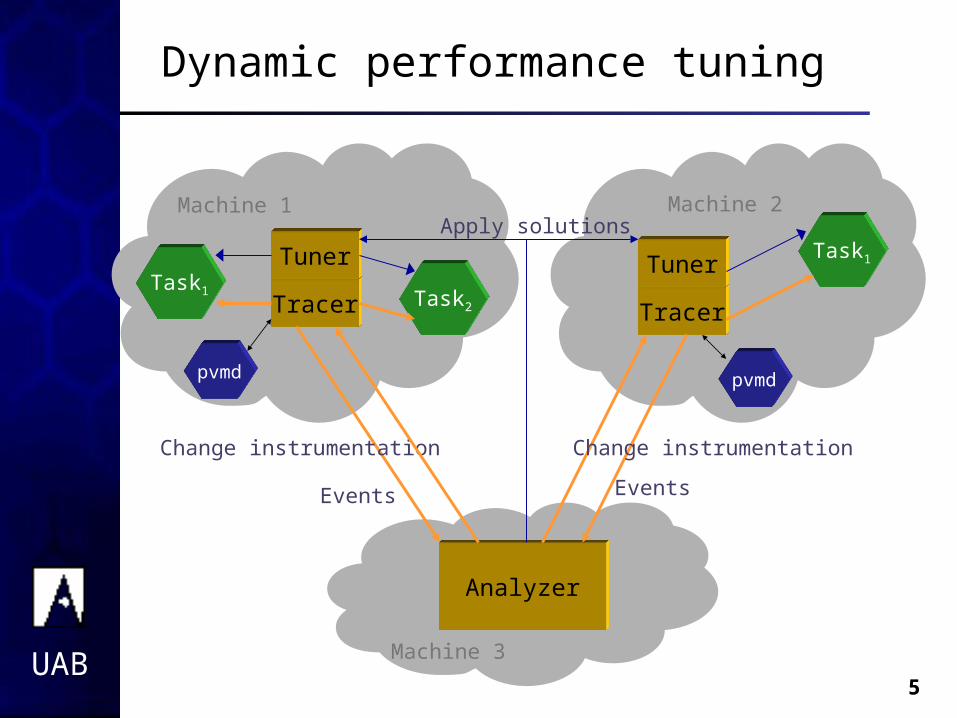
Machine 1 Machine 2
Machine 3
Dynamic performance tuning
Tracer
Tuner
pvmd
Analyzer
Tracer
Tuner
Events
Task1
Task1 Task2
pvmd
Change instrumentation
Events
Change instrumentation
Apply solutions
UAB6
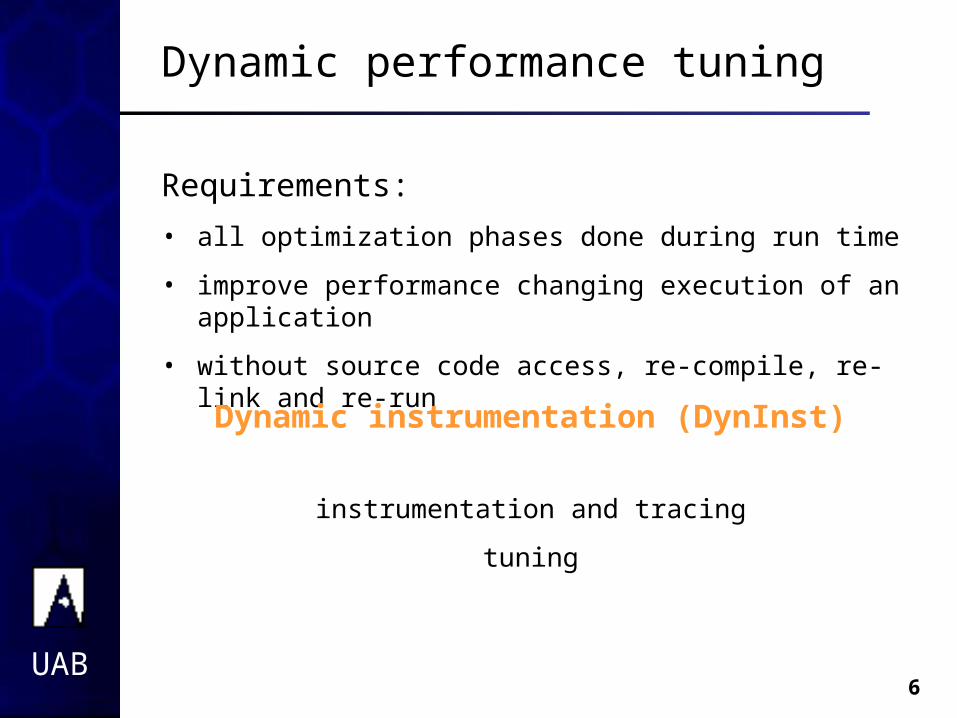
Dynamic performance tuning
Requirements:
• all optimization phases done during run time
• improve performance changing execution of an application
• without source code access, re-compile, re-link and re-run
Dynamic instrumentation (DynInst)
instrumentation and tracing
tuning
UAB7
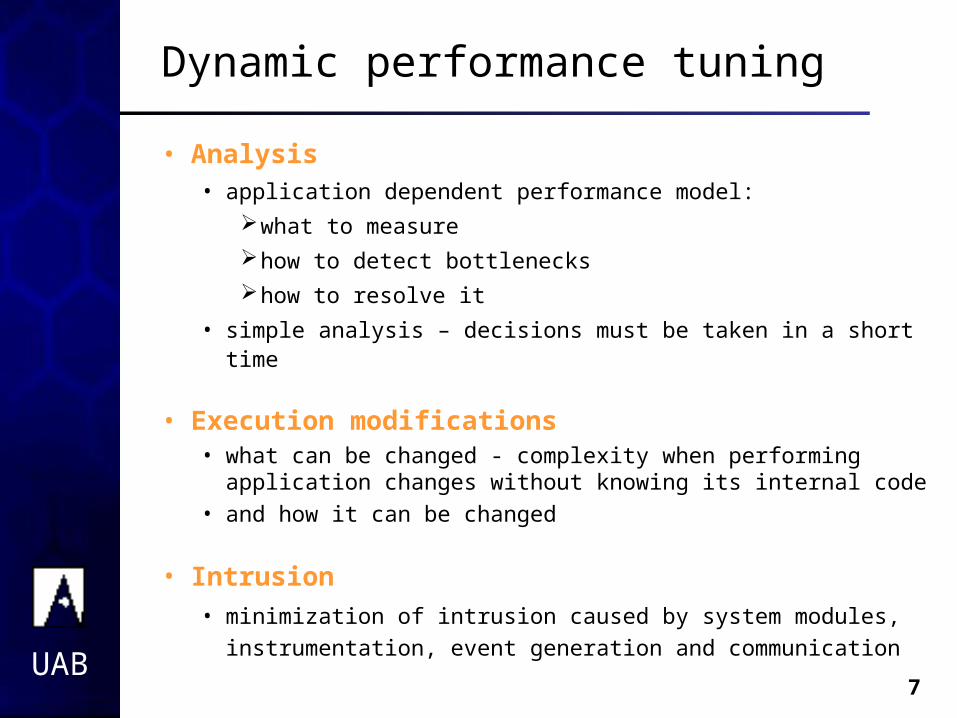
Dynamic performance tuning
• Analysis• application dependent performance model:
what to measure
how to detect bottlenecks
how to resolve it
• simple analysis – decisions must be taken in a short time
• Execution modifications• what can be changed - complexity when performing
application changes without knowing its internal code• and how it can be changed
• Intrusion
• minimization of intrusion caused by system modules,
instrumentation, event generation and communication
UAB8
Content
• Our goals - dynamic performance tuning
• Steering loop
Dynamic tracing
Performance analysis
Dynamic tuning
• DynInst
• Application development framework
• Conclusions and future work

UAB9
Dynamic tracer
Goals of the dynamic tracing tool:
• control of the distributed application
• application instrumentation management
• event generation
• intrusion minimization
• portability and extensibility
Version:• implementation in C++ for PVM based applications• Sun Solaris 2.x / SPARC

UAB10
Dynamic tracer
Distributed application control:
• Process control with PVM Tasker service
• VM control with Hoster service
• Master tracer / Slave tracers
• Clock synchronization(event timestamp with global order)
Machine 2SlaveTracer
pvmd
Task2 Task3
Machine 1
Task1
MasterTracer
pvmd
Machine 3
SlaveTracer
Task4
pvmd

UAB11
Dynamic tracer
Application instrumentation management:
• Instrumentation
• inserted into a set of selected functions (configurable)
• this set can be changed during execution (insert, remove)
• Different snippets:
• Event generation (function entry, exit)
• Line number information(function call points)
• Snippets call tracing library dynamically loaded into a running task
Machine N
Tracer
liblib
Task2
Task1
Config
UAB12
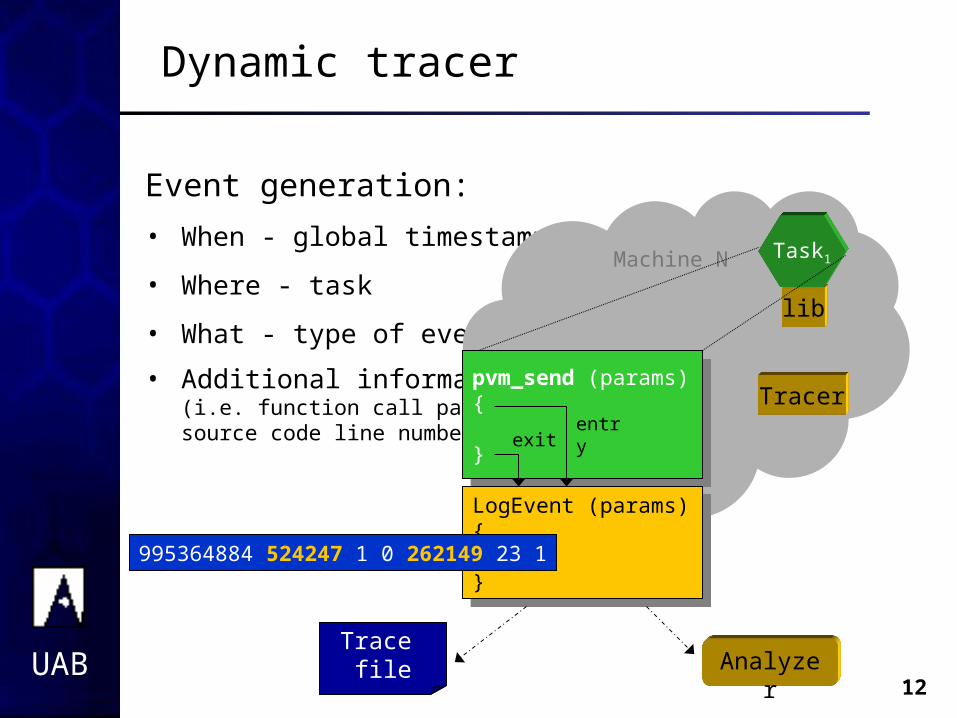
Dynamic tracer
Event generation:
• When - global timestamp
• Where - task
• What - type of event
• Additional information(i.e. function call params,source code line number)
Machine N
Tracer
lib
Task1
pvm_send (params){
}
pvm_send (params){
}
LogEvent (params){ ...}
LogEvent (params){ ...}
995364884 524247 1 0 262149 23 1
Trace file Analyzer
entryexit
UAB14
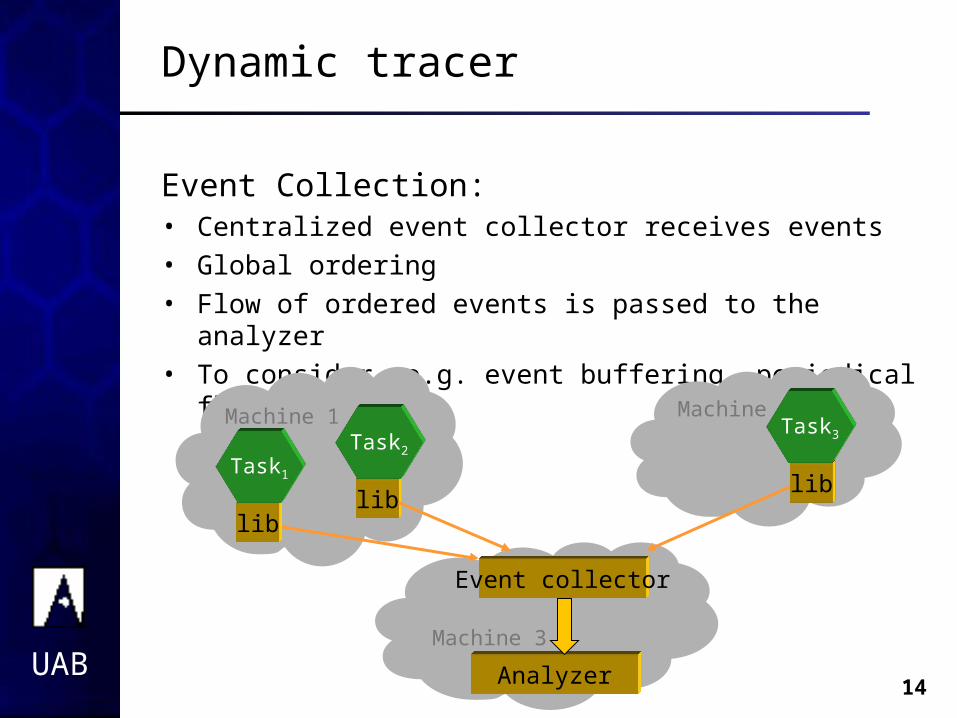
Dynamic tracer
Event Collection:• Centralized event collector receives events • Global ordering• Flow of ordered events is passed to the analyzer• To consider, e.g. event buffering, periodical flush
Machine 3
Machine 1 Machine 2
lib
Task1
lib
Task2
lib
Task3
Event collector
Analyzer

UAB15
Performance analysis
Clue questions:• What should/should not happen during execution
(what kind of problems, performance bottlenecks)?
• What events are needed (what should be collected to help discover what really happened)?
• How to deduce what really happened (finding bottlenecks and causes)?
• How to improve performance (finding solutions)?
UAB16
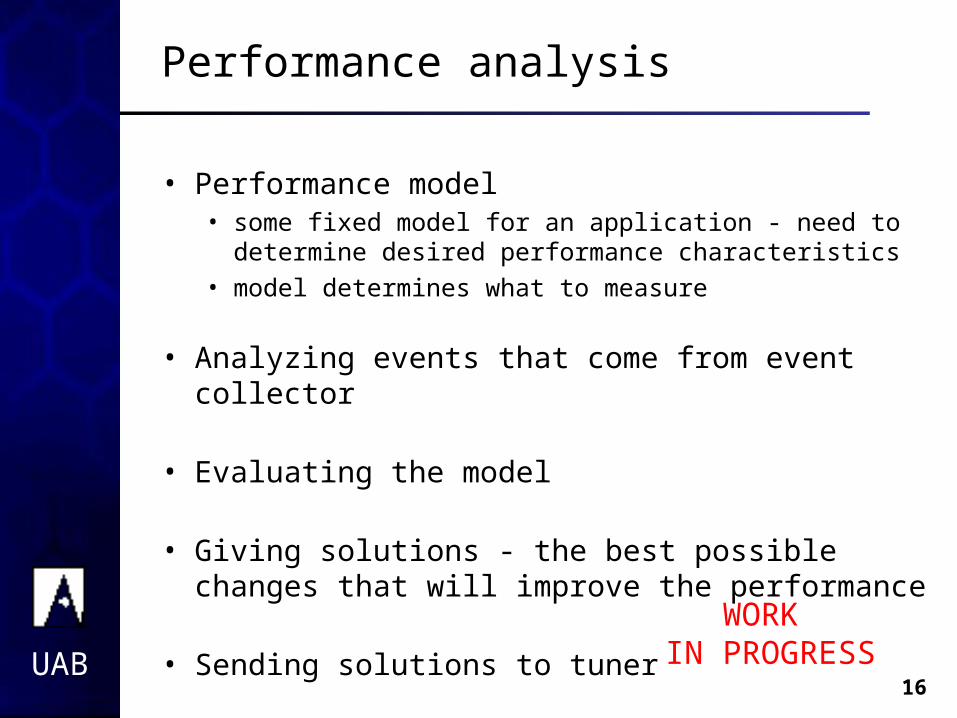
Performance analysis
• Performance model • some fixed model for an application - need to determine
desired performance characteristics• model determines what to measure
• Analyzing events that come from event collector
• Evaluating the model
• Giving solutions - the best possible changes that will improve the performance
• Sending solutions to tuner
WORK IN PROGRESS

UAB17
Dynamic tuning
What can be changed?• parameters: changing parameter value
• application contains well-known variables• application is prepared for changes
• set of pre-defined snippets• choosing strategy – function replacement• changing order of functions
• dynamic snippet creation• it depends on the solutions generated by analyzer• very difficult
Tested
In progress
Future
UAB18
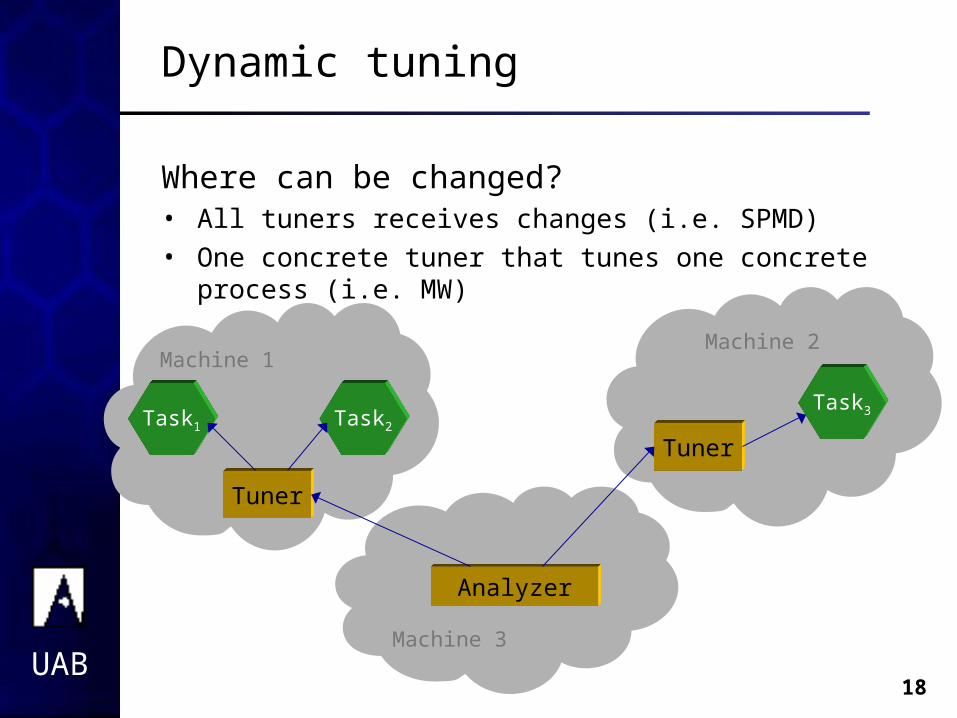
Dynamic tuning
Machine 3
Machine 1Machine 2
Task1 Task2
Task3
Analyzer
Tuner
Tuner
Where can be changed?• All tuners receives changes (i.e. SPMD)• One concrete tuner that tunes one concrete process (i.e. MW)
UAB19
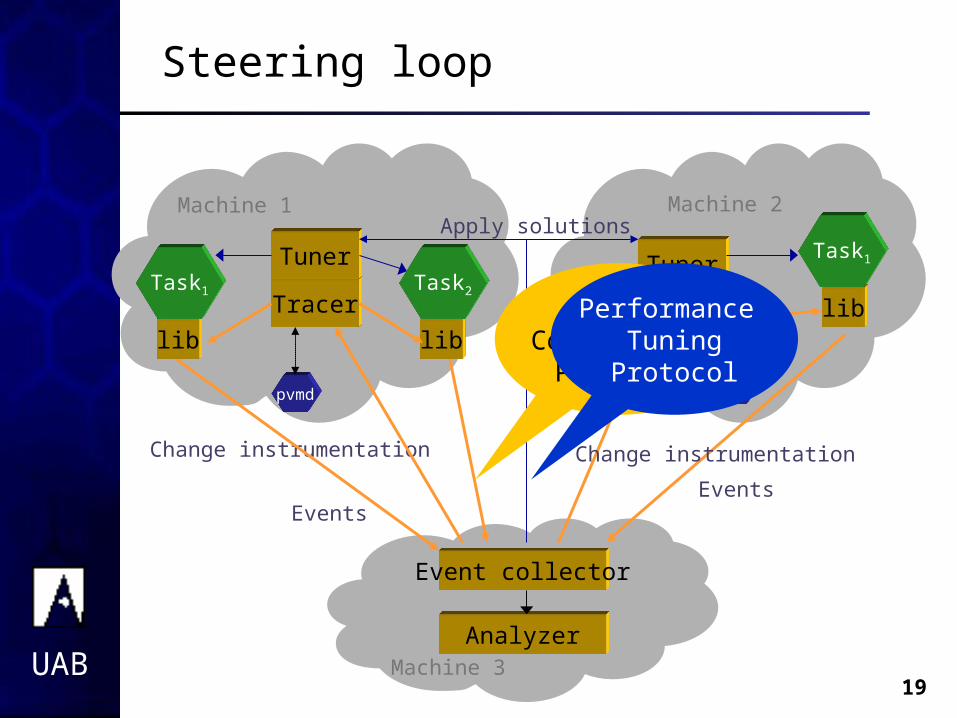
Steering loop
Machine 3
Machine 1
Tracer
Tuner
pvmd
Machine 2
Event collector
Events
Apply solutions
Change instrumentation
Tracer
Tuner
Events
Change instrumentation
lib
Task1
lib
Task2
Analyzer
pvmd
lib
Task1
Event Collection Protocol
Performance Tuning
Protocol
UAB22
Content
• Our goals - dynamic performance tuning
• Steering loop
Dynamic tracing
Performance analysis
Dynamic tuning
• DynInst
• Application development framework
• Conclusions and future work
UAB23
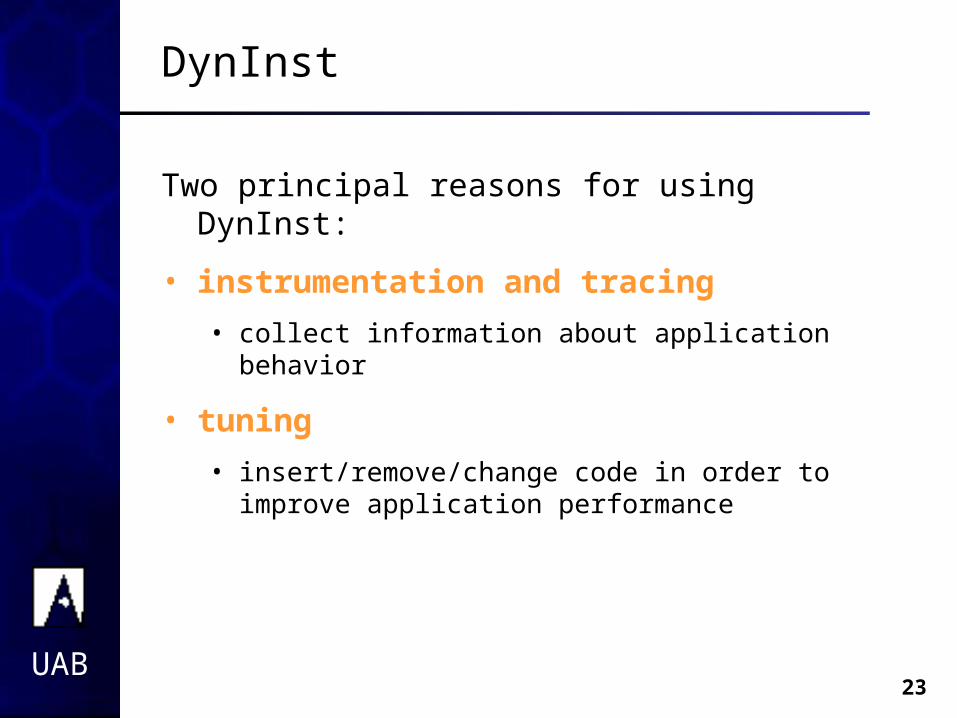
DynInst
Two principal reasons for using DynInst:
• instrumentation and tracing
• collect information about application behavior
• tuning
• insert/remove/change code in order to improve application performance
UAB24
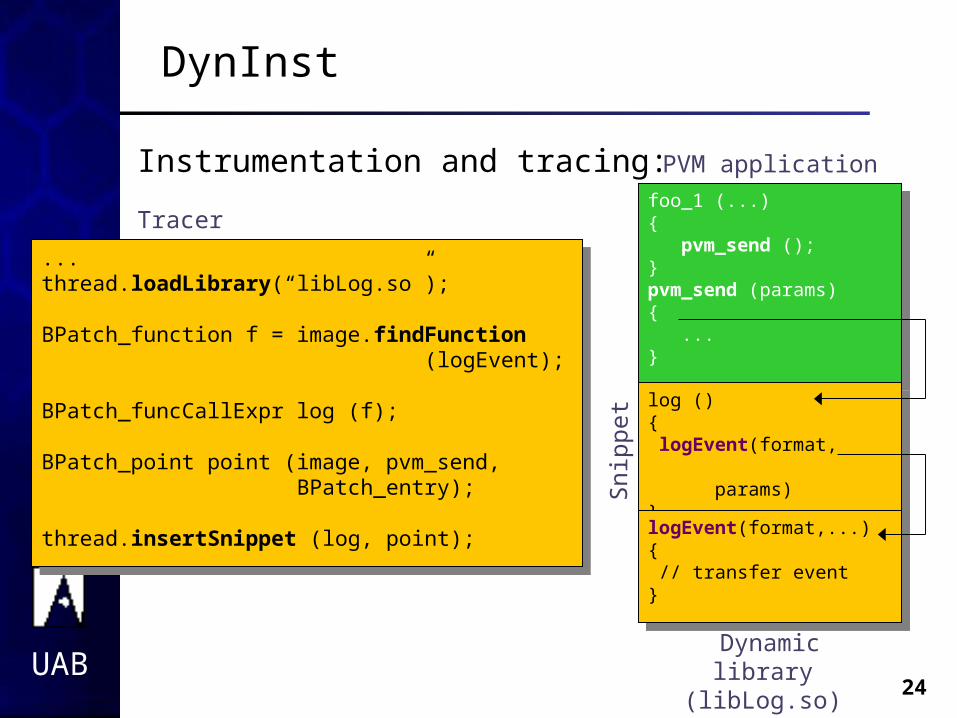
DynInst
Instrumentation and tracing:foo_1 (...){ pvm_send ();}pvm_send (params){ ...}
foo_1 (...){ pvm_send ();}pvm_send (params){ ...}
Tracer
...thread.loadLibrary(“libLog.so”);
BPatch_function f = image.findFunction (logEvent);
BPatch_funcCallExpr log (f);
BPatch_point point (image, pvm_send, BPatch_entry);
thread.insertSnippet (log, point);
...thread.loadLibrary(“libLog.so”);
BPatch_function f = image.findFunction (logEvent);
BPatch_funcCallExpr log (f);
BPatch_point point (image, pvm_send, BPatch_entry);
thread.insertSnippet (log, point);
Dynamic library (libLog.so)
PVM application
Sni
ppet log ()
{ logEvent(format, params)}
log (){ logEvent(format, params)}logEvent(format,...){ // transfer event}
logEvent(format,...){ // transfer event}
UAB25
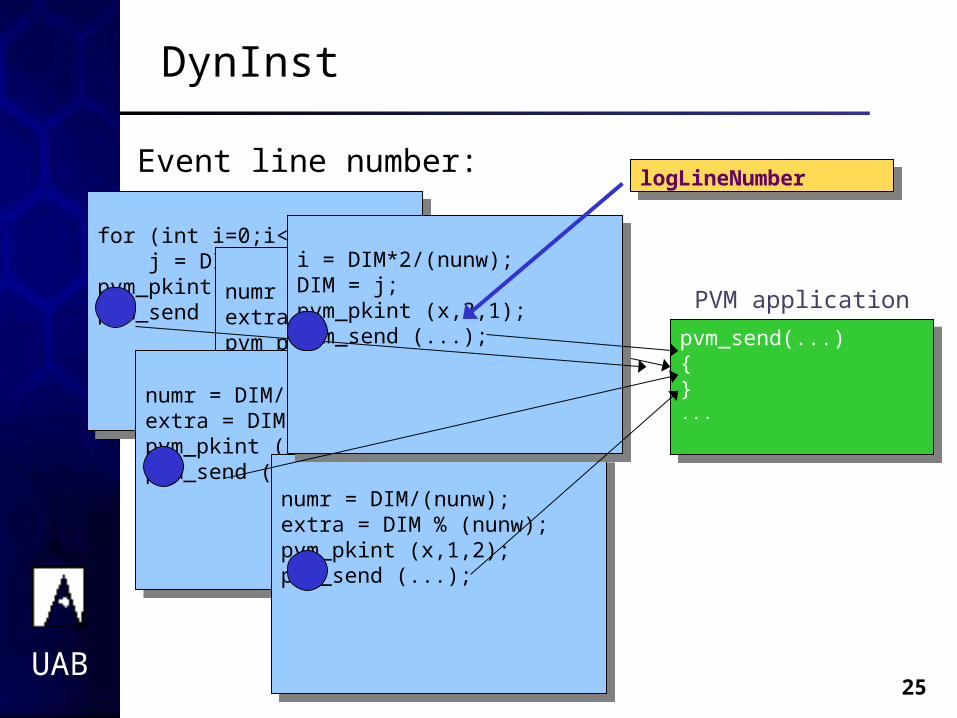
for (int i=0;i<100;i++) j = DIM % (nunw);pvm_pkint (x,1,2); pvm_send (...);
for (int i=0;i<100;i++) j = DIM % (nunw);pvm_pkint (x,1,2); pvm_send (...);
numr = DIM/(nunw);extra = DIM % (nunw);pvm_pkint (x,1,2); pvm_send (...);
numr = DIM/(nunw);extra = DIM % (nunw);pvm_pkint (x,1,2); pvm_send (...);
numr = DIM/(nunw);extra = DIM % (nunw);pvm_pkint (x,1,2); pvm_send (...);
numr = DIM/(nunw);extra = DIM % (nunw);pvm_pkint (x,1,2); pvm_send (...);
numr = DIM/(nunw);extra = DIM % (nunw);pvm_pkint (x,1,2); pvm_send (...);
numr = DIM/(nunw);extra = DIM % (nunw);pvm_pkint (x,1,2); pvm_send (...);
i = DIM*2/(nunw);DIM = j;pvm_pkint (x,3,1); pvm_send (...);
i = DIM*2/(nunw);DIM = j;pvm_pkint (x,3,1); pvm_send (...);
DynInst
Event line number:
PVM application
pvm_send(...){}...
pvm_send(...){}...
logLineNumber logLineNumber
UAB26
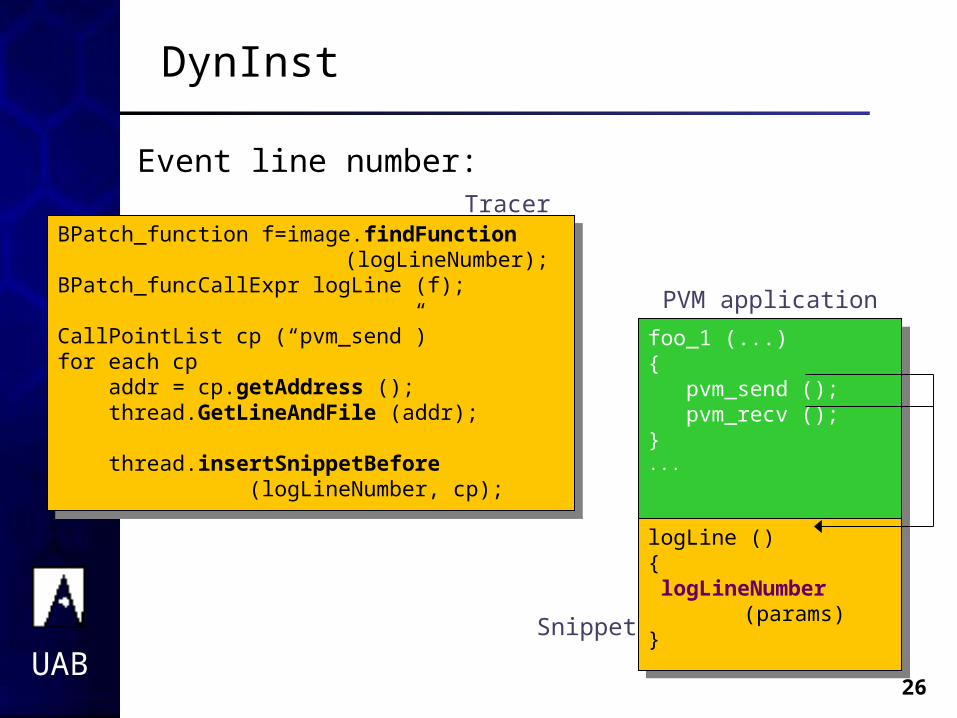
DynInst
Event line number:Tracer
BPatch_function f=image.findFunction (logLineNumber);
BPatch_funcCallExpr logLine (f);
CallPointList cp (“pvm_send”)for each cp addr = cp.getAddress (); thread.GetLineAndFile (addr); thread.insertSnippetBefore
(logLineNumber, cp);
BPatch_function f=image.findFunction (logLineNumber);
BPatch_funcCallExpr logLine (f);
CallPointList cp (“pvm_send”)for each cp addr = cp.getAddress (); thread.GetLineAndFile (addr); thread.insertSnippetBefore
(logLineNumber, cp);
PVM application
Snippet
foo_1 (...){ pvm_send (); pvm_recv ();}...
foo_1 (...){ pvm_send (); pvm_recv ();}...
logLine (){ logLineNumber
(params)}
logLine (){ logLineNumber
(params)}
UAB27
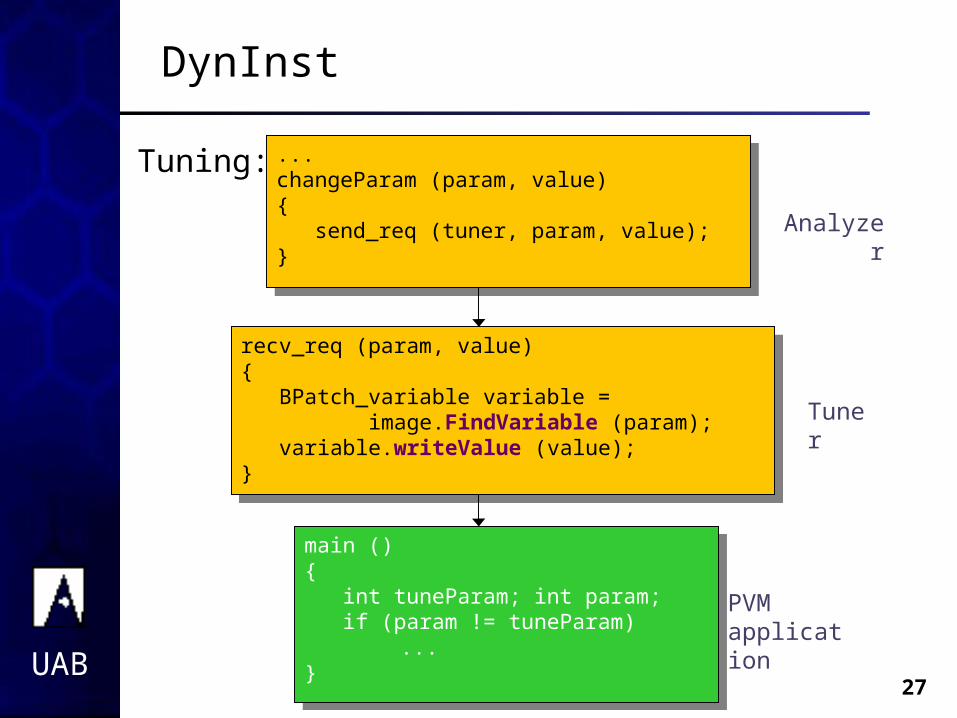
DynInst
Tuning:
recv_req (param, value){ BPatch_variable variable = image.FindVariable (param); variable.writeValue (value);}
recv_req (param, value){ BPatch_variable variable = image.FindVariable (param); variable.writeValue (value);}
...changeParam (param, value){ send_req (tuner, param, value);}
...changeParam (param, value){ send_req (tuner, param, value);}
main (){ int tuneParam; int param; if (param != tuneParam)
... }
main (){ int tuneParam; int param; if (param != tuneParam)
... }
Tuner
PVM application
Analyzer
UAB28
DynInst
Problems when using DynInst:
• Line number
• We need to scan all functions to be instrumented and additionally instrument them (before execution)
• Insert snippet that logs line number (before function call)
• Could be nice to access callee address (call stack??)
• Limited number of parameters that can be passed to library function call (max. 5 for Sun Solaris)
• Problems with scanning function call points (e.g. C++ mutatee with operator<<, function sleep)
• BPatch_function::findPoint (subroutine)
• BPatch_point::getCalledFunction ()
UAB29
Content
• Our goals - dynamic performance tuning
• Steering loop
Dynamic tracing
Performance analysis
Dynamic tuning
• DynInst
• Application development framework
• Conclusions and future work
UAB30
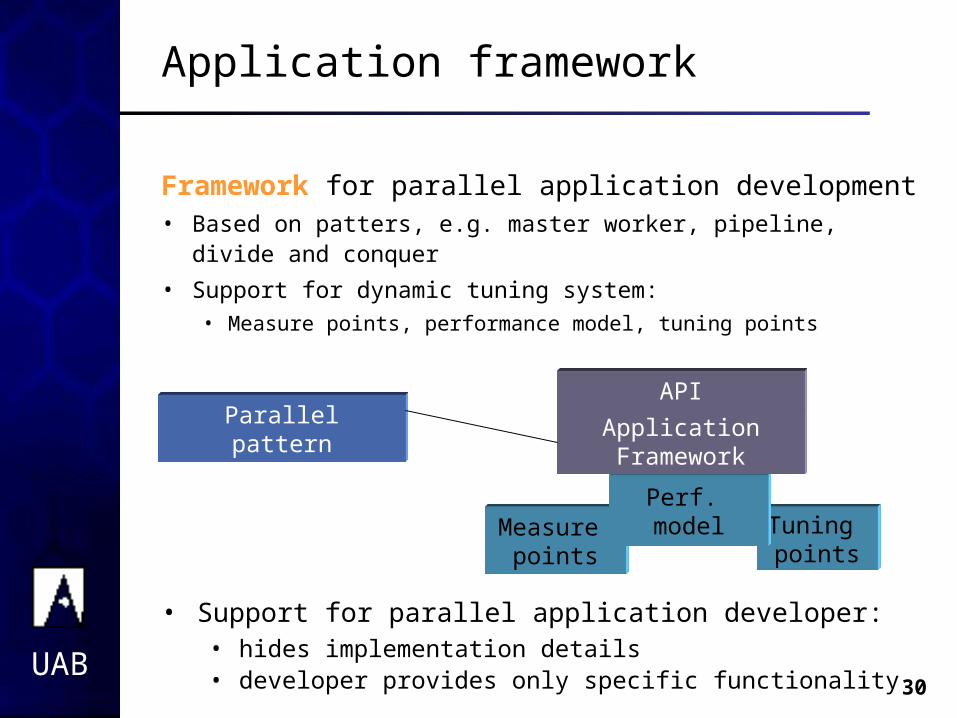
Application framework
Measure points
Tuning points
Perf. model
Application Framework
APIParallel pattern
Framework for parallel application development • Based on patters, e.g. master worker, pipeline, divide and
conquer
• Support for dynamic tuning system:• Measure points, performance model, tuning points
• Support for parallel application developer:• hides implementation details• developer provides only specific functionality
UAB31
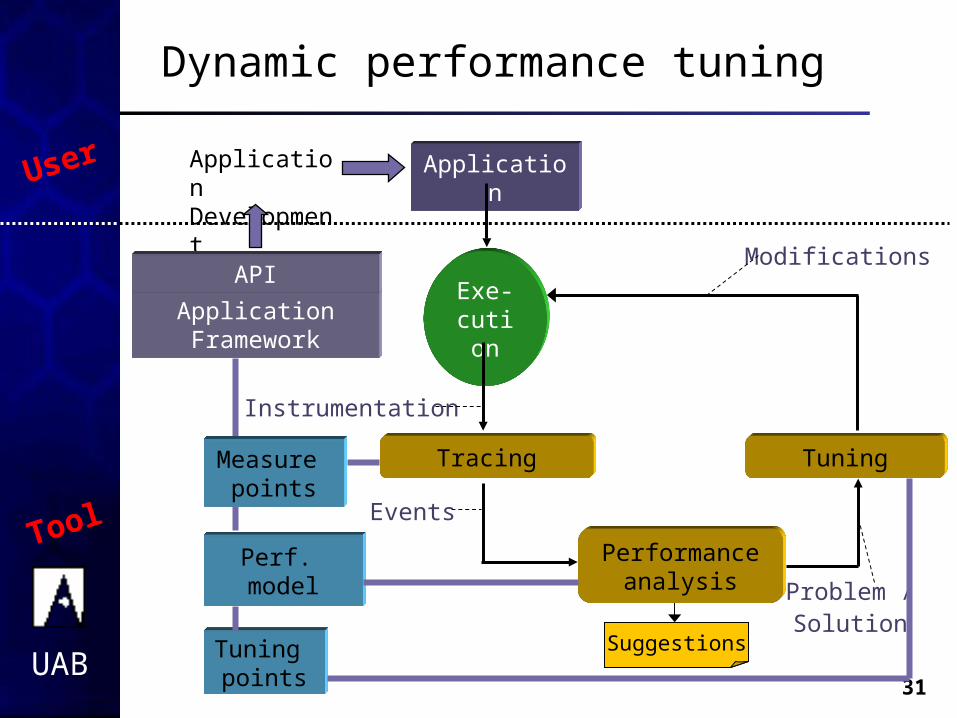
Dynamic performance tuning
Suggestions
ApplicationUser
TuningTracing
Exe-cutio
n
Tool
SolutionProblem /
Events
ApplicationDevelopment
Performance analysis
Modifications
Instrumentation
Application Framework
API
Measure points
Tuning points
Perf. model
UAB32
Content
• Our goals - dynamic performance tuning
• Steering loop
Dynamic tracing
Performance analysis
Dynamic tuning
• DynInst
• Application development framework
• Conclusions and future work
UAB33
Conclusions
• Dynamic tuning
• Design of dynamic tuning tool
• Characteristics
• Steering loop
• Design details
• Implementation of dynamic tracer
• Bases of performance analysis
• Tuning methods
• How we use DynInst
• Parallel application development framework
UAB34
Future work
• Tracer
• event buffering, changing instrumentation on demand, performance measurements
• Analyzer
• performance analysis
• Tuner
• other solutions that can be applied when changing???
• Find and analyze more examples of what to measure, how to analyze and what to change

Thank you very Thank you very muchmuch