Dynamic Tracing Tools on ARM/AArch64 platform Tracing Tools on ARM/AArch64 platform Updates and...
63
Dynamic Tracing Tools on ARM/AArch64 platform Updates and Challenges Hiroyuki ISHII Panasonic Corporation
Transcript of Dynamic Tracing Tools on ARM/AArch64 platform Tracing Tools on ARM/AArch64 platform Updates and...

Dynamic Tracing Tools onARM/AArch64 platformUpdates and Challenges
Hiroyuki ISHII
Panasonic Corporation

Hiroyuki ISHII
Panasonic Corporation, Automotive section, Japan
Linux engineer
Recent work:
Linux debugging tools
Previous work:
Linux kernel engineer
Bootloader: U-Boot, arm-trusted-firmware
2

This Talk
Aim: to promote the Dynamic Tracing Tools in Embedded
Introduction of the Dynamic Tracing Capability & Tools
Including recent updates
A Porting Example of the Dynamic Tracing Tool to AArch64
3

Panasonic IVI Products
Panasonic is a Tier-1 IVI* supplier for various OEMs
Largest IVI supplier in the world [*]In-Vehicle-Infortainment
Using Linux on ARM CPU in several IVI products
4

Current IVI System Development
IVI system is getting much larger & much more complex
Navigation, Voice recognition, Multimedia streaming & ripping
Database, Networking, Connectivity
Security, Fastboot, Update management ...
Trying to use the latest hardware & various open source
ARMv8 64bit (aka AArch64) & Linux 4.x (will be in product in near future)
Hundreds of open source components
"Tens of million lines" of unfamiliar source code
Consisting of open source and In-house code
Terribly complexed debugging - Tons of unknown issues5

Q. How can we debug "Tens of million lines" ofunfamiliar source code?
6

Q. How can we debug "Tens of million lines" ofunfamiliar source code?
A. Dynamic Tracing
7

What's Dynamic Tracing?
A way of watching every function (w/o few exeptions), at anytime
"Dynamic"
Attach to a live system
No precaution (pre-editing code)
Flexible & ad-hoc
"Tracing"
Ovserve system/program behavior
Monitor a particular function
Profiling
Function call history
http://www.brendangregg.com/perf.html 8

Dynamic Tracing in Embedded
Why now?
Linux 4.x: powerful tracing capabilities
kprobes for AArch64, BPF - mainlined
uprobes for AArch64 - almost ready to merge
Dynamic Tracing Tools
Improve in past 2-3 years, by supporting BPF etc.
What are the Advantages?
Advanced Observability
Break down the issues quickly & clearly
Less Installation Cost
No need to change the product code
9

Dynamic Tracing Capability
10

Linux Observability Tools - Traditional and New
11

Linux Observability Tools - Traditional and New
DynamicTracing
Tools
12

Linux Dynamic Tracing Frameworks
Dynamic tracing tools works thanks to the various tracingframeworks
tracepoints - Statically defined tracing
kprobes - Kernel dynamic probing
uprobes - User space dynamic probing
ftrace - Kernel function tracing
perf_events - Hardware event tracing & sampling
BPF - In-kernel Virtual Machine, Trace data processing
Summarize
Efficient data transfer
Makes many things practical
13

Type of Dynamic Tracing Tools
1. Programable multi-tool - SystemTap, bcc, ply
Provides a programable framework for tracing
Bundled scripts as individual analyzing tools
2. NOT programable multi-tool - perf
All-in-one tracing tool
Use with command line arguments
3. Single-purpose tools - perf-tools
A group of individual analyzing tools
14

Dynamic Tracing Tools (example: perf-tools)
15

Dynamic Tracing Tools (example: bcc)
16

Dynamic Tracing Usage
17

opensnoop
Trace open() syscalls - prints all the file-open events
$ ./opensnoop
PID COMM FD ERR PATH
8550 gcc 3 0 /lib/x86_64-linux-gnu/libz.so.1
8550 gcc -1 2 /home/foobar/local/lib/libc.so.6
8550 gcc 3 0 /lib/x86_64-linux-gnu/libc.so.6
8550 gcc -1 2 /etc/ccache.conf
8550 gcc 3 0 /home/foobar/.ccache/ccache.conf
8550 gcc 4 0 /home/foobar/.ccache/f/stats
8550 gcc 4 0 /home/foobar/.ccache/f/stats.tmp.foobar.8550.t8HMvp
8550 gcc -1 2 /home/foobar/local/lib/tls/x86_64/libc.so.6
8550 gcc -1 2 /home/foobar/local/lib/tls/libc.so.6
8550 gcc -1 2 /home/foobar/local/lib/x86_64/libc.so.6
8550 gcc -1 2 /home/foobar/local/lib/libc.so.6
8550 gcc 4 0 /etc/ld.so.cache
8550 gcc 4 0 /lib/x86_64-linux-gnu/libc.so.6
8550 gcc 4 0 /usr/lib/locale/locale-archive
8535 configure 3 0 configure.log
[...]
18

execsnoop
Trace new processes via exec() syscalls
$ ./execsnoop
PCOMM PID PPID RET ARGS
gcc 8550 8535 0 /home/foobar/.ccache/bin/gcc -v
gcc 8550 8535 0 /usr/bin/gcc -v
cat 8551 8535 0 /bin/cat ztest8535.c
gcc 8552 8535 0 /home/foobar/.ccache/bin/gcc -c ztest8535.c
gcc 8553 8552 0 /usr/bin/gcc -E ztest8535.c
cc1 8554 8553 0 /usr/lib/gcc/x86_64-linux-gnu/5/cc1 -E -quiet -imultiarch x86_64-linux-gnu
ztest8535.c -mtune=generic -march=x86-64 -fstack-protector-strong -Wformat
-Wformat-security
gcc 8555 8552 0 /usr/bin/gcc -c -o ztest8535.o /home/ishii/.ccache/tmp/ztest8535.stdout.foo
bar.8552.KMn6Zr.i
cc1 8556 8555 0 /usr/lib/gcc/x86_64-linux-gnu/5/cc1 -fpreprocessed /home/foobar/.ccache/tmp
/ztest8535.stdout.foobar.8552.KMn6Zr.i -quiet -dumpbase ztest8535.stdout.fo
obar.8552.KMn6Zr.i -mtune=generic -march=x86-64 -auxbase-strip ztest8535.o
-fstack-protector-strong -Wformat -Wformat-security -o /tmp/cc8HaudQ.s
gcc 8557 8555 -2 /home/foobar/.ccache/bin/as --64 -o ztest8535.o /tmp/cc8HaudQ.s
as 8557 8555 0 /home/foobar/local/bin/as --64 -o ztest8535.o /tmp/cc8HaudQ.s
19

biosnoop
Trace block device I/O with PID and latency
$ ./biosnoop
TIME(s) COMM PID DISK T SECTOR BYTES LAT(ms)
0.000000000 jbd2/sda1-8 253 sda W 969250944 86016 0.33
0.017384000 jbd2/sda1-8 253 sda W 969251112 4096 0.12
2.755776000 jbd2/sda3-8 564 sda W 2911149624 8192 0.13
2.766396000 jbd2/sda3-8 564 sda W 2911149640 4096 0.11
3.779816000 kworker/u16:3 1879 sda W 1941794816 4096 0.14
3.780044000 kworker/u16:3 1879 sda W 1941794856 4096 0.36
3.780058000 kworker/u16:3 1879 sda W 2080206896 4096 0.37
3.780065000 kworker/u16:3 1879 sda W 2080206976 4096 0.38
3.780073000 kworker/u16:3 1879 sda W 2080207104 4096 0.38
3.780079000 kworker/u16:3 1879 sda W 2080207248 4096 0.39
3.780170000 kworker/u16:3 1879 sda W 2080207376 4096 0.48
3.780204000 kworker/u16:3 1879 sda W 2080207768 4096 0.51
3.780296000 kworker/u16:3 1879 sda W 2080208784 4096 0.60
3.780335000 kworker/u16:3 1879 sda W 2080212720 4096 0.64
3.780389000 kworker/u16:3 1879 sda W 2080276848 4096 0.69
3.780497000 kworker/u16:3 1879 sda W 2138928736 4096 0.80
4.011546000 bash 26308 sda W 382200192 4096 0.11
20

funcgraph
Kernel function call graph & durations
$ ./funcgraph -a -m 3 do_sys_open
Tracing "do_sys_open"... Ctrl-C to end.
# tracer: function_graph
#
# TIME CPU TASK/PID DURATION FUNCTION CALLS
# | | | | | | | | | |
28554.134852 | 6) cat-26389 | | do_sys_open() {
28554.134854 | 6) cat-26389 | | getname() {
28554.134854 | 6) cat-26389 | 0.342 us | getname_flags();
28554.134855 | 6) cat-26389 | 1.062 us | }
28554.134855 | 6) cat-26389 | | get_unused_fd_flags() {
28554.134856 | 6) cat-26389 | 0.580 us | __alloc_fd();
28554.134857 | 6) cat-26389 | 1.068 us | }
28554.134857 | 6) cat-26389 | | do_filp_open() {
28554.134857 | 6) cat-26389 | 5.956 us | path_openat();
28554.134864 | 6) cat-26389 | 0.098 us | restore_nameidata();
28554.134864 | 6) cat-26389 | 7.117 us | }
28554.134865 | 6) cat-26389 | | put_unused_fd() {
28554.134865 | 6) cat-26389 | 0.054 us | _raw_spin_lock();
21

funccount
Count kernel & user function calls
$ ./funccount '/bin/bash:set*'
Tracing 49 functions for "/bin/bash:set*"... Hit Ctrl-C to end.
C
FUNC COUNT
set_working_directory 1
set_or_show_attributes 9
set_var_attribute 9
set_signal 31
set_debug_trap 31
set_dollar_vars_unchanged 73
set_shellopts 91
set_sigint_handler 104
set_dollar_vars_changed 146
set_sigchld_handler 195
setifs 223
set_current_prompt_level 271
set_pipestatus_from_exit 633
set_pipestatus_array 708
set_signal_handler 1789
22

trace
Trace arbitrary functions with filters
$ ./trace 'sys_read (arg3 > 20000) "read %d bytes", arg3'
PID TID COMM FUNC -
4136 4136 bash sys_read read 306218 bytes
32359 32359 cat sys_read read 131072 bytes
32361 32361 grep sys_read read 32768 bytes
$ ./trace 'r:bash:readline "%s", retval'
PID TID COMM FUNC -
26308 26308 bash readline cd ~
26308 26308 bash readline ls
26308 26308 bash readline echo $PATH
23

Flame Graph
http://www.brendangregg.com/ktap.html 24

Many Other Useful Tools...
capable: Trace security capability checks
biolatency: Summarize block device I/O latency
biotop: Top for disks
filetop: File reads and writes by filename and process
ext4slower: Trace slow ext4 operations
cachestat: Trace page cache hit/miss ratio
argdist: Display function parameter values as a histogram
see: https://github.com/iovisor/bcc
25

Dynamic Tracing Tools
Summary and Recent Updates
26

perf-tools
https://github.com/brendangregg/perf-tools
Single-Purpose Observability Tools (Closed?)
Pros
Few dependencies
Cons
Direct dependency on intel architecuture
Less customizable
27

perf-tools - Script[...]
echo nop > current_tracer
ver=$(uname -r)
if [[ "$ver" == 2.* || "$ver" == 3.[1-6].* ]]; then
# rval is char * kprobe='r:getnameprobe getname +0($retval):string'
else
# rval is struct filename * kprobe='r:getnameprobe getname +0(+0($retval)):string'
fi
if ! echo $kprobe >> kprobe_events; then
edie "ERROR: adding a kprobe for getname(). Exiting."
fi
if (( opt_pid )); then
if ! echo "common_pid==$pid" > events/kprobes/getnameprobe/filter || \
! echo "common_pid==$pid" > events/syscalls/sys_exit_open/filter
then
edie "ERROR: setting -p $pid. Exiting."
fi
fi
if ! echo 1 > events/kprobes/getnameprobe/enable; then
edie "ERROR: enabling kprobe for getname(). Exiting."
fi
if ! echo 1 > events/syscalls/sys_exit_open/enable; then
edie "ERROR: enabling open() exit tracepoint. Exiting."
fi
(( opt_time )) && printf "%-16s " "TIMEs"
printf "%-16.16s %-6s %4s %s\n" "COMM" "PID" "FD" "FILE"
offset=$($awk 'BEGIN { o = 0; }
$1 == "#" && $2 ~ /TASK/ && NF == 6 { o = 1; }
$2 ~ /TASK/ { print o; exit }' trace)
warn "echo > trace"
( if (( opt_duration )); then
# wait then dump buffer sleep $duration
cat trace
else
# print buffer live cat trace_pipe
fi ) | $awk -v o=$offset -v opt_name=$opt_name -v name=$name \
-v opt_duration=$opt_duration -v opt_time=$opt_time \
-v opt_fail=$opt_fail \
-v opt_file=$opt_file -v file=$file '
# common fields
$1 != "#" {
# task name can contain dashes and space
split($0, line, "-")
sub(/[ \t\r\n]+/, "", line[1])
comm = line[1]
if (opt_name && match(comm, name) == 0)
next
sub(/ .*$/, "", line[2])
pid = line[2]
}'
[...]
opensnoop 55/255 lines; Written by Brendan Gregg, GPLv228

SystemTap
https://sourceware.org/systemtap/
Powerful Multi-Tool with Nice Language
Pros
High-level, Less-arch-dependent, easy to understand language
Ready for AArch64, basically
Cons
Takes long time before running a script
Relatively unsafe
Both cons might be fixed with BPF support?
29

SystemTap - Script
#!/usr/bin/stap
probe begin
{
printf("%6s %6s %16s %4s %s\n", "UID", "PID", "COMM", "FD", "PATH");
}
probe nd_syscall.open.return
{
/* trace on return to ensure the pathname has faulted in */
printf("%6d %6d %16s %4d %s\n", uid(), pid(), execname(),
returnval(), user_string(@entry(pointer_arg(1)), "-"));
}
opensnoop-nd.stp; Written by Brendan Gregg, GPLv2
30

bcc
https://github.com/iovisor/bcc
Promissing BPF Front-end Tool, under active development
Pros
Low overhead & Extra capabilities, thanks to BPF
Python / Lua / Go / C++ front-end support
Many useful scripts
Cons
Lower level language
Direct dependency on intel architecuture
31

bcc - Script
from __future__ import print_function
from bcc import BPF
from time import sleep
b = BPF(text="""
#include "uapi/linux/ptrace.h"
struct key_t {
u64 ip;
};
BPF_TABLE("hash", struct key_t, u64, counts, 256);
int do_count(struct pt_regs *ctx) {
struct key_t key = {};
u64 zero = 0, *val;
key.ip = PT_REGS_IP(ctx);
val = counts.lookup_or_init(&key, &zero);
(*val)++;
return 0;
}
""")
b.attach_kprobe(event_re="vfs_.*", fn_name="do_count")
# header
print("Tracing... Ctrl-C to end.")
# output
try:
sleep(99999999)
except KeyboardInterrupt:
pass
print("\n%-16s %-26s %8s" % ("ADDR", "FUNC", "COUNT"))
counts = b.get_table("counts")
for k, v in sorted(counts.items(), key=lambda counts:
counts[1].value):
print("%-16x %-26s %8d" % (k.ip, b.ksym(k.ip),
v.value))
vfscount; Written by Brendan Gregg, Apache License v2.032

ply
https://github.com/wkz/ply
Upcomming BPF Front-end tool
Pros
Simple, High-level language
BPF support
Cons
Unstable
Development seems relatively slow
AArch64 is not supported yet
33

ply - Script
#!/usr/bin/env ply
kprobe:SyS_*
{
$syscalls[func].count()
}
syscall-count.ply; Available on https://wkz.github.io/ply/
$ ply syscall-count.ply
340 probes active
Cde-activating probes
$syscalls:
sys_nanosleep 1
sys_fdatasync 1
sys_timerfd_settime 1
sys_rt_sigaction 3
sys_alarm 5
sys_mmap 6
[...]
sys_select 309
sys_setitimer 314
sys_close 350
sys_writev 719
sys_write 814
sys_read 1288
sys_ioctl 2577
sys_poll 3977
sys_recvmsg 5540
sys_futex 5056734

perf
https://github.com/torvalds/linux/tree/master/tools/perf
Performance Analyzing Tool, In Linux Source Tree
Pros
Reliable & Ready to use, on many architecture
Advanced capabilities - CPU statics by PMU (Performance Monitoring Unit)
BPF support
Cons
Not much programable
Much key strokes
35

Summary of Tools
ToolProgramable
I/FCapability Overhead
Safety/Stability
CodeChange
BPFAArch64Support
bcc Good Great Low Safe No YesPartially
Yes
SystemTap Great Good High Unsafe No wipPartially
Yes
perf Not Good Good Low-Mid - No Yes Yes
perf-tools Not Good Good Low-Mid - No No No
ply Great Good Low Unstable No Yes No
NOTE: My personal opinion, means no special recomendation
36

Port Dynamic Tracing Tools
to AArch64
37

Port Dynamic Tracing Tools
AArch64-Porting Example of bcc
I'm also trying to port several other tools
Currently available: perf-tools
All patches are put on my github
https://github.com/hiroishii/bcc
https://github.com/hiroishii/perf-tools
38
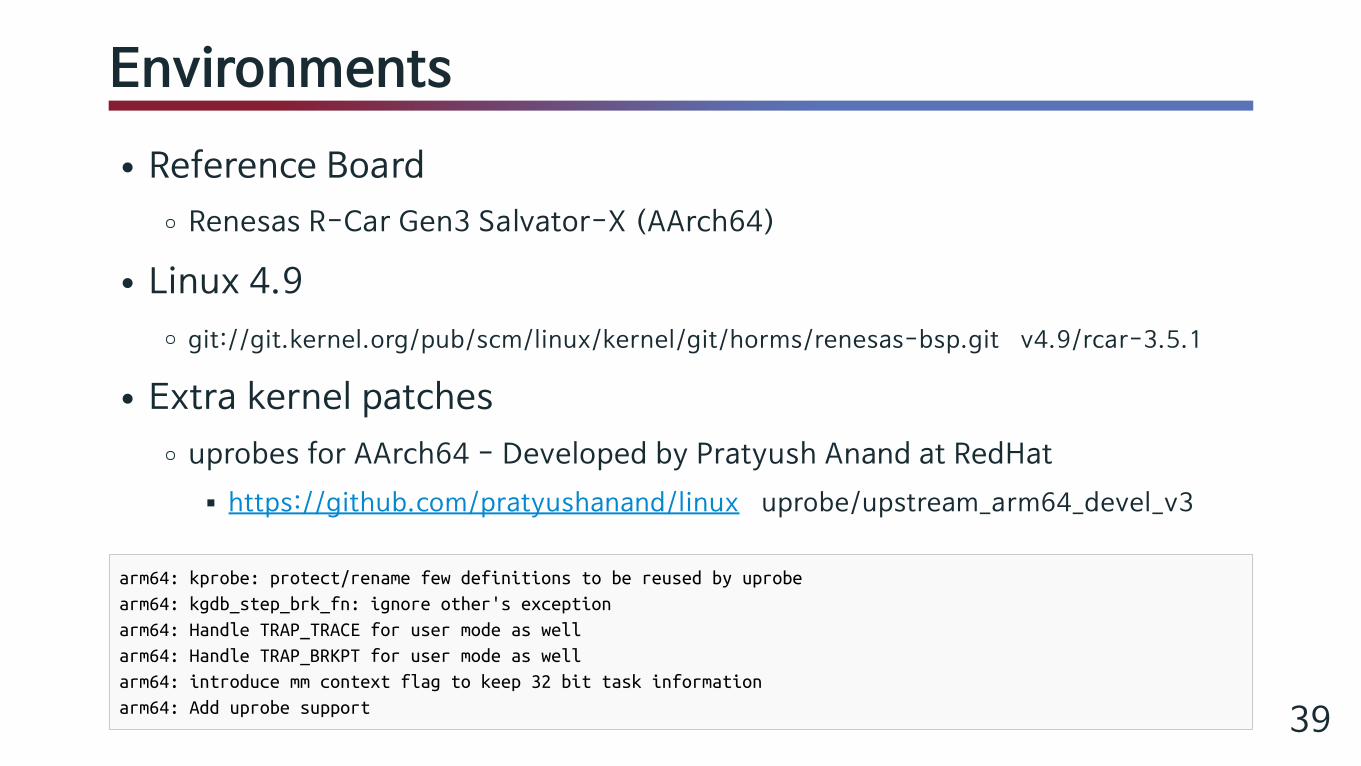
Environments
Reference Board
Renesas R-Car Gen3 Salvator-X (AArch64)
Linux 4.9
git://git.kernel.org/pub/scm/linux/kernel/git/horms/renesas-bsp.git v4.9/rcar-3.5.1
Extra kernel patches
uprobes for AArch64 - Developed by Pratyush Anand at RedHat
https://github.com/pratyushanand/linux uprobe/upstream_arm64_devel_v3
arm64: kprobe: protect/rename few definitions to be reused by uprobe
arm64: kgdb_step_brk_fn: ignore other's exception
arm64: Handle TRAP_TRACE for user mode as well
arm64: Handle TRAP_BRKPT for user mode as well
arm64: introduce mm context flag to keep 32 bit task information
arm64: Add uprobe support 39

Kernel Configs
CONFIG_BPF=y
CONFIG_BPF_JIT=y
CONFIG_BPF_SYSCALL=y
CONFIG_BPF_EVENTS=y
CONFIG_KPROBES=y
CONFIG_KPROBE_EVENT=y
CONFIG_UPROBES=y
CONFIG_UPROBE_EVENT=y
CONFIG_BRANCH_PROFILE_NONE=y
CONFIG_CONTEXT_SWITCH_TRACER=y
CONFIG_DYNAMIC_FTRACE=y
CONFIG_EVENT_TRACING=y
CONFIG_FTRACE=y
CONFIG_FTRACE_MCOUNT_RECORD=y
CONFIG_FTRACE_SYSCALLS=y
CONFIG_FUNCTION_GRAPH_TRACER=y
CONFIG_FUNCTION_PROFILER=y
CONFIG_FUNCTION_TRACER=y
CONFIG_GENERIC_TRACER=y
CONFIG_NOP_TRACER=y
CONFIG_PREEMPT_TRACER=y
CONFIG_RELAY=y
CONFIG_RING_BUFFER=y
CONFIG_RING_BUFFER_ALLOW_SWAP=y
CONFIG_SCHED_TRACER=y
CONFIG_STACKTRACE=y
CONFIG_STACK_TRACER=y
CONFIG_TRACEPOINTS=y
CONFIG_TRACER_MAX_TRACE=y
CONFIG_TRACER_SNAPSHOT=y
CONFIG_TRACER_SNAPSHOT_PER_CPU_SWAP=y
CONFIG_TRACE_CLOCK=y
CONFIG_TRACE_ENUM_MAP_FILE=y
CONFIG_TRACING=y
CONFIG_FRAME_POINTER=y
40

Other Environments
Ubuntu 16.04 host
gcc 5.4.0, make 4.1
cmake 3.7
Cross compiler
gcc v5.2.1 - Linaro Toolchain (aarch64-poky-linux-gcc)
Target userland (AArch64)
Yocto 2.x based
Multilib environment - "lib64" directory for 64bit libraries
Login via serial console, bash 4.3
41

Port bcc
Version
master on github (5 Feb 2017, c510eff)
Dependancies (noteworthy)
llvm/clang
elfutils, flex
python (optional)
42

Port bcc cont.
Porting Steps
Cross-compile llvm/clang
Cross-compile bcc
Fix 1. Multilib support
Fix 2. (Workaround) Module linkage problem
Fix 3. (Workaround) asm macro
Fix 4. Port each script
43

Cross-compile llvm/clang
Version
llvm, clang, compiler-rt version 3.9.1 (branch: release_39)https://github.com/llvm-mirror/llvm.githttps://github.com/llvm-mirror/clang.githttps://github.com/llvm-mirror/compiler-rt.git
44

Cross-compile llvm/clang cont.
Creating directory structure for build
$ git clone https://github.com/llvm-mirror/llvm.git --branch release_39
$ cd ${llvm_root_dir}/tools
$ git clone https://github.com/llvm-mirror/clang.git --branch release_39
$ cd ${llvm_root_dir}/projects
$ git clone https://github.com/llvm-mirror/compiler-rt.git --branch release_39
$ ...: command on the host PC
# ...: command on the target board
Abstructed paths such as ${llvm_root_dir}, ${sysroot}, etc
45

Cross-compile llvm/clang cont.
Build instructions
$ cd ${llvm_root_dir}
$ mkdir build && cd build
$ cmake .. -DCMAKE_CROSSCOMPILING=1 -DCMAKE_SYSROOT=${sysroot} \
-DCMAKE_FIND_ROOT_PATH=${sysroot} -DCMAKE_FIND_ROOT_PATH_MODE_PROGRAM=NEVER \
-DCMAKE_FIND_ROOT_PATH_MODE_LIBRARY=ONLY -DCMAKE_FIND_ROOT_PATH_MODE_INCLUDE=ONLY \
-DCMAKE_INSTALL_PREFIX=${sysroot}/usr -DCMAKE_INSTALL_LIBDIR=lib64 \
-DCMAKE_C_COMPILER=aarch64-poky-linux-gcc -DCMAKE_CXX_COMPILER=aarch64-poky-linux-g++ \
-DCMAKE_C_FLAGS="-mabi=lp64 -march=armv8-a -mtune=cortex-a57.cortex-a53 -Wall --sysroot=${sysroot} \
-DCMAKE_CXX_FLAGS="-mabi=lp64 -march=armv8-a -mtune=cortex-a57.cortex-a53 -Wall --sysroot=${sysroot} -std=c++11" \
-DCMAKE_EXE_LINKER_FLAGS="--sysroot=${sysroot}" -DCMAKE_SHARED_LINKER_FLAGS="--sysroot=${sysroot}" \
-DCMAKE_BUILD_TYPE=Release -DLLVM_TABLEGEN=/home/foobar/local/bin/llvm-tblgen \
-DCLANG_TABLEGEN=/home/foobar/local/bin/clang-tblgen -DLLVM_LIBDIR_SUFFIX=64 \
-DLLVM_DEFAULT_TARGET_TRIPLE=aarch64-unknown-linux-gnu
$ make && make install
TIPS: Recomend not to use the build paralization (might cause an oom error)
46

Cross-compile bcc
Build instructions - Almost same as llvm/clang
$ cd ${bcc_root_dir}
$ mkdir build && cd build
$ cmake .. -DCMAKE_CROSSCOMPILING=1 -DCMAKE_SYSROOT=${sysroot} \
-DCMAKE_FIND_ROOT_PATH=${sysroot} -DCMAKE_FIND_ROOT_PATH_MODE_PROGRAM=NEVER \
-DCMAKE_FIND_ROOT_PATH_MODE_LIBRARY=ONLY -DCMAKE_FIND_ROOT_PATH_MODE_INCLUDE=ONLY \
-DCMAKE_INSTALL_PREFIX=${sysroot}/usr -DCMAKE_INSTALL_LIBDIR=lib64 \
-DCMAKE_C_COMPILER=aarch64-poky-linux-gcc -DCMAKE_CXX_COMPILER=aarch64-poky-linux-g++ \
-DCMAKE_C_FLAGS="-mabi=lp64 -march=armv8-a -mtune=cortex-a57.cortex-a53 -Wall --sysroot=${sysroot} \
-DCMAKE_CXX_FLAGS="-mabi=lp64 -march=armv8-a -mtune=cortex-a57.cortex-a53 -Wall --sysroot=${sysroot} -std=c++11" \
-DCMAKE_EXE_LINKER_FLAGS="--sysroot=${sysroot}" -DCMAKE_SHARED_LINKER_FLAGS="--sysroot=${sysroot}" \
-DMULTILIB_LIB64=ON -DCMAKE_BUILD_TYPE=Release
$ make && make install
47

Port bcc - Fix 1. Multilib Support
Before Fix:
$ cmake .. -DCMAKE_CROSSCOMPILING=1 -DCMAKE_SYSROOT=${sysroot} \
-DCMAKE_FIND_ROOT_PATH=${sysroot} -DCMAKE_FIND_ROOT_PATH_MODE_PROGRAM=NEVER \
[...]
-- Found BISON: /usr/bin/bison (found version "3.0.4")
-- Found FLEX: /usr/bin/flex (found version "2.6.0")
CMake Error at ${sysroot}/usr/lib/cmake/llvm/LLVMExports.cmake:1028 (message):
The imported target "LLVMSupport" references the file
"${sysroot}/usr/lib/libLLVMSupport.a"
[...]
Cause:
Lack of multilib support48

Port bcc - Fix 1. Multilib Support cont.
Fix 1: bcc/CMakeLists.txt
--- a/CMakeLists.txt
+++ b/CMakeLists.txt
@@ -11,6 +11,13 @@ include(cmake/GetGitRevisionDescription.cmake)
include(cmake/version.cmake)
include(GNUInstallDirs)
+option(MULTILIB_LIB64 "use lib64 instead of lib to find library" OFF)
+if(MULTILIB_LIB64)
+ set_property(GLOBAL PROPERTY FIND_LIBRARY_USE_LIB64_PATHS TRUE)
+else()
+ set_property(GLOBAL PROPERTY FIND_LIBRARY_USE_LIB64_PATHS FALSE)
+endif()
+
set(CMAKE_MODULE_PATH ${CMAKE_MODULE_PATH} ${CMAKE_CURRENT_SOURCE_DIR}/cmake)
if(NOT PYTHON_ONLY)
Also need to add -DMULTILIB_LIB64=ON to cmake49

Port bcc - Fix 2. Lack of Module
Before Fix:
# /usr/share/bcc/examples/cpp/HelloWorld
Could not create ExecutionEngine: Interpreter has not been linked in.
bpf: Invalid argument
Failed to load on_sys_clone: -1
Cause:
Lack of the BPF module of clang
It had not built on the llvm/clang's compilation
Also bcc doesn't try to link it (even if it were exist)
50

Port bcc - Fix 2. Lack of Module cont.
Fix 2-1: llvm/clang compilation
Remove LLVM_TARGET_ARCH, LLVM_TARGETS_TO_BUILD option
These options make the BPF module not to be built
Cross compilation still works wellbecause of -DLLVM_DEFAULT_TARGET_TRIPLE=aarch64-unknown-linux-gnu option
51

Port bcc - Fix 2. Lack of Module cont.
Fix 2-2 (workaround): bcc/src/cc/CMakeLists.txt
--- a/src/cc/CMakeLists.txt
+++ b/src/cc/CMakeLists.txt
@@ -56,6 +56,8 @@ endif()
llvm_map_components_to_libnames(llvm_libs ${llvm_raw_libs})
llvm_expand_dependencies(expanded_libs ${llvm_libs})
+set(llvm_raw_libs all)
+
# order is important
set(clang_libs ${libclangFrontend} ${libclangSerialization} ${libclangDriver} ${libclangParse}
${libclangSema} ${libclangCodeGen} ${libclangAnalysis} ${libclangRewrite} ${libclangEdit}
52

Port bcc - Fix 3. asm macro
Before Fix:
# /usr/share/bcc/tools/execsnoop
LLVM ERROR: Inline asm not supported by this streamer because we don't have an asm parser
for this target
Cause:
Inline asm code exists in linux/arch/arm64/include/asm/sysreg.h
Ref: https://www.mail-archive.com/[email protected]/msg00337.html
53

Port bcc - Fix 3. asm macro cont.
Fix 3 (workaround): linux/arch/arm64/include/asm/sysreg.h
--- a/arch/arm64/include/asm/sysreg.h
+++ b/arch/arm64/include/asm/sysreg.h
@@ -239,6 +239,7 @@
#include <linux/types.h>
+#ifndef __clang__
asm(
" .irp num,0,1,2,3,4,5,6,7,8,9,10,11,12,13,14,15,16,17,18,19,20,21,22,23,24,25,26,27,28,29,30\n"
" .equ .L__reg_num_x\\num, \\num\n"
@@ -253,6 +254,7 @@ asm(
" .inst 0xd5000000|(\\sreg)|(.L__reg_num_\\rt)\n"
" .endm\n"
);
+#endif
/*
* Unlike read_cpuid, calls to read_sysreg are never expected to be
54

Port bcc - Run
Now bcc works
# /usr/share/bcc/examples/hello_world.py
telnetd-1479 [001] d..1 90624.696430: : Hello, World!
But some scripts require extra fix
# /usr/share/bcc/tools/opensnoop
PID COMM FD ERR PATH
(no outputs)
55

Port bcc - Fix 4. opensnoop
Before Fix:
# /usr/share/bcc/tools/opensnoop
PID COMM FD ERR PATH
(no outputs)
Cause:
Probe point mismatch
AArch64 kernel uses sys_openat() instead of sys_open()
56

Port bcc - Fix 4. opensnoop cont.
Fix 4: bcc/tools/opensnoop.py
--- a/tools/opensnoop.py
+++ b/tools/opensnoop.py
@@ -17,6 +17,7 @@
from bcc import BPF
import argparse
import ctypes as ct
+import subprocess
# arguments
examples = """examples:
@@ -68,7 +69,7 @@
BPF_HASH(infotmp, u64, struct val_t);
BPF_PERF_OUTPUT(events);
-int trace_entry(struct pt_regs *ctx, const char __user *filename)
+TRACE_ENTRY
{
struct val_t val = {};
u64 id = bpf_get_current_pid_tgid();
@@ -111,6 +112,17 @@
return 0;
}
"""
+
+sys_open = "sys_open"
+trace_entry = "int trace_entry(struct pt_regs *ctx, \
+ const char __user *filename)"
+
+arch = subprocess.Popen(["uname", "-m"], stdout=subprocess.PIPE).stdout.read()
+if arch[:7] == "aarch64":
+ sys_open = "sys_openat"
+ trace_entry = "int trace_entry(struct pt_regs *ctx, \
+ int __user dirfd, const char __user *filename)"
+
+bpf_text = bpf_text.replace('TRACE_ENTRY', '%s' % trace_entry)
+
if args.tid: # TID trumps PID
bpf_text = bpf_text.replace('FILTER',
'if (tid != %s) { return 0; }' % args.tid)
@@ -124,8 +138,8 @@
# initialize BPF
b = BPF(text=bpf_text)
-b.attach_kprobe(event="sys_open", fn_name="trace_entry")
-b.attach_kretprobe(event="sys_open", fn_name="trace_return")
+b.attach_kprobe(event=sys_open, fn_name="trace_entry")
+b.attach_kretprobe(event=sys_open, fn_name="trace_return")
TASK_COMM_LEN = 16 # linux/sched.h
NAME_MAX = 255 # linux/limits.h
57

Port bcc - Run Again
Works fine!
# /usr/share/bcc/tools/opensnoop
PID COMM FD ERR PATH
1483 telnetd 6 0 /dev/ptmx
1483 telnetd 7 0 /etc/group
1703 telnetd -1 2 /var/run/utmp
1703 telnetd -1 2 /var/run/utmp
1703 telnetd -1 2 /var/run/utmp
1703 telnetd -1 2 /var/log/wtmp
1703 telnetd 0 0 /dev/pts/0
1703 telnetd -1 2 /etc/issue.net
1703 bash -1 2 /lib64/tls/aarch64/libdl.so.2
1703 bash -1 2 /lib64/tls/libdl.so.2
1703 bash -1 2 /lib64/aarch64/libdl.so.2
1703 bash 4 0 /lib64/libdl.so.2
1703 bash -1 2 /lib64/tls/libc.so.6
1703 bash 4 0 /lib64/libc.so.6
1703 bash 4 0 /dev/tty
1703 bash 4 0 /proc/meminfo
1703 bash -1 2 /etc/nsswitch.conf 58

Summary
59

Summary
Let's GET STARTED with Dymanic Tracing Tools on AArch64!
bcc - Extra capabilities and Low overhead
SystemTap - Powerful but slow & unsafe, expecting BPF support
perf - Easy to start on AArch64, not so programable
perf-tools - Few dependencies
What comes NEXT
BPF front-end with High-level Language
bcc / perf extention?
SystemTap BPF support?
ply?
60

Future Works
Solve remaining issues
bcc - Correct workarounds, Port much more scripts, Test
Contributions
Port tools to Linux v3.x/ARMv7 (maybe)
61

References
http://www.brendangregg.com/
http://www.slideshare.net/brendangregg/linux-systems-performance-2016
http://www.brendangregg.com/Slides/LCA2017_BPF_tracing_and_more.pdf
https://developer.arm.com/products/system-design/cycle-models/knowledge-articles/using-the-arm-performance-monitor-unit-linux-driver
https://www.linaro.org/blog/kprobes-event-tracing-armv8/
https://clang.llvm.org/get_started.html
http://llvm.org/docs/CMake.html
http://llvm.org/docs/HowToCrossCompileLLVM.html
https://www.mail-archive.com/[email protected]/msg00337.html
62