
Dynamic simulation of groundnut rust : a preliminary...
15
I f I ,-. .. . . Agricihrral Systems 32 (1990) 113-141 Dynamic Simulation of Groundnut Rust: A Preliminary , < Model S. Savary IIRSDA. Institut International de Recherches Scientifiques pour le Diveloppement B Adiopodoumi. BP V 51 Abidjan, Ivory Coast P. D. De Jong, R. Rabbinge Wageningcn Agricultural University, Department of Theoretical Production Ecology, PO Box 430, 6700AK Wageningen, The Netherlands I & J. C. Zadoks Wageningen Agricultural University, Department of Phytopathology, PO Box 8025.6700EE Wageningen, The Netherlands ! (Receivcd 13 December 1988; acccptcd 4 April 1989) ABSTRACT td A first atrernpr to build a dynaniic simulation model of groimdnut rust is reported. The model involws two units: crop growth and development, and ritsi epidemic. Its strirctirre is described, and its performances are presented. Simulated outputs werefoundJairly similar to observed rust seoerity andcrop growth data from Adiopodowné, southern Ivory Coast. The performances of the model ma-v be considered to comply with the requirements expected from a preliminarv simirlaiion model. Directions for firrure improvements of the model are discussed. INTRODUCTION Groundnut rust, due to Piiccinia arachidis Speg., and leafspots, due to Cercosporidiztm persorrntzrm (Berk. & Curt.) Deighton (late leafspot) and Cerrospura arndtidicdu Hon (early leafspot), are causing two major foliar diseases in Western Africa, and especially in Ivory Coast (Savary, 1987a,b). I13 ~igricul~ura/S~~~cs0308-521X/90/$03~50 19 1990 Elsevier Science Publishers Ltd, England. Printed in Great Britan ,
Transcript of Dynamic simulation of groundnut rust : a preliminary...

I
f
I
,-. .. . .
Agricihrral Systems 32 (1990) 113-141
Dynamic Simulation of Groundnut Rust: A Preliminary , < Model
S. Savary
IIRSDA. Institut International de Recherches Scientifiques pour le Diveloppement B Adiopodoumi. BP V 51 Abidjan, Ivory Coast
P. D. De Jong, R. Rabbinge
Wageningcn Agricultural University, Department of Theoretical Production Ecology, PO Box 430, 6700AK Wageningen, The Netherlands
I
& J. C. Zadoks
Wageningen Agricultural University, Department of Phytopathology, PO Box 8025.6700EE Wageningen, The Netherlands
! (Receivcd 13 December 1988; acccptcd 4 April 1989)
ABSTRACT td
A first atrernpr to build a dynaniic simulation model of groimdnut rust is reported. The model involws two units: crop growth and development, and ritsi epidemic. Its strirctirre is described, and its performances are presented. Simulated outputs were foundJairly similar to observed rust seoerity andcrop growth data f rom Adiopodowné, southern Ivory Coast. The performances of the model ma-v be considered to comply with the requirements expected f r o m a preliminarv simirlaiion model. Directions f o r firrure improvements of the model are discussed.
INTRODUCTION
Groundnut rust, due to Piiccinia arachidis Speg., and leafspots, due to Cercosporidiztm persorrntzrm (Berk. & Curt.) Deighton (late leafspot) and Cerrospura arndtidicdu Hon (early leafspot), are causing two major foliar diseases in Western Africa, and especially in Ivory Coast (Savary, 1987a,b).
I13 ~igr icul~ura/S~~~cs0308-521X/90/$03~50 19 1990 Elsevier Science Publishers Ltd, England. Printed in Great Britan ,

I14 S. Suuury et al.
' The present study reports a first attempt to build a dynamic simulation -model of groundnut rust, which is recently established in Africa. The objective is to acquire more insight in the quantitative aspects of groundnut rust epidemiology (Zadoks, 1972~). Crop growth and development were included in the model (Rabbinge & Rijsdijk, 1981), as were various components of resistance (Zadoks, 19726). Due attention was given to leafspot diseases, which affect rust epidemics as well as crop growth.
I
STRUCTURE OF T H E MODEL
General considerations
The system under study is a square meter of groundnut crop infected by rust. It is surrounded by a large number of identical systems, with identical attributes, such as development stage of the crop, leaf area index, and rust severity. The present model elaborates on an initial model by Zadoks (1971).
The model has two main units, one referring to the crop, with growth and development, and the other to the rust epidemic. The latter includes two sub- units: rust lesion development and rust multiplication. Three categories of state variables are present: dry matter of plant organs, rust lesions and rust spores, which represent host growth, lesion development, and rust multi- plication, respectively (Fig. 1). Weather data and leafspot data are handled as driving functions. The programnie was written in CSMP (IBM, 1975).
The time step used in integration should be based on the time coefficients considered. As many processes are taken into account, with quite different time coefficients and with various feedbacks, the time step actually used must be a compromise between calculation time and deformation of results. This preliminary model uses a time step of 1 day. Processes with a time coefficient smaller than 1 day are incorporated into daily input features (Zadoks, 1971) by means of rules transforming complex processes into daily events (Waggoner, 1974; Rapilly & Jolivet, 1976). The biological day ran from 8 a m to 8 pm, concurrent with the climatological day.
:
The host model
The host model used to simulate crop growth and development is SUCROS (Van Keulen et al., 1982; Van Keulen & de Milliano, 1984). Four categories of organs are considered: roots, stems, leaves and pods, represented by their dry matter: RTDM, Sohl, LDM and PDM, respectively (Table 1). Partitioning of carbohydrates produced by photosynthesis is modeled using
,

i
List of V;iri;ihlcs uscd in Ihc Prc1iniin;iry Simul;ition hiodcl for Groundnut Rust . . - -.-- V(iricible f\fl'Nllill~ I f S )711h0~ UIlilS
Rate of assimilation of CO, at lighl saturatio11 pgcIl, i1;l- I il - 11 AcIud d;iily radi;ition (JO0 -700 nm) Ccrcosporn Icaf spot scvcrity
[ J ni - ' d;i y - '1 r i
A A l A .Y * 'A VRA D
CERCO CL.4 1 COFR
' CONSI'O . CSPOC CI'F
- 1 - 1 1 I 7
Fraction o f L.41 colonizcd by Cwcosportr sp. Corrcctiorl factor Convcrsion cocliicicnt of plant carl)ohydr;lte into sporcs Canopy spore contcnt Conversion factor of carbohydr:lies into plilni d r y matter Conversion efficiency for pod dry niattcr Maximum deposition cocliicicnt Fraction of leaf arca index lost by dcfoli:~tion Lcaf dry matter lost by defoliation Daily multiplication Pactor Daily rain condition Dcvclonmcnt staec
CI'FP DEPOS DLAl DLDflí Dd\fFR DR:ì IIVC DI'S EFF
L
Efficiency of use of absorbed visiblc radiation for CO, assin~ilation at L-J
[kg,.,, J - ' ha-' h - ' m' - SI low light lcvels
Gross photosynthesis rate C ~ ~ C ' ~ , O ha - I h - '1 Infcction cfficiency of the currcnl day:raiio of thc effective to the
deposition morts
GPIlOT IiVEFD
'LRI LDAf LLØII LLDAf
. . LSPOC Af.4 Ih'T
Leaf arca indcx Leaf dry matter Living leaf area indcx Living leaf dry matter Lcsion sporc contcnt Maintenance respiration rate
Infectious period duration Latency period duration Parlition coefficient of leaves (a function of DVS) Partition coefficient of pods (a function of DI'S) Partition coeficicni of roots (a function of DI'S) Partition coeficienl of stems (a function of DI.'S) Pod dry matter Net rate of photosynthesis Photosyn!tiates p_ool Photosy~ïtheii~ally act&-lcafär~'i;i;cx - - --- - . Size (area) of one rust pustule Rate of assimilate convcrsion into sporcs Ratio for sporc deposition Ratio for infcction R:rtio for sporc lihcration hlaximum ratio for spore lihcriition Daily rainfall amount Rate of compensation for dcfoliation Rate of sporc dispersal (libcration and dcposition], under unfavourablc
Rate of increase of the dcfoliatcd leavcs dry m:ittcr Riitc of daily miiltiplication. D:rily inflow of cllicicnt sporcs ( f ; iv~trr~hle
C'umul;ilcti ~ J I C of infcctioii tlupositcd spores (cllicicnt spores) Rcßcxion coefiicient of the canopy Maximum d:iily rclaiivc hurnidily h,lininiuni daily relative hunlidity Rims of infection (under unfavourablc conditions, three cl:isses of
_ . ~ - - - -
conditions for infcction
conditions) .
surviv;il of spores)
NLPD
PCP PCR
PDM PGNET PHOT PLAI PSIZE R.4 C R.4 DEP RRINF R:lLIB K.í LIBS R.í I N D Y RCD RDDS
PCL ,
Pes .-
e-I [-I e-I
[Sohi day- '3 [nini]
RDL RDA1
'
RIME RLOS RAIIP RJ! L P ROC'C RPL RPP RPR RPS RRCD RRCER RRDCER RRDDS
RTDAf RTRI-3
SDM SITE SITECO SL.4 STEAfP TEMPD Y
__. - .- TEAIPN TE.4fP x THLD
IfCSPOP I'ClEFF I'CLA 7- I'CINF Il'TC'OD JYTCOIE
S C T R YINF S L A T .Y.SEY .WO s I 'il c
-. . . - .
Root drv matter . --- Rates Offlow ofsurvivingsporcs from the Ist to the 2nd
Stem dry matter and from the 3rd stage to a 'death' stage
..
" h e r of sites ._
Site coefficient: number of sites per LAI unit Specific leaf area Sum of temperature Mean daily temperature Minimum daily temperature Maximum daily temperature Threshold of defoliated proportion of leaves for
defoliation
LO the 2nd to the 3rd.
compensation for c-I [-I Varietal coefficient for spore production (O < V C S p O p s 1)
[-I Varietal cocnicient for infection efìicicncy (0s I'CfEFFc 1)
c-I Varietal coefficient for the latency period dura tio^^ ( I 'CLZTz i ) Varictal coefficient for the infectious period dur;ltion (0s ~ ' C I N , C - ~ 1)
c-I Wetness coefficient for deposition (a function 01' DRAIN0 Wetness coefficient for infection efficiency (n function of nRA/NC and
[II
R H M A X ) Number of removed sites Number of infectious sites Number of latent sites Accumulated number of infected and removed situs Total number of occupicd situs Number of avai1;lblc sites -- -
P
A-' v
S. Sacary et al.
stems \ - .
1 2 3 4 5 6 7 8 9 development stages [STD)
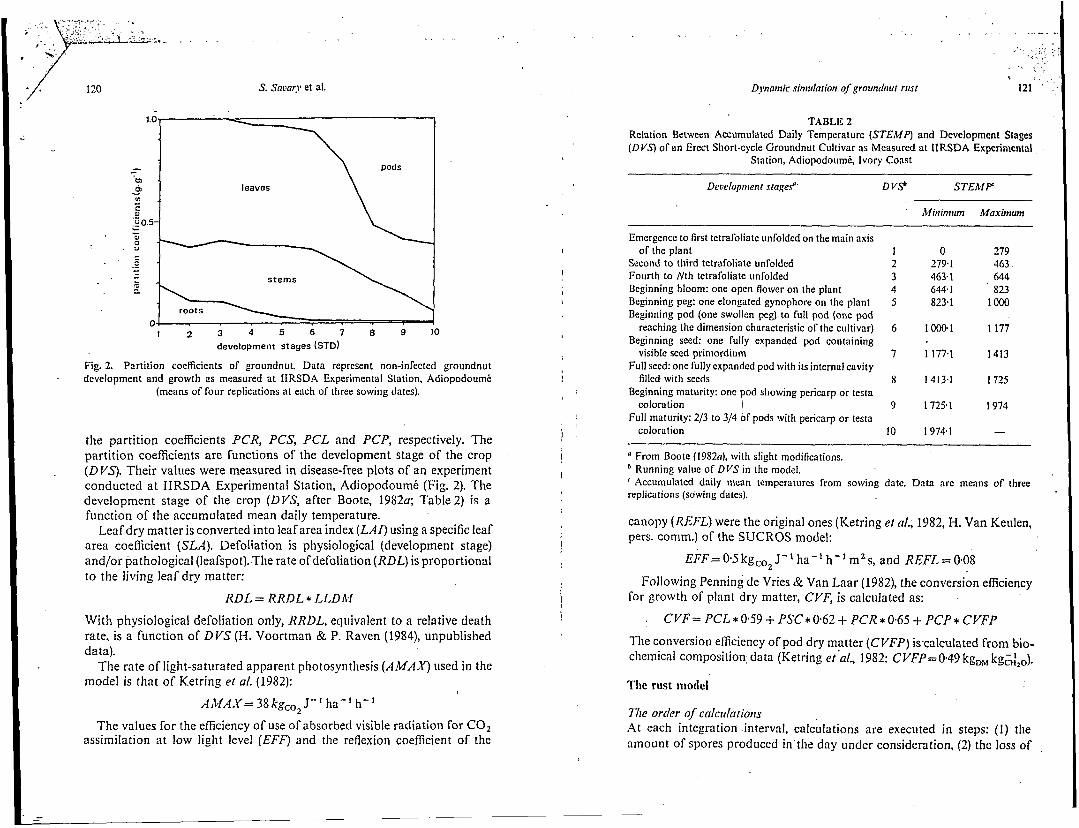
Fig. 2. Partition coefficients of groundnut. Data represent non-infected groundnut development and growth as measured at IIRSDA Experimental Station, Adiopodoumé
(means of four replications at each of three sowing dates). I
the partition coefficients PCR, PCS, PCL and PCP, respectively. The partition coefficients are functions of the development stage of the crop ( D YS). Their values were measured in disease-free plots of an experiment conducted a t IIRSDA Experimental Station, Adiopodoumé (Fig. 2). The development stage of the crop (DVS, after Boote, 19820; Table 2) is a function of the accumulated mean daily temperature.
Leaf dry matter is converted into leaf area index ( L A I ) using a specific leaf area coefficient ( S U ) . Defoliation is physiological (development stage) and/or pathological (leafspot). The rate of defoliation (RDL) is proportional to the living leaf dry matter:
RDL= RRDL* LLDAï
With physiological defoliation only, RRDL, equivalent to a relative death rate, is a function of DI'S (H. Voortman & P. Raven (1984), unpublished data).
The rate of light-saturated apparent photosynthesis ( A M A X ) used in the model is that of Ketring et al. (1952):
.
A M A X = 38kgc,, J- ' ha-' h-'
The values for the efficiency of use of absorbed visible radiation for CO, assimilation at low light level (EFF) and the reflexion coefficient of the
-
!
Ì
. . . . .--. . . . ,:.. , ;., .. _.. . ~ , , . . . .. ., . . . ... . _ I . . ,
Dynamic siniulation of groundnut rust i :
121
TABLE 2 Relation Between Accumulated Daily Temperature (STEMP) and Development Stages (DI'S) of an Erect Short-cycle Groundnut Cultivar as Measured at IIRSDA Experimental
Station, Adiopodoume, Ivory Coast
Deuelopnrerir stage$'' D VS' STEMP
Minimum Maximum
Emergence to first tetrafoliate unfolded on the main axis of the plant 1 O 279
Second to third tetrafoliate unfolded 2 279 1 463 Fourth to Nlh tetrafoliate unfolded 3 463.1 644 Beginning bloom: one open Rower on the plant 4 644. I 823 Beginning peg: one elongated gynophore on the plant 5 823.1 lo00 Beginning pod (one swollen peg) to full pod (one pod
Beginning seed: one fully expanded pod containing
Full seed: one fully expanded pod with its internal cavity
Beginning maturity: one pod showing pericarp or testa
Full maturity: 2/3 to 3/4 of pods with pericarp or testa
reaching the dimension characteristic of the cultivar) 6 I ooO.1 1177
visible seed primordium 7 1177.1 1413
I 725 filled with seeds
coloration I 9 1725.1 1974
coloration I O 1974.1 -
From Boote (1982a). with slight modifications. Running value of DVS in the model. Accumulated daily mcan temperatures from sowing date. Data are means of three
8 1413.1
replications (sowing dates).
canopy (REFL) were the original ones (Ketring er al., 1982, H. Van Keulen, pers. comm.) of the SUCROS model:
EFF = 0.5 kg J-I ha- ' h- ' m2 s, and REFL = 0.08
Following Penning de Vries & Van Laar (1982), the conversion efficiency for growth of plant dry matter, CVF, is calculated as:
. CVF = PCL * 0.59 i- PSC * 0.62 f PCR * 0.65 i- PCP * CVFP
The conversion efficiency of pod dry matter (CVFP) is-calculated from bio- chemical composition data (Ketring et'al., 1982: CYFP=0,49 kg,, kg&,,).
The rust model
TJie order of cnlculurions At each integration interval. calculations are executed in steps: (1) the amount of spores produced in the day under consideration. (2) the loss of

122 s. suoury et al.
spores leached to the ground by rain, (3) the proportion of the remaining spores liberated and deposited, (4) infections, leading to the production of latent lesions, and (5) accumulation of non-liberated spores in the canopy spore content (CSPOC).
The iizjrection cycle Following Zadoks (1971), four categories of sites (SITE) are distinguished: vacant, latent, infectious and removed lesions (XVAC, XLAT, XINF and XCTR). The rate of occupation of sites by rust is written as:
ROCC= REFF+ COFR -+ RSTART
where REFF is the rate of infection of deposited spores, and
COFR = XVACISITE
is the correction factor. RSTART initiates the epidemic. REFF is the daily multiplication of the whole population of lesions and is calculated as the sum of rates of efficacy of spores dispersed under favourable conditions for infection (RD&í) and of three age-classes of spores deposited under unfavourable conditions:
REFF = RDM -+ RINFl -+ RINF2 -+ RINF3
DMFR is the daily multiplication factor per lesion (Zadoks, 1971):
DMFR = REFFIXINF
The total population of lesions is: I
i XTO = X L A T i - XINF+ XCTR
XSEV represents the population of visible lesions as determined by actual rust severity assessments:
I
XSEV = XINF -+ XCTR
Spore production The spore content of the canopy, i.e. the amount of spores available for liberation, is calculated as an integral:
CSPOC = INTGRL (O., RSPO) n
The rate of increase of the spore content of the canopy is:
RSPO RSPOP- RLIB- RLOS
where RSPOP is the rate of spore production, RLIB the rate of spore liberation, and RLOS the rate of loss of spores due to rain leaching. The rate of spore production is a function of maximum (TEMPX), minimum
t
(TEMPN), and average (TLUPD 1') temperatures (Savary, 19856). The resulting spore production is corrected by a varietal coefficient ( F'CSPOP), with a default value of 1. for a susceptible cultivar.
Spore loss by rain Ieacliiiig A rain shower on an infected groundnut canopy induces a flow of rust spores suspended in water dripping from leaves and running off the petioles and stems to the ground. Leaching was found to reach high values from 5 mm rainfall volume (RAIND Y ) upwards (Savary & Janeau, 1986). Thrce types of daily rain conditions (DR,4INC) are considered: no rain. rainfall under 5 mm, and rainfall of 5 nim or more, which correspond to proportions of O. 0.25 and 0.5 of the canopy spore content leached to the ground (Table 3).
Spore liberntion The rate of spore liberation is proportional to the canopy sporc content (CSPOC):
RLIB = RALIB * CSPOC RALIB is a function of the maximum relative rate under dry conditions (RALIBX= 0.16; Savary, 1986). Dry conditions were defined by a minimum relative humidity (RHMIN) below 70% (Table 3; Mallaiah & Rao, 1982; Savary, 1986). RALIB also depends on the occurrence of rain. Slight rains (RAINDY <5mm) promote spore dispersal (Savary & Janeau, 1986; RALIB = 1-1 * RALIBX), whereas heavy rains (RAIND Y 2 5 mm) impede spore dispersal (RALIB = O).
.
Spore deposition on the canopy Spore deposition is represented by its relative rate, RADEP. RADEP is proportional to the leaf area which contains sites, whether occupied or not, a maximum deposition coefficient (DEPOX), and a cocficient for 'canopy wetness (CVTCOD). Deposition is taken to be three times higher on a wet than on a dry canopy (Chamberlain & Chadwick, 1972). DEPOX was derived from a study by Hirst & Stedman (1971), indicating that the depletion of a cloud of sugar beet pollen on a wheat crop due to deposition is about 1 % per meter travel and perfdry) LAlunit. This figure corresponds to the average 0*8-1.4% depletion of an Erysiphegrnmini.r spore flow per meter travel and per LAI unit (assuming LAI= 3) in a barley field (Aylor, 1982). These values represent spore deposition at mesoscale, over distances rang- ing from 1 to 10m, i.e. within crop, between plant dispersal. When spore dispersal at microscale, i.e. within plant dispersal, is considered (Roelfs & Martell, 1984), the proportion of deposited spores takes larger values. A value of 0.03 for DEPOX was used.

J 124 . ".
. . . . . ,
I .-
.i
S. Suuary et al.
C
!! \
i 4:
? 0 0 - 1
L
%
5 > * - -
II: v, O
% 2
o
I
!
,
1
I
<
1
125 Dynamic siinidairon of groundriui rusr
Injèction Infection is represented by RAINF, the relative rate of infection. RAINFis proportional to the daily infection efficiency (INEFD), a wetness coefficient (WTCOIE), and a varietal coefficient for infection efficiency (YCIEFF), the latter having a default value 1. for a susceptible cultivar.
RAINF= VCIEFF+ WTCOIE* INEFD
INEFD is the mean value of infection efficiencies calculated. from three temperatures of the current day: TEMPX, TEMPNand TEMPD Y(Savary, 1985h). Under laboratory conditions, P. araclridis spores may germinate and infect when relative humidity is 100% or when water is present on the leaf surface (Savary, 1985~). Under fiejd conditions, a water-saturated at- mosphere is assumed to coincide with the occurrence of water (rain or dew) on the foliage (Table 3). Dew is considered to occur when maximum relative humidity (RHMAX) is at least 95%.
Flotvs of spores (Javourable conditiotu) To simulate spore dispersal and rust spread, several phases were considered: spore liberation, spore deposition and infection ofsites. Each of these phases can be defined by state variables: liberated and deposited spores, and latent lesions, related by flows with rates: rate of spore liberation, of spore deposition and of site infection. These rates can be made proportional to relative rates (dimension: [T-'J: RALIB, RADEP and RAINF). Each of the considered processes, however, has time coefficients smaller than the time step chosen for the preliminary model (1 day). To be simulated within 1 day, their succession had to be summarized into a daily input feature, where the relative rates RALIB, RADEP and RAINF were considered as ratios (dimensionless), from which a relative rate of daily multiplication (RRDM, dimension [T- '1) representing the daily fraction of the sports that successfully pass the, dispersal and infection processes is calculated:
Favourable conditions are defined by: RALVDY # O or R H M A X 2 95%. The rate of daily multiplication under favourable conditions (RDM) is proportional to RRDM:
, R R D ~ = ( R A L I B * RADEP* R A I N ~ I D E L T
1 RDA4 = RRDII.I;* CSPOC 1
Flow of spores (rmnf¿wotrrable lx conditions) Under unfavourable, conditions (RAINDY= O and RHMAX t95%), deposited spores entera process of survival and maturation (Zadoks & Van Hees-Boukema, 1986jiVan Hees-Boukema & Zadoks, 1986: P. D. de Jong &

.._ , . '>, .. ,
! I26 S. Sirvary et al.
L. Michaud. unpublished results). The rate of deposition of dry spores is kalculated as:
I l
sources, which are beyond the limits of the system under consideration, and to be proportional to the (vacant) trapping area of the crop:
RDDS= RRDDS* CSPOC
The relative rate of the process, RRDDS, takes a null value under favourable conditions (RRDM >O) ; it combines the ratios for liberation and deposition when RRDM=O:
RRDDS= I N S W ( - R R D M , O., (RALIB* RADEP)/DELT)
Survival and maturation are modelled as a boxcar train without dispersion using RDDS as rate of inflow. The train has three'boxes, each with three outflows: a rate of mortality (which allows to simulate survival), a rate of infection (which represents maturation of spores), and a rate ol: outflow to the next stage. The residence time in each stage is12 days and the spores leaving the third box are considered dead. When i favourable .conditions occur, each of the three boxes is emptied, a proportion RAINF of the spores being efficient and the rest (1. - RAINF) being eliminated. The infection efficiency in the second stage is twice that of the two other stages. Under unfavourable conditions, the contents of the first boxes are allocated to the next one every second day, while that of the third is brought to a sink of dead spores.
Larency and iifectious period !
Passage of rust lesions through these periods is simulated using boxcar trains according to Zadoks (1971), with some additional detail. Residence times in the latent (NLPD) and in the infectious (NIPD) stages are functions of daily temperatures (Savary, 1985a). Both are mean values of three daily calculations, using TEMPX, TEMPN and TEMPD Y. The resulting residence times are corrected by variety-dependent1 factors ( VCLAT and VCINF), with default values of 1. for a susceptible variety. Each boxcar train has a relative death rate which is a function of death rates due to cultivar resistance ( R R M L VC and RRMIVC, default values: O. for a susceptible cultivar), to physiological defoliation (RRDPHY), and to defoliation caused by leafspot disease (RRDCER). Exhausted sites (XCTR) accumulate with the rate of outflow from the infectious stage (RREM) RREM is corrected for defoliation.
--b
Spontaneous itljections RSTART represents the background noise, the rate of inflow of effective spores from external inoculum sources into the considered crop. This rafe of inflow is assumed to depend on the magnitude and distance of inoculum
I
l i ì ! '
I
RSTART= RSPONI* ( X V A C ~ Ì T E C O ) where RSPONI is the rate of spontaneous infections per unit leaf area (an empirically estimated parameter, invariant per run) and SITECO, the number of sites per unit LAI.
Coupling
Hypotheses on the eflects of rust und Ieafipor diseases on the physiology und growth of host plants
(1) The groundnut rusf pustule. The occupied, sporulating site (XZNF) is seen as a pustule (0.75mm in diameter) surrounded by an apparently unaffected area (2.0 mm in diameter) which provides the energy needed for sporulation: the rust pustule is a sink for assimilates (Mendgen, 1981). A part of these assimilates is transformed into spores. A groundnut crop ( L A I = 4) infected by rust at a 15% severity (approximately 1-86 x IO6 lesions m-') produces 1 to 3 kg spores ha-' day-' under moderately favourable condi- tions (200 to 600 spores per lesion day-'; Savary, 1986).
The assimilates required for spore production are assumed to be directly derived from the net photosynthetic rate (PGNET= GPHOT- MAINT, where GPHOT represents the gross photosynthesis rate, and MAINT the maintenance respiration), before any partitioning to the growing organs. This effect is superimposed upon the reduction of photosynthetically active leaf area, represented by the accumulated areas of the pustules.
(2) The cercospora lesion. Three effects of the cercospora leafspots on the host are considered: (a) reduction of the rate of photosynthesis due to a reduction of photosynthetically active leaf area, (b) defoliation, and (c) compensation for defoliation. Cercospora lesions induce an acceleration of leaf senescence (Boote èt al., 1983), and defoliation. Defoliation due to cercospora lesions is represented by its relative rate, RRDCER, which is added to the relative rate of stage-dependent defoliation (RRDPHY) to compute the relative rate of defoliation of the canopy:
. .
' RRDL= RRDPHYS. RRDCER
RRDCER was estimated as the difference between the relative rates of defoliation of untreated (infected) and treated plots (H. Voortman & P. Raven (1984), unpublished data). The regression equation:
RRDCER = 1.72 x IO-" + 0.01 log, (CERCO + 1)
12x S. Savary et al.
which predicted RRDCER accurately in another, independent experiment [p < 0.05, P. D. de Jong, 1986, unpublished data), was incorporated in the model.
Three hypotheses are introduced to simulate the compensation for ,defoliation: (a) the rate of compensation (RCD) is proportional to the amount of defoliation in the past 7 days (Jones et al., 1982; Wilkerson et al., 1984), (b) its relative rate (XRCD) depends on the development stage of the crop (Sones et al., 1982), and (c) compensation occurs only when a threshold (TI ILD) is reached (Smith & Barfield, 1982), which depends on development stage. The model combines a decreasing relative rate of compensation with increasing development stage with a stage-dependent threshold for compensa tion.
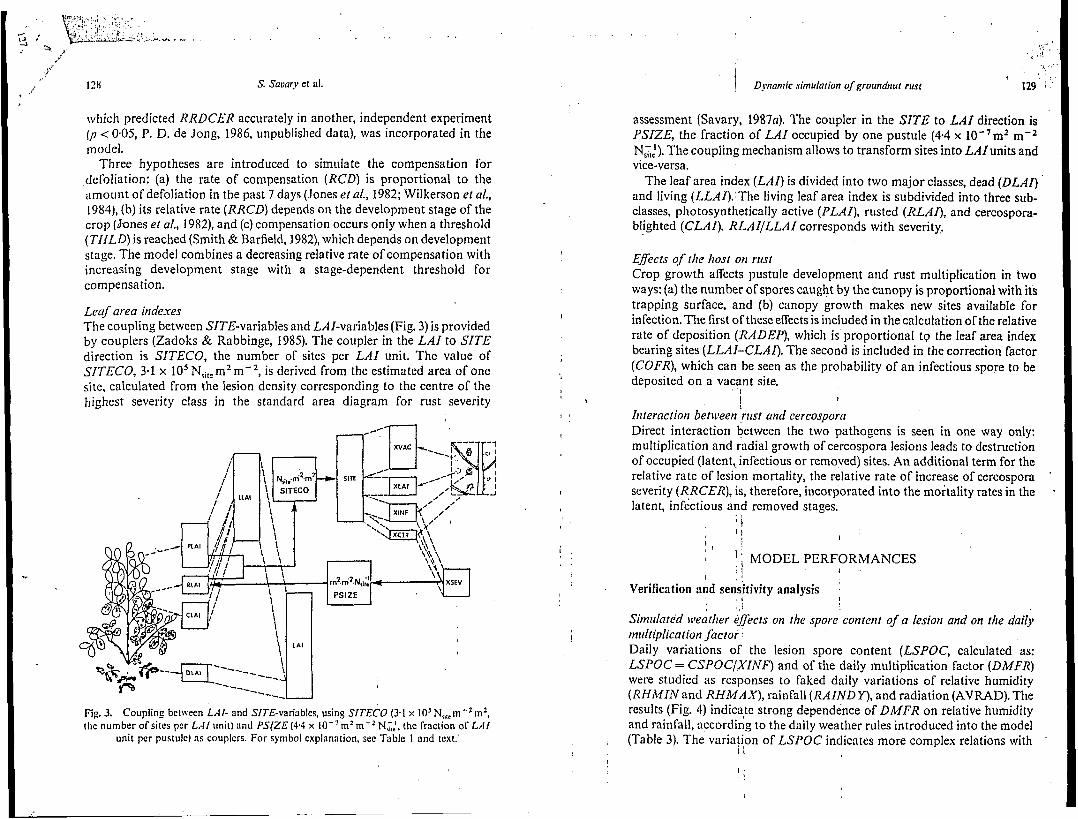
Lcuf area indexes The coupling between SITE-variables and LA I-variables (Fig. 3) is provided by couplers (Zadoks & Rabbinge, 1985). The coupler in the LAI to SITE direction is SITECO, the number of sites per LAI unit. The value of SITECO, 3.1 x lo5 Nsilem2 m-', is derived from the estimated area of one site, calculated from the lesion density corresponding to the centre of the highest severity class in the standard area diagram for rust severity
Fig. 3. Coupling between LAI- and SIT€-vanables. using SITECO (3.1 x IO' Nl,lem-2 m2, the number of sites per LA/ unit) and PSlZE (4.4 x IO-' m2m-* N,;:, the rrnction of LAI
unit per pustule) as couplers. For symbol explanation. see Table I and text.'
1.
3 1 Dynaniic simularion of groundnut rust 129 :
assessment (Savary, 1987~). The coupler in the SITE to LAI direction is PSIZE, the fraction of LAI occupied by one pustule (4.4 x lo-"' m-2 Ns;i). The coupling mechanism allows to transform sites into LAIunits and vice-versa.
The leaf area index (LAI) is divided into two major classes, dead @LAI) and living (LLAI):The living leaf area index is subdivided into three sub- classes, photosynthetically active (PLAI), rusted (RLAI), and cercospora- blighted (CLAI). RLAIILLAI corresponds with severity.
Eflects of t h host on rust Crop growth aflects pustule development and rust multiplication in two ways: (a) the number of spores caught by the canopy is proportional with its trapping surface, and (b) canopy growth makes new sites available for infection, The first of these erects is included in the calculation of the relative rate of deposition (RADEP), which is proportional t9 the leaf area index bearing sites (LLAI-CLAI). The second is included in the correction factor (COFR), which can' be seen as the probability of an infectious spore to be deposited on a vacant site.
Interaction between rust and cercospora Direct interaction between the two pathogens is seen in one way only: multiplication and radial growth of cercospora lesions leads to destruction of occupied (latent,, infectious or removed) sites. An additional term for the relative rate of lesion mortality, the relative rate of increase of cercospora severity (RRCER), is, therefore, incorporated into the moitality rates in the latent, infectious and removed stages.
' I I ! f
I
' I
1 I ' MODEL PERFORMANCES l
1 l Verification and sensitivity analysis
Sitiiiílated weather eflects on the spore content of a lesion and on the dail-v miíltiplication Jactor Daily variations of the lesion spore content (LSPOC, calculated as: LSPOC= CSPOCJXINF) and of the daily multiplication factor (DMFR) were studied as responses to faked daily variations of relative humidity (RHMIN and RHMAX), rainfall ( R A I N D Y) , and radiation (AVRAD). The results (Fig. 4) indicaJe strong dependence of DMFR on relative humidity and rainfall, according to the daily weather rules introduced into the model (Table 3). The variation of LSPOC indicates more complex relations with
I I I
1 %
I !

130 S. Suuury et al.
weather variables, and especially A VRAD. The moqel expects spore produc- tion to be negatively alrected by a reduction of the rate of photosynthesis. Reductions of LSPOC are associated with low radiation (Fig. 4, ;mows marked l), heavy rainfall (3), or consecutive moderate rainfall (4), whereas i t is increased by high radiation (2). High or low relative humidity appears to play a secondary role only. This verification run indicates that LSPOC is in
30 B
20
10 II; II I I I Ill Il I
1 30 40 5 0 ' 60 70 eò ' 91
Fig. 4. Simulated variations of the daily multiplication factor (D: D M F R [day-']) and of the lesion spore content (E: LSPOC [N,, N&']) as responses to faked variations of the relaiive humidity (A: RHMAX and RHMIN [%I). rainfall (B: RAINDY [mm]) and
radiation (C: A YRAD [J m-']).
time (days1
I
t
I
balance with a mean value of 1362 spores per lesion, which fits the range of minimum values measured in the field, following spore liberation under dry conditions (Savary, 19861, or rain-induced spore liberation (Savary & Janeau. 1986).
A sbniitutioti experitmnt aboici die eficts of ~veniher on ritsl cpidctnics A simulation experiment was conducted to check the effect of weather on rust epidemics. The input variables consisted of three weather factors, each at three levels. The output variable characterizing the epidemics was the area under the disease progress curve ( A UDPC). Inputs were rainfall patterns (Fig. 5, R1, R2 and R3), three levels of RHMINand RHMAX(H1: 65-80, H2: 75-90 and H3: 85-98%), and three levels of TEMPN and TEhfPX(T1: 23-27, T2: 21-31 and T3: 19-35°C). The effects of input variables could be assessed by their respective mean square values. The results indicated very strong effects of temperature (M.S. = 86.2), rainfall (M,S. = 73.61, and, to a lesser extent, of humidity (M.S. = 28.3). The response, ils measured by AUDPC, to T and H decreased with increasing indices of these treatments, whereas the response to R followed an optimum pattern.
Eflects of coniponennts of resistatice on sitnirlated groutidmi rust rpideniics Following Teng e! al. (1977), a simulation experiment was conducted using the levels of the varietal coefficients for infection efficiency, latency period, infectious period and sporulation intensity ( VCIEFF, VCLAT, VCINF and VCSPOP, respectively) as treatments. Three levels of VCLAT, and two levels of VCIEFF, VCINF and VCSPOP were permutated. The levels of VCLA T were chosen to represent relative resistance indices (Zadoks, 19726) of O., 0.25 and 0.5, respectively, i.e. VCLAT values of l., 1.33 and 2., respectively. The levels of VCIEFF, VCINF and VCSPOP were chosen to represent relative resistance indices of O and 0.25, i.e. VCIEFF, VCINF and VCSPOP values of 1. and 0.75, respectively.
The resulting A UDPCs decreased with the increase of resistance indices corresponding to any of the considered components of resistance. The efTect of VCLAT was very strong (M.S. = 97.1) whereas that of VCIEFF and VCSPOP were moderate (M.S. = 6-40 and 6.52, respectively), and that of VCINF (M.S. = 0.001) negligible.
I
.
Validation
To test the outputs of the model, the variables LLAI(1iving leaf area index) 'and XSEV (number of visible rust pustules per crop square meter) were chosen as representative of the crop sub-model and of the disease sub-model, respectively. Both were compared to data from field observations.
..

Dynamic sinlularion nJgroundnrrr rust 5 .
133 i S. Savary et al.
A Jield experiment The experiment ( S . Savary & S. Ledermann, 1986, unpublished data) consisted of three blocks sown at three different dates (A: 12 May, B: 2 July and C: 23 July 1986), each block containing four replicates of paired (weekly treated with Chlorothalonil and non-treated) plots (3 x 3 m). The cultivar used was ICH 149A, a short cycle, erect cultivar, planted at a density of 16.7 plants me2. Crop growth, rust and leafspot severities were assessed weekly on each replicate of the three blocks of the experiment.
Simulation runs To simulate the course of rust epidemics in the field, the inputs required include weather data (RAIND Y, RHMAX, RHMIN, A VRAD, TEMPXand TEMPW, ‘information on the initial population of plants and of rust pustules and cercospora data. The initial population of plants is represented by the dry matter of roots, leaves and stems. Cercospora leafspot data are represented by CERCO, the weekly assessment of percentage leaf area covered by cercospora lesions. The rate of inflow of spontaneous infections per LAI unit, RSPONI, was estimated from the second assessment where rust severity was not null. This rate was kept constant from the estimated date of first infection till harvest.
The groundnut cultivar used was highly susceptible to rust. The values of the varietal parameters for susceptibility were inserted accordingly, using the statement:
i a P m N 0:
E E
E E
.Q
E E
I PARAMETER VCIEFF= I., VCLAT= I-,’ VCINF= i., VCSPOP= I.,
. . , RRMLVC = O., RRMIVC = 0.
Comparison of siiiiula1ed and actual results The similarity between the simulated and observed values (Fig. 6) is not perfect but certainly encouraging. With one exception, the timing of the peaks is correct. With one exception again, the height of the peaks is correct, within a 10% limit. The upsurge of the simulated epidemic was about 1 week too early in two cases, and 1 week too late in one, but the slopes of the curves were simulated correctly. Simulation of the decline of epidemics is not yet fully satislfactory. I
u DISCUSSION AND CONCLUSION
4 O ln _jb P O
e O a 2 vi ch G Model structure ‘j
In buildidg this preliminary model of groundnut rust. attention was given to the processes within the system, their hierarchy, their assembling with

134 S. Suoury et al.
I !
I
- N
ü 'E ir 0
a
ui Lo e 8 %? O (b i i4
.-... /=., . ..
s ,
h s
Dynumic sinrulurion of groundnut rust 135 .. , \
explicit coupling hypotheses, and to convenient simulation techniques to represent them, rather than to the many factors that may affect a groundnut rust epidemic. Only those environmental factors which are assumed to exert >major effects were introduced to allow an overall evaluation of the model. ,The model does not contain stochastic features.
Most simulation models, which try to describe dispersal in a two- dimensional (severity and time) space, including the present one, are facing representational dificulties (Teng, 1985). Furthermore, one pathogen may be subjected to several dispersal processes, each with its own time, space and efficiency attributes, corresponding to particular sets of environmental conditions (Zadoks & Schein, 1979). As groundnut rust spore dispersal was studied under dry (Mallaiah & Rao, 1982; Savary, 1986) and rainy (Savary & Janeau, 1986) conditions, an attempt is made to represent dry as well as rain- induced dispersal.
Spore production is represented as a function of variety, pustule age, and temperature. These factors are frequently used in simulation models (Teng & Bowen, 1985). Additional factors are, indirectly, those which affect the rate of photosynthesis, since sporulation is derived from the flow of carbohydrates fixed by the crop. Spore survival may be considered at three separate states: before liberation (in the pustule), during transport, and after deposition (Shrum, 1975; Teng & Bowen, 1985). Spore survival after deposition and spore maturation are introduced in the model, using some empirical data (P. D. de Jong (1986), unpublished results). Infection is introduced as a function of leaf wetness, which, in turn, depends on the occurrence of rain and on the daily maximum relative humidity (Table 3). The effects of temperature and variety on infection are superimposed. Latency and infectious periods are simulated according to Zadoks (1971), with temperature as the driving function. Both are modified by varietal characteristics, expressed as varietal coefficients.
I
.
Lesion spore contcnt and d$ly multiplication factor
The results (Fig. 4) show that the simulated balance between spore production and spore liberation results in realistic value of the lesion spore content (LSPUC, Savary, 1986; Savary & Janeau, 1986). The results for DMFR (Fig. 4) indicate that the programme reacts adequately to the rules on weather relations (Table 3). DMFR varies from 0 to 5.60 (mean: 1-38) under dry conditions, from 1.3 to 72 (mean 27.2) when light rains occur, and takes zero value under heavy rainfall (RAIND Y 2 5 mm). The output of the model for D M F R is considered to be within the range of probable DiIlFR values, at least under dry conditions (four separate epidemics, DMFR = 0-3.36, mean: 0.51, P. D. de Jong (1986), unpublished data).

Simulated weather effects on rust epidemics
A simulation experiment indicated that temperature and rainfall have strong, and relative humidity has moderate, effects on groundnut rust epidemics. Scarce rains, as well as heavy and numerous rain showers, or large
unfavourable to the development of epidemics. The conclusions reflect the information used to build the model. They are in agreement with results from an analysis of survey data on groundnut diseases in the farmers' fields in Ivory Coast (Savary, 19870, b).
Simulated effects of components of resistance
1 daily temperature variations (and increase of daily mean temperature) are - I
Another simulation experiment indicates a hierarchy in the components of resistance. Among them, lengthening of the latency period has a strong effect, whereas reduction of the infection efficiency or of the sporulation intensity have but moderate effects on groundnut rust epidemics. Variation of the infectious period has negligible effects.
Comparable results were obtained by Zadoks (1971) and Teng et al. (1977). The similarity in conclusions should be ascribed to the similarity in system designs underlying the simulation models (Teng et al., 1977; Teng & Bowen, 1985). The large value of the infectious period (up to 26 days, Savary, 19856) probably contributes to minimize the effect of its reduction. For a necrotrophic pathogen (Septoria iiodorzm on wheat, Rapilly, 1979), the results of a comparison of components of resistance indicated that the latency period plays a secondary role only.
Comparison of model outputs with observed data
The data used to calculate the host's partition coefficients of the model were taken from the treated plots adjacent to the non-treated plots where the epidemics were measured. The procedure of validation, therefore, has not the same value for the crop sub-model as for the rust sub-model. Partition coefficients are functions of cultivar and development stage (Duncan et al., 1978). Groundnut development is fairly independent of rust or leafspot (Boote et al., 1383), a t least until development stage 9 is reached (Bell, 1986). The values of the coefficients used in the model were similar to those of Forestier (1969) in Cameroon on cvr Minkong, which resembles the cultivar used in these experiments.
The population of rust pustules (XSEV)
A possible cause of discrepancy between model outputs and observed values of XSEI'lies in the difficulty of estimating the early state of the considered
I
..
I
I
d q * ' 5 .
Dynamic sinrulotion of groundnut rust 137
pathosystem, and, especially, the early level of the epidemic due to spontaneous infections (Teng, 1985). The outputs of the model, however, d o not indicate that major error was made in initializing the model (Fig. 6, especially B).
Several causes of the overall overestimate of XSEV by model outputs can be found in the structure and in the information used to build the model. LLA/is overestimated, and this leads to an overestimation of the correction factor (COFR), and thus of the rate of occupation of vacant sites, ROCC. The development of rust pustules described in the model is based upon studies on young, healthy leaves infected with young, highly infectious spores (Savary, 198546). The use of these results to represent the development of rust pustules in the field entails the implicit assumption that optimum physiological conditions are met by both host and pathogen during the whole infection cycle. Another possibly important source of over- estimation of XSEVis related to the defoliation of the canopy due to either plant physiology o r leafspot effects. Due to the vertical distribution of pustules in the canopy (Savary, 19870), defoliation more intensely affects the fraction of leaf area which bears the largest fraction of the population of pustules. This differential effect of defoliation on rust lesion mortality was not taken into account in this preliminarymodel without stratification ofthe canopy into different leaf layers. i
Evaluation of the model I i 1
In view of its relative simplicity, the performance of this groundnut rust simulation model may be considered to comply with the requirements for a preliminary simulation model (Penning de Vries, 1982). The shapes of the simulated curves for XSEV and LLM resemble the observed curves, although a tendency of the model toward overestimation is noted. The range of values taken by the simulated variables is not basically different from those taken by actual observations. According to the results, the present simulation model is considered to adequately simulate groundnut rust epidemics in optimum crop growth situations under the environmental conditions of southern Ivory Coast.
Perspectives
The necessity of a balance between details introduced into the coupled host and pathogen sub-models was discussed by Rabbinge & Rijsdijk (1981), Zadoks & Rahbinge (19851, and Teng (1985). In spite of the number of possible improvements in representing the groundnut rust cycle, their impact on the explahtory value of the model is probably minor when compared to the contribution of a more detailed host sub-model. Two categories of improvements can be considered.
I
i !
I I l
' I

)I 7 i .
a .
* \ Dynanrrc sinrularion of groundnur rusr 139
Boote, K. J. (1982~). Growth stages of peanut. Peanut Science, 9, 3540. Boote, K. J. (19824. Peanut. In Crop Water Relations. ed. I. Teare & M. Pcet, John
Wiley &i Sons, New York, pp. 2.56-86. Boote, K, J., Jones, J. W., Mishoe, J. W. & Berger, R. D. (1983). Coupling pests to
crop growth simulator to predict yield reductions. Phytopathology, 73. 1581-7. Boote, K. J., Jones, J. W., Mishoe, J. W. & Wilkerson, G. G. (1985). Modeling growth
and yield of groundnut. In Agromereorology of Groundnut. ed. M. V. K. Sivakumar & S. M. Virmani, Niamey, pp. 243-54.
Chamberlain, A. C. & Chadwick, R. C. (1972). Deposition of spores and other particles on vegetation and soil. Ann. Appl. Biol., 7 , 141-58.
Duncan, W. G., McCloud, D. E., McGraw, R. L. & Boote, K. J. (1978). Physiological aspects of peanut yield improvement. Crop Science, 18, 1015-20.
Forestier, J. (1969). Développement de l'arachide hâtive en région forestiire. Cahiers ORSTOM, sér. Biol., 9, 33-63.
Hirst, J. M. & Stedman, O. J. (1971). Patterns of spore dispersal in crops. In Ecology of !lie Leaf Surface. ed. T. F. Preece, Academic Press, London, pp. 229-37.
IBM (1975). Continuous System Modeling Program III (CSMP III), Programme reference manual. IBM SH19-7001-3. Techn. Publ. Dept., White Plains, USA, 206 pp.
Jones, J. W., Barfield, C. S.. Boote, K. J., Smerage, G. H. & Mangold, J. (1982). Photosynthetic recovery of peanuts to defoliation at various growth stages. Crop Science, 22, 741-6.
Ketring, D. L., Brown, R. H., Sullivan, G. A. & Johnson, B. B. (1982). Growth physiology. In Peanut Science and Technology. ed. H. E. Pattee & C. T. Young, Yoakum. pp. 41 1-57.
Mallaiah, K. V. & Rao, A. S . (1982). Aerial dissemination of urediniospores of groundnut rust. Trans. Brit. Mycol. Soc., 18, 21-28.
Mendgen. K. (1981). Nutrient uptake in rust fungi. Plryroparhology, 71, 983-9. Penning de Vries, F. W. T. (1982). Phases of development of models. In Siniularion of
Plant Growth and Crop Producrion. ed. F. W. T. Penning de Vries & H. M. Van Laar, Pudoc, Wageningen, pp. 20-25.
Penning de Vries. F. W. T. & Van Laar, H. M. (1982). Simulation of growth processes and the model BACROS. In Simulation of Plant Growth and Crop Production. ed. F. W. T. Penning de Vries & H. M. Van Laar, Pudoc, Wageningen, pp. 114-3.5.
Rabbinge, R. & Rijsdijk, F. H. (1981). Disease and crop physiology: A modeller's point of view. In Eflect of Disease on the Physiology of the Growing Plunt. ed. P. G. Ayres, Cambridge University Press, Cambridge, pp. 201-20.
Rapilly, F. (1979). Simulation d'une épidémie de Seproria nodorum Berk. sur blé, étude des possibilités de résistance horizontale. EPPO Bull., 9, 243-50.
Rapilly, F. &Joliver, E. (1976). Construction d'un modèle (EPISEPT) permettant la simulation d'une épidémie de Septoria nodorum Berk. sur blé. Revue de Statistique Appliquèe, 24, 3 1-60.
Roelfs, A. P. & Martell, L. B. (1984). Uredospore dispersal from a point source within a wheat canopy. Plrytopathology, 74 1262-7.
Savary, S. (19854. Comparaison de différentes techniques d'infection de folioles d'arachide par Puccinia arachidis Speg. Agronomie, 5, 325-9.
Savary, S. (19856). EfTets du niveau de contamination et de la temptrature sur quelques étapes du cycle de Puccinia arachidis, Speg. Agronomie, 5. 479-85.
i
. '
138 iF". S. Savary et al.
?he first set of improvements could be directed t; a better description of &"y structure. Distinguishing several leaf layers in the groundnut crop canopy would allow consideration of vertical variations of microclimate characteristics (Zadoks & Schein, 1979), susceptibility parameters (Savary, 1987c), leafspot severity and life expectancy of the leaves. The introduction of vertical distribution of disease in the model would also be an important advantage for modelling crop losses due to groundnut diseases (Rabbinge & Rijsdijk, 1981).
The c rop sub-model represents canopy growth under optimum conditions; host-pathogen interactions were therefore assumed to be reducible to few coupling statements. Both feedbacks and feed-forwards (Zadoks & Rabbinge, 1985) should, however, be considered in the coupling of host and pathogen in a detailed epidemiological model (Rabbinge & Rijsdijk, 1981). The introduction of additional relations between host and pathogen would require additional detail in both sub-models, and especially in the host sub-model. For instance, rust effect on pod set and pod filling (Bell, 1986) could be studied with considerable improvement when simulated yield results from successive cohorts of pods (Boote el al., 1985).
The effects of plant water balance on rust lesion development (and vice versa, Zadoks & Schein, 1979; Rabbinge & Rijsdijk, 1981) could only be considered when plant water balance (Boote, 19826) is introduced in the host sub-model. Such additions improve the realism of epidemiological simulation models, and bring in sight the analysis of yield losses in the multiple pathosystem: ground-rust-leafspot.
'w! ACKNOWLEDGEMENTS
Thanks are due to S. Ledermann (CNEARC, Montpellier, France) and H. Voortman for numerous field observations. The assistance in computer work provided to the first author by R. Dierks and H. van Roermund (Department of Theoretical Production Ecology, Wageningen, The Netherlands) is gratefully acknowledged.
REFERENCES
Aylor, D. E. (1982). Modeling spore dispersal in a barley crop. Agric. Me:eorol., 26,
Bell, M.,(1986). The effect of foliage pathogens on the growth of peanut (Arachis 2 15-19.
h-vpogaea L.) in tropical Northern Australia. Ausr. J. rlgric. Res., 37, 31-42.
I
I I
I
t
i 1 I
I I I
1
i
I I
i
i i i 1
! i
j
I I
i !
I I
I

Savary, S. (1986). Relative humidity and wind velocity associated with diurnal rhythmicity of aerial dispersal of Piminia arachidis urediniospores. Neill. J. PI.
Savary, S. (19874. Enquête sur les maladies fongiques de l'arachide en Côte d'Ivoire. I. Mkthode d'enquête et Ctude descriptive: Les conditions culturales et les principales maladies. Neth. J . PI. Pathol., 93, 167-88.
Savary, S. ( I 9876). Enquête sur les maladies fongiques de l'arachide (Arachis hjpogaea) en Côte d'Ivoire. II. Epidlmiologie de la rouille de l'arachide (Puccinia arachidis). Netti. J. PI. Pathol., 93, 215-31.
Savary, S. (1987~). Decrease by plant development and leaf age of susceptibility of groundnut to rust (Puccinìa arachidis) in a susceptible cultivar. Netti. J. PI.
Savary, S. & Janeau, J. L. (1986). Rain-induced dispersal of Puccinia arachidis studied by means of a rainfall simulator. Neth. J. PI. Pathol., 92, 163-74.
Shrum, R. ( I 975). Simulation of wheat stripe rust (Puccinia striiforrnis West), using EPIDEMIC. a flexible plant disease simulator. Pennsylvania State Univ., Coll. Agric., Agric. Exp. Sta. Prog. Rep. 347, 41 p.
Smith, J. W. & Barfield, C. S. (1982). Management of preharvest insects. In Peanut ScienceandTecl~nology.ed. M. E. Pattee&C.T. Young, Yoakum. pp. 250-325.
Teng, P. S. (1985). A comparison of simulation approaches to epidemic modelling. Annu. Rev. Phyropathol., 23, 35 1-79.
Teng, P. S. & Bowen, K. L. (1985). Disease modelling and simulation. In The Cereal Rusts, Vol. II. ed. A. P. Roelfs & W. R. Bushnell, Academic Press, New York,
Teng, P. S., Blackie, M. J. & Close, R. C. (1977). A simulation analysis of crop yield loss due to rust disease. Agricultural S y s t e m , 2. 189-98.
Van Hees-Boukema, E. M. & Zadoks, J. C. (1986). Postponed germination of Puccinia recondita urediospores deposited on wheat seedlings. II. Infectivity of urediospores after postponed germination. Neth. J. PI. Path., 92, 71-80.
Van Keulen, H. 6r. De Milliano, W. A. J. (1984). Potential wheat yields in Zambia. A simulation approach. Agriculrural Systenis, 14, 171-92.
Van Keulen, H., Penning de Vries, F. W. T. & Drees, E. M. (1982). A summary model for crop growth. In Sinluluriori of Plant Gronvli and Crop Production. ed. F. W. T. Penning de Vries & H. M. Van Laar, Pudoc, Wageningen. pp.
Pathol., 92, 115-25.
Pathol., 93, 25-3 I .
pp. 435-66.
87-97. Waggoner, P. E. (1974). Simulation of epidemics. In Epidemics ojPlant Diseases. ed.
Wilkerson, G. G., Jones, J. W. & Poe, S. L. (1984). Effect of defoliation on peanut
Zadoks, J. C. (1971). Systems analysis and the dynamics of epidemics.
Zadoks, J. C. (1972~). Methodology of epidemiological research. Ann. REV.
Zadoks, J. C. (19726). Modern concepts in disease resistance in cereals. In The Way Ahead in Plant Breeding. ed. F. A. G. H. Lupton, G. Jenkins & R. Johnson, Eucarpia. Cambridge, pp. 89-98.
Zadoks, J. C. & Rabbinge, R. (1985). Modelling to a purpose. In Au'twnces in Plant Pathology. Vol. 3. hfathonaiical ~l.loclelling oj'Crop Diseuses. ed. C. A. Gilligan, Academic Press, London. pp. 2 3 1 4 .
J. Kranz, Springer-Verlag, Berlin, Heidelberg, New York, pp. 137-60.
plant growth. Crop Science, 24, 526-31.
Phytopathology, 61, 600-10.
.
Pl~-~toparhol., 10, 253-76.
P
Dynaniic simulation of groundnut rust 141
Zadoks, J. C. & Schein, R. D. (1979).,Epirìernìology and Plant Disease Management. Oxford University Press. New York, 427 pp.
Zadoks, J. C. & Van Hees-Boukema, E. M. (1986). Postponed gemination of Piiccinh recondita urediospores deposited on wheat seedlings. I. Ripening and longevity of urediospores with postponed gemination. Neth. J. PI. Parh., 92, 57-69.
e