Dynamic Radar Cross Section and Radar Doppler Measurements of ...
9
The AMTA host for the two conferences in India was Prof. 0. P. N. Calla, Director of the International Centre for Radio Sci- ence in Jodhpur. He was helpfiul and very hospitable throughout. In fact, the meetings were run with much ceremony and with special recognitions for each of the speakers. Dr. Janse van Rensburg summarized his first visit to India, "I found the people to be very friendly and welcoming and I had a good time." In fact, all AMTA speakers enjoyed the India experi- ence and look forward to a return visit! For more information on ATMS, visit http://www.atmns.org. Also, planning for the 2008 AMTA Regional Conference in Los Angeles is under way for the summer of 2008. We'll notify' everyone in the AMTA Corner when we have the date, but head over to http://www.amta.org to get the latest information. Enjoy the spring! This Month's Contribution This month's paper is from Brian M. Kent, PhD, Kueichien C. Hill, PhD), Alan Buterbaugh, and Greg Zelinski, Capt USAF with the Air Force Research Laboratory at Wright-Patterson AFB and Robert Hawley, Lisa Cravens, Tri-Van, Christopher Vogel, and Thomas Coveyou from ATK Mission Systems Group, in Dayton, Ohio. The paper is entitled "Dynamic Radar Cross Section and Radar Doppler Measurements of Commercial General Electric Windmill Power Turbines Part 1: Predicted and Measured Radar Signatures." The research examines the radar cross section signa- ture of various windmills over time, with both the dynamic RCS and the radar Doppler signatures measured. The measurements were then compared with modeled data results to verify the wind- mill models created. The problem with such large, moving metallic devices such as windmills is the potential interference such struc- tures present to an array of civilian air-traffic-control radars. A recent study by the Undersecretary of Defense for Space and Sen- sor Technology acknowledged the potential performance impact wind turbines introduce when located within line of site of air-traf- fic-control or air-route radars. We hope you enjoy their contribu- tion to the AMTA Corner. Feedback and Contact Information We're proud to be the AMTA Corner Associate Editors, and we wish to thank all those who contribute to its success, especially our authors who allow us to publish their papers in the AMTA Corner. In particular, AMIA extends our gratitude to Ross Stone for giving us the opportunity to contribute this column to this pres- tigious Magazine. If you wish to reference other previous AMITA publications, AMTA members can do so through our online archive at http://www.amta.org. If you are not a member, $50.00 and a few mouse clicks will get you registered as a member today! With the AMITA Corner, we're certainly open to feedback as to how we're doing. We can be e-mailed at stephen.schneider~wpafb.af mil or ieff~kemp(q~gtri.gaqtech.edu Until next time! Dynamic Radar Cross Section and Radar Doppler Measurements of Commercial General Electric Windmill Power Turbines Part 1: Predicted and Measured Radar Signatures Brian M. Kent 1 , Kueichien C. Hill', Alan Buterba ugh 1 , Greg Zelinskil, Robert Hawley 2 , Lisa Cravens 2 . Tni-Van 2 , .Christopher Vogee, and Thomas Cove you 2 'Ai Force Research Laboratory AFRLISNS Bldg 254, 2591 K St. Wright Patterson AFB, Ohio 45433-7602 USA E-mail: [email protected] 2ATK Mission Systems Group, Space Systems and Sensors 3975 Research Boulevard, Dayton, Ohio 45430 USA IEEE Antennas and Propagation Magazine, Vol. 50, No. 2, April 200821 211 Authorized licensed use limited to: University of Texas at Austin. Downloaded on June 9, 2009 at 12:48 from IEEE Xplore. Restrictions apply.
Transcript of Dynamic Radar Cross Section and Radar Doppler Measurements of ...
The AMTA host for the two conferences in India was Prof.0. P. N. Calla, Director of the International Centre for Radio Sci-ence in Jodhpur. He was helpfiul and very hospitable throughout. Infact, the meetings were run with much ceremony and with specialrecognitions for each of the speakers.
Dr. Janse van Rensburg summarized his first visit to India, "Ifound the people to be very friendly and welcoming and I had agood time." In fact, all AMTA speakers enjoyed the India experi-ence and look forward to a return visit!
For more information on ATMS, visit http://www.atmns.org.
Also, planning for the 2008 AMTA Regional Conference inLos Angeles is under way for the summer of 2008. We'll notify'everyone in the AMTA Corner when we have the date, but headover to http://www.amta.org to get the latest information. Enjoy thespring!
This Month's Contribution
This month's paper is from Brian M. Kent, PhD, KueichienC. Hill, PhD), Alan Buterbaugh, and Greg Zelinski, Capt USAFwith the Air Force Research Laboratory at Wright-Patterson AFBand Robert Hawley, Lisa Cravens, Tri-Van, Christopher Vogel, andThomas Coveyou from ATK Mission Systems Group, in Dayton,Ohio. The paper is entitled "Dynamic Radar Cross Section andRadar Doppler Measurements of Commercial General ElectricWindmill Power Turbines Part 1: Predicted and Measured Radar
Signatures." The research examines the radar cross section signa-ture of various windmills over time, with both the dynamic RCSand the radar Doppler signatures measured. The measurementswere then compared with modeled data results to verify the wind-mill models created. The problem with such large, moving metallicdevices such as windmills is the potential interference such struc-tures present to an array of civilian air-traffic-control radars. Arecent study by the Undersecretary of Defense for Space and Sen-sor Technology acknowledged the potential performance impactwind turbines introduce when located within line of site of air-traf-fic-control or air-route radars. We hope you enjoy their contribu-tion to the AMTA Corner.
Feedback and Contact Information
We're proud to be the AMTA Corner Associate Editors, andwe wish to thank all those who contribute to its success, especiallyour authors who allow us to publish their papers in the AMTACorner. In particular, AMIA extends our gratitude to Ross Stonefor giving us the opportunity to contribute this column to this pres-tigious Magazine. If you wish to reference other previous AMITApublications, AMTA members can do so through our onlinearchive at http://www.amta.org. If you are not a member, $50.00and a few mouse clicks will get you registered as a member today!With the AMITA Corner, we're certainly open to feedback as tohow we're doing. We can be e-mailed atstephen.schneider~wpafb.af mil or ieff~kemp(q~gtri.gaqtech.eduUntil next time!
Dynamic Radar Cross Section andRadar Doppler Measurements of
Commercial General Electric WindmillPower Turbines Part 1: Predicted and
Measured Radar Signatures
Brian M. Kent1, Kueichien C. Hill', Alan Buterba ugh1, Greg Zelinskil, Robert Hawley2,Lisa Cravens2 . Tni-Van2, .Christopher Vogee, and Thomas Cove you2
'Ai Force Research LaboratoryAFRLISNS Bldg 254, 2591 K St.
Wright Patterson AFB, Ohio 45433-7602 USAE-mail: [email protected]
2ATK Mission Systems Group, Space Systems and Sensors3975 Research Boulevard, Dayton, Ohio 45430 USA
IEEE Antennas and Propagation Magazine, Vol. 50, No. 2, April 200821 211
Authorized licensed use limited to: University of Texas at Austin. Downloaded on June 9, 2009 at 12:48 from IEEE Xplore. Restrictions apply.
Abstract
Commercial windmill-driven power turbines ("wind turbines") are expanding in popularity and use in the commercial powerindustry, since they can generate significant electricity without using fuel or emitting carbon-dioxide "greenhouse gas." In-country and near-off-shore wind turbines are becoming more common on the European continent. The United States hasrecently set long-term goals to generate 10% of national electric power using renewable sources. In order to make suchturbines efficient, current 1.5 MW wind-turbine towers and rotors are very large, with blades exceeding 67 m in diameter, andtower heights exceeding 55 m. Newer 4.5 MW designs are expected to be even larger. The problem with such large, moving,metallic devices is the potential interference such structures present to an array of civilian air-traffic-control radars. A recentstudy by the Undersecretary of Defense for Space and Sensor Technology acknowledged the potential performance impactwind turbines introduce when located within line of site of air-traffic-control or air-route radars [1]. In the spring of 2006, the AirForce Research Laboratory embarked on a rigorous measurement and prediction program to provide credible data to nationaldecision makers on the magnitude of the signatures, so that the interference issues could be credibly studied. This paper, thefirst of two parts, will discuss the calibrated RCS measurement of the turbines, and compare this data (with its uncertainty) tomodeled data.
Keywords: Doppler measurements; spectral analysis; radar cross sections; mobile diagnostic measurements
1. Introduction
T his two-part paper summarizes an Office of Undersecretary ofDefense-sponsored radar signature and Doppler measurement
and prediction campaign [1] for large, energy-producing wind tur-bines, manufactured by the General Electric Corporation. Thispaper will discuss the signature measurements and prediction por-tion, while Part 2 [2] will discuss the Doppler measurements andpredictions.
Wind-turbine power is becoming increasingly popular in bothEurope and the United States. Individual wind-turbine generatorscan produce --1.5 MW of clean and renewable energy, withoutincreasing carbon emissions or degrading the environment. Sincefuture power requirements for the US and Europe require the crea-tion of many gigawatts of electric generating capacity, large-areainstallations of wind turbines, called "wind farms," are beingplanned and installed throughout the world. Despite obviousenergy-independence and greenhouse-gas benefits, wind farms alsointroduce a potentially significant clutter problem for civilian andmilitary radar systems, if individual windmills are within theradar's line of sight. The purpose of this measurement campaign isto carefully predict and measure the radar signature (or radar crosssection) and Doppler signature of typical GE wind turbines asinstalled in the field. By recording relevant calibrated in-phase andquadrature (I, Q) signature data, various air-traffic and militaryradar manufacturers can accurately assess the impact of wind-tur-bine clutter on specific military and civilian radar models.
2. Description of a Single GE WindmillPower Turbine
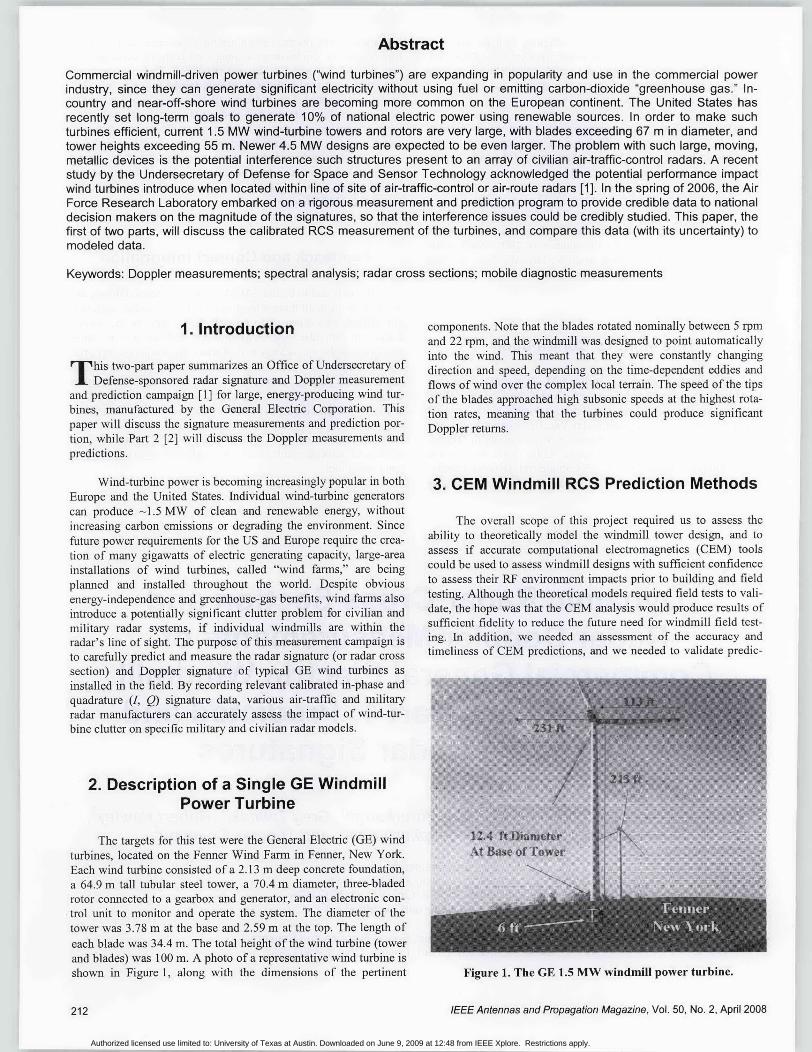
The targets for this test were the General Electric (GE) windturbines, located on the Fenner Wind Farm in Fenner, New York.Each wind turbine consisted of a 2.13 mn deep concrete foundation,a 64.9 mn tall tubular steel tower, a 70.4 mn diameter, three-bladedrotor connected to a gearbox and generator, and an electronic con-trol unit to monitor and operate the system. The diameter of thetower was 3.78 mn at the base and 2.59 m at the top. The length ofeach blade was 34.4 mn. The total height of the wind turbine (towerand blades) was 100 mn. A photo of a representative wind turbine isshown in Figure 1, along with the dimensions of the pertinent
212
components. Note that the blades rotated nominally between 5 rpmand 22 rpm, and the windmill was designed to point automaticallyinto the wind. This meant that they were constantly changingdirection and speed, depending on the time-dependent eddies andflows of wind over the complex local terrain. The speed of the tipsof the blades approached high subsonic speeds at the highest rota-tion rates, meaning that the turbines could produce significantDoppler returns.
3. CEM Windmill RCS Prediction Methods
The overall scope of this project required us to assess theability to theoretically model the windmill tower design, and toassess if accurate computational electromagnetics (GEM) toolscould be used to assess windmill designs with sufficient confidenceto assess their RF environment impacts prior to building and fieldtesting. Although the theoretical models required field tests to vali-date, the hope was that the GEM analysis would produce results ofsufficient fidelity to reduce the future need for windmill field test-ing. In addition, we needed an assessment of the accuracy andtimeliness of GEM predictions, and we needed to validate predic-
Figure 1. The GE 1.5 MW windmill power turbine.
IEEE Antennas and Propagation Magazine, Vol. 50, No. 2, April 2008
Authorized licensed use limited to: University of Texas at Austin. Downloaded on June 9, 2009 at 12:48 from IEEE Xplore. Restrictions apply.
tions with available measured data taken in the four main rad ar I aDIC I. I he wuxR' n m
bands (L, S, C, X). Since windmills vary over time, we needed to________________
do calculations for a variety of turbine incident or yaw angles Number_____ of___Facets ___
(azimuth) and elevation angles. Mesh 1 Mesh 2 Mesh 3
Given the sheer size of these windmills, we also had to
address the required geometric fidelity, and the density of the com-
putational meshes. We also needed to know how detailed the
geometry needed to be, and whether we had to calculate the entire
structure plus blades, or whether we could break the problem up
into smaller subsections.
The first order of business was to obtain the geometry from
General Electric, who graciously supplied AFRE with a series of
STEP and IGES files for all the windmill component parts. We
then employed ACAD [2], a CAD/mesh-generation tool that is
capable of producing high-precision, high-quality meshes suitable
for detailed GEM simulations. Since we were interested in fre-
quencies from 1.3-9.7 GHz, the overall geometry of the windmill
required the rendering of over 403,655 facets for our finest grid
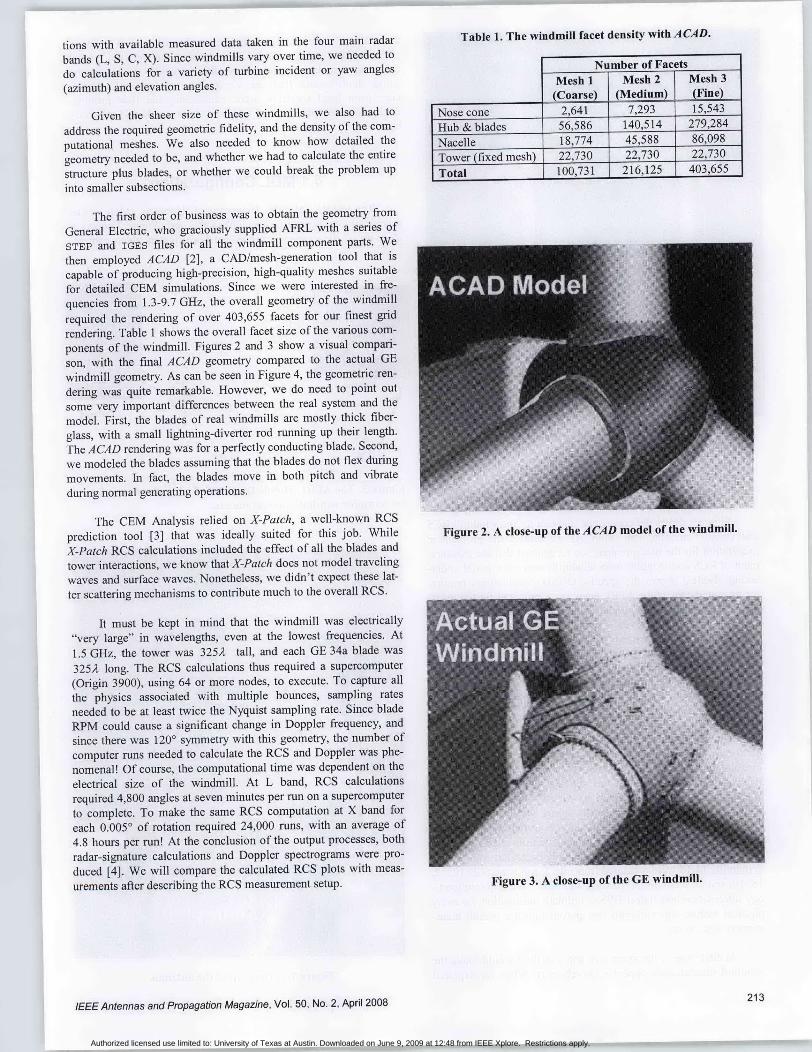
rendering. Table 1 shows the overall facet size of the various com-
ponents of the windmill. Figures 2 and 3 show a visual compari-
son, with the final ACAD geometry compared to the actual GE
windmill geometry. As can be seen in Figure 4, the geometric ren-
dering was quite remarkable. However, we do need to point out
some very important differences between the real system and the
model. First, the blades of real windmills are mostly thick fiber-
glass, with a small lightning-diverter rod running up their length.
The ACAD rendering was for a perfectly conducting blade. Second,
we modeled the blades assuming that the blades do not flex during
movements. In fact, the blades move in both pitch and vibrate
during normal generating operations.
The GEM Analysis relied on X-Patch, a well-known RCS
prediction tool [3] that was ideally suited for this job. While
X-Patch RCS calculations included the effect of all the blades and
tower interactions, we know that X-Patch does not model traveling
waves and surface waves. Nonetheless, we didn't expect these lat-
ter scattering mechanisms to contribute much to the overall RCS.
It must be kept in mind that the windmill was electrically"'very large" in wavelengths, even at the lowest frequencies. At
1.5 GHz, the tower was 3252 tall, and each GE 34a blade was
3252 long. The RCS calculations thus required a supercomputer
(Origin 3900), using 64 or more nodes, to execute. To capture all
the physics associated with multiple bounces, sampling rates
needed to be at least twice the Nyquist sampling rate. Since blade
RPM could cause a significant change in Doppler frequency, and
since there was 1200 symmetry with this geometry, the number of
computer runs needed to calculate the RCS and Doppler was phe-
nomenal! Of course, the computational time was dependent on the
electrical size of the windmill. At L band, RCS calculations
required 4,800 angles at seven minutes per run on a supercomputer
to complete. To make the same RCS computation at X band for
each 0.005' of rotation required 24,000 runs, with an average of
4.8 hours per run! At the conclusion of the output processes, both
radar-signature calculations and Doppler spectrograms were pro-
duced [4]. We will compare the calculated RCS plots with meas-
urements after describing the RCS measurement setup.
IEEE Antennas and Propagation magazine, Vol. 50, No. 2, April 2008
Nose cone 2,641 - 7,293 15,543
Hub & blades 56,586_ 140,514 279,284
Nacelle 18,774 45,588 86,098
Tower (fixed mesh) 2,3 2,3 22,730
Total 100,731 216,125 403,655
Figure 2. A close-up of the ACAD model of the windmill.
Figure 3. A close-up of the GE windmill.
213
Authorized licensed use limited to: University of Texas at Austin. Downloaded on June 9, 2009 at 12:48 from IEEE Xplore. Restrictions apply.

the problem in depth, we realized a number of serious technicalissues that had to be worked. These included, but were not limitedto, terrain variations, wind and weather variations, radar-antennasiting, multi-bounce (between windmills), unintentional interfer-ence from legal spectrum users, calibration, and field probing.Each issue was addressed in turn, and these are described brieflybelow.
4.1 MDL ConfigurationThe AFRL Mobile Diagnostic Laboratory (MDL) was
specifically configured to accomplish this test. Figure 7 shows aclose-up of the exterior antenna and bore-sighted video camera.
Target
Figure 4. The overall A CAD windmill geometry. ----
Figure 5. The AFRL Mobile Diagnostic Laboratory experimen-4. Full-Scale Field RCS Measurements tal setup for windmill measurements.
Figure 5 shows the conceptual diagram for the windmill RCSand Doppler measurement setup. As we studied the problem inpreparation for the measurement, we recognized that the measure- 4ment of RCS and Doppler from windmills was not a trivial under-taking. Table 2 shows the specific 0USD measurement require-ments levied against the AFRL team as we prepared for the meas-urement campaign. The middle column in Table 2 represents the"thresholds" or "must haves" for the measurements. The right col-umn outlines "measurement requirements," and the "stoplight"colors show if we met (green), partially met (yellow), or did notmeet (red) the requirements. On balance, we met all the thresholdrequirements imposed by our customer, a remarkable achievement At ngiven that we had less than two full months to prepare for and exe-moncute the measurements.
The first order of business was to perform a site survey. Fig-ure 6 shows the Fenner, New York, wind-farm map, and the threemeasurement sites (2, 6, and GE) that were ultimately selected.Each number represents one of the 20 windmills installed atFenner. The sites were selected based on topology, land-owneraccess (all were on private property), siting, and a diversity of ter-rain. Of the 20 windmills, we ultimately measured 10 single wind-mills, as well as groups of two or three windmills in a single radarrange cell. Windmill #2 (WM 2) was only measured from site 6. 4Windmills 14-18 were measured from site 2, and windmills 10, 12,18, 19, and 20 were measured from site "GE." We acquired topol-ogy information and (later) GPS coordinate information for everyphysical feature and windmill that played into the overall meas-urement uncertainty.
At first glance, the sheer size and signature would make thewindmill measurement appear relatively easy. When we explored Figure 7. A close-up of the antenna.
nWienna adII Propagation Magazine, Vol. 5u, No. 2, April 2008
Authorized licensed use limited to: University of Texas at Austin. Downloaded on June 9, 2009 at 12:48 from IEEE Xplore. Restrictions apply.
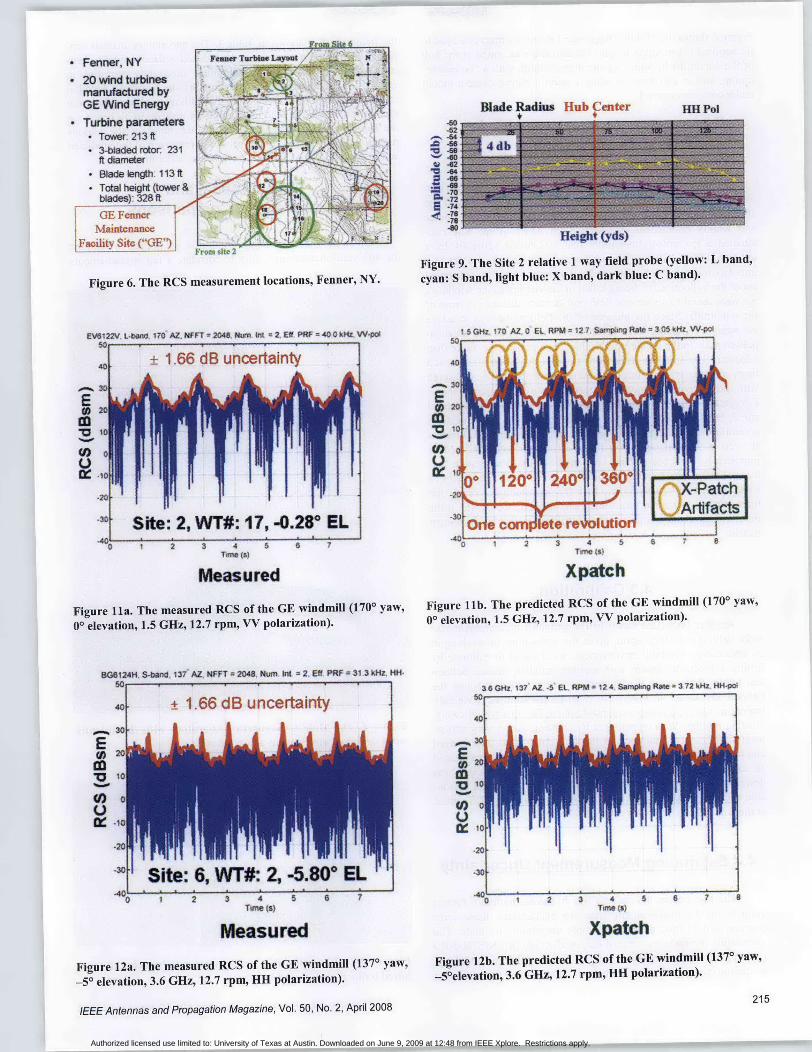
Figure 6. The RCS measurement locations, Fenner, NY.
EW122V. L.Siuud 170'AZ. WFT - 204& Nw b* - 2. EW P1W - 400Oktk. W$0I
Blade Radius Hub Center Tif Pol
S 4db
cyan: S band, light blue: X band, dark blue: C band).
i sGmz, 170 AZ 0 EL, RPM - 12.7. Sw'i sg Ra*-3G5k.OZ.W-qW
I1
SSite: 2, WT#: 17,40.280 EL'0 - 1 2 3 4
TOW48(s5 6 7
Measured
Figure 1 a. The measured RCS of the GE windmill (1700 yaw,00 elevation, 1.5 GE~z, 12.7 rpm, VV polarization).
W8012A 48. -Snd 131'A?. NVPT = 200. Mium Wn 2 e. ElPRW - 31,3 k~a. 1*1-so.
40 ± 1.66 dB uncertaintyI
.0-E
-4]Site: 6, WT#:- 2 -5-WOEL 1
Twme(s)
Xpatch
00 elevation, 1.5 GHz, 12.7 rpm, VV polarization).
36GHz. 137 AZ, -5 EL. RPU 124, Sampkv Rae* 372 kHz, WiH-O
40
O*0'
UIx10
-20
.30,
1A 0 a I I.A L A l It 1 i
11 1 "II1 Ii 11
Tome (6)
Measured
5 6 7
Figure 12a. The measured RCS of the GE windmill (1370 yaw,-50 elevation, 3.6 GHz, 12.7 rpm, HH polarization).
IEEE Antennas and Propagation Magazine, Vol. 50, No. 2, April 2008
-0 1 2 3 4TWO (S)5 6 1
XpatchFigure 12b. The predicted RCS of the GE windmill (1370 yaw,
-5*elevation, 3.6 GHz, 12.7 rpm, HH polarization).
215
I
s 8 ? An 6 6 7
so
Authorized licensed use limited to: University of Texas at Austin. Downloaded on June 9, 2009 at 12:48 from IEEE Xplore. Restrictions apply.
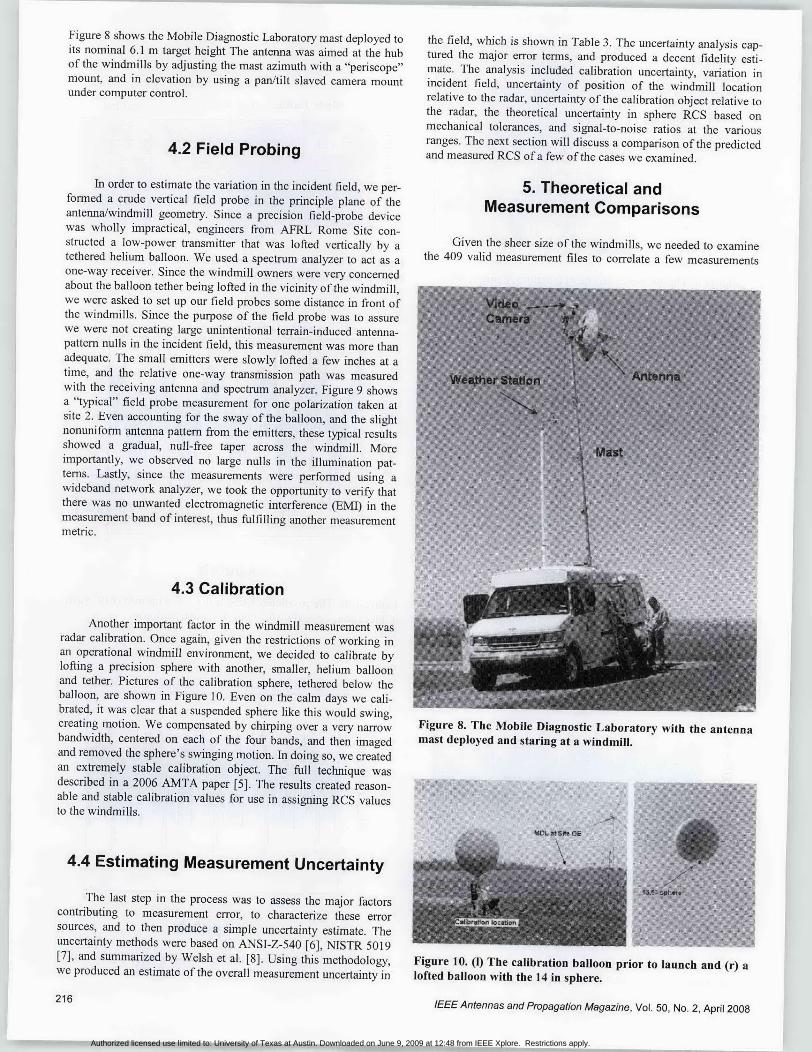
Figure 8 shows the Mobile Diagnostic Laboratory mast deployed toits nominal 6.1 m target height The antenna was aimed at the hubof the windmills by adjusting the mast azimuth with a "periscope"mount, and in elevation by using a pan/tilt slaved camera mountunder computer control.
4.2 Field Probing
In order to estimate the variation in the incident field, we per-formed a crude vertical field probe in the principle plane of theantenna/windmill geometry. Since a precision field-probe devicewas wholly impractical, engineers from AFRE Rome Site con-structed a low-power transmitter that was lofted vertically by atethered helium balloon. We used a spectrum analyzer to act as aone-way receiver. Since the windmill owners were very concernedabout the balloon tether being lofted in the vicinity of the windmill,we were asked to set up our field probes some distance in front ofthe windmills. Since the purpose of the field probe was to assurewe were not creating large unintentional terrain-induced antenna-pattern nulls in the incident field, this measurement was more thanadequate. The small emitters were slowly lofted a few inches at atime, and the relative one-way transmission path was measuredwith the receiving antenna and spectrum analyzer. Figure 9 showsa "typical" field probe measurement for one polarization taken atsite 2. Even accounting for the sway of the balloon, and the slightnonuniform antenna pattern from the emitters, these typical resultsshowed a gradual, null-free taper across the windmill. Moreimportantly, we observed no large nulls in the illumination pat-terns. Lastly, since the measurements were performed using awideband network analyzer, we took the opportunity to verity thatthere was no unwanted electromagnetic interference (EMI) in themeasurement band of interest, thus fulfilling another measurementmetric.
4.3 Calibration
Another important factor in the windmill measurement wasradar calibration. Once again, given the restrictions of working inan operational windmill environment, we decided to calibrate bylofting a precision sphere with another, smaller, helium balloonand tether. Pictures of the calibration sphere, tethered below theballoon, are shown in Figure 10. Even on the calm days we cali-brated, it was clear that a suspended sphere like this would swing,creating motion. We compensated by chirping over a very narrowbandwidth, centered on each of the four bands, and then imagedand removed the sphere's swinging motion. In doing so, we createdan extremely stable calibration object. The full technique wasdescribed in a 2006 AMTA paper [5]. The results created reason-able and stable calibration values for use in assigning RCS valuesto the windmills.
4.4 Estimating Measurement Uncertainty
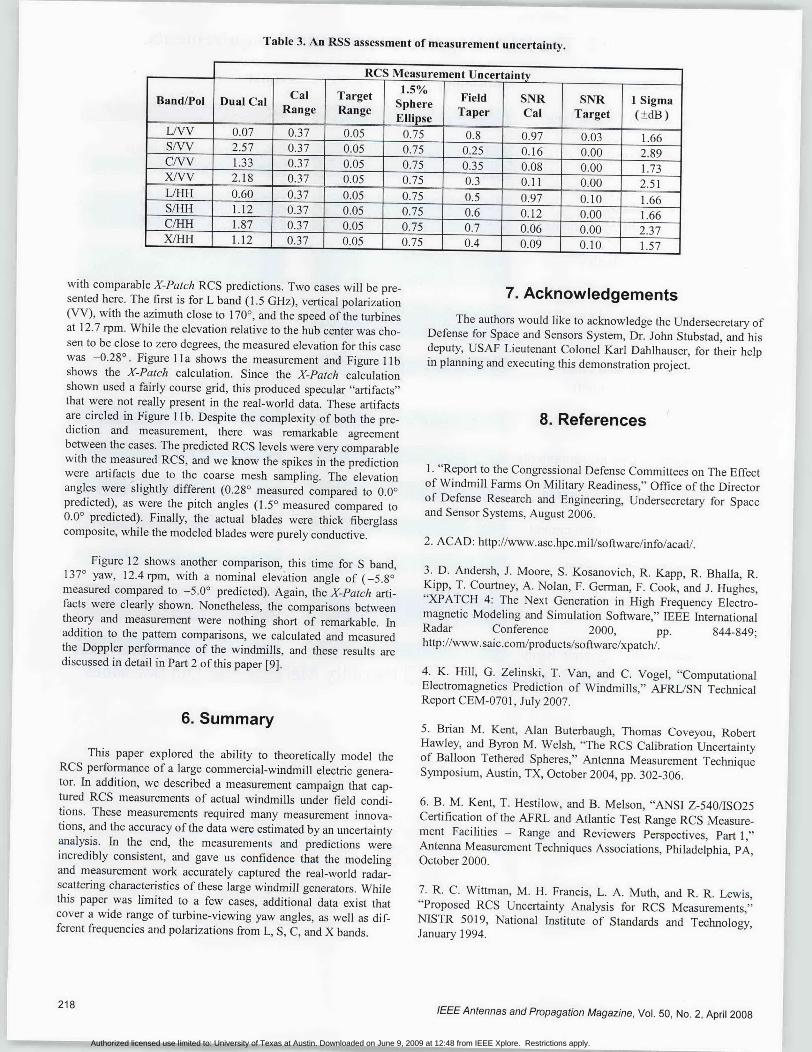
The last step in the process was to assess the major factorscontributing to measurement error, to characterize these errorsources, and to then produce a simple uncertainty estimate. Theuncertainty methods were based on ANSI-Z-540 [6], NISTR 5019[7], and sumimarized by Welsh et al. [8]. Using this methodology,we produced an estimate of the overall measurement uncertainty in
216
the field, which is shown in Table 3. The uncertainty analysis cap-tured the major error terms, and produced a decent fidelity esti-mate. The analysis included calibration uncertainty, variation inincident field, uncertainty of position of the windmnill locationrelative to the radar, uncertainty of the calibration object relative tothe radar, the theoretical uncertainty in sphere RCS based onmechanical tolerances, and signal-to-noise ratios at the variousranges. The next section will discuss a comparison of the predictedand measured RCS of a few of the cases we examined.
5. Theoretical andMeasurement Comparisons
Given the sheer size of the windmills, we needed to examinethe 409 valid measurement files to correlate a few measurements
Figure 8. The Mobile Diagnostic Laboratory with the antennamast deployed and staring at a windmill.
Figure 10. (I) The calibration balloon prior to launch and (r) alofted balloon with the 14 in sphere.
IEEE Antennas and Propagation Magazine, Vol. 50, No. 2, April 2008
Authorized licensed use limited to: University of Texas at Austin. Downloaded on June 9, 2009 at 12:48 from IEEE Xplore. Restrictions apply.
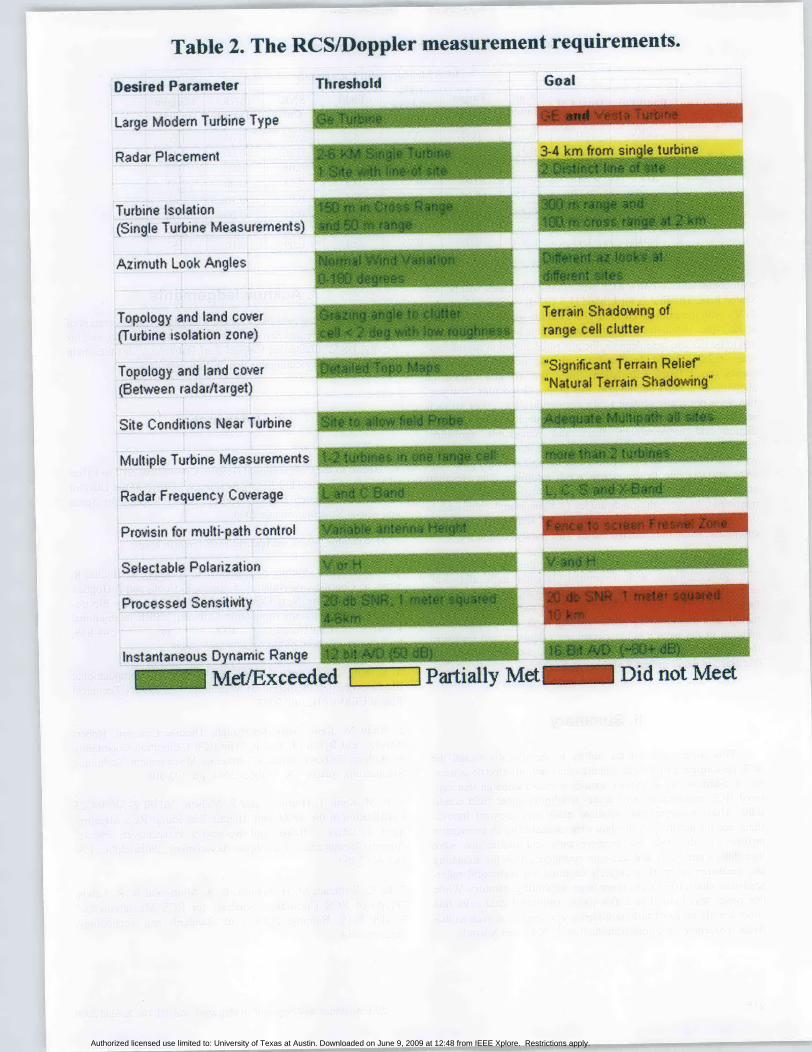
Table 2. The RCSIDoppler measurement requirements.
Desired Parameter Threshold Goal
Large Modem Turbine Type
Radar Placement 3- mfo inl ubn
Turbine Isolation(Single Turbine Measurements)
Azimuth Look Angles
Topology and land cover(Turbine isolation zone)
Topology and land cover(Between radar/target)
Site Conditions Near Turbine
Multiple Turbine Measurements
Radar Frequency Coverage
Provisin for muhti-path control
Selectable Polarization
Processed Sensitivity
Terrain Shadowing ofrange cell clutter
"Significant Terrain Relief"*Natural Terrain ShadowiAng"
instantaneous Dynamic Range OM9911I Met/Exceeded EZ]Partially Met Did not Meet
mo
Authorized licensed use limited to: University of Texas at Austin. Downloaded on June 9, 2009 at 12:48 from IEEE Xplore. Restrictions apply.
Dual Cal CalRange
TarlRan
Table 3. An RSS assessment of measurement uncertainty.
RCSMeasurement Uncertaint
~et 1.5er Field SNR SN 1Simge Spher Taper Cal Tre ±B
LIVV _70.0 .7 0.05 0.75 0.8 0.97 0.03 1.66S/KVV 2.57 037 0.5 0.75 0.25 010.0 2.89C/1VV 1.33 0.37 0.0 .5 0.35 0.08 0.00 -1.73X/VV 2. 18 0.3 .5 .5 03 -0.11 0.00 2.51L/HiH 0.60 0.37 0.05 0.75 0.5 0.97 0.10 1.66
S/H 1.12 0.37 0.05 0.75 0.6 0.12 0.00 1.66CHT 1.87 0.37 0.05 0.75 0.7 0.06 0.00 2.37X/H 1.12 0.37 0.05 0.7 5 0.4 0.09 0.10 1.57
with comparable X-Patch RCS predictions. Two cases will be pre-sented here. The first is for L band (1.5 GHz), vertical polarization(VV), with the azimuth close to 1700, and the speed of the turbinesat 12.7 rpm. While the elevation relative to the hub center was Cho-sen to be close to zero degrees, the measured elevation for this casewas -0.28'. Figure I I a shows the measurement and Figure 1 l bshows the X-Patch calculation. Since the X-Patch calculationshown used a fairly course grid, this produced specular "artifacts"that were not really present in the real-world data. These artifactsare circled in Figure 1 lb. Despite the complexity of both the pre-diction and measurement, there was remarkable agreementbetween the cases. The predicted RCS levels were very comparablewith the measured RCS, and we know the spikes in the predictionwere artifacts due to the coarse mesh sampling. The elevationangles were slightly different (0.28' measured compared to 0.00predicted), as were the pitch angles (1.50 measured compared to0.00 predicted). Finally, the actual blades were thick fiberglasscomposite, while the modeled blades were purely conductive.
Figure 12 shows another comparison, this time for S band,1370 yaw, 12.4 rpm, with a nominal elevation angle of (-5.81measured compared to -~5.0' predicted). Again, the X-Patclz arti-facts were clearly shown. Nonetheless, the comparisons betweentheory and measurement were nothing short of remarkable. Inaddition to the pattern comparisons, we calculated and measuredthe Doppler performance of the windmills, and these results arediscussed in detail in Part 2 of this paper [9].
6. Summary
This paper explored the ability to theoretically model theRCS performance of a large commercial-windmill electric genera-tor. In addition, we described a measurement campaign that cap-tured RCS measurements of actual windmills under field condi-tions. These measurements required many measurement innova-tions, and the accuracy of the data were estimated by an uncertaintyanalysis. In the end, the measurements and predictions wereincredibly consistent, and gave us confidence that the modelingand measurement work accurately captured the real-world radar-scattering characteristics of these large windmill generators. Whilethis paper was limited to a few cases, additional data exist thatcover a wide range of turbine-viewing yaw angles, as well as dif-ferent fr~equencies and polarizations from L, S, C, and X bands.
218
7. AcknowledgementsThe authors would like to acknowledge the Undersecretary of
Defense for Space and Sensors System, Dr. John Stubstad, and hisdeputy, USAF Lieutenant Colonel Karl Dahlhauser, for their helpin planning and executing this demonstration project.
8. References
1. "Report to the Congressional Defense Committees on The Effectof Windmill Farms On Military Readiness," Office of the Directorof Defense Research and Engineering, Undersecretary for Spaceand Sensor Systems, August 2006.
2. ACAD: http://www.asc.hpc.mil/software/info/acad/.
3. D. Andersh, J. Moore, S. Kosanovich, R. Kapp, R. Bhalla, R.Kipp, T. Courtney, A. Nolan, F. German, F. Cook, and J. Hughes,"XPATCH 4: The Next Generation in High Frequency Electro-magnetic Modeling and Simulation Software," IEEE InternationalRadar Conference 2000, PP. 844-849;http://www.saic.com/products/software/Xpatch/.
4. K. Hill, G. Zelinski, T. Van, and C. Vogel, "ComputationalElectromagnetics Prediction of Windmills," AFRL/SN TechnicalReport CEM-0701, July 2007.
5. Brian M. Kent, Alan Buterbaugh, Thomas Coveyou, RobertHawley, and Byron M. Welsh, "The RCS Calibration Uncertaintyof Balloon Tethered Spheres," Antenna Measurement TechniqueSymposium, Austin, TX, October 2004, pp. 302-306.
6. B. M. Kent, T. Hestilow, and B. Melson, "ANSI Z-540/15025Certification of the AFR.L and Atlantic Test Range RCS Measure-ment Facilities -Range and Reviewers Perspectives, Part I ,"Antenna Measurement Techniques Associations, Philadelphia, PA,October 2000.
7. R. C. Wittman, M. H. Francis, L. A. Muth, and R. R. Lewis,"Proposed RCS Uncertainty Analysis for RCS Measurements,"NISTR 5019, National Institute of Standards and Technology,January 1994.
IEEE Antennas and Propagation Magazine, Vol. 50, No. 2, April 2008
Band/Pol SNR 1 Sigma(±dB)
Authorized licensed use limited to: University of Texas at Austin. Downloaded on June 9, 2009 at 12:48 from IEEE Xplore. Restrictions apply.
8. Byron Welsh, William Muller, William Forster, Brian M. Kent,
and Dan Turner, "Update on the Air Force Research Laboratory
Advanced Compact Range Calibration Uncertainty Analysis,"
Antenna Measurement Techniques Symposium, October 2003,
Irvine CA, pp. 3-8.
9. B. M. Kent, A. Buterbaugh, K. C. Hill, G. Zelinski, R. Hawley,
L. Cravens, T. Van, C. Vogel, and T. Coveyou, "Dynamic Radar
Cross Section and Radar Doppler Measurements of Commercial
General Electric Windmill Power Turbines Part 2 -Predicted and
Measured Doppler Signatures," AMTA 2007 Symposium, St.
Louis, MO. I
IEEE Antennas and Propagation Magazine, Vol. 50, No. 2, April 2008 219
Authorized licensed use limited to: University of Texas at Austin. Downloaded on June 9, 2009 at 12:48 from IEEE Xplore. Restrictions apply.