Dynamic modeling of hybrid PV/Thermal solar system...
98
DEPARTMENT OF TECHNOLOGY AND BUILT ENVIRONMENT Dynamic modeling of hybrid PV/Thermal solar system for hydrogen production David Sanchez Pamplona Ramon Rodriguez November 2008 Master’s Thesis in Energy Systems Energy Systmes Examiner: Taghi Karimipanah Supervisor: Nabil Kassem
Transcript of Dynamic modeling of hybrid PV/Thermal solar system...

DEPARTMENT OF TECHNOLOGY AND BUILT ENVIRONMENT
Dynamic modeling of hybrid PV/Thermal solar system for hydrogen production
David Sanchez Pamplona Ramon Rodriguez
November 2008
Master’s Thesis in Energy Systems
Energy Systmes Examiner: Taghi Karimipanah
Supervisor: Nabil Kassem


2
ABSTRACT One method to produce clean hydrogen is water electrolysis, but the high electricity cost and the low efficiencies of the actual thermal plants that produce the electricity required make of this method an expensive solution. When water at high temperatures is used for the electrolysis, we require less electricity, making this a more cost effective solution. The total energy requirement (ΔH) for the electrolysis process consists of an electrical energy part (ΔG) and a thermal energy part (Q=TΔS), which provides the heat demand of the endothermic electrolytic reactions. The basic idea of High Temperature Electrolysis (HTE) is to replace part of the required energy by thermal energy produced from renewable energy resources such as thermal or photovoltaic solar energy. In this project we are going to investigate the use of a hybrid photovoltaic / thermal solar array that can provide both electricity and high temperature water. The main advantages of such concept can be attributed to:
The use of abundant cheap solar energy. No harmful gas emissions, thus minimum impact on the environment. Significant improvement of overall efficiency of electrolytic hydrogen
production. Due to the natural variation of the solar radiation intensity this system has to be analyzed under transient conditions, therefore, the main objective of this project is to study the dynamic behavior of a hybrid PV/thermal system using computer models and simulations and see how the production of hydrogen is affected.

3
TABLE OF CONTENTS ABSTRACT........................................................................................................................ 2 FIGURES............................................................................................................................ 5 TABLES ............................................................................................................................. 6 LITERATURE REVIEW AND DATA COLLECTION ................................................... 7 1.1 INTRODUCTION ........................................................................................................ 8 1.2 HYDROGEN .............................................................................................................. 10
1.2.1 Introduction........................................................................................................ 10 1.2.2 Production ......................................................................................................... 10 1.2.3 Delivery .............................................................................................................. 12 1.2.4 Storage............................................................................................................... 12 1.2.5 Conversion ........................................................................................................ 13 1.2.6 Applications ....................................................................................................... 14
1.3. ELECTROLYSIS AND ELECTROLYSERS........................................................... 16 1.3.1 Introduction........................................................................................................ 16 1.3.2 Electrolyser........................................................................................................ 19
1.4 SOLAR ENERGY ...................................................................................................... 21 1.4.1 Introduction........................................................................................................ 21
1.5. PHOTOVOLTAIC SOLAR ENERGY ..................................................................... 23 1.5.1 Introduction........................................................................................................ 23 1.5.2 Review of models and systems ..................................................................... 24 1.5.3 Photovoltaic Market ......................................................................................... 27
1.6 HYBRID SOLAR PANEL ......................................................................................... 30 1.6.1 Introduction........................................................................................................ 30 1.6.2 Review of models and systems ..................................................................... 32
1.6.2.1 Liquid PVT collectors................................................................................... 32 1.6.2.2 Air PVT Collectors ....................................................................................... 34 1.6.2.3 Ventilated PV with heat recovery ................................................................. 35 1.6.2.4 PVT Concentrator ......................................................................................... 35
1.6.3 Market of survey of PVT Collectors............................................................... 35 1.6.3.1 Liquid PVT collectors market....................................................................... 36 1.6.3.2 Air PVT collectors market ............................................................................ 39 1.6.3.3 Market of ventilated PV with heat recovery ................................................. 40 1.6.3.4 PVT concentrators market ............................................................................ 41 1.6.3.5 Other interesting projects developed with PVT collectors .......................... 43
MODELING ..................................................................................................................... 46 2.1 INTRODUCTION ...................................................................................................... 47 2.2 PHOTOVOLTAIC GENERATOR ............................................................................ 48
2.2.1 Introduction........................................................................................................ 48 2.2.2 Electrical Model ................................................................................................ 48 2.2.3 Thermal Model .................................................................................................. 53
2.3 PHOTOVOLTAIC THERMAL PANEL (PVT) ........................................................ 55 2.3.1 Introduction........................................................................................................ 55 2.3.2 Optical Model .................................................................................................... 56 2.3.3 Thermal Model .................................................................................................. 60
2.4 ELECTROLYSER...................................................................................................... 67

4
2.4.1 Introduction........................................................................................................ 67 2.4.2 High Temperature Solid Oxide Electrolyser..Error! Bookmark not defined.
2.4.2.1 Mathematical modeling .................................Error! Bookmark not defined. 2.5 HEAT EXCHANGER .................................................Error! Bookmark not defined. 2.6 HEAT THERMAL ENERGY STORAGE SYSTEMSError! Bookmark not defined.
2.6.1 Introduction.........................................................Error! Bookmark not defined. 2.6.2 Mathematical modeling ....................................Error! Bookmark not defined.
2.7 OTHER DATA AND AUXILIARY EQUIPMENT .................................................. 69 2.7.1 Weather Data .................................................................................................... 69 2.7.2 Secondary Battery.............................................Error! Bookmark not defined. 2.7.3 Power Conditioning Equipment.......................Error! Bookmark not defined. 2.7.4 Pump ...................................................................Error! Bookmark not defined.
APPENDIX B - PHOTOVOLTAIC PANEL................................................................... 89 APPENDIX C – PHOTOVOLTAIC THERMAL PANEL.............................................. 90 APPENDIX D - SOLID OXIDE ELECTROLYSER CELL (SOEC).............................. 94 APPENDIX E – HEAT EXCHANGER........................................................................... 97 REFERENCES ................................................................................................................. 70

5
FIGURES Figure 1.1, simple schematic of a production plant of hydrogen realized by the authors. Figure 1.2, natural hydrogen cycle obtained of National Energy Roadmap. Figure 1.3, technologies to produce hydrogen. Figure 1.4, commercial Hydrogen Car. Figure 1.5, commercial Hydrogen Boat namely Elding driven in Iceland. Figure 1.6, high temperature electrolyser. Figure 1.7, energy demand for the electrolysis at different temperatures (Hino, R; Haga, K; Aita, H; Sekita, K. “R&D on hydrogen production by high-temperature electrolysis of steam”; 2004). Figure 1.8, example of a thermal solar collector. Figure 1.9, example photovoltaic panel. Figure 1.10, hydrogen production methods using solar energy (Glatzmaier, G; Blake, D; Showalter, S. “Assessment of Methods for Hydrogen production using Concentrated Solar Energy”, 1998). Figure 1.11, a photovoltaic cell and a photovoltaic module. Figure 1.12, major materials used in photovoltaic cells (Source: Photon International, values obtained summing data of the manufacturers). Figure 1.13, distribution between crystalline silicon and thin film cell (PV Status Report 2007, Arnulf Jäger-Waldau). Figure 1.14, distribution of silicon panels in the market (Source: Photon International, values obtained summing data of the manufacturers). Figure 1.15, world PV cell production from 1990 to 2005 (PV Status Report 2007, Arnulf Jäger-Waldau). Figure 1.16, world production of photovoltaic cell in 2007 (Source: Photon International, values obtained summing data of the manufacturers). Figure 1.17, Europe production of photovoltaic cell in 2007 (Source: Photon International, values obtained summing data of the manufacturers). Figure 1.18, photovoltaic private companies (PV Status Report 2007, Arnulf Jäger-Waldau). Figure 1.19, current vs. Voltage at different temperatures. Figure 1.20, photovoltaic thermal panel designed by PVTWINS. Figure 1.21, PVT liquid collector concepts designed by Zondag.H. Figure 1.22, sheet and tube PVT liquid collector. Figure 1.23, cross section of the PVT experimental models designed by Y. Tripanagnostopoulos. Figure 1.24, example of an air PVT collector. Figure 1.25, photovoltaic thermal concentrator. Figure 1.26, Multi Solar System. Figure 1.27, PVT Collector designed by PVTWINS. Figure 1.28, PVT Panel designed by PVTWINS. Figure 1.29, schematic of one installation using HYSOLAR. Figure 1.30, installation made by Sekisui Chemical in Japan. Figure 1.31, “Solar Venti” collector designed by Aidt Miljø.

6
Figure 1.32, Twinsolar installed in public swimming pool. Figure 1.33, Twinsolar installed in a mountain refuge. Figure 1.34, picture Twinsolar system. Figure 1.35, Solarwall. Figure 1.36, Library from Mataro (Spain). Figure 1.37, installation of PVT concentrators produced by Heliodynamics on the roof. Figure 1.38, installation of a concentrator solar collector- Solar 8. in the World Heritage Museum in Skule (Sweden). Figure 1.39, solar thermal concentrator plant with Power Spar. Figure 1.40, flat plate photovoltaic thermal. Figure 1.41, Model PVT designed in Center Thermal of Lyon. Figure 1.42, PV/T systems with booster diffuse reflectors: (a) horizontal building roof system installation; (b) PV/T experimental system with indication of diffuse reflected solar rays. Figure 1.43, solar powered house- project Crowder Collegue. Figure 2.1, the equivalent circuit for the one-diode model. Figure 2.2, the equivalent circuit for the two-diode model. Figure 2.3, typical I–U and P–U characteristics for a PV generator. Figure 2.4, sheet and tube PVT liquid collector. Figure 2.5, the numbering of the radiative flux densities in the net radiation method in the topglass. Figure 2.6, cross section of the PVT experimental models. Figure 2.7, the serpentine like tube in a sheet and tube type combi-panel is modeled as a long straight tube. Figure 2.8, heat flows and temperatures in the various layers of the sheet and tube type PVT. Figure 2.9, temperature profiles of laminate and absorber in between tubes. Figure 2.10, temperature along the cell for average current densities. Figure 2.11, solar plant to produce hydrogen at high temperature. Figure 2.12, solid oxide electrolyser cell. Figure 2.13, tubular SOEC. Figure 2.14, planar SOEC. Figure 2.15, schematic view of a planar SOEC stack.
TABLES Table 1.1, hydrogen storage alternatives obtained of national energy roadmap. Table 1.2, Fuel Cell Types obtained of National Energy Roadmap. Table 1.3, electrolyser manufacturers. Table 1.4, band gap and theoretical efficiency of some materials. Table 2.1, chemical reactions involved in a SOEC. Table 2.2, heat exchangers at different temperatures. Table 2.3, comparison between the different methods of heat storage. Table 2.4, materials with potential use as PCM.

7
Chapter 1
LITERATURE REVIEW AND DATA COLLECTION
8
1.1 INTRODUCTION Facing the future in a sustainable development, beside the necessity of reducing the global warming and the drastic increases in oil prices have encouraged many countries around the world to adopt new energy-policies.
Hydrogen has the potential to solve several major challenges facing world today, the hydrogen produced can be used for fuel cell vehicles, electricity generation, or industrial applications, but in order for the hydrogen to become the main source of energy replacing the fossil fuels there are many obstacles like economical, technological and environmental problems among others. The overall challenge to hydrogen production is cost reduction.
The hydrogen that is produced from renewable sources is getting more importance due to the increase in emission gases and global warming. An attractive option to produce hydrogen is produce hydrogen from water via electrolysis because water is the most abundant element on earth, moreover is an adequate way to store the incoming energy of the sun in a chemical form. In addition, during periods of low electrical demand, many renewable power generators produce excess electricity, which is lost, and one method to use this could be to produce hydrogen. Solar installations are increasing rapidly, people act in response to the increasing energy costs, grid shutdowns and government concerns regarding supplies of natural gas. People also realize that by installing a solar system, they not only save money over the long run, but they contribute personally in improving the environment and in enhancing the energy security of the country.
For this project, we are going to use solar hybrid panels to produce hydrogen using high temperature electrolysis. With this innovative method we can rise the temperature of the water and obtain electricity with one single panel. Due to the high temperature of the water, the electricity consumption for the electrolysis is less than electrolysis at ambient temperature making the system more efficient. This performance will measure the amount of chemical energy obtained from solar energy. With a higher performance the area of the collectors is reduced in order to produce a certain amount of hydrogen, as a result the overall cost is reduced. In addition the greenhouse gas emissions are zero because the electricity is obtained from a renewable source.

In the following figure (Figure 1.1) we can see a simple schematic of a production plant of hydrogen, using high temperatures.
9
Fig. 1.1, Plant of hydrogen production using electrolysis
In addition a study using conventional photovoltaic panel will be realized to compare it with the study realized with hybrid panel, so we will be able to observe the advantages and disadvantages associated to the use of hybrid solar panel.
Water Supply
Hybrid Solar Panel
Electrolyser
Electric Converter cc/ca
H2 O2
H2O (l) H2O (g)
Alternately Current
1.2 HYDROGEN
1.2.1 Introduction
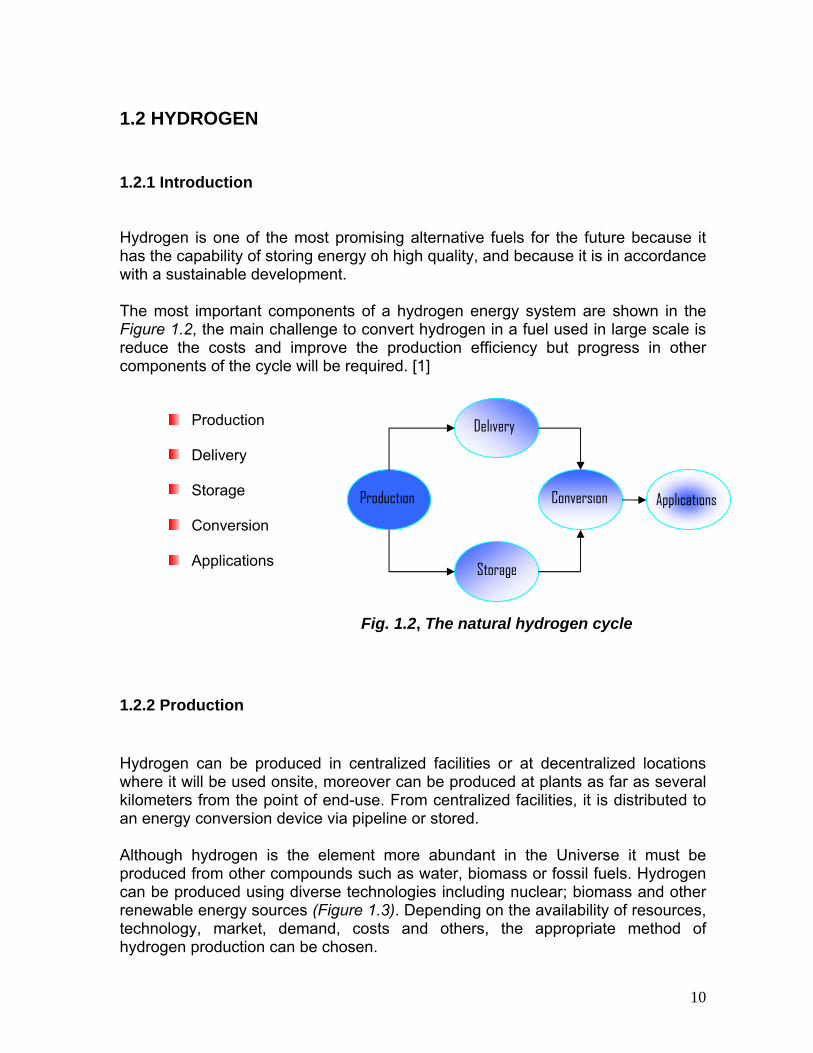
Hydrogen is one of the most promising alternative fuels for the future because it has the capability of storing energy oh high quality, and because it is in accordance with a sustainable development. The most important components of a hydrogen energy system are shown in the Figure 1.2, the main challenge to convert hydrogen in a fuel used in large scale is reduce the costs and improve the production efficiency but progress in other components of the cycle will be required. [1]
Production Delivery
10
Delivery
Storage
Conversion
Applications
1.2.2 Production
Hydrogen can be produced in centralized facilities or at decentralized locations where it will be used onsite, moreover can be produced at plants as far as several kilometers from the point of end-use. From centralized facilities, it is distributed to an energy conversion device via pipeline or stored. Although hydrogen is the element more abundant in the Universe it must be produced from other compounds such as water, biomass or fossil fuels. Hydrogen can be produced using diverse technologies including nuclear; biomass and other renewable energy sources (Figure 1.3). Depending on the availability of resources, technology, market, demand, costs and others, the appropriate method of hydrogen production can be chosen.
Production
Conversion Applications
Storage
Fig. 1.2, The natural hydrogen cycle

Fig. 3, Technologies to produce hydrogen
Several technologies to produce cost effective hydrogen are described next: [2]
Natural Gas Reforming: Natural gas contains methane (CH4) that can be used to produce hydrogen via thermal processes, such as steam methane reformation and partial oxidation. Currently this method is the most energy-efficient and also it is cost-effective when applied to large load, for this reason is the most used.
Coal Gasification: Coal is converted into a gaseous mixture of hydrogen, carbon monoxide, carbon dioxide, and other compounds by applying heat under pressure in the presence of steam.
Biomass Gasification: Biomass is converted into a gaseous mixture of hydrogen, carbon monoxide, carbon dioxide, and other compounds by applying heat under pressure in the presence of steam and a controlled amount of oxygen.
Nuclear high temperature electrolysis: Heat from a nuclear reactor can be used to improve the efficiency of water electrolysis to produce hydrogen. By increasing the temperature of the water, less electricity is required to split it into hydrogen and oxygen, which reduces the total energy required.
Photobiological and Photoelectrochemical: When certain microbes, such as green algae consume water in the presence of sunlight, they produce hydrogen as a product of their natural metabolic processes.
Renewable Electrolysis: Water electrolysis is the conversion of electrical energy into chemical energy in the form of hydrogen and oxygen. The electrical energy is later recovered by reacting hydrogen with oxygen in a fuel cell or combustion engine.
H2O electricity H2 + ½O2 [1.1]
11

12
Ideally, the electrical power needed to drive the reaction [1.1] is provided by a renewable resource such as wind, solar, geothermal. Actually this method is not as energy-efficient or cost as using fossil fuels.
High-Temperature Thermo chemical Water-Splitting: Another water-splitting method uses high temperatures generated by solar energy to drive a series of chemical reactions that split water.
1.2.3 Delivery
Delivery system moves hydrogen from the point of production to an end use device and vary depending of the production method. It is actually transported by pipeline or road via with tube trailers. When the distance of distribution is short (around 200 Km) distribution can be realized with high pressure cylinders but for distance smaller it is required transport hydrogen as a liquid. The high costs of delivery hydrogen methods can cause a major use of decentralized stations where hydrogen is directly used. [1]
Efforts should focus on the development of better delivery systems, pipelines materials, compressors to reduce the cost because at present is cheaper fossil delivery methods than hydrogen.
1.2.4 Storage
Hydrogen produced in plants may need to be stored before being converted into energy. Currently hydrogen can store as liquid, solid or gas form, a summary is shown in Table 1.1. The most used technology is compressed hydrogen gas in tanks although this system requires big space to store a small amount of hydrogen. For this reason new designs to store hydrogen at pressure around 70 MPA are being developed. Other method store hydrogen as liquid, in this case less space is required than gas system but it is necessary use cryogenic containers. Moreover, the liquefaction of hydrogen is a process which large evaporative losses. Hydrogen can also be stored as solid configuration adsorbed on carbon structures, when the hydrogen is needed, it can be obtained subjecting carbon under certain temperature and pressure conditions. The most promising carbon materials for hydrogen storage are carbon nanotubes. An alternative technique which is emerging is the use of chemical hydrides that are a class of compounds that can be stored in solution as an alkaline liquid.

13
Table 1.1, Hydrogen storage alternatives
Compressed Fuel Storage - Cylindrical Tanks - Quasi-comformable Tanks
Liquid Hydrogen Storage - Cylindrical tanks
- Eliptical Tanks - Criotanks - HP Liquid Tanks
Solid Storage Comformable Storage - Hybride Materials - Carbon Adsorption Chemical Hydrides - Off-board Recycling
1.2.5 Conversion
Conversion devices are installed into end-use applications and used to generate electricity for buildings and communities, and to power vehicles and portable devices. Once hydrogen is produced and delivered to a conversion device, it is used to fuel combustion engines and fuel cells that generate electrical, mechanical, and thermal energy. Engines can combust hydrogen in the same manner as gasoline, vehicles with hydrogen internal combustion engines are now in the demonstration phase and turbine designed specifically using hydrogen is under development. A fuel cell is an electrochemical device that converts the chemical energy of a fuel and an oxidant to electrical current (DC). In the case of hydrogen-oxygen fuel cell, hydrogen (H2) is the fuel and oxygen (O2) is the oxidant. The total fuel reaction is:
( ) ( ) energyelectricallOHgOgH +→+ 222 )(21 [1.2]
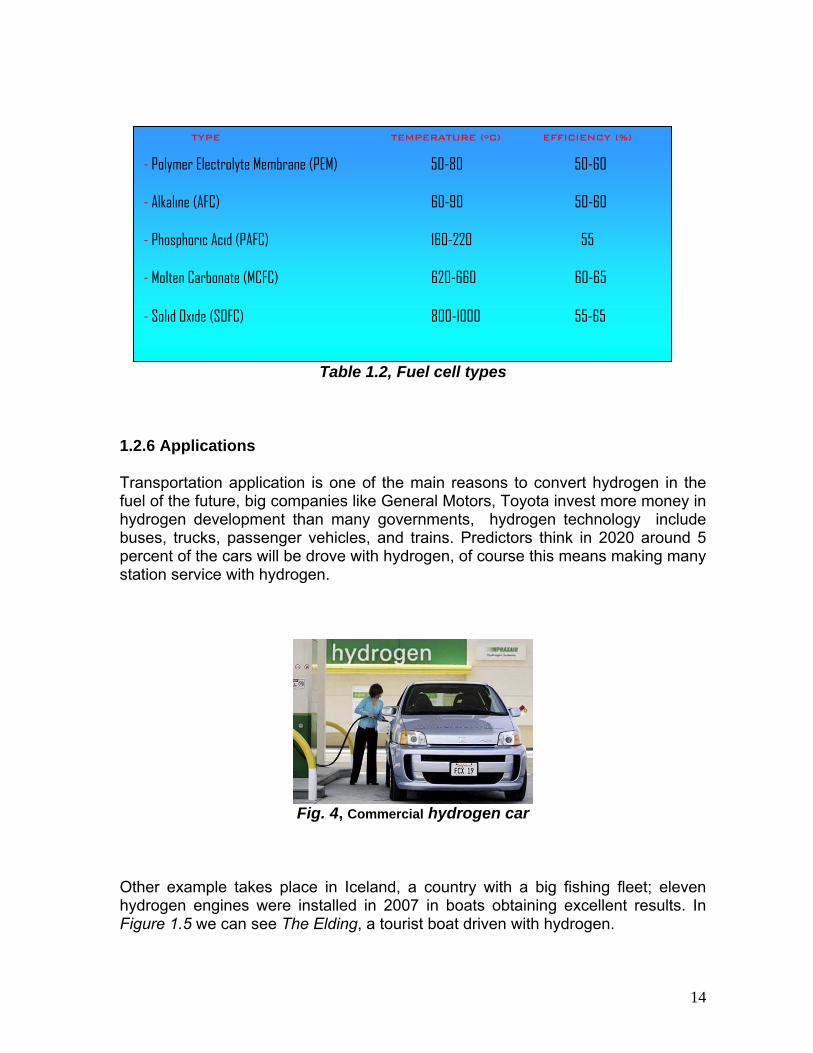
A number of fuel cell types are being developed and tested for use in different applications as vehicles, distributed power or combined heat and power. The difference between cells is the type of electrolyte used which can be alkaline, acid and phosphoric as more popular. In Table 1.2 there are fuel cells more development for commercial use.
14
Table 1.2, Fuel cell types
TYPE TEMPERATURE (ºC) EFFICIENCY (%)
- Polymer Electrolyte Membrane (PEM) 50-80 50-60 - Alkaline (AFC) 60-90 50-60 - Phosphoric Acid (PAFC) 160-220 55 - Molten Carbonate (MCFC) 620-660 60-65 - Solid Oxide (SOFC) 800-1000 55-65
1.2.6 Applications
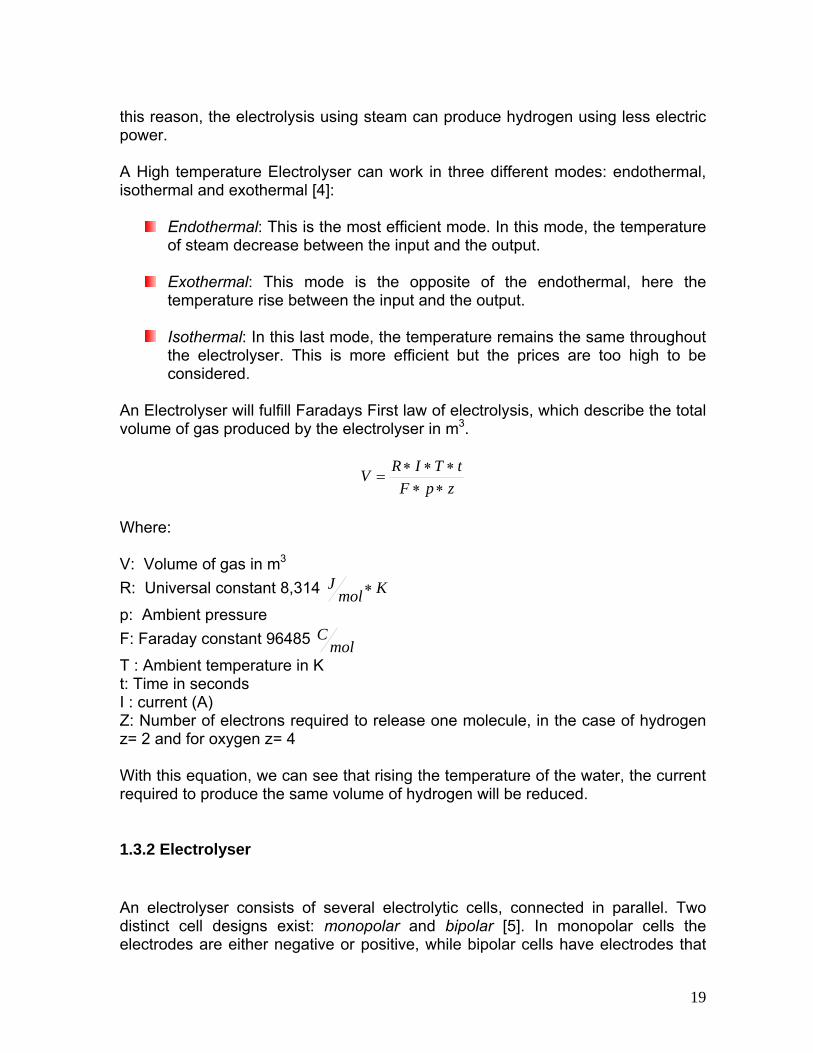
Transportation application is one of the main reasons to convert hydrogen in the fuel of the future, big companies like General Motors, Toyota invest more money in hydrogen development than many governments, hydrogen technology include buses, trucks, passenger vehicles, and trains. Predictors think in 2020 around 5 percent of the cars will be drove with hydrogen, of course this means making many station service with hydrogen.
Fig. 4, Commercial hydrogen car
Other example takes place in Iceland, a country with a big fishing fleet; eleven hydrogen engines were installed in 2007 in boats obtaining excellent results. In Figure 1.5 we can see The Elding, a tourist boat driven with hydrogen.

Fig.1.5, Commercial hydrogen boat
Stationary power applications include backup power units, grid management, power for remote locations, stand-alone power plants for towns and cities, distributed generation for buildings, and cogeneration. Portable power generation today: Portable applications for fuel cells include consumer electronics, business machinery, and recreational devices.
15

1.3. ELECTROLYSIS AND ELECTROLYSERS
1.3.1 Introduction
Hydrogen is usually produced in an industrial scale or by steam reforming or as a byproduct of petroleum or chemical production. Another method for hydrogen production that will be used in this project is water electrolysis. The electrolysis of the water is a known technology that has been studied for many years. The electrolysis is produced when an electrical current pass through an ionized substance in this case water between two electrodes and creates a chemical reaction, separating the oxygen and the hydrogen. This process happens when there are enough charged ions in a medium to create a current, Normal water doesn’t contain enough free ions to conduct a current, therefore, usually different chemicals like sodium chloride are added to the water to have the ions required for the process.
H2O + electricity H2 + ½ O2
There are several types of electrolysers [3], and the most common ones are:
Alkaline Electrolysers: is a common technology easy to fabricate. Is the most well known and dominating technology today in the market, but also acidic water electrolysers is commercially available.
Proton Exchange Membrane Electrolysers: Is a promising technology ideal
for small and medium applications, using renewable energy.
High Temperature Electrolyser: this technology is still under development. In this type of electrolyser, a part of the energy required for splitting water into hydrogen and oxygen is provided as heat, making the process more efficient, reducing the electricity demand and reducing the costs. In Figure 1.6 we can see a simple diagram of a HTES electrolyser.
Fig.1.6, High temperature electrolyser
16

Thermo chemical Electrolysers: convert all sorts of biomass into gases which then can be reformed to hydrogen, similar to the conventional reformer processes (see Education Kit: Fuel Reforming).
Photochemical Electrolysers: With the sunlight, it divides the water into
hydrogen and oxygen directly.
Biochemical and photo-biochemical: In this process a bacteria is used to produce hydrogen.
Photo electrochemical Electrolysers.
Acidic Electrolysers.
There are around 20 manufacturers of electrolysers worldwide that produce alkaline or PEM electrolysers, in Table 1.3; we can see some of those manufactures and some of their products. The high price of these equipments makes them a non cost-effective solution, compared to other technologies, such as hydrocarbon reformers. In order to compete, the technology has to be developed.
17
Table 1.3, Electrolyser manufacturers
COMPANY PRODUCT H2 PRODUCTION RATED POWER OPERATING INPUT VOLTAGE
Avalence Hydrofiller 175 10kg/day 70% efficiency 25kW Electric HG02 0.2 Nm3/hr 1.6kW, scalable up to 10kW Hydrogen Inc. ELT Elektrolyse Atmospheric 3 to 330 Nm3/h 4.3 – 4.6 kWh/Nm3 H2 Technik Electrolyses Distributed S20 0.53Nm3/h 200 240 VAC Energy H6m 6Nm3/h 380 480 VAC Systems 3 phase Hydrogenics HyLYZER 2.5 0-2.5kg/day 3,8kW (5 kW max) 22-28 V Corporation HyLYZER 20 0-20kg/day
HyLYZER 65 0-65kg/day 70% efficiency
StatoilHydro Atmospheric 4,3kWh/Nm3
Electrolysers No 5010 0-50 Nm3/h No 5040 300-377 Nm3/h

In electrolysis, the energy efficiency is a measure of how much electrical energy is contained within the hydrogen. As we saw in the table above, we can find efficiencies of around 70% or higher (based on the Lower Heating Value of Hydrogen). One of the main inconvenient of the conventional electrolysers is the electricity consumption. Since the electricity required for this process by the electrolyser is high, the production of hydrogen using this method is not economically viable. In a common electrolyser, around the 60% of the electrical power is used to transport the oxygen due to the high chemical potential gradient. The electrolysis process can take place at different temperatures. In the following Figure 1.7, we can see that the total energy that is required for the electrolysis increase as the temperature increase, whereas the required electrical energy is less. The electrolysis at high temperatures is possible when an external source of heat is available, like solar power. For instance the electricity required to split the water at 1000ºC is less than the required at 100ºC, this happens because the electric current density is increased, this means that the electrolyser at high temperatures is more efficient and can be cost effective, close to the thermo chemical processes, and with the advantage of zero greenhouse emissions and no corrosive chemicals used.
Fig. 1.7, Energy demand for the electrolysis at different temperatures
The total energy required (ΔH) for water splitting consists of the Gibbs free energy (ΔG) and a certain amount of caloric energy (TΔS). The electrical demand is proportional to the Gibbs free energy and decrease as the temperature rise. For
18
this reason, the electrolysis using steam can produce hydrogen using less electric power. A High temperature Electrolyser can work in three different modes: endothermal, isothermal and exothermal [4]:
Endothermal: This is the most efficient mode. In this mode, the temperature of steam decrease between the input and the output.
Exothermal: This mode is the opposite of the endothermal, here the
temperature rise between the input and the output.
Isothermal: In this last mode, the temperature remains the same throughout the electrolyser. This is more efficient but the prices are too high to be considered.
An Electrolyser will fulfill Faradays First law of electrolysis, which describe the total volume of gas produced by the electrolyser in m3.
zpFtTIRV
∗∗∗∗∗
=
Where: V: Volume of gas in m3 R: Universal constant 8,314 Kmol
J ∗
p: Ambient pressure F: Faraday constant 96485 mol
C
T : Ambient temperature in K t: Time in seconds I : current (A) Z: Number of electrons required to release one molecule, in the case of hydrogen z= 2 and for oxygen z= 4 With this equation, we can see that rising the temperature of the water, the current required to produce the same volume of hydrogen will be reduced.
1.3.2 Electrolyser
An electrolyser consists of several electrolytic cells, connected in parallel. Two distinct cell designs exist: monopolar and bipolar [5]. In monopolar cells the electrodes are either negative or positive, while bipolar cells have electrodes that
19
20
are negative on one side and positive on the other side (separated by an electrical insulator) The electrolyte used in conventional alkaline water electrolysers has traditionally been aqueous potassium hydroxide (KOH), mostly with solutions of 20–30 wt. % because of the optimal conductivity and remarkable corrosion resistance of stainless steel in this concentration range. The typical operating temperatures and pressures of these electrolysers are 70–100°C and 1–30 bar [6]. One characteristic of the electrolysers is the non linear voltage vs. current behavior. The current supplied to the electrolyser must be limited; also the temperature of it has to be controlled to prevent changes in its performance. Therefore, a control for the current supplied to the electrolyser is needed. This will be more noticeable in the system proposed in this project, because the electricity provided by the PV cells is changing constantly, then an electrical is required to deal with this dynamic behavior. After the electrolyser, the system may require compressors to achieve the final pressure required for the storage of the hydrogen, and depending on the application, different types of compressors can be used: Membrane compressors and multi stage compressors among others. These compressors represent a high investment for the system. Recent studies have focus on the production of hydrogen at high pressure, using alkaline and PEM electrolysers, which can obtain energy savings in the entire process. If the hydrogen produced by the electrolyser is not pure enough, it has to be purified to avoid accidents. It is not safe to store mixtures of hydrogen and air or hydrogen and oxygen.

1.4 SOLAR ENERGY
1.4.1 Introduction
Most of the natural energy on earth is solar energy; about 30% of the total solar energy incident on the atmosphere of the earth is directly reflected back into space as short wave radiation. The rest is distributed onto the earth’s surface, where it is utilized in artificial energy conversion or transferred to natural energy conversion processes. In the case of artificial energy conversion Solar energy can be mainly utilized in two ways, either to use it directly for heating or cooling of air and water (Figure 1.8) or to convert it into electrical energy by using photovoltaic (PV) modules (Figure 1.9), and as we said in the introduction, it can also be used to produce hydrogen.
Fig. 1.8, Thermal solar collector Fig. 1.9, Photovoltaic module In Figure 1.10, we can see that there are different methods to produce hydrogen with solar energy, the main three are: photochemical, electrochemical and thermo chemical processes, there are also combinations of these methods.
21

Fig. 1.10, Hydrogen production methods using solar energy
22

1.5. PHOTOVOLTAIC SOLAR ENERGY
1.5.1 Introduction
Photovoltaic (PV) is the most direct way to convert solar radiation into electricity, this technology generates direct current (DC) electrical power from semiconductors when they are illuminated by photons. The electricity is proportional to the light received by the semiconductors. Photovoltaic is generally considered to be an expensive method of producing electricity. However, in off-grid situations photovoltaic is very often the most economic solution to provide the required electricity service. The growing market all over the world indicates that solar electricity has entered many areas in which its application is economically viable. Additionally photovoltaic is very attractive for who want to contribute to the establishment of a new and more environmentally benign electricity supply system. The photovoltaic effect can be produced in solid, liquid and gas materials, but within the solid materials we can find the semiconductors, which have a high efficiency to convert solar energy into electrical energy, practically all photovoltaic devices incorporate a pn junction in a semiconductor across which the photo voltage is developed. These devices are also known as solar cells (Figure 1.11).
Fig. 1.11, A photovoltaic cell and a photovoltaic module
For practical use solar cells are packaged into modules containing either a number of cells, depending on the application, connected in series or parallel, commercially
23

is more usual in series. The module serves two purposes: It protects the solar cells from the ambient and it delivers a higher voltage than a single cell. Furthermore module has often a structure that make easier the transportation and manipulation. Module produces DC current that is typically transformed into AC current by an electronic device called inverter, now is possible use this electricity in electrical equipment or also electricity can be stored in batteries.
1.5.2 Review of models and systems
The maximum efficiency of a solar cell is determined by the material’s ability to absorb photon energy over a wide range, and on the band gap of the material. Table 1.4 shows that materials with band gaps close to the maximum solar radiation (about 1.5 eV) are good for solar cells.
24
Table 1.4, Band gap and theoretical efficiency of some materials
MATERIAL BAND GAP (eV) MAXIMUM EFFICIENCY (%)
- CuInSe2 0.98 25
- Si 1.1 28 - GaAs 1.4 30 - CdTe 1.5 29 - Si 1.7 27
Commercially there are a wide variety of technologies available, at various stages of development, the more used is the silicon in different configurations, around 90% in crystalline form as we can see in the Figure 12. Crystalline silicon dominates the market and although their decline in favor of other technologies has been announced a number of times, they presumably will retain their leading role for a time due to high efficiencies are possible and the ecological impact is low.

25
CrystallineSiliconAmorphousSiliconCadmiumTellurideCooper IndiumDiseleniumOthers
Beyond silicon forms there are other potential solar cell materials with high light absorption and are therefore suitable for thin-film solar cells, this type of cell also has a promising future due to the ongoing shortage in silicon feedstock and the production lines for thin film solar cells led to a massive expansion of investments. The most promises are Copper Indium Diselenide (CISe2), Cadmium Telluride (CdTe) and Thin Film Silicon. In Figure 1.13 can observe the predicted growth for crystalline silicon and thin films the next years.
Fig. 1.13, Distribution between crystalline silicon and thin film cell
The first material to appear was Silicon (Si) which is the most abundant element in the surface of the earth (apart from the oxygen), in order to hydrogen become a semiconductor and can be used in photovoltaic panel fabrication, silicon must have a high purity grade, over 98%. On the earth is found like silicon dioxide (SiO2) and to get the purity mentioned above refinement process is needed which is very expensive due to considerable input energy required.
87,4 %
5,2 %
4,7 % 0,5 % 2,3 %
Fig. 1.12, Major materials used in photovoltaic cells
Conventional silicon needs a thickness of about 100 μm of silicon to obtain a high absorption of photons in solar spectrum. Taking into account fifty percent of the cost of a module is due to the cost of processed silicon and that semiconductor industry has an unstable behavior lead to decrease the use of silicon in the fabrication of PV panels to reduce the cost. Currently news designs like thin film silicon is emerging in the market and improving its efficiency notably, this type of panel needs a thickness of about 50 μm. Within silicon panels can find the next models:
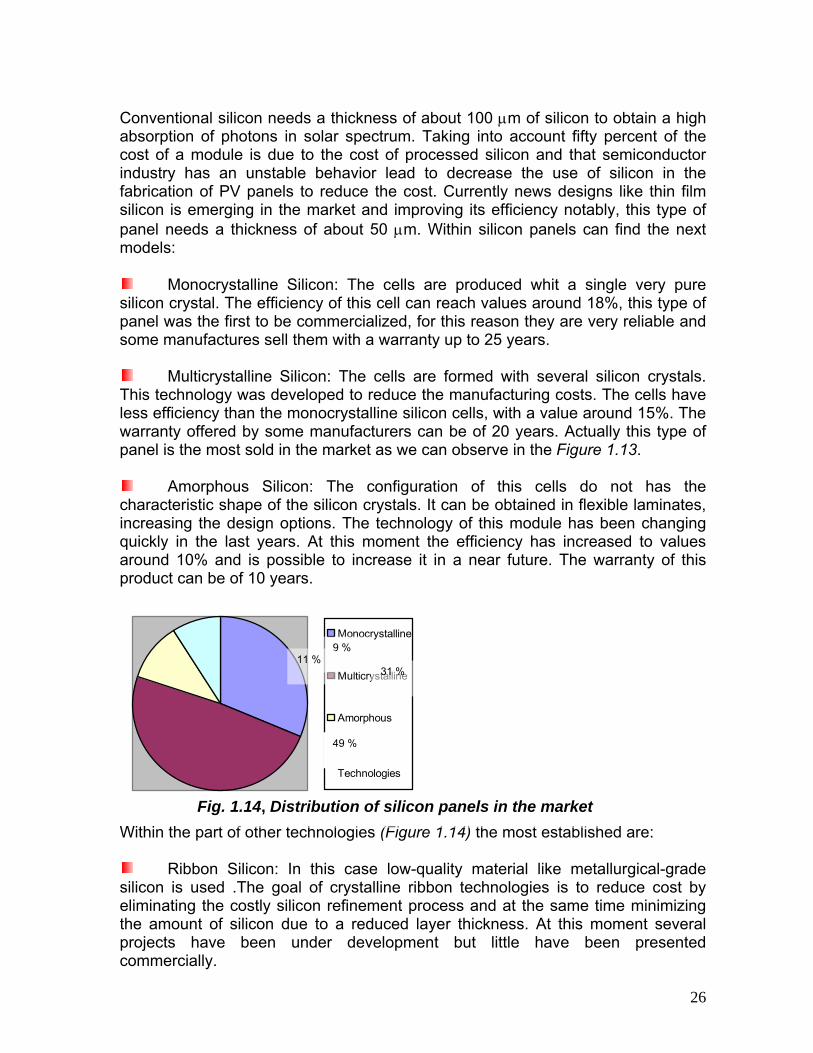
Monocrystalline Silicon: The cells are produced whit a single very pure silicon crystal. The efficiency of this cell can reach values around 18%, this type of panel was the first to be commercialized, for this reason they are very reliable and some manufactures sell them with a warranty up to 25 years.
Multicrystalline Silicon: The cells are formed with several silicon crystals. This technology was developed to reduce the manufacturing costs. The cells have less efficiency than the monocrystalline silicon cells, with a value around 15%. The warranty offered by some manufacturers can be of 20 years. Actually this type of panel is the most sold in the market as we can observe in the Figure 1.13.
Amorphous Silicon: The configuration of this cells do not has the characteristic shape of the silicon crystals. It can be obtained in flexible laminates, increasing the design options. The technology of this module has been changing quickly in the last years. At this moment the efficiency has increased to values around 10% and is possible to increase it in a near future. The warranty of this product can be of 10 years.
Monocrystalline
Multicrys
26
talline
Amorphous
OtherTechnologies
Within the part of other technologies (Figure 1.14) the most established are:
Ribbon Silicon: In this case low-quality material like metallurgical-grade
silicon is used .The goal of crystalline ribbon technologies is to reduce cost by eliminating the costly silicon refinement process and at the same time minimizing the amount of silicon due to a reduced layer thickness. At this moment several projects have been under development but little have been presented commercially.
49 %
Fig. 1.14, Distribution of silicon panels in the market
9 % 11 %
31 %

Cristalline Thin Film Silicon: Making a good design of the film, Si cells with a
thickness of only a few micrometers can have reasonable efficiencies. Due to the reduced thickness of the active silicon layer of typically 5 to 50 μm a substrate layer is needed as a mechanical support. This substrate used to be low quality silicon like the previously mentioned (Ribbon Silicon). This type the panel has considerably increased its production the last years and is probably one of the panels with more future [7].
Thin-film solar cells based on CdTe have a very long tradition and are also just at the onset of commercial production. After a long and varied development phase, they arrived at cell efficiencies of 16% and large-area module efficiencies of over 10% [8].
1.5.3 Photovoltaic Market
As we have said above, solar energy in general and photovoltaic energy in particular is a key technology to reduce many of the problems that exist actually with the environment and also PV energy is a way to increase the use of renewable sources.
Fig. 1.15, World PV cell production from 1990 to 2005 In this moment photovoltaic energy industry is growing rapidly in production volume and incomes, in countries like Spain, last year the growth was near 500% while in the rest of the countries of Europe there is a growth close to 50% each year as we can observe in the Figure 1.15. Business analysts predict that the market will increase the next year due to the raise of electricity prices from conventional energy sources.
27

Actually Germany is the country with more photovoltaic energy capacity installed with around 1100 MWp, followed by Spain which has shown a strong growth reaching 451 MWp of photovoltaic energy, one of the main causes of this expansion in Germany and Spain is due to the new modern policies which promote the use of these technologies with economical aids and other benefits. Outside Europe countries like Japan and United States are at the top in the use of photovoltaic energy. The prognostics that were done in the white paper target have been exceeded with a big margin. Speaking about photovoltaic industry is very clear viewing Figure 1.16,1.17 as the rapid expansion produced in China, and Taiwan in less measure, has provoked situate on the top of manufacturer. Also Japan due principally to the existence of big electronic companies as we will see below.
28
Japan (22%)
Europe (27%)
EE.UU (6%)
China (28%)
Australia (1%)
India(2%)
Taiwan (11%)
Others (3%)
141.1 MW
Fig. 1.16, World production of photovoltaic cell in 2007 In Europe, Germany is the major photovoltaic production country with 76 percent of the total, also is important observe in Figure 1.17 the incredible increase of production in PV cells reaching 4279 MW, almost the double than in 2006.
1170.6 MW
932 MW 35.4 MW
273 MW
1200 MW
164.2 MW
461.6 MW

29
Germany(76%)Spain (11%)
France (3%)
Norway (4%)
Italy (0.5%)
Netherland(3%)Belgium (2%)
Russia (1%) Fig. 1.17, Europe production of photovoltaic cell in 2007
Within the private companies, Sharp Corporation continues to dominate the PV market with 17.2%, although as we can observe in the next picture, the company had a lesser growth compared with the rest of the companies. Also we can see that four of the top ten companies are from Japan.
Fig. 1.18, Photovoltaic private companies
875.6 MW
6 MW
132.3 MW
39 MW
46 MW 29.1MW 36 MW

1.6 HYBRID SOLAR PANEL
1.6.1 Introduction
As we know all the systems that work with electricity have negative effects when the temperature is increased, for example electric engines, batteries and photovoltaic cells as well. In the previous charts the efficiency of the PV modules given by the manufactures are obtained with standard parameters (for example Temperature=25ºC and Radiation 1000 W/m2).In real life, the temperature of the PV cell is higher, reducing the electrical output by 0.5% for every 1°C above its rated output temperature. High temperature in the PV cells represents an increase in the current but also a significant reduction in the voltage, as a result the power of the panel decrease when the temperature increases as we can see in the Figure 1.19:
Fig. 1.19, Current vs. Voltage at different temperatures Manufactures of photovoltaic panels recommend installing the panels in good ventilated places to reduce the negative effects of the temperature on the PV cells, but with this solution energy in form of heat that exits in the cells is wasted. Is there any other alternative to solve this problem? The answer is yes. A solar hybrid photovoltaic thermal panel, PV/T is a combination of photovoltaic components and solar thermal components, which produce both electricity and heat from one integrated component or system. The PV/T cogeneration technology offers a solution that actually makes PV systems financially feasible in standard commercial and industrial applications.
30

Fig. 1.20, Photovoltaic thermal panel A PVT-panel (Figure 1.20) has a higher electrical annual output than a conventional PV-module because the thermal flow permits to cool down the PV cells.
The electrical yield of the PVT can either be used directly or be supplied to the grid while thermal yield, the user determines how heat is used. The thermal output depends strongly on the thermal system design and the amount of heat that is extracted by the user.
On the other hand, the idea of combining photovoltaic and solar thermal energy in a simple panel is an innovative concept and interest to research, the use of these panels could have the next advantages:
Generates both electricity and heat energy.
Improve total operating efficiency due to an appropriate working
temperature for the PV panel and for the production of thermal energy.
The total area used to extract a given amount of electricity and heat may be smaller than for two separate systems.
The semiconductors that compose the cell will operate in lower
temperatures where they are more efficient, for this reason the lifetime of the panels is larger.
When using integrated elements a potential saving in installation costs
compared to separate systems can turn out to be an important factor for future development of the market for photovoltaic/thermal solar collectors.
Make a good use of the solar radiation per square meter.
PVT collectors provide architectural uniformity on a roof, in contrast to a
combination of separate and PV-Thermal system. 31

32
It is important to notice that improvement produced either in PV or Solar Thermal Panel is also an improvement for the PV/T panel, for instance if the price of the PV cells decreases, the same reduction will affect the PV/T panel.
1.6.2 Review of models and systems
PVT devices can be very different in design, ranging from PVT domestic hot water systems to ventilated PV facades and actively cooled PV concentrators. The main difference is the fluid used to heat (air or water) .At first, PVT with liquid as heat transfer fluid seems more promise because water has better heat transporting qualities than air. Moreover pipes and pumps are cheaper than funs and ducts. The collectors can be divided into the following categories [9]:
PVT Liquid Collector.
PVT Air Collector.
Ventilated PV with heat recovery.
PVT concentrator. In choosing what type of PV/T system is most suitable the project demands need to be considered [9]:
Temperature and characteristics of thermal load.
Thermal load (kW).
Electrical load (kW).
Suitable mounting locations.
1.6.2.1 Liquid PVT collectors In these devices PV modules and thermal units using water (or glycol) are mounted together, the systems convert solar radiation to electricity and hot water. According to temperature levels of the liquid, the collectors can be used in different applications:
Low temperature: swimming pool and heat pump applications.
Medium temperature: domestic hot water.
High temperature: hydrogen production.

Several design concepts have been evaluated in PVT liquid, some of them are shown in the Figure 1.21 [10]:
33
Channel PVT Sheet-and-tube PVT
Free flow PVT Two-absorber PVT
Fig. 1.21, Various PVT liquid collector concepts Only model denominated sheet and tube PVT has been produced commercially, others are under development phase. Sheet and tube PVT is similar to conventional flat plate liquid collectors; an absorber, usually cooper plate painted with a highly absorptive paint, with a serpentine tube or a series of parallel risers is applied (Figure 1.22), onto which PV that converts sunlight into electricity has been laminated or glued.
Fig. 1.22, Sheet and tube PVT liquid collector
Water
Air
Insulation
PV Cell
Glass
PV Cell
Water Glass
Insulation
Adhesive
Absorber
Air / vapour mixture Air
Primary water channel
Secondary water channel
Glass
Transparent PV
Absorber
Insulation
PV Cell
Glass Air
Adhesive
Insulation
Heat conductor
Water flow

It is important notice that direct application of water heat may require a good control of the flow, to be able to adapt to variations in irradiance. Lower flow rates can cause the temperature gradients in the PVT to be too high and can be a problem for the PV cell. As conventional solar collector, PVT also can be glazed or unglazed (Figure 1.23). Sometimes PVT collectors may have a glass cover over the absorber to reduce the thermal losses. If such a cover is present, the collector is referred to as glazed, otherwise as unglazed [9].
34
From the point of view of electrical efficiency the amount of reflecting layers above the PV panel should be minimized. On the other hand the thermal efficiency will drop if no insulating air layers are present [11]. In the discussion whether the collector should be glazed or not, it is important to find a good balance between the increased thermal yield on one hand, and the reduction in electrical yield and the issues related to possible degradation on the other hand. Fig. 1.23, Cross section of the
PVT experimental models
1.6.2.2 Air PVT Collectors In this case air is used as heat transfer fluid. The PV cells are either pasted to the interior of the cover plate or to an absorber or the PV cells are acting as an absorber or cover plate itself. The air can be circulated by either natural ventilation or forced ventilation. [9]
Fig. 1.24, Example of an air PVT collector As it happens in Liquid PVT, this type of panel also can either be glazed or unglazed.
Glass
PV Cell
Air
Absorber
Insulation

1.6.2.3 Ventilated PV with heat recovery In conventional PV facades or PV roofs, an air gap is often present at the rear in order to allow the air to cool the PV by means of natural convection (ventilated PV). If this heat can be recovered from the PV and be used in the building, the PV functions as a PVT collector. [9]
1.6.2.4 PVT Concentrator It is a concentrating parabolic trough system that combines photovoltaic (PV) cells to produce electricity, with thermal energy absorption to produce hot water at high temperature. In the Figure 1.25 is shown an example of one commercial photovoltaic thermal concentrator, in this link can see an illustrative animation about how works. http://www.arontis.se/video/Solar8_solar_concentrator.swf
Fig. 1.25, Photovoltaic Thermal Concentrator
1.6.3 Market of survey of PVT Collectors
The markets for both solar thermal and PV are growing rapidly and have reached a very substantial size. For PV-Thermal a similar growth can be expected. However, the present PVT market is still very small.
35

The cost of the PVT system can be assumed to be similar to the cost of the solar thermal system plus the cost of the PV laminate minus the cost of saved materials through integrated production/ installation and reduced installation costs. From the market point of view, standardization and certification of performance and reliability are essential requirements to achieve a successful market introduction in the building sector. Currently several institute and manufacturers have made an effort to standardize these systems.
1.6.3.1 Liquid PVT collectors market Most PVT liquid collectors are developed based on a commercial solar thermal collector that has been modified to include PV in the surface of the absorber. Examples of product developments and market attempts are:
Millennium Electric is a company from Israel which has as its star product a PVT denominated Multi Solar System (MSS). It consists of unglazed flat plate solar collector with PV cells integrated on top of the panel. Underneath the PV cells the water based collector is placed. Moreover there is under the collector a heat exchanger integrated which heat air. According to data of the company is possible achieve efficiencies around 85 % (15% electric and 70% thermal).More information can find in its web page: http://www.millenniumsolar.com/
Fig. 1.26, Multi Solar System
PVTWINS is a spin-off from Netherlands Energy Center (ECN). PVTWINS offers two types of PVT-products namely PVT-panels and PVT collectors.
36

Fig. 1.27, PVT Collector designed by PVTWINS Fig.1.28, PVT Panel designed by PVTWINS PVT-collectors (Figure 1.27) consist of several PVT-laminates in a insulated aluminum box with a covering glass plate. The PVT-collector generates a higher temperature up to 90°C. Due to the higher temperature the annual electrical output is equal to a conventional PV-module.
37
The PVT panel (Figure 1.28) is a PVT-laminate in an aluminum frame and insulation on the back side. A PVT-panel has a higher electrical annual output than a conventional PV-module and generates water up to 50°C [12].

ICEC AG. is a company from Switzerland, they have developed a PV/T
collector HYSOLAR combining thermal and photovoltaic solar system. This hybrid solar system reduces the energy cost thanks to a simplified installation method and better roof space.
Fig. 1.29, Schematic of one installation using HYSOLAR
In Japan a company called Sekisui Chemical Co. developed around 1999 a PV/T for domestic hot water which converts about 10 % of the solar energy into electricity and 30% into hot water. Several installations of this were sited in Japan (Figure 1.30) but actually is not in the market. In Germany two companies SolarWerk and SolarWatt developed two similar systems which consist of a flat plate collector with PV cells integrated on the absorber, but both companies have problems maintaining long time stability of the PV cells as they are integrated on an absorber. This seems to be a common problem for companies interested in commercializing PV/T systems where the PV cells are integrated on the absorber.
Others prototypes were developed around year 2000 but anyone was commercial.
Fig. 1.30, Installation made by Sekisui Chemical in Japan
38

1.6.3.2 Air PVT collectors market In this case not many prototypes have been developed although the level of commercialization is higher than liquid PVT collectors:
Aidt Miljø A/S is a company from Denmark which has developed a solar air collector with integrated PV cells and fan. This product preheats ventilation air, but the main purpose of the product is actually to provide dehumidification of the air in cabins, garages. The PV cells supply a fan in the top of the collector with electricity.
Fig. 1.31, “Solar Venti” collector designed by Aidt Miljø
http://www.solarventi.com/generelt/SunModel_UK/index.htm
Grammer Solar is commercially producing a PVT collector namely Twinsolar, which has been applied in a number of large demonstration projects, Solar farms, swimming pools (Figure 1.32), mountain refuges (Figure 1.33) and cabins.
39
Fig. 1.32, Twinsolar installed in public Fig. 1.33, Twinsolar installed in a swimming pools mountain refuge Due to the safe and independent operation of the Twinsolar system, it is also ideal for second homes and houses not normally in use. The annual maintenance cost of the independent system at home is only the cost of changing the filter once or twice a year.

Twinsolar is a PVT collector with PV over the whole absorber. Air is circulating in the panel, entering and exiting in the same (lowest) side. Hot air is used as ventilation air in the building. (Figure 1.34)
Fig. 1.34, Picture Twinsolar system
Conserval Engineering Inc. invented and commercialized the transpired collector branded as SolarWall (Figure 1.35) which creates electricity and hot air. This system was tested at the Canadian National Solar Test Facility. The results documented that adding a solar thermal component to a PV array boosts the total solar efficiency to over 50%, compared with 10 to 15% efficiency for most PV modules alone [13].
Fig. 1.35, SolarWall
1.6.3.3 Market of ventilated PV with heat recovery The systems belonging to the group of Ventilated PV with Heat Recovery typically have emerged from solutions for specific buildings, where the primary focus has been building integration of PV and where the need for ventilation of the PV-systems in order to maximize the electrical yield has been combined with utilization of this heat for preheating of ventilation air, space heating or similar [11].
Secco Sistemi is an Italian enterprise which design system on roof or façade with integrated PV with heat recovery, this system is part of a roofing system and cannot be applied as add-on on existing roofs.
40

Fig. 1.36, Library from Mataro (Spain)
Thermal energy collected from a PV-solar air heating system is being used to provide cooling for the Mataro Library (Figure 1.36), near Barcelona. The system is designed to utilize surplus heat available from the ventilated PV facade and PV shed elements during the summer season to provide building cooling.
1.6.3.4 PVT concentrators market
Heliodynamics has developed a commercially available PVT concentrator, based upon tracking technology. The HD series of solar concentrators use mirror banks which concentrate solar radiation onto a receiver unit to produce heat or a combination of heat-and-power. Each mirror bank moves separately to accurately track the sun during the day and can fold over to protect itself automatically at night and in case of inclement weather. The receiver unit is a stationery band of devices set at the focus of the mirrors which converts the solar radiation into useful electrical and/or thermal energy [14].
Fig. 1.37,Installation of PVT concentrator produced by Heliodynamics on the roof
Arontis AB, a Swedish clean technology company that manufactures a PVT concentrator called Solar8 which converts sunlight into both electricity and thermal
41

heat. Solar8 consists of a sun-following reflector in the shape of a parabolic trough, water-cooled solar cells, electronic steering and actuator. Life cycle analysis shows that Solar8 has an up to four times better environmental performance than normal solar cell modules [15].
- Glass encased construction that protects reflectors and solar cells. - Reflector plate with high reflectance, low price and diffusive surface. - Steering system with double linear actuator. - Solar cells with 17% efficiency. - Three patent applications and design protection in the EU.
Fig. 1.38, Installation of a concentrator
solar collector- Solar 8 in the World Heritage Museum in Skule(Sweden)
In Canada, the company Menova Energy Inc. has developed a commercial PVT concentrator mainly for domestic application. The Power Spar, as it is called, is a high efficiency solar concentrator that can be configured for electricity, heat, cooling and lighting solutions.
Fig. 1.39, Solar thermal concentrator plant with Power Spar
The Power-Spar system consists of a parabolic trough reflector which concentrates the sun's energy onto a modular absorber. The absorber converts the sun's energy to electricity (via high efficiency multi-sun photovoltaic cells), or to heat (via a patented absorption surface) or transports the light to the buildings' interior (via optical cabling). According to data obtained from the enterprise, the Power Spar is capable of capturing up to 80% of the sun’s energy.
42
1.6.3.5 Other interesting projects developed with PVT collectors
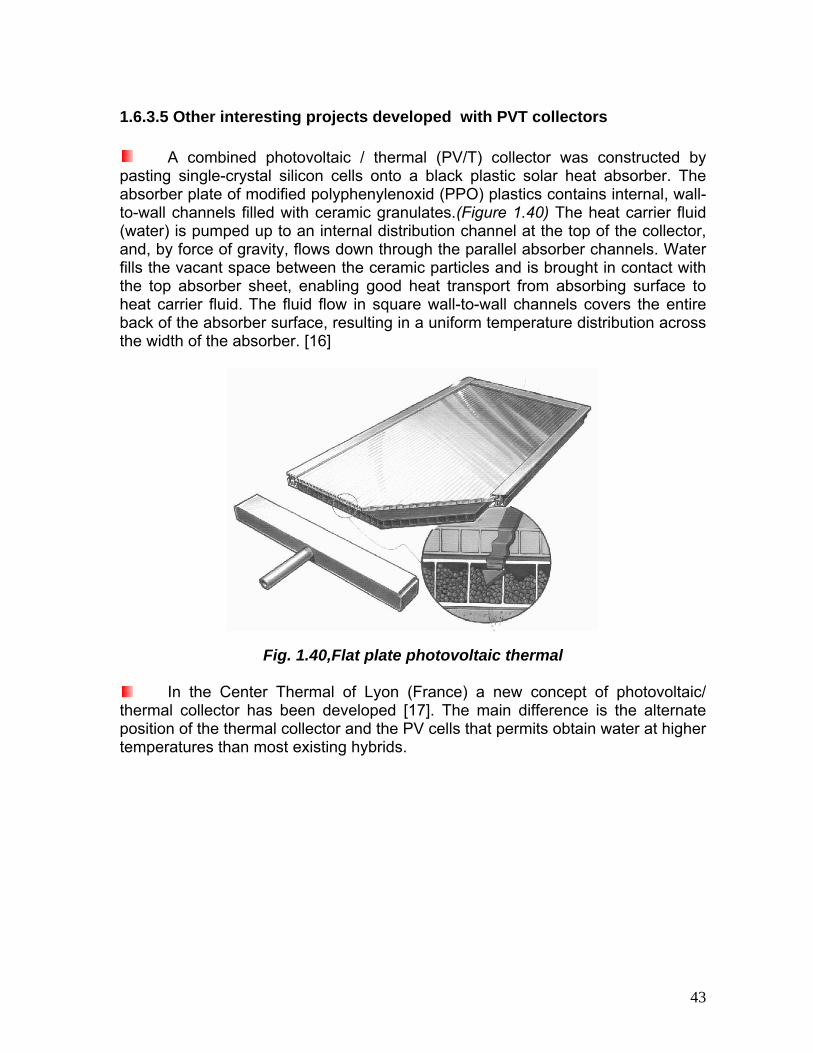
A combined photovoltaic / thermal (PV/T) collector was constructed by pasting single-crystal silicon cells onto a black plastic solar heat absorber. The absorber plate of modified polyphenylenoxid (PPO) plastics contains internal, wall-to-wall channels filled with ceramic granulates.(Figure 1.40) The heat carrier fluid (water) is pumped up to an internal distribution channel at the top of the collector, and, by force of gravity, flows down through the parallel absorber channels. Water fills the vacant space between the ceramic particles and is brought in contact with the top absorber sheet, enabling good heat transport from absorbing surface to heat carrier fluid. The fluid flow in square wall-to-wall channels covers the entire back of the absorber surface, resulting in a uniform temperature distribution across the width of the absorber. [16]
Fig. 1.40,Flat plate photovoltaic thermal
In the Center Thermal of Lyon (France) a new concept of photovoltaic/
thermal collector has been developed [17]. The main difference is the alternate position of the thermal collector and the PV cells that permits obtain water at higher temperatures than most existing hybrids.
43

Fig. 1.41, Model PVT designed in Center Thermal of Lyon
Y. Tripanagnostopoulos et al. [18] in the University of Patras (Greece) is one of the people who more have researched about new design concepts in PVT collector. In the next figure (Figure 1.42) we can see an example that proposes the use of booster diffuse reflectors. These reflectors have been placed stationary from the higher part of the modules of one row to the lower part of the modules of next row. This installation increases solar input on PV modules almost all year resulting to an increase of electrical and thermal output of the PV/T systems. The suggested diffuse reflectors don’t contribute to electrical efficiency drop, as they provide an almost uniform distribution of reflected solar radiation on PV module surface [18].
Fig. 1.42, PV/T systems with booster diffuse reflectors: (a) horizontal building roof system installation; (b) PV/T experimental system with indication of diffuse reflected solar rays.
Solar Decathlon is a competition in which 20 teams of students compete to design, build, and operate the most attractive, effective, and energy-efficient solar-powered house (Figure 1.43). In the year 2002 one project namely Crowder Collegue students used commercial amorphous thin film integrated into a standing seam metal roof. Water is heated through
Fig. 1.43, Solar powered house- project Crowder
Collegue
44

45
a system of cooper tubes attached to the back of the modules and an extra layer of glazing added above the modules.

46
Chapter 2
MODELING

47
2.1 INTRODUCTION This chapter describes the systems and subsystems used in a solar plant with photovoltaic and hybrid panels for the production of hydrogen through water electrolysis at high temperatures. The previous step to study either system consists of design a theoretical model. Each physical element is modeled as a separate component. After they are joined to compose the plant, then we will be able to vary input data to obtain the best efficiency. The mathematical model will be based on existing validated assumptions and formulas. The input data mentioned above are mostly obtained for the parameters which manufacturers supply, so that we will be able to use parameters of different companies. As always, there is a trade-off between simple and complex models. The simpler models are usually based on idealized processes and require very few parameters. The more complex models are usually more detailed and reflect to a greater extent the actual physical processes occurring, but, at the same time, they also require a much greater number of parameters. The models developed for this thesis, and presented in this chapter, fall into a category somewhere between simple and complex. The intention was to make the models as general as possible, but at the same time practical to use. Authors of this project will believe the accuracy of the models used ant the data of the manufactures.

48
2.2 PHOTOVOLTAIC GENERATOR
2.2.1 Introduction
In this project we are going to make two independent simulations, the first using a hybrid solar panel that supplies simultaneously hot water and electricity to the electrolyser. The second simulation will use conventional photovoltaic panel which supplies only electricity. Realize two simulations will permit us to know the advantages and disadvantages that have each system; moreover we will be able to compare the two models. Photovoltaic panel (PV) is with the hydrogen the energy source. A PV is composed by a set of cells connected in series, insulate around the cell and protections. In order to determine the efficiency of the photovoltaic panel two models are required: firstly an electric model to obtain the relationship between I-V, then we will be able to calculate the power supplied by the panel, in this case mostly of studies used to coincide and utilize the same model. Secondly a thermal model which calculates the operation temperature cell, an important parameter because the efficiency of the photovoltaic panel depends of temperature as we could see in the chapter 1. In this part each researcher project use a method, some of them simple as introduce the temperature of the cell as a input, others are more complex and take into account many variables.
2.2.2 Electrical Model1
To make the electrical design of a PV is needed study the behavior of a single cell. It turns out that a relatively simple idealized one diode model can be used for system design purposes [20].
1 Nomenclature and parameters used in simulation are in Appendix B.

Rs I
IL ID V Rsh
Fig.2.1 The equivalent circuit for the one-diode model [21]
The equivalent circuit of the one-diode model can be used in the modeling of an individual cell, of a module consisting of several cells, or of an array consisting of several modules. There is other similar model using two diode, the second diode is put in parallel with the first (Figure 2.1). This second model is more accuracy but it requires the input of more parameters. As the differences in the results are not large and we only want to compare with the hybrid panel we will use the one diode model.
Rs I
IL Rsh V
ID1 ID2
Fig. 2.2, The equivalent circuit for the two-diode model
The relationship between the current I and voltage U of the equivalent circuit in Figure 2.1 can be found by equating the light current IL, diode current ID, and shunt current Ish to the operation current I [22]:
sh
ssLshDL R
IRUaIRU
IIIIII+
−⎭⎬⎫
⎩⎨⎧
−⎟⎠
⎞⎜⎝
⎛ +−=−−= 1exp0 [2.1]
The five parameters IL, Io, Rs, Rsh and a in Equation 2.1 depend on the solar radiation and the cell temperature. The method used to obtain the values of these parameters is described in Duffie and Beckam [22] and we indicate next:
49

Resistance Rsh can be assumed to be infinitely large compared to the series resistance Rs, and then Equation 2.1 converts to:
⎭⎬⎫
⎩⎨⎧
−⎟⎠⎞
⎜⎝⎛ +
−=−−= 1exp0 aIRUIIIIII s
LshDL [2.2]
Now model has four parameters (IL, I0, Rs, a ). Three of the four conditions required to solve Equation 2.2 can be found from manufacturers’ data. The fourth condition can be derived from the knowledge of the temperature coefficients of the short circuit current and open circuit voltage. At short circuit conditions, all of the generated light current IL is passing through the diode. Thus, at reference conditions:
refscrefL II ,, = [2.3] At open circuit conditions the current is zero and the 1 in Equation 2.2 is small compared to the exponential term so that:
⎟⎟⎠
⎞⎜⎜⎝
⎛ −=
ref
refocrefLrefoc a
UII ,
,, exp [2.4]
50

Isc Current Maximum Poin
Imp
Power
Vmp Voc
Power t
Fig. 2.3, Typical I–U and P–U
characteristics for a PV generator
is substituted into Equation 2.2 (again neglecting the 1 to simplif
If an I–U pair at maximum power conditions and Io,refy the algebra), the result is:
refmp
refocrefmprefL
refmpref
sh I
U+UIIa
R,
,,,
,1ln −⎟⎠⎞
⎜⎝⎛ −
= [2.5]
The temperature effects must be incorporated into the model. The temperature coefficient of the short circuit current can be obtained from measurements at reference irradiance Gref and expressed by:
12
12,
)()(TT
TITITI scscsc
scI −−
≅ΔΔ
=μ [2.6]
In the next figure we can see how change the output power for different values of
mperature in the cell. The result was obtained simulating a single PV panel. te
51

52
The temperature coefficient of the open circuit voltage can be found from:
12
If the series resistance Rs is assumed independent of temperature, then only the parameters IL, Io, and a need to be functions of temperature. The following equations are good approximations for many PV modules [22]:
12,
)()TT
TUT
ococococU −
−≅
Δ=μ [2.7]
(TUUΔ
refc
cref T
Taa = ,
[2.8]
[ ])( ,,,,
refccscIrefLrefT
TL TTI
GGI −+= μ [2.9]
⎥⎥⎦
⎤
⎢⎢⎣
⎡⎟⎟⎠
⎞⎜⎜⎝
⎛−⎟
⎟⎠
⎞⎜⎜⎝
⎛=
refc
c
ref
Sgap
refc
crefoo T
Ta
NeT
TII,
3
,, 1exp [2.10]
An additional independent equation can be found by analytically differentiating Uoc in Equation 2.4 with respect to T, using Equations 2.6, 2.8 and 2.10, and setting the result(dUoc/dT) equal to the experimental value μU,oc. At reference conditions, this can on compact form be expressed by the curve fitting parameter:
3,
,,
,,,
−
+−=
refL
refcscI
SgaprefocrefcocUref
IT
NeUTa μ
μ [2.11]
2.2.3 Thermal Model
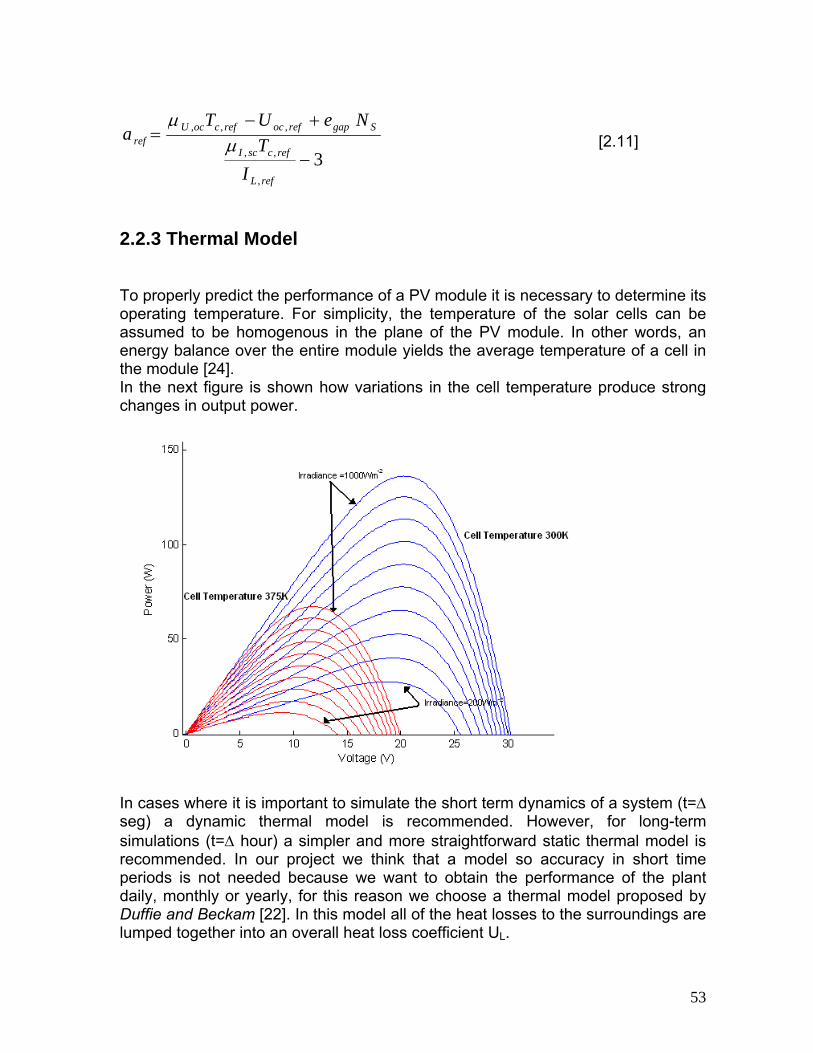
To properly predict the performance of a PV module it is necessary to determine its operating temperature. For simplicity, the temperature of the solar cells can be assumed to be homogenous in the plane of the PV module. In other words, an energy balance over the entire module yields the average temperature of a cell in the module [24]. In the next figure is shown how variations in the cell temperature produce strong changes in output power.
e straightforward static thermal model is
on we choose a thermal model proposed by uffie and Beckam [22]. In this model all of the heat losses to the surroundings are
lumped together into an overall hea
In cases where it is important to simulate the short term dynamics of a system (t=Δ seg) a dynamic thermal model is recommended. However, for long-term simulations (t=Δ hour) a simpler and morrecommended. In our project we think that a model so accuracy in short time periods is not needed because we want to obtain the performance of the plant daily, monthly or yearly, for this reasD
t loss coefficient UL.
53

The energy balance on a unit area of a PV module, which is cooled by losses to the surroundings, can be written as
( )acLTcTc
t TTUGGdt
dTC −⋅−⋅−⋅⋅= ηατ [2.12]
The term on the left-hand side of Equation 2.12 is the thermal energy stored in the PV module. The three terms on to absorption of solar radiation, electricaleat losses to the ambient, respectively.
the right hand side are the heat gains due energy produced by the PV module, and
h No thermal capacitance is included in the energy balance on the PV module. Equation 2.12 with Ct=0 converts to:
( ) ⎟⎠⎞⎜
⎝⎛
⋅−⋅⋅⋅+= ατηατ c
LTac UGTT 1/ [2.13]
Manufacturers usually provide data on the nominal operating cell temperature (NOCT). The NOCT is defined as the cell or module temperature that is reached when the cell are mounted in their normal way at a solar radiation level of 800 W/m2, a wind speed of 1 m/s, an ambient temperature of 20°C, and no load operation (ηc = 0) [24]. If the NOCT is available, then, using Equation 2.13, the overall heat loss coefficient can be estimated by:
( )NOCTaNOCTc
NOCTTL TT
GU,,
,−
⋅⋅= ατ [2.14]
The transmittance-absorptance product τα in Equation 2.14 is generally not known, but an estimate of 0.9 can be used without serious error because the term ηc/τα in Equation 2.14 is small compared to unity [22].
54

2.3 PHOTOVOLTAIC THERMAL PANEL (PVT)
2.3.1 Introduction
In contrast to the situation for conventional thermal or photovoltaic systems, the literature on combined photovoltaic-thermal collector design is very limited. With respect to flat-plate PVT liquid almost all the work focuses on the optimization of sheet-and-tube designs. (Figure 2.4)
Fig. 2.4, Sheet and tube PVT liquid collector The thermal models developed in previous studies are mostly steady-state models for predicting the annual yields. The reason is that the collector system performance can be adequately evaluated through the quasi-steady-state analysis using hourly weather data. The operation of a PV/T collector is dynamic due to the existence of periods of fluctuating irradiance or intermittent fluid flow, only two dynamic models have been found. The first is described by T.T.Chow et al.[25] in the University of Hong Kong based on the control–volume finite difference approach; this model was developed for a single glazed flat plate water heating PV/T collector. The second is developed by H.A.Zondag et al.[26] in the Energy Center of Netherlands (ECN), it is quasi three dimensional and time dependent and it was also developed for a flat plate water heating. Both models obtain good results in short periods of time allowing observe the performance of the PV/T under dynamical effects during the day. As we said in point 2.2.3 we think that accuracy models in short steps of time are not needed in this project and only incorporate more complexity. In addition the use of a dynamic model has disadvantages; for instance, the model needs meteorological data on a basis of a few seconds while data obtained in reference test are usually on an hourly basis. In addition these models are so extensive that require many time to simulate a real life equipment operation.
55

Numerically steady state model have been developed since 1979, this year Florschuetz et al. [27] developed an extension of the Hottel-Willier equations applied for combi-panels. Bergene and Lovvik et al. in 1995 [28] based on the models for flat-plate solar heat collectors presented by Duffie and Beckman and Sizmann (1991), giving attention to the radiation terms and to the necessary modifications due to the addition of solar cells [22]. In 2002, H.A Zondag et al. [26] in addition to the dynamic model mentioned above developed other three steady state models; we have chosen one of them because we think this model is the most appropriated for our requirements. The result of the measurements and the calculations is the efficiency of the collector that is defined as the yield divided by the amount of solar energy received by the collector. In this way, both an electrical and a thermal efficiency are defined:2
col
inoutth AG
TTcm⋅
−⋅⋅=
)(&η [2.15]
[ ]( 250045.01 −−⋅= celloel T )ηη [2.16]
In order to determine the thermal efficiency of the PVT-collector, two models are required. Whereas an optical model is required to determine how much irradiation is absorbed by the PVT-collector, a thermal model is required to determine the heat flows within the PVT-collector.
2.3.2 Optical Model
An optical model is necessary because the transmission-absorption factor for sunlight of the combi-panels strongly influences the thermal efficiency. The optical efficiency τα of a collector, also called the transmission-absorption factor is defined by: τα=1-ρ [2.17] In this equation ρ is the reflection factor for the whole geometry of top layers, air layers and PV laminate. The optical model is used to calculate τα and then this value is inserted as a constant into the thermal model [26]. The model is based on the net radiation method [29]. This method solves the energy flux balance at each interface in the PVT-collector configuration. In the model the following simplifications have been made [30]:
562 Nomenclature, parameters used in simulation and secondary equations are in Appendix C.

Sunlight is assumed to be unpolarized.
The surfaces within the pv laminate are assumed to reflect and transmit light in a specular way.
Interaction between surface parts is not modeled. In other words: no
oblique reflections of one part will reach another part by internal reflections.
The wavelength-range for the optical properties and spectrum is
subdivided in 120 wavelength-segments. The reflection factor of a surface depends on the angle of attack, the wavelength and the polarization of the incident light. Furthermore, it depends on the index of refraction of the material and on the structure of the surface. The absorption of light in the material through which it travels depends on the material properties and the thickness of the layer. At first the reflection factor r is calculated for all wavelengths at all interfaces in the top layers and laminate with the help of the Fresnel formulas. The reflection factor r is defined as the quotient of the intensities of the reflected (R) and incident (Ii) light beam:
iIRr = [2.18]
For unpolarized light we find:
( )( )
( )( )⎟⎟
⎠
⎞⎜⎜⎝
⎛+−
++−
=ri
ri
ri
riRθθθθ
θθθθ
2
2
2
2
tantan
sinsin
21 [2.19]
In which angles are determined using Snell’s law:
⎟⎟⎠
⎞⎜⎜⎝
⎛ ⋅=→=
r
iir
r
i
i
r
nn
nn θ
θθθ sin
arcsinsinsin
[2.20]
57
With these equations we can calculate the reflection factor at each interface between the layers and also the absorption of light within the layers of the laminate.
( )( )
⎟⎠⎞
⎜⎝⎛ ⋅−
=
+−=
−+=
=
r
topglassoi
iio
iio
i
Kqq
qRqRq
qRqRq
Gq
θδ
cosexp
1
1
3,2,
2,2,11,2,12,
2,2,11,2,11,
1,

58
0)1(
)1(
cosexp
4,
4,3,23,3,24,
4,3,23,3,23,
2,3,
=
+−=
−+=
⎟⎠⎞
⎜⎝⎛ ⋅−
=
i
iio
iio
r
topglassoi
qqRqRqqRqRq
Kqq θδ
Fig. 2.5, The numbering of the radiadensities in the net radiation methotopglass
tive flux d in the
The net radiation method comprises the following steps. First the in and outgoing radiative flux densities are numbered as unknowns (Figure 2.5). Then the equations that connect the flux densities are constructed and finally the reflectance and transmittance are calculated. This method is applied to all interfaces in the PVT collector which generates a set of equations. The coefficient of extinction K and the index of refraction n depend of the wavelength; the equations are solved for each wavelength interval separately and then integrated over the solar spectrum. A problem is produced by the fact that a PV-laminate does not present a homogeneous surface but consists of different parts .For each part the value for τα is calculated separately and then τα of the entire PVT-collector is determined by taking the average of these values, weighed with the respective surface areas [26]. Composition of the PVT Logically to realize the optical model and obtain the transmission-absorption factor is firstly needed know the composition of the panel. Maybe this is the part more problematical of the project, the layout and choice of materials which compose the PVT will determine if this project is possible or not. The main reason is if we want to obtain high temperature water the thermal resistance between ambient and absorber has to be as small as possible. Moreover the materials that compose the PV module have to resist high temperature too. For this motive the realization of this project in real life will depend mainly of the materials used in the PV (not taking into account economic aspects). The composition of a conventional PV module, it is obtained by stacking a front cover (glass), a layer of encapsulant material (EVA), the cells tabbed into strings, another layer of encapsulant material (EVA), and a backsheet (Tedlar) [31]. Past researcher projects created the PVT by the union of a conventional PV with a conventional collector with an adhesive. This is the easiest method but it has some disadvantages. For instance the adhesive layer can increase considerably the thermal resistance provoking low thermal efficiency, moreover materials as EVA

(Ethylene Vinyl Acetate) that do not resist high temperature or Tedlar which has relatively large reflection losses are not advisable in a PVT. Particular consideration has the temperature of the cell, especially under stagnation conditions due to the risk of EVA delamination increase strongly for temperatures over 135 ºC [32]. Logically the solution easier to solve this problem is not using these materials in our PV module. Only two research projects [33-34] have been found where EVA and tedlar are not used, both choose silicone’s layer as encapsulation. This will be a good solution because silicone has high resistance to high temperature. On the other hand, reduce the resistance between PV cell and absorber is one of the main goals studied by engineers and manufactures. This resistance determines the pv laminate temperature; therefore it is important for the electrical efficiency. In our project we have decided to use the model presented by Raghuraman et al.[33], this system consists of solar cells that are glued directly (no tedlar or EVA in between) to the thermal absorber plate. Between the plate and the cells is a layer of electrical insulation to avoid short-circuiting the PV, consisting of a rather thick layer of silicone pottant. The thermal conductivity of the silicone is 0.2 W/mK and the thickness of the layer is 0.5 cm, which results in a heat transfer of 40 W/m2K. Using this model exist a reduction in the thermal efficiency but we think that currently it is the only solution to work with a PVT at high temperatures. In addition the choice between a glazed or unglazed panel (Figure 2.6) should be taken into account. In our case unglazed panel is declined because high temperature is needed and unglazed panels supply high efficiencies in electric part but lower in thermal part. In the case of glazed panels two models can be studied, with one or two cover layer.
Fig. 2.6, Cross section of the PVT experimental models Research projects [25-26] indicate that the best solution is only one cover because other additional increase reflection losses, so that the electrical efficiency decreases considerably. Typically low iron glass is used for the top cover with a transmission about 91-92%. In recent years glasses up to 94% are being used for some companies, this will be important for PVT collectors due to will permit the use
59

of two top covers with a slight decrease in electric efficiency [35]. More information about this glass can be found in the next web: http://www.flabeg.com
2.3.3 Thermal Model
This model is developed for the prototype sheet and tube type combi-panel. The thermal model is based on the assumption that at each moment the panel is in thermal equilibrium in perpendicular direction to the flow, called as the x-direction, while in flow direction, denominated y-direction, temperature differences are present [30]. Other simplification is to stretch the serpentine tube to a long straight tube leading to the situation on the Figure 2.7; the simplification implies that symmetry is assumed with respect to the centerline between two successive pipes. The sides of the stretched sheet and tube combi-panel are assumed to be insulated. Also the typical temperature field around a tube-bend is not taken into account in the case of one long straight tube [26].
60
z y
Fig. 2.7, The serpentine like tube in a sheet and tube type combi-panel is modeled as a long straight tube
As we have mentioned above, the model assumes that all layers are uniform temperature in x-direction, then heat flow takes place in two dimensions: firstly from the PV cell to the top glass and via the absorber to the transport medium (z-direction); secondly the absorbed heat in the water is transported from inlet to outlet (y direction). The relations describing the radiative and convective heat transfer are put in local heat balances for all segments in z-direction and all layers in the combi-panel [30]. The heat flows in the sheet and tube PVT collector are indicated schematically in Figure 2.8:
x

61
z y
Fig.2.8, Heat flows and temperatures in the various layers of the sheet and tube type PVT
- Heat Balance The heat balance is represented by the following equations; for the top layer we have:
topglassradskywindsky qqq =+ ,, [2.21]
radairconvairtopglass qqq ,, += [2.22] For the laminate:
glassPVradairconvair qqq =+ ,, [2.23] In Equation [2.23] it is assumed that the temperature PV and glass is the same.
( ) caelPVglassPV qGq −⋅⋅−= ηττα [2.24] Where qca is the heat from the laminate to the absorber. For the absorber plate we have:
bacawater qqq −= [2.25] Where qba is the heat flow through the back insulation and qwater the heat transferred from the absorber to the water.
x

The set of Equations (2.21)-(2.25) presented above is for the case of the panel with one cover. For the zero case cover Eqs. (2.22) and (2.23) are left out, while in Eq. (2.21) the qtopglass is changed into qPVglass. For the panel with two covers, Eqs. (2.22) and (2.23) are repeated [36]. As we have mentioned in 2.3.2, initially in our project we will use a panel with only one cover, if with only one cover is not possible reach high temperature water to perform electrolysis, we will study the use of one additional cover. In a sheet and tube combi collector the PV is connected to a separate thermal absorber by means of an adhesive layer. Therefore, the heat transfer between the PV cells and the absorber plate should be modeled as well. This is taken into account by using the next equations [26]:
62
)
( abscellcaca TThq −⋅= [2.26] As we decided in the point 2.3.2 the value of hca is determined by the model of Raghuraman et al.[33]. The heat flow between absorber and ambient is: [2.27] ( aabsbaba TThq −⋅= ) It is assumed that the heat loss to the ambient through the back of the collector is negligible, therefore the value of hba=1. - Radiative losses Radiative losses from the top layer to the sky:
( ) ( )4444, atopglassgearthskytopglassgskyradsky TTFTTFq −⋅+−⋅⋅= ↑↑ σεσε [2.28]
Tsky can be calculated with the next equation:
5.10522.0 asky TT ⋅= [2.29] For the radiative heat transfer between two infinite parallel layers we use [27]:
( 44, ↓−⋅⋅
⋅−+
⋅= topglassPVglass
PVgPVg
PVgradair TTq σ
εεεε)εε [2.30]
- Convective losses The convective heat transfer is defined as: h=q/ΔT, where q is the heat flux and ΔT is the temperature difference. In this case the temperature difference is the
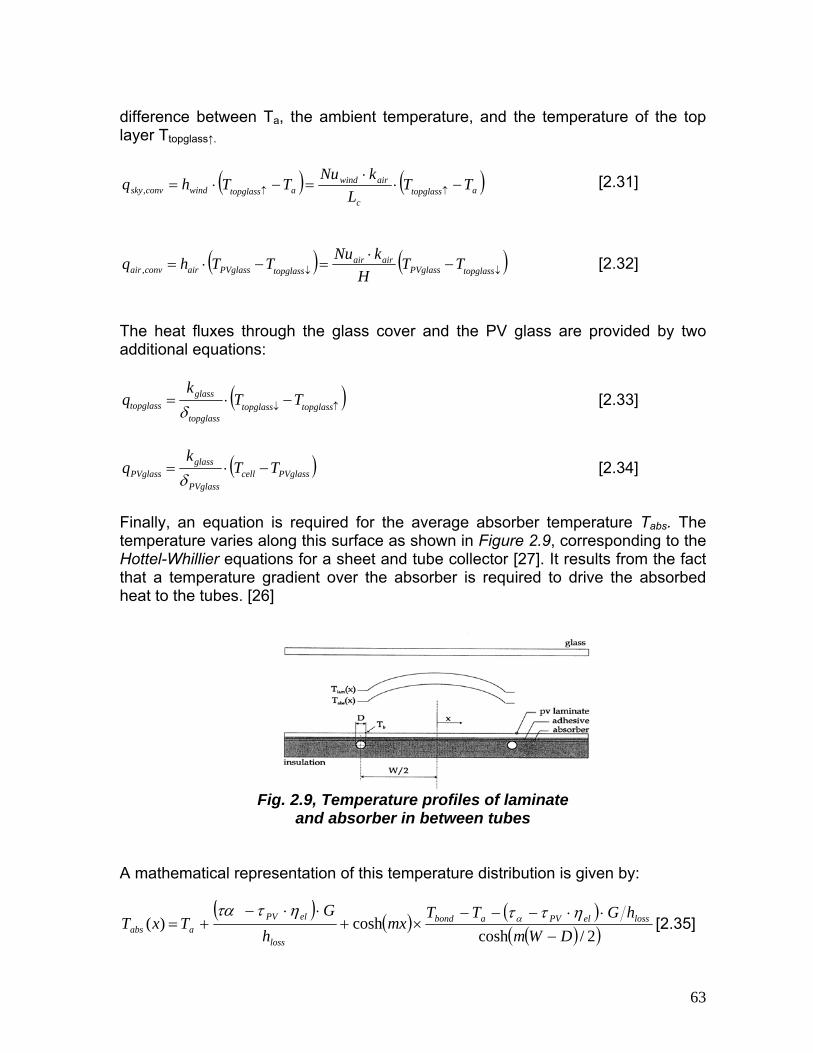
difference between Ta, the ambient temperature, and the temperature of the top layer Ttopglass↑.
( ) ( )atopglassc
airwindatopglasswindconvsky TT
LkNuTThq −⋅
⋅=−⋅= ↑↑, [2.31]
( ) ( )↓↓ −⋅
=−⋅= topglassPVglassairair
topglassPVglassairconvair TTH
kNuTThq , [2.32]
The heat fluxes through the glass cover and the PV glass are provided by two additional equations:
( ↑↓ −⋅= topglasstopglasstopglass
glasstopglass TT
kq
δ) [2.33]
( PVglasscellPVglass
glassPVglass TT
kq −⋅=
δ) [2.34]
Finally, an equation is required for the average absorber temperature Tabs. The temperature varies along this surface as shown in Figure 2.9, corresponding to the Hottel-Whillier equations for a sheet and tube collector [27]. It results from the fact that a temperature gradient over the absorber is required to drive the absorbed heat to the tubes. [26]
Fig. 2.9, Temperature profiles of laminate and absorber in between tubes
A mathematical representation of this temperature distribution is given by:
( )( ) ( )
( )( )2/coshcosh)(
DWmhGTT
mxh
GTxT losselPVabond
loss
elPVaabs −
⋅⋅−−−×+
⋅⋅−+=
ηττηττα α [2.35]
63

This equation is numerically integrated with respect to x in order to provide the average absorber temperature.
∫=
=2/
0
)(2 W
xabsabs dxxT
WT [2.36]
In equation the next parameters have to be calculated:
( )SiSiabsabsloss kkhm δδ ⋅+⋅= / [2.37] The effects of the copper (absorber) and silicon of the cells are expressed in the equation, since the heat conduction through the glass and silicone is much smaller than these. And Tbond is the temperature at the absorber surface directly above the tube; it is indicated in the Figure 2.8:
watertubewatertubewaterwaterbond kNuqDThqTT ⋅+=+= // [2.38] The overall heat loss coefficient, hl, can be calculated during the process of solving the heat balance:
( )( )aPVglass
baradskyconvskyloss TT
qqqh −++
= ,, [2.39]
The water outflow temperature in flow direction can be calculated if qwater is known:
( )com
inoutmpwater A
TTcq −⋅⋅= φ [2.40]
Tout of the previous segment is Tin for the next segment until the outflow temperature of the last segment being the outflow temperature of the panel can be calculated. 2.3.4 Definitions of efficiencies In this section, thermal and electrical efficiencies of the PV-Thermal collector are defined. The total efficiency of the PVT is defined:
elcolthcolcol ,, ηηη += The thermal efficiency of the collector, ηcol, is
( )GA
TTcm
com
inoutpthcol ⋅
−⋅⋅=&
,η
64

Where m the mass flow (kg/s), cp its heat capacity, Tin/out the inflow and outflow temperature of the water, Acom the aperture area of the thermal collector and G the total irradiance. The thermal efficiency is an instantaneous quantity, it can reach values higher than 1 when ambient temperature is higher than the average collector temperature or when the collector is cooling down. The DC electrical efficiency of the combi-panel is defined as
GAIV
com
LLelcol ⋅
⋅=,η
IL and VL are the direct current and voltage produced by the panel. In the presented model, the next equation is used for the electrical efficiency of the PV
[ ])251( −−= celloel Tμηη In which ηo=0.16 for a mono crystalline silicon module. The temperature coefficient μ is -0.3 %/ºC. The thermal efficiency influences the electrical efficiency via the cell temperature. And the electrical efficiency determines the optical efficiency through its effect on the absorption factor; therefore it also influences the thermal efficiency. 2.3.5 First results As a typical result of this PV-Thermal model is the dependency of the thermal efficiency on the reduced temperature which is the difference between inlet-temperature and ambient temperature divided by the irradiance, Tred= (Tin-Tamb)/G. The thermal and electrical efficiency is calculated for the meteorological and operational conditions showed in the next table: parameter value
G 800 W m-2
Tamb 20-60 ºC Tin 20 ºC m 0.02 kg sg-1
65

404142434445464748
-0,02 -0,01 0 0,01
Tred
ther
mal
effi
cien
cy(%
)
15,35
15,4
15,45
15,5
15,55
15,6
15,65
15,7
-0,02 -0,01 0 0,01 0,02
Tred
elec
tric
al e
ffici
ency
(%)
Compared to the separately installed pv panel and thermal collector the combi-panels have reasonable thermal and electrical efficiencies. The thermal efficiency is lower due to a lower absorption factor of the pv laminate compared to the spectral selective layer of a thermal collector and due to the heat resistance caused by the adhesive layer between pv laminate and absorber. The electrical efficiency is lower because of the necessary covering glass top layer and the increased cell temperature in the combi panel.
66

2.4 ELECTROLYSER
2.4.1 Introduction
In this project the purpose is to obtain hydrogen by means of electrolysis of the water, HTE is a promising alternative to the conventional electrolysis process; with this, it is possible to improve considerably the performance of electrolysis processes by operating at a high temperature. This method leads to a reduction in electricity consumption, but requires a part of the energy necessary for the dissociation of water to be in the form of thermal energy (steam water). In this project is not possible obtain water vapor at the temperatures required by a solid oxide electrolyser cell (SOEC), that are above 600 ºC, as we could see with the simulations, the output temperature of the water is of 100ºC with this type of panels, therefore, the high temperature electrolysers is not possible.
0
50
100
150
200
250
300
350
0 10 20 30 40 50 60 70 80 90 100 110 120 130 140
Temperature (ºC)
Ene
rgy
(KJ/
mol
H20)
deltaG T*deltaS deltaH
The slopes of the Gibbs free energy and the enthalpy lines are -0.162 and -0.032, respectively. This means the electrolysis system decreases steeply by increasing the operation temperature even if a great enthalpy for the system is required. Consequently we can expect higher thermal efficiencies for a hydrogen production at higher operating temperature conditions.
67

68

69
2.5 OTHER DATA AND AUXILIARY EQUIPMENT
2.5.1 Weather Data
One great advantage with TRNSYS is that it has a weather data generator in the standard library. This weather generator generates hourly weather data from monthly average values of solar radiation, dry bulb temperature, humidity ration, and wind speed. It also includes a solar radiation processor in the standard library which can estimate radiation at time intervals other than one hour [19].

3. Results Other effects influencing the thermal and electrical yield are discussed in the next section. To estimate the influence of dynamical effects on the daily yield a time dependent calculation is done using the measured irradiances, fluid inlet temperatures, ambient temperature and volume flow as inputs. For the simulations two average days were used, one for winter (1st of February) and one summer (7th of July) in two different cities, one was Almeria in Spain, where the biggest solar platform in Europe can be found and the other was Stockholm (Sweden) where this project was carried out. The ambient temperature and the irradiance of those places are shown in Fig 3.1 for the summer day
0
5
10
15
20
25
30
35
7 8 9 10 11 12 13 14 15 16 17 18 19 20 21 22
hour of day
ambi
ent t
empe
ratu
re (º
C)
Almería (Spain) Stockholm (Sweden)
0
200
400
600
800
1000
1200
7 8 9 10 11 12 13 14 15 16 17 18 19 20 21 22
hour of day
Irrad
ianc
e (W
/m2)
Almería (Spain) Stockholm (Sweden) Fig. 3.1 Ambient Temperature and solar irradiance
70

For the simulations a constant flow of 0.02 kg/s and an inlet temperature of the water of 12 ºC. were used.
In our case, the model that we used produce errors for irradiations below 230 W/m2, different unstable oscillations in the temperature of the different layers of the panel appear.
Probably this low irradiations in the model that was used produce thermal efficiencies below 0 and the output temperature is lower than the input temperature, also the low temperature of the cell produce a higher electrical efficiencies, even higher than the specified in the data sheets of the panels. This electrical and thermal efficiencies are shown form fig 3.2 to Fig 3.6
1515,215,415,615,8
1616,216,416,616,8
17
7 8 9 10 11 12 13 14 15 16 17 18 19 20
hour of day
elec
tric
al e
ffici
ency
(%)
Stockholm (Sweden) Almería (Spain)
Fig. 3.2 Electrical efficiency for summer
71

0
50
100
150
200
7 8 9 10 11 12 13 14 15 16 17 18 19 20
hour of day
elec
tric
al p
ower
(W)
Almería (Spain) Stockholm (Sweden)
Fig. 3.3 Electrical power for summer
-10
0
10
20
30
40
50
60
70
7 8 9 10 11 12 13 14 15 16 17 18 19
hour of day
ther
mal
effi
cien
cy (%
)
Almería (Spain) Stockholm (Sweden)
Fig 3.4 Thermal Efficiency for summer
72

0100200300400500600700800
7 8 9 10 11 12 13 14 15 16 17 18 19
hour of day
ther
mal
pow
er (W
)
Almería (Spain) Stockholm (Sweden)
Fig 3.5 Thermal power (summer)
02468
101214161820
7 8 9 10 11 12 13 14 15 16 17 18 19
hour of day
outfl
ow te
mpe
ratu
re (º
C)
Stockholm (Sweden) Almería (Spain) Inflow temperature
Fig 3.6 Output Temperature from one panel (summer)
73

For winter, the low ambient temperature and irradiance in Stockholm, produce really low efficiencies compared with the ones produced in Almeria as we can see in fig 3.7 to 3.10
.
0
0,5
1
1,5
2
9 10 11 12 13 14 15 16
hour of day
ambi
ent t
empe
ratu
re
(ºC)
0
5
10
15
20
25
30
Irra
dian
ce (W
/m2)
ambient temperature (ºC) Irradiance (W/m2)
Fig 3.7 Data for Stockholm
0
5
10
15
20
9 10 11 12 13 14 15 16 17 18
hour of day
ambi
ent t
empe
ratu
re
(ºC
)
0
100
200
300
400
500
600
700
Irra
dian
ce (W
/m2)
ambient temperature (ºC) Irradiance (W/m2)
Fig 3.8 Data for Almeria
74

0
5
10
15
20
25
30
35
11 12 13 14 15 16 17
hour of day
effic
ienc
y (%
)
0
100
200
300
400
500
600
Irra
dian
ce (W
/m2)
electrical efficiency thermal efficiency irradiance
Fig 3.11 Electrical efficiency (Almeria)
0
50
100
150
200
250
11 12 13 14 15 16 17
hour of day
Pow
er (W
)
0
100
200
300
400
500
600
Irra
dian
ce (W
/m2)
Electrical Power Thermal Power Irradiance
Fig. 3.12 Electrical Power (Almeria)
02468
10121416
11 12 13 14 15 16 17
hour of day
Pow
er (W
)
0
100
200
300
400
500
600
Irra
dian
ce (W
/m2)
Outflow temperature Inflow temperature Irradiance
Fig 3.13 Outflow temperature (Almeria) 75

As we mention before, the model of the panel allow us to calculate how the temperature of the water change throughout the panel. In this simulation, the panel was divided into 3 segments. In the figure 3.14we can see how the temperatures of the panel and water change in the different segments
0
5
10
15
20
25
30
1 2 3
nº of segments used
Tem
pera
ture
(ºC)
Cell temperature Water temperature
Fig. 3.14 Temperatures in the 3 different segments of the panel.
76

Is important to notice that the temperature of the panel depends on the temperature of the fluid, if no heated water was required, cold water could be introduced to the cell to cool down the cell and obtain a better electrical efficiency. In the following figure, two panels were connected in series to see the change in temperature.
0
5
10
15
20
25
30
35
1 2 3 4 5 6
nº of segments used
Tem
pera
ture
(ºC
)
Cell temperature Water temperature
Fig. 3.15 Temperature for two panels in series
Other important aspect is how the temperature changes with the flow, as we can see in the next figure, the lower the flow, the lower the output temperature.
water temperature for different flows (0.5- 0.25- 0.1- 0.05- 0.02)
10
12
14
16
18
1 2 3
distance
Wat
er te
mpe
ratu
re (º
C)
Fig 3.16 Temperature for different water flows
Since the aim of the Project was to obtain high temperatures to increase the efficiency for the production of hydrogen, several panels are connected in series to increase the temperature. The pressure values and different problem like cavitations are not studied in this Project. Also the losses in the tubes are
77
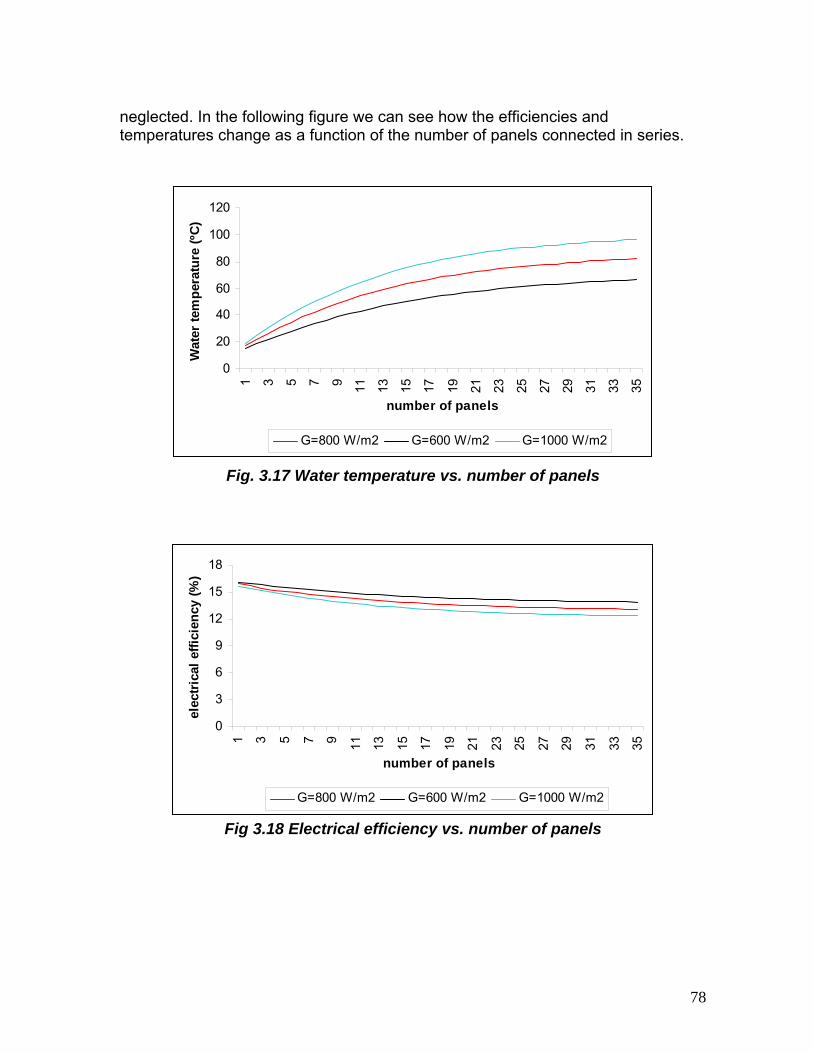
neglected. In the following figure we can see how the efficiencies and temperatures change as a function of the number of panels connected in series.
0
20
40
60
80
100
120
1 3 5 7 9 11 13 15 17 19 21 23 25 27 29 31 33 35
number of panels
Wat
er te
mpe
ratu
re (º
C)
G=800 W/m2 G=600 W/m2 G=1000 W/m2
Fig. 3.17 Water temperature vs. number of panels
0
3
6
9
12
15
18
1 3 5 7 9 11 13 15 17 19 21 23 25 27 29 31 33 35
number of panels
elec
trica
l effi
cien
cy (%
)
G=800 W/m2 G=600 W/m2 G=1000 W/m2
Fig 3.18 Electrical efficiency vs. number of panels
78

05
1015202530354045
1 3 5 7 9 11 13 15 17 19 21 23 25 27 29 31 33 35
number of panels
ther
mal
effi
cien
cy (%
)
G=800 W/m2 G=600 W/m2 G=1000 W/m2
Fig 3.19 Thermal efficiency vs. number of panels
Overall thermal efficiency and the balance of electricity An overall thermal efficiency for a hydrogen production by the PV/Thermal system has been analyzed. Considerable factors for calculating the overall thermal efficiency (η overall) are the efficiency of the electrolysis cell (η electrolysis), the electricity generation efficiency by the PV laminate and the thermal generation efficiency by the PV/Thermal. In order to analyze the sensitivity of the overall thermal efficiency, the applied span of each variable has been established as follows:
Efficiency of the electrolysis cell: 60-90% Efficiency of the PV/Thermal panel: 52%
The balance (χelec) of electricity and the thermal energy required by the electrolyser system supplied by the PV/Thermal panel has also been estimated. It is shown in the next figure:
79

0,74
0,76
0,78
0,8
0,82
0,84
0,86
0 10 20 30 40 50 60 70 80 90 100 110 120 130 140
Operation temperature (ºC)
Bala
nce
of e
lect
rici
ty
dem
ande
d
Figure 3.20, Balance of electricity as a function of operation temperature
The thermal efficiency defined as a high heat value of the produced hydrogen (HHV = 285.8kJ/H2 mol) divided by the total energy of the heat and the electricity required to produce the hydrogen is calculated by Eq. [3.1], and the balance of the electricity and the thermal energy is also calculated by Eq. [3.2].
PVTiselectrolyse
pheatingh
he
eelec
elhoverall
EFnQ
TcQQ
QQQ
QQHHV
ηη
χ
η
⋅⋅−=
Δ⋅==
+=
+=
∫/.
)(
)(
In the last equation, E represents the equilibrium potential, at the corresponding temperature. The E for the different temperatures is shown in the following figure
80

-1,26-1,24-1,22-1,2
-1,18-1,16-1,14-1,12-1,1
-1,08-1,06
0 10 20 30 40 50 60 70 80 90 100 110 120 130 140
Temperature (ºC)
Equ
ilibr
ium
Pot
entia
l (V
)
Figure 3.1, Equilibrium potential E vs. temperature
In the following we can see how the overall efficiency changes with the temperature and the electrolyser efficiency. A maximum value of 54% can be obtained.
ηelectrolysis
T (ºC) 60% 70% 80% 90% 20 0.3589 0.4146 0.4691 0.522640 0.3624 0.4184 0.4731 0.526760 0.3659 0.4220 0.4770 0.530780 0.3695 0.4260 0.4811 0.5350100 0.3730 0.4297 0.4850 0.5389120 0.3766 0.4336 0.4890 0.5431
0
0,1
0,2
0,3
0,4
0,5
0,6
0 10 20 30 40 50 60 70 80 90 100 110 120 130 140
Temperature (ºC)
Ove
rall
effic
ienc
y
0.9 0.8 0.7 0.6
81

82
Figure 3.2, overall efficiency for different temperatures

83
4. Conclusions
In this thesis a PV/Thermal panel has been evaluated with respect to their thermal and electrical efficiencies. The model that we used was taken from one of the models proposed by H.A. Zondag [26]; this model solves the heat balance for all layers in a combi-panel. A verification of the simulation was not carried out since we don’t have any panel of this kind to measure. Also the geometrical characteristics proposed by Zondag were used in the simulations. The thermal properties of the model were adjusted to obtain the maximum output temperature with this type of panels, and the electrical properties were taken from a commercial pv panel (Sanyo HIP 20).
A few general remarks should be made about possible differences in production costs of a separately installed thermal collector and pv panel compared to a PV/Thermal panel. Installation costs are shared by the installation of a PV/Thermal, while the installation costs of separate components is higher. The glass top layer of the PV panel that normally has to provide mechanical protection of the pv cells is covered in a PV/Thermal by a separate top glass layer that already has this function.
There is a production cost disadvantage for the PV/Thermal panel. To enable good heat transport between the pv cells and the water flowing through the tubes, an adhesive silicone layer that avoid overheating on the cells needs to be integrated in the PV/Thermal panel design. This construction method requires extra material costs or extra production steps. To verify the behavior of the silicone, a real hybrid panel should be studied to make sure that this pv cell can support high water temperature.
Due to the amount of errors generated by simulink generated mostly by the algebraic loops, only two representative days for summer and winter in different regions (Stockholm (Sweden), Almeria (Spain)) were simulated. When large amount of data was used, errors in the simulation appeared.
In the simulation of a single pv/thermal panel, thermal efficiencies of 47% were obtained and electrical efficiencies of 16%. The pv cell used in the simulations has a low temperature coefficient that reduces the variation in the output power produced by temperature changes.
With simulations, we were able to see that the high temperatures that we were expecting using this pv thermal panels can not be achieved, reaching temperatures around 100ºC. in order to obtain the high temperature that is required for High Temperature Steam Electrolysis other type of thermal panels should be used, for example parabolic concentrators or vacuum tubes.
With this hybrid panels we can reach the highest temperature of around 100ºC using minimum 35 panels connected in series, for a water flow of 0.02kg/s, with

84
additional panels the temperature doesn’t increase, and the thermal and electrical efficiencies have low values.
With a temperature of around 100ºC the overall efficiency of the system (pv/thermal panel and electrolyser) for the production of hydrogen was calculated, with a maximum of 54% with an electrolyser efficiency of 90%. Between ambient temperature and the obtained by the pv/thermal, the efficiency of the overall system has a variation of only 5%
With the results obtained with the simulation we can see that this type of panel is not appropriate to produce high water temperature. Using additional top glass cover layers, the temperature can be higher, but still, it doesn’t reach the temperature required by a HTSE system.
The temperature of the panel is proportional to the water temperature, and when this is used to cool down the pv cell, good results are obtained; therefore the electrical efficiency can be increased. This can be a good alternative for countries where the temperature is high in summer and the efficiency of the photovoltaic modules decrease in a significant way.

85
REFERENCES [1] National Hydrogen Energy Roadmap Workshop; Washington, DC; 2002. [2] U.S. Department of Energy (www.doe.gov ). [3] Water electrolysis and solar hydrogen demonstration projects, G. Sandstede, R. Wurster; 1989. [4] Rodriguez G, Pinteaux T. Studies and design of several scenarios for large production of hydrogen by coupling a high-temperature reactor with steam electrolysers. Grenoble, France, 2–5 September 2003, paper CO1/6. [5] Divisek J. (1990) Water electrolysis in low– and medium temperature regime. In Electrochemical Hydrogen Technologies—Electrochemical Production and Combustion of Hydrogen, Wendt H. (Ed), pp. 137–212, Elsevier Science Publishing Co., Inc., Oxford. [6] Wendt and Plzak, 1991. [7] Antonio Luque and Steven Hegedus.Handbook of Photovoltaic Science and Engineering; 2003. [8] Arnulf Jäger-Waldau.PV Status Report 2007, [9] PVT Roadmap, A European guide for the development and market introduction of PV-Thermal technology. [10] D.W. de Vries, W.G.J. van Helden, R.J.C. van Zolingen,A.A. van Steenhoven, H.A.Zondag. The yield of different combined PV-thermal collector designs, 2003. [11] Miroslav Bosanac, Bent Sørensen, Ivan Katic, Henrik Sørensen, Bruno Nielsen, Jamal Badran. Photovoltaic/Thermal Solar Collectors and their potential in Denmark, 2003. [12] http://www.pvtwins.nl [13] http://www.solarwall.com [14] http://www.hdsolar.com/index_tmp.php [15] http://www.arontis.se [16] Bjornar Sandnes and John Rekstad. A photovoltaic thermal PVT collector with a polymer absorber plate experimental study and analytical model, 2000. [17] Y.B. Assoa, C. Menezo, G. Fraisse, R. Yezou, J. Brau. Study of a new concept of photovoltaic–thermal hybrid collector. August 2006. [18] Y. Tripanagnostopoulos, T.Nousia, M.Souliotis and P. Yianoulis. Hybrid photovoltaic thermal solar systems. November 2000. [19] Klein S. A., Beckman W. A. and Duffie J. A. (1994) TRNSYS—A Transient System Simulation Program. Program Manual, Version 14.1.Solar Energy Laboratory, University of Wisconsin. [20] Rauschenbach H. S. (1980) Solar Cell Array Design Handbook: the Principles and Technology of Photovoltaic Energy Conversion, Van Nostrand Reinhold, New York. [21] Loferski J. J. (1972) An introduction to the physics of solar cells. In Solar Cells—Outlook for Improved Efficiency, pp. 47–53, National Academy of Sciences–Space Science Board, Washington, DC. [22] Duffie, J.A., Beckman, W.A., 1991. Solar Engineering of Thermal Processes. John Wiley & Sons Inc, New York.

86
[23] Townsend T. U. (1989) A Method for Estimating the Long-term Performance of Direct-Coupled Photovoltaic Systems, M.Sc. thesis, University of Wisconsin–Madison, U.S.A. [24] Ulleberg. Ø. (1998) Stand Alone Power Systems for the Future: Optimal design, operation & control of solar-hydrogen energy systems. [25] Ji J, Chow TT, He W. Dynamic performance of hybrid photovoltaic/thermal collector wall in Hong Kong. Building Environ 2003;38:1327–34. [26] Zondag, H.A., de Vries, D.W., van Helden, W.G.J., van Zolingen, R.J.C., van Steenhoven, A.A., 2002. The thermal and electrical yield of a PV-Thermal collector. Solar Energy 72 (2), 113–128. [27] Florschuetz, L.W., 1979. Extension of the Hottel–Whiller Model to the analysis of combined photovoltaic/thermal flat plate collectors. Solar Energy 22, 361–366. [28] Bergene, T., Lovvik, O.M., 1995. Model calculations on a flatplate solar heat collector with integrated solar cells. Solar Energy 55 (6), 453–462. [29] Siegel, R, 1973. Net radiation method for transmission through partially transparent plates. [30] de Vries, D. W., 1998. Design of a PV/thermal combi panel. PhD Thesis Eindhoven University of Technology, Eindhoven. [31] A.W. Czanderna, F.J. Pern, Sol. Energy Mater. Sol. Cells 43 (1996) 101. [32] Zondag HA, Van Helden WGJ. Stagnation temperature in PVT collectors. In: PV in Europe, Rome, 2002. [33] Raghuraman P. Analytical predictions of liquid and air photovoltaic/thermal, flat-plate collector performance. J Sol Energy Eng 1981;103:291–8. [34] Dross F. Vacuum-free, cost-effective,developing-country-material-available solar cell encapsulation. Managua, Nicaragua 2 December 2005. [35] Zondag, H.A. Flat-plate PV-Thermal collectors and systems:A review. 2005. [36] Zondag, H.A. The yield of different combined PV-thermal collector designs. 2003. [37] Generation IV Nuclear Energy Systems Roadmap—Economics Crosscut Group—R&D Scope Report. Draft authored by the members of the Generation IV Economics Crosscut Group, August 6, 2002. [38] C.Mansilla. Can high temperature steam electrolysis function with geothermal heat? 2007. [39] Michael K.H. Leung. Technological development of hydrogen production by solid oxide electrolyser cell (SOEC), 2007. [40] N.P. Brandon. Hydrogen production through steam electrolysis: Model-based steady state performance of a cathode-supported intermediate temperature solid oxide electrolysis cell. 2006. [41] N.P. Brandon. Hydrogen production through steam electrolysis: Model-based dynamic behaviour of a cathode-supported intermediate temperature solid oxide electrolysis cell. 2008. [42] J. Schmidt. CMC tubes based on C/C–SiC with high oxidation and corrosion resistance 2004. [43] Jan Schulte-Fischedick. An innovative ceramic high temperature plate-fin heat exchanger for EFCC processes. 2006 [44] S.K. Singal. Review of mathematical modeling on latent heat thermal energy storage systems using phase-change material, 2006.

87
[45] Hasnain SM. Review on sustainable thermal energy storage technologies, Part 1: heat storage materials and techniques. Energy Convers Manage 1998;39:1127–38. [46] Wujun Zhang, Chaxiu Guo. Numerical simulation and parametric study on new type of high temperature latent heat thermal energy storage system. 2007. [47] Hollands, K.G.T. et al., 1976. Free convective heat transfer across inclined air layers. Journal of Heat Transfer, ASME Transactions 98, 189–193. [48] Fujii, T., Imura, H., 1972. Natural convection heat transfer from a plate with arbitrary inclination. Int. J. Heat Mass Transfer 15, 755–767. [49] Bejan A. (1993). Heat Transfer, Wiley, New York.

APPENDIX A – Fundamental Constants Standard acceleration of gravity g 9.806 m⋅s-2
Stefan-Boltzmann constant σ 5.6697⋅10-8 W⋅K-4⋅m-2
Universal gas constant ℜ 8.314 J⋅K-1⋅mol-1
Faraday constant F 96,485.389 C⋅mol-1
Table A.1, fundamental constants used in thesis
88
32 TdTcTbaC p ⋅+⋅+⋅+=
92
5
10966.1101967.0104802.011.28
−−
−
⋅−=⋅=
⋅==
dbca
AIR
Reynold number (Re):
μρ Dv ⋅⋅
=Re ;
Rayleigh number (Ra): Ra = Gr⋅Pr; where Gr is the Grashof number and Pr is the Prandtl number:
ρ : density (kg⋅m-3) ν : mean fluid velocity (m⋅s-1) μ : dynamic fluid viscosity (N⋅s⋅m-2) D : characteristic length (m)
g : acceleration due to gravity (m⋅s- 2) β : volumetic thermal expansion coefficient (1⋅K-1) ν : kinematic viscosity (m2⋅s-1) ΔT: temperatures difference (K) L : characteristic length (m)
cp : specific heat (J⋅kg-
2
3
υβ LTgGr ⋅Δ⋅⋅
=
kcp μ⋅
=Pr 1⋅K-1)
μ : dynamic fluid viscosity (N⋅s⋅m-2) k : thermal conductivity (W⋅m-1⋅K-1)
Cp: specific heat (kJ/kmol⋅K) T: temperature (K)

89
APPENDIX B - PHOTOVOLTAIC PANEL Nomenclature IL Light current (A) Io Diode reverse saturation current (A) Rs, Rsh Series resistance and shunt resistance respectively (Ω) a Curve fitting parameter (V) U Operation voltage (V) I Operation current (A) Isc Short circuit current (A) Voc Open circuit voltage (V) Imp Maximum power current (A) Vmp Maximum power voltage (V) GT Irradiance (W⋅m-2)
NS Number of PV modules in series
Tc Temperature of PV cell (K) egap Band gap of material (eV) Ct Thermal capacitance of PV module (J⋅K-1⋅m-2) Ta Temperature of ambient (K) UL Overall heat loss coefficient (J⋅m-2) μ I,sc Temperature coefficient of the short circuit current (A⋅K-1) μ V,oc Temperature coefficient of the open circuit voltage (V⋅K-1) ηc Efficiency of PV cells (%) τ Transmittance α Absorptance ref Reference conditions NOCT Nominal operating cell temperature
Table B.1, nomenclature used in photovoltaic panel Values Photovoltaic Panel Cell temperature at reference conditions Tc,ref 25 °C Irradiance at reference conditions GT,ref 1000 W⋅m-2
Short circuit current at reference conditions Isc,ref 2.664 A Open circuit voltage at reference conditions Uoc,ref 87.72 V Maximum power current Imp 2.448 A Maximum power voltage Vmp 70.731 V Temperature coefficient of the short circuit current μ I,sc 0.00148 A⋅K-1
Temperature coefficient of the open circuit voltage μ V,oc -0.3318 V⋅K-1
Temperature ambient (NOCT) Ta,NOCT 20 °C Temperature cell (NOCT) Tc,NOCT 44 °C Irradiance (NOCT) GT,NOCT 800 W⋅m-2
Table B.2, value of the parameters used in photovoltaic panel

APPENDIX C – PHOTOVOLTAIC THERMAL PANEL Nomenclature A Collector surface area (m2) c Specific heat (J⋅kg-1⋅K-1) D Tube diameter (m) F View factor g Gravitational acceleration (m⋅s-2) G Irradiation (W⋅m-2) h Coefficient of heat transfer (W⋅m-1 ) I Current (A) H Ceight of insulation air layer (m) K Extinction coefficient (m-1) k Thermal conductivity (W⋅m-1⋅K-1) L Length of collector surface (m) m& Mass flow (kg⋅s-1) Nu Nusselt number n Refractive index Pr Prandtl number q Heat flux (W⋅m-2) Q Latent heat (J⋅kg-1) R Reflection coefficient Ra Rayleigh number Re Reynolds number T Temperature (K) Tred Reduced temperature (K⋅m2⋅W-1) v Velocity (m⋅s-1) V Voltage (V) W Tube spacing (m) α Absorption coefficient d Thickness of layer (m) ε Coefficient of emissivity η Efficiency ηo Electrical efficiency at standard conditions θ Angle to perpendicular of collector μ Viscosity (Kg⋅m-1⋅s-1) υ Cinematic viscosity (m2⋅s-1) τ Transmission coefficient τPV Transmission coefficient for layers above PV φ Collector angle with the horizontal a Ambient abs Absorber ba From back to ambient ca From cells to absorber conv Convection el Electrical g Glass in Inflow mpp Maximum power point rad Radiation th Thermal topglass↑ Upper surface topglass topglass↓ lower surface topglass
90Table C.1, nomenclature used in PVT

Values of coefficients used in simulations PV panel, collector, combi panel area APV = Acol=Acom 0.94 m2 Collector length Lc 1.776 m Length tube segment L 0.724 m Tube diameter D 0.01 m Tube spacing W 0.095 m Width of air layer H 0.02 m Collector angle ϕ 45º Thickness of cover glass dtopglass 3.2 mm Thickness of PV glass dPVglass 3.0 mm Thickness absorber dabs 2 mm Thickness silicon cell dcell 0.35 mm Thickness silicone layer dsilicone 5 mm
Table C.2, characteristic system dimensions3
Mass flow m 0.02 Kg/s &Mean fluid velocity vwater: (m s-1) Specific heat capacity of water cwater 4200 J⋅kg-1⋅K-1
Specific heat capacity of cooper tube ccooper tube 390 J⋅kg-1⋅K-1 Specific heat capacity of cooper sheet ccooper sheet 390 J⋅kg-1⋅K-1 Specific heat capacity of silicon csilicon 840 J⋅kg-1⋅K-1 Specific heat capacity of glass cglass 760 J⋅kg-1⋅K-1 Specific heat capacity of air cair 1004 J⋅kg-1⋅K-1 Kinematics viscosity air νair 1.5⋅10-5 m2⋅s-1
Dynamic fluid viscosity of air μair 18⋅10-6 N⋅s⋅m-2 Volumetric thermal expansion coefficient air βair 1.4 1⋅K-1 Density of water ρwater 1000 kg⋅m-3
Dynamic fluid viscosity of water μwater 1.003 10-3 N⋅s⋅m-2 Heat conduction through air kair 0.025 W⋅m-1⋅K-1 Heat conduction through glass kglass 0.9 W⋅m-1⋅K-1 Heat conduction through water kwater 0.6 W⋅m-1⋅K-1 Heat conduction through silicon ksilicon 84 W⋅m-1⋅K-1 Heat conduction through absorber (cooper) kabsorber 390 W⋅m-1⋅K-1 Heat conduction through silicone ksilicone 0.2 W⋅m-1⋅K-1 Heat transfer to absorber for sheet- and tube hca 40 W⋅m-1⋅K-1 Heat transfer through back of the collector hba 1 W⋅m-1⋅K-1
Table C.3, thermal properties
3 These dimensions have been taken from model of Zondag et al [36], possibly when we start the simulation change these values if we think advisable.
91

Ambient temperature Tamb 20 ºC Irradiance G 800 W⋅m-2 Wind speed vwind 1 m⋅s-1 Sky temperature (clear sky) Tsky 8 ºC Water inlet temperature Tin 20 ºC
Table C.4, ambient conditions used in simulation4
Emissivity of glass εg 0.9 Emissivity of PV εPV 0.9 Absorption factor pv laminate α 0.785
Table C.5, optical properties Additional equations To calculate the heat transfer coefficient (h), the type of fluid flow and convection must be determined: laminar or turbulent flow and forced or natural convection. The parameters that determine the type of flow are the Rayleigh and Reynolds numbers mentioned in Appendix A. Case 1. From top layer to the ambient. In the case of natural convection we will use the equations on Fuji and Imura et al.[48] that determine the Nusselt number Nu as a function of Ra. Then in Equation [2.31] has:
( ) ( )333.0333.025.0 13.0sin56.0 critcritwind RaRaRaNu −+⋅⋅= ϕ [C.1] ( )
2
3
Prair
catopglass LTTgRa
υβ ⋅−⋅⋅
⋅= ↑ [C.2]
8101⋅=critRa ; value recommended by Fuji and Imura et al. [48] for inclined plates
at 45º. Case 2. Insulating air layer. For the convective heat transfer in a inclined insulating air layer with the lower and upper boundaries at a uniform temperature, Hollands et al. [47] recommend the following relation valid for inclination angles β ∈ [0º, 60º] degrees and Ra ∈ [0, 1⋅105]. In Equation [2.32]: 4 These conditions will be taken when simulate only the PVT panel, when the plant is designed we will use weather data from Trnsys.
925 This values is obtained integrating

( )++
⎥⎥⎦
⎤
⎢⎢⎣
⎡−⎟
⎠⎞
⎜⎝⎛ ⋅
+⎥⎦
⎤⎢⎣
⎡⋅
−×⎥⎦
⎤⎢⎣
⎡
⋅⋅⋅
−⋅+= 15830
coscos
17081cos
8.1sin1708144.11333.06.1 ϕ
ϕϕϕ Ra
RaRaNuair [C.3]
The signs + indicate that these terms have the indicated value only if they are positive. If the term between the brackets assumes a negative value these terms become zero. Case 3. Tube. To estimate the heat transfer coefficient for heat transport from the tube wall to the water (Equation [2.38]) we need to calculate the flow velocity inside the tubes with:
42iD
mv⋅
=π
& [C.4]
where is flow rate (kg/s) and Di is inner diameter in the tube. m& According to Bejan et al. [49] for laminar flow in tubes a constant Nusselt number can be used:
2300Re364.4 <= siNutube [C.5] This is the case in low flow calculations where collector flow rates are around 0.004 kg/s. In the case for conventional flow rates are usual have turbulent flow inside the tubes. Then the next equation can be used:
2300RePrRe023.0 4.08.0 >⋅⋅= siNutube [C.6]
93

94
APPENDIX D - SOLID OXIDE ELECTROLYSER CELL (SOEC) Nomenclature CH2 ; CH2O Concentration of hydrogen and steam in the cathode gas stream (mol⋅m-3) Ci Concentration of gas species i in the cathode and anode gas streams
(mol⋅m-3) Cp,C; Cp,A; Cp,S; Cp,I Heat capacity of the cathode and anode, solid structure and interconnect
(J⋅kg-1⋅K-1) Ci
o Concentration of gas species i at the cell inlet (mol⋅m-3)
CH2 TPB ; CH2O TPB Concentration of hydrogen and steam at the triple phase boundary (mol⋅m-3) dh,C ; d h,A Hydraulic diameter of the cathode and anode gas channels (m) Deff, cathode Average effective diffusivity coefficient of the cathode (m2⋅s-1) Ecathode, Eanode Activation energy for the exchange current density of the cathode and
anode (J⋅mol-1) Eelectrode Activation energy for the exchange current density of an electrode (J⋅mol-1) F Faraday’s constant (C⋅mol-1) ΔG Gibbs free energy change of the reaction (J⋅mol-1H2) hC, hA, hS, hI Height of the cathode and anode channels, and thickness of the solid
structure and Interconnect (m) ΔH Enthalpy change of the reaction (J⋅mol-1H2) j Local current density (A⋅m-2) j0,cathode ; j0,anode Exchange current density of the cathode and anode (A⋅m-2) j0,electrode Exchange current density of an electrode (A⋅m-2) kC, kA Convective heat transfer coefficient between the solid parts of the cell and
the cathode and Anode gas streams (J⋅m-2⋅s-1⋅K-1) kcathode, kanode Pre-exponential factor for the exchange current density of the cathode and
anode (Ω-1⋅m-2) kelectrode Pre-exponential factor for the exchange current density of an electrode (Ω-
1⋅m-2) L Cell length (m) NuC, NuA Nusselt number of the cathode and anode gas streams PO2 Oxygen pressure in the anode gas stream (Pa) PO2
TPB Oxygen pressure at the triple phase boundary (Pa)
R Reaction rate (mol⋅s-1⋅m-2) Rohm Total resistance of the cell including electric and ionic resistances (Ω⋅m2) ℜ Gas constant (J⋅mol-1⋅K-1) ΔS Entropy change of the reaction (J⋅K-1⋅mol-1H2) t Time (s) T Temperature (K) TC, TA, TS, TI Temperature of the cathode and anode gas streams, solid structure and
interconnect (K) TC
0 Temperature of the cathode gas stream at the inlet (K)
uC; uA Velocity of the cathode and anode gas streams (m⋅s-1) U Cell potential (V) U0 Standard potential (V)

95
Urev Reversible potential (V) Urev,TPB Reversible potential estimated for the gas concentrations at the triple
phase boundary (V) W Cell width (m) x Axial coordinate (m) α Transfer coefficient εS, εI Emissivity of the solid structure and interconnect ηact, cathode ηact,anode Activation overpotential losses at the cathode and anode (V) ηconc Total concentration overpotential losses (V) ηconc,cathode; ηconc,anode Concentration overpotential losses at the cathode and anode (V) ηOhm Ohmic losses (V) ηtotal Total irreversible losses (V) λC, λA, λS, λI Thermal conductivity of the cathode and anode gas streams, solid
Structure and interconnect (J⋅m-1⋅s-1⋅K-1) νi Stoichiometric coefficient of gas species i ρC, ρA, ρS, ρI Density of the cathode and anode gas streams, solid structure and
Interconnect (kg⋅m-3) σ Stefan–Boltzmann constant (W⋅m-2⋅K-4) σcathode, σanode Electric conductivity of the cathode and anode (Ω-1⋅m-1) σelectrolyte Ionic conductivity of the electrolyte (Ω-1⋅m-1) τcathode,τelectrolyte,τanode Thickness of the cathode, electrolyte an anode (m)
Table D.1, nomenclature used in solid oxide electrolyser cell Values of coefficients used in simulations Cathode channel height hC 0.001 m Anode channel height hA 0.001 m Solid structure thickness hS 570⋅10-6 m Interconnect thickness hI 500⋅10-6 m Cell length L 0.4 m Cell width W 0.1 m Cathode thickness τcathode 500⋅10-6 m Electrolyte thickness τelectrolyte 20⋅10-6 m Anode thickness τanode 50⋅10-6 m Cathode electric conductivity σcathode 80⋅103 Ω-1⋅m-1
Electrolyte ionic conductivity σelectrolyte 33.4⋅103 exp (−10.3×10³/TS) Ω-1⋅m-1
Anode electric conductivity σanode 8.4⋅103 Ω-1m-1 Cathode average effective diffusivity Deff,cathode 36.6⋅10-6 m-2⋅s-1
Solid structure emissivity εS 0.8 Interconnect emissivity εI 0.1 Solid structure heat capacity Cp,S 500 J⋅kg-1⋅K-1
Interconnect heat capacity Cp,I 500 J⋅kg-1⋅K-1
Solid structure thermal conductivity λS 2 J⋅m-1⋅s-1⋅K-1
Interconnect thermal conductivity λI 25 J⋅m-1⋅s-1⋅K-1
Solid structure density ρS 5900 kg⋅m-3
Interconnect density ρI 8000 kg⋅m-3
Cathode stream Nusselt number NuC 3.09

Anode stream Nusselt number NuA 3.09 Transfer coefficient α 0.5 Cathode stream inlet temperature TC
0 1023 K Cathode stream inlet composition 10 mol% H2/90 mol% H2O Anode stream composition 100 mol% O2
Operating pressure 0.1⋅10-6 Pa Average current density 5000 A⋅m-2
Steam utilization factor 80% Pre-exponential factor cathode kcahode 654⋅109 Ω-1⋅m-2
Pre-exponential factor anode kanode 235⋅109 Ω-1⋅m-2
Activation energy cathode Ecathode 140⋅103 J⋅mol-1
Activation energy anode Eanode 137⋅103 J⋅mol-1
Table D.2, model input parameters and operating conditions Additional equations Equations [D.1] and [D.2] show the boundary concentrations used in Equations [2.46],[2.47]. They are determined for equimolar counter-current one-dimensional diffusion of H2 and H2O. Deff,cathode represents the average effective diffusivity coefficient in the cathode, considering a binary gas mixture of H2 and H2O [40].
)(2
)()(,
22 xjFD
xCxCcathodeeff
cathodeH
boundaryH
τ+= [D.1]
)(2
)()(,
220 xjFD
xCxCcathodeeff
cathodeOH
boundaryH
τ−= [D.2]
Electrode exchange current densities used in Equation [2.48] [2.49] are expressed in Equation [D.3] as a function of the preexponential factor and activation energy.
cathodeanodeelectrodexT
Ek
FxT
xjS
electrodeelectrode
SelectrodeO
,)(
exp2
)()(,
∈
⎥⎦
⎤⎢⎣
⎡⋅ℜ
−⋅⋅
⋅⋅ℜ
= [D.3]
The convective heat transfer coefficients for the cathode and anode streams (kC and kA) are calculated using Equation [D.4], assuming constant Nusselt number and hydraulic diameter [D.5].
Ah
AAA
Ch
CCc d
Nukd
Nuk,,
λλ⋅=⋅= [D.4]
A
AAh
C
CCh hW
hWdhWhW
d+
⋅⋅=
+⋅⋅
=22
,, [D.5]
96

APPENDIX E – HEAT EXCHANGER h1 and h2 are the heat transfer coefficients for the hot (1) and cold (2) and given by:
h
iii d
Nuh
λ⋅= , i=1,2, [E.1]
where dh=2e is the hydraulic diameter and where Nui is the Nusselt number which can be calculated for specific plates by:
3/1638.0 PrRe0254.0 iiiNu ⋅⋅= [E.2] Pr being the Prandtl number and Re being the Reynolds number calculated from:
Bm
i
ii ⋅
⋅=
μ&2
Re [E.3]
where B is the plate width, mi the mass flow rate and μi the dynamic viscosity of the fluid in the hot (i = 1) and in the cold (i = 2) side, respectively.
97