DYNAMIC INCREMENT FACTOR IN MODULAR …road-transport-technology.org/Proceedings/7 - ISHVWD...7th...
14
7th International Symposium on Heavv Vehicle Weights & Dimensions Delft. The Netherlands. June 16 - 20. 2002 DYNAMIC INCREMENT FACTOR IN MODULAR EXPANSION JOINTS OF BRIDGES UNDER REAVY TRAFFIC LOADING Ir. J. Maljaars Dr. Ir. P.H. Waarts Ir. J.S. Leenderts Ir. lng. R.B.J. Hoogvelt TNO Building and Construction Research, The Netherlands, e-mail j [email protected], tel +31-15-2763464 TNO Building and Construction Research, The Netherlands Rijkswaterstaat, Ministry of transport, The Netherlands TNO Automotive, The Netherlands ABSTRACT In order to obtain a better insight in why expansion joints fail, dynamic loads on the road near expansion joints in bridges and dynamic responses in the construction of modular expansion joints are measured and evaluated. For this purpose, a test vehicle has passed these expansion joints at various velocities. Both dynamic load of the vehicle and strains in the expansion joints were measured. INTRODUCTION Modular expansion joints are applied in many recently built bridges. These expansion joints form the connection between abutment and bridge, see figure 1. In this figure, an overview is given of the main construction parts establishing a modular expansion joint. The steel lamellas (center beams) transfer the traffic load to the cross beams, which are steel beams mounted in the bridge and in the abutment. A commonly used design method for modular expansion joints in bridges is based on the calculation of stresses under quasi static loading. These stresses are multiplied by a dynamic amplification factor, which takes into account the roughness of the pavement near the expansion joint, and by a dynamic amplification factor, which takes into account the interaction between the time history loading and the dynamic response of the expansion joint, for which damping and eigen frequency of the expansion joint are important. In this paper, the first factor is referred to as dynamic amplification factor for loading, the second as dynamic amplification factor for interaction. For current practice, Eurocode 1 part 3 (1991) prescribes a magnitude of 1.3 for the dynamic amplification factor for load. The dynamic amplification for interaction should be determined using equations prescribed in the Eurocode. Most manufacturers of expansion joints make such a design of the joint that the dynamic amplification factor is approximately 1. The total dynamic amplification is thus 1 x 1.3 = 1.3 for most designs. In many bridges in The Netherlands, cross beams of modular expansion joints collapse long before the calculated life time, see figure 2. This is possibly caused by a dynamic increment in real bridges that exceeds the assumed magnitude in the design. Therefore, dynamic amplification factors were measured and analyzed with measurements for two bridges in The Netherlands, the bridge in motorway xx over xx near Zaltbommel: the "Martinus Nijhoffbrug" and the bridge in mot?rway xx over xx near Grubbenvorst: the "Noorderbrug". For these bridges, a dynamic amplification (load x interaction) of 1.4 is used in the design. This paper describes the measurements and analyses and the resulting dynamic responses. PROCEDURE An instrumented vehicle with two axles, weighing approximately 18 tons, crossed the expansion joints, see figure 4. Accelerometers were attached to the axles and chassis of this vehicle in order to determine the dynamic wheel load through a mass-spring-damper model. The vehicle model consists of two un sprung elements (front and rear axle) and two sprung chassis parts (front and rear) connected with a rotational joint to allow chassis roll. The model parameters are listed in table I. The input for the model are the eight measured accelerometer signals. The 289
Transcript of DYNAMIC INCREMENT FACTOR IN MODULAR …road-transport-technology.org/Proceedings/7 - ISHVWD...7th...
7th International Symposium on Heavv Vehicle Weights & Dimensions
Delft. The Netherlands. June 16 - 20. 2002
DYNAMIC INCREMENT FACTOR IN MODULAR EXPANSION JOINTS OF BRIDGES UNDER REA VY TRAFFIC LOADING
Ir. J. Maljaars
Dr. Ir. P.H. Waarts
Ir. J.S. Leenderts
Ir. lng. R.B.J. Hoogvelt
TNO Building and Construction Research, The Netherlands, e-mail
j [email protected], tel +31-15-2763464
TNO Building and Construction Research, The Netherlands
Rijkswaterstaat, Ministry of transport, The Netherlands
TNO Automotive, The Netherlands
ABSTRACT
In order to obtain a better insight in why expansion joints fail, dynamic loads on the road near expansion joints in
bridges and dynamic responses in the construction of modular expansion joints are measured and evaluated. For
this purpose, a test vehicle has passed these expansion joints at various velocities. Both dynamic load of the
vehicle and strains in the expansion joints were measured.
INTRODUCTION
Modular expansion joints are applied in many recently built bridges. These expansion joints form the connection
between abutment and bridge, see figure 1. In this figure, an overview is given of the main construction parts
establishing a modular expansion joint. The steel lamellas (center beams) transfer the traffic load to the cross
beams, which are steel beams mounted in the bridge and in the abutment.
A commonly used design method for modular expansion joints in bridges is based on the calculation of stresses
under quasi static loading. These stresses are multiplied by a dynamic amplification factor, which takes into
account the roughness of the pavement near the expansion joint, and by a dynamic amplification factor, which
takes into account the interaction between the time history loading and the dynamic response of the expansion
joint, for which damping and eigen frequency of the expansion joint are important. In this paper, the first factor is
referred to as dynamic amplification factor for loading, the second as dynamic amplification factor for interaction.
For current practice, Eurocode 1 part 3 (1991) prescribes a magnitude of 1.3 for the dynamic amplification factor
for load. The dynamic amplification for interaction should be determined using equations prescribed in the
Eurocode. Most manufacturers of expansion joints make such a design of the joint that the dynamic amplification
factor is approximately 1. The total dynamic amplification is thus 1 x 1.3 = 1.3 for most designs.
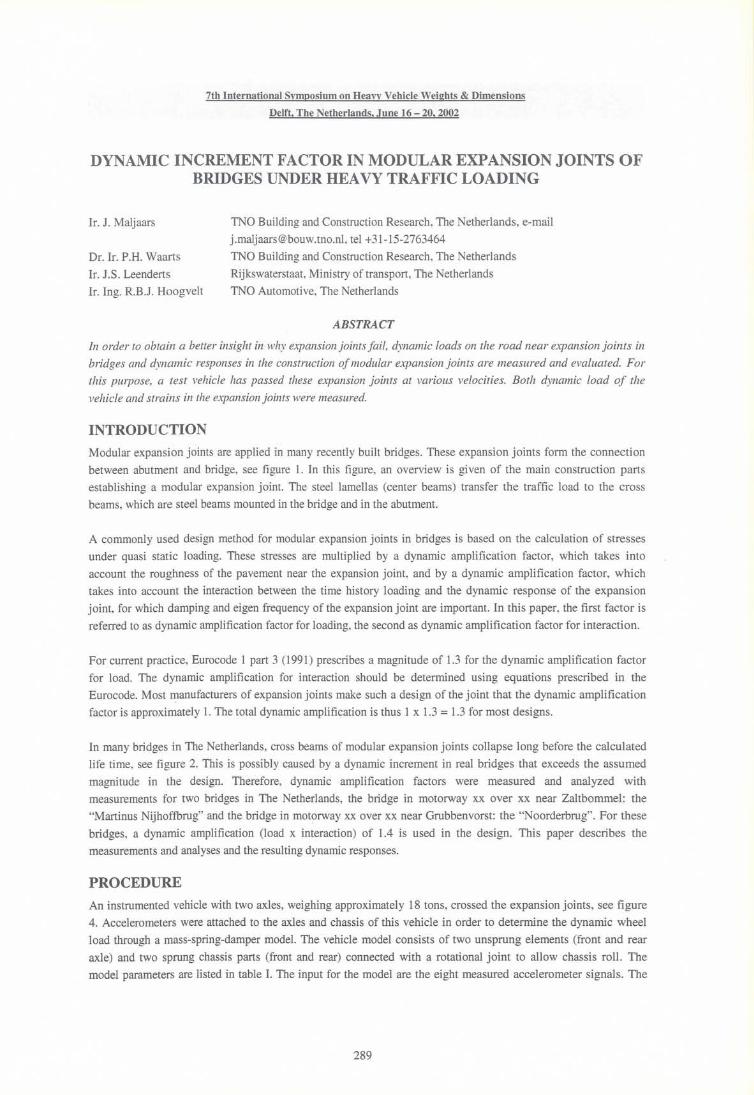
In many bridges in The Netherlands, cross beams of modular expansion joints collapse long before the calculated
life time, see figure 2. This is possibly caused by a dynamic increment in real bridges that exceeds the assumed
magnitude in the design. Therefore, dynamic amplification factors were measured and analyzed with
measurements for two bridges in The Netherlands, the bridge in motorway xx over xx near Zaltbommel: the
"Martinus Nijhoffbrug" and the bridge in mot?rway xx over xx near Grubbenvorst: the "Noorderbrug". For these
bridges, a dynamic amplification (load x interaction) of 1.4 is used in the design. This paper describes the
measurements and analyses and the resulting dynamic responses.
PROCEDURE
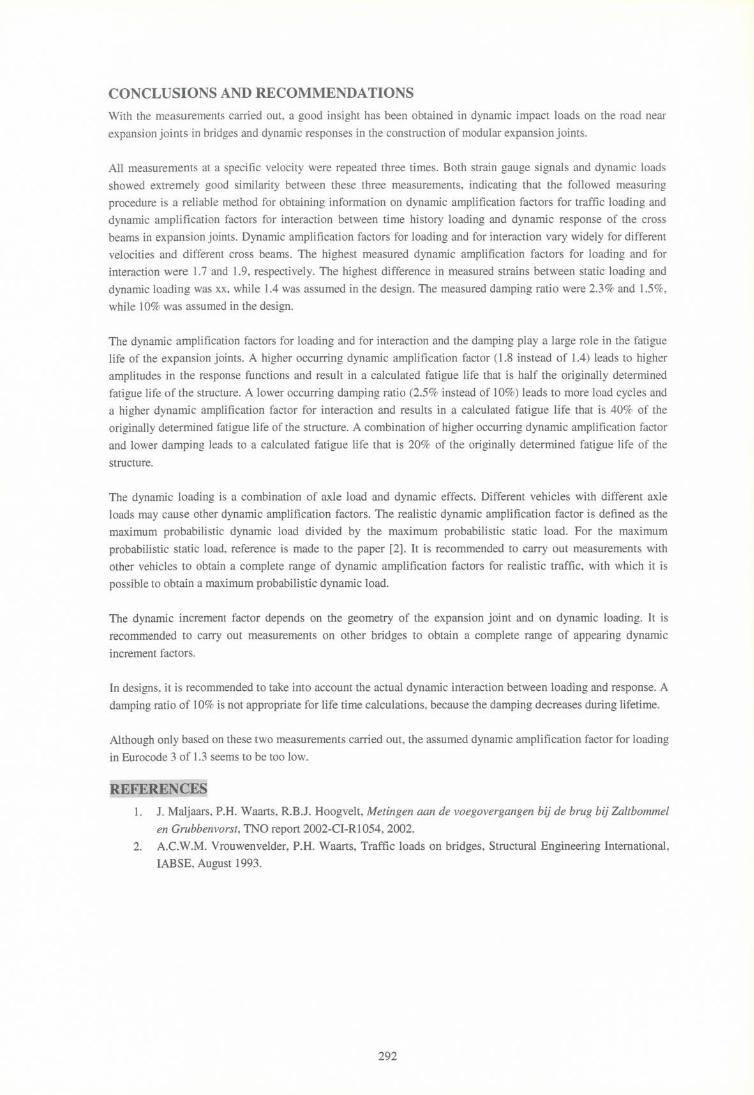
An instrumented vehicle with two axles, weighing approximately 18 tons, crossed the expansion joints, see figure
4. Accelerometers were attached to the axles and chassis of this vehicle in order to determine the dynamic wheel
load through a mass-spring-damper model. The vehicle model consists of two un sprung elements (front and rear
axle) and two sprung chassis parts (front and rear) connected with a rotational joint to allow chassis roll. The
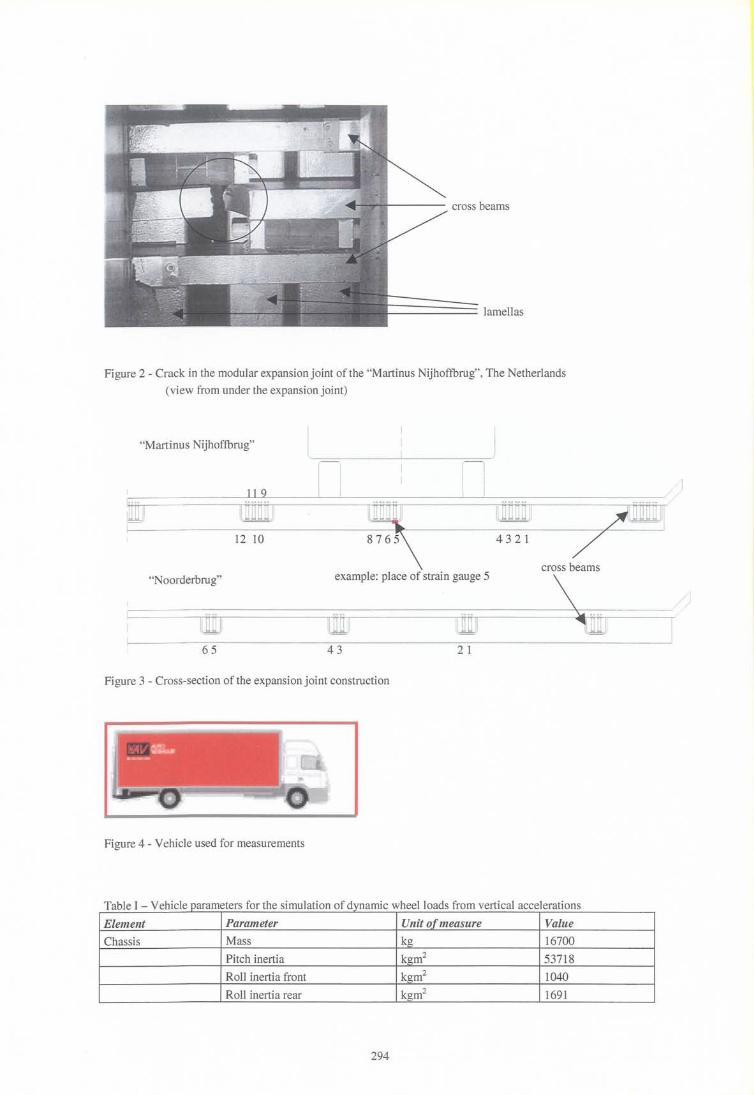
model parameters are listed in table I. The input for the model are the eight measured accelerometer signals. The
289

output are the four wheel loads. The lateral position of the test vehicle corresponded to the lateral posi tion of
passages of normal traffic. A variation in lateral position of approximately 100 mm occurred for low velocities.
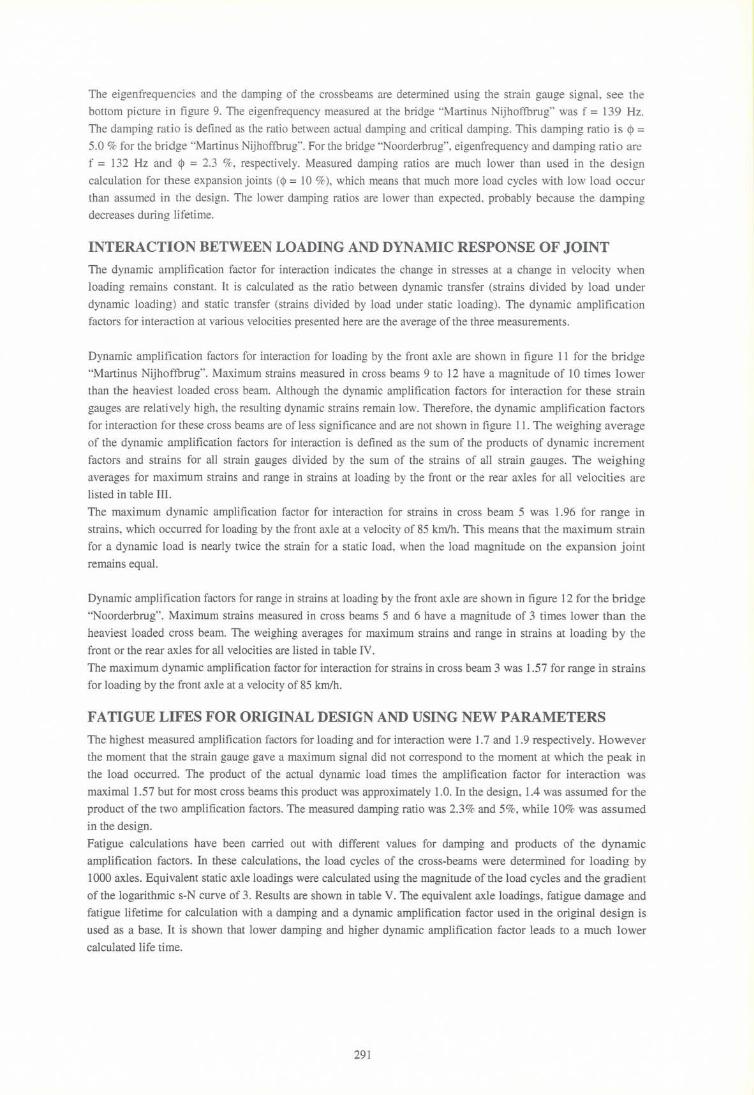
For the measurements, strain gauges were attached on the under-surface of the cross beams of the expansion joint,
see figure 3.
Measurements took place at a velocity of 5 kmlh to determine the static response, and at a velocity of 50, 70 and
85 kmlh to determine the dynamic response at various velocities. All measurements were repeated three times.
During the measurements, the bridges were closed for other traffic.
The dynamic amplification factors for an expansion joint is determined in two steps: first , strains in the expansion
joints are measured under a static loading. Strains divided by static loading result in the static transfer. Second,
strains are measured under dynamic loading. The dynamic transfer is calculated as the dynamic strains divided by
dynamic loading. The dynamic amplification factor for interaction is determined as dynamic transfer divided by
static transfer, The dynamic amplification factor for loading is determined as the dynamic peak load divided by the
static load.
DYNAMIC LOADING
Figure 5 shows accelerations measured at a velocity of 70 kmlh for the "Noorderbrug". The upper picture shows
accelerations at the axles while the lower picture shows accelerations at the chassis. The dynamic load is calculated
from these accelerations by using a model of a two-mass-spring system per quarter of the vehicle, see [1] . The
dynamic loads at the point where the vehicle crosses the expansion joint for the three measurements are shown in
figure 6. As for this velocity, the repeated measurements for all velocities showed an extremely good similarity.
The dynamic amplification factor for loading is defined as the maximum dynamic load effect divided by the static
load effect. The dynamic amplification factors for loading for various velocities for the vehicle used are shown in
table II. Dynamic amplification factors for the bridge "Martinus Nijhoffbrug" are larger than for the bridge
"Noorderbrug" . The unevenness and roughness of the pavement near the expansion joint have significant influence
on this dynamic amplification factor.
For calculation of the dynamic amplification factor for interaction, the load should be determined at the moment at
which a strain gauge signal is maximal. While a small difference in time exists between the maximum signals for
different strain gauges, the load differs for all strain gauges. Figure 7 shows the load for a measurement with
velocity 70 kmlh for the bridge "Noorderbrug". Dots indicate loads at the moment that a strain gauge signal was
maximal.
The loads at the moment that the signal of strain gauge 2 is maximal are given in figure 8. It is shown that the three
different measurements with the same velocity result in an almost equal load.
MEASURED STRAINS
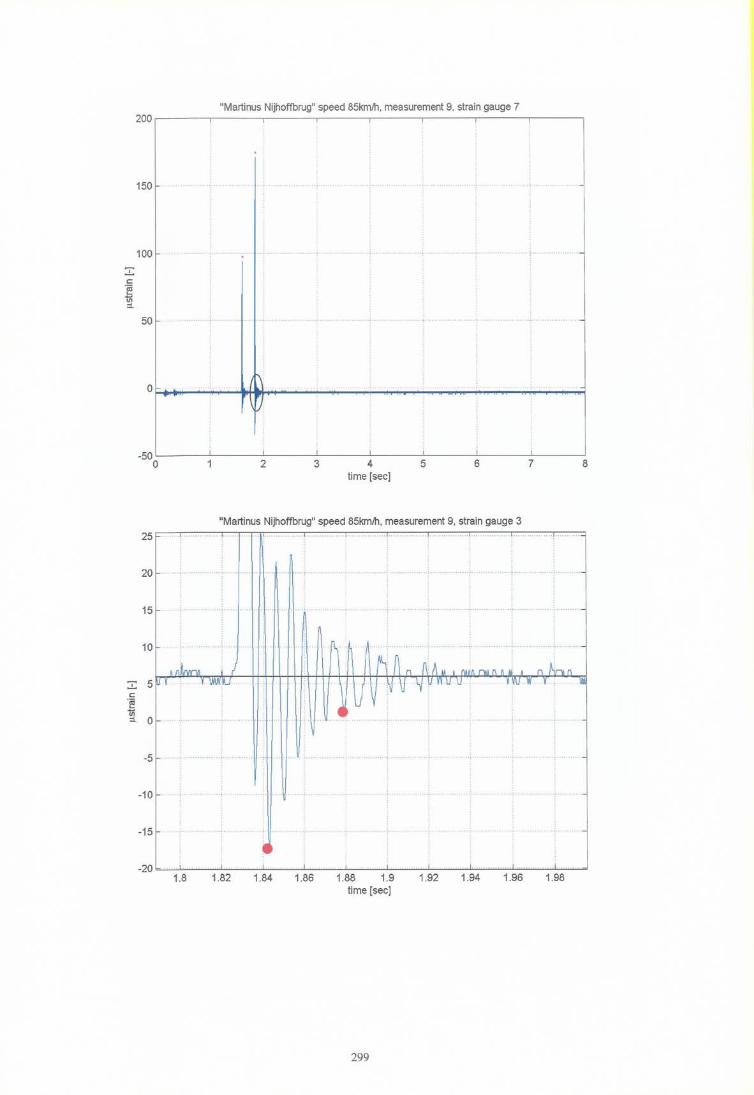
Figure 9 gives an example of the strains measured at the heaviest loaded crossbeam of the bridge "Martinus
Nijhoftbrug". The top picture shows results at a velocity of 5 kmlh, the middle picture at a velocity of 85 kmlh. For
every measurement, the maximum strain and the range in strain (difference between maximum and minimum
strain) are determined. Maximum strains for all measurements in the heaviest loaded crossbeam are shown in
figure 10. Strains measured in cross beams 1 to 8 (numbers are referred to figure 2) are of the same magnitude,
strains measured in cross beams 9 to 12 are a factor 5 to 10 lower. Figure 10 shows that the three different
measurements with the same velocity result in an almost equal strain. In this figure, strains decrease for increasing
velocity. However, this was not found for all cross beams.
At the bridge "Noorderbrug", strains vary slightly for the different measurements at low velocities. This is caused
by a small change in lateral position of the vehicle, due to which some cross beams are loaded slightly heavier and
others slightly lighter; the average strains measured at all cross beams show no significant difference between the
measurements.
290
The eigenfrequencies and the damping of the crossbeams are determined using the strain gauge signal, see the
bottom picture in figure 9. The eigenfrequency measured at the bridge "Martinus Nijhoffbrug" was f = 139 Hz.
The damping ratio is defined as the ratio between actual damping and critical damping. This damping ratio is <p = 5.0 % for the bridge "Martinus Nijhoffbrug". For the bridge "Noorderbrug", eigenfrequency and damping ratio are
f = 132 Hz and <p = 2.3 %, respectively. Measured damping ratios are much lower than used in the design
calculation for these expansion joints (<j) = 10 %), which means that much more load cycles with low load occur
than assumed in the design. The lower damping ratios are lower than expected, probably because the damping
decreases during lifetime.
INTERACTION BETWEEN LOADING AND DYNAMIC RESPONSE OF JOINT
The dynamic amplification factor for interaction indicates the change in stresses at a change in velocity when
loading remains constant. It is calculated as the ratio between dynamic transfer (strains divided by load under
dynamic loading) and static transfer (strains divided by load under static loading). The dynamic amplification
factors for interaction at various velocities presented here are the average of the three measurements.
Dynamic amplification factors for interaction for loading by the front axle are shown in figure 11 for the bridge
"Martinus Nijhoffbrug". Maximum strains measured in cross beams 9 to 12 have a magnitude of 10 times lower
than the heaviest loaded cross beam. Although the dynamic amplification factors for interaction for these strain
gauges are relatively high, the resulting dynamic strains remain Iow. Therefore, the dynamic amplification factors
for interaction for these cross beams are of less significance and are not shown in figure 11. The weighing average
of the dynamic amplification factors for interaction is defined as the sum of the products of dynamic increment
factors and strains for all strain gauges divided by the sum of the strains of all strain gauges. The weighing
averages for maximum strains and range in strains at loading by the front or the rear axles for all velocities are
listed in table Ill.
The maximum dynamic amplification factor for interaction for strains in cross beam 5 was 1.96 for range in
strains, which occurred for loading by the front axle at a velocity of 85 km/h. This means that the maximum strain
for a dynamic load is nearly twice the strain for a static load, when the load magnitude on the expansion joint
remains equal.
Dynamic amplification factors for range in strains at loading by the front axle are shown in figure 12 for the bridge
"Noorderbrug". Maximum strains measured in cross beams 5 and 6 have a magnitude of 3 times lower than the
heaviest loaded cross beam. The weighing averages for maximum strains and range in strains at loading by the
front or the rear axles for all velocities are listed in table IV.
The maximum dynamic amplification factor for interaction for strains in cross beam 3 was 1.57 for range in strains
for loading by the front axle at a velocity of 85 km/h.
FATIGUE LIFES FOR ORIGINAL DESIGN AND USING NEW PARAMETERS
The highest measured amplification factors for loading and for interaction were 1.7 and 1.9 respectively. However
the moment that the strain gauge gave a maximum signal did not correspond to the moment at which the peak in
the load occurred. The product of the actual dynamic load times the amplification factor for interaction was
maximal 1.57 but for most cross beams this product was approximately 1.0. In the design, 1.4 was assumed for the
product of the two amplification factors . The measured damping ratio was 2.3% and 5%, while 10% was assumed
in the design.
Fatigue calculations have been carried out with different values for damping and products of the dynamic
amplification factors . In these calculations, the load cycles of the cross-beams were determined for loading by
1000 axles. Equivalent static axle loadings were calculated using the magnitude of the load cycles and the gradient
of the logarithmic s-N curve of 3. Results are shown in table V. The equivalent axle loadings, fatigue damage and
fatigue lifetime for calculation with a damping and a dynamic amplification factor used in the original design is
used as a base. It is shown that lower damping and higher dynamic amplification factor leads to a much lower
calculated life time.
291
CONCLUSIONS AND RECOMMENDATIONS
With the measurements carried out, a good insight has been obtained in dynamic impact loads on the road near
expansion joints in bridges and dynamic responses in the construction of modular expansion joints.
All measurements at a specific velocity were repeated three times. Both strain gauge signals and dynamic loads
showed extremely good similarity between these three measurements , indicating that the followed measuring
procedure is a reliable method for obtaining information on dynamic amplification factors for traffic loading and
dynamic amplification factors for interaction between time history loading and dynamic response of the cross
beams in expansion joints. Dynamic amplification factors for loading and for interaction vary widely for different
velocities and different cross beams. The highest measured dynamic amplification factors for loading and for
interaction were 1.7 and 1.9, respectively. The highest difference in measured strains between static loading and
dynamic loading was xx, while 1.4 was assumed in the design. The measured damping ratio were 2.3% and 1.5%,
while 10% was assumed in the design.
The dynamic amplification factors for loading and for interaction and the damping play a large role in the fatigue
life of the expansion joints. A higher occurring dynamic amplification factor 0.8 instead of 1.4) leads to higher
amplitudes in the response functions and result in a calculated fatigue life that is half the originally determined
fatigue life of the structure. A lower occurring damping ratio (2.5% instead of 10%) leads to more load cycles and
a higher dynamic amplification factor for interaction and results in a calculated fatigue life that is 40% of the
originally determined fatigue life of the structure. A combination of higher occurring dynamic amplification factor
and lower damping leads to a calculated fatigue life that is 20% of the originally determined fatigue life of the
structure.
The dynamic loading is a combination of axle load and dynamic effects. Different vehicles with different axle
loads may cause other dynamic amplification factors. The realistic dynamic amplification factor is defined as the
maximum probabilistic dynamic load divided by the maximum probabilistic static load. For the maximum
probabilistic static load, reference is made to the paper [2]. It is recommended to carry out measurements with
other vehicles to obtain a complete range of dynamic amplification factors for realistic traffic, with which it is
possible to obtain a maximum probabilistic dynamic load.
The dynamic increment factor depends on the geometry of the expansion joint and on dynamic loading. It is
recommended to carry out measurements on other bridges to obtain a complete range of appearing dynamic
increment factors.
In designs , it is recommended to take into account the actual dynamic interaction between loading and response. A
damping ratio of 10% is not appropriate for life time calculations, because the damping decreases during lifetime.
Although only based on these two measurements carried out, the assumed dynamic amplification factor for loading
in Eurocode 3 of 1.3 seems to be too low.
1. 1. Maljaars, P.H. Waarts, R.B.I. Hoogvelt, Metingen aan de voegovergangen bij de brug bij Zaltbommel
en Grubbenvorst, TNO report 2002-CI-Rl 054,2002.
2. A.C.W.M. Vrouwenvelder, P.H. Waarts, Traffic loads on bridges, Structural Engineering International,
IABSE, August 1993.
292

TABLES & FIGURES
Side view
Top view of the modular expansion joint
lamellas
direc:::s beams) of traffic
/
/
Figure - Modular expansion joint in the bridge "Martinus Nijhoftbrug", The Netherlands
293
cross beams
------- lamellas
Figure 2 - Crack in the modular expansion joint of the "Martinus Nijhoffbrug", The Netherlands
(view from under the expansion joint)
"Martinus Nijhoffbrug"
119 n I_J
12 10 4321 7 cross beams
"N oorderbrug" example: place of strain gauge 5
\ 65 43 2 1
Figure 3 - Cross-section of the expansion joint construction
Figure 4 - Vehicle used for measurements
Ta bl I V h' I t h I . e - e IC e parameters or t e Slmu atlOn 0 fd h 11 d f . I Iynanuc w ee oa s rom vertlca acce eratlOns
Element Parameter Unit of measure Value
Chassis Mass kg 16700
Pitch inertia kgm2 53718
Roll inertia front kgm2 1040
Roll inertia rear kgm2 1691
294
/!M [
/ J

Distance CG to front axle m 3.46 Distance CG to rear axle m 2.13
Front axle Mass kg 650 Pitch inertia kgm2 540 Track width m 2.02
Rear axle Mass kg 1125 Pitch inertia kgm2 634 Track width m 1.85
Accelerations measurement gr701 f. mat 60r----,-----,----,-----,-----,---~-----,----~====r===~
(\J~
~ 40 .s (fl
~ 20 ctI c o ~ 0 ID ID ~ -20 «
- front left - front right - rear left - rear right
_40L-----~----~~----~----~------~-----L------L-----~------L-----~
10.4 10.6 10.8 11 11.2 11.4 11.6 11.8 12 12.2 12.4 Time[s]
6~---,----r---,----,----,----,----,----,~==~==~
(\J~
~ 4 .s (fl
·00 )@ 2
.J:: (J
c :8 0 ~ Cl
~ -2 (J
« _4L------L----~------~----~------~-----L------L------L------L-----~
10.4 10.6 10.8 11 11 .2 11.4 11.6 11.8 12 12.2 12.4 Time[s]
Figure 5 - Accelerations at the "Noorderbrug" at 70 kmlh
295

Comparison gr701, gr702 and gr703 X 104
14 .-----,------,-----,,-----.------.-----,------,-----.------,-----.
13
~11 "0 C tU
:g-10
~ N ~ 9 "0 tU .Q ID
~ 8
6
Fz1: 701 - Fz1:702 - Fz1:703 - Fz2: 701 - Fz2:702 - Fz2: 703
5 L-----~-----L----~ ______ ~ ____ _L ____ ~ ______ L_ ____ _L ____ ~ ____ ~
o 0.2 0.4 0.6 0.8 1 Time[s]
1.2 1.4 1.6 1.8 2
Table II D f - 'ynamlc ampl! !catIon actors
velocity dynamic ampl factor dynamic ampl factor
"Martinus Nijhoff' "N oorderbrug"
50 kmlh 1.5 1.1
70 kmlh 1.6 1.2
85 kmlh 1.7 1.4
296

"Noorderbrug" velocity 70 kmlh measurement 1
13
12
11 Z ;10
~ 9
8
7 k'~~" "" " '\:" "-/""'"
11.2
150
:::!:100 c .~
U; :i 50
11 .2
11 .3 11.4
11.3 11.4
11.5 time [sec]
11 .5 time [sec]
11.6
11.6
Figure 7 - Loads at maximum strains at a velocity of 70 km/h, "Noorderbrug"
Translation of text:
snelheid - velocity
belasting - load
rear axle load, strain gauge 2
160 I
140 ~
120 r'
- 100 ~ z :. 80 "D co 0 60
I
40
20
I 0 I I I
0 20 40 60 80
velocity (km/h)
Figure 8 - Loads at maximum strains at strain gauge 2, "Noorderbrug"
297
11.7
11.7
11.8
11 .8
• measurement 1
• measurement 2
measurement 3
I
100

"Martinus Nijhoffbrug" speed 5kmJh, measurement 1, strain gauge 7 250 ~------.-----~~----~------~------~------~------~------~
200
150
c "(ij 100
lo.-
U) :i
50
-50 L-------~------~------~------~------~------~-------L------~
o 2 3 4 time [sec]
298
5 6 7 8
"Martinus Nijhoffbrug" speed 85kmlh, measurement 9, strain gauge 7 200~------.-----~-------.------~------.-------,-------,------,
150
100 I
c: .~
U; :::i.
50
-50L-------~------~------~------~------~------~--------~----~ o 2 3 456 7 8
time [sec]
"Martinus Nijhoffbrug" speed 85kmlh, measurement 9, strain gauge 3
25
20
15
10
..l... 5 c: .~
U; :::i. 0
-51-- · .. ····,·················;···········
-10
-15
1.8 1.82 1.84 1.86 1.88 1.9 1.92 1.94 1.96 1.98 time [sec]
299

Figure 9 - Strain measured at cross beam 7, "Martinus Nijhoffbrug"
250
200
-I
150 -c: ca ~ - 100 U'J ::t
50
0
max signal strain gauge 7, loaded by rear axle
• measurement 1 I
-l------------~"_.----------- • measurement 2
~ measurement 3 • -~
•
0 20 40 60 80 100
velocity (km/h)
Figure 10 - Maximum strains at various velocities, cross beam 7, "Martinus Nijhoffbrug"
range in strains for loading by front axle
2.00 I
~ • strain gauge 1 0 - • strain gauge 2 0
1.50 ca -- • strain gauge 3 I c: Cl) • E x strain gauge 4 I Cl)
1.00 ! ~ t ~ strain gauge 5 0 c: • x 0 ~ • strain gauge 6 E + strain gauge 7 ca 0.50 c: >- - strain gauge 8
"'C
0.00 I
40 50 60 70 80 90
velocity (km/h)
Figure 11 - Dynamic increment factors for range in strains at the "Martinus Nijhoffbrug"
300

Table In -Weighi ng avera~ e of dynamic increment factors, "Martinus Niihoftbrug"
50 kmlh 70 kmlh 85 kmlh
Maximum, front axle 0.71 0.80 1.01
Range, front axle 0.77 0.94 1.38
Maximum, rear axle 0.68 0.64 0.56
Range, rear axle 0.73 0.76 0.78
range in strains for loading by front axle
1.80 ~ 1.60 0 -0 1.40 ca - x • strain gauge 1 - 1.20 s:::: Cl>
• • strain gauge 2 • • • E 1.00 Cl> ~
0 0.80 s::::
0 0.60
i ~ strain gauge 3
• )t(
i x strain gauge 4
• )t( strain gauge 5 E 0.40 ca • strain gauge 6 s:::: >- 0.20 "C
0.00
40 50 60 70 80 90
velocity (km/h)
Figure 12 - Dynamic increment factors for range in strains at the "Noorderbrug"
f Table IV - Weighing avera eo dynamic increment factors, "Noorderbrug"
50 kmlh 70 kmlh 85 kmlh
Maximum, front axle 0.93 0.92 1.02
Range, front axle 1.00 1.00 1.12
Maximum, rear axle 1.00 0.94 0.91
Range, rear axle 1.08 1.04 1.03
Tab e V - Equiva ent a e oa san atlgue xl I d df' e actors or varIatIOn m liD f . d ampmg an dd ynarruc amph IcatlOn f actors
Damping Dynamic Equivalent cycles Equivalent damage Fatigue life factor
amplification factors
Damping 10% DAF = 1.8 2186 1.9 0.53
DAF= 1.4 1145 1.0 1.0
DAF = 1.0 631 0.6 1.7
Damping 2.5% DAF = 1.8 5812 5.1 0.2
DAF= 1.4 3005 2.6 0.4
DAF = 1.0 948 0.8 1.3
301

302