Dynamic evaluation of autofocusing for automated ...amnl.mie.utoronto.ca/data/J25.pdf · Dynamic...
9
Journal of Microscopy, Vol. 227, Pt 1 2007, pp. 15–23 Received 6 July 2006; accepted 31 January 2007 Dynamic evaluation of autofocusing for automated microscopic analysis of blood smear and pap smear X. Y. LIU, W. H. WANG & Y. SUN Advanced Micro and Nanosystems Laboratory, University of Toronto, 5 King’s College Road, Toronto M5S 3G8, Canada Key words. Autofocusing, automated microscopic diagnosis, blood smear, dynamic evaluation, Fibonacci search, microscopy, pap smear. Summary Autofocusing is a fundamental procedure towards automated microscopic evaluation of blood smear and pap smear samples for clinical diagnosis. This paper presents comparison results of 16 selected focus algorithms based on 8000 static bright- field images and 1600 dynamic autofocusing trials using 10 blood smear and pap smear samples. Besides static behaviour, dynamic autofocusing performance is introduced for ranking the 16 focus algorithms. The Fibonacci search algorithm is employed for controlling the z-motor of the microscope to reach the focus position that is determined by focus objective functions. Experimental results demonstrate that the variance algorithm provides the best overall performance. Together with our previously reported findings, it is demonstrated that the variance algorithm or the normalized variance algorithm is the optimal focus algorithm for non-fluorescence microscopy applications including pap smear and blood smear imaging. Introduction Manual microscopic examination of hundreds or thousands of blood smear and pap smear samples is routinely performed by cytotechnologists and pathologists in clinical and hospital laboratory environments. Pap smear, which is a sample with cervical cells on a glass slide, is the most important diagnostic technique for detecting pre-invasive cervical cancer. Peripheral blood smear provides information on the number and shape of blood cells for detecting blood-related diseases, such as anaemia and leukaemia. Advances have been made to make smear interpretation more descriptive, paving the foundation to the realization of automated computer-assisted microscopic diagnosis (Simon et al., 1986; Angulo & Flandrin, 2003). Fully automated Correspondence to: Yu Sun. Tel: +1 416 946 0549; Fax: +1 416 978 7753; e-mail: [email protected] microscopic diagnosis is advantageous in that it will not only alleviate the tremendous workload from medical professionals (e.g. each pap smear contains roughly 50,000 to 300,000 cells) and result in greater efficiency; but more importantly, an automated microscopic diagnostic system will be capable of encompassing expert knowledge from diverse specialties within pathology to detect a multitude of diseases or a comprehensive disease pattern. Towards the realization of fully automated microscopic diagnosis of blood and pap smear, bringing a sample into focus or autofocusing is a fundamental procedure to perform. Although autofocusing is a long-standing research topic and many focus algorithms have been proposed, the selection of the optimal algorithm for specific experimental microscopy applications remains ad hoc. The autocorrelation algorithm (Vollath, 1987, 1988) was found to be the optimal focus algorithm for fluorescence microscopy applications (Santos et al., 1997). We previously demonstrated that the normalized variance algorithm provided the best performance for several types of non-fluorescence samples under bright field, phase contrast, and differential interference contrast (Sun et al., 2004). This paper focuses on the determination of the optimal focus algorithm for pap smear and blood smear bright-field imaging through a systematic evaluation of 16 commonly used focus algorithms that were applied to 10 blood smear and pap smear samples. Based on an evaluation methodology that examines the static performance of focus algorithms, we have recently demonstrated that the variance algorithm provides the best overall static performance for pap and blood smear (Liu et al., 2006). In order to evaluate the dynamic focusing performance of each algorithm, which is directly relevant to the implementation of automated microscopic diagnosis of blood and pap smear, the Fibonacci search algorithm was selected for controlling the z-directional motor (i.e. objective position) to reach the focus position that corresponds to the maximum value of the focus objective function. Besides the C 2007 The Authors Journal compilation C 2007 The Royal Microscopical Society
Transcript of Dynamic evaluation of autofocusing for automated ...amnl.mie.utoronto.ca/data/J25.pdf · Dynamic...

Journal of Microscopy, Vol. 227, Pt 1 2007, pp. 15–23
Received 6 July 2006; accepted 31 January 2007
Dynamic evaluation of autofocusing for automated microscopicanalysis of blood smear and pap smear
X . Y. L I U , W. H . WA N G & Y. S U NAdvanced Micro and Nanosystems Laboratory, University of Toronto, 5 King’s College Road, TorontoM5S 3G8, Canada
Key words. Autofocusing, automated microscopic diagnosis, blood smear,dynamic evaluation, Fibonacci search, microscopy, pap smear.
Summary
Autofocusing is a fundamental procedure towards automatedmicroscopic evaluation of blood smear and pap smear samplesfor clinical diagnosis. This paper presents comparison resultsof 16 selected focus algorithms based on 8000 static bright-field images and 1600 dynamic autofocusing trials using 10blood smear and pap smear samples. Besides static behaviour,dynamic autofocusing performance is introduced for rankingthe 16 focus algorithms. The Fibonacci search algorithm isemployed for controlling the z-motor of the microscope toreach the focus position that is determined by focus objectivefunctions. Experimental results demonstrate that the variancealgorithm provides the best overall performance. Together withour previously reported findings, it is demonstrated that thevariance algorithm or the normalized variance algorithm isthe optimal focus algorithm for non-fluorescence microscopyapplications including pap smear and blood smear imaging.
Introduction
Manual microscopic examination of hundreds or thousandsof blood smear and pap smear samples is routinely performedby cytotechnologists and pathologists in clinical and hospitallaboratory environments. Pap smear, which is a sample withcervical cells on a glass slide, is the most important diagnostictechnique for detecting pre-invasive cervical cancer. Peripheralblood smear provides information on the number and shapeof blood cells for detecting blood-related diseases, such asanaemia and leukaemia.
Advances have been made to make smear interpretationmore descriptive, paving the foundation to the realization ofautomated computer-assisted microscopic diagnosis (Simonet al., 1986; Angulo & Flandrin, 2003). Fully automated
Correspondence to: Yu Sun. Tel: +1 416 946 0549; Fax: +1 416 978 7753; e-mail:
microscopic diagnosis is advantageous in that it will not onlyalleviate the tremendous workload from medical professionals(e.g. each pap smear contains roughly 50,000 to 300,000cells) and result in greater efficiency; but more importantly,an automated microscopic diagnostic system will be capableof encompassing expert knowledge from diverse specialtieswithin pathology to detect a multitude of diseases or acomprehensive disease pattern. Towards the realization of fullyautomated microscopic diagnosis of blood and pap smear,bringing a sample into focus or autofocusing is a fundamentalprocedure to perform.
Although autofocusing is a long-standing research topicand many focus algorithms have been proposed, the selectionof the optimal algorithm for specific experimental microscopyapplications remains ad hoc. The autocorrelation algorithm(Vollath, 1987, 1988) was found to be the optimal focusalgorithm for fluorescence microscopy applications (Santoset al., 1997). We previously demonstrated that the normalizedvariance algorithm provided the best performance for severaltypes of non-fluorescence samples under bright field, phasecontrast, and differential interference contrast (Sun et al.,2004).
This paper focuses on the determination of the optimalfocus algorithm for pap smear and blood smear bright-fieldimaging through a systematic evaluation of 16 commonlyused focus algorithms that were applied to 10 blood smear andpap smear samples. Based on an evaluation methodology thatexamines the static performance of focus algorithms, we haverecently demonstrated that the variance algorithm providesthe best overall static performance for pap and blood smear(Liu et al., 2006). In order to evaluate the dynamic focusingperformance of each algorithm, which is directly relevant tothe implementation of automated microscopic diagnosis ofblood and pap smear, the Fibonacci search algorithm wasselected for controlling the z-directional motor (i.e. objectiveposition) to reach the focus position that corresponds tothe maximum value of the focus objective function. Besides the
C© 2007 The AuthorsJournal compilation C© 2007 The Royal Microscopical Society

1 6 X . Y. L I U, W. H . WA N G A N D Y. S U N
five ranking criteria for static evaluation (Sun et al., 2004; Liuet al., 2006), two new criteria (dynamic accuracy and dynamicrepeatability) are introduced for dynamically evaluating theselected focus algorithms.
Materials and method
As shown in Fig. 1, 10 samples (five blood smears andfive pap smears) were experimentally tested in this study.These representative samples were selected as they includea variety of information. The five blood smear sampleswere prepared in the Princess Margaret Hospital (Toronto,Canada), and the five pap smear samples were prepared inthe Sunnybrook Health Sciences Centre and Women’s CollegeHospital (Toronto, Canada). The thickness is 15–20 μm forthe blood smear samples and 10–15 μm for the pap smearsamples.
Figure 2 shows the experimental setup that consists ofa motorized inverted microscope (Olympus IX81), a CMOSdigital camera (Basler A601f) and a host computer (3.2 GHzCPU with 1.0 GB RAM) for image processing and motioncontrol. The minimum vertical motion step of the microscopeis 0.01 μm. The camera has a pixel size of 9.9 × 9.9 μm.An objective (Olympus LUCPlanFLN, 1.9 μm depth of field,NA 0.6 and 0.5μm resolution) and the bright-field observationmethod were used. The total magnification of the observationsystem (objective, coupler and camera) is 40×. Multiplyingthis 40× magnification with the resolution of the objective(0.5 μm), one can confirm that the pixel size of the camera(9.9 μm) satisfies the Nyquist theorem. Thus, no frequencyaliasing in image acquisition occurred.
For static evaluation, 10 image sets corresponding to the10 samples were collected with a step of 0.25 μm. Each setcontains 800 images (640 × 480), amounting to a total of8000 still images that were processed using the 16 focusalgorithms presented in the Focus Algorithms section. Besidesstatic evaluation, the z-motor of the microscope was controlledin real time for studying the dynamic behaviour of the 16algorithms. For each sample, 10 dynamic autofocusing trials
Fig. 2. System setup for investigating autofocusing of blood smear and papsmear samples.
were conducted for each focus algorithm, amounting to 1600dynamic autofocusing trials.
Focus algorithms
A common rationale of focus algorithms is that focusedimages contain more information and details (e.g. edges)than unfocused images, based on which an objective functionindicating the sharpness of images is used to evaluate thedegree of focusing. The focus position is obtained when theobjective function reaches its extremum. In this study, 16 focusalgorithms that are most commonly used in the literature werecompared to determine the optimal focus algorithm for papsmear and blood smear bright-field imaging. These algorithmsare classified into four groups (Sun et al., 2004). In order tomake the paper self-contained and facilitate the discussion ofresults presented in the Experimental Results and Discussionsection, the focus algorithms are briefly summarized asfollows.
Derivative-based algorithms
Thresholded absolute gradient (Santos et al., 1997). The absolutevalue of first derivative is accumulated when it is larger than a
Fig. 1. Bright-field images of five blood smear samples (top) and five pap smear samples (bottom).
C© 2007 The AuthorsJournal compilation C© 2007 The Royal Microscopical Society, Journal of Microscopy, 227, 15–23

DY NA M I C E VA L UAT I O N O F AU T O F O C U S I N G F O R AU T O M AT E D M I C RO S C O P I C A NA LYS I S 1 7
pre-defined threshold v :
fthre grad =∑
height
∑width
|i (x + 1, y) − i (x, y)|, (1)
where i(x, y) is the grey level intensity of pixel (x, y), and|i (x + 1, y) − i (x, y)| ≥ v.
Squared gradient (Santos et al., 1997).
fsqua grad =∑
height
∑width
(i (x + 1, y) − i (x, y))2 , (2)
where (i (x + 1, y) − i (x, y))2 ≥ v.
Brenner gradient (Brenner et al., 1971).
fBrenner =∑
height
∑width
(i (x + 2, y) − i (x, y))2, (3)
where (i (x + 2, y) − i (x, y))2 ≥ v.
Tenenbaum gradient (Krotkov, 1987; Yeo et al., 1993).
fTenengrad =∑
height
∑width
(Sx(x, y)2 + Sy(x, y)2)
, (4)
where Sx(x, y) and Sy(x, y) are the convoluted images withSobel operators.
Energy Laplace (Subbarao et al., 1993). The second derivativeC(x, y) is computed by convolving an image with theconvolution mask:
L =
⎡⎢⎣
−1 −4 −1
−4 20 −4
−1 −4 −1
⎤⎥⎦
and the objective function is
fenergy Laplace =∑
height
∑width
C (x, y)2. (5)
Sum of modified Laplace (Nayar & Nakagawa, 1994).
fSML =∑
height
∑width
(|L x(x, y)| + ∣∣L y(x, y)∣∣) , (6)
where L (x, y) are convoluted images with Laplacian operators.
Sum of squared Gaussian derivatives (Geusebroek et al., 2000).
fsum Gaus deri = 1MN
∑height
∑width
(G x(σ )2 + G y(σ )2)
, (7)
where Gx(σ ) and Gy(σ ) are first-order Gaussian derivatives inhorizontal/vertical directions. The scale can be determined byσ = d/2
√3, where d is dimension of the smallest feature.
Statistical algorithms
Variance (Groen et al., 1985; Yeo et al., 1993).
fvariance = 1H · W
∑height
∑width
(i (x, y) − i
)2, (8)
where i is the mean intensity of the image, and H and W areimage height and width.
Normalized variance (Groen et al., 1985; Yeo et al., 1993).
fnorm vari = 1
H · W · i
∑height
∑width
(i (x, y) − i
)2. (9)
Autocorrelation (Vollath, 1987; 1988).
fauto corr =∑
height
∑width
i (x, y) · i (x + 1, y)
−∑
height
∑width
i (x, y) · i (x + 2, y). (10)
Standard deviation-based correlation (Vollath, 1987, 1988).
fstddev corr =∑
height
∑width
i (x, y) · i (x + 1, y) − H · W · i 2.
(11)
Histogram-based algorithms
Range algorithm (Firestone et al., 1991). Denote the number ofpixels with intensity i by h(i), the objective function is
frange = max{i | h (i ) > 0} − min{i | h(i ) > 0} (12)
Entropy algorithm (Firestone et al., 1991).
fentropy = −∑
i
pi · log2( pi ), (13)
where pi = h(i )/H · W.
Intuitive algorithms
Thresholded content (Mehdelsohn & Mayall, 1972; Groenet al., 1985). Objective function of this algorithm is the sum ofintensities above a certain threshold.
fthre cont =∑
height
∑width
i (x, y), (14)
where i (x, y) ≥ v.
Thresholded pixel count (Groen et al., 1985).
fpixel count =∑
height
∑width
c (i (x, y), v) , (15)
where
c (i (x, y), v) ={
1, i (x, y) ≤ v
0, else
Image power (Santos et al., 1997).
fpower =∑
height
∑width
i (x, y)2, (16)
where i (x, y) ≥ v.
C© 2007 The AuthorsJournal compilation C© 2007 The Royal Microscopical Society, Journal of Microscopy, 227, 15–23

1 8 X . Y. L I U, W. H . WA N G A N D Y. S U N
Dynamic search of objective function extremum
To search for the focus position of a sample, themaximum/minimum (i.e. extremum) value of the focusobjective function must be precisely located. In this study, theFibonacci search algorithm (Beveridge & Schechter, 1970) wasselected for conducting the extremum search of the objectivefunction. Under the unimodality assumption of the objectivefunction, the Fibonacci search algorithm has been proven tobe the optimal algorithm for search problems (Kiefer, 1953;Johnson, 1956) and requires the least number of computationsof objective functions for autofocusing applications (Krotkov,1987; Yeo et al., 1993).
Fibonacci sequence consists of a series of Fibonacci numbersFn, which is constructed with the recursive equation Fn =Fn−1 + Fn−2 (n > 1) and the boundary condition F0 =F1 = 1. In Fibonacci search, the length of the initial searchspace is taken as a Fibonacci number. The search space issubdivided according to the Fibonacci sequence. When thelength of the initial search space is not a Fibonacci number,the smallest Fibonacci number greater than the length ofthe initial search space is used to subdivide the search spaceproportionally.
The algorithm flow is described in Fig. 3 where all focusobjective functions are assumed to have peaks with globalmaxima. The objective functions with global minima will beinverted. In Fig. 3, the search space is denoted by [ak, bk], wherek is the iterative search index; N is the least index of Fibonaccisequence such that FN ≥ b1 − a1; f is the focus objectivefunction; x1
k and x2k are the search positions to which the z-
motor should be moved and where images should be acquiredto compute the objective functions. One can see from Fig. 3that only one computation of the objective function is requiredfor all search iterations except the first iteration. As will bediscussed in the Experimental Results and Discussion section,the computation time of all the 16 focus algorithms is within30 ms, and only 16 computations of focus objective functionswere required throughout the autofocusing processes. Thus,the dynamic focusing time is mainly determined by the physicalrun time of the z-motor to move from its initial position to thefinal focus position.
Ranking methodology
A new ranking methodology is used for dynamically andstatically evaluating the selected 16 focus algorithms onpap and blood smear samples. The first two criteria (i.e.dynamic accuracy and dynamic repeatability) assess thedynamic performance of a focus algorithm and the dynamicfocusing system. The other five criteria previously used bySun et al. (2004) and Liu et al. (2006) comprehensivelyevaluate the static performance of focus algorithms. In orderto quantitatively compare the 16 focus algorithms, all focuscurves were normalized, and the curves with global minimuminverted.
Fig. 3. Fibonacci search algorithm.
Dynamic accuracy
Previous research (Santos et al., 1997; Sun et al., 2004; Liuet al., 2006) studied the static accuracy of an objective functioncurve to describe the accuracy of the focus algorithm. However,dynamic search accuracy was not investigated; therefore,the focusing accuracy of the complete dynamic system wasnot represented. Considering the dynamic Fibonacci searcherror, the dynamic accuracy criterion proposed in this study isdefined as the distance between the real focus position, which ismanually determined by a proficient microscopy operator, andthe maximum position dynamically located by the Fibonaccisearch method. To minimize the effect of random errors, 10autofocusing trials were conducted for each pap and bloodsmear sample using each focus algorithm, and the averagedvalue represents the final dynamic accuracy.
Dynamic repeatability
This criterion assesses the repeatability of dynamicautofocusing, which is described by the standard deviation of
C© 2007 The AuthorsJournal compilation C© 2007 The Royal Microscopical Society, Journal of Microscopy, 227, 15–23

DY NA M I C E VA L UAT I O N O F AU T O F O C U S I N G F O R AU T O M AT E D M I C RO S C O P I C A NA LYS I S 1 9
the located focus positions of the 10 autofocusing trials. For anideal focus objective function, the Fibonacci search algorithmwould precisely locate the same maximum position everytime. In practice, the lower this measure is, the easier the samemaximum position can be reached in different autofocusingtrials.
Number of local maxima
Local maxima may trap the autofocusing algorithm andincrease the computational complexity. This criterionrepresents the number of local maxima in a focus curve. Theless this measure is, the easier and faster it is to reach the globalmaximum.
Range
This criterion measures the distance between twoneighbouring local minima around the global maximum.A larger range measure permits easier searching for themaximum of the focusing curve.
Noise level
This criterion describes the speed of the direction changes(second derivative of the focusing curve) between localmaxima. The sum of squared second derivatives except thevalue at the maximum is used to quantitatively representthis measure. A focus curve with a lower noise level preventsthe Fibonacci search from being trapped into an erroneoussearch range and therefore, guarantees the autofocusingaccuracy.
Width at 50% maximum
This criterion measures the width at 50% maximum of thefocus curve (Fig. 4). The smaller it is, the sharper the focus peakis, and the easier it is to locate the focus position accurately.
Fig. 4. Objective function curve of the focus algorithms.
Width at 20% maximum
The width at 20% maximum (Fig. 4) is employed to evaluate theperformance of focus algorithms, which is of great importancefor providing Fibonacci search with reliable cues of functionvalues in a wide range to precisely locate the global maximum(Groen et al., 1985).
Overall score
The ideal values for the above seven individual criteria (twodynamiccriteriaandfivestaticcriteria)aredescribedinTable1,in which the ideal values for the range and the 20% width criteriaare the total number of static images in each image set (800 inthis study for each image set). To evaluate a focus algorithm,the difference/distance between each criterion’s ideal valueand the value of the focus curve is calculated. An ideal focuscurve has criterion distance coordinates of [0, 0, 0, 0, 0, 0, 0].The lower a criterion distance, the better the performance of analgorithm under this criterion. In this study, all the individualcriterion distances are normalized in order to maintain equalweights for each criterion distance. The overall score is definedas the Euclidean distance of a focus curve to [0, 0, 0, 0, 0,0, 0].
Experimental results and discussion
In both dynamic and static evaluation, the 16 focus algorithmswere applied to full images (640 × 480) for computingfocus objective functions. The computation time of all the 16algorithms is within 30 ms. The selected threshold valuesfor algorithms (14), (15) and (16) are 150, 170 and 180,respectively, which were selected because the algorithmsprovided their best performance with these threshold values.It has been demonstrated that algorithms (1), (2) and (3) donot require thresholding (Sun et al., 2004). According to thedimension of the smallest sample feature, scale σ in algorithm(7) was set to be 1 pixel.
For dynamic evaluation, 10 experimental autofocusingtrials were conducted for each sample using each focusalgorithm (10 smear samples and 16 focus algorithms),amounting to 1600 dynamic autofocusing trials. The initialsearch space for Fibonacci search was set to be symmetricalaround the real focus position, and its length (i.e. b1 − a1)was set to be 800 steps with a step size of 0.25 μm. Thus,N = 15 and FN = 987. The speed of the z-motor was set at70 μm/s. Figure 5 shows two representative dynamic focusingcurves selected from the 1600 experimental trials. It canbe seen that the search range of Fibonacci search rapidlynarrowed and converged to the located focus position. Thetotal position changes and run time of the z-motor for allsearches that converged to the real focus position were fairlyclose. The focusing time of the 16 focus algorithms for bloodand pap smears is summarized in Table 2, in which every
C© 2007 The AuthorsJournal compilation C© 2007 The Royal Microscopical Society, Journal of Microscopy, 227, 15–23

2 0 X . Y. L I U, W. H . WA N G A N D Y. S U N
Table 1. Ideal values for individual ranking criteria.
Criteria Dynamic accuracy Dynamic repeatability No. of local max Range Noise level 50% width 20% width
Ideal value 0 0 0 800 0 0 800
0 1 2 3 4 5 60
25
50
75
100
125
150
175
200
time (sec)
posi
tion o
f -m
oto
r (
μ m)
init
ial
sear
ch r
ange
z
real focus position
Fig. 5. Two representative dynamic focusing curves of variance algorithm(8) using Fibonacci search.
entry is the average value of 50 dynamic focusing trials. Nosignificant differences were observed in focusing time amongfocus algorithms (5.24–5.71 s).
For static evaluation, a total of 8000 images collected fromthe 10 blood smear and pap smear samples (Fig. 1) at eachstep of 0.25 μm were processed using the 16 selected focusingalgorithms. According to individual criteria and the overallscore, the 16 algorithms were scored and ranked based onboth their dynamic performance and their static focus curvesof blood smear and pap smear. The evaluation results arelisted in Tables 3 and 4. Every entry in column no. 2 and 3represents the average value from 50 experimental trials foreach type of samples. Every entry in column no. 4 to columnno. 8 represents the average value from five focus curves.Smaller values in all columns of Tables 3 and 4 representbetter performance. The numbers in parentheses show theranking of a focus algorithm according to individual criteriondistances (column no. 2–8) or the overall score (columnno. 9).
From Tables 3 and 4, it can be seen that the variancealgorithm (8) provides the best overall performance for bothblood and pap smear samples, and that the normalizedvariance algorithm (9) provides almost optimal overallperformance for both types of samples. This finding is inagreement with our previous study on autofocusing of bloodand pap smear samples, in which only the static performanceof the focus algorithms was considered (Liu et al., 2006).Figure 6 shows the focus curves of the variance algorithm (8)on 10 image sets of blood and pap smear samples. One reasonthat explains the best overall performance of the algorithms(8) and (9) is that these statistical-based algorithms are less
Table 2. Dynamic focusing time of blood and pap smears.
Focusing time of Focusing time ofAlgorithm blood smears (s) pap smears (s)
ThreAbsGrad (1) 5.58 5.66SquaGrad (2) 5.62 5.71BrennerGrad (3) 5.49 5.48TeneGrad (4) 5.69 5.54EnergyLapl (5) 5.53 5.41SumModiLapl (6) 5.68 5.59SumGausDeri (7) 5.43 5.50Variance (8) 5.29 5.41NormVariance (9) 5.32 5.41AutoCorr (10) 5.54 5.50StanDeviCorr (11) 5.38 5.40Range (12) 5.47 5.34EntrAlgo (13) 5.49 5.53ThreCont (14) 5.68 5.56ThrePixeCont (15) 5.58 5.24ImagePower (16) 5.35 5.33
noise sensitive. The property of noise insensitivity enables thesealgorithms to produce the lowest number of local maxima, thebest range and the almost lowest noise level. The contributionsof these three individual criteria are clearly reflected in the bestoverall scores.
Together with our previously reported results (Sun et al.,2004; Liu et al., 2006), the variance or the normalized variancealgorithm has been demonstrated to provide the best overallperformance for non-fluorescence microscopy applicationsincluding pap smear and blood smear samples.
The dynamic accuracy includes the static accuracydetermined by the focus algorithm and the maximum searcherror generated by Fibonacci search. The static accuracy wascomputed and ranked in Table 5 (column no. 3 and 6), whichis described by the distance between the real focus positionand the maximum of the static focus curve. The Fibonaccisearch error is listed and ranked in column no. 4 and no. 7in Table 5, which is the absolute difference between dynamicaccuracy and static accuracy. It was found that an importantfactor influencing the Fibonacci search accuracy is the noiselevel (column no. 6 in Tables 3 and 4). Of the algorithms thatrank from 11th to 16th in terms of the Fibonacci search error(Table 5), four algorithms (5, 6, 10 and 12) have the highestnoise level for blood smear samples and five algorithms for papsmear samples (5, 6, 10, 12 and 15). A higher noise level in
C© 2007 The AuthorsJournal compilation C© 2007 The Royal Microscopical Society, Journal of Microscopy, 227, 15–23
DY NA M I C E VA L UAT I O N O F AU T O F O C U S I N G F O R AU T O M AT E D M I C RO S C O P I C A NA LYS I S 2 1
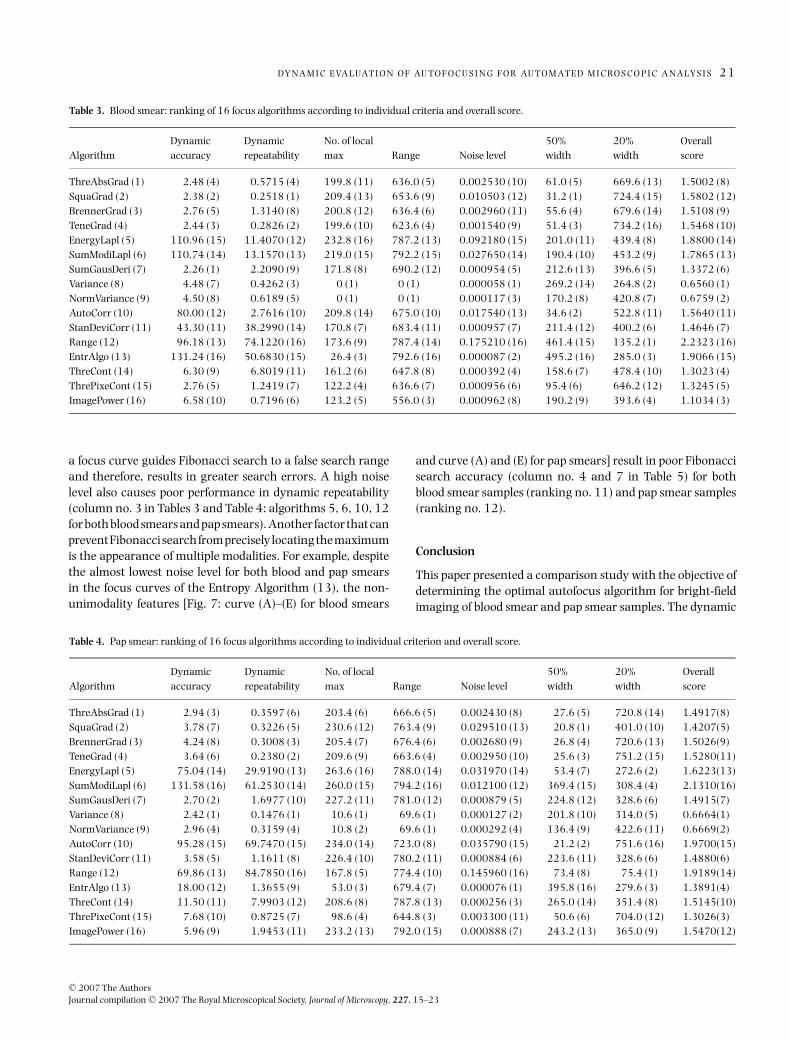
Table 3. Blood smear: ranking of 16 focus algorithms according to individual criteria and overall score.
Dynamic Dynamic No. of local 50% 20% OverallAlgorithm accuracy repeatability max Range Noise level width width score
ThreAbsGrad (1) 2.48 (4) 0.5715 (4) 199.8 (11) 636.0 (5) 0.002530 (10) 61.0 (5) 669.6 (13) 1.5002 (8)SquaGrad (2) 2.38 (2) 0.2518 (1) 209.4 (13) 653.6 (9) 0.010503 (12) 31.2 (1) 724.4 (15) 1.5802 (12)BrennerGrad (3) 2.76 (5) 1.3140 (8) 200.8 (12) 636.4 (6) 0.002960 (11) 55.6 (4) 679.6 (14) 1.5108 (9)TeneGrad (4) 2.44 (3) 0.2826 (2) 199.6 (10) 623.6 (4) 0.001540 (9) 51.4 (3) 734.2 (16) 1.5468 (10)EnergyLapl (5) 110.96 (15) 11.4070 (12) 232.8 (16) 787.2 (13) 0.092180 (15) 201.0 (11) 439.4 (8) 1.8800 (14)SumModiLapl (6) 110.74 (14) 13.1570 (13) 219.0 (15) 792.2 (15) 0.027650 (14) 190.4 (10) 453.2 (9) 1.7865 (13)SumGausDeri (7) 2.26 (1) 2.2090 (9) 171.8 (8) 690.2 (12) 0.000954 (5) 212.6 (13) 396.6 (5) 1.3372 (6)Variance (8) 4.48 (7) 0.4262 (3) 0 (1) 0 (1) 0.000058 (1) 269.2 (14) 264.8 (2) 0.6560 (1)NormVariance (9) 4.50 (8) 0.6189 (5) 0 (1) 0 (1) 0.000117 (3) 170.2 (8) 420.8 (7) 0.6759 (2)AutoCorr (10) 80.00 (12) 2.7616 (10) 209.8 (14) 675.0 (10) 0.017540 (13) 34.6 (2) 522.8 (11) 1.5640 (11)StanDeviCorr (11) 43.30 (11) 38.2990 (14) 170.8 (7) 683.4 (11) 0.000957 (7) 211.4 (12) 400.2 (6) 1.4646 (7)Range (12) 96.18 (13) 74.1220 (16) 173.6 (9) 787.4 (14) 0.175210 (16) 461.4 (15) 135.2 (1) 2.2323 (16)EntrAlgo (13) 131.24 (16) 50.6830 (15) 26.4 (3) 792.6 (16) 0.000087 (2) 495.2 (16) 285.0 (3) 1.9066 (15)ThreCont (14) 6.30 (9) 6.8019 (11) 161.2 (6) 647.8 (8) 0.000392 (4) 158.6 (7) 478.4 (10) 1.3023 (4)ThrePixeCont (15) 2.76 (5) 1.2419 (7) 122.2 (4) 636.6 (7) 0.000956 (6) 95.4 (6) 646.2 (12) 1.3245 (5)ImagePower (16) 6.58 (10) 0.7196 (6) 123.2 (5) 556.0 (3) 0.000962 (8) 190.2 (9) 393.6 (4) 1.1034 (3)
a focus curve guides Fibonacci search to a false search rangeand therefore, results in greater search errors. A high noiselevel also causes poor performance in dynamic repeatability(column no. 3 in Tables 3 and Table 4: algorithms 5, 6, 10, 12for both blood smears and pap smears). Another factor that canprevent Fibonacci search from precisely locating the maximumis the appearance of multiple modalities. For example, despitethe almost lowest noise level for both blood and pap smearsin the focus curves of the Entropy Algorithm (13), the non-unimodality features [Fig. 7: curve (A)–(E) for blood smears
and curve (A) and (E) for pap smears] result in poor Fibonaccisearch accuracy (column no. 4 and 7 in Table 5) for bothblood smear samples (ranking no. 11) and pap smear samples(ranking no. 12).
Conclusion
This paper presented a comparison study with the objective ofdetermining the optimal autofocus algorithm for bright-fieldimaging of blood smear and pap smear samples. The dynamic
Table 4. Pap smear: ranking of 16 focus algorithms according to individual criterion and overall score.
Dynamic Dynamic No. of local 50% 20% OverallAlgorithm accuracy repeatability max Range Noise level width width score
ThreAbsGrad (1) 2.94 (3) 0.3597 (6) 203.4 (6) 666.6 (5) 0.002430 (8) 27.6 (5) 720.8 (14) 1.4917(8)SquaGrad (2) 3.78 (7) 0.3226 (5) 230.6 (12) 763.4 (9) 0.029510 (13) 20.8 (1) 401.0 (10) 1.4207(5)BrennerGrad (3) 4.24 (8) 0.3008 (3) 205.4 (7) 676.4 (6) 0.002680 (9) 26.8 (4) 720.6 (13) 1.5026(9)TeneGrad (4) 3.64 (6) 0.2380 (2) 209.6 (9) 663.6 (4) 0.002950 (10) 25.6 (3) 751.2 (15) 1.5280(11)EnergyLapl (5) 75.04 (14) 29.9190 (13) 263.6 (16) 788.0 (14) 0.031970 (14) 53.4 (7) 272.6 (2) 1.6223(13)SumModiLapl (6) 131.58 (16) 61.2530 (14) 260.0 (15) 794.2 (16) 0.012100 (12) 369.4 (15) 308.4 (4) 2.1310(16)SumGausDeri (7) 2.70 (2) 1.6977 (10) 227.2 (11) 781.0 (12) 0.000879 (5) 224.8 (12) 328.6 (6) 1.4915(7)Variance (8) 2.42 (1) 0.1476 (1) 10.6 (1) 69.6 (1) 0.000127 (2) 201.8 (10) 314.0 (5) 0.6664(1)NormVariance (9) 2.96 (4) 0.3159 (4) 10.8 (2) 69.6 (1) 0.000292 (4) 136.4 (9) 422.6 (11) 0.6669(2)AutoCorr (10) 95.28 (15) 69.7470 (15) 234.0 (14) 723.0 (8) 0.035790 (15) 21.2 (2) 751.6 (16) 1.9700(15)StanDeviCorr (11) 3.58 (5) 1.1611 (8) 226.4 (10) 780.2 (11) 0.000884 (6) 223.6 (11) 328.6 (6) 1.4880(6)Range (12) 69.86 (13) 84.7850 (16) 167.8 (5) 774.4 (10) 0.145960 (16) 73.4 (8) 75.4 (1) 1.9189(14)EntrAlgo (13) 18.00 (12) 1.3655 (9) 53.0 (3) 679.4 (7) 0.000076 (1) 395.8 (16) 279.6 (3) 1.3891(4)ThreCont (14) 11.50 (11) 7.9903 (12) 208.6 (8) 787.8 (13) 0.000256 (3) 265.0 (14) 351.4 (8) 1.5145(10)ThrePixeCont (15) 7.68 (10) 0.8725 (7) 98.6 (4) 644.8 (3) 0.003300 (11) 50.6 (6) 704.0 (12) 1.3026(3)ImagePower (16) 5.96 (9) 1.9453 (11) 233.2 (13) 792.0 (15) 0.000888 (7) 243.2 (13) 365.0 (9) 1.5470(12)
C© 2007 The AuthorsJournal compilation C© 2007 The Royal Microscopical Society, Journal of Microscopy, 227, 15–23

2 2 X . Y. L I U, W. H . WA N G A N D Y. S U N
0 100 200 300 400 500 600 700 8000
0.2
0.4
0.6
0.8
1
Image Index
No
rmal
ized
Ob
ject
ive
Fu
nct
ion blood (A)
blood (B) blood (C) blood (D) blood (E)
real focus position
0 100 200 300 400 500 600 700 8000.2
0.4
0.6
0.8
1
Image Index
Norm
aliz
ed O
bje
ctiv
e F
unct
ion pap (A)
pap (B)pap (C)pap (D)pap (E)
real focus position
Fig. 6. Focus curves of variance algorithm (8) for 10 image sets of bloodsmears (top) and pap smears (bottom).
autofocusing performance of 16 selected focus algorithms was,for the first time, evaluated and ranked. Fibonacci searchwas introduced for implementing the dynamic maximumsearch of the focus objective functions. A ranking methodology
Table 5. Static accuracy and Fibonacci search error of the 16 focus algorithms for blood and pap smears.
Blood smear Pap smear
Dynamic Static Fibonacci Dynamic Static FibonacciAlgorithm accuracy accuracy search error accuracy accuracy search error
ThreAbsGrad (1) 2.48 (4) 3.0 (1) 0.52 (3) 2.94 (3) 4.0 (7) 1.06 (7)SquaGrad (2) 2.38 (2) 3.2 (5) 0.82 (7) 3.78 (7) 6.4 (12) 2.62 (9)BrennerGrad (3) 2.76 (5) 3.0 (1) 0.24 (1) 4.24 (8) 4.0 (7) 0.24 (2)TeneGrad (4) 2.44 (3) 3.0 (1) 0.56 (4) 3.64 (6) 4.2 (10) 0.56 (5)EnergyLapl (5) 110.96 (15) 15.6 (15) 95.36 (15) 75.04 (14) 8.6 (14) 66.44 (14)SumModiLapl (6) 110.74 (14) 10.8 (13) 99.94 (16) 131.58 (16) 7.0 (13) 124.58 (16)SumGausDeri (7) 2.26 (1) 6.2 (11) 3.94 (10) 2.70 (2) 2.2 (1) 0.5 (4)Variance (8) 4.48 (7) 3.8 (8) 0.68 (5) 2.42 (1) 2.6 (4) 0.18 (1)NormVariance (9) 4.50 (8) 3.4 (6) 1.10 (8) 2.96 (4) 2.6 (4) 0.36 (3)AutoCorr (10) 80.00 (12) 3.4 (6) 76.6 (13) 95.28 (15) 4.0 (7) 91.28 (15)StanDeviCorr (11) 43.30 (11) 6.2 (11) 37.10 (12) 3.58 (5) 2.2 (1) 1.38 (8)Range (12) 96.18 (13) 12.2 (14) 83.98 (14) 69.86 (13) 5.6 (11) 64.26 (13)EntrAlgo (13) 131.24 (16) 145.0 (16) 13.76 (11) 18 (12) 22.8 (16) 4.8 (12)ThreCont (14) 6.30 (9) 5.0 (9) 1.30 (9) 11.50 (11) 10.6 (15) 0.9 (6)ThrePixeCont (15) 2.76 (5) 3.0 (1) 0.24 (1) 7.68 (10) 3.2 (6) 4.48 (11)ImagePower (16) 6.58 (10) 5.8 (10) 0.78 (6) 5.96 (9) 2.2 (1) 3.76 (10)
0 200 400 600 8000.5
0.6
0.7
0.8
0.9
1
Image Index
Nor
mal
ized
Obj
ecti
ve F
unct
ion blood (A)
blood (B)blood (C)blood (D)blood (E)
0 200 400 600 800
0.8
0.85
0.9
0.95
1
Image Index
No
rmal
ized
Ob
ject
ive
Fu
nct
ion pap (A)
pap (B)pap (C)pap (D)pap (E)
Fig. 7. Focus curves of the Entropy algorithm (13) for 10 image sets ofblood smears (top) and pap smears (bottom).
was employed for ranking the focusing algorithms, consistingof two newly proposed dynamic measures, five previouslypresented static criteria and one overall score. The variancealgorithm was found to provide the best overall performancefor both blood smear and pap smear samples, which is thus,appropriate to choose for automated microscopic diagnosis ofblood and pap smear.
C© 2007 The AuthorsJournal compilation C© 2007 The Royal Microscopical Society, Journal of Microscopy, 227, 15–23

DY NA M I C E VA L UAT I O N O F AU T O F O C U S I N G F O R AU T O M AT E D M I C RO S C O P I C A NA LYS I S 2 3
References
Angulo, J. & Flandrin, G. (2003) Automated detection of working areaof peripheral blood smears using mathematical morphology. Anal. Cell.Pathol. 25, 37–49.
Beveridge, G.S. & Schechter, R.S. (1970) Optimization: Theory and Practice,McGraw-Hill, New York.
Brenner, J., Dew, B., Horton, J., King, J., Neirath, P. & Sellers, W. (1971) Anautomated microscope for cytologic research. J. Histochem. Cytochem.24, 100–111.
Firestone, L., Gook, K., Gulp, K., Talsania, N. & Preston, K. (1991)Comparison of autofocus methods for use in automated algorithms.Cytometry 12, 195–206.
Geusebroek, J.M., Cornelissen, F., Smeulders, A. & Geerts, H. (2000) Robustautofocusing in microscopy. Cytometry 39, 1–9.
Groen, F., Young, I.T. & Ligntart, G. (1985) A comparison of different focusfunctions for use in autofocus algorithms. Cytometry 6, 81–91.
Johnson, S.M. (1956) Best Exploration for Maximum is Fibonaccian. RANDCorporation Report P-856. Santa Monica, CA.
Kiefer, J. (1953) Sequential minimax search for a maximum. Proc. Am.Math. Soc. 4, 502–506.
Krotkov, E. (1987) Focusing. Int. J. Comput. Vis. 1, 223–237.Liu, X.Y., Wang, W.H. & Sun, Y. (2006) Autofocusing for automated
microscopic evaluation of blood smear and pap smear. IEEE International
Conference of the Engineering in Medicine and Biology Society, Aug. 30–Sept. 3 2006, New York, USA.
Mehdelsohn, M.L. & Mayall, B.H. (1972) Computer-oriented analysisof human chromosomes – III focus. Comput. Biol. Med. 2, 137–150.
Nayar, S. & Nakagawa, Y. (1994) Shape from focus. IEEE Trans. PatternAnal. Machine Intell. 16, 824–831.
Santos, A., Solorzano, C.O., Vaquero, J.J., Pena, J.M., Malpica, N. & Pozo,F. (1997) Evaluation of autofocus functions in molecular cytogeneticanalysis. J. Microsc. 188, 264–272.
Simon, H., Voss, K., Wenzelides, K., Hufnagl, P. & Roth, K. (1986)Automated microscopic image evaluation for histological diagnosis oftumours. Exp. Pathol. 30, 51–58.
Subbarao, M., Choi, T. & Nikzad, A. (1993) Focusing techniques. Opt. Eng.32, 2824–2836.
Sun, Y., Duthaler, S. & Nelson, B.J. (2004) Autofocusing in computermicroscopy: selecting the optimal focus algorithm. Microsc. Res. Tech.65, 139–149.
Vollath, D. (1987) Automatic focusing by correlative methods. J. Microsc.147, 279–288.
Vollath, D. (1988) The influence of the scene parameters and of noise on thebehavior of automatic focusing algorithms. J. Microsc. 151, 133–146.
Yeo, T., Jayasooriah, S.O. & Sinniah, R. (1993) Autofocusing for tissuemicroscopy. Image Vis. Comput. 11, 629–639.
C© 2007 The AuthorsJournal compilation C© 2007 The Royal Microscopical Society, Journal of Microscopy, 227, 15–23