Dynamic behaviour of commercial aircraft fuselage · PDF file · 2017-04-07Dynamic...
10
American Institute of Aeronautics and Astronautics 1 Dynamic behaviour of commercial aircraft fuselage sections Vincenzo Franzese 1 , Alessandro Perazzo 1 Università degli Studi di Napoli Federico II, Naples, 80125, Italy This work is integrated in a research project aimed at cabin noise reduction for turbofan commercial aircraft. In order to understand the vibro-acoustic behaviour of a structure it is fundamental to find out its natural frequencies and mode shapes. Several numerical investigations were performed on different fuselage sections to predict the dynamic behaviour of these structures and the influence in the response of each single component. Then an experimental campaign was performed on the fuselage section available at CeSMA laboratory and experimental results were compared with numerical ones. Stiffened cylinders exhibit a dynamic behaviour which is the envelope of three simple structures: frame, shell between two frames and unstiffened cylinder. The envelope curve of the available structure and the NGTP model were obtained. Finally, experimental and numerical correlations of the frame were presented. KEYWORDS: modal analysis, vibro-acoustic testing Nomenclature r = section radius of fuselage section l = section length of fuselage section t = average thickness hf = floor height nd = number of doors nh = number of portholes ns = number of stringers nf = number of frames FEM = finite element method E = Young’s modulus G = shear modulus ρ = mass density ν = Poisson’s ratio W = width of the cross section ffff = free-free condition on four edges n = number of circumferential wave number EMA = experimental modal analysis Δf = percentage difference between FEM and EMA natural frequencies Sff = power spectral density of the input signal Sxx = power spectral density of the output signal Sxf = cross spectral density of the input and output signal 2 = coherence function MAC = modal assurance criterion T = transpose operator H = hermitian operator uf = numerical eigenvector ue = experimental eigenvector FRF = frequency response function 1 Graduate student, Industrial Engineering Department, via Claudio 21, 80125 Naples.
Transcript of Dynamic behaviour of commercial aircraft fuselage · PDF file · 2017-04-07Dynamic...

American Institute of Aeronautics and Astronautics
1
Dynamic behaviour of commercial aircraft fuselage sections
Vincenzo Franzese1, Alessandro Perazzo1
Università degli Studi di Napoli Federico II, Naples, 80125, Italy
This work is integrated in a research project aimed at cabin noise reduction for turbofan
commercial aircraft. In order to understand the vibro-acoustic behaviour of a structure it is
fundamental to find out its natural frequencies and mode shapes. Several numerical
investigations were performed on different fuselage sections to predict the dynamic behaviour
of these structures and the influence in the response of each single component. Then an
experimental campaign was performed on the fuselage section available at CeSMA laboratory
and experimental results were compared with numerical ones. Stiffened cylinders exhibit a
dynamic behaviour which is the envelope of three simple structures: frame, shell between two
frames and unstiffened cylinder. The envelope curve of the available structure and the NGTP
model were obtained. Finally, experimental and numerical correlations of the frame were
presented.
KEYWORDS: modal analysis, vibro-acoustic testing
Nomenclature
r = section radius of fuselage section
l = section length of fuselage section
t = average thickness
hf = floor height
nd = number of doors
nh = number of portholes
ns = number of stringers
nf = number of frames
FEM = finite element method
E = Young’s modulus
G = shear modulus
ρ = mass density
ν = Poisson’s ratio
W = width of the cross section
ffff = free-free condition on four edges
n = number of circumferential wave number
EMA = experimental modal analysis
Δf = percentage difference between FEM and EMA natural frequencies
Sff = power spectral density of the input signal
Sxx = power spectral density of the output signal
Sxf = cross spectral density of the input and output signal
𝛾2 = coherence function
MAC = modal assurance criterion
T = transpose operator
H = hermitian operator
uf = numerical eigenvector
ue = experimental eigenvector
FRF = frequency response function
1Graduate student, Industrial Engineering Department, via Claudio 21, 80125 Naples.
American Institute of Aeronautics and Astronautics
2
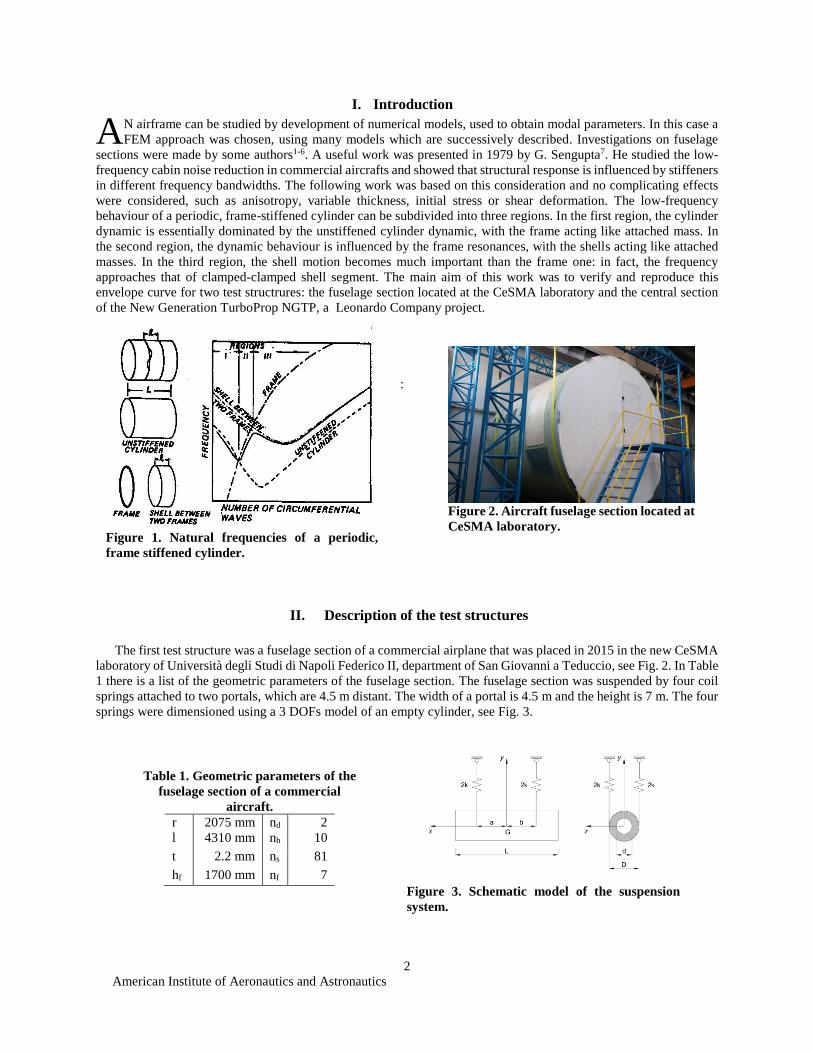
I. Introduction
N airframe can be studied by development of numerical models, used to obtain modal parameters. In this case a
FEM approach was chosen, using many models which are successively described. Investigations on fuselage
sections were made by some authors1-6. A useful work was presented in 1979 by G. Sengupta7. He studied the low-
frequency cabin noise reduction in commercial aircrafts and showed that structural response is influenced by stiffeners
in different frequency bandwidths. The following work was based on this consideration and no complicating effects
were considered, such as anisotropy, variable thickness, initial stress or shear deformation. The low-frequency
behaviour of a periodic, frame-stiffened cylinder can be subdivided into three regions. In the first region, the cylinder
dynamic is essentially dominated by the unstiffened cylinder dynamic, with the frame acting like attached mass. In
the second region, the dynamic behaviour is influenced by the frame resonances, with the shells acting like attached
masses. In the third region, the shell motion becomes much important than the frame one: in fact, the frequency
approaches that of clamped-clamped shell segment. The main aim of this work was to verify and reproduce this
envelope curve for two test structrures: the fuselage section located at the CeSMA laboratory and the central section
of the New Generation TurboProp NGTP, a Leonardo Company project.
:
II. Description of the test structures
The first test structure was a fuselage section of a commercial airplane that was placed in 2015 in the new CeSMA
laboratory of Università degli Studi di Napoli Federico II, department of San Giovanni a Teduccio, see Fig. 2. In Table
1 there is a list of the geometric parameters of the fuselage section. The fuselage section was suspended by four coil
springs attached to two portals, which are 4.5 m distant. The width of a portal is 4.5 m and the height is 7 m. The four
springs were dimensioned using a 3 DOFs model of an empty cylinder, see Fig. 3.
A
Figure 1. Natural frequencies of a periodic,
frame stiffened cylinder.
Table 1. Geometric parameters of the
fuselage section of a commercial
aircraft.
r 2075 mm nd 2
l 4310 mm nh 10
t 2.2 mm ns 81
hf 1700 mm nf 7
Figure 2. Aircraft fuselage section located at
CeSMA laboratory.
Figure 3. Schematic model of the suspension
system.
American Institute of Aeronautics and Astronautics
3
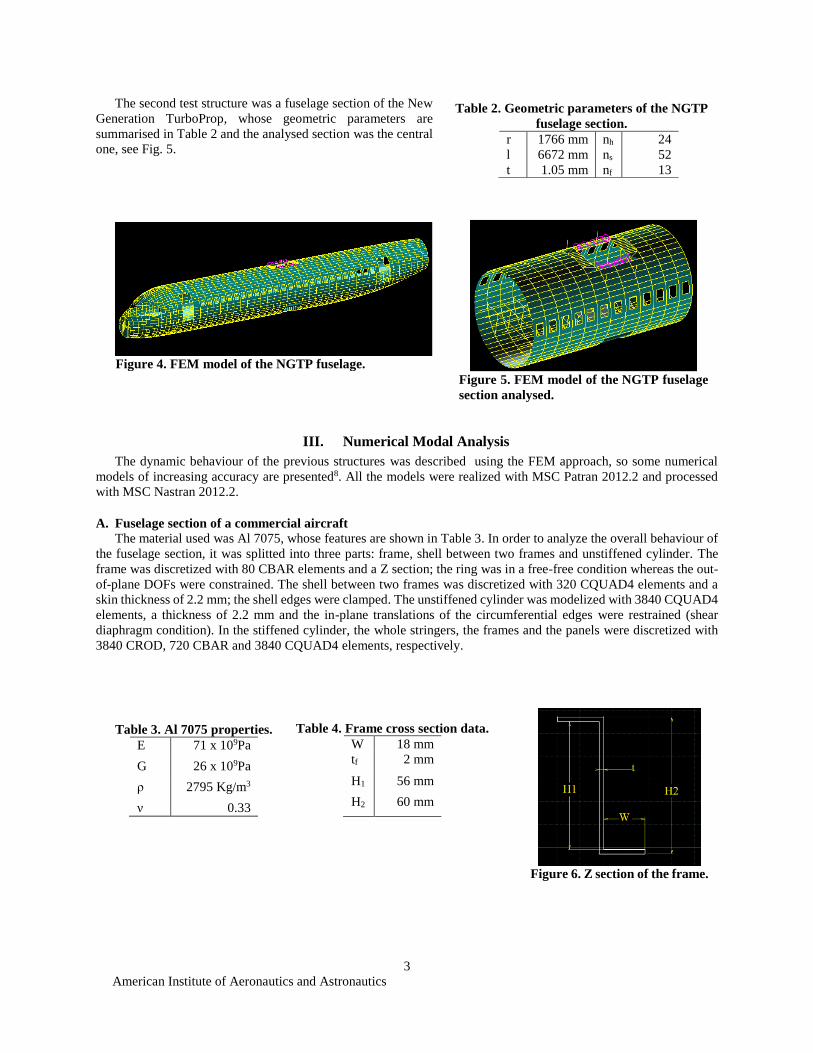
The second test structure was a fuselage section of the New
Generation TurboProp, whose geometric parameters are
summarised in Table 2 and the analysed section was the central
one, see Fig. 5.
III. Numerical Modal Analysis
The dynamic behaviour of the previous structures was described using the FEM approach, so some numerical
models of increasing accuracy are presented8. All the models were realized with MSC Patran 2012.2 and processed
with MSC Nastran 2012.2.
A. Fuselage section of a commercial aircraft
The material used was Al 7075, whose features are shown in Table 3. In order to analyze the overall behaviour of
the fuselage section, it was splitted into three parts: frame, shell between two frames and unstiffened cylinder. The
frame was discretized with 80 CBAR elements and a Z section; the ring was in a free-free condition whereas the out-
of-plane DOFs were constrained. The shell between two frames was discretized with 320 CQUAD4 elements and a
skin thickness of 2.2 mm; the shell edges were clamped. The unstiffened cylinder was modelized with 3840 CQUAD4
elements, a thickness of 2.2 mm and the in-plane translations of the circumferential edges were restrained (shear
diaphragm condition). In the stiffened cylinder, the whole stringers, the frames and the panels were discretized with
3840 CROD, 720 CBAR and 3840 CQUAD4 elements, respectively.
Figure 5. FEM model of the NGTP fuselage
section analysed.
Table 2. Geometric parameters of the NGTP
fuselage section.
r 1766 mm nh 24
l 6672 mm ns 52
t 1.05 mm nf 13
Table 3. Al 7075 properties.
E 71 x 109Pa
G 26 x 109Pa
ρ 2795 Kg/m3
ν 0.33
Table 4. Frame cross section data.
W 18 mm
tf 2 mm
H1 56 mm
H2 60 mm
Figure 6. Z section of the frame.
Figure 4. FEM model of the NGTP fuselage.
American Institute of Aeronautics and Astronautics
4
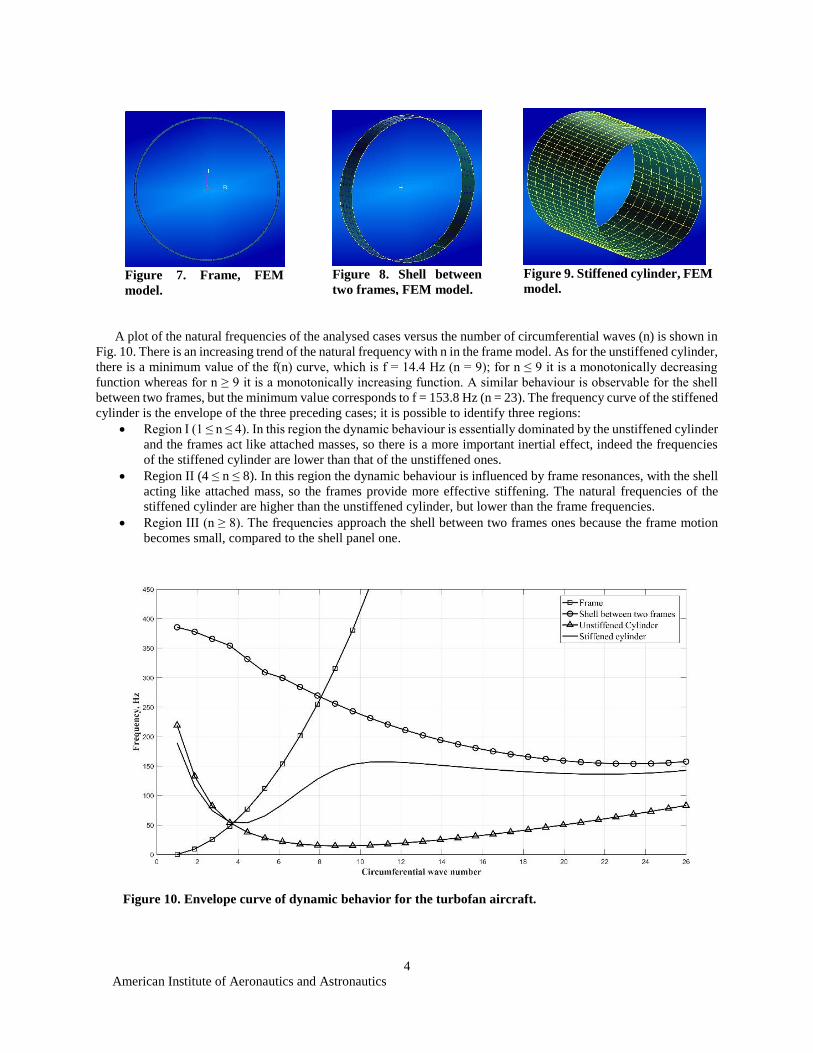
A plot of the natural frequencies of the analysed cases versus the number of circumferential waves (n) is shown in
Fig. 10. There is an increasing trend of the natural frequency with n in the frame model. As for the unstiffened cylinder,
there is a minimum value of the f(n) curve, which is f = 14.4 Hz (n = 9); for n ≤ 9 it is a monotonically decreasing
function whereas for n ≥ 9 it is a monotonically increasing function. A similar behaviour is observable for the shell
between two frames, but the minimum value corresponds to f = 153.8 Hz (n = 23). The frequency curve of the stiffened
cylinder is the envelope of the three preceding cases; it is possible to identify three regions:
Region I (1 ≤ n ≤ 4). In this region the dynamic behaviour is essentially dominated by the unstiffened cylinder
and the frames act like attached masses, so there is a more important inertial effect, indeed the frequencies
of the stiffened cylinder are lower than that of the unstiffened ones.
Region II (4 ≤ n ≤ 8). In this region the dynamic behaviour is influenced by frame resonances, with the shell
acting like attached mass, so the frames provide more effective stiffening. The natural frequencies of the
stiffened cylinder are higher than the unstiffened cylinder, but lower than the frame frequencies.
Region III (n ≥ 8). The frequencies approach the shell between two frames ones because the frame motion
becomes small, compared to the shell panel one.
Figure 10. Envelope curve of dynamic behavior for the turbofan aircraft.
Figure 7. Frame, FEM
model.
Figure 8. Shell between
two frames, FEM model.
Figure 9. Stiffened cylinder, FEM
model.
American Institute of Aeronautics and Astronautics
5
B. Fuselage section of the NGTP
The materials used were Aluminum alloys, which differ in E and ρ. In order to analyze the behaviour of the
fuselage section of NGTP, three sub-structures were analyzed also in this case: frame, shell between two frames and
unstiffened cylinder. The frame was discretized with 52 CBAR elements; the out-of-plane DOFs were constrained
and only in plane flexural modes were considered. The shell between two frames was discretized with 156 CQUAD4
elements and a skin thickness of 1.05 mm; the shell edges were clamped. The unstiffened cylinder was modelized
with 1664 CQUAD4 elements, a thickness of 1.05 mm and the shear diaphragm condition was used. In the stiffened
cylinder, the whole stringers, the frames and the panels were discretized with 1836 CROD, 576 CBAR and 1728
CQUAD4 respectively.
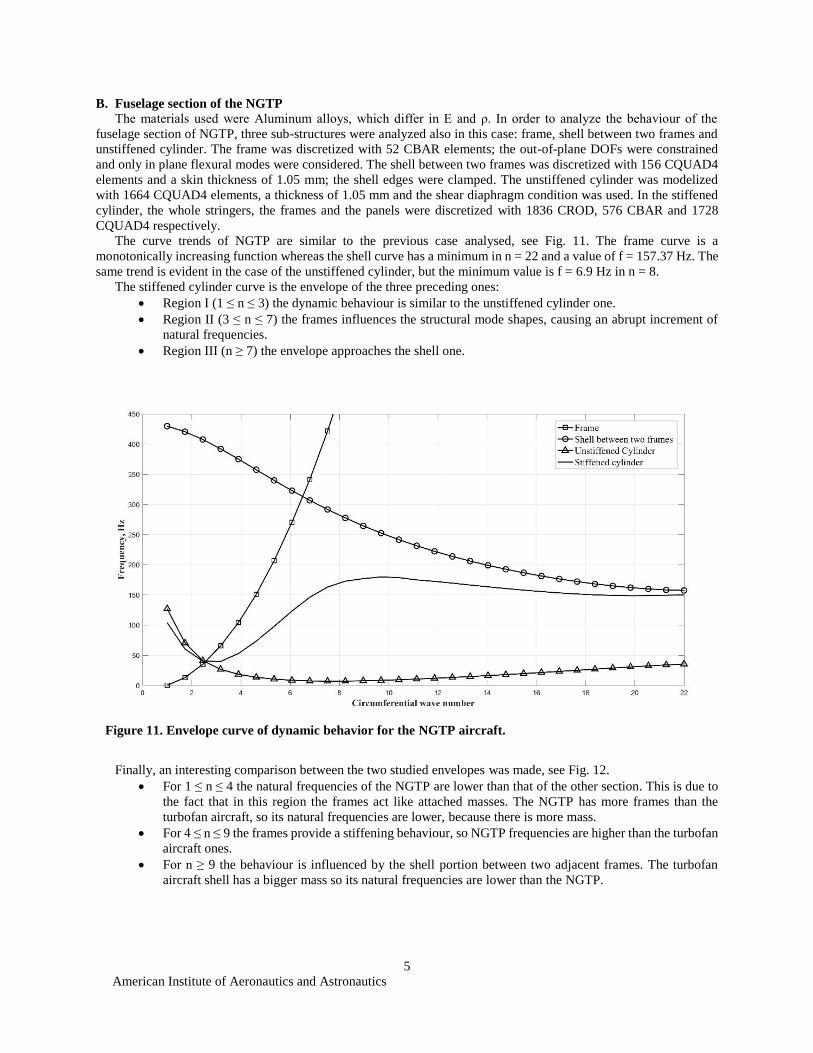
The curve trends of NGTP are similar to the previous case analysed, see Fig. 11. The frame curve is a
monotonically increasing function whereas the shell curve has a minimum in n = 22 and a value of f = 157.37 Hz. The
same trend is evident in the case of the unstiffened cylinder, but the minimum value is f = 6.9 Hz in n = 8.
The stiffened cylinder curve is the envelope of the three preceding ones:
Region I (1 ≤ n ≤ 3) the dynamic behaviour is similar to the unstiffened cylinder one.
Region II (3 ≤ n ≤ 7) the frames influences the structural mode shapes, causing an abrupt increment of
natural frequencies.
Region III (n ≥ 7) the envelope approaches the shell one.
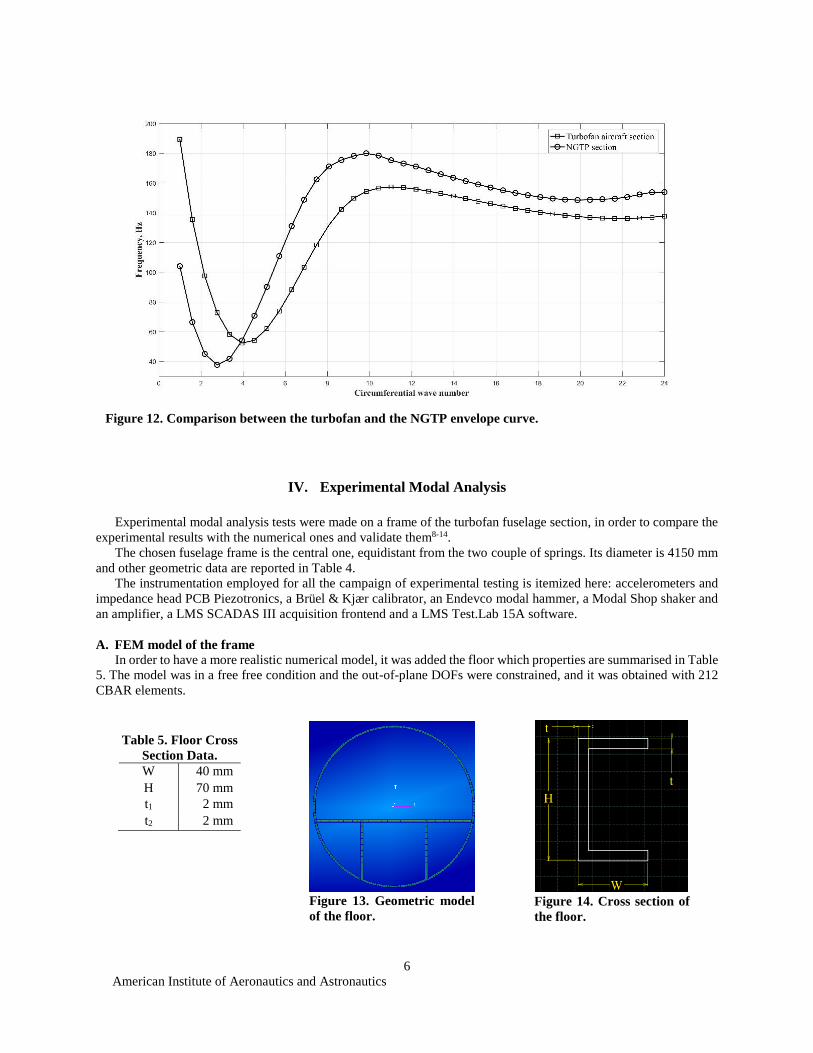
Finally, an interesting comparison between the two studied envelopes was made, see Fig. 12.
For 1 ≤ n ≤ 4 the natural frequencies of the NGTP are lower than that of the other section. This is due to
the fact that in this region the frames act like attached masses. The NGTP has more frames than the
turbofan aircraft, so its natural frequencies are lower, because there is more mass.
For 4 ≤ n ≤ 9 the frames provide a stiffening behaviour, so NGTP frequencies are higher than the turbofan
aircraft ones.
For n ≥ 9 the behaviour is influenced by the shell portion between two adjacent frames. The turbofan
aircraft shell has a bigger mass so its natural frequencies are lower than the NGTP.
Figure 11. Envelope curve of dynamic behavior for the NGTP aircraft.
American Institute of Aeronautics and Astronautics
6
IV. Experimental Modal Analysis
Experimental modal analysis tests were made on a frame of the turbofan fuselage section, in order to compare the
experimental results with the numerical ones and validate them8-14.
The chosen fuselage frame is the central one, equidistant from the two couple of springs. Its diameter is 4150 mm
and other geometric data are reported in Table 4.
The instrumentation employed for all the campaign of experimental testing is itemized here: accelerometers and
impedance head PCB Piezotronics, a Brüel & Kjær calibrator, an Endevco modal hammer, a Modal Shop shaker and
an amplifier, a LMS SCADAS III acquisition frontend and a LMS Test.Lab 15A software.
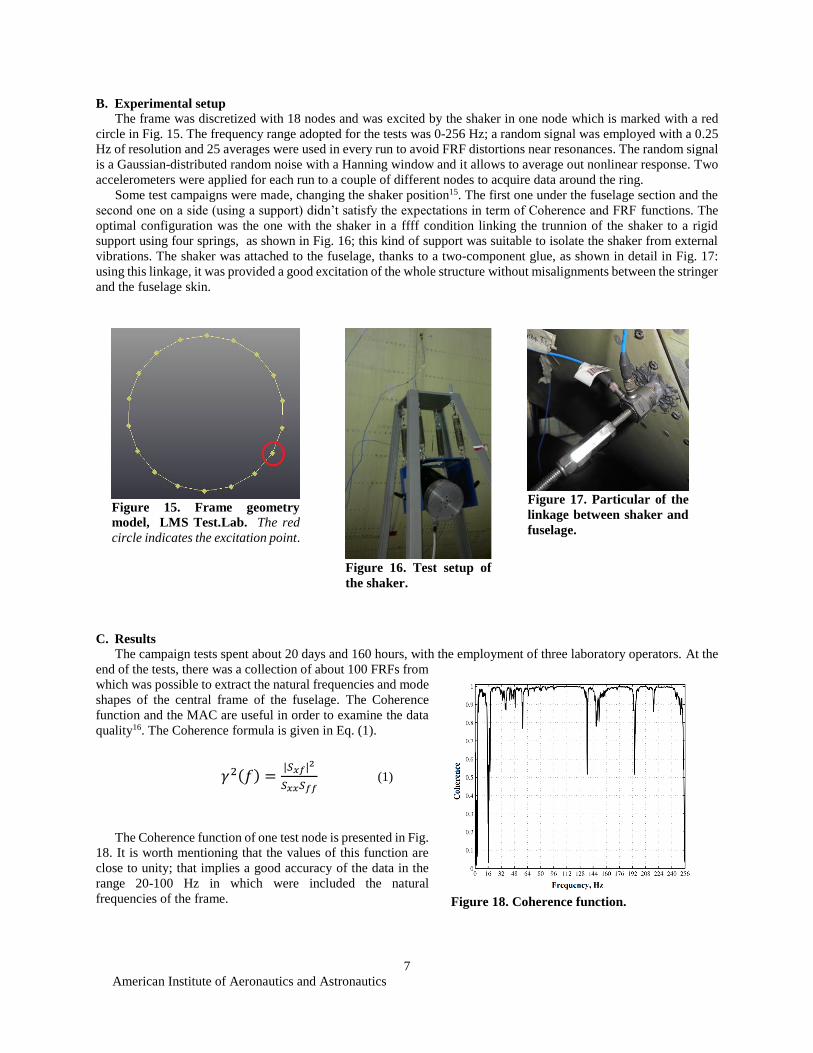
A. FEM model of the frame
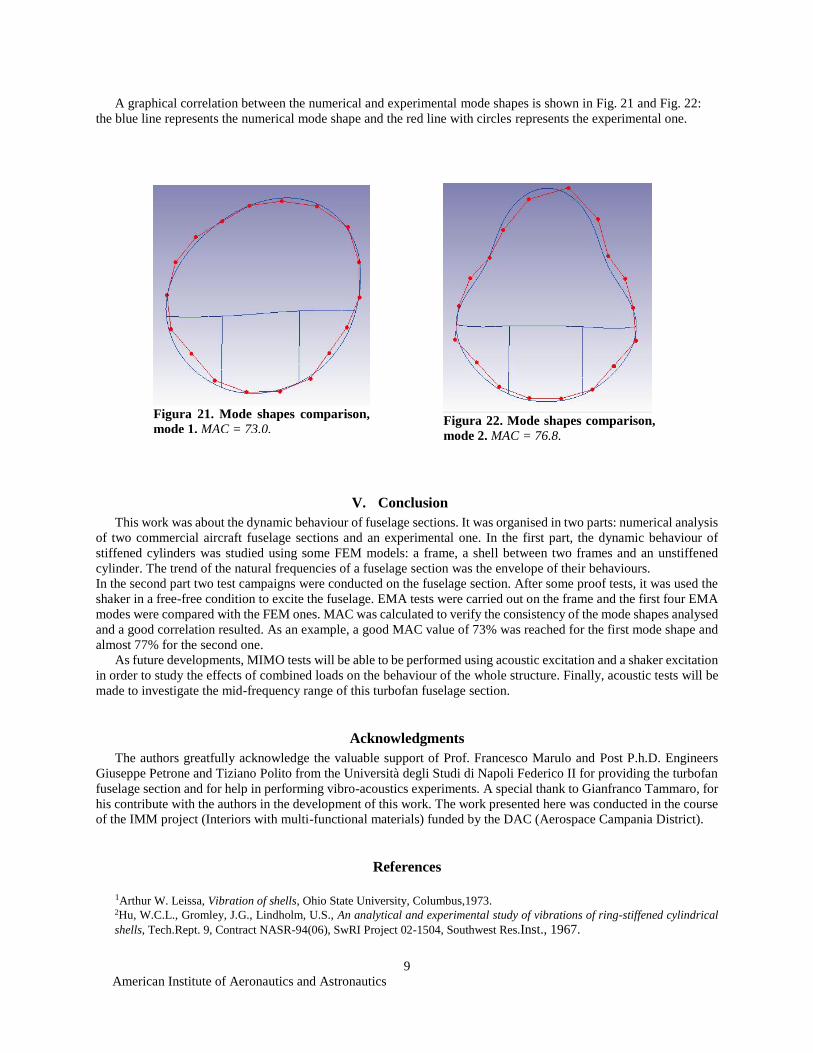
In order to have a more realistic numerical model, it was added the floor which properties are summarised in Table
5. The model was in a free free condition and the out-of-plane DOFs were constrained, and it was obtained with 212
CBAR elements.
Figure 12. Comparison between the turbofan and the NGTP envelope curve.
Table 5. Floor Cross
Section Data.
W 40 mm
H 70 mm
t1 2 mm
t2 2 mm
Figure 13. Geometric model
of the floor.
Figure 14. Cross section of
the floor.
American Institute of Aeronautics and Astronautics
7
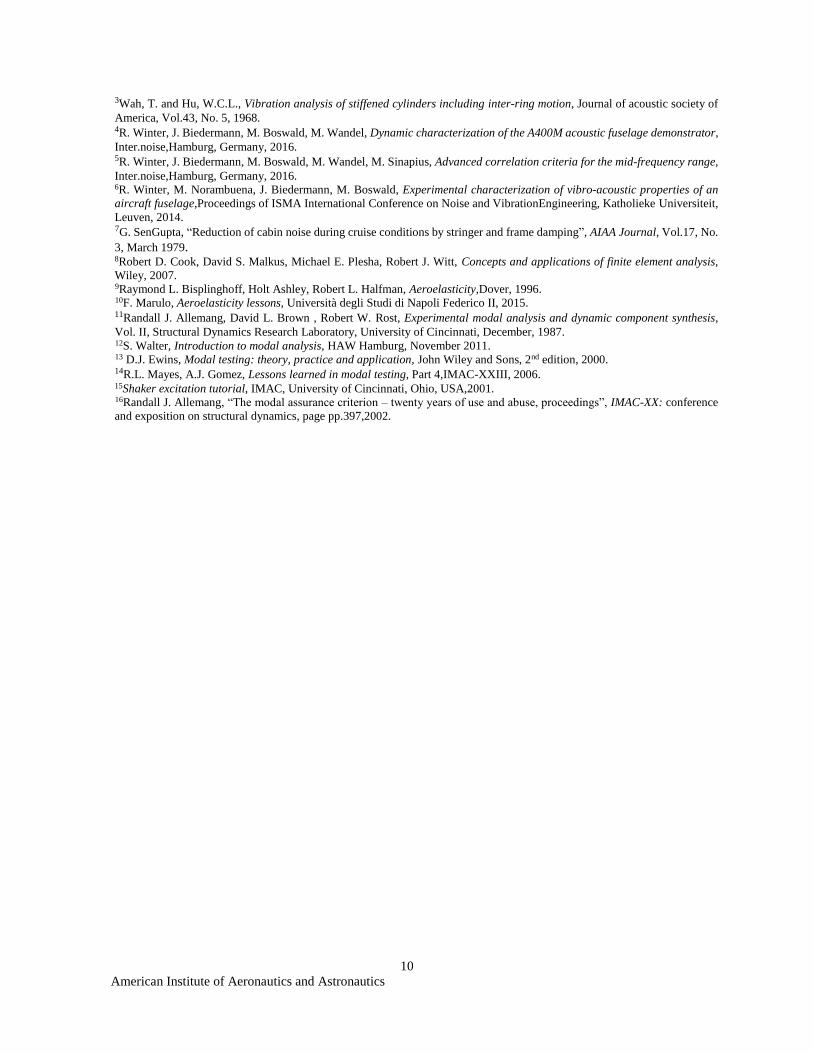
B. Experimental setup
The frame was discretized with 18 nodes and was excited by the shaker in one node which is marked with a red
circle in Fig. 15. The frequency range adopted for the tests was 0-256 Hz; a random signal was employed with a 0.25
Hz of resolution and 25 averages were used in every run to avoid FRF distortions near resonances. The random signal
is a Gaussian-distributed random noise with a Hanning window and it allows to average out nonlinear response. Two
accelerometers were applied for each run to a couple of different nodes to acquire data around the ring.
Some test campaigns were made, changing the shaker position15. The first one under the fuselage section and the
second one on a side (using a support) didn’t satisfy the expectations in term of Coherence and FRF functions. The
optimal configuration was the one with the shaker in a ffff condition linking the trunnion of the shaker to a rigid
support using four springs, as shown in Fig. 16; this kind of support was suitable to isolate the shaker from external
vibrations. The shaker was attached to the fuselage, thanks to a two-component glue, as shown in detail in Fig. 17:
using this linkage, it was provided a good excitation of the whole structure without misalignments between the stringer
and the fuselage skin.
C. Results
The campaign tests spent about 20 days and 160 hours, with the employment of three laboratory operators. At the
end of the tests, there was a collection of about 100 FRFs from
which was possible to extract the natural frequencies and mode
shapes of the central frame of the fuselage. The Coherence
function and the MAC are useful in order to examine the data
quality16. The Coherence formula is given in Eq. (1).
The Coherence function of one test node is presented in Fig.
18. It is worth mentioning that the values of this function are
close to unity; that implies a good accuracy of the data in the
range 20-100 Hz in which were included the natural
frequencies of the frame.
Figure 15. Frame geometry
model, LMS Test.Lab. The red
circle indicates the excitation point.
Figure 16. Test setup of
the shaker.
Figure 17. Particular of the
linkage between shaker and
fuselage.
Figure 18. Coherence function.
𝛾2(𝑓) =|𝑆𝑥𝑓|2
𝑆𝑥𝑥𝑆𝑓𝑓 (1)

American Institute of Aeronautics and Astronautics
8
A comparison between the measured FRF and the
synthesized one of the whole structure is shown in
Fig. 19. In this figure are indicated, with blue circles,
the first four natural frequencies of the frame
obtained by exciting the fuselage section with a
random signal. In these FRFs there is also the
presence of other peaks related to resonances of other
subsctures of the fuselage section. The only aim of
these experimental tests was to compare frame
natural frequencies with the numerical ones and
verify the level of the correlation. The MAC is
graphically reported in Fig. 20.
The Modal Assurance Criterion is a statistical indicator that
is most sensitive to large differences and relatively insensitive
to small differences in the mode shapes. This yields a good
statistic indicator and a degree of consistency between mode
shapes. It is bounded between 0 and 100 (in percentage), with
100 indicating fully consistent mode shapes whereas a value near 0 indicates that the modes are not consistent.
In Eq. (2) is presented the formula of MAC. To understand if there is a good correlation between the mode shapes
it is helpful the main diagonal of the matrix in Table 6: its values are equal or higher than sixty per cent, so these
modes shapes were enough consistent.
A percentage comparison between first four EMA and FEM natural frequencies is reported in Table 7. It is possible
to observe that the MAC value is high for the first and second resonances, even if the difference of EMA and
FEM fundamental frequency is also high; maybe it is due to other complicating effects not considered in this
experimental and numerical analysis. The MAC values for the third and fourth mode shapes are lower than the first
ones, but these are acceptable values, so a good result was globally obtained from these experimental tests. It is worth
mentioning a switch between the second and third resonances: the second EMA mode shape corresponded to the third
FEM one while the third EMA mode shape corresponded to the second FEM one.
Table 7. Comparison of the natural frequencies
of the frame between FEM and EMA.
FEM EMA ∆𝑓 % MAC %
19.76 29.84 -33.78 73.0
39.42 41.43 -4.85 76.8
46.42 37.58 23.52 65.9
79.34 82.11 -3.37 60.5
Table 6. Frame MAC % table, FEM vs.
EMA.
1 2 3 4
1 73.0 5.5 2.5 14.6
2 6.9 76.8 5.8 9.7
3 2.1 9.0 65.9 5.1
4 8.7 3.8 1.8 60.5
Figura 19. Measured and synthesized FRF, in Log
scale.
Figura 20. MAC of four mode shapes.
MAC =|{u}e
T{u}fH|2
{u}eT{u}e
H{u}fT{u}f
H (2)
American Institute of Aeronautics and Astronautics
9
A graphical correlation between the numerical and experimental mode shapes is shown in Fig. 21 and Fig. 22:
the blue line represents the numerical mode shape and the red line with circles represents the experimental one.
V. Conclusion
This work was about the dynamic behaviour of fuselage sections. It was organised in two parts: numerical analysis
of two commercial aircraft fuselage sections and an experimental one. In the first part, the dynamic behaviour of
stiffened cylinders was studied using some FEM models: a frame, a shell between two frames and an unstiffened
cylinder. The trend of the natural frequencies of a fuselage section was the envelope of their behaviours.
In the second part two test campaigns were conducted on the fuselage section. After some proof tests, it was used the
shaker in a free-free condition to excite the fuselage. EMA tests were carried out on the frame and the first four EMA
modes were compared with the FEM ones. MAC was calculated to verify the consistency of the mode shapes analysed
and a good correlation resulted. As an example, a good MAC value of 73% was reached for the first mode shape and
almost 77% for the second one.
As future developments, MIMO tests will be able to be performed using acoustic excitation and a shaker excitation
in order to study the effects of combined loads on the behaviour of the whole structure. Finally, acoustic tests will be
made to investigate the mid-frequency range of this turbofan fuselage section.
Acknowledgments
The authors greatfully acknowledge the valuable support of Prof. Francesco Marulo and Post P.h.D. Engineers
Giuseppe Petrone and Tiziano Polito from the Università degli Studi di Napoli Federico II for providing the turbofan
fuselage section and for help in performing vibro-acoustics experiments. A special thank to Gianfranco Tammaro, for
his contribute with the authors in the development of this work. The work presented here was conducted in the course
of the IMM project (Interiors with multi-functional materials) funded by the DAC (Aerospace Campania District).
References
1Arthur W. Leissa, Vibration of shells, Ohio State University, Columbus,1973. 2Hu, W.C.L., Gromley, J.G., Lindholm, U.S., An analytical and experimental study of vibrations of ring-stiffened cylindrical
shells, Tech.Rept. 9, Contract NASR-94(06), SwRI Project 02-1504, Southwest Res.Inst., 1967.
Figura 21. Mode shapes comparison,
mode 1. MAC = 73.0.
Figura 22. Mode shapes comparison,
mode 2. MAC = 76.8.
American Institute of Aeronautics and Astronautics
10
3Wah, T. and Hu, W.C.L., Vibration analysis of stiffened cylinders including inter-ring motion, Journal of acoustic society of
America, Vol.43, No. 5, 1968. 4R. Winter, J. Biedermann, M. Boswald, M. Wandel, Dynamic characterization of the A400M acoustic fuselage demonstrator,
Inter.noise,Hamburg, Germany, 2016. 5R. Winter, J. Biedermann, M. Boswald, M. Wandel, M. Sinapius, Advanced correlation criteria for the mid-frequency range,
Inter.noise,Hamburg, Germany, 2016. 6R. Winter, M. Norambuena, J. Biedermann, M. Boswald, Experimental characterization of vibro-acoustic properties of an
aircraft fuselage,Proceedings of ISMA International Conference on Noise and VibrationEngineering, Katholieke Universiteit,
Leuven, 2014. 7G. SenGupta, “Reduction of cabin noise during cruise conditions by stringer and frame damping”, AIAA Journal, Vol.17, No.
3, March 1979. 8Robert D. Cook, David S. Malkus, Michael E. Plesha, Robert J. Witt, Concepts and applications of finite element analysis,
Wiley, 2007. 9Raymond L. Bisplinghoff, Holt Ashley, Robert L. Halfman, Aeroelasticity,Dover, 1996. 10F. Marulo, Aeroelasticity lessons, Università degli Studi di Napoli Federico II, 2015. 11Randall J. Allemang, David L. Brown , Robert W. Rost, Experimental modal analysis and dynamic component synthesis,
Vol. II, Structural Dynamics Research Laboratory, University of Cincinnati, December, 1987. 12S. Walter, Introduction to modal analysis, HAW Hamburg, November 2011. 13 D.J. Ewins, Modal testing: theory, practice and application, John Wiley and Sons, 2nd edition, 2000. 14R.L. Mayes, A.J. Gomez, Lessons learned in modal testing, Part 4,IMAC-XXIII, 2006. 15Shaker excitation tutorial, IMAC, University of Cincinnati, Ohio, USA,2001. 16Randall J. Allemang, “The modal assurance criterion – twenty years of use and abuse, proceedings”, IMAC-XX: conference
and exposition on structural dynamics, page pp.397,2002.