Dynamic Assignment of Patients to Primary and Secondary ...
33
Dynamic Assignment of Patients to Primary and Secondary Inpatient Units: Is Patience a Virtue? Derya Kilinc 1 , Soroush Saghafian 2 , Stephen J. Traub 3 1 School of Computing, Informatics, and Decision Systems Engineering, Arizona State University, Tempe, AZ 85287 2 Harvard Kennedy School, Harvard University, Cambridge, MA 02138 3 Department of Emergency Medicine, Mayo Clinic, Phoenix, AZ 85054 An important contributor to the well-known problem of Emergency Department (ED) overcrowding is prolonged board- ing of patients who are admitted through the ED. Patients admitted through the ED constitute about 50% of all non- obstetrical hospital admissions, and may be boarded in the ED for long hours with the hope of finding an available bed in their primary inpatient unit. We study effective ways of reducing ED boarding times by considering the trade-off between keeping patients in the ED and assigning them to a secondary inpatient unit. The former can increase the risk of adverse events and cause congestion in the ED, whereas the latter may adversely impact the quality of care. Further complicating this calculus is the fact that a secondary inpatient unit for a current patient can be the primary unit for a future arriving patient; assignments, therefore, should be made in an orchestrated way. Developing a queueing-based Markov decision process, we demonstrate that patience in transferring patients is a virtue, but only up to a point. We also find that, contrary to the prevalent perception, idling inpatient beds can be beneficial. Since the optimal policy for dynamically assigning patients to their primary and secondary inpatient units is complex and hard to implement in hospitals, we develop a simple policy which we term penalty-adjusted Largest Expected Workload Cost (LEWC-p). Using simulation analyses calibrated with hospital data, we find that implementing this policy could significantly help hospitals to improve their patient safety by reducing boarding times while controlling the overflow of patients to secondary units. Using data analyses and various simulation experiments, we also help hospital administrators by generating insights into hospital conditions under which achievable improvements are significant.* Key words : ED boarding; inpatient flow management; patient safety; healthcare operations; Markov decision process History : Version: November 5, 2017 “Ah, all things come to those who wait.” (Violet Fane (1843-1905)) 1. Introduction Over the last decade, hospital Emergency Department (ED) overcrowding has become a widely recognized problem in healthcare delivery in the U.S. and around the world. In a report to congress, the U.S. Government Accountability Office highlighted this problem, and emphasized that ED waiting times for the emergent patients exceeds the recommended time window for 50% of visits (GAO (2009)). ED overcrowding may have dire consequences, including higher complication rates and even increased mortality (Bernstein et al. (2009), CNN (2008)). As overcrowding increases, patients are subject to higher dissatisfaction, impaired access, higher rates of leaving without being seen (LWBS), and decreased economic performance (Hoot and Aronsky (2008)). One important factor associated with ED overcrowding is the prolonged ED boarding of patients admitted to inpatient units (GAO (2003)). ED boarding occurs when an admitted patient waits for transfer to an inpatient unit due to bed unavailability in a downstream unit. Although this may cause congestion and may block ED resources from being assigned to newly arrived patients (see, e.g., Saghafian et al. (2012), and the references therein for the so-called “bed-block” effect), boarding * This work was supported in part by Mayo Clinic through grant XSS0133. 1
Transcript of Dynamic Assignment of Patients to Primary and Secondary ...

Dynamic Assignment of Patients to Primary andSecondary Inpatient Units: Is Patience a Virtue?
Derya Kilinc1, Soroush Saghafian2, Stephen J. Traub3
1School of Computing, Informatics, and Decision Systems Engineering, Arizona State University, Tempe, AZ 852872Harvard Kennedy School, Harvard University, Cambridge, MA 02138
3Department of Emergency Medicine, Mayo Clinic, Phoenix, AZ 85054
An important contributor to the well-known problem of Emergency Department (ED) overcrowding is prolonged board-ing of patients who are admitted through the ED. Patients admitted through the ED constitute about 50% of all non-obstetrical hospital admissions, and may be boarded in the ED for long hours with the hope of finding an available bed intheir primary inpatient unit. We study effective ways of reducing ED boarding times by considering the trade-off betweenkeeping patients in the ED and assigning them to a secondary inpatient unit. The former can increase the risk of adverseevents and cause congestion in the ED, whereas the latter may adversely impact the quality of care. Further complicatingthis calculus is the fact that a secondary inpatient unit for a current patient can be the primary unit for a future arrivingpatient; assignments, therefore, should be made in an orchestrated way. Developing a queueing-based Markov decisionprocess, we demonstrate that patience in transferring patients is a virtue, but only up to a point. We also find that, contraryto the prevalent perception, idling inpatient beds can be beneficial. Since the optimal policy for dynamically assigningpatients to their primary and secondary inpatient units is complex and hard to implement in hospitals, we develop a simplepolicy which we term penalty-adjusted Largest Expected Workload Cost (LEWC-p). Using simulation analyses calibratedwith hospital data, we find that implementing this policy could significantly help hospitals to improve their patient safetyby reducing boarding times while controlling the overflow of patients to secondary units. Using data analyses and varioussimulation experiments, we also help hospital administrators by generating insights into hospital conditions under whichachievable improvements are significant.*
Key words: ED boarding; inpatient flow management; patient safety; healthcare operations; Markov decision processHistory: Version: November 5, 2017
“Ah, all things come to those who wait.” (Violet Fane (1843-1905))
1. Introduction
Over the last decade, hospital Emergency Department (ED) overcrowding has become a widelyrecognized problem in healthcare delivery in the U.S. and around the world. In a report to congress,the U.S. Government Accountability Office highlighted this problem, and emphasized that EDwaiting times for the emergent patients exceeds the recommended time window for 50% of visits(GAO (2009)).
ED overcrowding may have dire consequences, including higher complication rates and evenincreased mortality (Bernstein et al. (2009), CNN (2008)). As overcrowding increases, patientsare subject to higher dissatisfaction, impaired access, higher rates of leaving without being seen(LWBS), and decreased economic performance (Hoot and Aronsky (2008)).
One important factor associated with ED overcrowding is the prolonged ED boarding of patientsadmitted to inpatient units (GAO (2003)). ED boarding occurs when an admitted patient waits fortransfer to an inpatient unit due to bed unavailability in a downstream unit. Although this may causecongestion and may block ED resources from being assigned to newly arrived patients (see, e.g.,Saghafian et al. (2012), and the references therein for the so-called “bed-block” effect), boarding
* This work was supported in part by Mayo Clinic through grant XSS0133.
1

Kilinc, Saghafian, and Traub: Assigning ED Patients to Inpatient Units2
may be viewed in a positive light by some when it is done to ensure transfer to the most appropriateinpatient unit (rather than a secondary unit that has bed availability). This is due to a questionableyet prevalent belief that patience in transferring admitted patients is always a virtue. This beliefdeserves further scrutiny, especially because it is well understood that prolonged boarding timeshave several negative consequences for patients, including an increased risk of adverse events(ROAE).1
The assignment of hospital beds to patients is a challenging task due to several complexities,including limited capacity of hospital beds, time-dependencies of bed request arrivals, and uniquetreatment requirements of patients (Proudlove et al. (2007)). These complexities force hospitaladministrators to incorporate various aspects of the operational status of their system (such as thecurrent congestion level, time of the day, and discharge times in inpatient units) in their decision-making process. Nevertheless, from a medical standpoint, the ideal way of assigning a bed for aspecific type of patient is directly related to the patient’s medical diagnosis and treatment needs.However, to accommodate patient demands with the limited available hospital resources, hospitaladministrators may consider alternative assignment options. In particular, when there is no avail-able bed in the ideal downstream unit (i.e., the patient’s primary inpatient unit), the patient maybe assigned to an alternative, secondary inpatient unit with an acceptable (if suboptimal) servicecapability and capacity. This practice of assigning patients to an alternative unit is known as “over-flowing.”
Overflowing is not a new concept in hospitals; however, in practice the overflow process is oftencontrolled in a myopic manner without much attention to the needs of future patients. Instead,what is needed is a reasonable balance between the risk of keeping a patient in the ED (with thehope of a primary unit assignment) vs. that of assigning the patient to a secondary unit that hascurrent bed availability. A careful consideration of these trade-offs might have a significant impacton both patient safety and operational efficiency of hospitals. Our goal in this paper is to develop asystematic approach to facilitate better decision making with respect to inpatient unit assignments.
To gain insights, we explore these issues in our partner hospital, Mayo Clinic Arizona (MCA).There are eight inpatient wards (IWs) in MCA from which a bed can be requested for an admittedpatient. A detailed description of these eight IWs are shown in Table 1. The data we have collectedfrom MCA shows that the average ED boarding time (the average time between bed request andoccupancy) at MCA is 111 minutes, with boarding times up to 150 minutes for some patients.Moreover, we observe from our data that about 30% of the patients admitted through the MCAED are boarded for at least two hours. An average delay of 111 minutes is significant, especiallywhen we consider that the average ED Length of Stay (LOS) for admitted patients in MCA is
1Patients boarded in the ED are sometimes kept on hallway beds, which raises additional concerns about whether they receivethe care that is deemed necessary for them — the inpatient unit level of care.

Kilinc, Saghafian, and Traub: Assigning ED Patients to Inpatient Units3
Table 1 IWs and their size in MCAIW Name Abbrev. Definition Number of Beds2 West 2W Intensive Care Unit (ICU) 303 East 3E Orthopedics and Urology Surgical Services 403 West 3W Medical/Surgical Organ Transplant 364 East 4E Bone Marrow Transplant, Hematology, Oncology 304 West 4W Cardiology and Cardiothoracic Surgery 365 West 5W Neurosciences and E.N.T. 367 East 7E Palliative Care, General Surgery 36
7 West 7WHematology and Oncology patients withmedical-surgical overflow 24
about 5 hours. This suggests that, on average, almost 37% of ED LOS is caused by boarding.2
Furthermore, as is shown in Figure 1(a), we find that boarding duration is highly time-dependent.Therefore, even if the average waiting time is not extremely long, patients admitted through theED experience different levels of delay based on the hour in which their inpatient bed is requested.
As we illustrate in Figure 1(a), boarding delays consists of two parts: Pre-Assignment and Post-Assignment. Pre-Assignment delay is the time between bed request and assignment of a suitableinpatient bed to the patient. Post-assignment delay is the time between bed assignment and bedoccupancy. Our analyses of MCA data reveal that post-assignment delays are higher on averagethan pre-assignment delays (see Figure 1(a)). Additionally, as we show in Figure 1(b), there is asignificant mismatch (i.e., time lag) between the hourly bed request pattern and the ED departurepattern (see, e.g., Shi et al. (2015), Armony et al. (2015), and Powell et al. (2012) for relatedresults reported for other hospitals). The time between ED arrivals and ED departures in Figure1(b) is defined as ED LOS, and the time between bed requests and ED departures represents theED boarding time. As can be seen from this figure, the ratio of ED boarding time to ED LOS canbe as high as 48% for some patients.
Effective assignment policies to primary and secondary inpatient units might significantly helphospitals such as MCA to improve their prolonged ED boarding times. In this study, we utilize avariety of analytical and simulation analyses calibrated with hospital data to gain insights into thestructure of such policies as well as their achievable improvement magnitudes. In particular, weseek to answer the following questions:• Structure: When should a patient be kept in the ED until a bed becomes available in his/her
primary inpatient unit instead of being quickly assigned to a secondary unit with current bedavailability?• Magnitude: How much improvement can be achieved if a hospital adopts an effective policy
for dynamically assigning ED admitted patients to their primary or secondary inpatient units?To gain insights and answer these questions, we start by utilizing a Markov decision process
(MDP) and modeling the flow process as a multi-class queueing network problem with “flexible”
2See also, Carr et al. (2010) who report that 17% of the ED total LOS is caused by the ED boarding.

Kilinc, Saghafian, and Traub: Assigning ED Patients to Inpatient Units4
0
20
40
60
80
100
120
140
160
12:0
0 A
M1
:00
AM
2:0
0 A
M3
:00
AM
4:0
0 A
M5
:00
AM
6:00
AM
7:0
0 A
M8
:00
AM
9:0
0 A
M10
:00
AM
11:0
0 A
M12
:00
PM
1:0
0 P
M2:
00 P
M3
:00
PM
4:0
0 P
M5
:00
PM
6:0
0 P
M7
:00
PM
8:0
0 P
M9
:00
PM
10:0
0 P
M11
:00
PM
Ave
rage
ED
Bo
ard
ing
Tim
e(M
inu
tes)
Hour of Bed Request
Pre-Assignment Delay Post-Assignment Delay Total
(a) Average boarding time
0
0.01
0.02
0.03
0.04
0.05
0.06
0.07
0.08
0.09
0.1
12:0
0 A
M1
:00
AM
2:0
0 A
M3:
00 A
M4
:00
AM
5:0
0 A
M6
:00
AM
7:0
0 A
M8
:00
AM
9:0
0 A
M10
:00
AM
11:0
0 A
M12
:00
PM
1:0
0 P
M2
:00
PM
3:00
PM
4:0
0 P
M5
:00
PM
6:0
0 P
M7
:00
PM
8:0
0 P
M9
:00
PM
10:0
0 P
M11
:00
PM
Ave
rage
Rat
e (P
er H
ou
r)
Hour
ED Arrivals Bed Request ED Departures
ED Service Duration
ED Boarding Duration
(b) Non-stationary arrival, bed request, and departure rates
Figure 1 ED boarding times based on collected data from our partner hospital
servers. In this model, the servers are defined as the downstream inpatient unit beds that are “flex-ible,” in that they can serve different classes of patients. The literature on hospital-like multi-classqueueing systems with flexible servers that can address the appropriateness of bed assignmentdecisions is not vast. We contribute to this literature by considering (a) a penalty cost that reflectsthe reduction in service quality when a patient is assigned to a secondary inpatient unit, and (b) riskof adverse events that can occur due to prolonged ED boarding times. By analyzing our MDP set-ting, we find that the optimal assignment policy is a state-dependent threshold-type policy: keepingpatients in the ED for their primary inpatient unit to become available pays off, but only up to acertain threshold that depends on the number and status of outstanding ED bed requests. That is,patience is a virtue, but only up to a point.
Our findings and results regarding the structure of the optimal policy can help hospitals to makebetter bed assignment decisions, particularly as we shed light on some guidelines that can strikea better balance between patient safety, quality of care, and operational efficiency. However, wenote that the optimal policy generated by our model is complex to use in practice, since it is highlydependent upon the system state (e.g., the number of patients of different types boarded in theED). Therefore, based on the properties of the optimal policy, we develop two heuristic policieswhich are simple to implement and effective. We test these heuristic policies by comparing theirperformance with the optimal policy using a detailed patient flow simulation model calibratedwith hospital data. We find that implementing our proposed assignment policy would reduce theaverage ED boarding time by 10 minutes per patient (a 9% improvement). Moreover, our analysissuggests that our proposed policy would improve a combined measure of patient safety and qualityof care metrics by 14%, and would decrease the percentage of patients with more than two hoursof boarding by 2%.

Kilinc, Saghafian, and Traub: Assigning ED Patients to Inpatient Units5
We also use our simulation framework to generate insights into hospital conditions under whichsuch improvements can be most significant. Our results suggest that hospitals with higher con-gestion levels (e.g., busy teaching hospitals) would benefit more than other hospitals (e.g., lessbusy community hospitals) from utilizing our proposed policy as a way to strike a better balancebetween patient safety, quality of care, and operational efficiency. Our results also suggest that,under specific conditions on adverse event rates and number of patients boarded in the ED, keepingan inpatient bed idle for potential future bed requests is beneficial. This practice of intentional bedidling is currently used in some inpatient units such as the ICU. However, our results provide sup-port for implementation across a wider range of inpatient units, and reveal that bed idling shouldbe used more broadly in hospitals.
The main contributions of this paper are four-fold: (1) We generate insights into effective bedassignment policies by developing a model that considers the trade-offs between risk of adverseevents that may occur while a patient is boarded in ED, and a potentially lower quality of carethat might be provided if the patient is routed to a secondary unit. (2) We develop an easy-to-implement and yet effective policy for bed assignment in hospitals that considers multiple inpatientunits, multiple patient types, time-dependent bed request arrivals, and dynamic ED and inpatientunit congestion levels. (3) By making use of some laboratory findings, and testing our proposedbed assignment policy via a detailed simulation model calibrated with hospital data, we generatevarious insights for hospitals. For example, we find that our proposed policy is more effectivein reducing ED boarding times for patients that are less sensitive to assignment to a secondaryinpatient unit. Examples of such patients include those without an elevated serum troponin (Tn)level among chest pain (CP) patients, or those with a B-type natriuretic peptide (BNP) less than4,000 pg/ml among congestive heart failure (CHF) patients. (4) We also shed light on varioushospital-dependent conditions under which our proposed policy is reasonably effective, therebydiscussing the suitability of our proposed policy for implementation in a wide range of hospitals.
The rest of this paper is organized as follows. Section 2 reviews the related studies on patientflow and dynamic assignment policies. Section 3 presents a model of patient flow, and developsan MDP framework that captures the trade-offs in the model. Section 4 identifies the structure ofthe optimal policy. In Section 5, we describe our proposed heuristic bed assignment policy, andcompare its performance with the optimal policy. In Section 6, we describe our detailed simulationmodel of patient flow, and use it to perform various sensitivity analyses. Finally, we present ourconcluding remarks in Section 7. All proofs are provided in Online Appendix A.

Kilinc, Saghafian, and Traub: Assigning ED Patients to Inpatient Units6
2. Literature Review
In this section, we briefly review studies that are related to our work. We divide such studies to twocategories: (a) related studies on ED patient flow, and (b) related studies on dynamic assignmentand routing in queueing systems.
2.1. Related Studies on ED Patient Flow
ED patient flow studies can be found in both the medical and operations research/managementscience literature. Such studies typically focus on patient flow either into the ED, within the ED,or out of the ED. An extensive review of operations research/management science contributions tothese three elements can be found in Saghafian et al. (2015). Our work in this paper focuses onpatient flow out of the ED. Research on this last part of flow includes studies on effective waysfor improving the process for those who are admitted to the hospital through the ED as well asthose discharged to go home. Our study contributes to the former, and hence, we discuss only therelevant studies within that literature.
Harrison et al. (2005) use discrete-event simulation to analyze the effect of bed capacity onoverflow rates. The authors indicate that seasonality of arrivals is one of the main triggers of over-flow in hospitals. Thompson et al. (2009) study a capacity utilization-based patient allocationproblem. In their model, patients may be transferred between different units to minimize the totalcost under a preemptive service policy assumption, where assignment to each unit is accompaniedby a reward/cost. Similar to Thompson et al. (2009), we consider different levels of quality of carethat can be provided in different inpatient units. However, unlike that study, we also model the riskof adverse events (ROAE) that can occur because of prolonged waiting in the ED. This allows us toprovide a system-wide view that, in addition to operational efficiency, considers both patient safetyand quality of care concerns. Another related study is Mandelbaum et al. (2012), which considersthe fair routing of patients to inpatient units, where fair routing means targeting the same levelof idleness among all servers. Unlike Mandelbaum et al. (2012), we consider patient routing asa mechanism to eliminate prolonged ED boarding times. Furthermore, the study of Mandelbaumet al. (2012) analyzes a model with a single customer class, whereas we consider heterogeneouspatient classes in order to gain insights into the questions we raised in the Introduction.
Teow et al. (2012) use data mining techniques to identify factors that trigger overflow decisions.Unlike Teow et al. (2012), our study attempts to identify conditions under which it is optimal tooverflow a patient to a secondary inpatient unit. Shi et al. (2015) focus on patient flow from ED toinpatient units, and propose early discharge policies in inpatients units as a mechanism to reduceand flatten ED boarding times. Our study focuses on a similar patient flow from the ED to inpatientunits; however, unlike the predetermined trigger times in Shi et al. (2015), we (a) optimize bedassignment decisions based on the number of boarded patients in the ED, and (b) consider both

Kilinc, Saghafian, and Traub: Assigning ED Patients to Inpatient Units7
patient safety and quality of care metrics. Furthermore, a policy of changing physician dischargeroutines that is described in Shi et al. (2015) might be hard to implement in many hospitals dueto cultural issues such as difference in physicians’ preferences. Our study offers guidelines onalternative ways of improving the patient flow.
Similar to our study, Griffin (2012) develops a patient flow model to improve bed assignmentby maximizing the suitability of patient assignments and minimizing ED boarding times. Theauthor evaluates five dynamic bed assignment algorithms to aid decision makers. Due to the largedimension of the state and action spaces, Griffin (2012) cannot identify the exact structure of theoptimal assignment policy. In our study, we first gain insights into the structure of the optimalpolicy by using a stylized model of patient flow with two inpatient units and two patient types. Wethen make use of these insights to develop a heuristic policy. Using realistic simulations calibratedwith hospital data, we next examine the performance of this heuristic policy in a realistic setting.This combination of analytical and simulation analyses allows us to fully address the questionswe raised in the Introduction. In addition, instead of assuming that all inpatient units can serve asa potential secondary unit for all patients (as is assumed in the majority of the above-mentionedstudies), we use historical hospital data, laboratory findings, and physicians’ opinion to determinespecific secondary inpatient units for each patient type.
2.2. Related Studies on Dynamic Assignment and Routing in Queueing Systems
Our model captures the system characteristics as a multi-class queueing system where the bedrequests for ED admitted patients are considered as arrivals, and inpatient unit beds are consideredas servers. In multi-class queueing systems, the customers can be differentiated based on servicerates, holding costs, arrival rates, or service requirements. Under an average holding cost objective,Cox and Smith (1961) demonstrate that the widely-used cµ policy is optimal for both preemptiveand non-preemptive cases service protocols. The cµ policy is also shown to be the optimal policyin various more complex queueing networks (see, e.g., Kakalik and Little (1971), Buyukkoc et al.(1985), and Walrand (1988)). A version of the cµ rule, generalized cµ , is proved to be the optimalpolicy for different queueing structures under heavy traffic (see, e.g.,Van Mieghem (1995), Man-delbaum and Stolyar (2004)). Saghafian and Veatch (2016) establish the optimality of the cµ rulefor queueing systems with flexible servers and two tier structures, where one tier is served by oneserver while the second tier can be served by all the servers.In Lin and Kumar (1984), the authors show that when two types of servers with different servicespeeds are available—a setting termed “slow server problem”—the optimal assignment policy isa threshold-type policy: customers/jobs are assigned to the slow server whenever the queue lengthreaches a certain threshold. Our model resembles similar characteristics to the “slow server prob-lem,” because (a) patient service times in inpatient units are not identical, and (b) there is some

Kilinc, Saghafian, and Traub: Assigning ED Patients to Inpatient Units8
flexibility in assignments (for some patients). However, instead of heterogeneous servers, we con-sider heterogeneous patient types with different service rates, since it better matches the hospitalpatient flow we study. This differentiates our study from the above-mentioned studies in the litera-ture since in such studies the resulted optimal policy typically depends on the difference betweenservice rates of servers (see, e.g., Bell and Williams (2001)). However, our data analysis showsthat service durations in primary and secondary units are not statistically different (for patients ofthe same type).
Dynamic assignment problems in queueing networks are extensively analyzed in the literature(see, e.g., Mandelbaum et al. (2012), Meyn (2001, 2003), and Palmer and Mitrani (2004)).Armony and Bambos (2003) and Dai and Lin (2005) study dynamic assignment problems consid-ering a throughput maximization objective. Andradottir et al. (2007) and Saghafian et al. (2011)allow for server disruptions and repairs in systems with heterogeneous flexible servers, and DeVericourt and Zhou (2005) study a call center setting where agents are heterogeneous in terms ofboth service rate and quality of service (see also Zhan and Ward (2013)). Another related stream ofliterature that considers flexible servers is the “skill-based routing” literature, where the customersare routed to the servers that have the appropriate skill sets (similar to the routing of patients toprimary vs. secondary units in our study). However, unlike our work, the focus of those studies aremostly on settings where (a) servers have multiple skills (e.g., call center agents), and (b) staffingdecisions are the primary concerns (see, e.g., Garnett and Mandelbaum (2000), Gans et al. (2003),Wallace and Whitt (2005)). There are also various other studies on routing policies in multi-server,multi-class settings (see, e.g., Gurvich and Whitt (2009), Tezcan and Dai (2010), Armony andWard (2010), Gurvich and Perry (2012)). However, in these studies only costs related to waitingand losing customers are considered, whereas we focus on the trade-off between waiting and over-flows. Moreover, we note that the majority of the above-mentioned studies focus on heavy trafficsettings. Unlike them, we seek to address the questions we raised in the Introduction under prac-tical hospital congestion levels. To this end, we do not impose any heavy traffic assumption, andinstead make use of actual hospital bed census data as the basis of our analytical and simulationanalysis.
3. The Model
A general representation of patient flow through the ED and hospital inpatient wards (IWs) is pre-sented in Figure 2. A patient that arrives to the ED goes through the triage stage, and is assignedan Emergency Severity Index (ESI). If there is an examination room available, the patient imme-diately starts the ED service; otherwise, he/she will have to wait in a designated ED waiting area.Once the ED treatment is done, the patient is either discharged home or is admitted to the hospital.For an admitted patient, if there is a bed available in his/her primary IW (or the secondary IW if

Kilinc, Saghafian, and Traub: Assigning ED Patients to Inpatient Units9
applicable), the patient is transferred out of the ED; otherwise, he/she is kept in the ED until a bedbecomes available. For the goals of this study, we focus on the patient flow within the dashed areaof Figure 2.3
To gain insights into the questions we raised in the Introduction, we start by modeling the patientflow as a multi-class queueing system with IWs as flexible servers, and analyze it by using anMDP. The patients in the system are classified based on their primary IW, i.e., where they canbe best served from a medical standpoint. Ward-level placement is typically determined by a bedplacement coordinator, sometimes in consultation with the ED or the admitting physician. Once apatient is moved to an IW, the IW bed is considered as unavailable until the patient is done withthe inpatient unit service, and hence, the service processes in IWs are typically non-preemptive. Togain some high level insights, we start by considering each of the IWs as a single “super server,”which represents the capacity of the IW as a whole. This pooling of beds within each IW allows usto keep track of availability of capacity in IWs in a computationally tractable way. However, to testthe insights we gain from this simplifying assumption, we relax it in Section 6, and consider eachIW bed as a server. Similarly, we start by considering the arrival process as a stationary PoissonProcess, and assume IW service times are exponential. In Section 6, we also relax these simplifyingassumptions by using empirical distributions (for both interarrival and service times) that we haveestimated based on our data.
Figure 3 illustrates the patient flow under consideration as a queueing system. Our discussionswith medical providers revealed that, for the vast majority of patients, only one IW can be con-sidered as a secondary IW.4 Hence, as illustrated in Figure 3, the system consists of multipleprimary-secondary pairs, where each patient type has only one primary IW and only one secondaryIW.
To analyze the patient flow depicted in Figure 3, we let Np and Ns denote the set of patient classesand servers (IWs), respectively. Also, for i ∈ Np, we denote by λi the arrival (i.e., bed request)rate of class i patients. We model the service process in IWs with class-dependent service rates µi
where i ∈ Np. We also let Xi(t) denote the number of class i patients boarded in the ED at time t,and define X(t) = (Xi(t) : i ∈ Np) as the vector of the number of all such patients. Moreover, fori ∈ Np and j ∈ Ns, we let ai j(t) = 1 if IW j is serving a class i patient at time t, and ai j(t) = 0otherwise. Also, we let θi denote the per unit of time risk of adverse events that can occur for aclass i patient because of boarding in the ED, denote by ci the associated cost per adverse event,
3Thus, we do not consider measures related to events that occur outside this flow. For instance, an important measures for EDsis the percentage of patients who leave without being seen. But this occurs mainly from the waiting room of EDs (i.e., before theED service starts).
4We also note that some patients can only be served in their primary unit (e.g., ICU patients). We still consider a primary-secondary pair for such patients, but disallow for service in the secondary IW by considering a high penalty cost for care deliveryin the secondary IW.

Kilinc, Saghafian, and Traub: Assigning ED Patients to Inpatient Units10
ED Arrival Triage ED Waiting ED Service
Discharge
Admission
IW 1
IW 2
IW N
Figure 2 General flow of patients with the dotted area representing the focus of this paper (IW: Inpatient Ward)
define θi = ciθi, and let θ = (θi : i ∈ Np). In this setting, θi plays the role of “holding cost” for apatient of class i, and is accrued per unit of time boarding in the ED. Similarly, we let pi j denote anon-negative penalty that is accrued due to a lower-than-desired quality of care when a patient ofclass i is assigned to IW j (pi j = 0 if i = j).5
The objective is to find an optimal assignment policy to control the patient flow in order tominimize the total long-run average sum of (a) adverse events (a patient safety concern), and (b) thepenalties accrued due to placement in secondary units (a quality of care concern). 6 This optimalobjective can be calculated as:
Z∗ = infπ∈Π
Zπ = infπ∈Π
[∑
i∈Np
∑j∈Ns
pi jOπi j + ∑
i∈Np
θiLπi
], (1)
where Π is the set of admissible (non-preemptive, non-collaborative, and non-anticipative7) poli-cies, Zπ is the long-run average objective under policy π ∈ Π, Lπ
i denotes the long-run averagenumber of class i patients in the queue (i.e., boarded in the ED) under policy π ∈ Π, and Oπ
i j
denotes the long-run average number of class i patients overflowed to IW j under policy π ∈Π. Inthis setting:
Lπi = limsup
T→∞
1T
∫ T
0E [Xπ
i (s)]ds, (2)
Oπi j = limsup
T→∞
Aπi j(T )
T, (3)
5In Section 6, we will discuss how we have used a year of data on patients with chest pain (CP) or congestive heart failure(CHF) to estimate all the parameters required for our model.
6We may refer to these as “costs” for simplicity. However, it should be noted that these are general, and may include variousnegative consequences of undesirable outcomes with respect to patient safety and/or quality of care caused by patient flow decisions.We refer interested readers to empirical studies such as Kuntz et al. (2014), Berry et al. (2016), Chan et al. (2016)), and thereferences therein for further examples of such outcomes.
7The reason we focus on non-anticipative policies is that even when the providers have a rough estimate on the discharge timesof their patients, the exact discharge time is unknown and can be affected by several factors. Similarly, the exact timing of futurebed requests are not known.

Kilinc, Saghafian, and Traub: Assigning ED Patients to Inpatient Units11
ED Beds
ED Discharge
θ1
θ2
θN
λ1
λN
IW1
IW2
IW1
IWN
IW1
µ1
µ2
µ2
µN
p21
p12
IW Discharge
ED Boarding
µ1
λ2
p1
Figure 3 A queueing representation of the patient flow
where Aπi j(T ) is the cumulative number of times up to time T that IW j has been assigned to a class
i patient under policy π ∈Π (i.e., a counting process associated with ai j(t) = 1).
3.1. A Markov Decision Process Formulation
As mentioned earlier, our partner hospital has eight main IWs (see Table 1), and hence, |Np| =|Ns| = 8. However, as noted earlier, because each patient type has only one primary and one sec-ondary IW, the hospital can be viewed as multiple primary-secondary IW pairs. Hence, we expectthe insights generated by focusing on a single primary-secondary pair to be useful for the wholehospital system. For this reason, and to gain some clear insights into effective patient flow con-trol policies, we start by considering the simplest case where Np = Ns = {1,2}, and later test theinsights gained via simulations for a larger system. We let a1 =(a11,a21) and a2 =(a12,a22), whereai j = 1 if server j is busy with a patient of class i. We assume that all the underlying processes arememoryless, and require that at any point in time ∑i∈Np ai j ≤ 1 (∀ j ∈ Ns). With these, we definethe system state as X = (X ,a1,a2) with state space S = Z
2+×{0,1}2×{0,1}2. 8 We then use uni-
formization to transfer the underlying continuous-time Markov chain (CTMC) to a discrete-timeMarkov chain (DTMC). Let ψ = λ1 +λ2 +2max{µ1,µ2} be the uniformization factor. Then, thelong-run average cost optimality equation for the DTMC can be written as:
J(X)+ Z∗ =1ψ
[θ XT + min
u=ui j∈U (X)
{∑
i∈Np
∑j∈Ns
λiTui jJ(X + ei,a j)
+ ∑i∈Np
∑j∈Ns
∑k∈Np
ak jµkT ui jJ(X ,a j− ek)
+
(ψ− ∑
i∈Np
λi− ∑k∈Np
∑j∈Ns
ak jµk
)J(X)
}], (4)
8Since we do not allow preemptions to better reflect the actual practice, it is necessary to keep track of the IWs’ availabilities(a1,a2) as a part of the state.

Kilinc, Saghafian, and Traub: Assigning ED Patients to Inpatient Units12
where J(X) is a relative cost function defined as the difference between the total expected cost ofstarting from state X and a reference state (state 0), Z∗ is the optimal average cost per uniformizedperiod, the notation “T ” represents the transpose operator, and T ui j is a functional operator thatdepends on action vector ui j. In optimality equation (4), ei is a vector with the same dimensionsas X containing a one in the ith position and zeros elsewhere. Thus, the first line inside the mini-mization in (4) is due to inpatient bed request arrivals from the ED, which occur with rate λi forpatients of class i. Similarly, the second line in (4) is due to discharges of patients from IWs, andthe last line in (4) is due to the self-loop in the underlying DTMC. The control actions ui j in (4)are taken so as to minimize the long-run average cost, where the set of admissible actions is:
U (X) =
{u = (ui j)i∈Np, j∈Ns s.t. : ui j ∈ {0,1},∑i∈Np ui j ≤ (1−∑i∈Np ai j) ∀ j ∈ Ns,∑ j∈Ns ui j ≤ Xi ∀i ∈ Np
}. (5)
That is, a patient cannot be assigned to IW j, if IW j is busy or if the number of patients boardedin the ED is insufficient.
4. The Optimal Patient-IW Assignment Policy
In Online Appendix A, we show that we can restrict our attention to policies that do not allowidling an IW j ∈ Ns when there is a patient with IW j as his/her primary IW boarded in ED (SeeProposition EC.1 in Online Appendix A).9 Although this is an expected result in service systems inwhich preemption is allowed, we note that in non-preemptive services such as the one we model,this insight can be counter intuitive. To establish this non-idling result under our non-preemptiveassumption, we first demonstrate a monotonicity property in in Online Appendix A (see, LemmaEC.1). Here, we seek to answer the questions we raised in the Introduction, and generate insightsinto conditions under which patients should be forced to wait in the ED until a bed in their primaryinpatient unit becomes available (rather than being transferred to a secondary unit with current bedavailability). We start by establishing the following result, which states the optimality of a cµ-typepriority rule.
PROPOSITION 1 (Optimality of a cµ-type Priority). If pi j = 0 for all i ∈ Np and j ∈ Ns, it is
optimal for each IW to give strict priority to the patient class that has the highest θiµi except to
avoid idling, regardless of the status or allocation of other IW.
Proposition 1 implies that inpatient units should give strict priority to serving the patient classwith the highest θ µ value, when reduction in quality of care is not a main concern, or when thedifferences in service qualities between primarily and second inpatient units is negligible. Labelingthe class with the highest value of θ µ as Class 1, this means that, in order to merely minimize therisk of adverse events, IWs should always prioritize serving Class 1 patients when at least one such
9Note that this result is only on idling when a primary patient exists, and does not mean idling IW beds cannot be optimal ingeneral (see, e.g., Theorem 1).

Kilinc, Saghafian, and Traub: Assigning ED Patients to Inpatient Units13
patient is boarded in the ED and the inpatient unit has some available capacity. The implication ofProposition 1 for a hospital bed manager is as follows. If there is a Class 1 patient boarded in EDthat is not expected to experience a reduction in quality of care from an alternative IW assignment,the bed manager should prioritize assigning him/her to a bed as soon as one becomes available ineither his/her primary or secondary IW: patience is not a virtue in this case.
But what if in addition to the risk of adverse events (a patient safety concern), the manager isalso concerned about the quality of care? Our numerical results suggest that the optimal policy insuch a situation is a state-dependent threshold-type policy, where the threshold is on the number ofpatients boarded in the ED. We will discuss this in detail in the remainder of this section. However,to gain some initial analytical insights, we first focus on the patient flow to IW 1. This allows usshow that when we introduce non-zero overflow penalty costs in our model, the primary unit ofClass 1 patients (IW 1) prioritizes Class 1 patients under the optimal policy whenever it has someavailable capacity, and idles when X2 < X2 where X2 is a threshold level. Thus, Class 2 patientsshould be kept boarded in the ED rather than being overflowed to IW 1 when X2 < X2. Hence, inthis case, we find that patience is a virtue, but only up to a point.
THEOREM 1 (Threshold-Based Idling). There exists an optimal stationary policy which is of a
threshold type: IW 1 (i) serves its secondary patients when the number of such patients boarded
in the ED reaches a state-dependent threshold level and has no primary patient boarded in the
ED, (ii) serves its primary patients whenever such patients are boarded in the ED, and (iii) idles
otherwise.
As is specified in Theorem 1, it is optimal to idle IW 1 when there is no Class 1 patient availableand the number of Class 2 patients waiting for an inpatient bed is below a threshold level. This isdue the non-zero overflow penalty, which represent the reduction in quality of care when a patientis assigned to a secondary unit. In fact, when pi j is high enough, the optimal policy idles IWj whenever it does not have any primary patient boarded in the ED. For non-extreme overflowpenalty cases, when IW 1 does not have a primary patient boarded in the ED, it first idles until thenumber of Class 2 patients boarded in the ED reaches a certain level, then prioritize Class 2 patientsuntil either a Class 1 patient starts to board in the ED, or the number of Class 2 patients falls belowthe threshold. For hospital bed managers, Theorem 1 implies that when a bed becomes available inIW 1, Class 1 patients should be assigned to that IW if there are Class 1 patients boarded in the ED.Otherwise, Class 2 patients should be assigned to IW 1, but only if the number of Class 2 patientsboarded in the ED is higher than a certain level. This result is important, because it sheds light onthe fact that an IW 1 bed can be left idle under the optimal policy depending on the congestion levelof the ED. By idling such a bed and asking Class 2 patients to continue boarding in the ED, thehospital bed manager can avoid a potential reduction in quality of care, and also prevent a future

Kilinc, Saghafian, and Traub: Assigning ED Patients to Inpatient Units14
arriving Class 1 patient from prolonged ED boarding, which in turn may have significant patientsafety related consequences.
4.1. Patient Flow to IW 2
To gain further insights into the structure of effective patient-IW assignment policies, we now turnour attention to IW 2, and consider the simplified model illustrated in Figure 4. Recall that IW 2 isthe primary IW for Class 2 patients, and the secondary IW for Class 1 patients, where we labeledclasses (without loss of generality) such that θ1µ1 ≥ θ2µ2. Thus, IW 2 prefers to serve Class 1with respect to the θ µ index, but Class 2 with respect to the overflow penalty. As we will see,understanding the main trade-offs in this simplified model is essential for answering the questionswe raised in the Introduction.
We further simplify our analysis here by assuming that the service process is preemptive.10 Thisallows us to consider Y = (Y1,Y2) as the system’s state, where Yi represents the number of Class i
patients in the system, the state space is S = Z2+, and the set of admissible actions is:
U (Y ) =
{u = (ui2)i∈{1,2} s.t. : ui2 ∈ {0,1},ui2 ≤ Yi, ∑
i∈{1,2}ui2 ≤ 1 ∀i ∈ {1,2}
}. (6)
Since the optimal policy and performance under long-run average setting can be obtained by usinglimit arguments over the infinite-horizon (see, e.g., Sennott (1999)), we start by considering thesystem in infinite horizon. The infinite-horizon optimality equation for this simplified model canbe written as:
J(Y ) = θ Y T +β minu∈U (Y )
{∑
i∈{1,2}λi J(Y + ei)
+ ∑i∈{1,2}
µiui2 (pi2 + J(Y − ei))+
(1−Λ− ∑
i∈{1,2}µiui2
)J(Y )
}, (7)
where β is the discount factor per uniformized period, the overflow penalty costs p12 and p22
are scaled so that p22 = 0, and the vector θ is scaled so that θ Y T represents the expected costper uniformized period when the system is at state Y . Moreover, in (7), the uniformization rate
is ψ = λ1 + λ2 +max{µ1,µ2}, where µi =µi
ψ, λi =
λi
ψ, and Λ = λ1 + λ2. Next, we define the
functional operators Ta,Tu and T∗ (see, e.g, Saghafian and Veatch (2016) for the use of similaroperators in a different queueing structure) as:
Tθ J(Y ) = θ Y T , (8)
TaJ(Y ) = ∑i∈{1,2}
λi J(Y + ei), (9)
10We realize that allowing service preemption is not fully realistic; however, this assumption is useful for tractability and forgaining sharp insights. We relax this assumption in Section 6, and utilize real-world data along with simulation analyses to verifythe insights gained.

Kilinc, Saghafian, and Traub: Assigning ED Patients to Inpatient Units15
Class 1
IW 2
Class 2
ED Boarding IW Discharge
θ1
θ2
µ2
µ1
p12
Figure 4 A queueing representation of the simplified system
TuJ(Y ) = ∑i∈{1,2}
µiui2 (pi2 + J(Y − ei)) ,
(1−Λ− ∑
i∈{1,2}µiui2
)J(Y ),
= (1−Λ)J(Y )− ∑i∈{1,2}
µiui2 (∆iJ(Y − ei)− pi2) , (10)
T∗J(Y ) = minu∈U (Y )
TuJ(Y ), (11)
T J(Y ) = Tθ J(Y )+β (TaJ(Y )+T∗J(Y )) , (12)where ∆iJ(Y ) = J(Y + ei)− J(Y ). Using these functional operators, we can simply write theinfinite-horizon optimality equation (7) as
J(Y ) = T J(Y ). (13)The average cost and finite-horizon cost equations can be obtained in a similar manner. Specifi-cally, the finite-horizon cost satisfies Jn+1(Y ) = T Jn(Y ), and the average cost can be calculated aslimβ→1−(1−β )J(Y ) (see, e.g., Sennott (1999) Corollary 7.5.10 for further discussion).
Using the above-mentioned setting, we next consider the following two properties(i) µ1∆1J(Y )−µ2∆2J(Y + e1− e2)≥ µ1∆1J(Y − e1)−µ2∆2J(Y − e2) for all Y ≥ (1,1), (14)
(ii) µ1∆1J(Y − e1)−µ2∆2J(Y − e2)≥ µ1∆1J(Y + e2− e1)−µ2∆2J(Y ) for all Y ≥ (1,1). (15)Property (i) implies that assigning Class 1 patients to IW 2 becomes more desirable as the numberof boarded Class 1 patients increases, and property (ii) implies that assigning Class 2 patients toIW 2 becomes more desirable as the number of boarded Class 2 patients increases. Let F be theset of real-valued functions defined on S = Z
2+ such that if F ∈ F then F satisfies properties
(14)-(15). The following lemma shows that, if θ1µ1 ≥ θ2µ2, the functional operator T defined in(12) preserves properties (14)-(15).
LEMMA 1 (Preservation). If θ1µ1 ≥ θ2µ2 and J ∈F , then T J ∈F .
Utilizing Lemma 1, we can establish the following result.
THEOREM 2 (Optimality of a Threshold-Type Policy). If θ1µ1 ≥ θ2µ2, then the optimal policy
obtained from (7) is of a threshold type: IW 2 should prioritize its primary patients until the number
of Class 1 patients boarded in the ED reaches a threshold that depends on the number of Class 2
patients still waiting for a bed assignment.
Kilinc, Saghafian, and Traub: Assigning ED Patients to Inpatient Units16
The optimal policy described in Theorem 2 is a threshold-based “primary-then-cµ” rule: IW 2serves its primary patients up to a point, and switches to the cµ rule (θ µ in our notation) after-wards. Note that when p12 = 0, the optimal assignment policy is the well-known cµ rule (see,e.g., Buyukkoc et al. (1985) and Saghafian and Veatch (2016)), because the threshold becomeszero. However, when we consider a non-zero penalty cost in the model, under the optimal policy,IW 2 first serves its primary patients until the marginal benefit of serving a primary patient versusa secondary one reaches the value of the penalty that might be accrued due to the reduction inquality of care. This suggests that, when the number of boarded patients is low, EDs should try tomatch their patients with their primary units to ensure the highest quality of care. However, oncethe number of boarded patients passes a specific threshold, the focus should shift from concernsabout decrements in quality of care to concerns about the risk of adverse events that can occur dueto prolonged boarding. Thus, we again observe that patience (for a primary unit assignment) is a
virtue, but only up to a point.
Hospital bed managers can use our results in various ways when deciding on which patient classto assign to an IW 2 bed that has just become available. For instance, when a bed becomes availablein IW 2, and they do no expect any near-term bed availability in IW 1, Theorem 2 suggests that bedmanagers should consider the number of both Class 1 and 2 patients boarded in ED and prioritizethe primary patient type (Class 2) until the number of Class 1 patients boarded in ED reaches acertain level. From then on, they should start prioritizing Class 1 patients until the number of Class1 patients boarded in ED drops below that certain level. However, the bed manager should be awarethat this level is highly dependent on the number of patients from both classes in the ED as wellas estimation of parameters related to (a) reduction in quality of care when a secondary inpatientunit is used (pi j), (b) risk of adverse events for both classes (θi), and (c) average length of stay forboth classes ( 1
µi). Thus, the decision should be made in a careful way and only after performing
sensitivity analysis. To further assist hospital bed managers in making such decisions, we utilizethe insights we gained from analyzing the optimal policy, and develop effective bed assignmentheuristics in the next section. We then use a variety of simulation experiments calibrated withhospital data that we have collected to evaluate their effectiveness under realistic conditions, andgenerate more insights for hospital administrators via sensitivity analyses.
5. Heuristic Policies
When we consider non-preemptive service policies (which better represent the current practice inmost hospitals) under the general system structure discussed in Section 3, our numerical compu-tations show that the optimal policy is complex: it has a state-dependent threshold that dependson all the elements in the system state, including IW bed availabilities. Our numerical results alsoshow that the optimal policy has a structure similar to the optimal control of the “N” structure

Kilinc, Saghafian, and Traub: Assigning ED Patients to Inpatient Units17
queueing network, where one server works as a shared server while the other works as a dedicated
server. That is, the primary unit of Class 1 patients (IW 1) typically prioritizes its primary patients(i.e., works as a dedicated unit whenever its queue of boarded patients is not empty), and primaryunit of Class 2 patients (IW 2) typically first serves its primary patients until the number of Class1 patients boarded in ED exceeds a threshold, then helps IW 1 by serving Class 1 patients (seeOnline Appendix A for some numerical experiments supporting this observation). In what follows,we take advantage of this (and our other findings) to develop easy-to-implement heuristic policiesfor use in hospitals.
5.1. A Birth-and-Death Process to Approximate the Optimal Threshold
To develop a heuristic that is easy to implement, we start by considering the optimal policy of an“N” queueing network by assuming that IW 2 can serve patients from both types (a shared server)while IW 1 can only serve Class 1 patients (a dedicated server). We use a birth-and-death processfor this system to estimate the optimal threshold level on the number of Class 1 patients boarded inthe ED above which IW 2 starts helping IW 1 by serving Class 1 patients. In particular, assumingthat the threshold level is some number T , we can approximate the Class 1 queueing dynamics viathe birth-and-death process depicted in Figure EC.4 (see Online Appendix F). When the numberof patients in the Class 1 queue, X1, is smaller than the threshold level, only IW 1 will serve Class1 patients which will occur with rate µ1. However, when X1 is larger than the threshold, both IW 1and IW 2 will serve Class 1 patients, and hence, the death rate becomes 2µ1.
We use a separate birth-and-death process to approximate the dynamics for Class 2 patients(see Figure EC.5 in Online Appendix F). Let P2(T ) be the steady-state fraction of time that IW 2serves Class 2 patients. Then, the service rate for Class 2 patients is P2(T )µ2. Let L1(T ) and L2(T )
denote the long-run average queue length (i.e., number of patients boarded in the ED) of Class 1and Class 2 patients, respectively. Assuming that O1(T ) denotes the average number of Class 1patients served by IW 2, and Z(T ) denotes the long-run average system cost under threshold levelT , we can calculate Z(T ) as:
Z(T ) = θ1L1(T )+θ2L2(T )+ p12O1(T ). (16)The objective is to find the value of T that minimizes Z(T ). To calculate (16), we use the above-mentioned birth-and-death processes to estimate L1(T ), L2(T ), and O1(T ). To this end, we firstneed to obtain the steady-state probability P j
i which is the probability that the length of queuej ∈ {1,2} equals to i≥ 0. From the balance equations, we have:
P1i = (
λ1
µ1)iP1
0 ∀ i≤ T, (17)
P1i = (
λ1
µ1)T (
λ1
2µ1)i−T P1
0 , ∀ i > T. (18)

Kilinc, Saghafian, and Traub: Assigning ED Patients to Inpatient Units18
By using the fact that these probabilities must sum to 1, we find P10 as:
P10 (T ) =
(1−ρ1)(1−ρ2)
ρT1 (ρ2−ρ1)+(1−ρ2)
, (19)
where ρ1 =λ1
µ1and ρ2 =
λ1
2µ1. By using these probabilities, we can obtain the average queue length
for Class 1 patients, L1(T ):
L1(T ) =T
∑i=0
iρ i1P1
0 (T )+∞
∑i=T+1
iρT1 ρ
i−T2 P1
0 (T ). (20)
Also, O1(T ) = 12 ∑
∞i=T+1 iρT
1 ρi−T2 P1
0 (T ) by assuming that Class 1 patients in the queue will beserved equally by IW 1 and IW 2 after the number of Class 1 patients boarded in ED reaches thethreshold.11 To calculate the average queue length of Class 2 patients, L2(T ), we first calculate thefollowing:
P2(T ) = P(x1 ≤ T ) = P10 (T )
1−ρT+11
1−ρ1. (21)
The average queue length for Class 2 patients is then:
L2(T ) =λ2
P2(T )µ2−λ2. (22)
These allow us to calculate Z(T ) via (16), and find the optimal threshold value T ∗ =
argminT≥0 Z(T ). However, the threshold level T ∗ does not have a closed-form solution, and thefunction Z(T ) can be non-convex in general. Nevertheless, we can utilize numerical approaches(e.g., bisection search) to find the value that minimizes (16). We term the heuristic policy thatcontrols the patient flow based on this threshold as the birth-and-death threshold (BDT) policy.
5.2. Penalty-Adjusted Largest Expected Workload Cost Policy (LEWC-p)
Our results in Section 4 reveal that that there exists a threshold type optimal policy that optimizesperformance by following the primary-then-cµ rule (see, e.g., Theorem 2). This policy tends toserve the primary patient type with the lower cµ value until the cost differences of serving the sec-ondary patients exceeds the overflow penalty cost (see the discussion in Online Appendix A, proofof Lemma 1). This insight suggests that instead of using a heuristic policy to directly approximatethe threshold—the idea behind the BDT policy—there might be value in following a heuristic thatbalances the costs associated with different queues. Thus, as our second heuristics, we develop amodified version of the Largest Expected Workload Cost (LEWC) policy proposed by Saghafianet al. (2011) for general parallel queueing systems. The LEWC policy dynamically balances theexpected workload cost of queues by prioritizing the queue with the largest expected workloadcost (ROAE in our setting).12 In order to also incorporate the additional penalty cost of serving
11This is not a strong assumption, because the service rates are patient class dependent not IW dependent.12LEWC is a dynamic policy, because it prescribes different actions based on the system state.

Kilinc, Saghafian, and Traub: Assigning ED Patients to Inpatient Units19
patients in their secondary IW—a main factor for the patient flow focus of this study— we proposea penalty-adjusted version of LEWC, which we term LEWC-p. To this end, similar to Saghafian etal. (2011), we first use the following Linear Program (LP). In this LP, the objective is to find theoptimal server allocations to maximize the minimum percentage excess capacity among all patienttypes:
Max τ (23)
Subject to:
∑j∈Ns
yi jµi ≥ λi(1+ τ) ∀i ∈ Np, (24)
∑i∈Np
yi j ≤ 1 ∀ j ∈ Ns, (25)
yi j ≥ 0 ∀i ∈ Np,∀ j ∈ Ns. (26)In this LP, yi j is the decision variable that represents the long-run proportion of time that IW j
serves patient class i. Constraint (24) ensures that the objective function maximize the minimumexcess capacity among all patient classes. Constraint (25) guarantees that the total proportion oftime for each IW does not exceed 1, and Constraint (26) enforces the proportions to be non-negative.
Next, when a bed in IW j becomes available, we calculate an index, Ii j(xi), for each queue i∈Np
(class of patients boarded in the ED) to approximate the penalty-adjusted expected workload costof that queue given that its current length is xi:
Ii j(xi) =θixi
∑ j∈Ns y∗i jµi− pi j
xiy∗i j
∑ j∈Ns y∗i j, (27)
where y∗i j’s are the solution to LP (23)-(26). The first part of the index approximates the costassociated with risk of adverse events for class i patients: since there are xi patients in the queue, itwill take approximately xi
∑ j∈Ns y∗i jµiunits of time to serve them, and the cost due to adverse events is
θi per unit of time per patient boarded. The second part of the index approximates the associatedpenalty cost. In this term,
y∗i j∑ j∈Ns y∗i j
represents the proportion of patients of class i served by IW j.13
With these, the penalty-adjusted LEWC policy (LEWC-p) is as follows:Step 1. Solve LP (23)-(26) to derive optimal allocations y∗i j.Step 2. Whenever a patient arrives or IW j becomes available, compute indices Ii j(xi) for all
patient classes (i∈Np), then assign the bed to patient class k = argmaxi∈Np Ii j(xi). If theprimary and secondary queues of IW j have the same index, break the tie by assigning
13In using (27), we assume that LP (23)-(26) has a unique optimal solution with y∗i j 6= 0 whenever i 6= j. For systems in which
this solution is not unique (e.g., balanced systems whereλi
µi= κ, ∀i ∈ Np) ties need to be broken based on cost parameters.

Kilinc, Saghafian, and Traub: Assigning ED Patients to Inpatient Units20
the bed to the primary queue. If the primary queue of IW j is empty, and its secondaryqueue has a negative index, keep the bed in IW j idle.
5.3. Comparison of the Proposed Heuristic Policies
We now compare the performance of the proposed BDT and LEWC-p heuristic policies with theoptimal policy. As a benchmark, we also use the generalized cµ (Gcµ) rule. Under the Gcµ policy,the available bed in IW j is assigned to the class that has the highest θiµixi value. We use thispolicy as a benchmark since it (a) takes the queue lengths into account, and (b) is known to workwell in a variety of queueing systems.14
To compare these policies (BDT, LEWC-p, and Gcµ), we create a large test suite which coversvarious combinations of parameters (e.g., costs associated with risk of adverse events and reduc-tion in quality of care, arrival rates, service rates, etc.). Tables EC.4-EC.7 in Online Appendix Bsummarize the parameter combinations in this test suite, which generate a total of 216 probleminstances. To find the optimal policy for each problem instance, we use the well-known value-iteration algorithm to solve our MDP formulation. This allows us to report optimality gaps for eachof the policies under consideration.
Figure 5 illustrates our computational results over the test suite by constructing the empiricalCumulative Distribution Function (CDF) for the percentage optimality gap of each of the non-optimal policies (BDT, LEWC-p, and Gcµ). The results presented in this figure show that LEWC-pand BDT policies can both be considered as “nearly-optimal” policies. However, the mean andstandard deviation of LEWC-p optimality gap is smaller than that of the BDT policy, so we canconclude that it is the better policy. The performance of Gcµ is, however, significantly worse thanboth the LEWC-p and BDT policies. This is mainly because Gcµ does not consider penaltiesassociated with secondary unit assignments. However, even when the underlying penalty parameteris zero, we observe that Gcµ is not the best policy for all cases. When the penalty parameter iszero, both of the proposed heuristic policies (BDT and LEWC-p) perform close to each other whileBDT performs slightly better due to the assumption that IW 1 only serves Class 1 patients (underthe cµ policy both of the IWs serve Class 1 whenever feasible).
Table 2 compares the optimality gap of LEWC-p, BDT, and Gcµ policies for various congestionlevels in the system. All of the policies show a smaller mean optimality gap in moderate to highcongestion levels than in the low congestion level. This observation suggests that implementingthem in crowded systems (e.g., in busy teaching hospitals) is better than doing so in less crowdedsystems (e.g., in less busy urban hospitals). Finally, Table 3 compares the policies based on various
14This is especially the case in system with quadratic holding costs and in systems that face heavy traffic. Our system does notmeet ant of these conditions. However, we still use the optimality gap of the (Gcµ) rule to better gage the optimality gap of ourproposed heuristics.

Kilinc, Saghafian, and Traub: Assigning ED Patients to Inpatient Units21
0
0.2
0.4
0.6
0.8
1
CD
F o
f O
pti
mal
ity
Gap
Optimality Gap (%)
LEWC-p BDT GCµ
Optimality Gap
Policy Mean Std.Dev. Min Max
LEWC-p 6.19% 3.94% 0.00% 16.54%
BDT 7.97% 4.17% 0.00% 28.38%
GCµ 13.41% 4.64% 0.44% 34.25%
Figure 5 Performance of LEWC-p, BDT, and Gcµ relative to the optimal policy over the entire test suite (216 problem
instances)
penalty parameter settings and shows that all policies perform best when the underlying penaltyparameter is high. Moreover, LEWC-p is more robust than the BDT policy to changes in the penaltyparameter. This is intuitive, since the BDT policy only uses one threshold level, while the LEWC-ppolicy dynamically adjusts the assignments based on the number of patients of different classesthat are boarded in the ED.
6. Simulation Analysis Using Hospital Data
To gain more insights into effective policies for assigning ED patients to their primary or sec-ondary inpatient units, we use a discrete-event simulation model of ED patient flow, and calibrateit with a year of hospital data collected from our partner hospital. This enables us to relax some ofthe assumptions we made earlier (e.g., exponential service times, Poisson arrivals, etc.), and alsoshed light on the magnitude of achievable benefits for EDs as well as hospital conditions underwhich our proposed assignment policy (LEWC-p) will work well. To this end, we first describe theadmission sources in our partner hospital. We then describe the arrival process from such sources.Finally, we discuss the service process as well as the empirical length of stay (LOS) distributionswe have estimated from our data set.
6.1. Patient Flow and IWs in Our Partner Hospital
Admission Sources. Patients are admitted to IWs from three main sources. We categorize admittedpatients based on their source of admission in three groups: ED admits, direct admits, and Oper-
ating Room (OR) admits. ED admits are patients who finish their treatment with ED and receivean admit decision from an ED physician. Direct admits are the ones directly admitted to an IW

Kilinc, Saghafian, and Traub: Assigning ED Patients to Inpatient Units22
Table 2 Optimality gap of policies for various congestion levelsCongestion Level Policy Mean Min Max
Low: ρ ≤ 0.5LEWC-p 7.01 % 0.00 % 14.03 %
BDT 8.66 % 0.00 % 28.38 %Gcµ 16.90 % 11.90 % 34.25 %
Moderate: ρ = 0.7LEWC-p 5.83 % 1.29 % 16.54 %
BDT 8.34 % 2.61% 15.47 %Gcµ 13.47 % 8.66 % 17.17 %
High: ρ ≥ 0.9LEWC-p 5.68 % 1.74 % 9.20 %
BDT 7.07 % 3.82 % 14.42 %Gcµ 10.49 % 0.09 % 15.28 %
Table 3 Optimality gap of policies for various penalty costsPenalty Cost Policy Mean Min Max
Low: p12 = p21=1LEWC-p 7.02 % 1.29 % 16.54 %
BDT 9.87 % 6.00 % 28.38%Gcµ 14.37 % 8.85 % 21.78 %
Moderate: p12 = p21=10LEWC-p 5.82 % 0.00 % 15.06 %
BDT 6.17 % 0.00% 15.73 %Gcµ 12.92 % 0.09 % 22.40 %
High: p12 = p21=100LEWC-p 4.68 % 0.00 % 13.24 %
BDT 4.68 % 0.00 % 13.92 %Gcµ 11.73 % 0.44 % 34.25 %
Low-High: p12 = 1, p21=100LEWC-p 4.55 % 2.78 % 4.73 %
BDT 5.21 % 4.59 % 7.24 %Gcµ 11.68 % 10.49 % 13.05 %
High-Low: p12 = 100, p21=1LEWC-p 7.96 % 5.74 % 10.15 %
BDT 10.22 % 8.74 % 12.53 %Gcµ 15.42 % 11.14 % 16.41 %
without any preceding visits. OR admits are the patients who initially receive a surgery from thehospital and are subsequently admitted to an IW.IWs. Patients from the three admission sources described above require a bed from one of the eightinpatient units based on their diagnosis. The name of IWs, their descriptions, and number of bedsin each of them in our partner hospital can be found in Table 1 (see Section 1).Patient Types. To gain clear insights into effective assignment policies, we focus on patients whowere admitted via the ED of our partner hospital with an admission diagnosis of either chest pain
(CP) or congestive heart failure (CHF). These patients are often assigned to a secondary IW; theprimary IW for both CP and CHF patients is 4 West (4W), and their secondary IW is 5 West(5W) (see Table 1 for more information regarding these IWs). There are two types of CP and CHFpatients: Type 1 patients are those considered to be more sensitive to a secondary bed assignment(i.e., are subject to higher reduction in quality of care if assigned to a secondary inpatient unit).Type 2 patients are those who are less sensitive to a secondary bed assignment. We develop aclassification scheme using simple laboratory findings and based on our discussions with medicalexperts at our partner hospital. We define Type 1 CP patients as those who have an elevated serumtroponin (Tn) level, and Type 2 CP patients as those who have a normal troponin level. We defineType 1 CHF patients as those who have a B-type natriuretic peptide (BNP) level of 4,000 pg/ml

Kilinc, Saghafian, and Traub: Assigning ED Patients to Inpatient Units23
or greater, and Type 2 CHF patients as those with BNP levels below 4,000 pg/ml. Our empiricalanalyses show that, among patients of same type, there is no statistically significant differencein the mean IW service time between primary and secondary units (see Table EC.7 in OnlineAppendix C).Arrival Process. We use bed-request times as the “arrival” time of each patient to our system. Weobserve from our data set that, for each of the three arrival sources (ED admit, direct admit, ORadmit), the arrival rate is highly time-dependent. Furthermore, we observe that the arrival processfor each arrival source and for each IW can be modeled as a nonhomogeneous Poisson Processwith a rate that is constant during one-hour time blocks. In addition to hour-of-day dependentarrival rates, we observe day-of-week dependency in arrival rates for ED admits. We simulate thepatient flow assuming that the arrival process is cyclo-stationary with one week as the cycle. Wedo not consider the occasional transfers between inpatient units, since (a) our focus in this paper ison the patient flow between ED and IWs, (b) these transfers do not have any significant effect onthe optimal policy, and (c) the rate of such transfers is negligible compare to the arrival rate of EDadmits, direct admits, and OR admits.Service Process. In our simulation model, we consider the beds in IWs as servers. Based on ourdata, the service rates depend on patient type and admission source but not the IW (see TableEC.7 in Online Appendix C for p-values on the equality of means of service times for primary andsecondary IWs for different patient types). Table EC.8 in Online Appendix C shows the averageservice time (in days) for each IW based on the admission source. Our statistical analyses suggestthat we can use lognormal distributions as service time distributions.15
Costs. Penalty costs are assigned based on the patient type (Type 1 and Type 2 discussed above).The penalty cost for Type 1 patients are always higher than Type 2 patients, since Type 1 patientsare more sensitive to a secondary bed assignment. Because estimating cost parameters can besubject to error, we perform various sensitivity analyses. We do so by considering a wide rangeof parameters for both penalty costs and costs associated with risk of adverse events (see OnlineAppendix D for more information).Performance Measures. In addition to the overall objective we introduced in Section 3, we use theoverflow proportion (the ratio of patients assigned to a secondary IW to the total number of patientsof same type served) and the average ED boarding time (the average time between a request andbed occupancy) as other performance measures. We also use the 2-hour boarding rate (the fractionof patients that are boarded for two hours or more)16 as another performance measure. We do so
15Lognormal distribution as a service time distribution is not unique to hospitals. For instance, Brown et al. (2005) show similarcharacteristic of the service time distribution in call centers.
16As we discussed in Section 1, the current 2-hour boarding rate at our partner hospital based on our data set is around 30%.

Kilinc, Saghafian, and Traub: Assigning ED Patients to Inpatient Units24
because reducing excessive boarding times (and not just average boarding times) is also importantfor most EDs.Priorities and Runs. We use the first-in-first-out (FIFO) priority rule for each IW regardless ofthe admission source of patients. Each simulation observation is obtained for 1,000 replicationswith a replication length of one year. The number of replications is chosen so as to enforce tightconfidence intervals, enabling us to represent simulation confidence intervals with their midpointin all of our graphs. This warm-up period is determined through the Welch method (see, e.g., Welch(1983)).
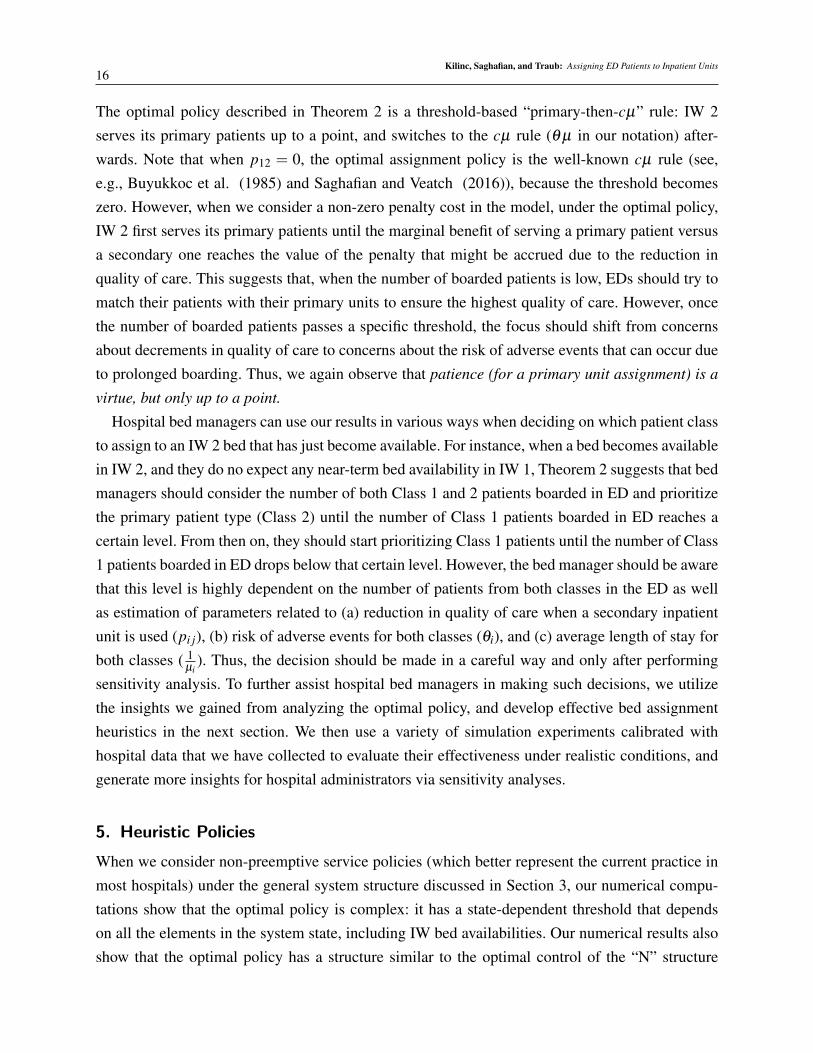
Base Case Scenario. We consider the base case scenario to be a reflection of the current systemin our partner hospital based on a year of data that we have collected. We use this scenario asa benchmark to analyze the potential changes that may occur due to implementing our proposedpolicies. Thus, we use the level of performance measures in the base case scenario (e.g., 2-hourboarding rate, average boarding time in the ED, etc.) for CP and CHF patients as a point of refer-ence, and compare the results of our proposed policy with those metrics. To this end, we focus onpatient flow from ED to the two IWs that can serve CP and CHF patients: 4 West and 5 West. Inaddition to CP and CHF patients, we simulate the flow of other patients that require a bed from 4West or 5 West, but note that these patients are not eligible for overflows, and can only be assignedto their primary inpatient units. We include these patients in our simulation model to represent thecapacity utilization in 4 West and 5 West more accurately, thereby increasing the fidelity of oursimulations. Figure 6 illustrates the patient flow under consideration.17The dashed lines in Figure6 show assignments of patients to secondary IWs (overflows that incur a penalty cost) while thesolid lines show assignments to primary IWs. In the current practice, there is no specific rule forassigning patients to their primary vs secondary units. Thus, for our base case scenario, we use theFIFO rule for the primary bed assignments, and model the overflows to secondary IWs by usingthe proportions that are obtained from our data analyses.
6.2. Validating the Simulation Model
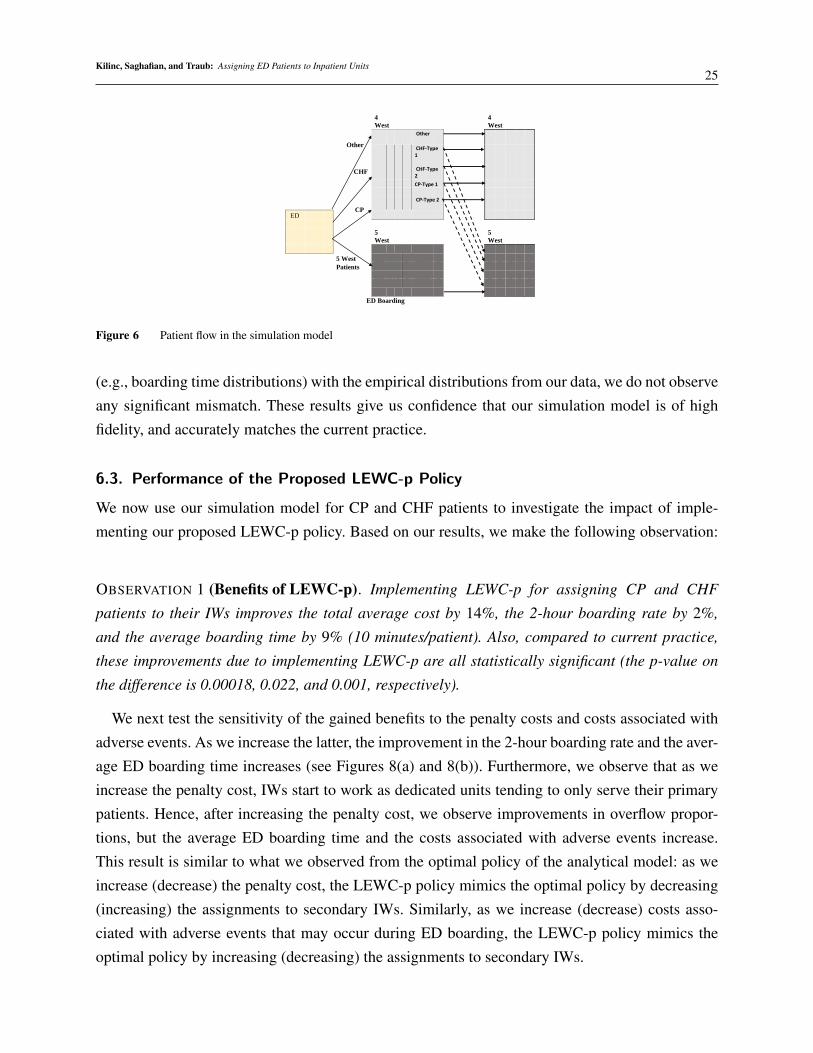
To validate our simulation model, we compare our empirical results obtained directly from our dataset with those obtained from our simulation model. Figures 7(a) and 7(b) compare the resultingtime-dependent boarding time of patients as well as the resulted overflow rates of the simulationmodel with that of the empirical data. Using the t-test for the equality of means, we observe no sta-tistical difference between outputs of our simulation model and those from empirical data (p-value= 0.412). Similarly,using Kolmogorov-Smirnov tests for comparing the distributions of outputs
17In Online Appendix E, we extend our simulation analysis to the whole patient flow depicted in Figure 3 with all the 8 IWslisted in Table 1. However, since this requires estimating various parameters for each and every patient type served in the hospital,our simulations lose fidelity. Thus, here we stay with CP and CHF patients (i.e., patients for which we have more accurate data).
Kilinc, Saghafian, and Traub: Assigning ED Patients to Inpatient Units25
4
West
4
West
Other
CHF-Type 1 CHF-Type 2
CP-Type 1
CP-Type 2
ED
5
West
5
West
ED Boarding
CHF
5 West
Patients
Other
CP
Figure 6 Patient flow in the simulation model
(e.g., boarding time distributions) with the empirical distributions from our data, we do not observeany significant mismatch. These results give us confidence that our simulation model is of highfidelity, and accurately matches the current practice.
6.3. Performance of the Proposed LEWC-p Policy
We now use our simulation model for CP and CHF patients to investigate the impact of imple-menting our proposed LEWC-p policy. Based on our results, we make the following observation:
OBSERVATION 1 (Benefits of LEWC-p). Implementing LEWC-p for assigning CP and CHF
patients to their IWs improves the total average cost by 14%, the 2-hour boarding rate by 2%,
and the average boarding time by 9% (10 minutes/patient). Also, compared to current practice,
these improvements due to implementing LEWC-p are all statistically significant (the p-value on
the difference is 0.00018, 0.022, and 0.001, respectively).
We next test the sensitivity of the gained benefits to the penalty costs and costs associated withadverse events. As we increase the latter, the improvement in the 2-hour boarding rate and the aver-age ED boarding time increases (see Figures 8(a) and 8(b)). Furthermore, we observe that as weincrease the penalty cost, IWs start to work as dedicated units tending to only serve their primarypatients. Hence, after increasing the penalty cost, we observe improvements in overflow propor-tions, but the average ED boarding time and the costs associated with adverse events increase.This result is similar to what we observed from the optimal policy of the analytical model: as weincrease (decrease) the penalty cost, the LEWC-p policy mimics the optimal policy by decreasing(increasing) the assignments to secondary IWs. Similarly, as we increase (decrease) costs asso-ciated with adverse events that may occur during ED boarding, the LEWC-p policy mimics theoptimal policy by increasing (decreasing) the assignments to secondary IWs.
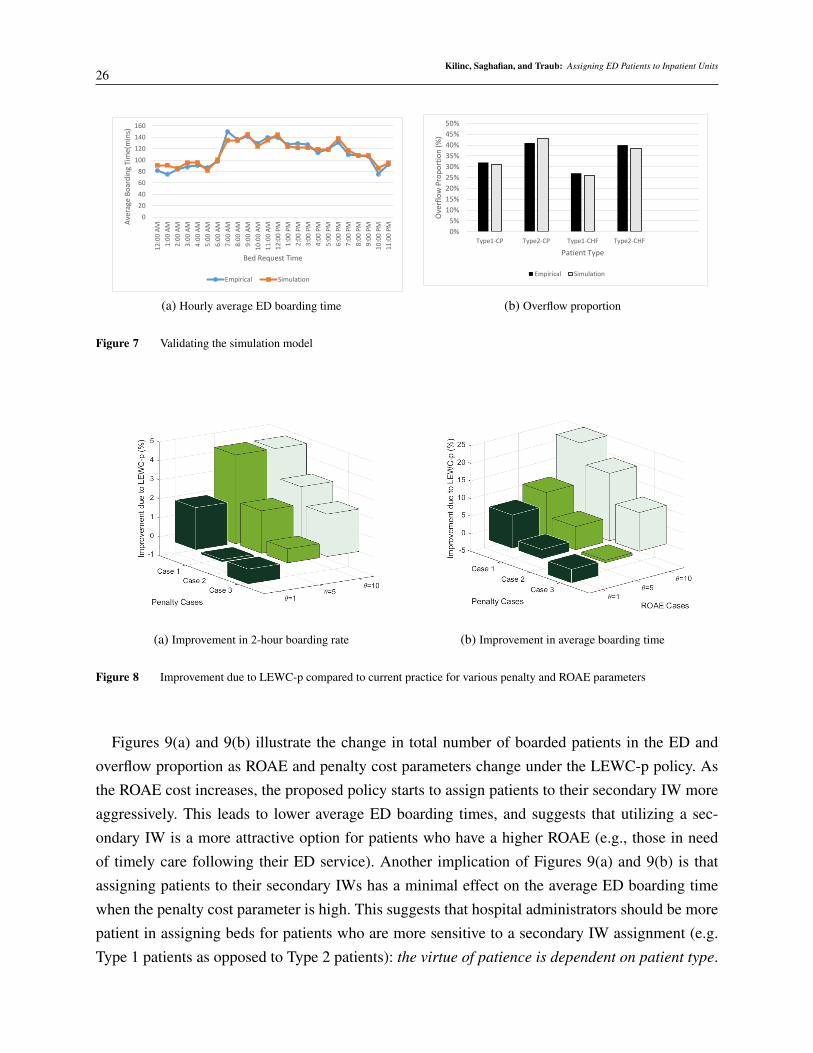
Kilinc, Saghafian, and Traub: Assigning ED Patients to Inpatient Units26
0
20
40
60
80
100
120
140
160
12
:00
AM
1:0
0 A
M
2:0
0 A
M
3:0
0 A
M
4:0
0 A
M
5:0
0 A
M
6:0
0 A
M
7:0
0 A
M
8:0
0 A
M
9:0
0 A
M
10
:00
AM
11
:00
AM
12
:00
PM
1:0
0 P
M
2:0
0 P
M
3:0
0 P
M
4:0
0 P
M
5:0
0 P
M
6:0
0 P
M
7:0
0 P
M
8:0
0 P
M
9:0
0 P
M
10
:00
PM
11
:00
PMA
vera
ge B
oar
din
g Ti
me(
min
s)
Bed Request Time
Empirical Simulation
(a) Hourly average ED boarding time
0%
5%
10%
15%
20%
25%
30%
35%
40%
45%
50%
Type1-CP Type2-CP Type1-CHF Type2-CHF
Ove
rflo
w P
rop
ort
ion
(%
)
Patient Type
Empirical Simulation
(b) Overflow proportion
Figure 7 Validating the simulation model
(a) Improvement in 2-hour boarding rate
(b) Improvement in average boarding time
Figure 8 Improvement due to LEWC-p compared to current practice for various penalty and ROAE parameters
Figures 9(a) and 9(b) illustrate the change in total number of boarded patients in the ED andoverflow proportion as ROAE and penalty cost parameters change under the LEWC-p policy. Asthe ROAE cost increases, the proposed policy starts to assign patients to their secondary IW moreaggressively. This leads to lower average ED boarding times, and suggests that utilizing a sec-ondary IW is a more attractive option for patients who have a higher ROAE (e.g., those in needof timely care following their ED service). Another implication of Figures 9(a) and 9(b) is thatassigning patients to their secondary IWs has a minimal effect on the average ED boarding timewhen the penalty cost parameter is high. This suggests that hospital administrators should be morepatient in assigning beds for patients who are more sensitive to a secondary IW assignment (e.g.Type 1 patients as opposed to Type 2 patients): the virtue of patience is dependent on patient type.

Kilinc, Saghafian, and Traub: Assigning ED Patients to Inpatient Units27
(a) Average number of patients boarded in ED
(b) Overflow proportion
Figure 9 The effect of ROAE and penalty cost parameters on the average number of patients boarded and overflow proportion
due to LEWC-p
6.3.1. Effect of Idling Beds Our proposed policy allows idling IW beds (in anticipation offuture needs) even when there are patients boarded in the ED who need them. However, hospitalbeds are valuable assets, and keeping them idle while patients are waiting for them might not beperceived as attractive by hospital administrators. To gain some insights into the impact of idling,we modify our policy by assigning 4 West patients to 5 West when there is no 5 West patientboarded in the ED (disallowing idling of 5 West beds). From our results on the performance ofLEWC-p policy with and without idling, we can make the following observation:
OBSERVATION 2 (Nonidling Policy). Non-idling flow policies increase the number of patients
overflowed, but does not significantly change the average number of patients boarded in the ED,
the average boarding time, and the 2-hour boarding rate.
The above observation captures one of the most fundamental trade-offs in our study. Prohibitingidling 5 West beds increases the number of 4 West patients assigned to 5 West while reducingthe number of 4 West patients boarded in ED who are eligible for a secondary unit assignment.However, these assignments result in blocking the access of future arriving 5 West patients to 5West beds, which increases the number of 5 West patients boarded in ED. As a result, the aver-age number of patients boarded in ED, the average boarding time, and the 2-hour boarding ratedo not change significantly. These outcomes contradict the prevalent perception among hospitaladministrators that beds should not be idled intentionally. We note that this perception might becorrect when the ROAE among different patient groups (in our case, 4 West and 5 West patients) issignificantly different.18 However, our results suggest that hospitals should typically refrain fromprohibiting idling: idling IW beds can be beneficial.
18If the ROAE for eligible 4 West patients is much larger than that of the 5 West patients, prohibiting idling can be beneficial interms of the total average cost metric and average boarding time for 4 West patients.
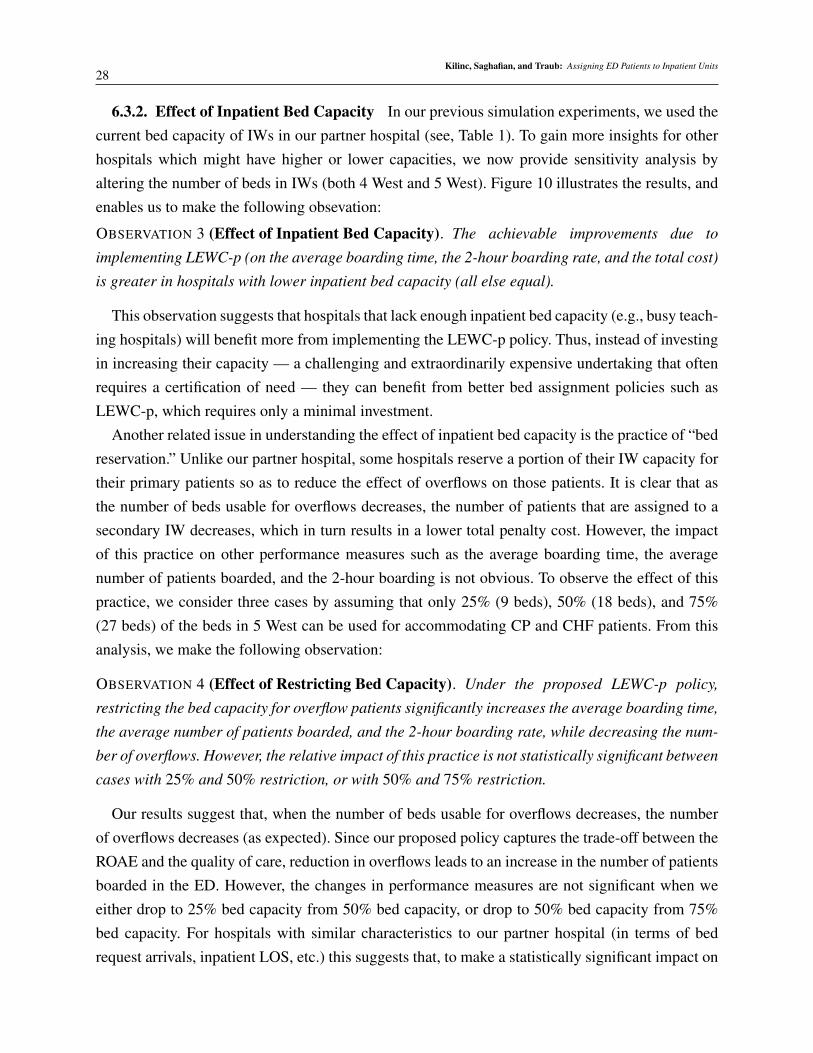
Kilinc, Saghafian, and Traub: Assigning ED Patients to Inpatient Units28
6.3.2. Effect of Inpatient Bed Capacity In our previous simulation experiments, we used thecurrent bed capacity of IWs in our partner hospital (see, Table 1). To gain more insights for otherhospitals which might have higher or lower capacities, we now provide sensitivity analysis byaltering the number of beds in IWs (both 4 West and 5 West). Figure 10 illustrates the results, andenables us to make the following obsevation:
OBSERVATION 3 (Effect of Inpatient Bed Capacity). The achievable improvements due to
implementing LEWC-p (on the average boarding time, the 2-hour boarding rate, and the total cost)
is greater in hospitals with lower inpatient bed capacity (all else equal).
This observation suggests that hospitals that lack enough inpatient bed capacity (e.g., busy teach-ing hospitals) will benefit more from implementing the LEWC-p policy. Thus, instead of investingin increasing their capacity — a challenging and extraordinarily expensive undertaking that oftenrequires a certification of need — they can benefit from better bed assignment policies such asLEWC-p, which requires only a minimal investment.
Another related issue in understanding the effect of inpatient bed capacity is the practice of “bedreservation.” Unlike our partner hospital, some hospitals reserve a portion of their IW capacity fortheir primary patients so as to reduce the effect of overflows on those patients. It is clear that asthe number of beds usable for overflows decreases, the number of patients that are assigned to asecondary IW decreases, which in turn results in a lower total penalty cost. However, the impactof this practice on other performance measures such as the average boarding time, the averagenumber of patients boarded, and the 2-hour boarding is not obvious. To observe the effect of thispractice, we consider three cases by assuming that only 25% (9 beds), 50% (18 beds), and 75%(27 beds) of the beds in 5 West can be used for accommodating CP and CHF patients. From thisanalysis, we make the following observation:
OBSERVATION 4 (Effect of Restricting Bed Capacity). Under the proposed LEWC-p policy,
restricting the bed capacity for overflow patients significantly increases the average boarding time,
the average number of patients boarded, and the 2-hour boarding rate, while decreasing the num-
ber of overflows. However, the relative impact of this practice is not statistically significant between
cases with 25% and 50% restriction, or with 50% and 75% restriction.
Our results suggest that, when the number of beds usable for overflows decreases, the numberof overflows decreases (as expected). Since our proposed policy captures the trade-off between theROAE and the quality of care, reduction in overflows leads to an increase in the number of patientsboarded in the ED. However, the changes in performance measures are not significant when weeither drop to 25% bed capacity from 50% bed capacity, or drop to 50% bed capacity from 75%bed capacity. For hospitals with similar characteristics to our partner hospital (in terms of bedrequest arrivals, inpatient LOS, etc.) this suggests that, to make a statistically significant impact on

Kilinc, Saghafian, and Traub: Assigning ED Patients to Inpatient Units29
Figure 10 Effect of inpatient bed capacity on the improvements due to LEWC-p
the performance measures, managers should consider dramatic changes in the number of beds tobe used for overflows.
6.3.3. Effect of Overflow Trigger Times Overflow trigger times are often used in practice(see, e.g., Shi et al. (2015)) where a patient is overflowed to a secondary IW only when theboarding time of the patient exceeds a predetermined trigger time. We next investigate how ourproposed policy performs when the hospital employs an overflow trigger time. To this end, weassume that a patient can be overflowed either when his/her boarding time exceeds the trigger time,or when the LEWC-p policy assigns him/her to a secondary IW. We analyze the performance ofthis modified policy by considering various trigger times.
OBSERVATION 5 (Overflow Trigger Time). Imposing overflow trigger times typically increases
the penalty costs accrued due to lower levels of quality of care. However, regardless of the level of
the trigger time, the relative improvement in the costs associated with adverse events is not high
enough to yield an overall improvement in the aggregate cost measure. In addition, the impact of
imposing a trigger time on the average boarding time and the 2-hour boarding rate is significant
only when the trigger time is no more than two hours.
This observation suggests that imposing an overflow trigger time that is higher than two hoursdoes not change the performance of our proposed LEWC-p policy. In fact, using a trigger time thatis more than two hours typically adds complexity in assignment decisions without any significantchange in performance measures. As we noted earlier, our proposed LEWC-p policy improves theaverage boarding time by approximately 10 minutes per patient compared to the current practice.This results in approximately 100 minutes of average boarding time and 29% of 2-hour boardingrate in the improved system. Setting a trigger time that is lower than two hours can affect more than

Kilinc, Saghafian, and Traub: Assigning ED Patients to Inpatient Units30
70% of the patient population (since 2-hour boarding rate is 29%), which may result in improve-ments in the average boarding time and the 2-hour boarding rate. However, we find that addingtrigger times to LEWC-p does not lead to improvements in the aggregate cost measure, regardlessof the level of the trigger time. This further confirms that the proposed LEWC-p policy alreadystrikes a strong balance between concerns related to prolonged ED boarding times and those relatedto overflows.
7. Conclusion
We study the dynamic assignment of ED admitted patients to hospital IWs. We utilize a queueingframework and an MDP model to gain insights into effective mechanisms to minimize the risk ofadverse events (a patient safety concern) while reducing the number of secondary inpatient unitassignments (a quality of care concern).
Our results for a simplified model with two patient classes and two IWs suggest that the optimalpolicy is a threshold-type policy, where the threshold depends on the number of patients boarded inthe ED. Under this policy, the primary unit of Class 1 patients (i.e., patients that have a higher θ µ
value) typically works as a dedicated unit that serves its primary patients whenever such a patientis boarded in the ED. Moreover, the primary unit of Class 2 patients serves them before helping IW1 on Class 1 patients, and switches to serving Class 1 patients once the number of Class 1 patientsboarded in the ED reaches a threshold. These suggest that patience in transferring ED admittedpatients to IWs is a virtue, but only up to a point. Contrary to the prevalent perception amonghospital administrators, we also find that idling IW beds can be beneficial. In particular, whileidling is used in some hospitals and some specific inpatient units, our results indicate evidence forwider implementation of idling policies. We also show that, when the penalties that represent thereduction in quality of care in secondary units are negligible, the optimal policy is the well-knowcµ rule: both IWs serve Class 1 patients in order to myopically decrease the risk of adverse ofevents for patients boarded in the ED.
Our analyses show that the optimal policy is complex in general, and may not be suitable forimplementation in practice. Therefore, we develop two heuristic policies that are easy to imple-ment. We first use a birth-and-death process to approximate the threshold level that minimizes anaggregate measure of both patient safety and quality of care. Then, we propose a modified versionof the LEWC heuristic termed LEWC-p that enables us to dynamically strike a balance betweenconcerns of patient safety and quality of care. The results show that LEWC-p significantly outper-forms other policies, and is also more robust than them in that it has a lower standard deviation ofoptimality gap. Thus, an important contribution of this study is to introduce LEWC-p as a simplebut effective policy that can be implemented in hospitals.

Kilinc, Saghafian, and Traub: Assigning ED Patients to Inpatient Units31
We then investigate the achievable gains due to implementing LEWC-p by using a simulationmodel that we calibrated with a year of data collected from our partner hospital. By using this sim-ulation model, we are able to reflect the realistic features of the hospital patient flow. To gain clearinsights, we focus on chest pain (CP) and congestive heart failure (CHF) patients. Furthermore,by utilizing laboratory findings to separate patients based on the level of Tn for CP patients andBNP for CHF patients, we classify these patients as Type 1 and Type 2. Our analyses on CP andCHF patients indicate that LEWC-p can yield significant improvements compared to the currentpractice by striking a better balance between patient safety and quality of care metrics. We alsoshed light on various hospital characteristics that will make the use of our proposed policy morebeneficial.
We suspect that the proposed model and policy on patient flow from the ED to IWs can beextended to other areas of the hospital. Similar to the bed-block phenomenon in the ED, operatingrooms (ORs) experience problems due to bed shortages in the post-anesthesia care unit (PACU).Our model and analyses can be used in those areas of a hospital to provide insights into the trade-offbetween waiting to be assigned to an appropriate bed versus a quick overflow to a less appropriatebed.
Our model can be also extended in various other ways. First, our model focuses on the patientflow between the ED to IWs without including the transfer between IWs (the requirements for sucha flow would be different from our focus in this paper). However, an extension of our model canbe used to study patient flow between IWs, and hence, may provide other ways to further reduceED boarding times. Second, our model considers IW beds as servers, although in the actual systemthe transfer process from ED to IWs is more complicated. For instance, in many hospitals, thenurses’ availabilities often affect the patient flow, as nurses are responsible for transferring patientsfrom the ED to IWs. Future research can expand our study by considering such more complexscenarios. Finally, in our objective function, we focus on the risk of adverse events and qualityof care of patients admitted through the ED. Future research can extend our objective function byincorporating other concerns such as the LOS and waiting times for ED patients who are dischargedhome after their ED visit.
ReferencesAndradottir S, Ayhan H, Down DG (2007). Compensating for failures with flexible servers. Operations Research 55(4):753–768.Armony M, Bambos N (2003). Queueing dynamics and maximal throughput scheduling in switched processing systems. Queueing
Systems 44(3):209–252.Armony M, Ward AR (2010). Fair dynamic routing in large-scale heterogeneous-server systems. Operations Research 58(3):624–
637.Armony M, Israelit S, Mandelbaum A, Marmor YN, Tseytlin Y, Yom-Tov GB (2015). On patient flow in hospitals: A data-based
queueing-science perspective. Stochastic Systems Forthcoming.Bell SL, Williams RJ (2001). Dynamic scheduling of a system with two parallel servers in heavy traffic with resource pooling:
asymptotic optimality of a threshold policy The Annals of Applied Probability 11(3):608–649.Bernstein SL, Aronsky D, Duseja R, Epstein S, Handel D, Hwang U, McCarthy M, McConnell J, Pines JM, Rathlev N, et al. (2009.)
The effect of emergency department crowding on clinically oriented outcomes. Academic Emergency Medicine 16(1):1–10.

Kilinc, Saghafian, and Traub: Assigning ED Patients to Inpatient Units32
Berry J, Jillian A, Tucker AL (2016). Past the point of speeding up: The negative effects of workload saturation on efficiency andpatient severity. Management Science 63(4):1042–1062.
Brown L, Gans N, Mandelbaum A, Sakov A, Shen H, Zeltyn S, Zhao L,(2005). Statistical analysis of a telephone call center: Aqueueing-science perspective. Journal of the American Statistical Association 100(469):36–50.
Buyukkoc C, Varaiya P, Walrand J (1985). The cµ rule revisited. Advances in Applied Probability 17(1):237–238.Carr BG, Hollander JE, Baxt WG, Datner EM, Pines JM (2010). Trends in boarding of admitted patients in US emergency depart-
ments 2003–2005. The Journal of Emergency Medicine 39(4):506–511.Chan CW, Farias VF, Escobar GJ (2016). The impact of delays on service times in the intensive care unit. Management Science
53(2):197–218.CNN (2008). Tape shows woman dying on waiting room floor
http://www.cnn.com/2008/US/07/01/waiting.room.death/index.html?eref=rs.Cox DR, Smith WL (1961). Queues (Methuen & Co., London).Dai JG, Lin W (2005). Maximum pressure policies in stochastic processing networks. Operations Research 53(2):197–218.De Vericourt F, Zhou Y (2005). Managing response time in a call-routing problem with service failure. Operations Research
53(6):968–981.Falvo T, Grove L, Stachura R, Vega D, Stike R, Schlenker M, Zirkin W (2007). The opportunity loss of boarding admitted patients
in the emergency department. Academic Emergency Medicine 14(4):332–337.Gans N, Koole G, Mandelbaum A (2003). Telephone call centers: Tutorial, review, and research prospects. Manufacturing & Service
Operations Management 5(2):79–141.Government Accountability Office (GAO) (2003). Hospital emergency departments: crowding vary among hospitals and commu-
nities. http://www.gao.gov/new.items/d03460.pdf.Government Accountability Office (GAO) (2009). Hospital emergency departments: crowding continues to occur, and some patients
wait longer than recommended time frames. http://www.gao.gov/new.items/d09347.pdf.Garnett O, Mandelbaum A (2000.) An introduction to skills-based routing and its operational complexities. Teaching Note, Tech-
nion, Israel.Griffin J (2012). Improving health care delivery through multi-objective resource allocation. Ph.D. dissertation, School of Industrial
and Systems Engineering, Georgia Institute of Technology, Atlanta, GA.Gurvich, I, Whitt W (2009). Scheduling flexible servers with convex delay costs in many-server service systems. Manufacturing &
Service Operations Management 11(2):237–253.Gurvich, I, Perry O (2012). Overflow networks: Approximations and implications to call center outsourcing. Operations Research
60(4):996–1009.Guttmann A, Schull MJ, Vermeulen MJ, Stukel TA (2011). Association between waiting times and short term mortality and hospital
admission after departure from emergency department: population based cohort study from Ontario, Canada. British MedicalJournal 342:d2983.
Harrison GW, Shafer A, Mackay M (2005). Modelling variability in hospital bed occupancy. Health Care Management Science8(4):325–334.
Hoot NR, Aronsky D (2008). Systematic review of emergency department crowding: causes, effects, and solutions. Annals ofEmergency Medicine 52(2):126–136.
Kakalik JS, Little JDC (1971). Optimal service policy for the M/G/1 queue with multiple classes of arrival. Report, RANDCorporation, Santa Monica, CA.
Kuntz L, Mennicken R, Scholtes, S (2014). Stress on the ward: Evidence of safety tipping points in hospitals. Management Science61(4):754–771.
Lin W, Kumar PR (1984). Optimal control of a queueing system with two heterogeneous servers. IEEE Transactions on AutomaticControl 29(8):696–703.
Mandelbaum A, Momcilovic P, Tseytlin Y, (2012). On fair routing from emergency departments to hospital wards: QED queueswith heterogeneous servers. Management Science 58(7):1273–1291.
Mandelbaum A, Stolyar AL (2012). Scheduling flexible servers with convex delay costs: Heavy-traffic optimality of the generalizedcµ-rule. Operations Research 52(6):836–855.
Meyn SP (2001). Sequencing and routing in multiclass queueing networks part I: Feedback regulation. SIAM Journal on Controland Optimization 40(3):741–776.
Meyn SP (2003). Sequencing and routing in multiclass queueing networks part II: Workload relaxations. SIAM Journal on Controland Optimization 42(1):178–217.
Palmer J, Mitrani I (2004). Optimal Server Allocation in Reconfigurable Clusters with Multiple Job Types (Springer Berlin Heidel-berg).
Powell ES, Khare RK, Venkatesh AK, Van Roo BD, Adams JG, Reinhardt G (2012). The relationship between inpatient dischargetiming and emergency department boarding. The Journal of Emergency Medicine 42(2):186–196.
Proudlove, N, Boaden, R, Jorgensen J (2007). Developing bed managers: the why and the how. Journal of Nursing Management15(1):34–42.
Saghafian S, Van Oyen MP, Kolfal B (2011). The W network and the dynamic control of unreliable flexible servers. IIE Transactions43(12):893–907.
Saghafian S, Hopp WJ, Van Oyen MP, Desmond JS, Kronick SL (2012). Patient streaming as a mechanism to improve responsive-ness in Emergency Departments. Operations Research 60(5):1080–1097.
Saghafian S, Austin G, Traub SJ (2015). Operations research/management contributions to Emergency Department patient flowoptimization: Review and research prospects. IIE Transactions on Healthcare Systems Engineering 5(2):101–123.

Kilinc, Saghafian, and Traub: Assigning ED Patients to Inpatient Units33
Saghafian S, Veatch MH (2016). A cµ rule for two-tiered parallel preferences. IEEE Transactions on Automatic Control 61(4):1046–1050.
Sennott L (1999) Stochastic Dynamic Programming and Control of Queueing Systems (John Wiley & Sons, New York).Shi P, Chou MC, Dai JG, Ding D, Sim J (2015). Models and insights for hospital inpatient operations: Time-dependent ED boarding
time. Management Science 62(1):1–28.Teow KL, El-Darzi E, Foo C, Jin X, Sim, J (2012). Intelligent analysis of acute bed overflow in a tertiary hospital in Singapore.
Journal of Medical Systems 36(3):1873–1882.Tezcan T, Dai JG (2010). Dynamic control of N-systems with many servers: Asymptotic optimality of a static priority policy in
heavy traffic. Operations Research 58(1):94–110.Thompson S, Nunez M, Garfinkel R, Dean MD (2009). OR practice-efficient short-term allocation and reallocation of patients to
floors of a hospital during demand surges. Operations Research 57(2):261–273.Van Mieghem JA (1995). Dynamic scheduling with convex delay costs: The generalized cµ rule. The Annals of Applied Probability
5(3):809–833.Wallace RB, Whitt W (2005). A staffing algorithm for call centers with skill-based routing. Manufacturing & Service Operations
Management 7(4):276–294.Walrand J (1988). An Introduction to Queueing Networks (Prentice Hall,, Englewood Cliffs, NJ).Welch PD (1983). The statistical analysis of simulation results. The computer performance modeling handbook 22:268–328.Zhan D, Ward AR (2013). Threshold routing to trade off waiting and call resolution in call centers. Manufacturing & Service
Operations Management 16(2):220–237.