Dynamic Analysis of Healthcare Service Delivery - Worcester
219
Dynamic Analysis of Healthcare Service Delivery: Application of Lean and Agile Concepts by Tom Christopher Rust A Dissertation Submitted to the Faculty of the WORCESTER POLYTECHNIC INSTITUTE in partial fulfillment of the requirements for the Degree of Doctor of Philosophy in System Dynamics May 2013 Signature of Author . . . . . . . . . . . . . . . . . . . . . . . . . . . . . . . . . . . . . . . . . . . . . . . . . . . . . . . . . . . . . . Social Science and Policy Studies Approved by. . . . . . . . . . . . . . . . . . . . . . . . . . . . . . . . . . . . . . . . . . . . . . . . . . . . . . . . . . . . . . . . . . . . Professor Khalid Saeed, Major Advisor Social Science and Policy Studies Approved by. . . . . . . . . . . . . . . . . . . . . . . . . . . . . . . . . . . . . . . . . . . . . . . . . . . . . . . . . . . . . . . . . . . . Professor Isa Bar-On, Co-Advisor Department of Mechanical Engineering Approved by. . . . . . . . . . . . . . . . . . . . . . . . . . . . . . . . . . . . . . . . . . . . . . . . . . . . . . . . . . . . . . . . . . . . Associate Professor Oleg Pavlov, Co-Advisor Social Science and Policy Studies
Transcript of Dynamic Analysis of Healthcare Service Delivery - Worcester

Dynamic Analysis of Healthcare Service Delivery: Application of Lean and Agile Concepts
by
Tom Christopher Rust
A Dissertation
Submitted to the Faculty
of the
WORCESTER POLYTECHNIC INSTITUTE
in partial fulfillment of the requirements for the
Degree of Doctor of Philosophy
in
System Dynamics
May 2013
Signature of Author . . . . . . . . . . . . . . . . . . . . . . . . . . . . . . . . . . . . . . . . . . . . . . . . . . . . . . . . . . . . . .
Social Science and Policy Studies
Approved by. . . . . . . . . . . . . . . . . . . . . . . . . . . . . . . . . . . . . . . . . . . . . . . . . . . . . . . . . . . . . . . . . . . .
Professor Khalid Saeed, Major Advisor
Social Science and Policy Studies
Approved by. . . . . . . . . . . . . . . . . . . . . . . . . . . . . . . . . . . . . . . . . . . . . . . . . . . . . . . . . . . . . . . . . . . .
Professor Isa Bar-On, Co-Advisor
Department of Mechanical Engineering
Approved by. . . . . . . . . . . . . . . . . . . . . . . . . . . . . . . . . . . . . . . . . . . . . . . . . . . . . . . . . . . . . . . . . . . .
Associate Professor Oleg Pavlov, Co-Advisor
Social Science and Policy Studies

Rust 1
Abstract
Hospitals are looking to industry for proven tools to manage increasingly complex operations
and reduce costs simultaneously with improving quality of care. Currently, ‘lean’ is the
preferred system redesign paradigm, which focuses on removing process waste and variation.
However, the high level of complexity and uncertainty inherent to healthcare make it incredibly
challenging to remove variability and achieve the stable process rates necessary for lean redesign
efforts to be effective. This research explores the use of an alternative redesign paradigm –
‘agile’ – which was developed in manufacturing to optimize product delivery in volatile demand
environments with highly variable customer requirements. ‘Agile’ redesign focuses on
increasing system responsiveness to customers through improved resource coordination and
flexibility. System dynamics simulation and empirical case study are used to explore the impact
of following an agile redesign approach in healthcare on service access, care quality, and cost;
determine the comparative effectiveness of individual agile redesign strategies; and identify
opportunities where lean methods can contribute to the creation of responsive, agile enterprises
by analyzing hybrid lean-agile approaches. This dissertation contributes to the emerging
literature on applying supply chain management concepts in healthcare, and opens a new path for
designing healthcare systems that provide the right care, at the right time, to the right patient, at
the lowest price.
Rust 2
Table of Contents
Abstract. . . . . . . . . . . . . . . . . . . . . . . . . . . . . . . . . . . . . . . . . . . . . . . . . . . . . . . . . . . . . . . . . . . . . . 1
List of Figures. . . . . . . . . . . . . . . . . . . . . . . . . . . . . . . . . . . . . . . . . . . . . . . . . . . . . . . . . . . . . . . . . 3
List of Tables . . . . . . . . . . . . . . . . . . . . . . . . . . . . . . . . . . . . . . . . . . . . . . . . . . . . . . . . . . . . . . . . . 6
Introduction. . . . . . . . . . . . . . . . . . . . . . . . . . . . . . . . . . . . . . . . . . . . . . . . . . . . . . . . . . . . . . . . . . . 7
Chapter 1: A New Approach to Improving Healthcare Delivery: the importance of resource
flexibility . . . . . . . . . . . . . . . . . . . . . . . . . . . . . . . . . . . . . . . . . . . . . . . . . . . . . . . . . . . . . . . . . . . 31
Chapter 2: The Unintended, Adverse Effects of 'Leaner' Healthcare. . . . . . . . . . . . . . . . . . . . . . 81
Chapter 3: Adapting Agile Strategies to Healthcare Service Delivery. . . . . . . . . . . . . . . . . . . . 122
Conclusion. . . . . . . . . . . . . . . . . . . . . . . . . . . . . . . . . . . . . . . . . . . . . . . . . . . . . . . . . . . . . . . . . .166
Appendices. . . . . . . . . . . . . . . . . . . . . . . . . . . . . . . . . . . . . . . . . . . . . . . . . . . . . . . . . . . . . . . . . .170
References. . . . . . . . . . . . . . . . . . . . . . . . . . . . . . . . . . . . . . . . . . . . . . . . . . . . . . . . . . . . . . . . . . 207
Rust 3
List of Figures
Figure 1. Stock and flow diagram of the C&P system dynamics model. ..................................... 11
Figure 2. C&P clinic demand and system performance pre- and post-implementation, taken from
Jan 2013 VA AMIS290 report. ..................................................................................................... 14
Figure 3. Patient admission and discharge rates showing downstream variation amplification in a
UK hospital (adapted from Walley, 2007). ................................................................................... 17
Figure 4. A generic, multi-stage healthcare service delivery model, with the feedback structure of
a single representative stage (i.e., clinic or hospital department) shown. ..................................... 20
Figure 5. System re-design classification matrix (adapted from Christopher, 2000). .................. 25
Figure 6. Historical data on C&P clinic referral rate and average patient wait time as of
November 2010, taken from Jan 2013 VA AMIS290 report........................................................ 35
Figure 7. ‘House of Lean’ visualization of lean enterprise redesign strategy (adapted from Liker,
2004). ............................................................................................................................................ 37
Figure 8. Response to an increase in demand for services under fixed or flexible capacity
production systems (adapted from Aronsson et al, 2011). ............................................................ 39
Figure 9. Overview of the intake and examination processes in C&P in June 2010. ................... 45
Figure 10. C&P management’s responses to work pressure ......................................................... 53
Figure 11. Effect of fatigue on productivity ................................................................................. 55
Figure 12. Effect of burnout on turnover ...................................................................................... 56
Figure 13. Effect of Fatigue on f{Fi} ........................................................................................... 58
Figure 14. Effect of Inexperience on f{Fi} .................................................................................... 58
Figure 15. Influence Diagram of the main effects determining waiting time in C&P. ................. 60
Figure 16. Stock and flow diagram of the C&P system dynamics model. ................................... 61
Figure 17. C&P referral rate and average patient wait time. At right: Historical data from C&P
service from March 2009 through July 2011. At left: Output from a representative base case
simulation run. .............................................................................................................................. 67
Figure 18. Base case scenario simulation output for patient referral and error rates contributing to
patient backlog. ............................................................................................................................. 68
Figure 19. Comparison of average patient wait time to total costs under four scenarios, 1000 runs
each. At left: base case (blue) and agile (silver). Right: lean (orange) and combined (white). ... 73
Rust 4
Figure 20. Dynamic behavior of cost per average patient and average patient wait time under
four scenarios with linearly increasing demand. ........................................................................... 74
Figure 21. C&P clinic demand and system performance pre- and post-implementation, taken
from Jan 2013 VA AMIS290 report. ............................................................................................ 77
Figure 22. Patient admission and discharge rates showing downstream variation amplification in
UK hospital (adapted from Walley, 2007). ................................................................................... 90
Figure 23. System re-design classification matrix (adapted from Christopher, 2000). ................ 92
Figure 24. High-level stock and flow diagram of the generic service supply chain; rectangles
represent accumulations, hourglasses represent rates, and bold arrows represent information
exchange. ...................................................................................................................................... 96
Figure 25. Stock and flow diagram of one clinic in an operational service supply chain structure.
The main capacity adjustment loop is highlighted; parameters adjusted to explore behavior
inherent to the model’s structure are circled. ................................................................................ 98
Figure 26. Base case analysis of changes in individual clinic workloads resulting from a 20%
increase in demand in week 10. .................................................................................................. 106
Figure 27. Behavior of total service chain workload with different efficiency levels with a 20%
increase in demand in week 10. .................................................................................................. 109
Figure 28. Comparison of workload error and service time variation under increasing demand
variability. ................................................................................................................................... 110
Figure 29. Accumulated absolute workload error in each clinic after lean improvement. ......... 113
Figure 30. Comparison of service times and provider stress levels of service chains with multiple
performance standards distributions; demand is stochastic and unknown. ................................ 117
Figure 31. Characteristics of agile supply chain (modified from Harrison et al., 1999). ........... 129
Figure 32. The functional steps in a healthcare process (adapted from Aronsson et al, 2011). . 134
Figure 33. A generic multi-stage healthcare service delivery model .......................................... 135
Figure 34. System dynamics model of a single representative care delivery unit; the main
capacity adjustment loop is highlighted. ..................................................................................... 136
Figure 35. Base case analysis of individual clinic service rates. ................................................ 149
Figure 36. Resultant service times from market sensitivity simulation runs. ............................. 151
Figure 37. Resultant service supply chain performance under various market sensitivity
strategies. .................................................................................................................................... 152
Figure 38. Variation in individual clinic backlogs and capacities following market sensitivity
strategies. .................................................................................................................................... 153
Rust 5
Figure 39. Resultant service supply chain performance under various information sharing
strategies. .................................................................................................................................... 155
Figure 35. Variation in individual clinic backlogs and capacities following information sharing
strategies. .................................................................................................................................... 156
Figure 41. Resultant average patient service times from information sharing simulation runs. 157
Figure 42. Resultant service supply chain performance under various coordination strategies. 159
Figure 38. Variation in individual clinic backlogs and capacities following centralization
strategies. .................................................................................................................................... 160
Figure 44. Resultant workload error following clinic parameter re-distribution. ....................... 161
Figure 45. Comparative effectiveness of selected agile operational plans in response to a one-
time 10% increase in demand. .................................................................................................... 162
Rust 6
List of Tables
Table 1. Parameter changes for the three system redesign scenarios tested and base case,
developed through interviews and analysis of data obtained from VA CPRS reports. ................ 64
Table 2. Performance measures for the base case scenario .......................................................... 65
Table 3. Performance measures for lean, agile, and combined system redesign scenarios. ......... 71
Table 4. The five Lean principles (Womack & Jones, 1996) ..................................................... 85
Table 5. Comparison of service times and workload errors caused by one-time step increases in
demand. ....................................................................................................................................... 107
Table 6. Comparison of service times and provider stress levels of four lean-based redesign
scenarios, when patient demand is stochastic and unknown. ..................................................... 112
Rust 7
0-1. Introduction
Providing the right care, to the right patient, at the right time is not only the definition of
providing quality healthcare, but also the key to the long-run viability of our healthcare system.
However, our healthcare delivery system is often unable to match the supply of healthcare
services with the demand for that care. Intense, inherent demand variability renders this
synchronization almost impossible to maintain for any significant period of time. The mismatch
between patients and providers has been shown to lead to significant adverse effects: demand
variability has been suggested as a main driver for increasing healthcare delivery costs (Litvak,
2005), unexpected surges in admission rates have been linked to increased likelihoods of
unplanned patient readmission (Baker et al, 2009), and the inability to maintain a desired
patient:provider ratio has been correlated to increased patient mortality (Needleman et al, 2011;
Aiken, 2002). Demand variability may be the most pressing problem facing healthcare delivery
today.
Furthermore, present day healthcare delivery is defined by the idea that networks of clinicians,
rather than individual clinicians, provide patient care, and that the success or failure of healthcare
delivery is ultimately determined by the ability of those clinicians to coordinate their activities.
As healthcare increases in complexity, these previously disparate care processes and clinicians
become even harder to manage and align, resulting in further increased risk to patients and
inefficient use of system resources. Analysis from supply chain management research indicates
that linking locally controlled service delivery processes (i.e., individual healthcare clinics or
hospital departments) into continuous chains of service provision creates internal demand
variability that amplifies already problematic external variability. This ‘bullwhip effect’ of
systemic demand variability amplification has been shown to be inherent to both manufacturing
and service delivery chains (Anderson et al, 2005), and to be the suggested leading cause of
supply stock-outs and product distribution costs (Lee et al, 1997). Recent research has found a
similar phenomenon of demand variability amplification in multiple healthcare delivery settings,
from elective surgery, to in-patient recovery wards, to emergency departments (Sameul et al,
2010; Walley, 2007; Sethuraman & Tirupati, 2005), where it has led to performance degradation,
reduced resource availability and greater probability of exceeding desired provider utilization
and occupancy rates. Increasing demand variability inside the patient care chain generally
results in greater stress on employees, higher operating costs, and lower hospital revenues.
Combining these two analyses leads to the conclusion that healthcare delivery is facing a ‘perfect
storm’ of demand variability, stemming from the combination of exogenous and endogenous
demand variation. As our delivery systems become more interconnected and dependent upon
each other, the problems currently caused by demand variation will undoubtedly be further
magnified. Hence, being able to quickly adapt to ever-changing rates of patient arrivals and flow
through healthcare systems is crucial to the overall success of healthcare delivery. Creating new
management structures and decision heuristics to better respond to both internally and externally
Rust 8
driven demand variation is essential to ensure that the supply of care can be synchronized to
meet the peaks and troughs of patient demand. Defining, evaluating, and implementing new
healthcare service delivery management methods, at the operations level, is clearly of critical
importance to providing effective, high-quality healthcare.
The objective of this research is to improve how our healthcare delivery system responds to
variation in initial demand for care and in subsequent patient flow through the care delivery
chain. In the subsequent chapters we explore the effects of increasing resource flexibility and/or
efficiency in a real world healthcare delivery system subject to intense, unpredictable demand
variation; show how current dominant healthcare delivery system redesign methods may actually
increase internal variation to the detriment of patient health and safety; discuss an alternative
approach to improving system behavior; and propose, test, and validate concrete operational
changes to improve performance based on that new approach.
This introduction is organized as follows. First, we discuss and justify the use of system
dynamics as an appropriate methodology for understanding behavior of healthcare delivery
systems. Second, we present our motivation for this research, which stems from our experiences
improving service delivery at one Boston-area VA hospital. Third, we discuss the development
of a generalizable healthcare service delivery model, its underlying logic, and its limitations.
Fourth, we present our simulation experiments, which explore the intended and unintended
effects of multiple system improvement paradigms applied to that generic model. The
penultimate section discusses the implications of our findings; our contributions to the fields of
service supply chain management, healthcare service delivery, lean methods, and healthcare
service simulation; our research shortcomings; and possible future work. The concluding section
of this introduction presents the organizational structure of the dissertation.
0-2. Methodology
This research is founded on the pillars of supply chain management, healthcare delivery
improvement, and patient safety literatures. Our research and conclusions are based on a mixture
of direct observation, semi-structured interviews, system dynamics simulations, and empirical
analysis. We had direct access to stakeholders and participants of a Veterans Affairs (VA)
healthcare delivery system, and years’ worth of clinical process data from that system. The use
of system dynamics as a method for analyzing the behavior of complex systems over time is well
established.
System dynamics modeling has been used to address many healthcare related problems and has
resulted in about 1500 publications since 1991 (Brailsford 2008). Dangerfield (1999) reviews
system dynamics modeling in healthcare and concludes that the method can be used effectively
in a qualitative way when influence (or causal) diagrams are the main analytic tool, and in
Rust 9
quantitative ways when based on simulation models. This research extends previous dynamic
analyses of healthcare management: Specifically, Taylor and Dangerfield’s (2005) use of
quantitative system dynamics analysis of the reasons for failed management interventions in
cardiac catheterization services, and Lane and Husemann’s (2008) use of qualitative modeling to
elicit proposals for improvement of acute patient flows in the UK National Health Service.
Similarly, Wolstenholme et al (2006) use both qualitative and quantitative system dynamics to
analyze the effects of care delivery redesign on mental healthcare performance. A general
discussion of the role of system dynamics in analyzing healthcare delivery systems can be found
in Taylor and Lane (1998).
We chose system dynamics simulation because the method encourages both a systemic view of
the interactions of patient flows and information, and a more strategic perspective on the
management of the system. It is widely accepted by healthcare professionals that healthcare
delivery cannot be understood by looking at factors in isolation (Lane, 1999). By encouraging
the study of how different processes interact to produce observed effects, system dynamics offers
a rigorous approach for bringing that interconnectedness insight into focus. We choose system
dynamics specifically for its ability to 1) clearly relate patterns of behavior to system structure,
2) quantify the causal links between demand and patient wait times, and 3) assess potential
changes to system structure and management decision heuristics that will improve system
performance in the long term. This necessitates the consideration of a broad range of
interactions across physical and information flows.
Throughout these chapters, the service chain and governing decision heuristics are modeled
through first-order nonlinear differential equations. The formal mathematical expressions use to
represent the systems studied are reported throughout the paper and the specific model code for
each is included in individual appendices. We have not used discrete-event simulation (DES) or
stochastic modeling (of variables like ‘patient inflow' or ‘treatment time') because our primary
objective is not to quantify numerical results for one specific healthcare delivery chain, but to
understand and illustrate to healthcare managers the deterministic behaviors of healthcare
delivery systems in general. The use of continuous, as opposed to discrete, flows in the model is
a reasonable approximation of the perpetual adjustments (hiring and firing) necessary in the
management of service organizations, and is a common method for abstracting these systems in
both operations management and supply chain management research (Sethi & Thompson,
2000). For an in-depth discussion of the trade-offs and appropriate problems for using system
dynamics or DES see Tako and Robinson (2009) and Kleijnen (2005).
0-3. Research Motivation
The motivation for this research arises from the experiences at one representative Veterans
Affairs (VA) hospital, which was beset by problems stemming from increasing demand variation
Rust 10
for one of its key services: the administration of Compensation and Pension (C&P) exams.
These exams determine the level of veterans’ service-connected medical disability, a key factor
governing veterans’ access to free medical coverage at the VA and their life-time disability
benefits. Providing timely and accurate disability exams is a critical service provided by the VA.
All returning service members must navigate this process, as must all current VA patients
seeking to change their recognized level of service-connected disability and subsequent benefits.
Specifically, at our study site, demand for C&P exams and average wait times for those exams
nearly doubled from June to November 2010, when this research project began, effectively
amounting to a denial of services for some veterans.
Many other VA facilities nation-wide experience similar demand variation and subsequent
increases in service delays for C&P exams, along with reductions in exam quality and patient
satisfaction. The backlog of veterans waiting for disability assessments has risen dramatically in
recent years, from less than 389,000 in 2009 to over 809,000 by 2011. Of this amount, over 60
percent are currently waiting for over 125 days. These delays prompted a series of Office of
Inspector General investigations in 2008-9, in which they found inefficient, poorly coordinated
services; scant resources; and low quality, as measured by the number of incomplete exams
(Finn, 2010). More recently, the spectacle of veterans committing suicide because of delayed
treatment for PTSD caused, in part, by delays in the Compensation and Pension process, has
brought widespread criticism upon the VA (New York Times, 5/6/2011). Finding a solution to
this problem, even at only one pilot site, could lead to significant improvement in veterans’
access to healthcare services.
0-3.1. Model development
We sought to address this declining performance through an analysis of demand variability, the
factors governing patient flow through the service delivery system, and clinic managers’ service
capacity decision heuristics. In order to identify and test operation-level changes that the C&P
clinic could implement quickly to increase their ability to respond to severe fluctuations in
demand, we built a dynamic simulation of the C&P clinic. Simulation was a necessary first step
in redesigning the clinic, as the large scale changes necessary to both system structure and
management were deemed too risky to implement without a well-developed understanding of
both their intended and unintended effects. In the dynamically complex healthcare environment,
structure and management changes often result in both intended and unintended consequences
that cannot be easily foreseen without the help of a computer model (Kleijen, 2005).
To build a representative dynamic model of the C&P clinic, we worked with system
stakeholders, conducting interviews with managers, providers, and administrative staff;
developing causal loop diagrams in group meetings; iteratively refining and adding the details
they deemed important. Stakeholders then identified the relative influences between system
components and explained and quantified their own decision heuristics. We presented initial
Rust 11
simulations, then revised the model until both model structure and outcomes fit the existing
historical data.
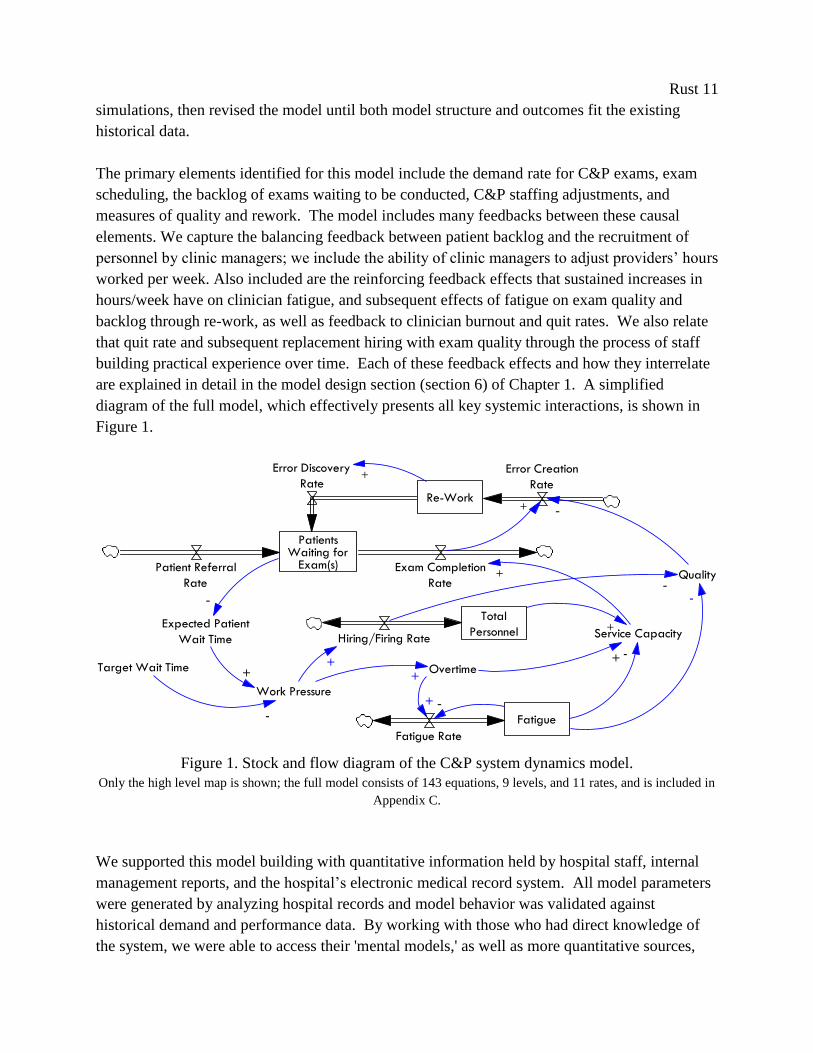
The primary elements identified for this model include the demand rate for C&P exams, exam
scheduling, the backlog of exams waiting to be conducted, C&P staffing adjustments, and
measures of quality and rework. The model includes many feedbacks between these causal
elements. We capture the balancing feedback between patient backlog and the recruitment of
personnel by clinic managers; we include the ability of clinic managers to adjust providers’ hours
worked per week. Also included are the reinforcing feedback effects that sustained increases in
hours/week have on clinician fatigue, and subsequent effects of fatigue on exam quality and
backlog through re-work, as well as feedback to clinician burnout and quit rates. We also relate
that quit rate and subsequent replacement hiring with exam quality through the process of staff
building practical experience over time. Each of these feedback effects and how they interrelate
are explained in detail in the model design section (section 6) of Chapter 1. A simplified
diagram of the full model, which effectively presents all key systemic interactions, is shown in
Figure 1.
Work Pressure
Overtime
Fatigue
Quality
+
+
-
+ -+Target Wait Time
-
Service CapacityExpected Patient
Wait Time
+
PatientsWaiting for
Exam(s)Patient Referral
Rate
Exam Completion
Rate
Re-Work
Error Creation
Rate
Error Discovery
Rate
-
Total
PersonnelHiring/Firing Rate
+
-
-
+
Fatigue Rate
+
-
+
Figure 1. Stock and flow diagram of the C&P system dynamics model.
Only the high level map is shown; the full model consists of 143 equations, 9 levels, and 11 rates, and is included in
Appendix C.
We supported this model building with quantitative information held by hospital staff, internal
management reports, and the hospital’s electronic medical record system. All model parameters
were generated by analyzing hospital records and model behavior was validated against
historical demand and performance data. By working with those who had direct knowledge of
the system, we were able to access their 'mental models,' as well as more quantitative sources,

Rust 12
and were able to build a transparent model that was accepted as realistic in its formulation and
level of detail.
This level of interaction and collaboration was necessary for the creation of a useful, meaningful
simulation model that was suited to their unique context. Also, there are no other simulation
models or empirical evidence extant to assist healthcare managers with modifying management
heuristics or decision structures to better respond to demand variation, nor does the current
service management research literature provide practical advice to improve the ability to
synchronize the supply of care with patient demand (Vries & Huijsman, 2011). In the larger
field of supply chain management, the study of healthcare service delivery and patient logistics is
very new, and while it has a few exemplary initiates, still lacks much academic research (Shah et
al, 2008). Furthermore, C&P clinic managers were skeptical of the need to change their own
decision-making heuristics, even if it was clear in the abstract that the root cause to their current
performance problems was demand variation. Collaborative model building not only helped
validate the model, it also provided powerful evidence to support their subsequent management
change efforts.
Our dynamic analysis found that, though prevalent, other forms of variation were not a
significant cause of the patient access and exam quality problems being experienced in the C&P
clinic. Process variation, variation in patient characteristics, variation in provider practices and
opinions certainly occur in the C&P clinic, as in almost all healthcare service settings, but do not
appear to be significant contributors to the main performance problems. The unacceptable
increase in average service time and reduction in exam quality were clearly generated by patient
demand variation.
Demand variation led to this performance degradation because system structure and delays
inherent to managers’ decision process and subsequent resource allocation insured that the clinic
could not keep the supply of services adequately synchronized with extreme changes in demand.
The resultant increase in patient backlog and pressure on C&P clinicians created further adverse
effects that compounded the original increase in demand. Bringing new clinicians into the clinic
as a response to the growing backlog reduced staff’s average experience level with C&P
disability examinations. This unintentional, but unavoidable, decrease in experience led to
decreases in average exam quality, which increased re-work precisely at the least opportune time
to enlarging a second stream of demand for C&P services. Given the re-work discovery and
correction times of this particular C&P clinic, the delivery system structures and management’s
capacity adjustment decisions unintentionally amplified external demand variation, exacerbating
the patient access problem. This insight further established the need for management to be able
to respond quickly to any significant increase or decrease in patient demand, to prevent any
significant buildup of patient backlog and subsequent additional variation.
Rust 13
Simulation of operations-level changes to management decisions and system structures
suggested that increasing resource flexibility, defined as the ability to respond both quickly and
sufficiently to changes in patient demand, was most impactful. The specific operational changes
suggested resulted in expanding management’s control over setting the number of hours worked
per clinician per week, which simulations indicated would mitigate the demand amplification
effect of increasing re-work, and also render the system able to prevent future demand ‘shocks’
or severe variation from creating the patient access and exam quality problems experienced in
2010. A complete discussion and evaluation of the improvement scenarios proposed for the
C&P clinic, both to provider type and management decision heuristics is presented in section 6.4
of Chapter 1. Addressing other sources of variation was deemed to be of minimal importance, as
they were not significant contributors to the observed performance problems, when compared
against the effects of external demand variation.
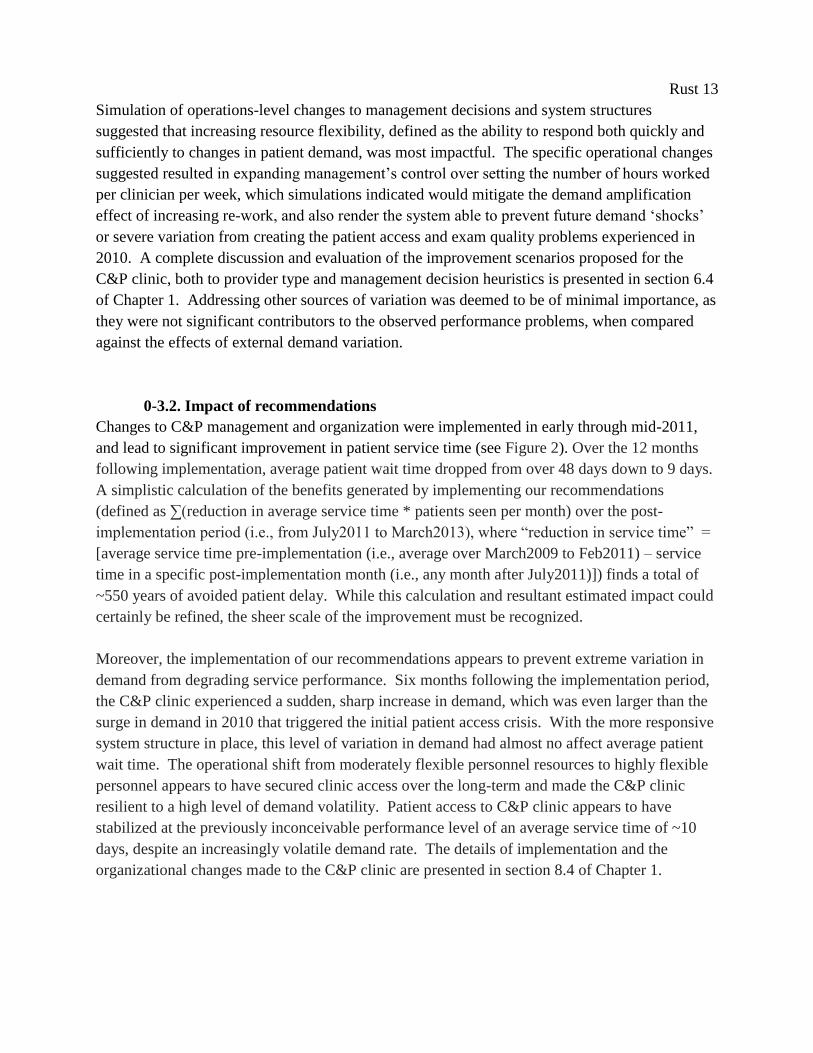
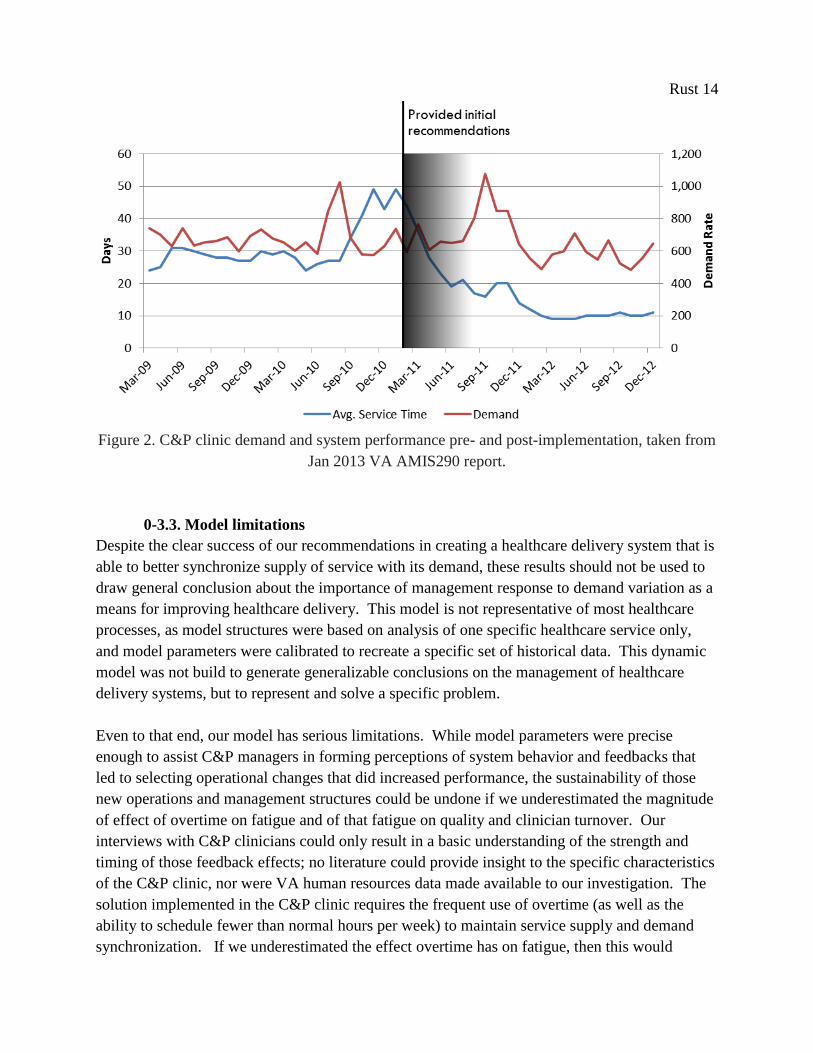
0-3.2. Impact of recommendations
Changes to C&P management and organization were implemented in early through mid-2011,
and lead to significant improvement in patient service time (see Figure 2). Over the 12 months
following implementation, average patient wait time dropped from over 48 days down to 9 days.
A simplistic calculation of the benefits generated by implementing our recommendations
(defined as ∑(reduction in average service time * patients seen per month) over the post-
implementation period (i.e., from July2011 to March2013), where “reduction in service time” =
[average service time pre-implementation (i.e., average over March2009 to Feb2011) – service
time in a specific post-implementation month (i.e., any month after July2011)]) finds a total of
~550 years of avoided patient delay. While this calculation and resultant estimated impact could
certainly be refined, the sheer scale of the improvement must be recognized.
Moreover, the implementation of our recommendations appears to prevent extreme variation in
demand from degrading service performance. Six months following the implementation period,
the C&P clinic experienced a sudden, sharp increase in demand, which was even larger than the
surge in demand in 2010 that triggered the initial patient access crisis. With the more responsive
system structure in place, this level of variation in demand had almost no affect average patient
wait time. The operational shift from moderately flexible personnel resources to highly flexible
personnel appears to have secured clinic access over the long-term and made the C&P clinic
resilient to a high level of demand volatility. Patient access to C&P clinic appears to have
stabilized at the previously inconceivable performance level of an average service time of ~10
days, despite an increasingly volatile demand rate. The details of implementation and the
organizational changes made to the C&P clinic are presented in section 8.4 of Chapter 1.
Rust 14
Figure 2. C&P clinic demand and system performance pre- and post-implementation, taken from
Jan 2013 VA AMIS290 report.
0-3.3. Model limitations
Despite the clear success of our recommendations in creating a healthcare delivery system that is
able to better synchronize supply of service with its demand, these results should not be used to
draw general conclusion about the importance of management response to demand variation as a
means for improving healthcare delivery. This model is not representative of most healthcare
processes, as model structures were based on analysis of one specific healthcare service only,
and model parameters were calibrated to recreate a specific set of historical data. This dynamic
model was not build to generate generalizable conclusions on the management of healthcare
delivery systems, but to represent and solve a specific problem.
Even to that end, our model has serious limitations. While model parameters were precise
enough to assist C&P managers in forming perceptions of system behavior and feedbacks that
led to selecting operational changes that did increased performance, the sustainability of those
new operations and management structures could be undone if we underestimated the magnitude
of effect of overtime on fatigue and of that fatigue on quality and clinician turnover. Our
interviews with C&P clinicians could only result in a basic understanding of the strength and
timing of those feedback effects; no literature could provide insight to the specific characteristics
of the C&P clinic, nor were VA human resources data made available to our investigation. The
solution implemented in the C&P clinic requires the frequent use of overtime (as well as the
ability to schedule fewer than normal hours per week) to maintain service supply and demand
synchronization. If we underestimated the effect overtime has on fatigue, then this would

Rust 15
results in an unintended buildup of fatigue, leading to decreased exam quality, average
experience levels (due to higher clinician turnover) and a reinforcing increase in re-work that
could eventually outweigh and overwhelm the performance gains experienced to date.
Also, our model does not explain the change in service standards shown in the months following
implementation. Our model boundaries did not include feedback between performance and
desired performance, nor any other structures governing how the level of desired performance is
selected. We can only offer conjecture as to the reasons the performance of the C&P clinic has
not returned to the previous level of an average service time of ~26 days. Perhaps the significant
honors received by the C&P management team for their improved performance provided them
with a level of notoriety that they did not wish to relinquish. The ability to keep patient service
times close to 10 days does place the hospital among the top performers in the nation. Perhaps
the C&P managers had reasons for hiring additional, unnecessary clinicians that they did not
reveal to us in our model building sessions, which led to the observed reduction in patient
backlog and subsequent lower average service time. While both theories are plausible, the
consistency of performance would suggest the former is closer to the truth, but without further
investigation, it is impossible to know with certainty. These limitations, and others, are
discussed in detail in the model description and analysis sections of Chapter 1.
However, the most important limitation of this model does not stem from its parameter
estimation or model boundaries, but from its level of abstraction. The most important abstraction
was the aggregation of steps in the pre-exam scheduling process and the post-exam results
reporting process into a single backlog of services waiting for completion. These steps in the
overall service delivery process were found not to contribute to the dynamic behavior of the
system, as no relation was found between those process steps, their own service capacities - as
these steps are completed by clerks or other non-clinical staff, and other system components or
performance measures. This reduction in model detail allows for a clearer interpretation of the
causal factors producing the behavior observed in simulation, but excludes potential demand
variation amplification effects generated by linking locally controlled steps in a service chain
(i.e., the ‘bullwhip effect’). The target service times and service backlogs for these other stages
in the C&P service delivery process are between 1/3 to an entire order of magnitude smaller than
the clinical steps of the care delivery process, as are the costs associated with those steps. The
C&P managers felt that the clarity offered by such an abstract representation was more useful
than the insights generated by including details on the actions of clerks, transcribers, and other
seemingly ancillary staff.
This abstraction fundamentally limits the ability to draw generalizable conclusions from this
initial work improving healthcare delivery. As discussed previously, most healthcare services do
not consist of only one stage or clinic, but multiple, discrete stages linked in series in a chain of
activities, all of which perform a necessary action to facilitate patient care in subsequent stages.
Rust 16
As healthcare becomes more advanced, these multiple, independent stages are linked in ever
more complex chains of care delivery. A different dynamic model is required to assess the
impact of this complexity on performance.
0-4. Healthcare Delivery as Service Chain
With the growing complexity of healthcare services, providers are increasingly dependent on
sharing care delivery activities with other, specialized healthcare professionals to provide
adequate patient care. Patients are now treated in service chains that combine interventions into
serial encounters with specialized providers and link theses encounters into clinical pathways.
Moreover, the implementation of more integrated care programs are frequently cited as common
operational change used to decrease resource utilization and improve healthcare quality (Aptel
and Pourjalali, 2001). Clearly, from both a theoretical and practical point of view, the healthcare
service delivery is changing significantly.
However, the variability and unpredictability inherent to healthcare demand renders this network
approach to care delivery difficult to manage (Li et al, 2002). Supply chain management
literature suggests that this trend of increasing complexity and interdependence of stages in the
healthcare delivery system has the effect of generating internal demand variability. Similar to the
‘bullwhip effect’ in manufacturing (Forrester, 1958, 1961; Lee et al, 1997), research on
healthcare service chains has identified structural tendencies toward internal demand variation
amplification as a key cause of supply chain stress, reducing access to services (as measured by
the distribution of service delivery time), and subsequent degradations in service quality and
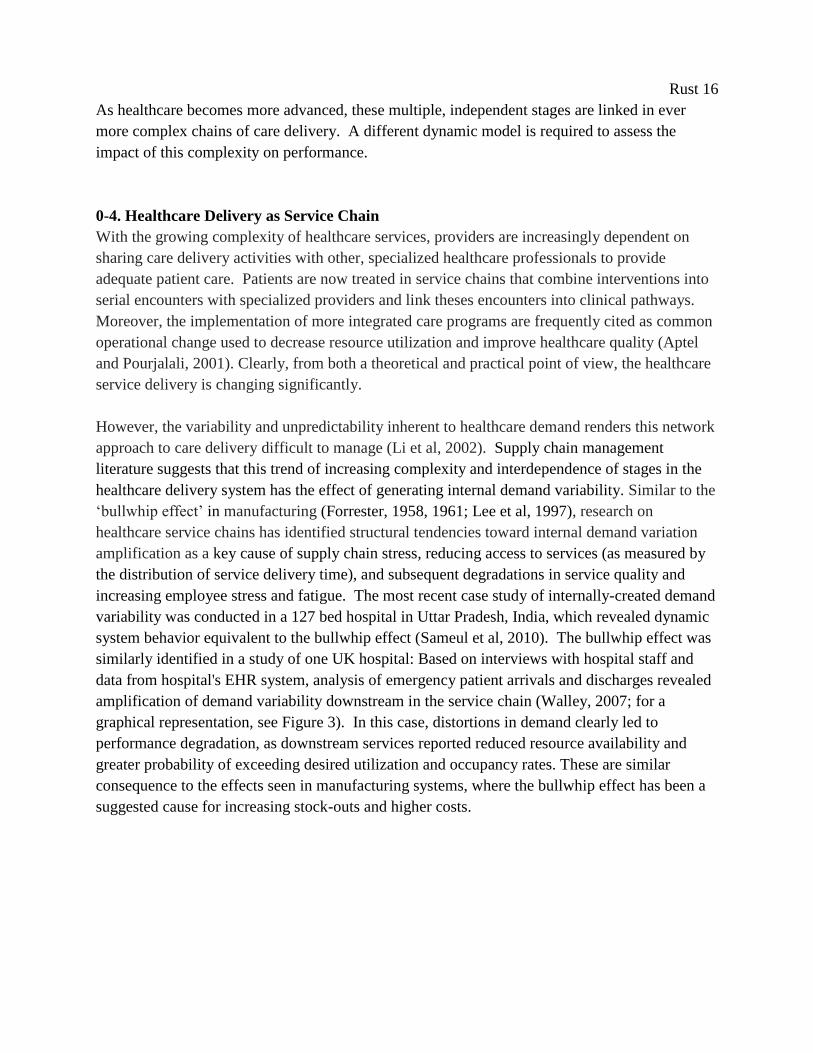
increasing employee stress and fatigue. The most recent case study of internally-created demand
variability was conducted in a 127 bed hospital in Uttar Pradesh, India, which revealed dynamic
system behavior equivalent to the bullwhip effect (Sameul et al, 2010). The bullwhip effect was
similarly identified in a study of one UK hospital: Based on interviews with hospital staff and
data from hospital's EHR system, analysis of emergency patient arrivals and discharges revealed
amplification of demand variability downstream in the service chain (Walley, 2007; for a
graphical representation, see Figure 3). In this case, distortions in demand clearly led to
performance degradation, as downstream services reported reduced resource availability and
greater probability of exceeding desired utilization and occupancy rates. These are similar
consequence to the effects seen in manufacturing systems, where the bullwhip effect has been a
suggested cause for increasing stock-outs and higher costs.

Rust 17
Figure 3. Patient admission and discharge rates showing downstream variation amplification in a
UK hospital (adapted from Walley, 2007).
A study of a large hospital in Australia also directly identifies the bullwhip effect in the patient
care chain for elective surgeries (Sethuraman & Tirupati, 2005). The increasing variation in
demand for services as elective patients move to downstream departments inside the hospital
creates the need to make more beds available in post-operative care wards than indicated by the
initial demand. On peak days, when the bullwhip effect causes the number of elective surgery
recovery patients to be artificially high, there is a shortage of beds in the in-patient wards, which
restricts the number of surgeries and reducing the theater utilization and hospital throughput on
subsequent days. Demand for nursing services is directly affected by higher variability, resulting
in higher labor costs. Demand variation amplification is also associated with increased
dependence on less experienced part-time or temp agency staff. Increasing demand variability
inside the patient care chain generally results in greater stress on employees, higher operating
costs, and lower hospital revenues. The growing interdependence of healthcare delivery leading
to demand variation amplification, coupled with pressure to reduce costs and serve greater
numbers of patients, makes healthcare service delivery chains increasingly difficult to manage
and coordinate.
However, despite the clear conclusion that system structures and management practices are the
cause of these demand variation amplification problems, research into the effective management
of increasingly interconnected healthcare delivery chains faced with highly variable demand is
practically nil. Service chain management in a healthcare context is very much an emerging
field, with only limited academic studies addressing the challenges unique to the healthcare
setting (Vries & Huijsman, 2011). Subsequent questions of how service delivery integration and
coordination of care systems regarding patient flows and resource management can be best
Rust 18
achieved operationally still are a relatively unexplored area of service supply chain management.
Most service supply chain management research is still theoretical or conceptually-focused as
opposed to operational in nature (Sampson & Froelhe, 2006), currently providing little to aid
healthcare managers facing the combination of demand volatility and increasingly integrated
care delivery chains. Furthermore, to date there has been limited success in improving system-
wide service chain management in real-world healthcare delivery systems (McKone-Sweet et al,
2005; Vries & Huijsman, 2011). There are very limited practical guidelines or sets of identified
best-practices for designing and implementing cost-effective, and at the same time, demand
responsive, healthcare delivery systems. Healthcare managers face a significant gap in
knowledge around the optimal design and management of complex care delivery systems to
ensure effective patient care.
0-4.1. Developing a generalizable model
We address this gap in knowledge by extending our original analysis of the dynamic interplay
between external demand variability, clinic manager’s decision heuristics, and resource
allocation structures from one specific clinic to an entire healthcare service chain. The purpose
of this model is to draw generalizable conclusions on the effectiveness of our proposed strategy
to improve healthcare delivery through changing management response to demand variation.
The dynamic simulation model we create captures the essential elements of reality common to
most healthcare delivery chains rather than perfectly simulating one specific service. The
healthcare service chain depicted is thus an abstract representation of a broad spectrum of
possible healthcare services. The limitations inherent to this approach, both to analyzing model
behavior and to the applicability of our conclusions, are discussed in the next section.
This new model is both a simplification of the original and an extension. Like the initial model,
this new, more generic healthcare service chain contains no variability in clinical care itself or
provider preferences, and also excludes variation in the characteristics of individual patients. We
further simplify the original model by removing the complex feedbacks related to overtime,
fatigue, quality, and rework. Not all healthcare service managers have ability to schedule
overtime. This additional system structure to change service capacity is subsumed into a general
representation of adding or removing staff from the stock of employees.
This abstraction that employees can only work a fixed number of hours per week severs causal
connections to fatigue, exam quality, and rework creation. While this simplifying assumption
certainly cannot be said to be the norm in healthcare services, we believe excluding these
feedbacks from the generic model is appropriate, and should not alter our model behavior
significantly. The effect of fatigue on service quality and the creation of internal demand
variability has been studied before in detail. In their simulation case study of a European
telecom firm, Akkermans and Vos (2003) use a similar model to our generic healthcare service
Rust 19
chain to explore the effect of rework on service chain performance and the ‘bullwhip effect.’
They develop insight into the interdependence between employee stress, work quality, rework,
and demand variation amplification, concluding that the addition of these feedbacks amplifies
internal demand variation, and that the magnitude of demand amplification is directly governed
by model parameters for error creation and rework discovery and correction.
Simply from the model’s structure, we can infer that removing these links in the generic model
eliminates a potentially significant, self-reinforcing in-flow into clinics’ backlogs, which will
result in the model generating a reduced ‘bullwhip effect’ than would occur with these links in
place. However, the magnitude of the impact of this assumption of no fatigue and perfect quality
depends on how divergent these parameters are from the real-world healthcare delivery chain it
is being used to represent. The more divergence, either in error creation or in discovery and
correction times, the less the recommendations and conclusions gleaned from our simplified
model should be used to improve any real-world healthcare delivery system.
We extend the original model to include multiple, serial stages in the service chain. These stages
can represent individual clinics, as in our C&P case study, or individual hospital departments.
They represent any discrete stage of a patient care process with its own locally controlled staff
that is linked in series to provide patient care. For consistency, we will refer to these patient care
stages as ‘clinics’ from here on. Each clinic in our model operates in an identical manner, has
identical performance standards and parameters, and is autonomous, with capacity decisions
based only on the information available at each clinic. Each clinic is linked, as the output of
clinici forms the demand to clinici+1, but each clinic requires a separate resource to serve its
patient backlog, which could either be from requiring a different set of skills to complete the
tasks in each clinic, or that an organizational structure prevents sharing resources between
clinics.
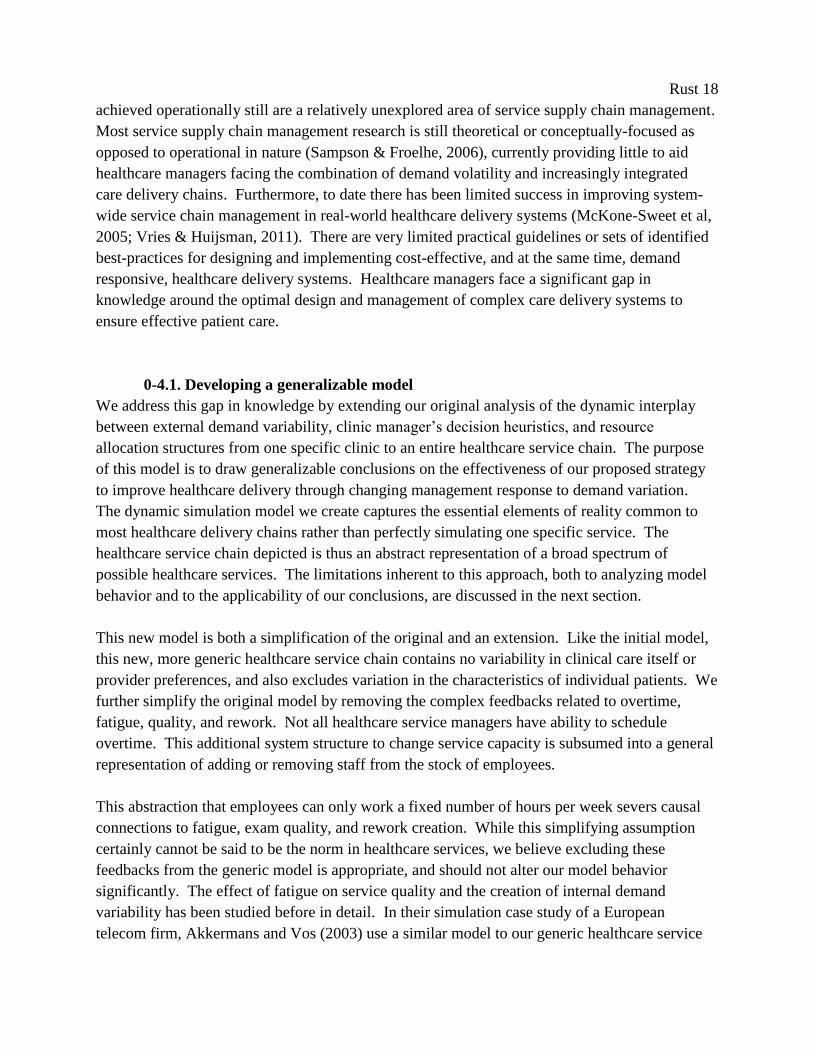
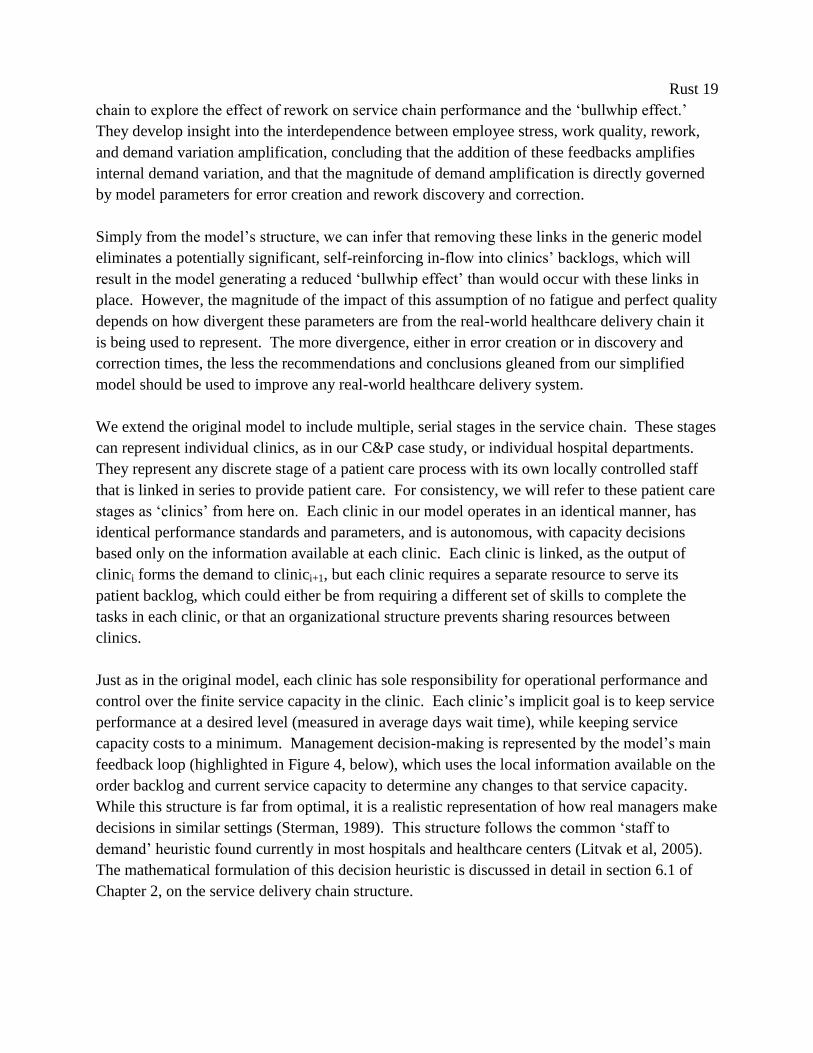
Just as in the original model, each clinic has sole responsibility for operational performance and
control over the finite service capacity in the clinic. Each clinic’s implicit goal is to keep service
performance at a desired level (measured in average days wait time), while keeping service
capacity costs to a minimum. Management decision-making is represented by the model’s main
feedback loop (highlighted in Figure 4, below), which uses the local information available on the
order backlog and current service capacity to determine any changes to that service capacity.
While this structure is far from optimal, it is a realistic representation of how real managers make
decisions in similar settings (Sterman, 1989). This structure follows the common ‘staff to
demand’ heuristic found currently in most hospitals and healthcare centers (Litvak et al, 2005).
The mathematical formulation of this decision heuristic is discussed in detail in section 6.1 of
Chapter 2, on the service delivery chain structure.
Rust 20
Triage Admission Recovery
PatientArrival
PatientDiagnosis
PatientTreatment
PatientDischarge
adsfl;kjadadsfl;kjad 0
Patient
Backlog (B)Patient Arrival
Rate (Ra)
Patient Care
Completion Rate (Rc)
Adding or Removing
Providers (Rs)
Maximum
Completion Rate
B
+
+
Time to Adjust
Workforce (Tc)-
Minimum Care
Duration (Tm)
-
Target Service
Time (Ts)
Desired Care
Capacity-
+
+ Service
Capacity (C)
-
+
Capacity
Management
Meeting WFGoal
Work Availability
B
B
a;lkjf a;lkjf 0
a;lkjf 1
Figure 4. A generic, multi-stage healthcare service delivery model, with the feedback structure of
a single representative stage (i.e., clinic or hospital department) shown.
The main capacity adjustment loop is highlighted. This healthcare delivery chain could contain any number of
individual stages, here we have arbitrarily shown a three stage chain.
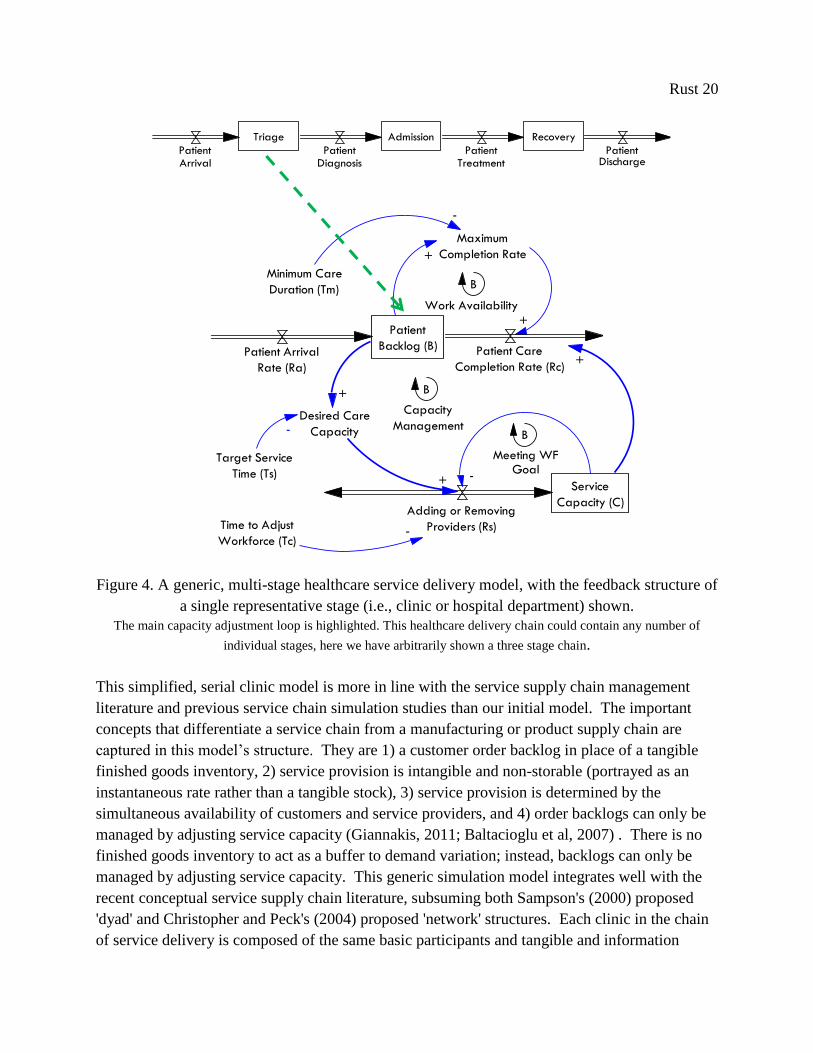
This simplified, serial clinic model is more in line with the service supply chain management
literature and previous service chain simulation studies than our initial model. The important
concepts that differentiate a service chain from a manufacturing or product supply chain are
captured in this model’s structure. They are 1) a customer order backlog in place of a tangible
finished goods inventory, 2) service provision is intangible and non-storable (portrayed as an
instantaneous rate rather than a tangible stock), 3) service provision is determined by the
simultaneous availability of customers and service providers, and 4) order backlogs can only be
managed by adjusting service capacity (Giannakis, 2011; Baltacioglu et al, 2007) . There is no
finished goods inventory to act as a buffer to demand variation; instead, backlogs can only be
managed by adjusting service capacity. This generic simulation model integrates well with the
recent conceptual service supply chain literature, subsuming both Sampson's (2000) proposed
'dyad' and Christopher and Peck's (2004) proposed 'network' structures. Each clinic in the chain
of service delivery is composed of the same basic participants and tangible and information

Rust 21
flows as Sampson's model, but each of these clinics is in turn linked through the exchange of
information and customers. We believe our model structure represents an operationalized
synthesis of current service supply chain concepts.
This new model builds on a thread started by Anderson and Morrice (1999, 2000), who were the
first to use system dynamics to simulate a multi-stage service system with their model of the
mortgage service industry. Other dynamic serial service models have followed, including
publications by Akkermans and Vos (2003) and Anderson et al. (2005, 2006). The models used
in all of these studies are based on the same underlying assumptions and no clear criticism or
alternative structure has emerged in the system dynamics or service supply chain literatures.
Indeed, Sampson and Froehle cite these models as "clear exceptions" to what they describe as the
normally "forced and unclear" application of supply chain management principles and models to
services (2006, p.337).
0-4.2 Limitations and applicability of the generic model
The main abstraction that permits clear analysis of the bullwhip effect and the effect changing
management structures has on healthcare service delivery is also the abstraction that limits the
direct applicability of this model to any one healthcare service delivery chain. Chains of
identical clinics, where desired service times, capacity adjustment practices, and service quality
are all equivalent, are simply not a realistic representation of almost any healthcare delivery
system. The stages, clinics, or departments in any healthcare service chain are much more likely
to be different in all of these characteristics than they are to be the same. It is heroic to assume
that the conclusions generated by this model apply to all healthcare service system.
However, while not universally applicable, there are many healthcare services where the
differences in these parameters and structures are minimal, and thus could benefit from the
knowledge generate by a dynamic analysis of this abstract model. The applicability of our
conclusions depends on how closely a real-world healthcare service chain’s stages are to having
similar properties. We discuss each parameter in detail, citing examples where we believe these
factors are similar enough to warrant the consideration of our conclusions and recommendations.
Desired service times: The distinct clinics in our abstract healthcare service could portray
a care chain that takes a patient across multiple organizations and locations, where each clinic
has a desired service time measured in months; for example, an elective surgery chain, that starts
with a visit to a primary care provider, then next to a specialist, then to an out-patient surgery
clinic. Each of these stages in our change could conceivably have a desired average patient wait
time of two months (i.e., two months to get an appointment with a primary care physician, two
months to get an appointment with a specialist, and two months to schedule the out-patient
procedure). Our model could also apply to patient care chains where each stage lasts only an
Rust 22
hour; for example, a trip to the emergency department might last a total of four hours, with each
stage patient intake, triage, clinical interview, and discharge with prescription taking one hour
each.
Our conclusions and recommendations should not be applied to a patient care chain with stages
with very dissimilar desired service times; for example, it is not an accurate representation of the
care process for patients suffering heart attacks. This patient care chain starts in the emergency
department (where desired service time is measured in minutes), then proceeds to the in-patient
recovery wards (where the desired service time is measured in days), and finally to physical
therapy (where the desired time is measured in months). Sensitivity analysis on the variation in
desired service times across clinics in our abstract healthcare delivery chain is conducted in
section 8 of Chapter 2, where we test the effects altering the distribution of service times has on
resultant demand variation amplification and total patient service time. We find that varying
these parameters significantly affects the magnitude of the amplification inherent to the service
chain, with an even distribution resulting in the most downstream demand variation
amplification. A detailed explanation for why changing these parameters produces this behavior
is included in section 8 of Chapter 2. Thus, this assumption of identical desired service delivery
times in our abstract model results in an over-estimation of the ‘bullwhip effect’ compared to
that created by most real-world healthcare delivery chains, with the magnitude of this error
increasing the more the parameters diverge. However, this ‘bullwhip magnifying’ assumption
counteracts the previously stated ‘bullwhip diminishing’ assumptions discussed in section 4.1 of
this introduction. Testing the effects of relaxing these assumptions to represent more specific,
real-world healthcare delivery chains is the subject of future work.
Capacity adjustment processes: Similar to the examples above, there are many patient
care chains where each stage has a similar process, and overall delay time, for adjusting its
service capacity. For example, inside the emergency department, most stages have an ‘on-call’
clinician ready to support the current staff if demand increases at any stage in the emergency care
process, resulting in an equivalent reaction no matter the specific type of staff needed. There are
other patient care chains where each stage takes many months to add capacity. In the previous
out-patient specialty surgery example, for any one of those clinics to change its service capacity,
they must go through the same process of posting a position for, interviewing, credentialing, and
finally hiring a new clinician, which, when summed together, are probably equivalent no matter
the type of clinician, whether general practitioner, specialists, or specialty surgeon.
The importance of variation in these two parameters is evaluated through simulation experiments
in subsequent chapters. We find that large differences in capacity adjustment times affect the
behavior of the service chain, as do the combination of differences in these two parameters
between clinics in our model. We explore the interaction effects of these two distributions in
section 8.3 of Chapter 3 on ‘Coordinated planning.’ We find that, similar to varying the

Rust 23
distribution of parameters governing individual clinics’ desired service times, altering the
distribution of capacity adjustment times away from our simplifying assumption of uniformity
reduces the bullwhip effect. However, we find that varying the distribution of these two
parameters together results in even more complex behavior and significant impact on inherent
downstream variation amplification. Causal explanations for these interaction effects is
discussed in section 8.3 of Chapter 3. Given the impact of the assumption of uniformity in these
model parameters on overall model behavior, we recommend against applying our conclusions to
real-world healthcare chains with differing parameters without serious consideration, and
propose this as the subject for future research, both in simulation and especially in quantitative
analysis of real-world healthcare service chains.
Service quality: In our generic model, we assume that each stage makes an equivalent
number of mistakes and that the creation of mistakes is not dynamically related to any other
element in the model. As discussed previously, this is obviously not the case in most healthcare
service systems. It is highly unlikely that the quality of care provided in each clinic in a
healthcare service chain are the same, it also unlikely that any individual real-world service chain
would even know the relative quality of each of its clinics. While much research has been
conducted on understanding the root causes of errors made in healthcare services, little research
has been done comparing the relative magnitude of these causes between stages in a care
delivery chain, or general conclusions about the dynamic interaction of these causes and other
elements in our generic model. More precise estimation of the effects of relation of the
patient:provider ratio to service quality in diverse clinical settings would increase the
significance of our results. Our model excludes dynamic effects related to service quality, as
there is little generic analysis in the literature to guide model design on this issue. Without
reliable, generalizable correlations or parameter estimates from the field, it is difficult to produce
a direct measure of the impact of the bullwhip effect on risks to patient health. See section 7.1 of
chapter 2 on ‘Performance measures’ for further discussion.
There are other limitations and potential bias inherent to the structure of our generic model. By
excluding, 1) the dynamic effects of increased patient service time on patient health, 2) the effect
of service quality on clinic rework rates, and 3) variation in both individual patient and provider
characteristics, we limit both the complexity of model behavior and the scope of our subsequent
policy analysis. These elements should be included in future simulation studies, but, to provide
value, must be calibrated to a specific service delivery chain. As discussed in the limitations of
the initial model, past service supply chain research suggests that these additional feedbacks may
magnify the variation amplification effect (Akkermans & Vos, 2003), thus our model potentially
under-estimates the bullwhip effect and its effects clinic performance.
Rust 24
0-5. Simulation Experiments
Given these constraints and limitations, we use this generic model to conduct two sets of
experiments. Both of these explore the impacts of demand variability and changing the
structures and parameters governing management decision-making on the performance of
healthcare service delivery systems.
The first set addresses the current focus in healthcare delivery on improving efficiency and
reducing cost, rather than directly targeting demand variability. Specifically, in this first set of
experiments, we explore the intended, and unintended, effects of the dominant healthcare service
improvement paradigm, ‘lean,’ which aims to redesign healthcare service delivery chains to be
able to serve more patients with fewer resources. This set of experiments fills a crucial gap in
knowledge, as, to date, there has been minimal research on the effect of unpredictable demand
variability on the outcomes of lean redesign efforts, in either service or manufacturing contexts,
nor any work firmly criticizing the use of lean in healthcare delivery in the literature (Brandao de
Souza, 2009).
The second set of experiments is designed to expand understanding of the use of a contrasting
management paradigm, ‘agile,’ in the realm of healthcare delivery. First coined by researchers at
the Iacocca Institute at Lehigh University in 1991, ‘agile’ focuses on increasing system
responsiveness to demand through changing all parts of a product or service system, from
organizational structures, to information systems, to logistics processes, to management decision
heuristics. Agile has recently been suggested as a means to improve healthcare service delivery
(Vries & Huijsman, 2011), but specific practices or operational plans to increase 'agility' have
not been developed for service chains, including healthcare. This experiment set starts to fill this
significant gap in knowledge, exploring how agile strategies can be translated into operational
plans in healthcare service delivery; understanding the trade-offs created by individual agile
practices in healthcare delivery systems on patient access, service quality, and cost control; and
gauging the comparative effectiveness of individual agile practices at improving performance
along those dimensions. Each set of experiments is discussed in detail in the following sections.
These two experiment sets were also chosen because ‘lean’ and ‘agile’ are often presented as
contrasting performance improvement strategies in the supply chain management literature, with
their effectiveness determined by the context characteristics in which they are applied. The use
of the two strategies is usually separated by characteristics of both customer demand and
production methods for a given product or service. Bruce et al. (2004) find that agile is most
applied to products that have short life cycles and require low or no finished inventory, while
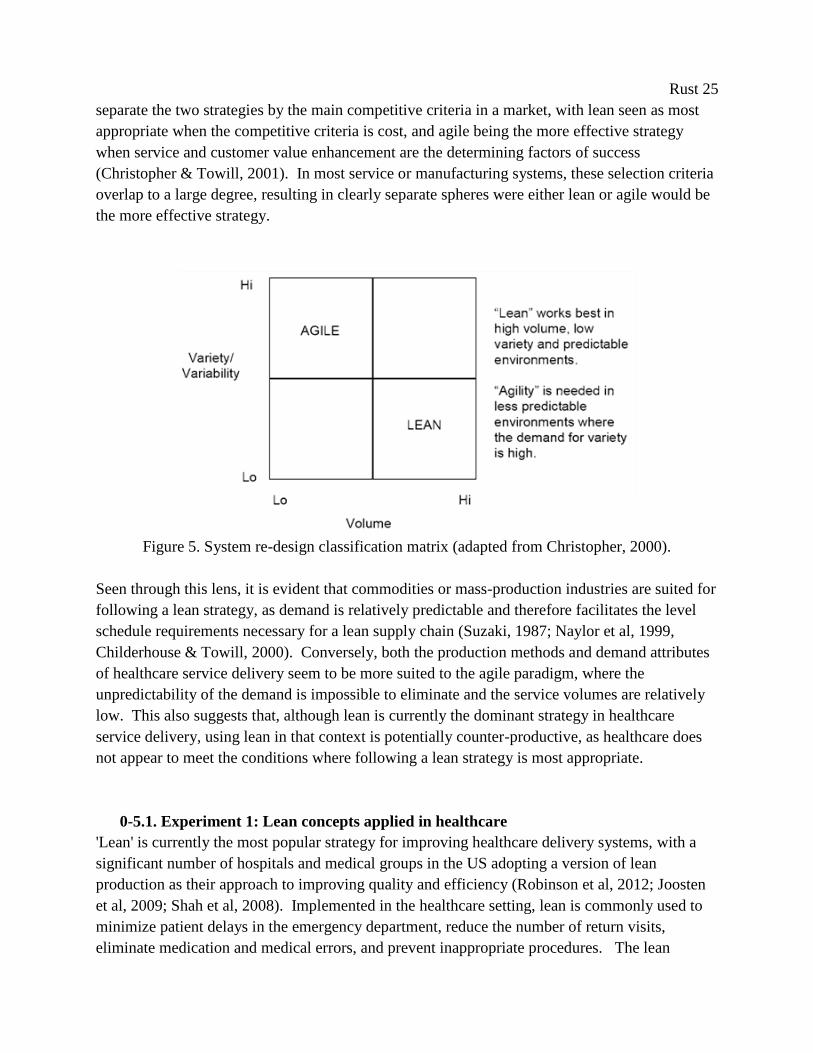
lean is more applied to durable goods. Christopher (2000) suggests that agile is the preferred
improvement strategy in contexts where demand volatility is high, the products or services
demanded are highly variable, and production volumes are low; while lean is the preferred
strategy when demand is predictable and the volume is high (see Figure 5). Other researchers
Rust 25
separate the two strategies by the main competitive criteria in a market, with lean seen as most
appropriate when the competitive criteria is cost, and agile being the more effective strategy
when service and customer value enhancement are the determining factors of success
(Christopher & Towill, 2001). In most service or manufacturing systems, these selection criteria
overlap to a large degree, resulting in clearly separate spheres were either lean or agile would be
the more effective strategy.
Figure 5. System re-design classification matrix (adapted from Christopher, 2000).
Seen through this lens, it is evident that commodities or mass-production industries are suited for
following a lean strategy, as demand is relatively predictable and therefore facilitates the level
schedule requirements necessary for a lean supply chain (Suzaki, 1987; Naylor et al, 1999,
Childerhouse & Towill, 2000). Conversely, both the production methods and demand attributes
of healthcare service delivery seem to be more suited to the agile paradigm, where the
unpredictability of the demand is impossible to eliminate and the service volumes are relatively
low. This also suggests that, although lean is currently the dominant strategy in healthcare
service delivery, using lean in that context is potentially counter-productive, as healthcare does
not appear to meet the conditions where following a lean strategy is most appropriate.
0-5.1. Experiment 1: Lean concepts applied in healthcare
'Lean' is currently the most popular strategy for improving healthcare delivery systems, with a
significant number of hospitals and medical groups in the US adopting a version of lean
production as their approach to improving quality and efficiency (Robinson et al, 2012; Joosten
et al, 2009; Shah et al, 2008). Implemented in the healthcare setting, lean is commonly used to
minimize patient delays in the emergency department, reduce the number of return visits,
eliminate medication and medical errors, and prevent inappropriate procedures. The lean
Rust 26
approach in healthcare is adapted from the Toyota Production System, and focuses on improving
process efficiency through the elimination of waste, or muda, which is defined as any activity
that consumes resources but generates no redeeming value for the patient (Womack & Jones,
1996).
Previous research in supply chain management finds that, in markets with significant demand
variability, increasing efficiency in service delivery chains without regard to either the context or
an understanding of how those changes would affect the entire delivery chain can reduce the
ability of that system to synchronize production with customer demand. This inverse
relationship between efficiency and the ability to meet a changes in demand volume is found in
theoretical research (Slack, 1983; Easton & Rothschild, 1987; Carlsson, 1989), industry case
studies (Wheelwright, 1995), and large, cross-sectional industry surveys (Suarez et al, 1996;
Sanchez & Perez, 2005). Even at Toyota, the incubator of lean, Adler et al. (1999), find
evidence for a trade-off between production efficiency and the ability to change production to
synchronize production with demand. If this trade-off exists in healthcare service delivery as
well, then this would mean that the more ‘lean’ a system becomes, the less that system will be
able to meets its patients’ needs and the lower overall quality of care it will provide.
This trade-off may be acceptable in manufacturing or service systems where the cost of
temporarily not meeting demand is relatively low. However, this capability is critical for
healthcare service delivery chains, as patient volumes are constantly changing and measures of
quality in almost all healthcare service delivery systems have time sensitive components
(Aronsson et al, 2011). The longer patients wait for care in any stage in a service delivery chain,
the more likely their condition will deteriorate in the interim. Since being able to respond in an
appropriate and timely fashion is critical to providing effective care, the potential for life-
threatening consequences of ‘lean’ diminishing the ability to match supply of services to demand
is worth investigating.
The aim of this research is to better understand the complex effects of lean improvement in
healthcare delivery systems on overall service delivery, quality, and cost in a service chain with
unknown, variable demand. We investigate the structural causes for the existence of a
significant trade-off between increased efficiency and they ability to synchronize service
capacities with demand in the healthcare delivery chain. Our hypothesis is that ‘lean,’ in its
current state of affecting single, isolated improvements in clinic efficiency without regard to the
complex dynamics of the healthcare setting, is detrimental to the responsiveness of healthcare
services to patient demand, leading to reduced access to services, and further possible subsequent
consequences in service quality and cost. We test for these feedback effects in simulation in our
generic model, and in turn, evaluate the importance of matching improvement strategy to
context.
Rust 27
This set of experiments answers the specific research questions:
1. What are the adverse effects or increased risks generated by following a lean
improvement strategy in a service delivery chain facing unpredictable, highly variable
demand (such as healthcare service delivery)?
2. Does a following a lean strategy without addressing demand volatility reduce the
effectiveness of healthcare improvement efforts in the long-term?
3. How can agile concepts be incorporated with efforts to improve individual stage (i.e.,
clinic or hospital department) efficiency to mitigate these risks?
0-5.1. Experiment 2: Agile concepts applied in healthcare
The second set of experiments focuses on the alternative improvement paradigm of ‘agile,’
which has recently been suggested as a means to improve healthcare service delivery (Vries &
Huijsman, 2011). Many manufacturing companies have followed agile principles to improve
their supply chain’s ability to better accommodate and synchronize production and delivery with
volatile demand, resulting in increased revenues and market share (see Lee, 2004 for discussion).
The core agile strategies – increasing market sensitivity, incorporating real-time demand
information in management decisions, coordinating planning over the entire service chain, and
integrating processes and performance management are across all stages in the chain – seem
perfectly suited for improving the management of complex healthcare organizations faced with
inherently variable demand.
However, even if manufacturing case studies and conceptual models of agility are available, the
extant literature fails to clearly delineate how agile concepts can be applied to aid healthcare
service delivery. The question how to best integrate agile strategies into healthcare is an
uncovered field in the area of supply chain management, and has only most recently been a
suggested topic of research (Vries & Huijsman, 2011). Specific practices or operational plans to
increase 'agility' have not been developed for service chains, including healthcare. To our
knowledge, there are no agile case studies addressing the challenges unique to the healthcare
setting. This is a clear gap in knowledge that limits the improvement of healthcare service
delivery chains. Moreover, the comparative effectiveness of individual agile operational plans is
also unknown, as are the trade-offs created by individual agile practices on cost, service access,
and service quality. Given the resource constraints in most hospitals, it is useful, if not critical,
to develop an understanding of how, and to what effect, specific agile-derived operational plans
can be used to improve healthcare service delivery.
We seek to address these gaps by determining how agile principles can be operationalized in
healthcare service chains to address issues of patient access, service quality, and cost control.
From the literature, we define specific operational practices based on core agile strategies, then
test these operations-level changes in our generic healthcare delivery model. We establish the
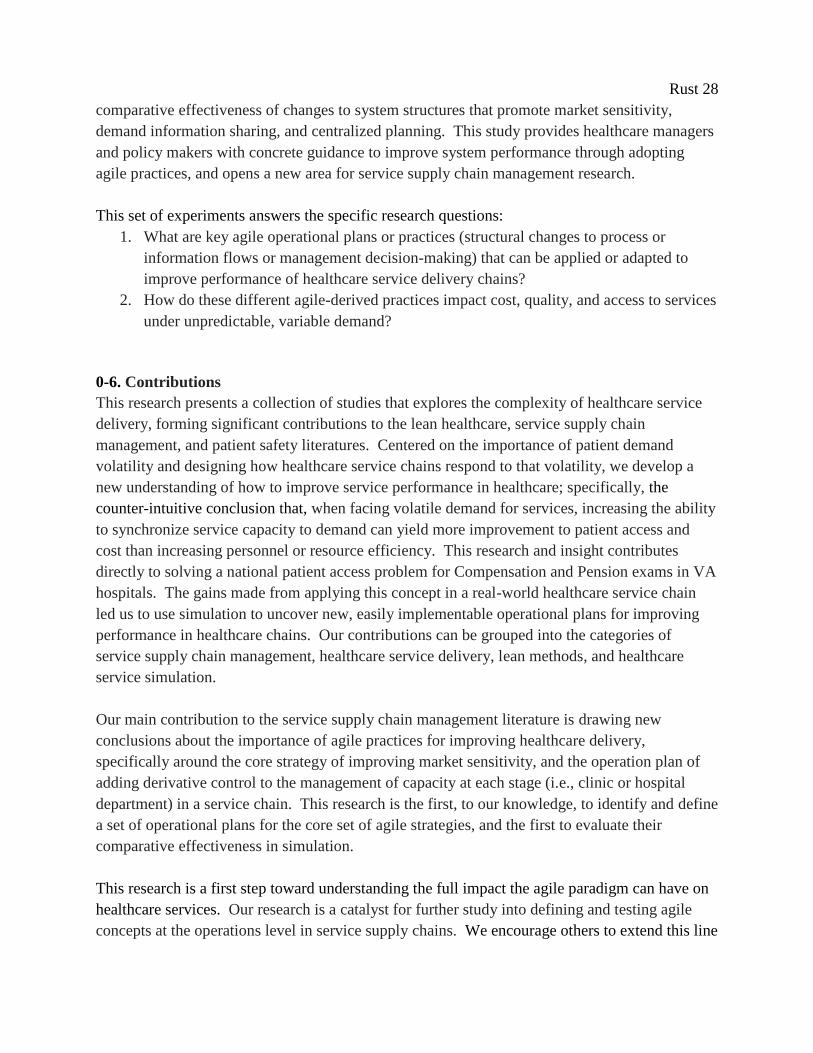
Rust 28
comparative effectiveness of changes to system structures that promote market sensitivity,
demand information sharing, and centralized planning. This study provides healthcare managers
and policy makers with concrete guidance to improve system performance through adopting
agile practices, and opens a new area for service supply chain management research.
This set of experiments answers the specific research questions:
1. What are key agile operational plans or practices (structural changes to process or
information flows or management decision-making) that can be applied or adapted to
improve performance of healthcare service delivery chains?
2. How do these different agile-derived practices impact cost, quality, and access to services
under unpredictable, variable demand?
0-6. Contributions
This research presents a collection of studies that explores the complexity of healthcare service
delivery, forming significant contributions to the lean healthcare, service supply chain
management, and patient safety literatures. Centered on the importance of patient demand
volatility and designing how healthcare service chains respond to that volatility, we develop a
new understanding of how to improve service performance in healthcare; specifically, the
counter-intuitive conclusion that, when facing volatile demand for services, increasing the ability
to synchronize service capacity to demand can yield more improvement to patient access and
cost than increasing personnel or resource efficiency. This research and insight contributes
directly to solving a national patient access problem for Compensation and Pension exams in VA
hospitals. The gains made from applying this concept in a real-world healthcare service chain
led us to use simulation to uncover new, easily implementable operational plans for improving
performance in healthcare chains. Our contributions can be grouped into the categories of
service supply chain management, healthcare service delivery, lean methods, and healthcare
service simulation.
Our main contribution to the service supply chain management literature is drawing new
conclusions about the importance of agile practices for improving healthcare delivery,
specifically around the core strategy of improving market sensitivity, and the operation plan of
adding derivative control to the management of capacity at each stage (i.e., clinic or hospital
department) in a service chain. This research is the first, to our knowledge, to identify and define
a set of operational plans for the core set of agile strategies, and the first to evaluate their
comparative effectiveness in simulation.
This research is a first step toward understanding the full impact the agile paradigm can have on
healthcare services. Our research is a catalyst for further study into defining and testing agile
concepts at the operations level in service supply chains. We encourage others to extend this line
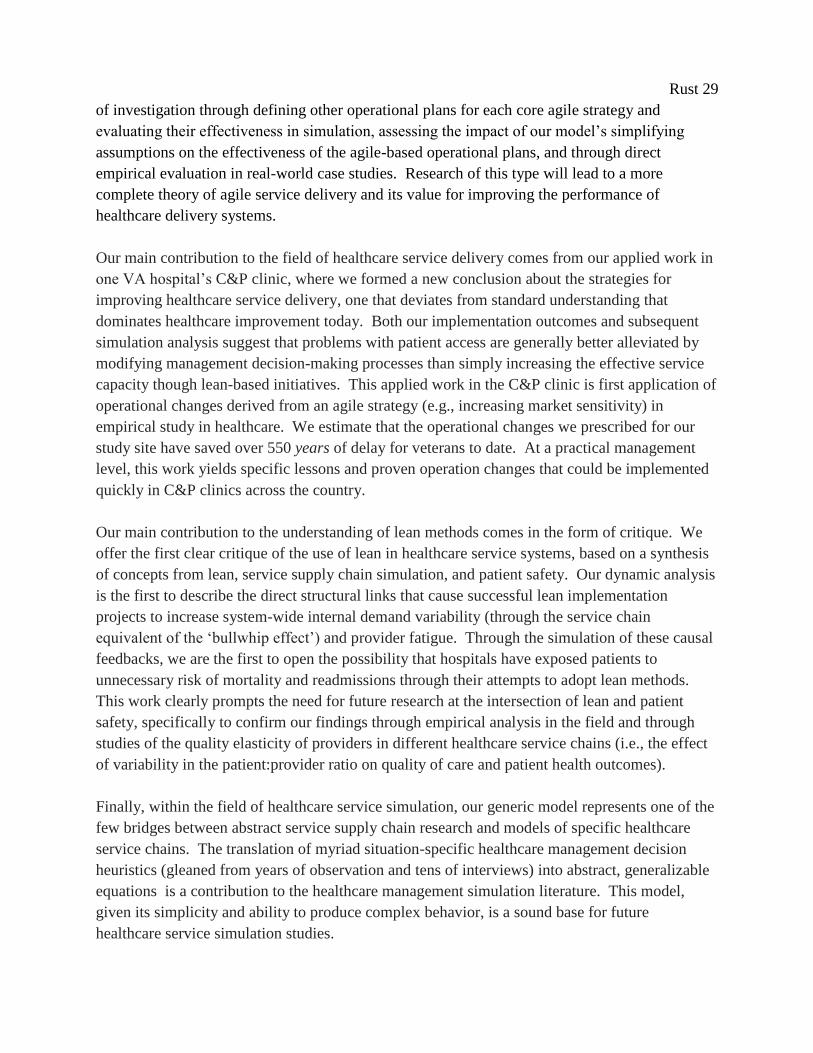
Rust 29
of investigation through defining other operational plans for each core agile strategy and
evaluating their effectiveness in simulation, assessing the impact of our model’s simplifying
assumptions on the effectiveness of the agile-based operational plans, and through direct
empirical evaluation in real-world case studies. Research of this type will lead to a more
complete theory of agile service delivery and its value for improving the performance of
healthcare delivery systems.
Our main contribution to the field of healthcare service delivery comes from our applied work in
one VA hospital’s C&P clinic, where we formed a new conclusion about the strategies for
improving healthcare service delivery, one that deviates from standard understanding that
dominates healthcare improvement today. Both our implementation outcomes and subsequent
simulation analysis suggest that problems with patient access are generally better alleviated by
modifying management decision-making processes than simply increasing the effective service
capacity though lean-based initiatives. This applied work in the C&P clinic is first application of
operational changes derived from an agile strategy (e.g., increasing market sensitivity) in
empirical study in healthcare. We estimate that the operational changes we prescribed for our
study site have saved over 550 years of delay for veterans to date. At a practical management
level, this work yields specific lessons and proven operation changes that could be implemented
quickly in C&P clinics across the country.
Our main contribution to the understanding of lean methods comes in the form of critique. We
offer the first clear critique of the use of lean in healthcare service systems, based on a synthesis
of concepts from lean, service supply chain simulation, and patient safety. Our dynamic analysis
is the first to describe the direct structural links that cause successful lean implementation
projects to increase system-wide internal demand variability (through the service chain
equivalent of the ‘bullwhip effect’) and provider fatigue. Through the simulation of these causal
feedbacks, we are the first to open the possibility that hospitals have exposed patients to
unnecessary risk of mortality and readmissions through their attempts to adopt lean methods.
This work clearly prompts the need for future research at the intersection of lean and patient
safety, specifically to confirm our findings through empirical analysis in the field and through
studies of the quality elasticity of providers in different healthcare service chains (i.e., the effect
of variability in the patient:provider ratio on quality of care and patient health outcomes).
Finally, within the field of healthcare service simulation, our generic model represents one of the
few bridges between abstract service supply chain research and models of specific healthcare
service chains. The translation of myriad situation-specific healthcare management decision
heuristics (gleaned from years of observation and tens of interviews) into abstract, generalizable
equations is a contribution to the healthcare management simulation literature. This model,
given its simplicity and ability to produce complex behavior, is a sound base for future
healthcare service simulation studies.

Rust 30
Taken all together, this research suggests a clear shift is necessary in both the guiding theory and
practice of healthcare delivery improvement efforts. Our hope is that this research will
successfully highlight the importance of designing care systems that respond effectively to
variability in patient demand; how improving demand responsiveness can also lead to reduced
costs, as resources are matched more effectively to demand; and provide healthcare practitioners
and leaders with practical insights for applying simple, effective operational plans to improve
performance in their own healthcare delivery systems.
0-7. Dissertation structure
This dissertation is organized as follows. The first chapter, titled “A New Approach to
Improving Healthcare Delivery: the importance of resource flexibility,” presents a detailed
narrative of our work with the Compensation and Pension clinic, including model development,
scenario tests, implementation efforts, and overall conclusions drawn from the experience.
The second chapter, titled “The Unintended, Adverse Effects of 'Leaner' Healthcare,”
encompasses our first experiments conducted with our generic healthcare delivery model. The
experiments in this chapter focus on the effects of the application of lean-based improvement
methods on demand variation amplification and the subsequent unintended consequences of
wider distribution of service delays, increased provider fatigue, reduced quality of care, and the
possibility of increased patient mortality. This chapter highlights the importance of collaborative
planning and performance measurement in healthcare and offers critical managerial insights for
hospital systems considering applying lean methods to their service delivery chains.
The third chapter, titled “Adapting Agile Strategies to Healthcare Service Delivery,” is the
collection of our analysis of the applicability of agile strategies to the context of healthcare
service delivery, our development of specific operational plans for these agile strategies, and our
test of their comparative effectiveness. This study provides healthcare managers and policy
makers with concrete guidance to improve system performance through adopting agile practices,
and opens a new area for service supply chain management research
The final chapter presents our conclusions, namely the implications of our work; our
contributions to the fields of service supply chain management, healthcare service delivery, and
lean methods; our research shortcomings; and possible future work. The concluding sections of
this dissertation contain appendices and references.
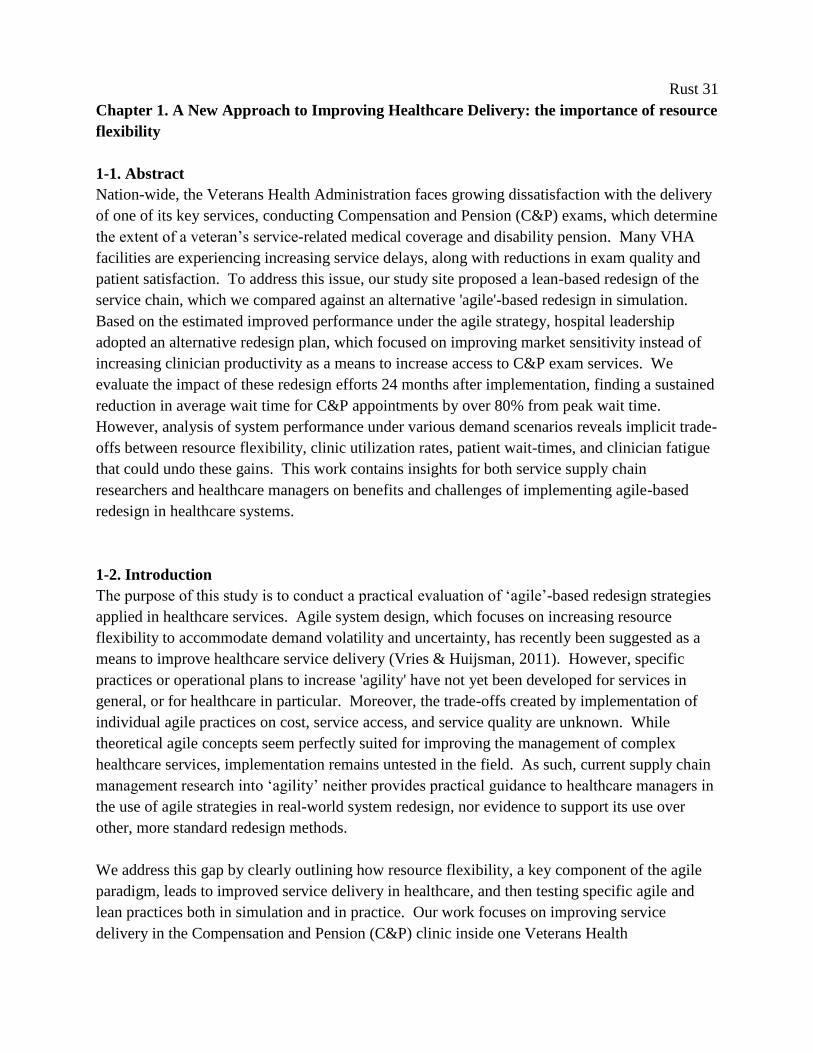
Rust 31
Chapter 1. A New Approach to Improving Healthcare Delivery: the importance of resource
flexibility
1-1. Abstract
Nation-wide, the Veterans Health Administration faces growing dissatisfaction with the delivery
of one of its key services, conducting Compensation and Pension (C&P) exams, which determine
the extent of a veteran’s service-related medical coverage and disability pension. Many VHA
facilities are experiencing increasing service delays, along with reductions in exam quality and
patient satisfaction. To address this issue, our study site proposed a lean-based redesign of the
service chain, which we compared against an alternative 'agile'-based redesign in simulation.
Based on the estimated improved performance under the agile strategy, hospital leadership
adopted an alternative redesign plan, which focused on improving market sensitivity instead of
increasing clinician productivity as a means to increase access to C&P exam services. We
evaluate the impact of these redesign efforts 24 months after implementation, finding a sustained
reduction in average wait time for C&P appointments by over 80% from peak wait time.
However, analysis of system performance under various demand scenarios reveals implicit trade-
offs between resource flexibility, clinic utilization rates, patient wait-times, and clinician fatigue
that could undo these gains. This work contains insights for both service supply chain
researchers and healthcare managers on benefits and challenges of implementing agile-based
redesign in healthcare systems.
1-2. Introduction
The purpose of this study is to conduct a practical evaluation of ‘agile’-based redesign strategies
applied in healthcare services. Agile system design, which focuses on increasing resource
flexibility to accommodate demand volatility and uncertainty, has recently been suggested as a
means to improve healthcare service delivery (Vries & Huijsman, 2011). However, specific
practices or operational plans to increase 'agility' have not yet been developed for services in
general, or for healthcare in particular. Moreover, the trade-offs created by implementation of
individual agile practices on cost, service access, and service quality are unknown. While
theoretical agile concepts seem perfectly suited for improving the management of complex
healthcare services, implementation remains untested in the field. As such, current supply chain
management research into ‘agility’ neither provides practical guidance to healthcare managers in
the use of agile strategies in real-world system redesign, nor evidence to support its use over
other, more standard redesign methods.
We address this gap by clearly outlining how resource flexibility, a key component of the agile
paradigm, leads to improved service delivery in healthcare, and then testing specific agile and
lean practices both in simulation and in practice. Our work focuses on improving service
delivery in the Compensation and Pension (C&P) clinic inside one Veterans Health
Rust 32
Administration (VHA) hospital, which administers medical disability examinations, a key factor
governing a veteran’s level of medical coverage at the VHA and their life-time disability
benefits. Providing timely and accurate disability exams is a critical service provided by the
VHA. Many other VHA facilities nation-wide experience increasing service delays for C&P
exams, along with reductions in exam quality and patient satisfaction. At our study site, average
wait times for C&P exams nearly doubled from August to November 2010, when this research
project began, effectively leading to a denial of services for some veterans.
With the complexity of service delivery and the high costs incurred if redesign efforts failed,
there was a clear need to assess the impact of proposed system changes and improvement
strategies on cost effectiveness and operational performance prior to implementation. The aim of
this research is twofold: to use system dynamics simulation support hospital management
decision making on the redesign of service delivery by assessing the impact of multiple proposed
redesign initiatives, and to use this case study to build knowledge of the effectiveness of ‘agility’
in improving healthcare delivery. Our specific research questions are:
What are the benefits realized from following an agile system redesign paradigm
focusing on flexibility in healthcare?
How do these improvements compare to following a lean strategy of increasing process
efficiency?
How effective are specific operational plans for promoting market sensitivity, a key
characteristic of agility, at reducing cost and increasing access to services in real
healthcare systems?
To answer these questions, we develop a system dynamics model of the C&P clinic based on a
series of semi-structured stakeholder interviews to determine the relationships between
operational policies, management decisions, and process outcomes, and then calibrate that model
with data available from the hospital’s electronic medical record and site observations. This
model was used with clinic managers to test the impact of system redesign based on standard
lean improvement methods, which focused on increasing clinic efficiency; and agile-based
redesign, which focused on increasing resource flexibility as a response to rising service delays.
Following simulation analysis under multiple demand scenarios, hospital leadership selected a
combined ‘lean + agile’ operational plan, instituting management changes to increase resource
flexibility to control patient wait times, and operational changes to increase clinic efficiency to
reduce costs. C&P clinic redesign commenced in February 2011, with most changes coming
online during the summer of 2011. We evaluate the impact of the redesign on system
performance after 24 months, finding the combined strategy led to sustained improved
performance. This work reveals previously implicit trade-offs between resource flexibility,
clinic utilization rates, and patient wait-times. This work clearly identifies increasing resource
flexibility as a successful means to accomplish both cost reduction and improve access to
Rust 33
services, and highlights a few of the potential pitfalls of implementing agile-based redesign in
real-world healthcare systems.
The paper is organized as follows. First, we present the origins of the present study, provide
background on the patient access problem and discuss the role of both lean and agile paradigms
in improving healthcare services. Next, we discuss the choice of system dynamics, and provide
an overview of our model development process. Then, we present an overview of the existing
intake and disability assessment process in the C&P clinic (the base case scenario) and define
alternative scenarios representing lean- and agile-based clinic redesign plans. We end with
scenario testing, model results, post-implementation evaluation, and conclusions.
1-3. Problem Description
The Veterans Administration faces growing dissatisfaction with the delivery of one of its key
services, Compensation and Pension (C&P). C&P is the clinical segment of a longer process
through which Veterans petition for official recognition of a service connected disability, which
if found, grants them access to free healthcare services for that disability at a VA hospital and
potential pension payments for lost employment. Simply put, C&P is the gateway to VA health
services and benefits. All returning service members must navigate this process, as must all
current VA patients seeking to change their recognized level of service-connected disability and
subsequent benefits.
Many VHA facilities nation-wide are experiencing increasing service delays for C&P exams,
along with reductions in exam quality and patient satisfaction. The backlog of people waiting for
disability assessment by the VA has risen dramatically in recent years, from less than 389,000 in
2009 to over 809,000 by 2011. Of this amount, over 60 percent are currently waiting for over
125 days. The VA’s FY2012 national budget projects that the average days to complete a claim
to rise to 230 days in FY2012 (U.S. Department of Veterans Affairs, 2011).
Long wait times for medical disability exams and a growing backlog of C&P claims have led to
C&P becoming an important political issue, as veterans report dissatisfaction with lengthy
processing times (Luk et al, 2010). More recently, the spectacle of Veterans committing suicide
because of delayed treatment for PTSD has brought widespread criticism upon the VA (New
York Times, 5/6/2011). These actions and others prompted a series of Office of Inspector
General investigations in 2008-9, in which they found inefficient, poorly coordinated services;
scant resources; and low quality, as measured by the number of incomplete exams (Finn, 2010).
These critiques have forced the VA in general and C&P clinic managers in particular to initiate
service delivery redesign efforts focused on improving efficiency and patient access.
Rust 34
This paper focuses on the C&P clinic at one VA hospital in the Northeast, which, for
confidentiality, will be referred to simply as 'the hospital'. This hospital is a large, integrated
care organization with a service area of around 470,000 people, treating 63,000 patients
annually, with a staff of approximately 3,700 FTE, including primary care doctors, specialists,
lab services, administrators and support staff. The organization provides primary and intensive
care, specialty surgical services, emergency and urgent care, and both in- and out-patient mental
health treatment.
At the end of 2010, the C&P management team was confronted with what they described as a
‘perfect storm’ of rapidly growing waiting lists, long waiting times, fatigued personnel, and
changing clinical and legal guidelines. Wait-times for C&P exams, which had always been
somewhat variable, almost doubled over the period of two months, from an average of 27 days to
over 49 days, as shown in Figure 6. A review of demand data showed an equally large increase
in demand a few months prior. While such a dramatic increase is not the norm, interviews with
C&P managers confirmed that similar ‘spikes’ in demand have occurred previously as
regulations governing Veteran eligibility for specific diseases and conditions are re-written by
Congress, or the VA changes national policies, guidelines, or staffing at upstream stages in the
disability assessment process.
This increase in patient wait times, and thus reduced access to C&P services, was unacceptable
to both C&P managers and to hospital leadership. Patient wait times are a key performance
indicator for C&P services. All VA hospitals are judged against a national standard of 30 days
average patient wait time. However, this measure is calculated monthly, as opposed to weekly or
daily, so reporting of possible problems are delayed by up to one month before clinic managers
have substantive data proving there is a patient access issue, which is crucial to facilitating their
requests for changes in resources and personnel. Anecdotal evidence is reported faster, as it
comes directly from C&P clinic providers and administrative staff, but these qualitative data are
not enough to trigger changes in resource or personnel allocation. Managers do have access to
information on the distribution of individual patient wait times, specifically the number of
patients waiting for greater than 60, 90 and 120 days, but these data are not officially part of the
VA's evaluation of C&P performance, are not linked to routine performance evaluation or
process management, and are thus not easily collected or frequently examined.
Not only is official average patient wait time calculated monthly, but so are any data on demand
rates. Under the current system, C&P clinic managers at our study site only access aggregate
data on demand: total requests summed over each month. These few, aggregate measures do not
provide enough detail to effectively manage C&P clinics. Discussion with C&P managers
revealed that they recognize this fact, and instead make management decisions based on clinic
backlog level, which is reported to them daily by C&P clinic scheduling clerks. This practice
has led to adequate performance under previous demand conditions, and is similar the decision

Rust 35
heuristic reported in most service settings. For example, Anderson (1997) finds an identical
‘stock-correction’ type decision heuristic in the custom machine tool industry, Anderson and
Morrice (2000, 2001) in a mortgage services company, Akkerman and Vos (2003) in a telecom
company, and Anderson et al (2005) in the service supply chain management of an oil field
development firm. While not an optimal decision heuristic or control mechanism by any means,
it appears to be the rule most often used in practice in service management.
Figure 6. Historical data on C&P clinic referral rate and average patient wait time as of
November 2010, taken from Jan 2013 VA AMIS290 report.
Despite the ubiquity of this kind of management heuristic, when faced with a rapid increase in
demand, such as seen in June, July and August of 2010, C&P managers were not able to
maintain system performance within desired boundaries. System structure and delays inherent to
their decision process and subsequent resource reallocation insured that managers could not keep
the supply of services adequately synchronized with extreme changes in demand. They did not
have enough quantitative data to justify the resource additions needed until problem was well out
of control. Additional personnel transfers to the C&P clinic were only authorized after patient
wait times increased to being the worst in the region. The hospital needed a new system
structure to allow for an effective and prompt respond to a wider range of demand rates.
1-4. Literature Review and Dynamic Hypothesis
To respond to the sever decline in system performance, hospital leadership ordered a redesign of
the C&P clinic, including care processes, patient scheduling, and management. The proposed
clinic redesign was based on a ‘lean’ approach, and thus focused on the fundamental lean goal of
accomplishing perfect quality with minimal waste due to unneeded operations, inefficient
processes, or excessive buffering in operations (Narasimhan et al, 2006). The lean approach in
Rust 36
healthcare is essentially focused on the elimination of waste or muda, which is defined as any
activity that consumes resources but generates no redeeming value in the eyes of the ‘customer’
(Womack & Jones, 1996). Reinforcing this definition, Naylor et al. (1999) describe lean as
developing a value stream to eliminate all waste, including time, and to ensure a level schedule.
A level schedule means that the service delivery process must be protected from uncertainty and
variation. This ‘level-loading’ makes high-capacity utilization possible, thus leading to lower
total costs. Also for healthcare, lean applications usually include such elements as creating
strong collaborations between providers, reducing the number of suppliers, moving toward just-
in-time service delivery and continuously striving to improve quality (Aronsson et al, 2011).
Lean, in this sense, is a redesign effort aimed mainly at increasing the efficiency of operations.
Lean is currently the most common set of tools and guiding management strategy for healthcare
delivery redesign (Shah et al, 2008). Lean organization strategy is most associated with the
success of Toyota, but the upsurge of interest in lean healthcare can be traced to the widely-
publicized successes of lean improvement projects at Virginia Mason, ThedaCare, Pittsburg
General hospitals in the early 2000s. Each facility achieved significant reduction and elimination
of waste through the redesign of patient logistics, clinical pathways, data interchange, and care
integration (Miller, 2005). Lean methods and strategies are currently promoted in VA hospitals
nation-wide, and are the basis for most VA redesign and improvement initiatives.
After conducting a thorough process analysis, C&P management opted to change the design of
its service provision process by transitioning from a specialty-driven practice to using more mid-
level, generalist providers (physician assistants, PAs, and nurse practitioners, NPs). Their
hypothesis is that PAs and NPs would be more productive than specialists, as they are able to
conduct more types of medical exams and potentially conduct multiple examinations during the
same appointment; resulting in faster, more efficiency service, and thus lower average service
times. Service quality would not be affected by this shift, as C&P medical disability
examinations are highly routinized, with clear exam templates and mandatory question sets
provided for all possible claimed disabilities. However, C&P management could not evaluate
this assumption, as there are currently no measures for the diagnostic quality of C&P exams (i.e.,
no peer review or medical oversight).
Transitioning to mid-level providers would increase clinic process efficiency, allowing the C&P
clinic to work down the backlog of patients that had accumulated during the summer. This
solution also complemented a general trend of improving VA clinic efficiency by keeping
clinicians ‘working at the top of their licenses,’ and had the positive secondary impact of
reducing costs, as the salaries of these mid-level staff are significantly lower than those of
specialists.
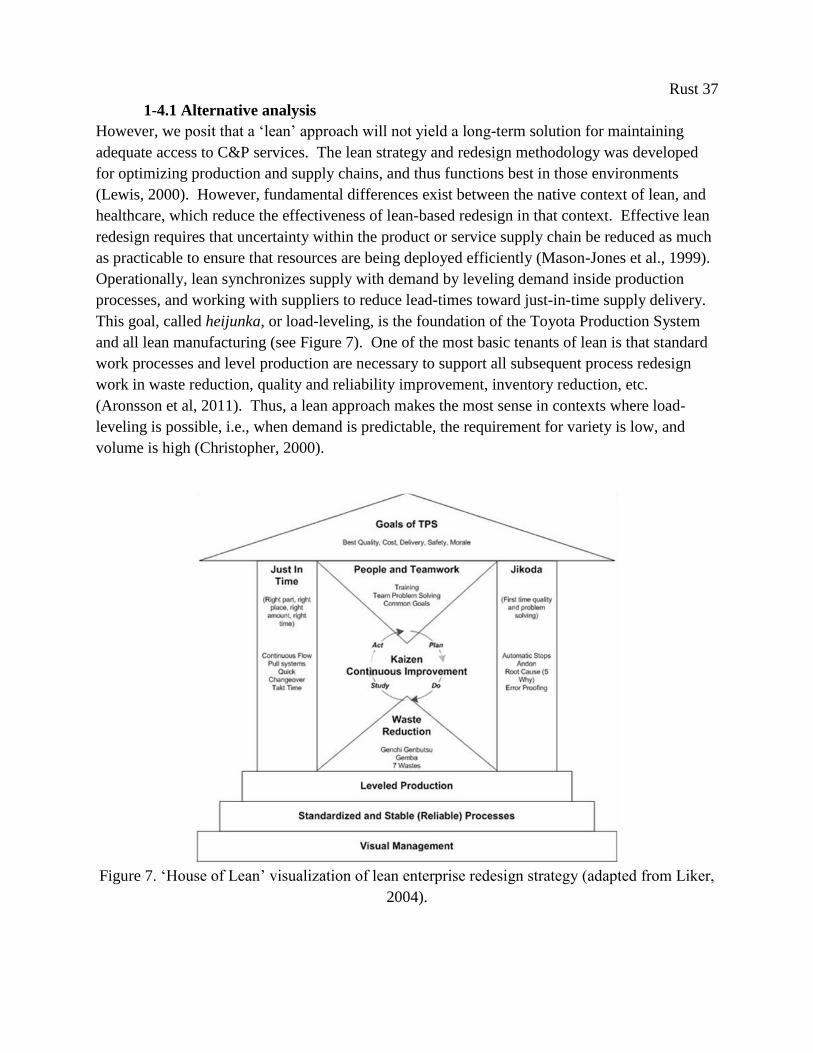
Rust 37
1-4.1 Alternative analysis
However, we posit that a ‘lean’ approach will not yield a long-term solution for maintaining
adequate access to C&P services. The lean strategy and redesign methodology was developed
for optimizing production and supply chains, and thus functions best in those environments
(Lewis, 2000). However, fundamental differences exist between the native context of lean, and
healthcare, which reduce the effectiveness of lean-based redesign in that context. Effective lean
redesign requires that uncertainty within the product or service supply chain be reduced as much
as practicable to ensure that resources are being deployed efficiently (Mason-Jones et al., 1999).
Operationally, lean synchronizes supply with demand by leveling demand inside production
processes, and working with suppliers to reduce lead-times toward just-in-time supply delivery.
This goal, called heijunka, or load-leveling, is the foundation of the Toyota Production System
and all lean manufacturing (see Figure 7). One of the most basic tenants of lean is that standard
work processes and level production are necessary to support all subsequent process redesign
work in waste reduction, quality and reliability improvement, inventory reduction, etc.
(Aronsson et al, 2011). Thus, a lean approach makes the most sense in contexts where load-
leveling is possible, i.e., when demand is predictable, the requirement for variety is low, and
volume is high (Christopher, 2000).
Figure 7. ‘House of Lean’ visualization of lean enterprise redesign strategy (adapted from Liker,
2004).
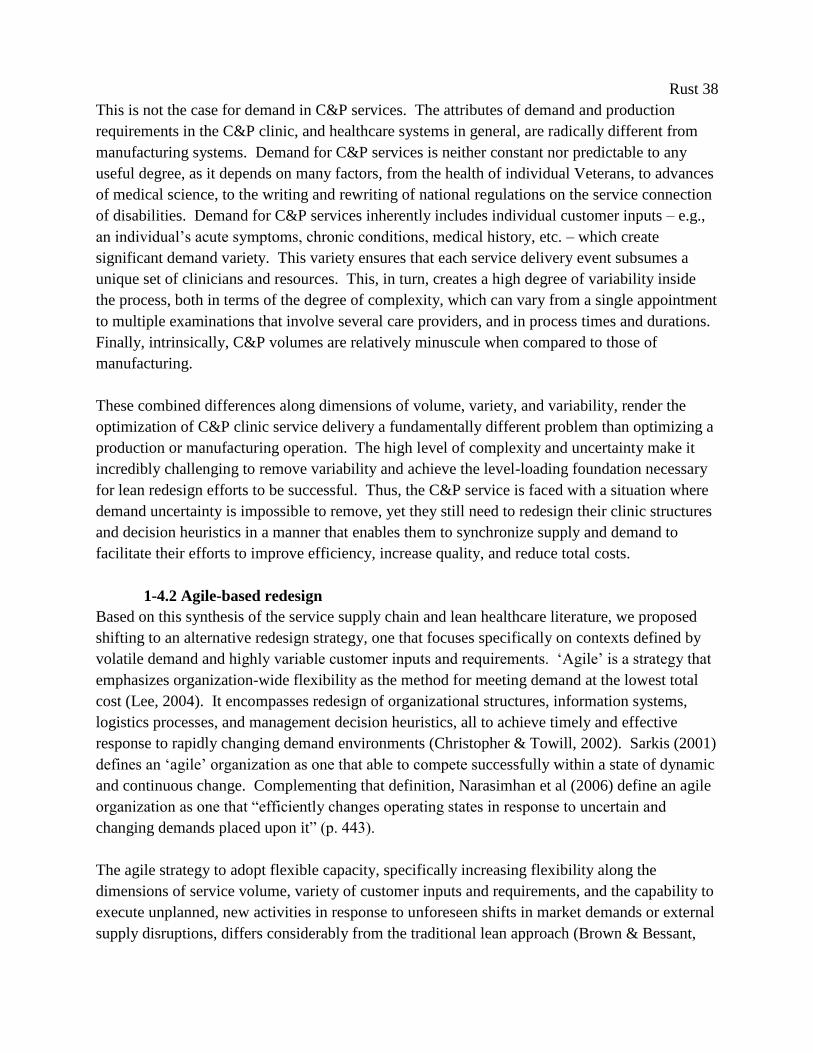
Rust 38
This is not the case for demand in C&P services. The attributes of demand and production
requirements in the C&P clinic, and healthcare systems in general, are radically different from
manufacturing systems. Demand for C&P services is neither constant nor predictable to any
useful degree, as it depends on many factors, from the health of individual Veterans, to advances
of medical science, to the writing and rewriting of national regulations on the service connection
of disabilities. Demand for C&P services inherently includes individual customer inputs – e.g.,
an individual’s acute symptoms, chronic conditions, medical history, etc. – which create
significant demand variety. This variety ensures that each service delivery event subsumes a
unique set of clinicians and resources. This, in turn, creates a high degree of variability inside
the process, both in terms of the degree of complexity, which can vary from a single appointment
to multiple examinations that involve several care providers, and in process times and durations.
Finally, intrinsically, C&P volumes are relatively minuscule when compared to those of
manufacturing.
These combined differences along dimensions of volume, variety, and variability, render the
optimization of C&P clinic service delivery a fundamentally different problem than optimizing a
production or manufacturing operation. The high level of complexity and uncertainty make it
incredibly challenging to remove variability and achieve the level-loading foundation necessary
for lean redesign efforts to be successful. Thus, the C&P service is faced with a situation where
demand uncertainty is impossible to remove, yet they still need to redesign their clinic structures
and decision heuristics in a manner that enables them to synchronize supply and demand to
facilitate their efforts to improve efficiency, increase quality, and reduce total costs.
1-4.2 Agile-based redesign
Based on this synthesis of the service supply chain and lean healthcare literature, we proposed
shifting to an alternative redesign strategy, one that focuses specifically on contexts defined by
volatile demand and highly variable customer inputs and requirements. ‘Agile’ is a strategy that
emphasizes organization-wide flexibility as the method for meeting demand at the lowest total
cost (Lee, 2004). It encompasses redesign of organizational structures, information systems,
logistics processes, and management decision heuristics, all to achieve timely and effective
response to rapidly changing demand environments (Christopher & Towill, 2002). Sarkis (2001)
defines an ‘agile’ organization as one that able to compete successfully within a state of dynamic
and continuous change. Complementing that definition, Narasimhan et al (2006) define an agile
organization as one that “efficiently changes operating states in response to uncertain and
changing demands placed upon it” (p. 443).
The agile strategy to adopt flexible capacity, specifically increasing flexibility along the
dimensions of service volume, variety of customer inputs and requirements, and the capability to
execute unplanned, new activities in response to unforeseen shifts in market demands or external
supply disruptions, differs considerably from the traditional lean approach (Brown & Bessant,
Rust 39
2003; Prince & Kay, 2003; Sharifi & Zhang, 2001). The lean approach of using fixed (or
planned) capacity is built on the logic of maintaining high utilization of resources, e.g. personnel
and equipment, to achieve the lowest possible costs. In industries where external variability is
difficult to control, lean firms protect production processes from demand variation by
maintaining buffer stocks of finished inventory, which they subsequently try to reduce through
increasing production efficiency (Aronsson et al, 2011). While reducing these inventories to
zero, to create ‘just in time’ production, is the end goal; in reality, firms always need some buffer
against changes in demand, or they must allow variation in product delivery times.
In the healthcare context, this ‘inventory buffer’ would translate to patient queues.
Consequently, stringently following a lean approach, through the use of fixed (or planned)
resources to maintain high utilization rates and minimizing the use of a constant ‘patient buffer,’
ensures that service times vary over time, depending on demand volume. Large volumes of
patients, in excess of the planned capacity, will result in longer service times and patient queues,
as described on the left side of Figure 8. Thus, focusing on making improvements to process
efficiency will not actually result in improvements to patient access to services in the long term,
as the root cause of demand variation itself has not been addressed.
Our alternative, agile-derived approach to the problem faced by the C&P clinic is to increase the
flexibility of service capacity to ensure a fixed lead-time, shown on the right side in Figure 8.
This more flexible service delivery system requires high availability of extra personnel or other
resources needed to perform the process on time, independent of the actual demand volume. The
advantage with this approach is that patients will receive reliable access to C&P services, and it
will considerably shorten average throughput times in the system as a whole. Shifting the C&P
clinic to a more agile structure will provide the ability to maintain desired performance levels
over the long term, regardless of future equivalent ‘spikes’ in demand.
Figure 8. Response to an increase in demand for services under fixed or flexible capacity
production systems (adapted from Aronsson et al, 2011).
Rust 40
1-5. Methodology/Approach
The specific modifications to system structure and operations necessary to support a more
flexible and timely reallocation of resources and personnel in response to changes in demand is
difficult to determine, and even more difficult to justify. To date, there is no simulation or
empirical evidence to shed light on to what extent health care providers can benefit from
following an agile redesign strategy in practice (Vries & Huijsman, 2011). C&P clinic managers
were skeptical of the need to change their own decision making heuristics, even if the abstract
logic of demand variation as the root cause to their current trouble was clear. Managers were
quick to point out that shifting to a more agile service delivery system would probably require
more resources, which would which persistently remain at lower average utilization rates.
Transitioning to an agile service delivery system can lead to this possible downside, if the new
process for resource allocation is not sufficiently flexible. If significant delays persist in
resource reallocation, then synchronizing service supply with demand will not occur, and a
resource buffer will be necessary to replace the missing patient buffer. For an agile strategy to
be effective, resource gap identification, reallocation decisions, and actual C&P clinic schedule
changes will all have to be made quickly enough to accommodate the demand volatility
demonstrated in 2010.
In order to identify and test operation-level agile policies that increase flexibility to a level
adequate for probable future fluctuations in demand, we first built a dynamic simulation of the
C&P clinic. Simulation was a necessary first step in clinic redesign, as such large scale changes
to both system structure and management were deemed too risky to implement without a well-
developed understanding of both their intended and unintended effects (Smits, 2010; Young et
al, 2004; Bower and Gilbody, 2005). In the dynamically complex healthcare environment,
process and policy changes often result in intended and unintended consequences which cannot
be easily foreseen without the help of a computer model (Kleijen, 2005).
This kind of exploratory simulation is also necessary because little is known about how ‘agility’
can be operationalized with patient care systems. There are no agile redesign case studies
addressing the challenges unique to the healthcare setting to aid in the targeting specific
operational improvements to system flexibility. In the larger field of supply chain management,
the study of healthcare service delivery and patient logistics is very new, and while it has a few
exemplary initiates, still lacks much academic research (Shah et al, 2008). Furthermore, the
problem of maintaining patient access in the face of volatile demand is a ‘long term problem’,
where the effects of redesign decisions do not appear immediately, but would only appear after
months or even years (Vennix, 1996). Any evidence required to support system modifications
that stem from our hypothesis that increasing system flexibility would provide the level of
patient access desired must necessarily come first from simulation.

Rust 41
We use system dynamics simulation because the method encourages both a systemic view of the
interactions of patient flows and information, and a more strategic perspective on the
management of the system. It is widely accepted by healthcare professionals that healthcare
delivery cannot be understood by looking at factors in isolation (Lane, 1999). By encouraging
the study of how different processes interact to produce effects, system dynamics offers a
rigorous approach for bringing that interconnectedness insight into focus. We choose system
dynamics specifically for its ability to 1) clearly relate patterns of behavior to system structure,
2) quantify the causal links between demand and patient wait times, and 3) assess potential
changes to system structure and management decision heuristics that will improve system
performance in the long term. This necessitates the consideration of a broad range of
interactions across physical and information flows.
System dynamics modeling has been used to address many healthcare related problems and has
resulted in about 1500 publications since 1991 (Brailsford 2008). Dangerfield (1999) reviews
system dynamics modeling in healthcare and concludes that the method can be used effectively
in a qualitative way when influence (or causal) diagrams are the main analytic tool, and in
quantitative ways when based on simulation models. We build off of previous work in
healthcare management: Specifically, Taylor and Dangerfield’s (2005) use of quantitative system
dynamics analysis of the reasons for failed management interventions in cardiac catheterization
services, and Lane and Husemann’s (2008) use of qualitative modeling to elicit proposals for
improvement of acute patient flows in the UK National Health Service. Similar Wolstenholme
et al (2006) use both qualitative and quantitative SD to analyze the effects of process redesign on
mental healthcare performance. A general discussion of the role of system dynamics in
analyzing healthcare systems can be found in Taylor and Lane (1998).
As with all modeling approaches, the application of system dynamics produces gains as well as
losses. Examples of the latter are the loss of the stochastic variation and resolution down to the
individual patient, or condition level. We have not used modeling methods capable of these
features, such as discrete-event simulation (DES) or stochastic modeling (of variables like 'client
inflow' or 'assessment time'), because our primary objective is not to quantify numerical results
but to understand and illustrate to C&P managers the deterministic behavior of their system and
understanding what causes poor system performance. For an in-depth discussion of the trade-
offs and appropriate problems for using SD or DES see Tako and Robinson (2009) and Kleijnen
(2005).
We choose system dynamics for its ability to generate buy-in for our alternative proposal and to
involve the C&P management team in the model building process. The combination of
modeling software and group model building produces results that are both technically
representative and persuasive to system participants. In this study, we worked closely with those
who had direct knowledge of the system. By accessing their 'mental models' as well as formal
Rust 42
sources (Forrester 1961), we were able to build a transparent model which was accepted as
realistic in its formulation. The model became a 'visual learning environment' (Lane 1997),
helping C&P management to understand why system structure produced the behaviors they had
experienced (the Base Case) and how behavior would vary under different management policies
(the Simulation Analysis). Using system dynamics made the complex and compelling
mathematical model accessible to our group of healthcare professionals.
First, we used system dynamics qualitatively to develop influence diagrams that specify
relationships between management decision and their effects, and quantitatively through
computer simulation. We develop the simulation model for the C&P patient access problem
following the method adapted from Forrester (1994) and Sterman (2000):
1) Describe the system, including its parts and boundaries. We develop influence
diagrams based on the internal reports, interviews with hospital staff, and the
literature.
2) Convert these descriptions to level and rate equations, using Vensim® software.
3) Revise the model, until both model structure and outcomes fit the existing (base
case) performance.
4) Design alternative policies and process structures, based on interviews with C&P
managers, which are then simulated and compared to the base scenario.
5) Discuss the Base Case and alternative scenarios with the C&P management team.
6) Implement changes to decision policy and system structures
It should be noted that the sequence of steps 1-5 is iterated until the participants were satisfied
and agreed that the simulation model sufficiently represented reality. Initial qualitative research
into the management of C&P clinics was completed in 2009 (Luk et al, 2010), and the first round
of semi-structured interviews began in October 2010. We conducted a total of seventeen semi-
structured individual and group interviews with clinicians, clerks, operations and business
managers, operating staff, and medical directors. Initial interviews with hospital staff were used
to create a basic conceptual map outlining patient, personnel and information flows. In
subsequent rounds of interviews, interviewees revised copies of the conceptual map, correcting
or adding information so that it best represented their perception of the system. Next, to
facilitate step 2, the C&P team identified relative influences between system components and
explained and quantified their own decision heuristics. The primary elements identified for this
model include the referral rate for C&P exams, exam scheduling, the backlog of exams waiting
to be conducted, C&P staffing adjustments, and measures of quality and rework. We supported
this subjective analysis with information held by hospital staff, internal management reports, and
the electronic medical record system.
Over the course of these interviews and subsequent model revisions, we developed a close
working relationship with C&P clinic managers. While initially skeptical, their direct
Rust 43
involvement in the model building process made them more willing to accept the results of our
alternative agile-based redesign simulation runs in step 4. We concluded step 5 with a policy
recommendations report regarding our findings on the impacts of policy and process structure
redesign on C&P performance and efficiency that was signed off by the entire C&P management
team. The final step of implementation was undertaken by hospital leadership in a series of
transformative changes to the C&P clinic from February 2011 through June 2011.
1-6. Model Design
First, we present a description of C&P patient flow, followed by an influence diagram
identifying all significant management decision heuristics and information feedbacks.
Combined, these inform the design of the simulation model, which is then presented with three
scenarios for policy analysis.
1-6.1 Patient flow
Patients are referred to the C&P clinic solely by the Veterans Benefits Administration, which
conducts the initial 'triage' process for assessing disability claims. After referral to the hospital
C&P service, patients enter the hospital’s intake process for exam scheduling and medical
disability assessment. Conducting disability assessments is the key business process, with about
80% of the staff conducting specialized disability exams (e.g., ischemic heart disease relating to
Agent Orange exposure, or PTSD), and the remaining 20% required for administrative and
clerical support. The C&P clinic directly employed approximately 14.6 FTE people, 1.4
generalists (MDs, physician assistants and nurse practitioners), 0.8 psychiatrists, 5.4 specialists,
and 6 support staff. Actual percentages fluctuate to as C&P managers attempt to match clinical
resources with changes in demand. The remaining staff needed to conduct disability exams are
procured on an ad hoc basis from other departments inside the hospital, and from outside
providers on fee-for-service contracts. These 'non-aligned' staff represent the bulk of the
capacity used by the C&P clinic.
Figure 1 shows a simplified version of the final map of the C&P process, consisting of the
following phases:
Patients are referred to C&P at an average rate of 153 patients per week (645 per month).
After referral, patients enter the first waiting list (W1) to wait for a C&P clerk to contact
them to schedule their appointment for a disability assessment. The average waiting time for
an appointment is 1.3 days, with over 96% of all patients are scheduled within the 3 day
guideline. The scheduling timeliness produced by each C&P support staff is monitored and
addressed weekly by C&P management. This management feedback process ensures that
adequate clerk time is devoted to scheduling patients. We found no linkage between
Rust 44
scheduling and other wait times or backlogs; the changes in work pressure in other parts of
the C&P process do not affect this performance indicator.
After scheduling, patients enter the second waiting list (backlog W2), waiting for their
appointment(s) for disability assessment. On average, 2,543 patients are waiting for their
assessment, which consist of an average of 1.6 separate appointments, each with a different
specialist provider. One patient may claim multiple disabling conditions, requiring multiple
biologic systems to be examined (e.g., a patient may be suffering from joint pain, tunnel
vision and depression). Appointments are conducted by a broad range of clinicians with
varying specialization and productivity levels. A specialist can complete, on average, 0.63 of
a patient's disability assessment in their one hour appointment. A physician’s assistant can
complete, on average, 0.87 of a patient’s disability assessment in their one hour appointment.
17% of patients are referred to C&P for three disparate conditions, 6% for four conditions,
and only 1.3% for five or more. C&P management has near complete flexibility around
assigning patients to specific providers (either to multiple specialists or a single generalist).
However, there are a few conditions, such as PTSD exams, where a particular specialist is
mandated by law. Approximately 5% of patients fail to report to their appointment, or about
7 per week.
After the appointment, patient exams enter a third backlog, waiting for their assessment
report to be competed and sent to the VBA. This takes clinicians an average of 0.9 days.
Some assessments are returned to the hospital as incomplete, unclear, or otherwise
insufficient for use by the VBA. Reports with errors are discovered by the VBA after an
average of 4.3 weeks, after which they are returned to the originating clinician. Correcting
an assessment report requires approximately the same amount of time as the originating
patient appointment, but very rarely (<0.1%) are patients required to return to facilitate this
correction. The rework rate is reported monthly as a percentage of the entire C&P workload
(not by individual clinician) and is between 1 and 2%. It should be noted that this quality
measure does not measure the accuracy of the diagnoses, but simply familiarity with work
processes, exam templates, and VBA requirements.
In the equilibrium simulation, the outflow rate of complete assessments equals the inflow rate of
requests for assessment. Therefore, on average, 146 patients leave the C&P process every week
(accounting for the extra work done to correct errors and losses from patient no-shows). We
estimate an average total assessment duration of 27.3 days, which compares reasonably to the
process time of 26.9 days from calculations based on internal C&P oversight reports.
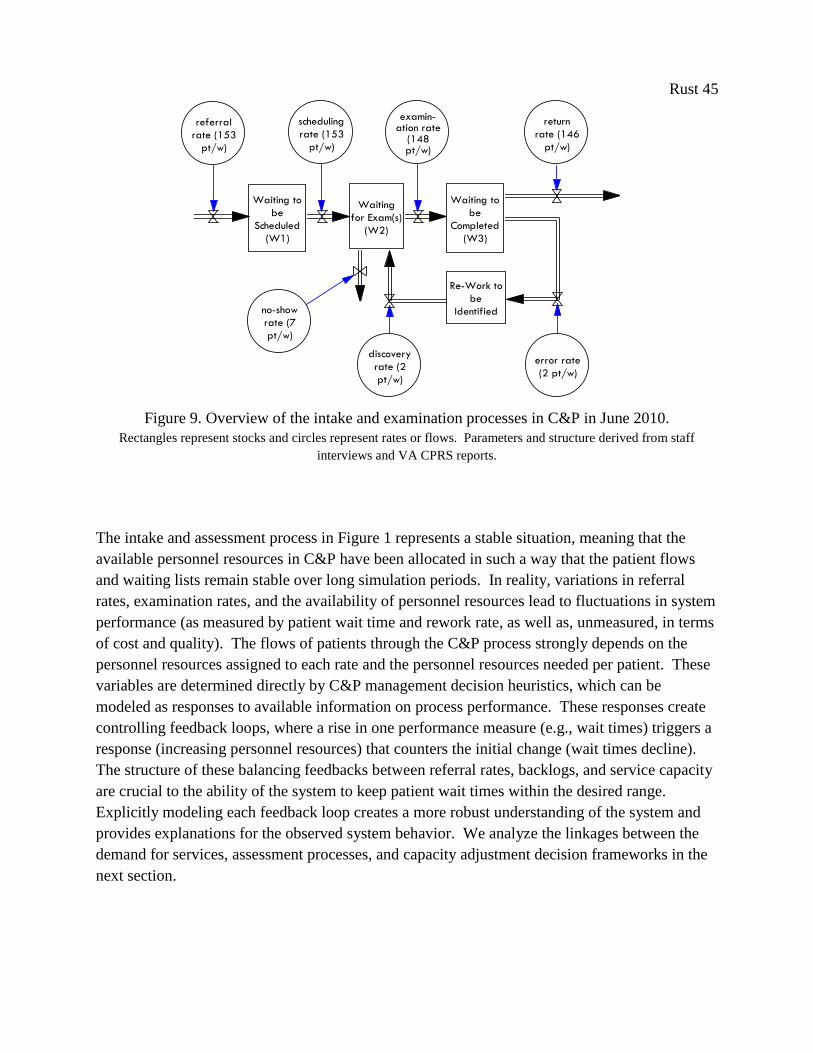
Rust 45
Waiting to
be
Scheduled
(W1)
Waiting
for Exam(s)
(W2)
Waiting to
be
Completed
(W3)
Re-Work to
be
Identified
referral rate sc exa
error ratediscovery rate
a
n
referral
rate (153
pt/w)
scheduling
rate (153
pt/w)
examin-ation rate
(148pt/w)
no-show
rate (7
pt/w)
discovery
rate (2
pt/w)
error rate
(2 pt/w)
return
rate (146
pt/w)
......
......
......
Figure 9. Overview of the intake and examination processes in C&P in June 2010.
Rectangles represent stocks and circles represent rates or flows. Parameters and structure derived from staff
interviews and VA CPRS reports.
The intake and assessment process in Figure 1 represents a stable situation, meaning that the
available personnel resources in C&P have been allocated in such a way that the patient flows
and waiting lists remain stable over long simulation periods. In reality, variations in referral
rates, examination rates, and the availability of personnel resources lead to fluctuations in system
performance (as measured by patient wait time and rework rate, as well as, unmeasured, in terms
of cost and quality). The flows of patients through the C&P process strongly depends on the
personnel resources assigned to each rate and the personnel resources needed per patient. These
variables are determined directly by C&P management decision heuristics, which can be
modeled as responses to available information on process performance. These responses create
controlling feedback loops, where a rise in one performance measure (e.g., wait times) triggers a
response (increasing personnel resources) that counters the initial change (wait times decline).
The structure of these balancing feedbacks between referral rates, backlogs, and service capacity
are crucial to the ability of the system to keep patient wait times within the desired range.
Explicitly modeling each feedback loop creates a more robust understanding of the system and
provides explanations for the observed system behavior. We analyze the linkages between the
demand for services, assessment processes, and capacity adjustment decision frameworks in the
next section.
Rust 46
1-6.2 Management decision heuristics
Fundamentally, a system dynamics model is a causal theory of how behavior is generated by a
system of both material flows and information feedbacks. Although no two C&P departments
have the exact same problems, the nature of the main factors reducing access to services is
universal. There are four main feedback processes interacting to affect patients' access to
services. The principle interactions created by C&P management decisions and how these
decisions influence the provision and availability of C&P services are shown in Figure 2. The
C&P process contains the following feedback loops:
Balancing Loop 1: Recruiting Personnel
An increase in the number of patients waiting for exams increases the backlog and the
expected patient wait time (C&P management uses the proxy measure 'average time until the
next available appointment,' which is known continuously by clerks as they schedule
patients). As this time increases beyond the target acceptable wait time, work pressure
increases, leading C&P managers to hire more personnel. This results in more total
personnel available to provide services, increasing the examination rate, which reduces the
patient backlog and the proxy metric for expected wait time. Under the initial system design,
where C&P examiners are predominantly specialists from outside departments, C&P
management increases personnel resources by 'borrowing' them from other services. Actual
hiring of new staff is avoided because of the many delays inherent to the process: posting the
position, filling the vacancy, accrediting the new clinician, specific training in disability
assessments, takes, on average, 52 weeks.
Mathematically, this balancing loop includes investment in human capital, including hiring,
training, and learning-by-doing, and is structured as follows. Desired workforce at any given
time is based on C&P manger’s perceptions of clinician effectiveness and the desired service
capacity. Desired service capacity is based on the throughput requirements (which are based
on the backlog of patients awaiting C&P exams) and perception of effectiveness (which is
based on the ratio of service capacity to actual current number of clinicians). The desired
workforce does not change instantaneously as it takes time to authorize the changes in the
desired workforce, which is captured by parameter τdwf (all time parameters are denoted by
the letter tau, with a subscript identifying the specific constant and use in the model).
This adjustment delay is included in the model as an exponential smooth, or a weighted
moving average where the importance of input data decline exponentially with age. This is a
common formulation of adaptive expectations, where perceptions adjust gradually over time
(Sterman, 2000). Perception of desired workforce changes when the actual desired service
capacity (modified by other perception, discussed immediately, below), differs from the

Rust 47
perceived state. As the perception of desired workforce is updated, the error falls, and the
subsequent adjustments diminish, until the perception again matches reality.
where Dwf (t) = desired workforce at time t, measured in units of clinician FTEs (Full
Time Equivalents)
Dsc(t) = desired service capacity at time t, measured in units of clinician FTEs
Pee(t) = perceived clinician effectiveness at time t, defined below
Dwt0 = initial desired workforce at t = 0
τdwf = time to adjust desired workforce level = 2 weeks
Desired service capacity is the required service capacity based on the desired production
rate and the standard work intensity and time allocation, represented as:
where Rdc(t)= desired completion rate at t, defined in the section on balancing loop 2
w(t) = work week at time t (standard in this model is 40 hours / week, but this
parameter is modified by C&P managers as a response to work pressure, which is
discussed in the section on balancing loop B2)
(t) = productivity of experienced clinicians at time t (standard in this model is
0.63 requests / specialist*hour and 0.87 requests / generalist*hour, but these
parameters are modified by the effect of fatigue, which is discussed in detail in
the section on reinforcing loop R1). Variation in productivity is based on breadth
of skill set and understanding of the purpose of forensic examination: generalists
can conduct more aspects of a patient's request than a specialist, who can only
examine issues in their area of expertise. An individual generalists can conduct,
on average, 0.87 of a patient's total request, while a specialist can complete, on
average, 63% (based on skill set and distribution of exams per patient).

Rust 48
Perceived clinician effectiveness is management’s aggregate dimensionless
understanding of the effectiveness of their total workforce. It does not distinguish the
causes of changing effectiveness, which could be caused by changes in average clinicians
experience, changes in productivity, and the effects of fatigue and work intensity. The
workforce is divided into two populations: experienced and recently hired “rookie”
clinicians. New hires are less productive than experienced clinicians, but gradually gain
skills through experience, on-the-job coaching and mentoring. This perception of
effectiveness does not change instantaneously as it takes time to recognize the changes in
the workforce, which is captured by parameter τpp . This adjustment delay is included in
the model as an exponential smooth, which constantly updates current perception based
on the gap between that perception and reality.
where C(t) = service capacity at time t = defined in the section on reinforcing loop R1,
“Fatigue Buildup,” below
Et(t) = total number of clinicians = Er(t) + Ee(t) , measured in units of clinician
FTEs
Er(t) = total number of new (rookie) clinicians at time t, measured in units of
clinician FTEs
Ee(t) = total number of experienced clinicians at time t, measured in units of
clinician FTEs
τpp = time to perceive productivity = 13 weeks, i.e., a quarterly update, which
includes time to measure, report, and assess clinician productivity
Pee0 = 1, which represents a dimensionless ratio, normalized to 1
Desired workforce informs the hiring rate of new clinicians, which contributes to the
stock of new clinicians, Er:

Rust 49
The hiring rate of new clinicians, Rh, both replaces clinicians that have quit working at
the hospital and adjusts for changes in the desired workforce.
Rh =
where Dwf(t) = desired workforce (defined above)
Et(t) = total number of clinicians in time t = Er(t) + Ee(t) , measured in
units of clinician FTEs
τwf = time to adjust workforce = 4 months for “borrowed” staff, which
includes negotiation with other service line, internal negotiation within
that service, restructuring clinic profiles, and informing C&P clerks. Set to
1 year for permanent staff, which includes creating and filling a vacancy
in through human resources and the credentialing processes.
Rrq = new clinician turnover rate (defined below)
Req = experienced clinician turnover rate (defined below)
Rrlo = layoff rate of new clinicians at time t= , measured in units
of clinician FTEs/week
where Rdlo = desired layoff rate = max(0, -Rh), remains zero, unless the desired
hiring rate falls below zero, measured in units of clinician FTEs /week
Rmaxlo = maximum layoff rate = =, determined by the number of
workers and the layoff time, measured in units of clinician FTEs /week
τlo = time to layoff an clinician = 2 weeks for “borrowed” staff, and 8
weeks to layoff permanents staff
Rrq = quit rate of new clinicians at time t = Er * “Effect of Burnout on Turnover,”
measured in units of clinician FTEs /week
where Er = number of new clinicians a time t
“Effect of Burnout on Turnover” = is described in the discussion of
reinforcing loop R1, “Fatigue Buildup,” below
Rm = maturation rate of new clinicians at time t = Er / τm, measured in units of
clinician FTEs /week
where τm = time for an average new clinician to gain experience = 52 weeks for
“borrowed” staff, as they only work on average 20% of their time on C&P; and 16
weeks for permanents staff, who work in the C&P clinic full time.
Er0 = initial number of new clinicians at t = 0, measured in units of clinician FTEs

Rust 50
As new clinicians gain experience, they flow into the stock of experienced clinicians, Ee,
represented as:
where Rm(t) = maturation rate of new clinicians at time t, measured in units of clinician
FTEs/week
Relo(t) = experienced clinician layoff rate =
IF THEN ELSE( Rrlo(t) < Rdlo(t) , MIN(Rdlo(t), Rmaxlo(t)), 0, measured in
units of clinician FTEs /week
This ‘if then else” equation ensures that the hospital lays-off new clinicians before
experienced clinicians.
Req(t) = quit rate of experienced clinicians at time t = Ee * ω * “Effect of Burnout
on Turnover,” measured in units of clinician FTEs /week
Ee = number of experienced clinicians, measured in units of clinician
FTEs
ω = the dimensionless fraction of experienced clinicians that leaves the
C&P clinic every week = 0.05 for “borrowed” staff who have less
affiliation to the C&P clinic and see working in C&P as a secondary duty,
and 0.02 for permanent staff
“Effect of Burnout on Turnover” = is described in the discussion of
reinforcing loop R1, “Fatigue Buildup,” below
Ee0 = initial number of experienced clinicians at t = 0, measured in units of
clinician FTEs
Taken together, these equations determine the service capacity, C(t), which directly
influences the C&P request completion rate and thus patient backlog. This balancing
control loop operates in conjunction with the ability managers have to adjust clinicians
working hours per week. This, and a full description of equations governing the patient
backlog, are discussed in the next section on balancing loop B2 “Adjusting Hours per
Week”, below.
Balancing Loop 2: Adjusting Hours per Week
Similar to B1, as an increase in work pressure also leads C&P managers to increase the
number of hours assigned per clinician per day (usually in the form of overtime). This
causes an increase in the examination rate, which reduces the backlog, the average wait time,

Rust 51
and the proxy metric for expected patient wait time. This feedback loop contains almost no
delays, as changes to the number of hours each clinician is assigned to C&P can take effect
the following day. This feedback is constrained by each clinician's willingness to work
overtime. The few clinicians working directly for C&P (mainly PAs and NPs) have worked
up to 20 additional hours per week. However, because most specialists are only temporarily
assigned to C&P, they perceive C&P as secondary to their normal duties and are only willing
to work up to two extra hours weekly for C&P patients. If work pressure declines, both
generalists and specialists will reduce their C&P hours per day. In the Base Case Scenario, a
predominance of specialists ensures that loop B1 dominates B2 in creating the dynamic
tendencies of the system, as it is easier to increase service capacity by 'borrowing' more
specialists than through increasing their C&P clinic hours per day.
Mathematically, the structure of this balancing loop is as follows. This section presents the
structure for the arrival, accumulation and processing of C&P exams and the link to the
service capacity sector, where B(t) is the order backlog, Rc(t) is the exam completion rate in
the clinic at time t, and Rde(t) is the error discover rate at time t. Note that Ra(t) is the new
C&P request arrival rate, which is determined exogenously.
where B(t) = patient backlog at t , measured in units of C&P patient requests for
exam(s). This is analogous to the number of C&P patients awaiting service.
Ra(t)= exogenous arrival rate of patients at time t , measured in units of C&P
patient requests/week
Rc(t) = completion rate of patients at time t, measured in units of C&P patient
requests/week
Red(t) = error discovery rate at time t, defined in the discussion of reinforcing loop
R2, below
B0 = initial backlog (C&P patients in-progress) at t = 0
The completion rate is the lesser of the potential completion rate based on the potential
completion rate, Rpc(t), or the maximum completion rate, based on the number of exams
in the backlog and the minimum time needed to process each exam, Rcmax(t).
where Rpc(t) = potential completion rate = C(t) * * w(t) , measured in units of
C&P patient requests/week
Rust 52
where w(t) = work week at time t (standard in this model is 40 hours / week, but
this parameter is modified by C&P managers as a response to work
pressure, which is discussed below)
(t) = productivity of experienced clinicians at time t (standard in this
model is 0.63 requests / specialist*hour and 0.87 requests /
generalist*hour, but these parameters are modified by the effect of fatigue,
which is discussed in detail in the section on reinforcing loop R1, “Fatigue
Buildup,” below)
Rcmax(t) = maximum completion rate at time t , measured in units of C&P patient
requests/week
= B(t) / “minimum delivery delay”
where the “minimum delivery delay” = 0.5 weeks
The desired completion rate depends, Rdc(t), on the backlog and the organization’s
delivery time goal, so
Rdc(t) = B(t) / λ , measured in units of C&P patient requests/week
where λ = target service time = 3.85 weeks (just under the mandate set
nationally at 4 weeks)
The decision to adjust service capacity through making changes to the hours of work per
clinician to complete C&P exams at the desired rate is dependent on work pressure,
which we define as the ratio of desired to actual service capacity. A work pressure
greater than one indicates the clinic is under stress as there are more exams in the backlog
than the clinic can process within the target service time, given the number and
productivity of clinicians, the standard workweek and the current standard for the time
that should be allocated to each exam. A work pressure of less than one indicates excess
capacity. High work pressure boosts exam completion through greater work intensity,
reducing the backlog and work pressure.
Work Pressure = Cd(t) / C(t), measured as a dimensionless ratio of clinician FTEs to
clinician FTEs
where = desired capacity at time t = Cd(t) = Rdc / ( * w), measured in
units of clinician FTEs
where Rdc(t)= desired completion rate at t, measured in units of C&P
patient requests/week
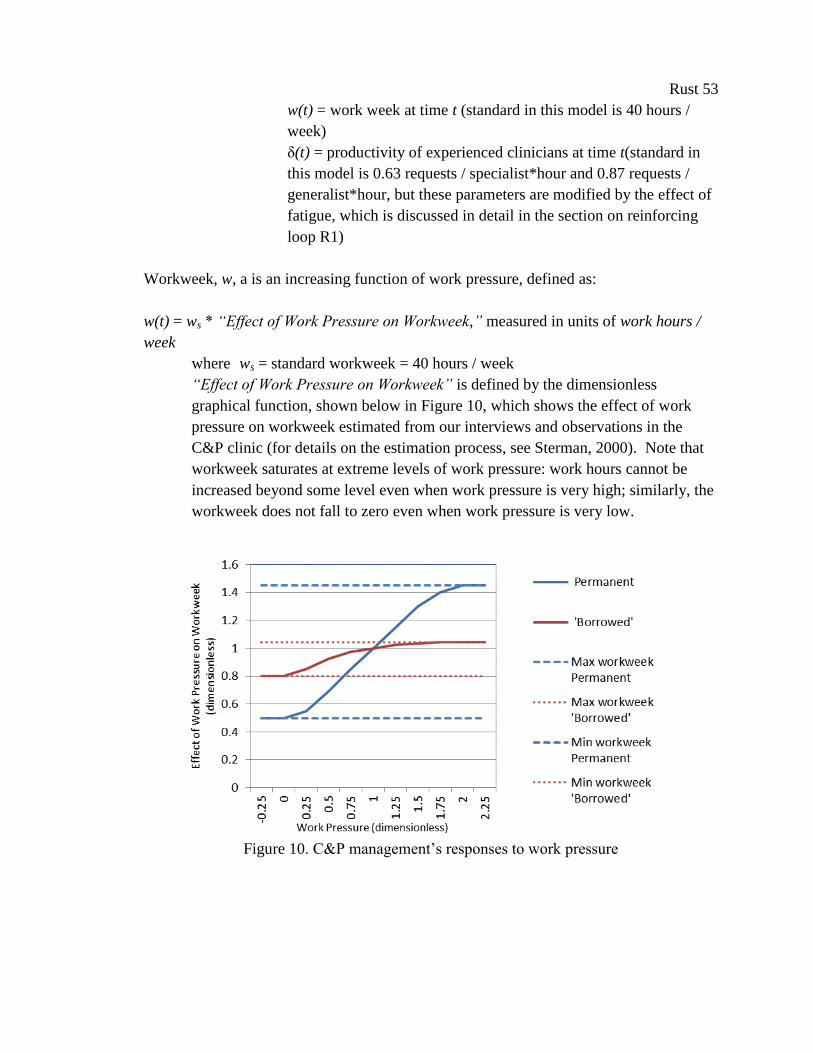
Rust 53
w(t) = work week at time t (standard in this model is 40 hours /
week)
δ(t) = productivity of experienced clinicians at time t(standard in
this model is 0.63 requests / specialist*hour and 0.87 requests /
generalist*hour, but these parameters are modified by the effect of
fatigue, which is discussed in detail in the section on reinforcing
loop R1)
Workweek, w, a is an increasing function of work pressure, defined as:
w(t) = ws * “Effect of Work Pressure on Workweek,” measured in units of work hours /
week
where ws = standard workweek = 40 hours / week
“Effect of Work Pressure on Workweek” is defined by the dimensionless
graphical function, shown below in Figure 10, which shows the effect of work
pressure on workweek estimated from our interviews and observations in the
C&P clinic (for details on the estimation process, see Sterman, 2000). Note that
workweek saturates at extreme levels of work pressure: work hours cannot be
increased beyond some level even when work pressure is very high; similarly, the
workweek does not fall to zero even when work pressure is very low.
Figure 10. C&P management’s responses to work pressure

Rust 54
Reinforcing Loop 1: Fatigue Buildup
While higher work intensity boosts output in the short run, extended overtime
causes fatigue that eventually undermines the benefit of longer hours through an increase in
fatigue. This results in a decrease in the effectiveness of the personnel, reducing the exam
completion rate. This reinforcing loop does not pose a problem in the Base Case Scenario, as
the use of overtime is limited by the organizational constraints mentioned above. We assume
that all staff (both specialists and generalists) experience the same effects of fatigue on
productivity for the same accumulated overtime.
Mathematically, the structure of this reinforcing loop, which connects service capacity with
the effect of fatigue on clinician productivity, is as follows.
C(t) = service capacity at time t = Eet(t) * “Effect of Fatigue on Productivity”, measured
in units of clinician FTEs
where Eet(t) = effective total number of clinicians at time t = Ee(t) + (Er(t) * ρ) ,
measured in units of clinician FTEs
where Ee(t) = total number of experienced clinicians at time t, measured in units
of clinician FTEs
Er(t) = total number of new (rookie) clinicians at time t, measured in units
of clinician FTEs
ρ = new clinician (rookie) productivity fraction = 0.5, measured as a
dimensionless fraction of the productivity of a fully trained clinician
“Effect of Fatigue on Productivity,” defined by the graphical function
shown below in Figure 11, is a decreasing function that reduces service
capacity when the recent workweek is greater than 40 hours/week, but
increases only marginally above its normal operating point when the
workweek falls below normal. The effect this equation describes is
discussed in the section on feedback loop R2b, “Work Quality.”

Rust 55
Figure 11. Effect of fatigue on productivity
Fatigue builds up and dissipates over time; we model fatigue as an exponentially
weighted moving average of past work intensity, as measured by the recent workweek.
The longer the fatigue onset time the longer it takes for burnout to set in and for
clinicians to recover when work intensity falls.
Recent workweek, measured in units of work hours / week, is an exponential smoothing
of the workweek over the period for the onset of fatigue. The 'short term' label refers to
the fact that the burnout onset time is much longer than the fatigue onset time.
where w(t) = workweek at time t, measured in units of work hours / week
ws = standard workweek = 40 hours / week
τfo = fatigue onset time = 3 weeks, which the average time for an extended
series of workweeks to have an impact on clinician productivity
Extended periods of high work intensity also increase clinician turnover. The effect of
fatigue on turnover is an increasing function of burnout, and affects both types of
clinicians equally.
Rrq = quit rate of new clinicians at time t = Er * “Effect of Burnout on Turnover,”
measured in units of clinician FTEs / week
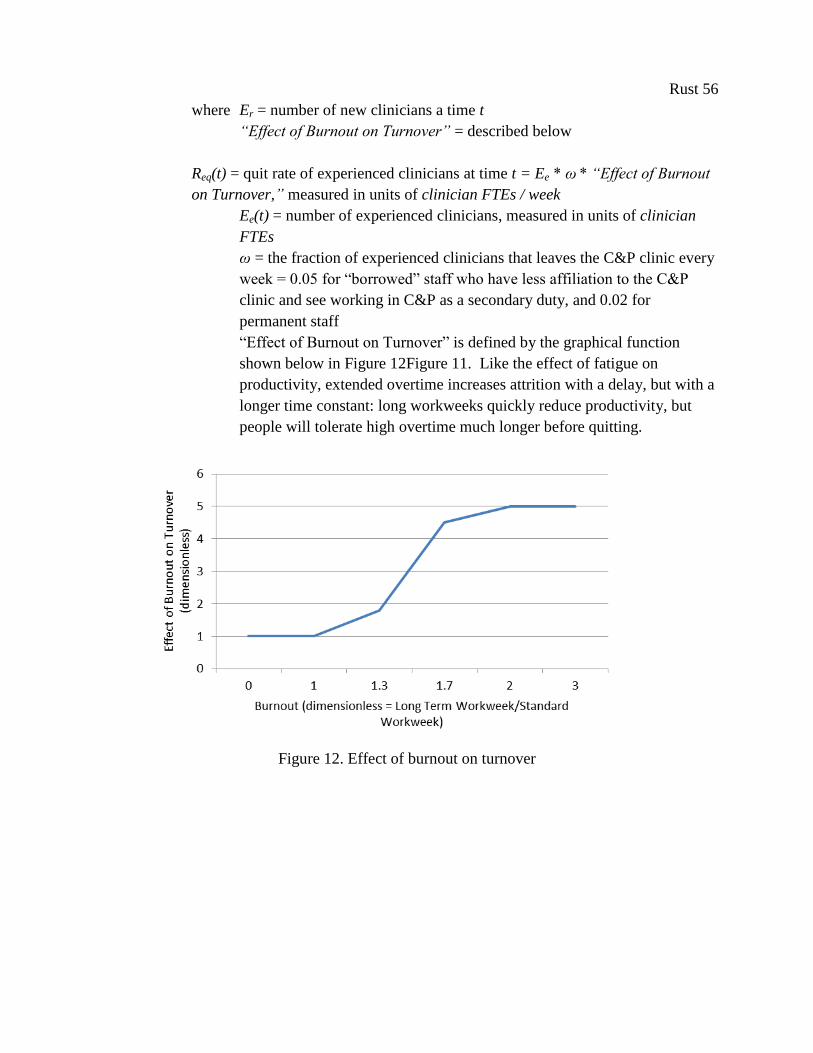
Rust 56
where Er = number of new clinicians a time t
“Effect of Burnout on Turnover” = described below
Req(t) = quit rate of experienced clinicians at time t = Ee * ω * “Effect of Burnout
on Turnover,” measured in units of clinician FTEs / week
Ee(t) = number of experienced clinicians, measured in units of clinician
FTEs
ω = the fraction of experienced clinicians that leaves the C&P clinic every
week = 0.05 for “borrowed” staff who have less affiliation to the C&P
clinic and see working in C&P as a secondary duty, and 0.02 for
permanent staff
“Effect of Burnout on Turnover” is defined by the graphical function
shown below in Figure 12Figure 11. Like the effect of fatigue on
productivity, extended overtime increases attrition with a delay, but with a
longer time constant: long workweeks quickly reduce productivity, but
people will tolerate high overtime much longer before quitting.
Figure 12. Effect of burnout on turnover

Rust 57
Long Term Workweek, measured in units of work hours / week, is an exponential
smoothing of the workweek over the period for the onset of burnout. The 'long term' label
refers to the fact that the burnout onset time is much longer than the fatigue onset time.
where w(t) = workweek at time t, measured in units of work hours / week
ws = standard workweek = 40 hours / week
τbo = time for the extended workweek to have an effect on turnover = 52
weeks
These two ‘side effects’ of high work intensity on fatigue and burnout create a pair of
reinforcing feedbacks that reduce service capacity (directly and indirectly, as attrition
both lowers headcount and increases the rookie fraction), which lowers C&P exam
request completion rate, allowing the service backlog to rise, further increasing work
pressure and forcing service providers to work even harder.
Reinforcing Loop 2 (a and b): Work Quality
Increasing fatigue creates an increase in the percentage of errors made, increasing the number
of exams returned by the VBA for correction. This reinforcing loop causes the unintended
consequence of increasing the backlog of exams (as this rework is added to the queue),
further increasing work pressure and the need for more hours assigned per clinician per day
to C&P. Loop R2b indicates that hiring also adversely affects average quality, as clinicians
new to C&P will produce more errors than those with accumulated experience. We found
that, on average, specialists take more time to gain experience than generalists, as specialists
see fewer C&P patients per week (generalists can see up to 10 patients per day, while most
specialists see an average of 4.3 patients per week in the Base Case Scenario).
Mathematically, the structure of this reinforcing loop, which connects the effects of fatigue to
service quality and backlog, is as follows. We assume that the probability of errors depends
on two factors: fatigue and average clinician experience. Fatigue increases the chance of
error and cuts the chance of detecting and correcting it at the time. Inexperienced clinicians
simply make more errors than experienced clinicians. For simplicity we assume these sources
of error are independent. The probability an exam is done incorrectly is then the
complement of the probability that no error was introduced by any of these factors:
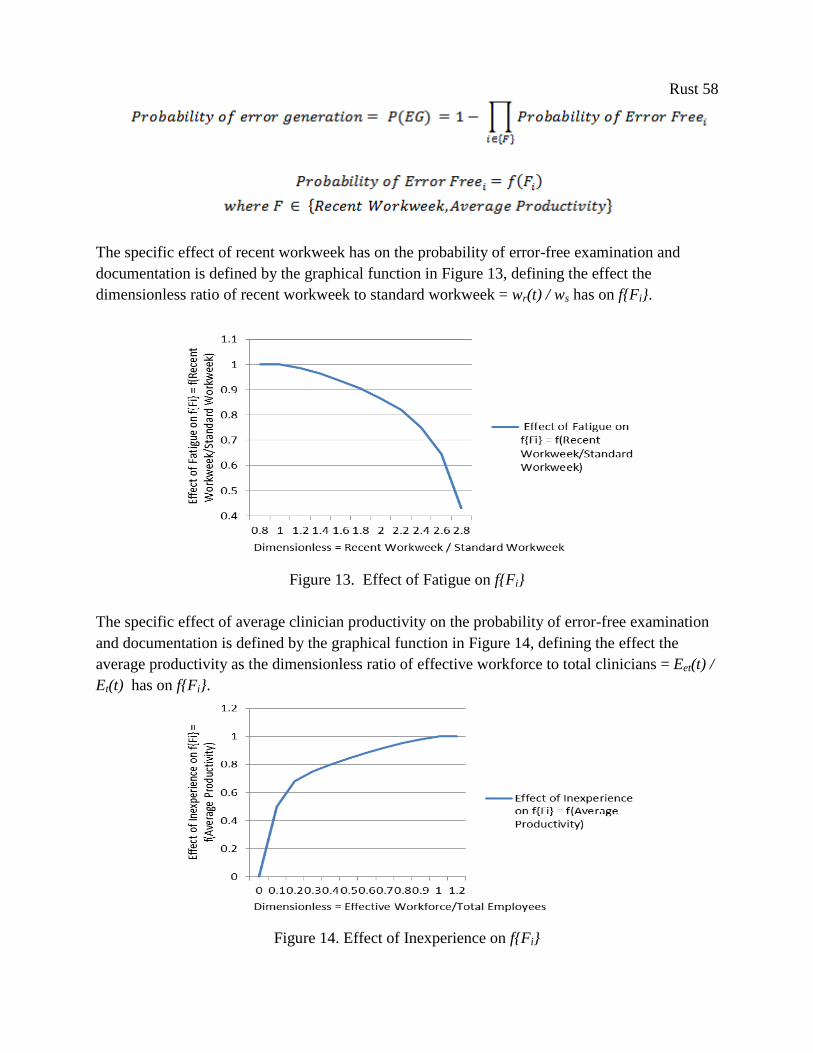
Rust 58
The specific effect of recent workweek has on the probability of error-free examination and
documentation is defined by the graphical function in Figure 13, defining the effect the
dimensionless ratio of recent workweek to standard workweek = wr(t) / ws has on f{Fi}.
Figure 13. Effect of Fatigue on f{Fi}
The specific effect of average clinician productivity on the probability of error-free examination
and documentation is defined by the graphical function in Figure 14, defining the effect the
average productivity as the dimensionless ratio of effective workforce to total clinicians = Eet(t) /
Et(t) has on f{Fi}.
Figure 14. Effect of Inexperience on f{Fi}

Rust 59
Sensitivity analysis suggests that model behavior is not significantly affected by changes in these
graphical functions.
The errors created by these effects are typically not detected immediately: the VBA takes an
average of one month to discover an error in either the exam or its documentation. Errors
therefore accumulate in a stock of unknown rework until they are discovered (this is a standard
model construction for rework, for details see, Lyneis and Ford, 2007).
where E(t) = backlog of undiscovered errors at time t, measured in units of C&P patient
requests for exam(s)
Reg(t)= error generation rate at t, measured in units of C&P patient requests for
exam(s)/week
Red(t) = error discover rate at t, measured in units of C&P patient requests for
exam(s)/week
E0 = initial backlog of undiscovered errors at t = 0, measured in units of C&P
patient requests for exam(s).
Error generation, Reg(t),depends on the total completion rate and the probability that each exam
contains an error:
Reg(t) = Rc(t) * P(EG), measured in units of C&P patient requests for
exam(s)/week
where Rc(t) = completion rate of C&P patient requests at time t measured in units
of C&P patient requests for exam(s)/week
P(EG) = probability of error generation (dimensionless)
The error discovery rate, Red(t), is assumed to be a first-order process with a constant average
error discovery time:
Red(t) = E(t) / τde, measured in units of C&P patient requests/week
where E(t) = the number of undiscovered errors at time t measured in units of C&P
patient requests for exam(s)
τde = time to discover errors = 4 weeks
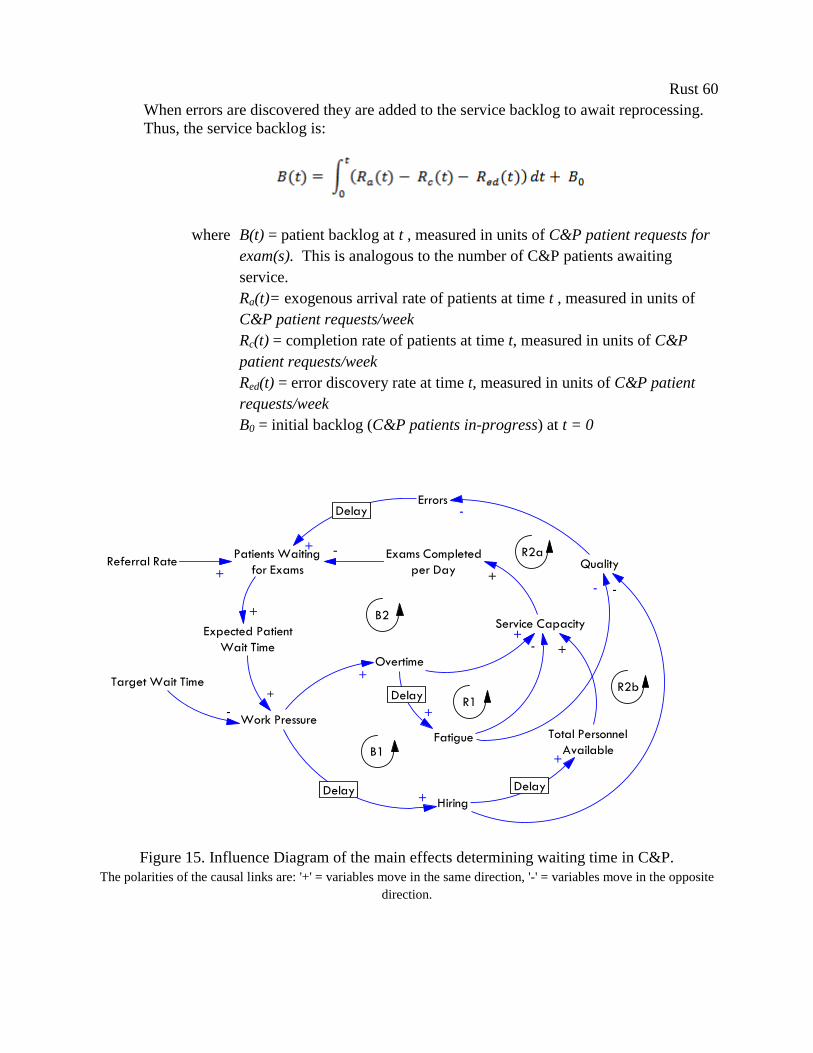
Rust 60
When errors are discovered they are added to the service backlog to await reprocessing.
Thus, the service backlog is:
where B(t) = patient backlog at t , measured in units of C&P patient requests for
exam(s). This is analogous to the number of C&P patients awaiting
service.
Ra(t)= exogenous arrival rate of patients at time t , measured in units of
C&P patient requests/week
Rc(t) = completion rate of patients at time t, measured in units of C&P
patient requests/week
Red(t) = error discovery rate at time t, measured in units of C&P patient
requests/week
B0 = initial backlog (C&P patients in-progress) at t = 0
Referral Rate
Work Pressure
Overtime
Fatigue
Quality
+
+
-
Exams Completed
per Day
+-
Patients Waiting
for Exams+
+
Errors-
+
Hiring+
+
Delay
DelayDelay
Delay
B1
B2
R2b
R1
Target Wait Time
-
-
Service Capacity
Total Personnel
Available
+
+
R2a
Expected Patient
Wait Time
+
-
Figure 15. Influence Diagram of the main effects determining waiting time in C&P.
The polarities of the causal links are: '+' = variables move in the same direction, '-' = variables move in the opposite
direction.
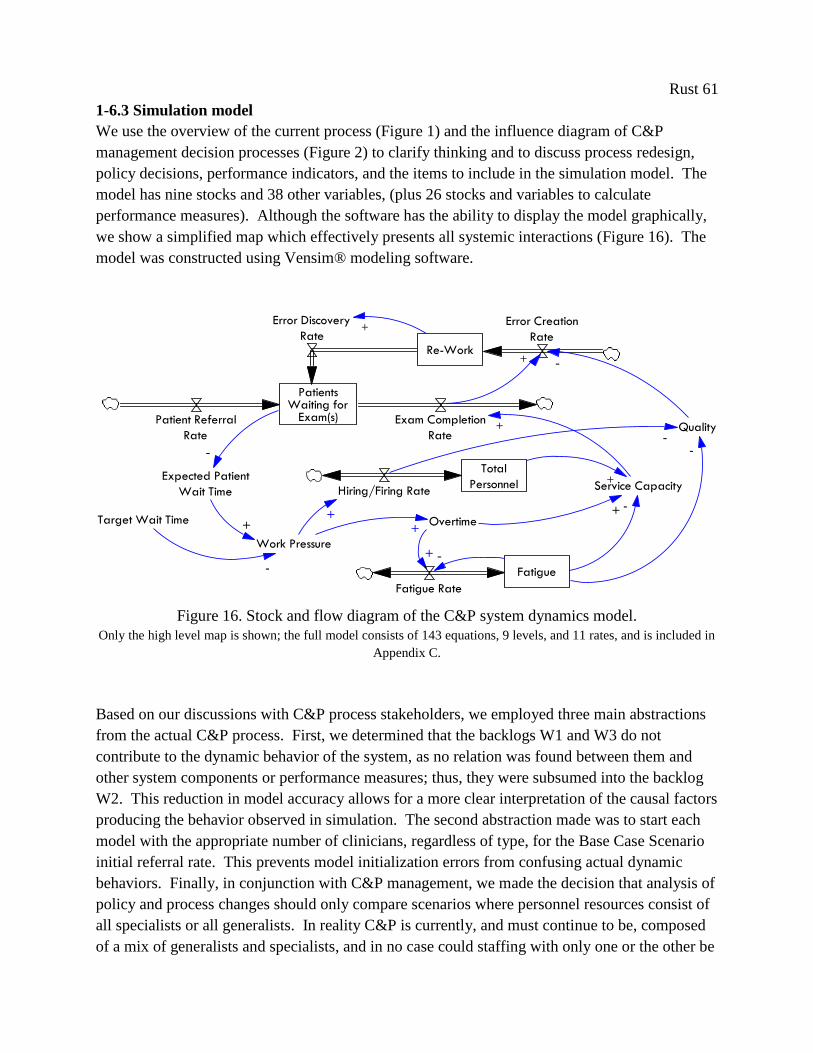
Rust 61
1-6.3 Simulation model
We use the overview of the current process (Figure 1) and the influence diagram of C&P
management decision processes (Figure 2) to clarify thinking and to discuss process redesign,
policy decisions, performance indicators, and the items to include in the simulation model. The
model has nine stocks and 38 other variables, (plus 26 stocks and variables to calculate
performance measures). Although the software has the ability to display the model graphically,
we show a simplified map which effectively presents all systemic interactions (Figure 16). The
model was constructed using Vensim® modeling software.
Work Pressure
Overtime
Fatigue
Quality
+
+
-
+ -+Target Wait Time
-
Service CapacityExpected Patient
Wait Time
+
PatientsWaiting for
Exam(s)Patient Referral
Rate
Exam Completion
Rate
Re-Work
Error Creation
Rate
Error Discovery
Rate
-
Total
PersonnelHiring/Firing Rate
+
-
-
+
Fatigue Rate
+
-
+
Figure 16. Stock and flow diagram of the C&P system dynamics model.
Only the high level map is shown; the full model consists of 143 equations, 9 levels, and 11 rates, and is included in
Appendix C.
Based on our discussions with C&P process stakeholders, we employed three main abstractions
from the actual C&P process. First, we determined that the backlogs W1 and W3 do not
contribute to the dynamic behavior of the system, as no relation was found between them and
other system components or performance measures; thus, they were subsumed into the backlog
W2. This reduction in model accuracy allows for a more clear interpretation of the causal factors
producing the behavior observed in simulation. The second abstraction made was to start each
model with the appropriate number of clinicians, regardless of type, for the Base Case Scenario
initial referral rate. This prevents model initialization errors from confusing actual dynamic
behaviors. Finally, in conjunction with C&P management, we made the decision that analysis of
policy and process changes should only compare scenarios where personnel resources consist of
all specialists or all generalists. In reality C&P is currently, and must continue to be, composed
of a mix of generalists and specialists, and in no case could staffing with only one or the other be
Rust 62
a feasible policy. However, C&P management felt that such abstracted scenarios were more
useful for comparison and decision-making purposes, allowing for more clear answers to their
questions on process redesign.
1-6.4 Clinic redesign proposals
We test both lean and agile-based system redesign proposals in simulation. These different
scenarios test the implicit hypothesis underpinning the current process redesign, that improving
provider efficiency will improve service timeliness, and the alternate hypothesis, that increasing
resource flexibility will instead improve service timeliness and patient access.
The lean proposal generated by C&P managers is to change the type of provider used to deliver
C&P medical disability exams. The two types of providers chosen by C&P mangers to be of
interest were staffing with all specialists and with all mid-level generalists (specifically,
physician assistants). Physician assistants show increased efficiency over specialists, as
measured by the average number of disability assessments completed per hour. This change is
included in our model as an increase in the provider productivity parameter. The parameter
governing variable costs due to salary is also modified in this scenario, as PAs earn about half as
much as specialists. Based on conversations with C&P managers and other C&P staff, we
assume that the quality of exams (as measured by the rework rate) will not be affected by type of
clinician. The process for completing C&P disability exams is highly scripted, ensuring that a
broad range of provider can accomplish them with little additional training.
Our proposed agile-based system redesign concept is to improve resource flexibility through
changing the speed at which resource allocation decisions are manifest, rather than changing
specific provider types. There are many possible ways to increase the speed of the decision to
adjust resource allocation, ranging from streamlining the hiring process for new C&P clinicians,
to reviewing and reacting to patient backlog measures daily instead of weekly, to removing steps
in the communication process between C&P managers and their staff’s primary service chiefs.
Considering the constraints present in the hospital, in terms of lengthy hiring times for new
clinicians, delays in borrowing clinicians from other departments, and the limited ability to
schedule over-time, we propose to increase resource flexibility through the counter-intuitive
solution of hiring all C&P clinicians directly for the C&P clinic.
In this scenario, C&P clinicians will report directly to the C&P medical director, who will no
longer need to ‘borrow’ clinicians from other departments. This staffing shift will increase
resource flexibility by increasing individual C&P clinicians’ ability to work overtime when
demand increases and the ability of C&P managers to schedule less than 40 hours per week when
demand decreases, both of which are currently limited by the organizational structure inherent to
‘borrowing’ providers, as discussed in section 7.2. We believe that increasing the ability to make
these types of hours/provider/week decisions will result a net increase in capacity flexibility,
Rust 63
even if management decisions on the total number of providers per week manifest much more
slowly than before. Shifting the mechanism by which resource capacity is adjusted, from
changing total personnel to changing hours/week, will allow C&P managers to react more
quickly to fluctuations in patient backlog, resulting in better synchronization of service capacity
with demand.
This proposed policy is included in the model as a change in the capacity adjustment time
parameter and the maximum possible workweek per provider. In addition to the effects on
resource flexibility, these changes to clinic staff primary location also necessarily affect
providers’ learning rates as related to gaining experience, and clinician turn-over rates (for
details, see Table 1). Providers who work directly for the C&P clinic gain experience faster
when working solely on C&P cases, and are more committed to the C&P clinic, therefore
remaining in C&P longer than their ‘borrowed’ counterparts.
C&P clinic managers raised substantive concerns about this proposal during the policy design
phase. Their qualms fell into three main categories. The first is that even if flexibility is as
important to performance as we believe, hiring new clinicians at the VA takes so long that our
proposed policy could never create a more flexible system than their current system of ad hoc
borrowing. The lengthy time to hire a new clinician was perceived to completely overwhelm any
possible flexibility gains from ability to use overtime. Before explicit investigation of this effect
in group simulation sessions, C&P managers discounted the effect overtime adjustments could
have on the total service capacity.
The second problem they foresaw is that since the agile-derived operation change allows for no
resource buffer for C&P managers, then the continuous use of overtime to adjust service
capacity would lead to clinician fatigue and eventual burnout. This would not only have a
detrimental impact on service quality in the short term, but reduce average experience level of
C&P clinicians in the long term, as the higher turn-over rate would ensure that proportionally
more clinician would be new and inexperienced than before. This causal relationship is
commonly found in workforce models in the literature, and undoubtedly appears in their real-
world system. We explicitly include these feedback loops to allow for overtime to create a
buildup of fatigue and subsequent declining service quality in our model.
The third main concern centered on costs: if demand declined significantly (a reverse from the
event seen in 2010), then C&P managers will not be able to quickly reduce capacity, which will
lead to low utilization rates and unjustifiable higher costs in that period of abnormally low
demand. We addressed this concern by explicitly setting ‘time to dismiss’ equally as long as the
‘time to hire.’ Model testing under various demand scenarios, included in section 9.3, address
this concern. Working with the C&P management team, we included all of these constraints and
feedbacks explicitly in our model to test for these predicted effects.

Rust 64
Table 1. Parameter changes for the three system redesign scenarios tested and base case,
developed through interviews and analysis of data obtained from VA CPRS reports.
1-7. Simulation Analysis
In this section, we test for the effects of a sudden increase in demand for C&P services on system
performance, finding support for our hypothesis that the ad hoc ‘borrowing’ of providers, which
provided the appearance of flexibility, was, in fact, not flexible enough to accommodate the
‘spike’ in demand seen in 2010. These simulations produce system behaviors that closely match
historical data, further validating our model. Finally, we discuss how model structure creates
these behaviors and the implications for C&P redesign.
1-7.1 System performance under ‘normal’ demand
Calibration of the patient referral rate to C&P was derived from historical data made available by
the hospital. These data are simulated as stochastic variation around a mean of 153 patients per
week, or the equivalent of 1,025 exams per month. To establish that the model is able to produce
the dynamics seen in the real world, this variation around the mean patient referral rate was
simulated 1,000 times for the equivalent of three years each. Summary statistics from these runs
are shown in Table 2, and compared to historical data. Unless otherwise stated, these
performance measures have been calculated from simulations using this ‘normal’ demand and
are averages subsuming the variation caused by ‘normal’ variation in the referral rate.
Scenario
Performance
Indicator unit
Base Case =
‘Borrowing’
specialists
(100%)
‘Borrowing’ mid-
level providers
Hiring
specialists
Hiring mid-
level providers
Time to Hire [weeks] 16 16 52 52
Time to Train [weeks] 52 52 16 16
Maximum
Productivity [exams/hour] 0.63 0.87 0.63 0.87
Maximum
Workweek [hours/week] 42 42 58 58
Time to Layoff [weeks] 2 2 8 8
Normal Quit
Rate
[dimensionless
/week] 2% 2% 0.05% 0.05%
Cost [dollars/year
] $150,000 $75,000 $150,000 $75,000
Redesign
philosophy Lean Agile Combined
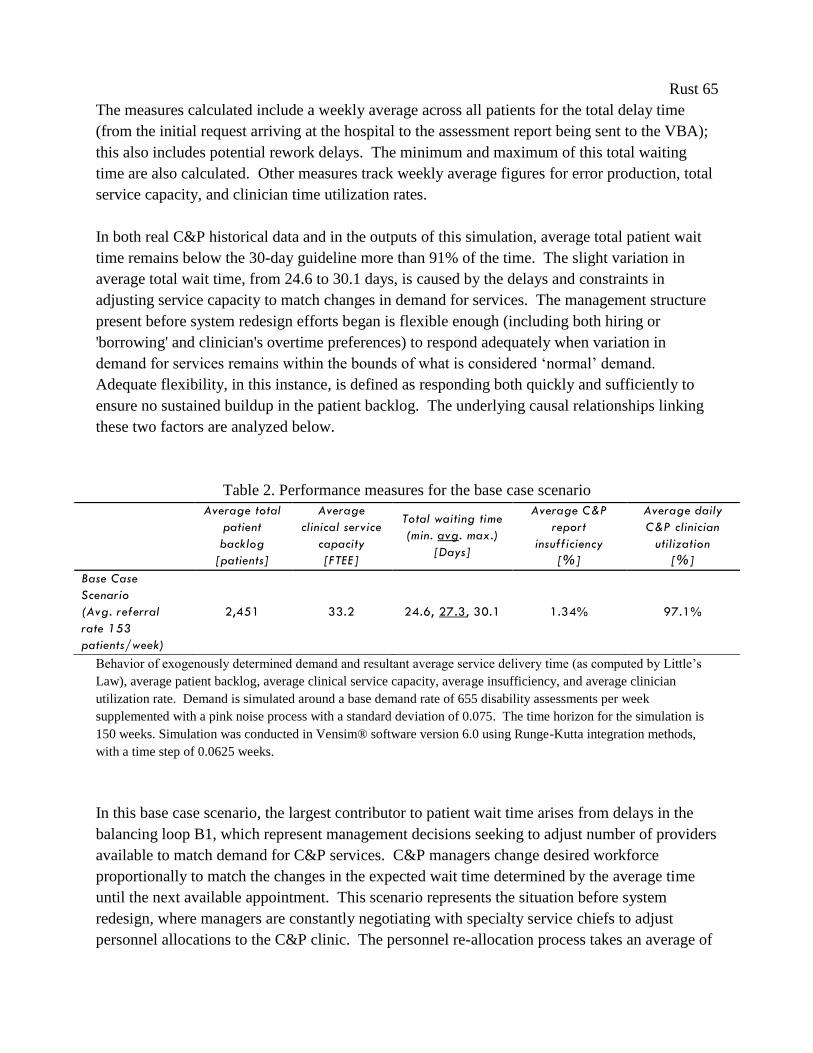
Rust 65
The measures calculated include a weekly average across all patients for the total delay time
(from the initial request arriving at the hospital to the assessment report being sent to the VBA);
this also includes potential rework delays. The minimum and maximum of this total waiting
time are also calculated. Other measures track weekly average figures for error production, total
service capacity, and clinician time utilization rates.
In both real C&P historical data and in the outputs of this simulation, average total patient wait
time remains below the 30-day guideline more than 91% of the time. The slight variation in
average total wait time, from 24.6 to 30.1 days, is caused by the delays and constraints in
adjusting service capacity to match changes in demand for services. The management structure
present before system redesign efforts began is flexible enough (including both hiring or
'borrowing' and clinician's overtime preferences) to respond adequately when variation in
demand for services remains within the bounds of what is considered ‘normal’ demand.
Adequate flexibility, in this instance, is defined as responding both quickly and sufficiently to
ensure no sustained buildup in the patient backlog. The underlying causal relationships linking
these two factors are analyzed below.
Table 2. Performance measures for the base case scenario
Behavior of exogenously determined demand and resultant average service delivery time (as computed by Little’s
Law), average patient backlog, average clinical service capacity, average insufficiency, and average clinician
utilization rate. Demand is simulated around a base demand rate of 655 disability assessments per week
supplemented with a pink noise process with a standard deviation of 0.075. The time horizon for the simulation is
150 weeks. Simulation was conducted in Vensim® software version 6.0 using Runge-Kutta integration methods,
with a time step of 0.0625 weeks.
In this base case scenario, the largest contributor to patient wait time arises from delays in the
balancing loop B1, which represent management decisions seeking to adjust number of providers
available to match demand for C&P services. C&P managers change desired workforce
proportionally to match the changes in the expected wait time determined by the average time
until the next available appointment. This scenario represents the situation before system
redesign, where managers are constantly negotiating with specialty service chiefs to adjust
personnel allocations to the C&P clinic. The personnel re-allocation process takes an average of
Average total
patient
backlog
[patients]
Average
clinical service
capacity
[FTEE]
Total waiting time
(min. avg. max.)
[Days]
Average C&P
report
insufficiency
[%]
Average daily
C&P clinician
utilization
[%]
Base Case
Scenario
(Avg. referral
rate 153
patients/week)
2,451 33.2 24.6, 27.3, 30.1 1.34% 97.1%
Rust 66
four months, consisting of negotiations between service chiefs, internal negotiations with
clinicians, and updating clinic profiles in the IT system. During this time, service demand has
undoubtedly changed, prompting another round of negotiations. Thus, C&P personnel resources
are always four months behind what C&P managers believe they should be.
However, this delay leads to limited adverse consequences during normal fluctuations in demand
for services. As shown in both simulation and site data, a four month personnel adjustment delay
is not enough to allow a buildup of patients waiting for C&P appointments. Under normal
conditions, neither the speed nor the volume of the responses generated by this loop is too
limited for managers to be able to keep C&P performance close to desired.
C&P managers can also adjust service capacity by directly changing hours per clinician,
represented by balancing loop B2. However, this loop has little effect on overall service capacity
in this scenario. No large adjustments to C&P hours per week are possible, as 'borrowed'
specialists have no incentives to work overtime, and a reduction in clinic utilization (working
less than an 8 hour day) would cause their specialty service to re-requisition them to their
primary service. While balancing loop B2 is not constrained at all in speed, it is severely
constrained in terms of volume of response available.
The pre-redesign organizational structure in which C&P is embedded leads to a dependence on
loop B1, the official re-allocation of resources between departments. This lack of an immediate
lever to change service capacity, coupled with the delay in resource re-allocation, prevents C&P
managers from reacting optimally to changes in demand for services. These two factors
combined lead to the observed 9% overage in patient wait times.
1-7.2 System performance under excess demand for services
The reference mode also includes a period of excess demand for C&P services. Clinic managers
and data from the hospital’s electronic medical record system indicate that excessive demand
overloads the C&P system, creating a massive patient backlog which increases average patient
wait time to near 50 days. Figure 17 compares historical data, with a 160% increase in demand
for services during July and August 2010, to the base case simulation output (one sample run
shown). The model replicates historical behavior, where normal variation in the patient referral
rate produces a tolerable variation in total patient waiting time, until a period of excess demand
creates a subsequent increase in average patient wait time. The underlying reasons for this
behavior are analyzed below.
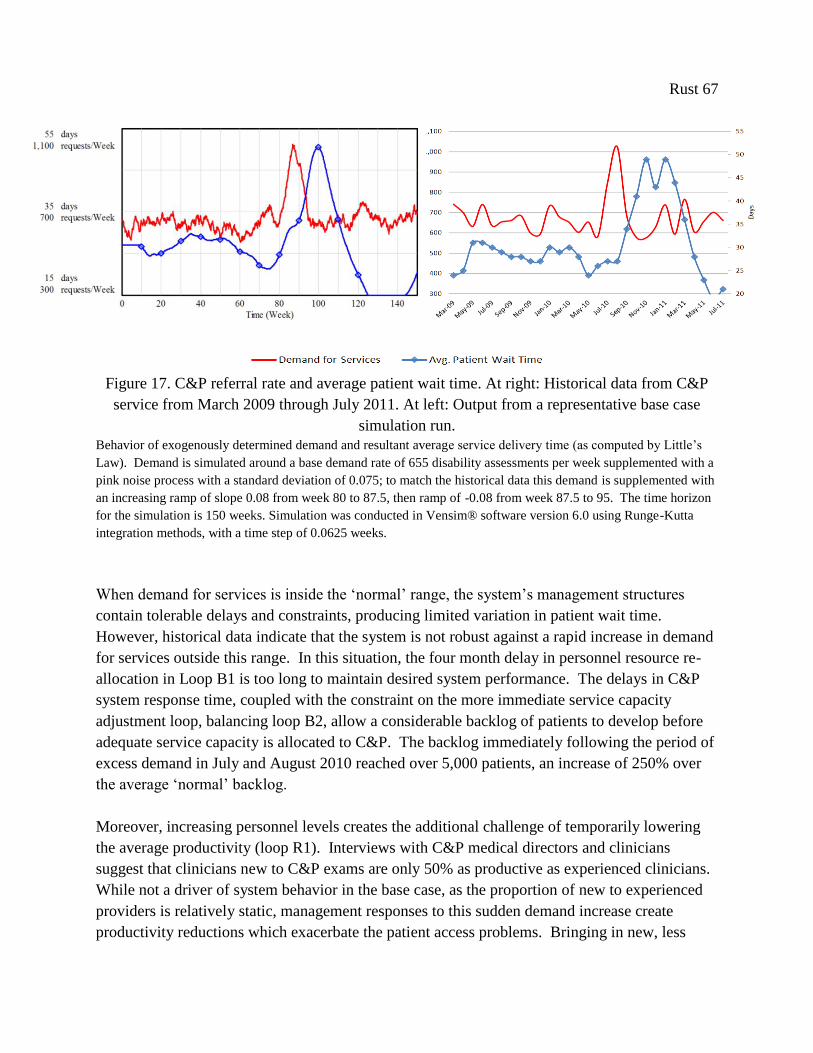
Rust 67
Figure 17. C&P referral rate and average patient wait time. At right: Historical data from C&P
service from March 2009 through July 2011. At left: Output from a representative base case
simulation run.
Behavior of exogenously determined demand and resultant average service delivery time (as computed by Little’s
Law). Demand is simulated around a base demand rate of 655 disability assessments per week supplemented with a
pink noise process with a standard deviation of 0.075; to match the historical data this demand is supplemented with
an increasing ramp of slope 0.08 from week 80 to 87.5, then ramp of -0.08 from week 87.5 to 95. The time horizon
for the simulation is 150 weeks. Simulation was conducted in Vensim® software version 6.0 using Runge-Kutta
integration methods, with a time step of 0.0625 weeks.
When demand for services is inside the ‘normal’ range, the system’s management structures
contain tolerable delays and constraints, producing limited variation in patient wait time.
However, historical data indicate that the system is not robust against a rapid increase in demand
for services outside this range. In this situation, the four month delay in personnel resource re-
allocation in Loop B1 is too long to maintain desired system performance. The delays in C&P
system response time, coupled with the constraint on the more immediate service capacity
adjustment loop, balancing loop B2, allow a considerable backlog of patients to develop before
adequate service capacity is allocated to C&P. The backlog immediately following the period of
excess demand in July and August 2010 reached over 5,000 patients, an increase of 250% over
the average ‘normal’ backlog.
Moreover, increasing personnel levels creates the additional challenge of temporarily lowering
the average productivity (loop R1). Interviews with C&P medical directors and clinicians
suggest that clinicians new to C&P exams are only 50% as productive as experienced clinicians.
While not a driver of system behavior in the base case, as the proportion of new to experienced
providers is relatively static, management responses to this sudden demand increase create
productivity reductions which exacerbate the patient access problems. Bringing in new, less
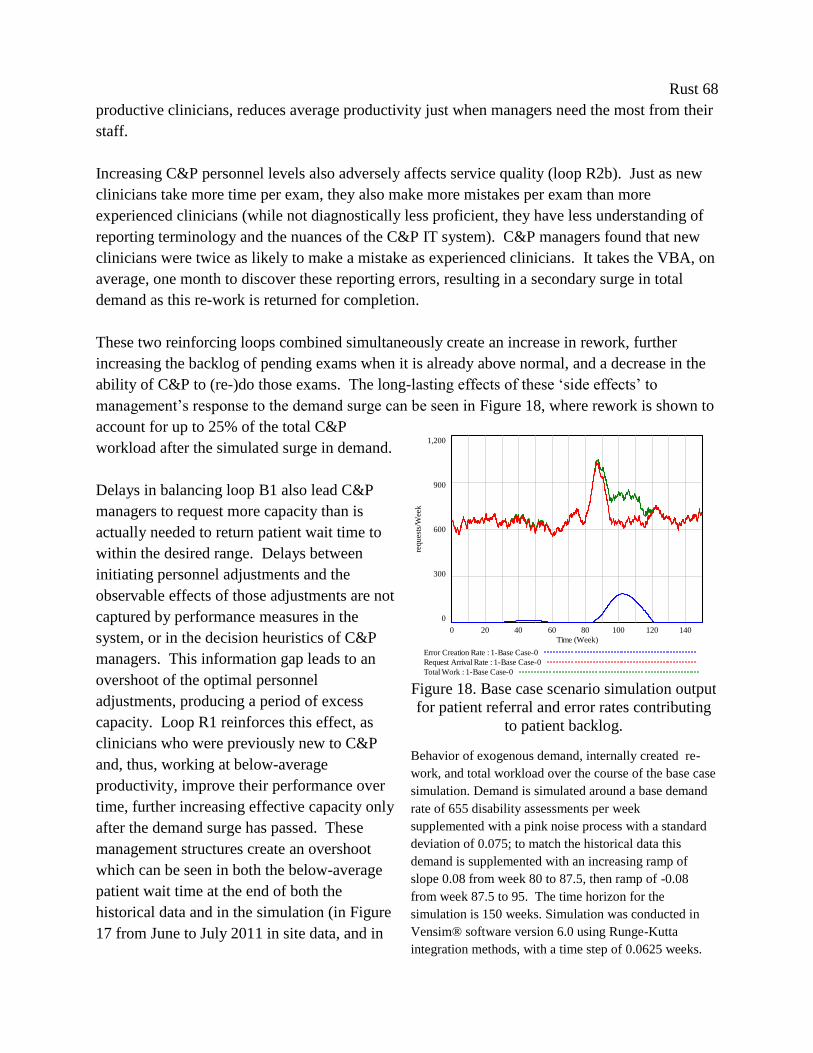
Rust 68
productive clinicians, reduces average productivity just when managers need the most from their
staff.
Increasing C&P personnel levels also adversely affects service quality (loop R2b). Just as new
clinicians take more time per exam, they also make more mistakes per exam than more
experienced clinicians (while not diagnostically less proficient, they have less understanding of
reporting terminology and the nuances of the C&P IT system). C&P managers found that new
clinicians were twice as likely to make a mistake as experienced clinicians. It takes the VBA, on
average, one month to discover these reporting errors, resulting in a secondary surge in total
demand as this re-work is returned for completion.
These two reinforcing loops combined simultaneously create an increase in rework, further
increasing the backlog of pending exams when it is already above normal, and a decrease in the
ability of C&P to (re-)do those exams. The long-lasting effects of these ‘side effects’ to
management’s response to the demand surge can be seen in Figure 18, where rework is shown to
account for up to 25% of the total C&P
workload after the simulated surge in demand.
Delays in balancing loop B1 also lead C&P
managers to request more capacity than is
actually needed to return patient wait time to
within the desired range. Delays between
initiating personnel adjustments and the
observable effects of those adjustments are not
captured by performance measures in the
system, or in the decision heuristics of C&P
managers. This information gap leads to an
overshoot of the optimal personnel
adjustments, producing a period of excess
capacity. Loop R1 reinforces this effect, as
clinicians who were previously new to C&P
and, thus, working at below-average
productivity, improve their performance over
time, further increasing effective capacity only
after the demand surge has passed. These
management structures create an overshoot
which can be seen in both the below-average
patient wait time at the end of both the
historical data and in the simulation (in Figure
17 from June to July 2011 in site data, and in
Figure 18. Base case scenario simulation output
for patient referral and error rates contributing
to patient backlog.
Behavior of exogenous demand, internally created re-
work, and total workload over the course of the base case
simulation. Demand is simulated around a base demand
rate of 655 disability assessments per week
supplemented with a pink noise process with a standard
deviation of 0.075; to match the historical data this
demand is supplemented with an increasing ramp of
slope 0.08 from week 80 to 87.5, then ramp of -0.08
from week 87.5 to 95. The time horizon for the
simulation is 150 weeks. Simulation was conducted in
Vensim® software version 6.0 using Runge-Kutta
integration methods, with a time step of 0.0625 weeks.
arrivals and errors
1,200
900
600
300
0
0 20 40 60 80 100 120 140
Time (Week)
req
ues
ts/W
eek
Error Creation Rate : 1-Base Case-0
Request Arrival Rate : 1-Base Case-0
Total Work : 1-Base Case-0

Rust 69
weeks 120-150 in simulation) and in the reduced clinic utilization rates of C&P clinicians over
the same period.
We have derived a system structure from iterative interviews and site data that reproduces
observed behavior. In analysis of the base case simulation, we have clearly defined the problem
facing C&P. Simulations reveal a system robust against what is perceived to be a ‘normal’ level
of demand volatility, but not against ‘surges’ in demand, or increased levels of demand
volatility. C&P management decision structures reliant on borrowing specialist clinicians are not
flexible enough (in terms of response speed) to prevent a buildup of patients waiting for
appointments when demand increases suddenly. If demand is subject to recurrent sudden
increases, then further patient access problems are inevitable.
1-8. Exploring Agile Clinic Redesign
The initial motivation for this research was to inform system redesign efforts by a VA hospital
facing a 'crisis' of patient access to services. Model simulations explore what changes to current
system structures or processes could render the system more robust against fluctuation in
demand for services, and prevent future sudden increases in demand from recreating the access
problem seen in 2010. Exploratory simulation allows us to confidently test lean-derived system
redesign proposals, along with the agile-based proposal, before implementation. Simulation also
allows us to challenge managers’ assumptions on the causes of the observed behavior in the
system, and assess the robustness of new policies under different demand conditions.
We conduct a range of simulation experiments for comparison with the base case. The principle
scenarios involve changes in provider type in C&P, changes to the staffing structure of the C&P
service, and combined scenarios. Other policy runs explore the effects of increased demand
volatility.
1-8.1 Performance measures
Policies were judged against current national guidelines for timeliness (total average patient wait
time <30 days) and quality (<2% disability assessment return rate). However, discussion with
C&P managers indicated that other performance indicators would be useful for evaluating
system performance. Hospital administrators and C&P managers sought to compare clinic (e.g.,
average provider) utilization, total cost, productivity, and cost per patient across the various
system redesign alternatives.
The resulting total of seven key performance indicators are listed in Table 3, left column
(equations for performance measure calculation are shown in Appendix C). The first two
indicators are the national performance indicators currently tracked by the hospital. The next
indicator is total cost per year, which is based on number of providers and hours worked per

Rust 70
week (this measure includes the extra costs of overtime and under-time, but excludes fixed costs,
tests, labs, administrative and support staff, etc.). The next three indicators are measures of
productivity: Clinic utilization is the ratio of actual time spent in C&P to a standard 40 hour
workweek; average productivity is measured as exams/hour (which is affected by ratio of new to
experienced providers and fatigue from excess periods of overtime), and cost per patient.
Finally, we present our own measure of timeliness: the average absolute difference between the
target wait time and the actual wait time (i.e., the accumulation of all wait time error, averaged
over the duration of the simulation). This is a more descriptive measure of the C&P system's
response to fluctuations in demand for services than average total wait time. Average total wait
time can be a misleading performance indicator, as a lower average wait time is not necessarily a
sign of improved performance. An average wait time below the target wait time indicates the
system is providing faster than desired access to services, and is thus consuming more than the
necessary level of resources. We do not include indicators of patient satisfaction because we
assume these are constant in our model, and thus do not affect model behavior. General patient
satisfaction with the disability assessment process is outside the scope of our research efforts, but
future models may include measures of patient satisfaction.
1-8.2 Lean v. agile scenarios
System behavior was simulated for each system redesign approach. The resulting performance
measures are shown in Table 3 and Figure 19 and analysis of the various outputs of the runs is
presented below. These simulations reveal the trade-offs inherent between the two approaches of
increasing clinician productivity and/or resource flexibility in environments of extreme demand
uncertainty.
In our model, agile-based redesign results in an average patient wait time that appears to support
the C&P managers’ fears, that hiring permanent clinicians will decrease system performance.
However, the variation in total wait time indicates that the opposite is true: staffing more flexibly
lowered to the total range of service time variation to less than 28.7% of the range of the base
case. The maximum average patient wait time in the agile scenario is only 37 days, compared to
over 50 days in the lean-based scenario. For comparative purposes, the clearest measure of
system performance is absolute wait time error, which is the total accumulated difference
between the actual wait time and the target wait time. The scenarios that focus on increasing
flexibility generate only 28% of the wait time error accumulated during the base case and lean-
based simulations.
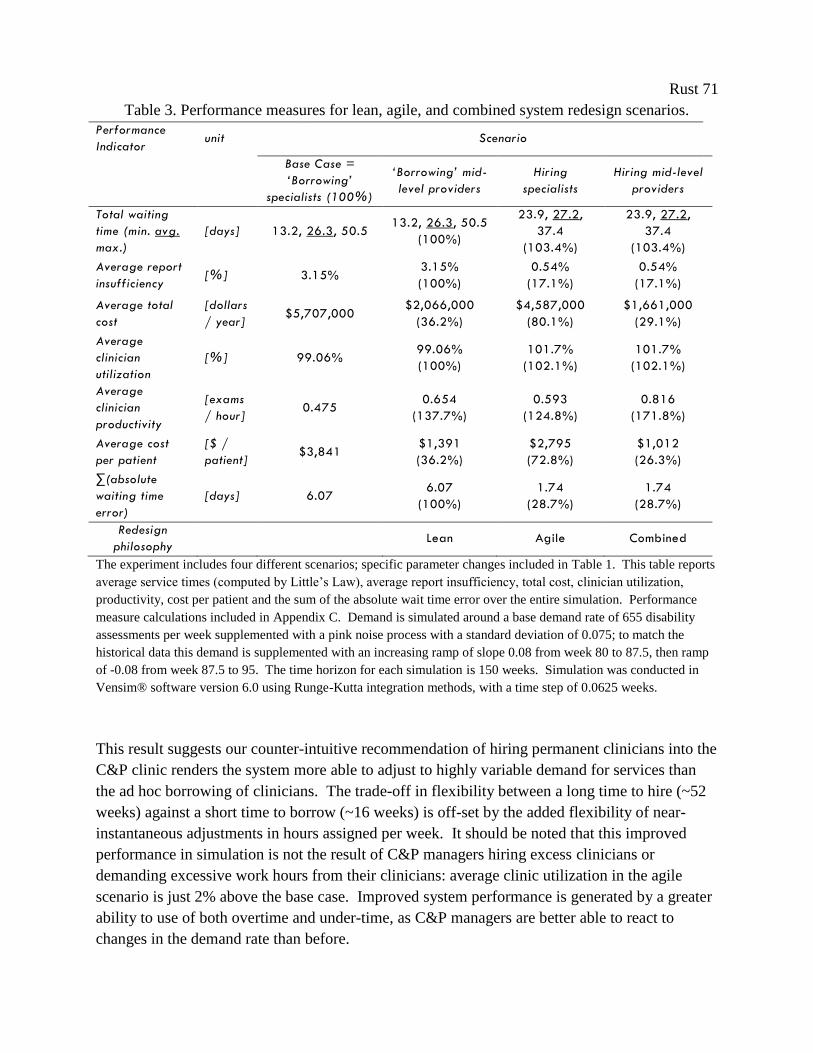
Rust 71
Table 3. Performance measures for lean, agile, and combined system redesign scenarios.
Performance
Indicator unit Scenario
Base Case =
‘Borrowing’
specialists (100%)
‘Borrowing’ mid-
level providers
Hiring
specialists
Hiring mid-level
providers
Total waiting
time (min. avg.
max.)
[days] 13.2, 26.3, 50.5 13.2, 26.3, 50.5
(100%)
23.9, 27.2,
37.4
(103.4%)
23.9, 27.2,
37.4
(103.4%)
Average report
insufficiency [%] 3.15%
3.15%
(100%)
0.54%
(17.1%)
0.54%
(17.1%)
Average total
cost
[dollars
/ year] $5,707,000
$2,066,000
(36.2%)
$4,587,000
(80.1%)
$1,661,000
(29.1%)
Average
clinician
utilization
[%] 99.06% 99.06%
(100%)
101.7%
(102.1%)
101.7%
(102.1%)
Average
clinician
productivity
[exams
/ hour] 0.475
0.654
(137.7%)
0.593
(124.8%)
0.816
(171.8%)
Average cost
per patient
[$ /
patient] $3,841
$1,391
(36.2%)
$2,795
(72.8%)
$1,012
(26.3%)
∑(absolute
waiting time
error)
[days] 6.07 6.07
(100%)
1.74
(28.7%)
1.74
(28.7%)
Redesign
philosophy Lean Agile Combined
The experiment includes four different scenarios; specific parameter changes included in Table 1. This table reports
average service times (computed by Little’s Law), average report insufficiency, total cost, clinician utilization,
productivity, cost per patient and the sum of the absolute wait time error over the entire simulation. Performance
measure calculations included in Appendix C. Demand is simulated around a base demand rate of 655 disability
assessments per week supplemented with a pink noise process with a standard deviation of 0.075; to match the
historical data this demand is supplemented with an increasing ramp of slope 0.08 from week 80 to 87.5, then ramp
of -0.08 from week 87.5 to 95. The time horizon for each simulation is 150 weeks. Simulation was conducted in
Vensim® software version 6.0 using Runge-Kutta integration methods, with a time step of 0.0625 weeks.
This result suggests our counter-intuitive recommendation of hiring permanent clinicians into the
C&P clinic renders the system more able to adjust to highly variable demand for services than
the ad hoc borrowing of clinicians. The trade-off in flexibility between a long time to hire (~52
weeks) against a short time to borrow (~16 weeks) is off-set by the added flexibility of near-
instantaneous adjustments in hours assigned per week. It should be noted that this improved
performance in simulation is not the result of C&P managers hiring excess clinicians or
demanding excessive work hours from their clinicians: average clinic utilization in the agile
scenario is just 2% above the base case. Improved system performance is generated by a greater
ability to use of both overtime and under-time, as C&P managers are better able to react to
changes in the demand rate than before.

Rust 72
The lean scenario of changing staff to more efficient providers does not affect patient wait time
or clinic utilization rates. Instead, it is the C&P system’s ability to respond to demand that
determines the wait time error. The more flexible the resources, meaning the fewer constraints
on the speed and size of service capacity adjustment, the better the system will be able to
maintain a desired wait time when faced with fluctuating demand. These simulations suggest
that changing individual provider productivity has no long-term effect on maintaining desired
patient access to services.
The operational change proposed to increase resource flexibility, hiring clinicians directly into
the C&P clinic, also generates the added gains of greater productivity due to lower clinician
turnover (if working directly for C&P, the average clinician will gain experience for many years
instead of only for a few months). This causes an increase in exam quality (as measured by the
exam return rate) over the base case. Exam quality in the model is determined by the effects of
fatigue and experience, and is assumed not to be affected by inherent differences in skill sets
between specialists and mid-level providers. Long periods of overtime could lead to fatigue and
reduce quality, which are included in the model in feedback loop R2a, and while clinic
utilization does increase in slightly under the more flexible staffing scenario, it is not enough to
affect performance. As this might be an artifact of the specific demand pattern used, the effects
of alternate demand patterns on clinic utilization rates are examined in subsequent simulations.
In summary, changing to more efficient providers seems to only affect costs and average
productivity levels and not patient access. Regardless of the level of system flexibility,
switching to mid-level providers reduces the cost of providing C&P services by ~63% (i.e., from
the base case to agile scenario, and from the lean to combined scenario). Most of these gains are
generated by differences in base salary, as mid-levels’ salaries are assumed to be, on average,
50% of those of specialists. Cost is also reduced by differences in clinician productivity, which
is also higher for mid-levels than specialists, thus reducing the total FTE required to meet
demand, further reducing costs in those scenarios. These factors combine to affect average cost
per patient, which is significantly lower with mid-levels than with specialists. It should be noted
that switching to a more agile service system does increase the use of overtime, which does
increase costs (as seen in the kink in the behavior of cost over time in the agile and combined
scenarios in Figure 19). However, this increase in costs is always less severe than the costs
incurred by the greater fluctuations in resources required under the less flexible system.
Figure 19 shows a comparison of the behavior of costs and service times under the four
scenarios, each of which is driven by identically distributed exogenous demand. These charts
reveal the range of possible costs and patient wait times that the C&P clinic and their patients
will face under a demand pattern equivalent to that of historical demand. Taking this dynamic
behavior into account, agile redesign clearly improves both costs and patient access over the base
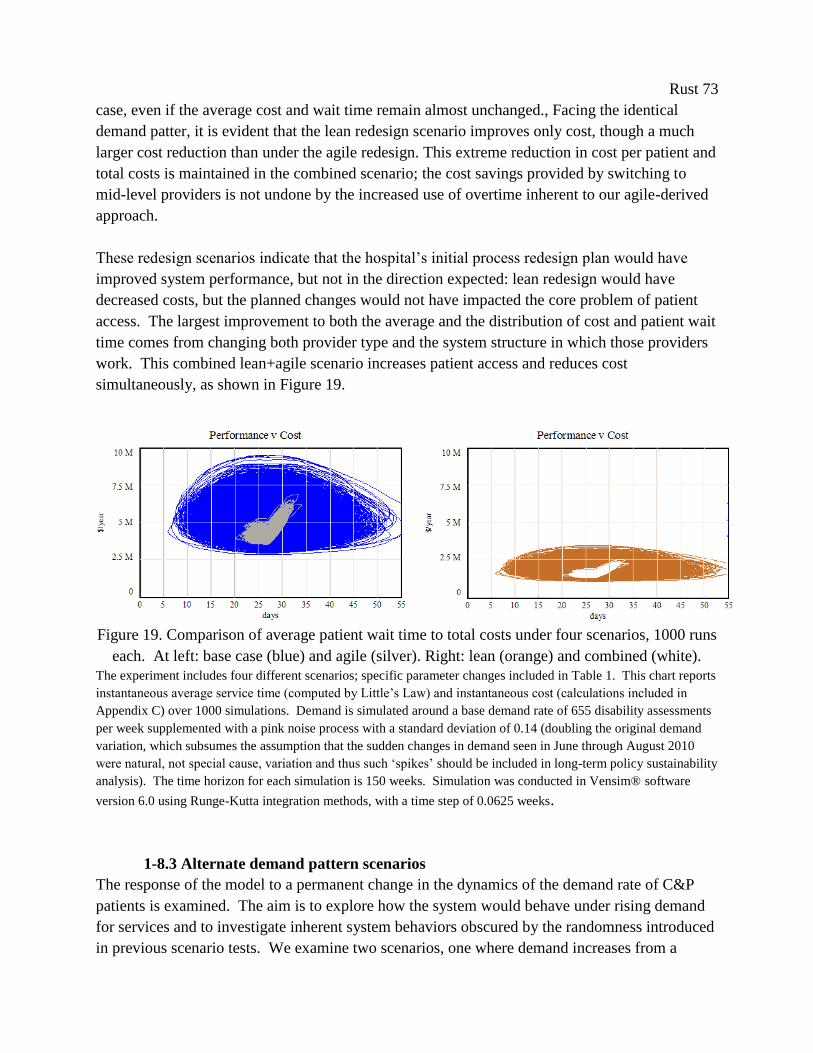
Rust 73
case, even if the average cost and wait time remain almost unchanged., Facing the identical
demand patter, it is evident that the lean redesign scenario improves only cost, though a much
larger cost reduction than under the agile redesign. This extreme reduction in cost per patient and
total costs is maintained in the combined scenario; the cost savings provided by switching to
mid-level providers is not undone by the increased use of overtime inherent to our agile-derived
approach.
These redesign scenarios indicate that the hospital’s initial process redesign plan would have
improved system performance, but not in the direction expected: lean redesign would have
decreased costs, but the planned changes would not have impacted the core problem of patient
access. The largest improvement to both the average and the distribution of cost and patient wait
time comes from changing both provider type and the system structure in which those providers
work. This combined lean+agile scenario increases patient access and reduces cost
simultaneously, as shown in Figure 19.
Figure 19. Comparison of average patient wait time to total costs under four scenarios, 1000 runs
each. At left: base case (blue) and agile (silver). Right: lean (orange) and combined (white).
The experiment includes four different scenarios; specific parameter changes included in Table 1. This chart reports
instantaneous average service time (computed by Little’s Law) and instantaneous cost (calculations included in
Appendix C) over 1000 simulations. Demand is simulated around a base demand rate of 655 disability assessments
per week supplemented with a pink noise process with a standard deviation of 0.14 (doubling the original demand
variation, which subsumes the assumption that the sudden changes in demand seen in June through August 2010
were natural, not special cause, variation and thus such ‘spikes’ should be included in long-term policy sustainability
analysis). The time horizon for each simulation is 150 weeks. Simulation was conducted in Vensim® software
version 6.0 using Runge-Kutta integration methods, with a time step of 0.0625 weeks.
1-8.3 Alternate demand pattern scenarios
The response of the model to a permanent change in the dynamics of the demand rate of C&P
patients is examined. The aim is to explore how the system would behave under rising demand
for services and to investigate inherent system behaviors obscured by the randomness introduced
in previous scenario tests. We examine two scenarios, one where demand increases from a
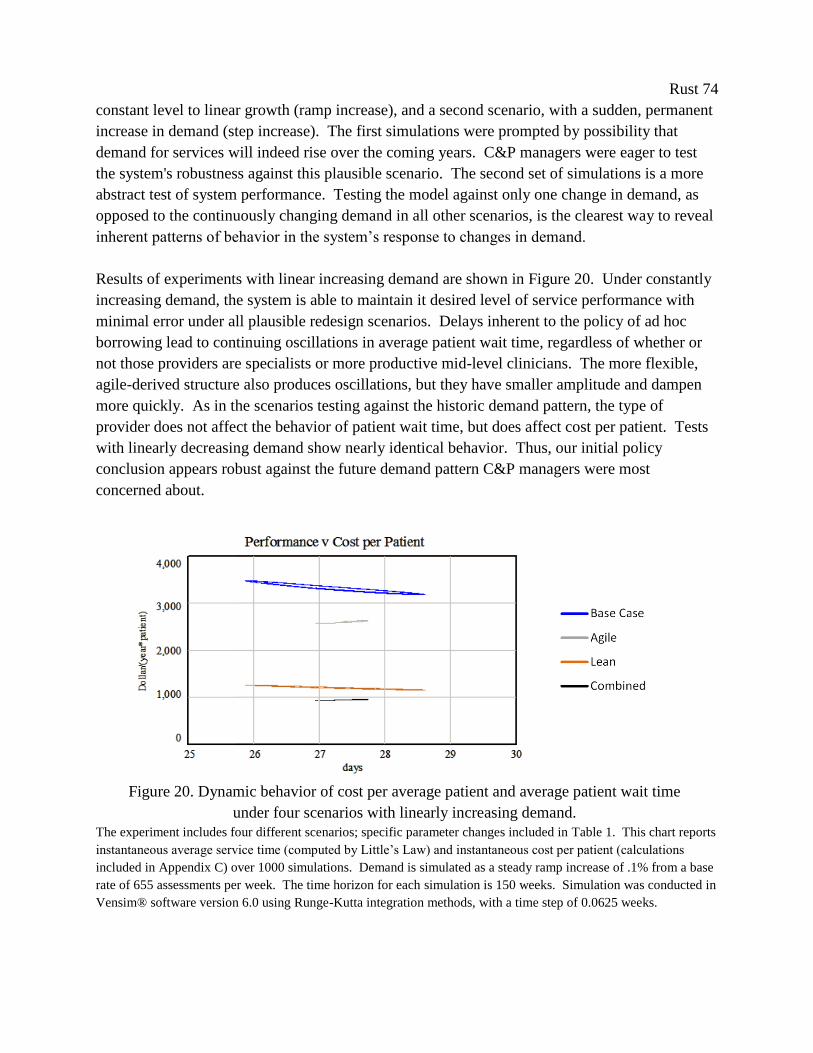
Rust 74
constant level to linear growth (ramp increase), and a second scenario, with a sudden, permanent
increase in demand (step increase). The first simulations were prompted by possibility that
demand for services will indeed rise over the coming years. C&P managers were eager to test
the system's robustness against this plausible scenario. The second set of simulations is a more
abstract test of system performance. Testing the model against only one change in demand, as
opposed to the continuously changing demand in all other scenarios, is the clearest way to reveal
inherent patterns of behavior in the system’s response to changes in demand.
Results of experiments with linear increasing demand are shown in Figure 20. Under constantly
increasing demand, the system is able to maintain it desired level of service performance with
minimal error under all plausible redesign scenarios. Delays inherent to the policy of ad hoc
borrowing lead to continuing oscillations in average patient wait time, regardless of whether or
not those providers are specialists or more productive mid-level clinicians. The more flexible,
agile-derived structure also produces oscillations, but they have smaller amplitude and dampen
more quickly. As in the scenarios testing against the historic demand pattern, the type of
provider does not affect the behavior of patient wait time, but does affect cost per patient. Tests
with linearly decreasing demand show nearly identical behavior. Thus, our initial policy
conclusion appears robust against the future demand pattern C&P managers were most
concerned about.
The experiment includes four different scenarios; specific parameter changes included in Table 1. This chart reports
instantaneous average service time (computed by Little’s Law) and instantaneous cost per patient (calculations
included in Appendix C) over 1000 simulations. Demand is simulated as a steady ramp increase of .1% from a base
rate of 655 assessments per week. The time horizon for each simulation is 150 weeks. Simulation was conducted in
Vensim® software version 6.0 using Runge-Kutta integration methods, with a time step of 0.0625 weeks.
Figure 20. Dynamic behavior of cost per average patient and average patient wait time
under four scenarios with linearly increasing demand.

Rust 75
If the system is presented with a sudden, permanent increase in demand, the effects increased
resource flexibility become even clearer. Under the base case structure, one change in demand
leads to continuing oscillations in average patient wait time for over two years. While it is
impossible to see this trend in the historical data, as demand and other process parameters are
always subject to small fluctuations, this result further supports our dynamic hypothesis that
increasing resource flexibility renders the system more able to absorb changes in demand for
services than a more efficient system. Altering the demand pattern does not appear to affect our
recommendations on system redesign.
Figure 7. Comparison of behavior of average patient wait time under lean and agile -based
scenarios.
The experiment includes two different scenarios; specific parameter changes included in Table 1. Scenarios with
more flexible clinic structure respond with less oscillation, regardless of provider type. This chart reports
instantaneous average service time (computed by Little’s Law). Demand is simulated as a base rate of 655
assessments per week, supplemented with an instantaneous increase of 25% in week 10. The time horizon for each
simulation is 150 weeks. Simulation was conducted in Vensim® software version 6.0 using Runge-Kutta
integration methods, with a time step of 0.0625 weeks.
1-8.4 Impact of operational change
Hospital leadership were persuaded by these simulation results, and decided to follow the
combined strategy of improving both resource flexibility and efficiency by moving away from ad
hoc borrowing specialists to direct hiring of mid-level providers. Armed with model simulations
and analysis, they were able to defend this significant budget outlay, and the decision to move
away from the standard business practice of mandating high clinic utilization rates at all times.
The simulations assuaged managers’ fears of massive overtime costs, and potential downsides of
not being able to quickly remove providers from the clinic that they will no longer need if
demand declines.
The shift away from ad hoc borrowing to hiring mid-level providers to work directly and solely
for the C&P clinic started in February 2011, with the first two physician assistants transferred in
from another VA hospital in April of that year. More mid-level providers have joined the C&P
Lean
Agile
Rust 76
clinic as their primary clinic since then. The use of specialists for most exams declined greatly
over the next year (as possible, given the federal regulations and requirements for some exams).
While, the C&P clinic has not been able to make the complete transition to mid-level providers
as tested in our simplified simulation, they have fully embraced the concept of increasing
resource flexibility and are working toward that ideal state.
As expected, increasing the flexibility of personnel resources resulted in the sustained reduction
in patient wait time. We present data on demand and system performance for two years
following implementation of our agile-derived operational plan in Figure 21. Over the 12
months following implementation, average patient wait time dropped from over 48 days down to
9 days. A simplistic calculation of the benefits generated by implementing our recommendations
(defined as ∑(reduction in average service time * patients seen per month) over the post-
implementation period (i.e., from July2011 to March2013), where “reduction in service time” =
[average service time pre-implementation (i.e., average over March2009 to Feb2011) – service
time in a specific post-implementation month (i.e., any month after July2011)]) finds a total of
~550 years of avoided patient delay. While this calculation and resultant estimated impact could
certainly be refined, the sheer scale of the improvement must be recognized.
Moreover, the implementation of our recommendations appears to prevent extreme variation in
demand from degrading service performance. Six months following implementation, C&P
experienced a sudden, sharp increase in demand, which was even larger than the ‘spike’ in
demand in 2010 which triggered the initial patient access crisis. With the more flexible system
structure in place, this ‘spike’ in demand had almost no affect average patient wait time. The
operational shift from moderately flexible personnel resources to highly flexible resources
appears to have secured clinic access over the long-term and made the C&P clinic resilient to a
high level of demand volatility. Patient access to C&P clinic appears to have stabilized, despite
an increasingly volatile demand rate.
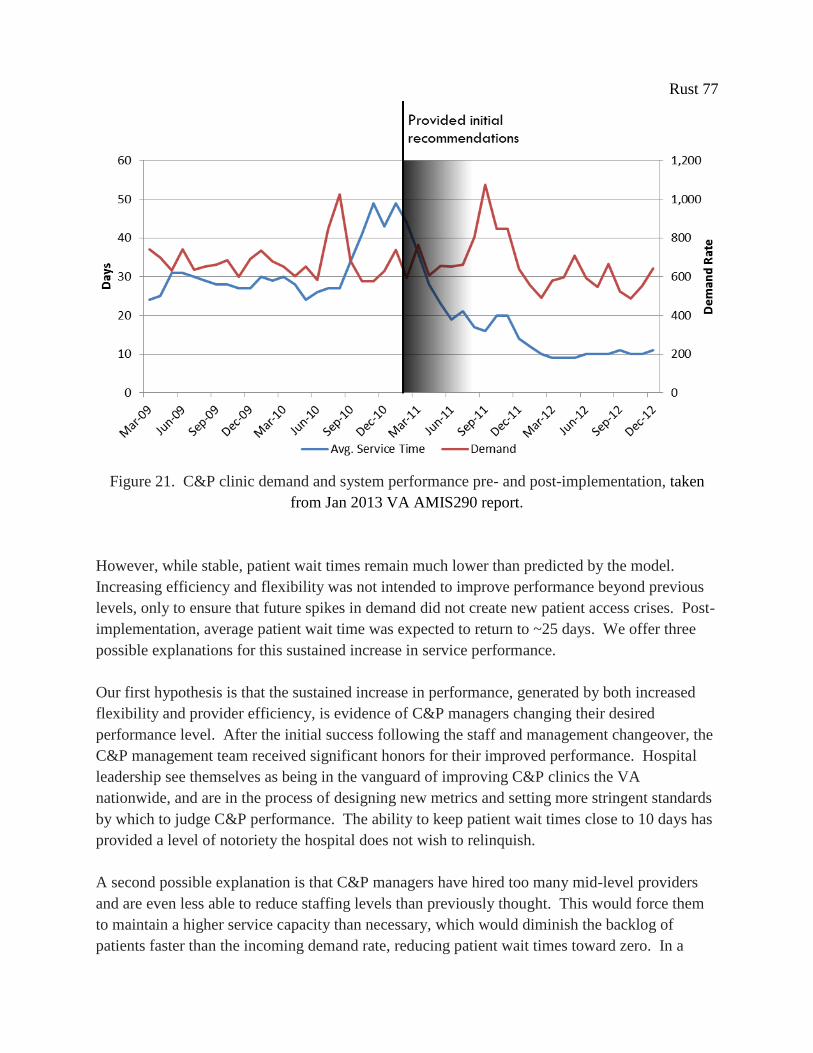
Rust 77
Figure 21. C&P clinic demand and system performance pre- and post-implementation, taken
from Jan 2013 VA AMIS290 report.
However, while stable, patient wait times remain much lower than predicted by the model.
Increasing efficiency and flexibility was not intended to improve performance beyond previous
levels, only to ensure that future spikes in demand did not create new patient access crises. Post-
implementation, average patient wait time was expected to return to ~25 days. We offer three
possible explanations for this sustained increase in service performance.
Our first hypothesis is that the sustained increase in performance, generated by both increased
flexibility and provider efficiency, is evidence of C&P managers changing their desired
performance level. After the initial success following the staff and management changeover, the
C&P management team received significant honors for their improved performance. Hospital
leadership see themselves as being in the vanguard of improving C&P clinics the VA
nationwide, and are in the process of designing new metrics and setting more stringent standards
by which to judge C&P performance. The ability to keep patient wait times close to 10 days has
provided a level of notoriety the hospital does not wish to relinquish.
A second possible explanation is that C&P managers have hired too many mid-level providers
and are even less able to reduce staffing levels than previously thought. This would force them
to maintain a higher service capacity than necessary, which would diminish the backlog of
patients faster than the incoming demand rate, reducing patient wait times toward zero. In a
Rust 78
similar vein, the third possibility is that regardless of the accuracy of the staffing for average
demand, C&P managers are not allowing their staff to work less than 40 hours per week, thus
creating a similar effect of excess service capacity. In times when patient demand is lower than
normal, not allowing providers to work less than the normal number of hours per week would
lead to draining the patient backlog to lower than desired to maintain a target average wait time
of 25 days. Keeping average hours worked per week above 40 leads to further problems, by
allowing fatigue to accumulate, eventually leading to lower quality, burnout, and higher staff
turnover rates. For this agile-derived strategy to be effective over the long-term, resource
flexibility has to be maintained in both directions; C&P managers must allow small periods of
both over and under-utilization of resources.
With the limited information available post-implementation, the first explanation appears the
most likely: that the initial success of clinic redesign has allowed C&P managers and hospital
leadership to set new, more rigorous performance standards. The stability of patient wait times
at 10±1 days for over one year in the face of highly variable demand suggests that exam quality
reductions, rework, and clinician burnout are not occurring. However, the limited documentation
during the previous period of ‘ad hoc’ borrowing of clinicians from other service lines prevents a
direct comparison to rule out other possible causes. There is no clear understanding of what the
aggregate FTEE in the C&P clinic was before implementation, so it is almost impossible to
prove that FTEE have remained constant, or if, in the move to mid-level providers, that the C&P
clinic has increased effective service capacity.
More in-depth post-implementation data collection and analysis was not supported by the
hospital. We can only assume that the lean portion of our operational plan was effective at
reducing costs, as estimated by the model. However, even the limited data available does shed
light on a crucial issue for the long-term effectiveness of the agile portion of this operational
plan. The C&P clinic, and hospital systems in general, appear to maintain two conflicting
management goals: to keep patient wait times low and stable, and to keep resource utilization
rates high. In service systems with variable demand, these two goals cannot both be met
simultaneously. Before the ‘spike’ in demand in 2010, the previous management focus in the
C&P clinic was on maintaining high utilization rates. Ignoring the inherent trade-off with patient
access and focusing management efforts solely on utilization rates is a potential root explanation
for why the C&P clinic was so un-prepared for sudden increases in demand. C&P managers
must find a balance in this trade-off that is acceptable both to the hospital budget and to patient
satisfaction and safety. In practical terms, they must allow ‘under-time’ as well as overtime, or
fatigue will drive quality down, increase rework, and undo the gains realized from increased
flexibility. Indeed, this work shows that the benefits of flexibility far outweigh the costs of both
periodic low utilization rates and overtime pay.
Rust 79
1-9. Conclusion
This work yields specific, practical lessons for C&P departments across the country, as well as
more general conclusions on the importance of agility in the management of the service delivery
systems faced with highly volatile demand. With this research, we address a gap in current
understanding of real world implementation of agile-based redesign strategies. This case study
represents the first implementation of agile-derived clinic redesign in healthcare delivery,
identifying increasing market sensitivity as a successful means to accomplish both cost reduction
and improve access to services. Specifically, we validate reducing capacity adjustment time as a
successful agile policy in healthcare service supply chains and develop an understanding of why
it is effective.
The principle finding of this study is that, when facing volatile demand for services, increasing
system flexibility yields more improvement than increasing personnel or resource efficiency.
Our simulation analysis suggests that problems with timely patient access are generally better
alleviated by creating a system structure that allows for more rapid synchronization of supply
with demand than simply increasing the effective service capacity though lean-based initiatives.
The ability to make swift and adequate adjustments to service capacity makes it possible to
achieve better performance while simultaneously reducing costs.
The ability of the C&P clinic to respond to demand variability determines its performance over
the long term. These simulated scenarios indicate that without changes to C&P management's
ability to adjust assigned hours per week, there would continue to be limited service capacity
flexibility, which would inevitably result in periods of lengthy delays for patients. Changing
provider or clinic process efficiency has no sustained effect on patient access, but has a
significant effect on average cost and productivity. This study also demonstrates that increasing
personnel efficiency alone cannot compensate for variability in the demand for services. For a
C&P clinic to improve on all performance measures, managers should both increase provider
efficiency to reduce cost, and make those providers flexible to improve system responsiveness.
This study also illustrates the value of simulation modeling in healthcare management and
system redesign. We chose to use simulation to help managers develop strategies and system
structures that are robust against demand variation over other common uses, such as demand
forecasting or estimating required service capacity. We believe the real value of simulation
modeling is not generated by anticipating the external environment, but through eliminating any
potential problems created by the environment by changing the underlying structure of the
system itself. Specifically, the development of a qualitative influence diagram offers a useful
structure to base the stakeholder interviews, and provided, often for the first time, C&P managers
with a holistic view of the system where they could finally clearly interpret the interactions
between their own decisions, process steps, and performance metrics. Dynamic simulation
proved an invaluable investigative tool to permit comparison of the relative benefits and

Rust 80
probable costs of various change options under consideration. The model also became a learning
laboratory which permitted risk free experimentation and encouraged creative thinking and
imaginative solutions. On a small scale, this case study demonstrates the potential for healthcare
simulation to contribute to clinic redesign initiatives and ultimately its potential value in
reducing health care costs, increasing system performance, and improving patients’ access to
care.
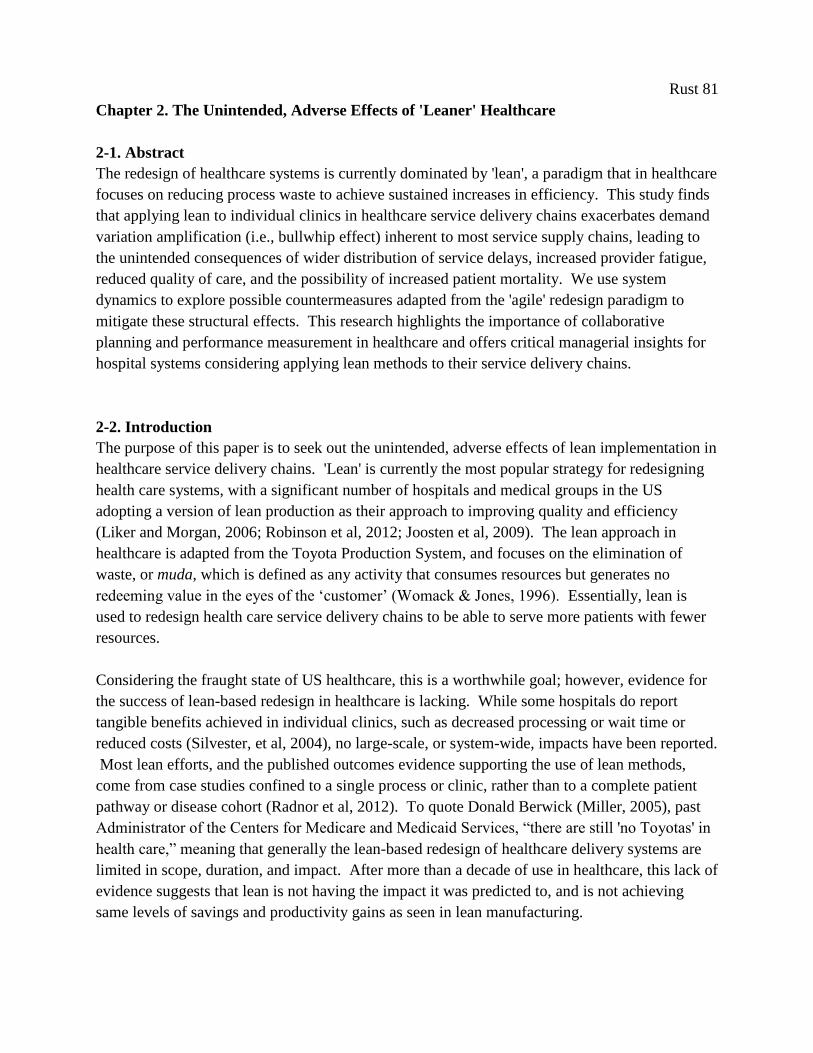
Rust 81
Chapter 2. The Unintended, Adverse Effects of 'Leaner' Healthcare
2-1. Abstract
The redesign of healthcare systems is currently dominated by 'lean', a paradigm that in healthcare
focuses on reducing process waste to achieve sustained increases in efficiency. This study finds
that applying lean to individual clinics in healthcare service delivery chains exacerbates demand
variation amplification (i.e., bullwhip effect) inherent to most service supply chains, leading to
the unintended consequences of wider distribution of service delays, increased provider fatigue,
reduced quality of care, and the possibility of increased patient mortality. We use system
dynamics to explore possible countermeasures adapted from the 'agile' redesign paradigm to
mitigate these structural effects. This research highlights the importance of collaborative
planning and performance measurement in healthcare and offers critical managerial insights for
hospital systems considering applying lean methods to their service delivery chains.
2-2. Introduction
The purpose of this paper is to seek out the unintended, adverse effects of lean implementation in
healthcare service delivery chains. 'Lean' is currently the most popular strategy for redesigning
health care systems, with a significant number of hospitals and medical groups in the US
adopting a version of lean production as their approach to improving quality and efficiency
(Liker and Morgan, 2006; Robinson et al, 2012; Joosten et al, 2009). The lean approach in
healthcare is adapted from the Toyota Production System, and focuses on the elimination of
waste, or muda, which is defined as any activity that consumes resources but generates no
redeeming value in the eyes of the ‘customer’ (Womack & Jones, 1996). Essentially, lean is
used to redesign health care service delivery chains to be able to serve more patients with fewer
resources.
Considering the fraught state of US healthcare, this is a worthwhile goal; however, evidence for
the success of lean-based redesign in healthcare is lacking. While some hospitals do report
tangible benefits achieved in individual clinics, such as decreased processing or wait time or
reduced costs (Silvester, et al, 2004), no large-scale, or system-wide, impacts have been reported.
Most lean efforts, and the published outcomes evidence supporting the use of lean methods,
come from case studies confined to a single process or clinic, rather than to a complete patient
pathway or disease cohort (Radnor et al, 2012). To quote Donald Berwick (Miller, 2005), past
Administrator of the Centers for Medicare and Medicaid Services, “there are still 'no Toyotas' in
health care,” meaning that generally the lean-based redesign of healthcare delivery systems are
limited in scope, duration, and impact. After more than a decade of use in healthcare, this lack of
evidence suggests that lean is not having the impact it was predicted to, and is not achieving
same levels of savings and productivity gains as seen in lean manufacturing.
Rust 82
Furthermore, it can be inferred from multiple studies from the supply chain literature that
following 'lean' strategies is inappropriate in the context of healthcare. Christopher and Towill
(2001, 2002) find that lean is not the appropriate method to use in markets with high demand
variability and high requirements for customization, as is the case in healthcare, where each
patient comprises a unique set of current symptoms, past conditions, and treatment preferences,
which in turn requires a unique set of resources. Evidence from US manufacturing suggests that
redesigning systems toward efficient, high-speed, low-cost service delivery renders them less
able to respond to unexpected changes in demand or supply. The adoption of lean redesign
methods in US product distribution chains is one suggested cause for increased occurrence of
stock-outs and rising percentage of mark-downs, which is when a retailer reduces the price of a
product to quickly sell excess inventory, between 1980 and 2000 (Lee, 2004). In markets with
variable demand, following lean redesign strategies may create a trade-off between service
delivery efficiency and the ability to respond quickly to changes in customer demand. This
trade-off may be acceptable in services where the cost of temporarily not meeting demand is
relatively low. However, in healthcare, where being able to respond in an appropriate and timely
fashion is critical to providing effective care, the potential for life-threatening consequences of
‘lean’ diminishing the ability to match supply of services to demand is worth investigating.
Our hypothesis is that ‘lean,’ in its current state of affecting single, isolated improvements in
clinic efficiency without regard to the complex dynamics of the healthcare setting, is detrimental
to the responsiveness of healthcare services to patient demand, leading to reduced access to
services, and further possible subsequent consequences in service quality and cost. We test for
these feedback effects in simulation, and in turn, evaluate the importance of matching system
redesign strategy to context. We use simulation to identify possible counter-measures adapted
from the ‘agile’ manufacturing redesign paradigm, which was developed in custom
manufacturing to accommodate demand variability and unpredictability. ‘Agile’ strategies focus
on improving resource flexibility and sharing demand information, and as redesign strategies,
have been shown to lead to superior abilities in term of service and quality (Narasimhan et al,
2006).
To date there has been minimal research on the effect of unpredictable demand variability on the
outcomes of lean redesign efforts, in either service or manufacturing contexts, nor any work
firmly criticizing the use of lean in healthcare in the literature (Brandao de Souza, 2009). We
believe this represents a crucial gap in knowledge. Expanding on the theory set by
manufacturing supply chain management research, we explore the possibility that lean is being
applied to an area to which it is not suited, exposing both patients and providers to unknown
risks. The aim of this research is to better understand the complex effects of lean improvement
in healthcare on overall service delivery, quality, and cost in a service chain with unknown,
variable demand. We use system dynamics simulation to validate the existence of a significant
trade-off between increased efficiency and service access, and search for adverse effects in cost
Rust 83
and service quality. System dynamics has proven well suited to address the complexity that
characterizes many health system issues (Homer & Hirsch, 2006), and has been used previously
in health care service supply studies (Lane et al. 2003).
This research highlights why resource responsiveness to demand is important for healthcare
quality, and reveals the potential risks to patients of focusing redesign efforts solely on waste
reduction and increasing clinic productivity without regard to inherent demand volatility.
Specifically, we seek answers to the following research questions:
What are the adverse effects or increased risks generated by following a ‘lean’ redesign
strategy in area with unpredictable, highly variable demand (such as healthcare)?
Does a following ‘lean’ strategy without addressing demand volatility reduce the
effectiveness of healthcare redesign efforts in the long-term?
How can agile strategies (specifically, cooperative planning and coordination of
performance measures) be incorporated into lean-based redesign to mitigate these risks
and mitigate the trade-off between efficiency and service access?
The paper is organized as follows. First, we review lean-based redesign of healthcare service
delivery systems, and present our hypothesis on lean redesign increasing patient and provider
risk. Second, we develop our research model from the literature and review alternative redesign
paradigms. Third, we discuss and justify system dynamics as an appropriate methodology for
understanding behavior of healthcare delivery systems and describe the logic of our simulation
model. Next, we analyze inherent model behavior and compare these behaviors to the literature
to further validate our simulation model. Subsequently, we explore the effects of lean-based
redesign on our healthcare service model, specifically considering effects on distribution of
service times and variation in the patient-to-provider ratio as proxies for service quality and
patient safety. Additionally, we investigate and discuss the impact of applying ‘agile’-based
strategies, specifically coordinated planning and implementation of redesign activities on service
times and quality of care. The concluding section of this paper discusses the implications of our
findings for both healthcare supply chain researchers and managers, research shortcomings, and
possible future work.
2-3. Problem Description
To understand the effects of lean implementation on healthcare delivery, some of the
fundamental concepts of lean system redesign must be explained. Despite the seemingly simple
aims underlying what is generically referred to as 'lean,' the methodology itself is multi-faceted
and is constantly evolving as it is applied to new sectors of the economy. We present a brief
outline of this evolution, and discuss the current iteration of lean as adapted to the healthcare
context, with its emphasis on waste reduction in individual clinics. Next, we find support from
the supply chain management literature for our hypothesis that this redesign approach has
Rust 84
exposed both patients and providers to unnecessary risk through simultaneously decreasing
responsiveness to patients’ needs, and increasing demand variability and provider fatigue.
2-3.1 The evolution of ‘lean’
The roots of lean can be found in Japanese manufacturing, particularly the Toyota Production
System. It was initially created as an alternative production and management system to better fit
the Japanese post-war context of scarce resources than traditional methods of mass production
(Holweg, 2007). Even before the name ‘lean’ was coined, Toyota executives were bringing
together a comprehensive production method with the goal of creating a smooth, cost-
minimizing flow of products and services through the production system to the customer
(Womack and Jones 1996). The initial writings by Taiichi Ohno and Shigeo Shingo, the primary
creators of the Toyota Production System, identify what would later be called ‘lean’ as methods
for addressing three specific concerns: removing waste, or the non-value adding components of a
process (muda); stabilizing uneven demand and variation in information flows and process
production (mura); and improving working conditions to prevent injuries and excessive strain on
employees (muri) (Hines et al., 2008). Achieving these goals would allow Toyota to not simply
produce more cars, but to produce them more efficiently.
Besides being an empowering management philosophy and set of production goals, the Toyota
Production System also contains a set of analytic tools to assist workers with achieving those
goals. Now dubbed ‘lean methods,’ these tools help workers identify the steps in work processes
that create value as defined by the customer, target improvements to the smooth production of
goods, services or information, and eliminate waste in production. Increasing quality and
productivity is achieved through the application of these specialized tools in facilitated group
workshops (kaizen events) coupled with creating an organizational culture that supports
continuous improvement and refinement of work processes. The redesign of production
processes is comprehensive, constant, and coordinated, with all workers at Toyota, from line-
workers to the CEO, responsible for striving toward more efficient, smoother, and safer
production.
Womack and Jones (1996) are usually credited with spreading the management principles
developed to enhance car production at Toyota to a world-wide manufacturing audience. Their
landmark 1996 study showed that the Toyota Production System could be distilled into five core
‘lean principles’ that could be applied to virtually any manufacturing system, outlined in Table 4.
The ability to apply these lean principles to any production system is based on the simplifying
assumption that organizations are composed of interrelated production processes, and through
engaging with these five principles, organizations can transform their processes to increase value
and reduce waste and variation regardless of the product or service delivered. This assumption,
that organizations can effectively be abstracted into a network of interconnected processes,
theoretically allows lean methods to be applied to any economic sector, physical product, or
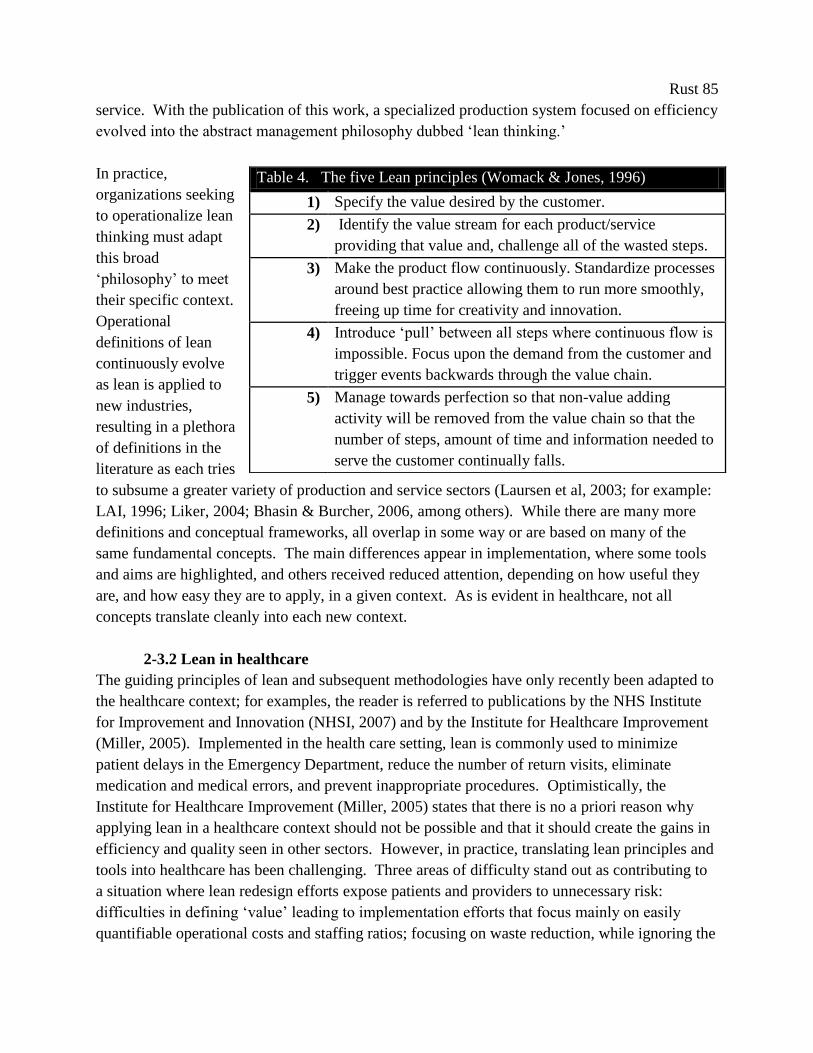
Rust 85
service. With the publication of this work, a specialized production system focused on efficiency
evolved into the abstract management philosophy dubbed ‘lean thinking.’
In practice,
organizations seeking
to operationalize lean
thinking must adapt
this broad
‘philosophy’ to meet
their specific context.
Operational
definitions of lean
continuously evolve
as lean is applied to
new industries,
resulting in a plethora
of definitions in the
literature as each tries
to subsume a greater variety of production and service sectors (Laursen et al, 2003; for example:
LAI, 1996; Liker, 2004; Bhasin & Burcher, 2006, among others). While there are many more
definitions and conceptual frameworks, all overlap in some way or are based on many of the
same fundamental concepts. The main differences appear in implementation, where some tools
and aims are highlighted, and others received reduced attention, depending on how useful they
are, and how easy they are to apply, in a given context. As is evident in healthcare, not all
concepts translate cleanly into each new context.
2-3.2 Lean in healthcare
The guiding principles of lean and subsequent methodologies have only recently been adapted to
the healthcare context; for examples, the reader is referred to publications by the NHS Institute
for Improvement and Innovation (NHSI, 2007) and by the Institute for Healthcare Improvement
(Miller, 2005). Implemented in the health care setting, lean is commonly used to minimize
patient delays in the Emergency Department, reduce the number of return visits, eliminate
medication and medical errors, and prevent inappropriate procedures. Optimistically, the
Institute for Healthcare Improvement (Miller, 2005) states that there is no a priori reason why
applying lean in a healthcare context should not be possible and that it should create the gains in
efficiency and quality seen in other sectors. However, in practice, translating lean principles and
tools into healthcare has been challenging. Three areas of difficulty stand out as contributing to
a situation where lean redesign efforts expose patients and providers to unnecessary risk:
difficulties in defining ‘value’ leading to implementation efforts that focus mainly on easily
quantifiable operational costs and staffing ratios; focusing on waste reduction, while ignoring the
Table 4. The five Lean principles (Womack & Jones, 1996)
1) Specify the value desired by the customer.
2) Identify the value stream for each product/service
providing that value and, challenge all of the wasted steps.
3) Make the product flow continuously. Standardize processes
around best practice allowing them to run more smoothly,
freeing up time for creativity and innovation.
4) Introduce ‘pull’ between all steps where continuous flow is
impossible. Focus upon the demand from the customer and
trigger events backwards through the value chain.
5) Manage towards perfection so that non-value adding
activity will be removed from the value chain so that the
number of steps, amount of time and information needed to
serve the customer continually falls.

Rust 86
other two main lean aims of stabilizing uneven demand and improving working conditions; and
implementation decisions based on individual project impact leading to isolated, un-collaborative
changes. These three factors combined result in a situation that far from resembles the original
redesign efforts at Toyota. Each is discussed in detail below.
The most problematic of these adaptation issues is the current difficulty lean practitioners have in
defining ‘value’ in healthcare. All lean improvements are theoretically driven by improving
‘value’ for the customer, which is often prosaically defined as, ‘what the customer is willing to
pay for.’ While the patient might be the ultimate ‘customer’ of every care process, intermediate
‘customers,’ such as physicians, surgeons, clerks and payers, are often more central to an
individual lean project in healthcare, and each would define value differently based on their
perspective (Muir, 2007). In health care, since there is no single customer to focus lean
improvement on, value is defined by a complex and fragmented customer community, which
leads to what Young and McClean (2008) describe as a bewildering array of value-concepts,
reflected in a plethora of quality measures and frameworks. Without a clear definition of value, it
is far easier to create project goals around quantifiable cost savings than to try to justify
qualitative measures of patient satisfaction or empowerment, even if they are closer to the
original concept of ‘value.’ The lack of a cohesive, unifying customer and subsequent definition
of value hinders improvement initiatives and restricts them to quantifiable improvements in
clinic productivity, like patient throughput or resources per patient, rather than systems issues of
improving service quality and patient experience (Radnor et al, 2012).
The lack of a comprehensive definition contributes in part to our second crucial context
challenge, which is the singular focus of lean in healthcare on waste elimination. Graban (2008)
finds that most healthcare organizations that have attempted to implement lean have focused
only on the elimination of waste, while ignoring the other foci of lean theory: smoothing flow
and improving workplace environments and conditions. Reinforcing this trend, the seminal
introduction to lean implementation in healthcare in the US by IHI (Miller, 2005) focuses almost
solely on eliminating waste. In healthcare, there is a general perception that lean is only
concerned with waste reduction and subsequent cost reduction, not systematic improvement
involving stabilizing variation in demand or preventing injuries and excessive strain on
employees (Robinson et al, 2012).
Unfortunately, the prescribed attention to system-wide analysis of uneven flow of patients,
products, or information across entire value streams, which is fundamental to lean
manufacturing, is not the current state of lean implementation in healthcare. Projects are
implemented regardless of their impact on patient flow into other clinics or care processes, such
systemic consequences are not taken into consideration. Most hospitals and healthcare
organizations prioritize lean redesign projects by their individual return-on-investment,
implementing redesign projects in the easiest, highest return clinics first.

Rust 87
This 'low-hanging fruit' project selection strategy results in our third key difference between lean
manufacturing and lean as it is applied in healthcare settings. By implementing only those
opportunities that require a minimum of effort instead of targeting an entire patient pathway lean
projects create 'islands of success', rather than holistic, sustainable improvement (Graban, 2008).
Most lean redesign efforts in healthcare focus solely on the individual process level (Bhasin &
Burcher, 2006) and most often within individual clinics (Allen et al., 2004). As such, lean
healthcare creates disparate improvement, as the majority of healthcare providers tend towards
small, enclosed projects rather than adopting an organization or system-wide approach (Spear,
2005; Young & McClean, 2008; Brandao de Souza, 2009; Burgess & Radnor, 2010).
Organizations rarely adopt a broader mindset and take a system-wide perspective on either
implementation efforts or outcomes analysis (Murman et al., 2002; Bhasin, 2008). What results
is isolated, scattered efforts at improving individual clinic productivity, based on ease of
implementation rather than long-term, systemic impact.
The importance of adopting a holistic approach in both implementation and analysis has just
begun to be discussed among the healthcare process improvement experts (Spear, 2009). Few
lean practitioners identify the current state of isolated lean redesign projects as problematic.
Even the exemplars of lean healthcare, such as Virginia Mason hospital in Seattle and Royal
Bolton in the UK, have very few lean projects that involve multiple specialties or clinics (Kenny,
2011; Burgess & Radnor, 2010). To date, healthcare organizations tend to understand ‘lean’ as a
collection of standalone, operational tools for improving productivity, rather than as a broader,
pan-organizational value-creation philosophy.
Even with the growing number of case studies, there are no examples of lean implementation
following a systems approach in healthcare, nor research on applying lean methodologies in
complex systems. While it is obvious that one-off, disjointed implementation is not optimal, it
remains as yet unexplored whether lean implementation could, in fact, increase risk to patients or
be detrimental to quality of care. There is almost no literature on the unintended effects of lean
implementation and very little criticism of lean implementation in healthcare in general (Brandao
de Souza, 2009). Lean practitioners are often more concerned that isolated improvements will
not generate the scale of improvement necessary to sustain organizational commitment to
process improvement, rather than exploring the potential negative effects on patient care and
safety (Hines et al., 2004; Spear, 2005; Radnor & Boaden, 2008). Indeed, most lean
practitioners reject the very concept of a trade-off between health care quality and efficiency,
believing increased efficiency to be an unmitigated benefit with no downside risk. At most,
some authors critique lean implementation by acknowledging ‘mistakes along the lean journey’
(Kenny, 2011), but almost all these errors are confined to the domains of organizational politics,
management, or staff effort, rather than increasing risk or harm to patients.
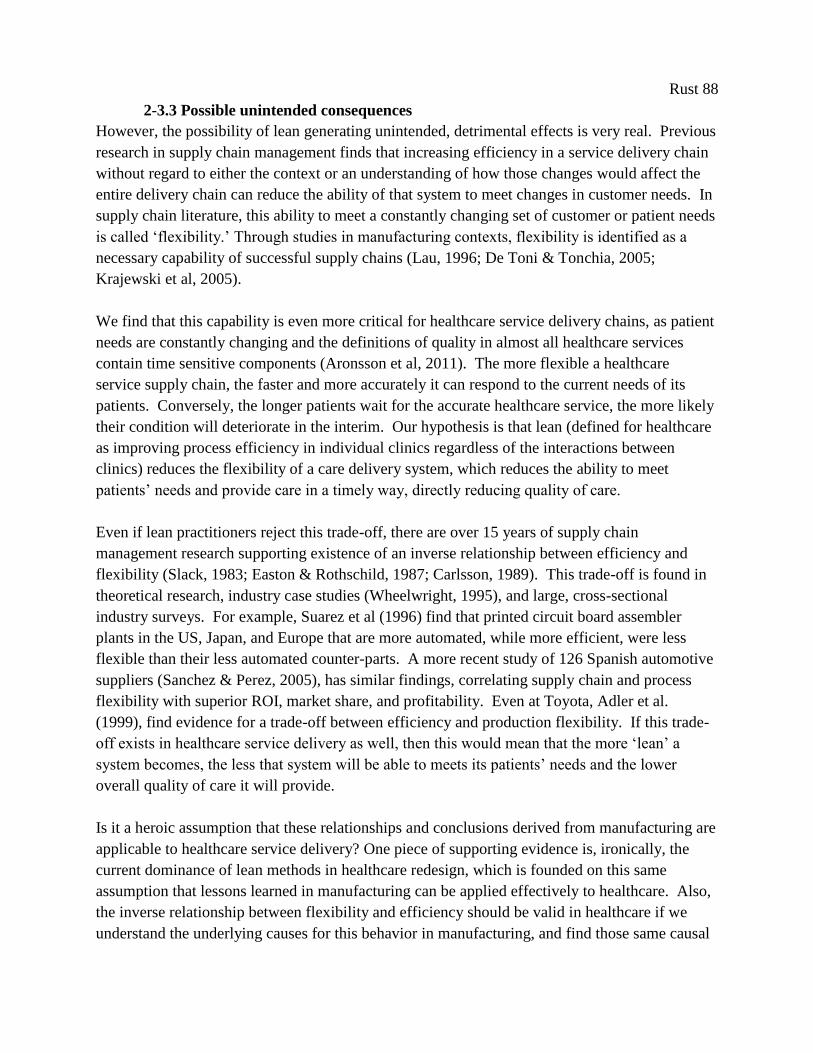
Rust 88
2-3.3 Possible unintended consequences
However, the possibility of lean generating unintended, detrimental effects is very real. Previous
research in supply chain management finds that increasing efficiency in a service delivery chain
without regard to either the context or an understanding of how those changes would affect the
entire delivery chain can reduce the ability of that system to meet changes in customer needs. In
supply chain literature, this ability to meet a constantly changing set of customer or patient needs
is called ‘flexibility.’ Through studies in manufacturing contexts, flexibility is identified as a
necessary capability of successful supply chains (Lau, 1996; De Toni & Tonchia, 2005;
Krajewski et al, 2005).
We find that this capability is even more critical for healthcare service delivery chains, as patient
needs are constantly changing and the definitions of quality in almost all healthcare services
contain time sensitive components (Aronsson et al, 2011). The more flexible a healthcare
service supply chain, the faster and more accurately it can respond to the current needs of its
patients. Conversely, the longer patients wait for the accurate healthcare service, the more likely
their condition will deteriorate in the interim. Our hypothesis is that lean (defined for healthcare
as improving process efficiency in individual clinics regardless of the interactions between
clinics) reduces the flexibility of a care delivery system, which reduces the ability to meet
patients’ needs and provide care in a timely way, directly reducing quality of care.
Even if lean practitioners reject this trade-off, there are over 15 years of supply chain
management research supporting existence of an inverse relationship between efficiency and
flexibility (Slack, 1983; Easton & Rothschild, 1987; Carlsson, 1989). This trade-off is found in
theoretical research, industry case studies (Wheelwright, 1995), and large, cross-sectional
industry surveys. For example, Suarez et al (1996) find that printed circuit board assembler
plants in the US, Japan, and Europe that are more automated, while more efficient, were less
flexible than their less automated counter-parts. A more recent study of 126 Spanish automotive
suppliers (Sanchez & Perez, 2005), has similar findings, correlating supply chain and process
flexibility with superior ROI, market share, and profitability. Even at Toyota, Adler et al.
(1999), find evidence for a trade-off between efficiency and production flexibility. If this trade-
off exists in healthcare service delivery as well, then this would mean that the more ‘lean’ a
system becomes, the less that system will be able to meets its patients’ needs and the lower
overall quality of care it will provide.
Is it a heroic assumption that these relationships and conclusions derived from manufacturing are
applicable to healthcare service delivery? One piece of supporting evidence is, ironically, the
current dominance of lean methods in healthcare redesign, which is founded on this same
assumption that lessons learned in manufacturing can be applied effectively to healthcare. Also,
the inverse relationship between flexibility and efficiency should be valid in healthcare if we
understand the underlying causes for this behavior in manufacturing, and find those same causal
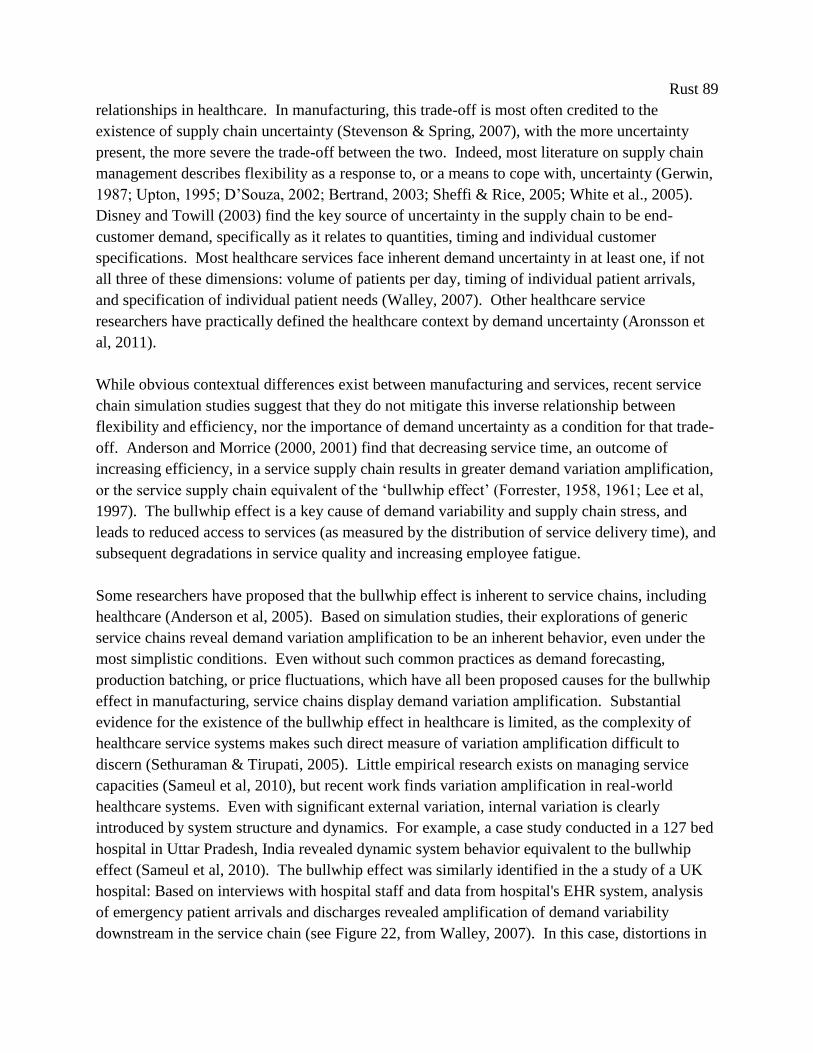
Rust 89
relationships in healthcare. In manufacturing, this trade-off is most often credited to the
existence of supply chain uncertainty (Stevenson & Spring, 2007), with the more uncertainty
present, the more severe the trade-off between the two. Indeed, most literature on supply chain
management describes flexibility as a response to, or a means to cope with, uncertainty (Gerwin,
1987; Upton, 1995; D’Souza, 2002; Bertrand, 2003; Sheffi & Rice, 2005; White et al., 2005).
Disney and Towill (2003) find the key source of uncertainty in the supply chain to be end-
customer demand, specifically as it relates to quantities, timing and individual customer
specifications. Most healthcare services face inherent demand uncertainty in at least one, if not
all three of these dimensions: volume of patients per day, timing of individual patient arrivals,
and specification of individual patient needs (Walley, 2007). Other healthcare service
researchers have practically defined the healthcare context by demand uncertainty (Aronsson et
al, 2011).
While obvious contextual differences exist between manufacturing and services, recent service
chain simulation studies suggest that they do not mitigate this inverse relationship between
flexibility and efficiency, nor the importance of demand uncertainty as a condition for that trade-
off. Anderson and Morrice (2000, 2001) find that decreasing service time, an outcome of
increasing efficiency, in a service supply chain results in greater demand variation amplification,
or the service supply chain equivalent of the ‘bullwhip effect’ (Forrester, 1958, 1961; Lee et al,
1997). The bullwhip effect is a key cause of demand variability and supply chain stress, and
leads to reduced access to services (as measured by the distribution of service delivery time), and
subsequent degradations in service quality and increasing employee fatigue.
Some researchers have proposed that the bullwhip effect is inherent to service chains, including
healthcare (Anderson et al, 2005). Based on simulation studies, their explorations of generic
service chains reveal demand variation amplification to be an inherent behavior, even under the
most simplistic conditions. Even without such common practices as demand forecasting,
production batching, or price fluctuations, which have all been proposed causes for the bullwhip
effect in manufacturing, service chains display demand variation amplification. Substantial
evidence for the existence of the bullwhip effect in healthcare is limited, as the complexity of
healthcare service systems makes such direct measure of variation amplification difficult to
discern (Sethuraman & Tirupati, 2005). Little empirical research exists on managing service
capacities (Sameul et al, 2010), but recent work finds variation amplification in real-world
healthcare systems. Even with significant external variation, internal variation is clearly
introduced by system structure and dynamics. For example, a case study conducted in a 127 bed
hospital in Uttar Pradesh, India revealed dynamic system behavior equivalent to the bullwhip
effect (Sameul et al, 2010). The bullwhip effect was similarly identified in the a study of a UK
hospital: Based on interviews with hospital staff and data from hospital's EHR system, analysis
of emergency patient arrivals and discharges revealed amplification of demand variability
downstream in the service chain (see Figure 22, from Walley, 2007). In this case, distortions in

Rust 90
demand clearly led to performance degradation, as downstream services reported reduced
resource availability and greater probability of exceeding desired utilization and occupancy rates.
These are similar consequence to the effects seen in manufacturing systems, where the bullwhip
effect has been a suggested cause for increasing stock-outs and higher costs.
Figure 22. Patient admission and discharge rates showing downstream variation amplification in
UK hospital (adapted from Walley, 2007).
The bullwhip has also been reported in Australia: Sethuraman and Tirupati (2005) directly
identify the bullwhip effect in the patient pathway for elective surgeries. The increasing
variation in demand for services as elective patients move to downstream clinics creates the need
to make more beds available in post-operative care wards than indicated by the initial demand.
On peak days, when the bullwhip effect causes the number of elective surgeries to be artificially
high, there is a shortage of beds in the patient wards, which restricts the number of surgeries and
reducing the theater utilization and hospital throughput on subsequent days. Demand for nursing
services is directly affected by higher variability, resulting in higher labor costs. Higher demand
variation amplification is also associated with increased dependence on part-time or temp agency
staff. Increasing demand variability inside the patient care pathway generally results in greater
stress on employees, higher operating costs, and lower hospital revenues.
Further support for the inverse relationship between flexibility and efficiency occurring in
service systems is found in an empirical study of a European telecom company (Akkermans &
Vos, 2003), where business process redesign efforts, which increased individual employee
productivity, reduced the telecom’s overall ability to respond to both demand and process
variability. Most recently, Anderson et al. (2005) explore the behaviors inherent to a generic
model of service delivery chains, concluding that trade-off between efficiency and flexibility is
Ra
nge o
f ad
missio
n rate
Ra
nge o
f discha
rge ra
te
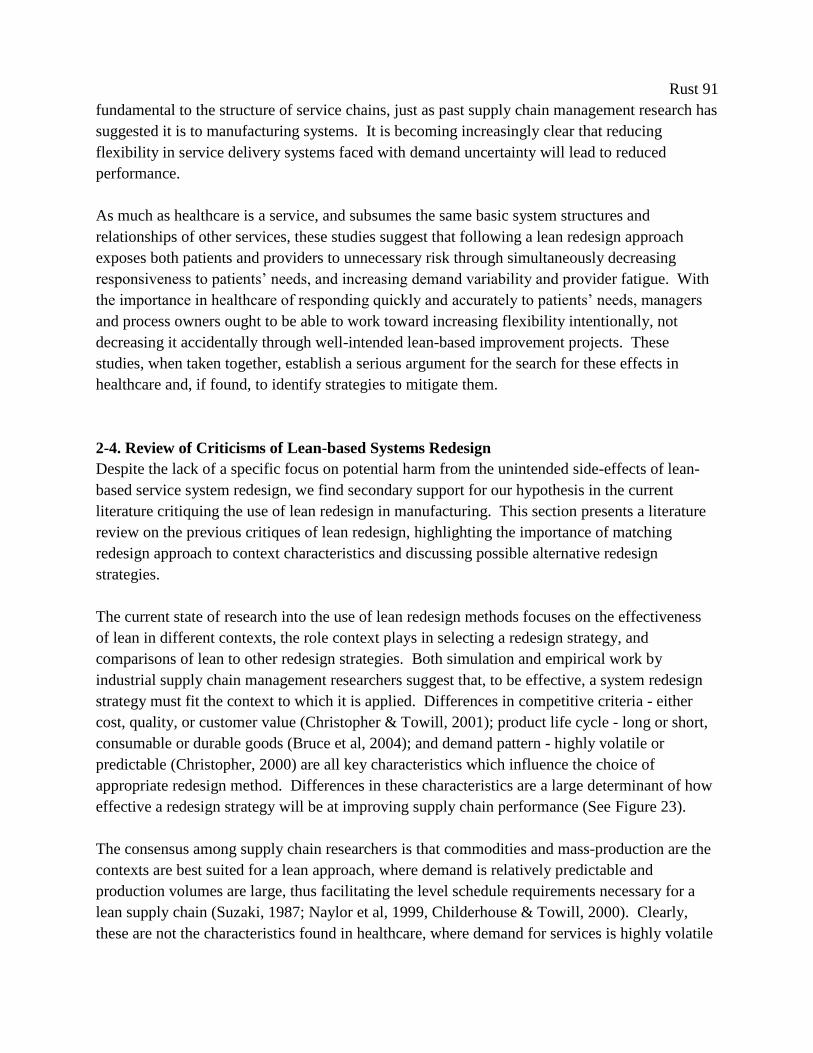
Rust 91
fundamental to the structure of service chains, just as past supply chain management research has
suggested it is to manufacturing systems. It is becoming increasingly clear that reducing
flexibility in service delivery systems faced with demand uncertainty will lead to reduced
performance.
As much as healthcare is a service, and subsumes the same basic system structures and
relationships of other services, these studies suggest that following a lean redesign approach
exposes both patients and providers to unnecessary risk through simultaneously decreasing
responsiveness to patients’ needs, and increasing demand variability and provider fatigue. With
the importance in healthcare of responding quickly and accurately to patients’ needs, managers
and process owners ought to be able to work toward increasing flexibility intentionally, not
decreasing it accidentally through well-intended lean-based improvement projects. These
studies, when taken together, establish a serious argument for the search for these effects in
healthcare and, if found, to identify strategies to mitigate them.
2-4. Review of Criticisms of Lean-based Systems Redesign
Despite the lack of a specific focus on potential harm from the unintended side-effects of lean-
based service system redesign, we find secondary support for our hypothesis in the current
literature critiquing the use of lean redesign in manufacturing. This section presents a literature
review on the previous critiques of lean redesign, highlighting the importance of matching
redesign approach to context characteristics and discussing possible alternative redesign
strategies.
The current state of research into the use of lean redesign methods focuses on the effectiveness
of lean in different contexts, the role context plays in selecting a redesign strategy, and
comparisons of lean to other redesign strategies. Both simulation and empirical work by
industrial supply chain management researchers suggest that, to be effective, a system redesign
strategy must fit the context to which it is applied. Differences in competitive criteria - either
cost, quality, or customer value (Christopher & Towill, 2001); product life cycle - long or short,
consumable or durable goods (Bruce et al, 2004); and demand pattern - highly volatile or
predictable (Christopher, 2000) are all key characteristics which influence the choice of
appropriate redesign method. Differences in these characteristics are a large determinant of how
effective a redesign strategy will be at improving supply chain performance (See Figure 23).
The consensus among supply chain researchers is that commodities and mass-production are the
contexts are best suited for a lean approach, where demand is relatively predictable and
production volumes are large, thus facilitating the level schedule requirements necessary for a
lean supply chain (Suzaki, 1987; Naylor et al, 1999, Childerhouse & Towill, 2000). Clearly,
these are not the characteristics found in healthcare, where demand for services is highly volatile
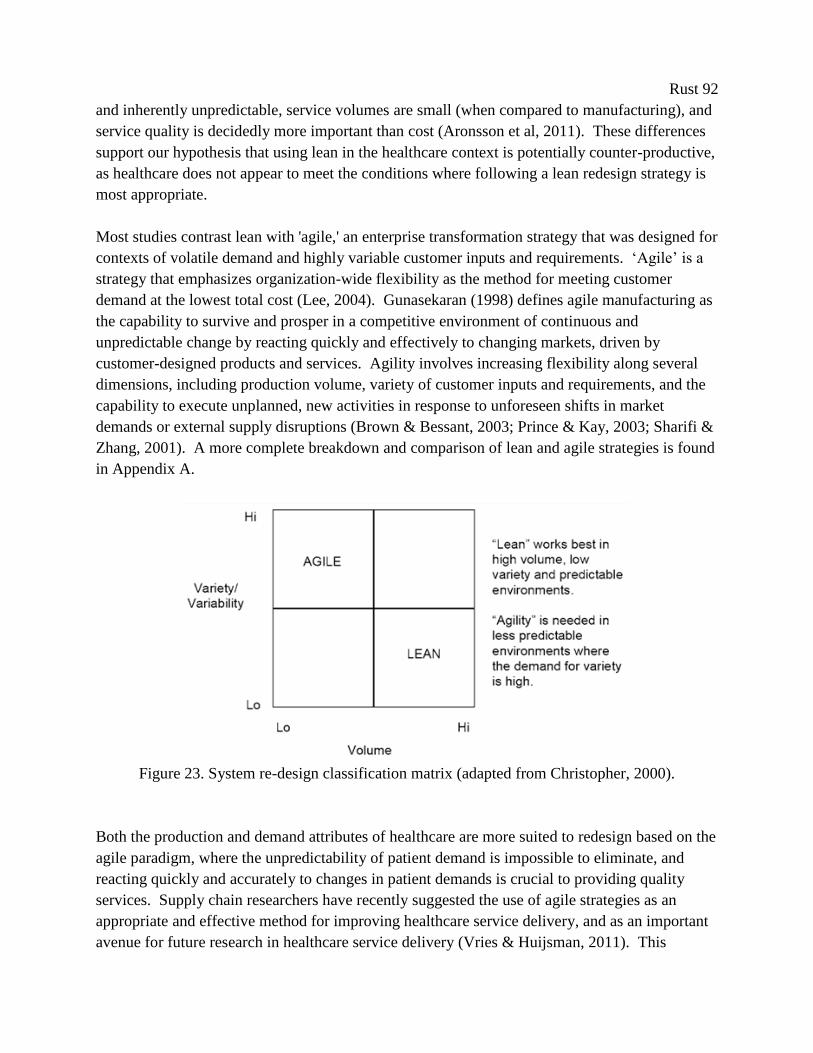
Rust 92
and inherently unpredictable, service volumes are small (when compared to manufacturing), and
service quality is decidedly more important than cost (Aronsson et al, 2011). These differences
support our hypothesis that using lean in the healthcare context is potentially counter-productive,
as healthcare does not appear to meet the conditions where following a lean redesign strategy is
most appropriate.
Most studies contrast lean with 'agile,' an enterprise transformation strategy that was designed for
contexts of volatile demand and highly variable customer inputs and requirements. ‘Agile’ is a
strategy that emphasizes organization-wide flexibility as the method for meeting customer
demand at the lowest total cost (Lee, 2004). Gunasekaran (1998) defines agile manufacturing as
the capability to survive and prosper in a competitive environment of continuous and
unpredictable change by reacting quickly and effectively to changing markets, driven by
customer-designed products and services. Agility involves increasing flexibility along several
dimensions, including production volume, variety of customer inputs and requirements, and the
capability to execute unplanned, new activities in response to unforeseen shifts in market
demands or external supply disruptions (Brown & Bessant, 2003; Prince & Kay, 2003; Sharifi &
Zhang, 2001). A more complete breakdown and comparison of lean and agile strategies is found
in Appendix A.
Figure 23. System re-design classification matrix (adapted from Christopher, 2000).
Both the production and demand attributes of healthcare are more suited to redesign based on the
agile paradigm, where the unpredictability of patient demand is impossible to eliminate, and
reacting quickly and accurately to changes in patient demands is crucial to providing quality
services. Supply chain researchers have recently suggested the use of agile strategies as an
appropriate and effective method for improving healthcare service delivery, and as an important
avenue for future research in healthcare service delivery (Vries & Huijsman, 2011). This

Rust 93
impetus to apply agile redesign strategies in healthcare further supports our hypothesis: if
increasing flexibility is key to success in markets with characteristics similar to those found in
healthcare, then the inverse should be true as well, that reducing flexibility in healthcare will
decrease successful service delivery.
While there are many studies on applications of agile redesign in manufacturing contexts, there
are no studies on how to apply or develop 'agility' in a service supply chain. Thus, if our current
conclusion is correct, and agile should be recommended over lean as the most effective system
redesign strategy in healthcare, there are almost no operational insights available for healthcare
managers on how to develop 'agility' in their hospitals or clinics. Despite the importance of
services in the world economy and the maturity of the supply chain management field, service
supply chain management literature is still in its earliest development and is a relatively new
framework for understanding service delivery. Scholars have yet to come to agreement on a
conceptual framework for service supply chains, let alone conduct experiments or simulations to
generate practical advice for managers attempting to improve service delivery. To date,
multiple, competing conceptual models for service supply chains currently exist (Giannakis,
2011; Baltacioglu et al, 2007; Sampson & Froehle, 2006; Ellram et al, 2004), which has hindered
the development of standard service supply chain simulation models and other tools for
operational analysis. Furthermore, there is no agreement between service supply chain
researchers on a complete set of distinguishing fundamental differences between services and
manufacturing, such as the intangible nature of services and the simultaneous interaction of
customer and service provider, to name two. The dominant trend in current scholarship in
service supply chains appears to be a focus on resolving these theoretical issues rather than
developing actionable conclusions relevant to healthcare operations and business managers.
2-5. Methodology/Approach
In this section, we describe the use of system dynamics in healthcare, and justify its use as the
most appropriate method for understanding healthcare service delivery systems.
Despite the lack of a concise conceptual model, system dynamicists have been generating
practical, operations-level policy recommendations for managing service supply chains through
exploring both generic and real-world systems with simulation models for over 10 years.
Anderson and Morrice published the first system dynamics simulation of a service supply chain
in 1999, by adapting the foundational system dynamics manufacturing supply chain simulation
model (for examples, see Forrester, 1958; and Lyneis, 1980) to include some of the key
phenomena of services more recently agreed upon by service supply chain scholars: the
intangibility of services and the simultaneous interaction of customer and service provider. The
model was developed mainly to research the phenomenon of up-stream demand amplification
(known in manufacturing chains as the bullwhip effect) and the effectiveness of the counter-
Rust 94
measures found in capacity management strategies. They base their model parameters on
information from the mortgage industry, but identify generic policy conclusions applicable to
any service delivery system.
Closely following that publication, Akkermans and Vos (2003) use a similar model (modified to
include endogenous effects of schedule pressure on quality and rework) to illuminate the causes
of, and counter-measures for, demand variation amplification in the telecom industry. Again,
they use system dynamics simulation to identify actionable counter-measures to demand
amplification that are universally applicable across service types. More recently, Anderson et al.
(2005) use more generic version of their original model to evaluate structural causes of
amplification in the service chain and Lee (et al, 2009) use a similar model to evaluate the use of
alternative capacity management control policies.
The important concepts that differentiate a service supply chain from a manufacturing or product
supply chain are captured in each of these models’ structures. They are 1) the replacement of a
tangible finished goods inventory for a customer order backlog, 2) service provision is intangible
and non-storable (portrayed as an instantaneous rate, tasks per time, rather than a tangible stock),
3) service provision is determined by the simultaneous availability of customers and service
providers, and 4) order backlogs can only be managed by adjusting service capacity. There is no
finished goods inventory to act as a buffer to demand variation; instead, backlogs can only be
managed by adjusting service capacity. This generic simulation model integrates well with the
recent conceptual service supply chain literature, subsuming both Sampson's (2000) proposed
'dyad' and Christopher and Peck's (2004) proposed 'network' structures. Each clinic in the chain
of service delivery is composed of the same basic participants and tangible and information
flows as Sampson's model, but each of these clinics is in turn linked through the exchange of
information and customers. We believe this structure represents an operationalized synthesis of
current service supply chain concepts.
The models used in all of these studies are based on the same underlying structures and no clear
criticism or alternative structure has emerged in the system dynamics literature. There are no
criticisms of this method, system dynamics, or particulars of these simulation models' structures
in the service supply chain literature. Indeed, Sampson and Froehle cite these models as "clear
exceptions" to what they describe as the normally "forced and unclear" application of supply
chain management principles and models to services (2006, p.337). The continuity of the
models' structure over time and lack of a clear alternative lead us to believe it is not unwarranted
to label this a 'standard' service supply chain simulation model.
Furthermore, we believe this method could become the standard tool for the study of healthcare
service supply chains. The complexity of the services and resources incorporated in the
provision of healthcare necessitate formal methods for integrating and synthesizing these diverse
Rust 95
components, understanding the evolution of the design and behavior of delivery systems, and
developing strategies for improved management and coordination (Giannakis, 2011).
Conventional analytic methods are generally unable to satisfactorily address situations in
healthcare where demand for services changes over time and where patient risk factors, diseases,
and health resources are in a continuous state of interaction and flux (Schorr, 1997). It is widely
accepted by healthcare professionals that healthcare delivery cannot be understood by looking at
factors in isolation (Lane, 1999), as many healthcare delivery systems are conceived of as
complex systems (Parchman et al, 2011), where 'everything affects everything else' (Brailsford et
al, 2010).
System dynamics provides a formal, mathematical approach to simulating systems where
multiple feedback processes all interact to produce in continuous change. This approach is
particularly well suited to modeling complex, adaptive systems, where multiple, interconnected
feedback loops render system behavior difficult to understand and interpret (Vennix, 1996).
Thus, system dynamics has been identified as an appropriate method for improving the
management of healthcare systems (Young, 2005), because it can provide a strategic perspective
of the management of the system as a whole instead of basing understanding on the behavior of
individual parts (Lane et al, 2000). System dynamics can describe the interactions of patients
and care processes over time and be used to evaluate the effects of different policy interventions
before proceeding with any high-risk or high-cost intervention (Young et al, 2004).
System dynamics modeling has been used extensively in healthcare (approximately 1500
publications since 1991, Brailsford, 2008), and a recent review of system dynamics modeling in
healthcare concludes that the method can be used effectively for quantitative analysis when
based on simulation models (Dangerfield, 1999). System dynamics has already been used for
quantitative analysis of the underlying reasons for failed management interventions in cardiac
catheterization services (Taylor & Dangerfield, 2005), and to analyze the effects of business
process redesign on mental healthcare performance (Wolstenholme et al, 2006). A general
discussion of the role of system dynamics in analyzing healthcare systems can be found in
Taylor and Lane (1998). The reader is directed to (Homer & Hirsh, 2006) for more examples
that to support for the use of system dynamics simulation as a tool for understanding healthcare
service supply chain management.
2-6. Dynamic Hypothesis and Simulation Model
In this section, we define our simulation model’s mathematical structure, key relationships and
feedback structures, and give a detailed examination of our main abstractions and assumptions.

Rust 96
To explore our dynamic hypothesis, we model a generic healthcare service delivery chain that
consists of four separate clinics. This structure allows us to test our hypothesis that the ‘leaner’
any one clinic becomes, the less the overall chain is able to provide quality patient care. The
health care service system is modeled in continuous time, and is simulated in Vensim®
software. The use of continuous, as opposed to discrete, flows in the model is a reasonable
approximation of the perpetual adjustments (hiring and firing) necessary in the management of
service organizations, and is a common method for abstracting these systems in both operations
management and system dynamics literature (Sethi & Thompson, 2000). This model is
concurrent with previous system dynamics service supply chain models, visualized in Figure 24.
The purpose of the model is to capture the essential elements of reality common to most
healthcare delivery chains rather than perfectly simulate one specific service. As is, the model’s
structure could represent many healthcare service chains. The four distinct clinics in this
healthcare service delivery could portray a multi-month process that takes a patient across
multiple organizations and locations: from the emergency department, to an imaging lab, then an
operating theater, and finally, through to outpatient rehabilitation. This service chain could also
represent a hospital's core service of emergency medicine, all taking place inside the one
department: patient intake, triage, clinical interview, and discharge. This model could just as
easily be parameterized to represent an elective service: a visit to a family doctor, a referral to a
specialist, scheduling elective surgery, and receiving a bill. This generalizability comes at the
cost of simplicity; the idiosyncrasies particular to any one service chain are not included in the
model.
Our fundamental assumption is that the elements we exclude from the model would not, even
collectively, be enough to overcome the dynamics inherent to the structure contained within this
simplified model. Applying lean redesign methods to any healthcare delivery chain would yield
similar effects. This model could be further adapted to a specific health care context through
adding additional clinics or feedback structure, or changing model parameters. For example, the
Clinic 1PatientBacklog
Clinic 2PatientBacklog
Clinic 3PatientBacklogEnd-Customer
Demand
Completing
Stage 1
Completing
Stage 2
Completing
Stage 3
Clinic 1
Capacity
Clinic 1 Manager's
Capacity Decisions
+
Maximum
Completion Rate 1
Minimum Delivery
Time 1
-
++
Maximum
Completion Rate 2
Minimum Delivery
Time 2
-
Maximum
Completion Rate 3
Minimum Delivery
Time 3
-
+
+
+
+
Desired
Completion Rate 1
+
+
Clinic 2
Capacity
Clinic 2 Manager's
Capacity Decisions
Desired
Completion Rate 2
+
Clinic 3
Capacity
Clinic 3 Manager's
Capacity Decisions
Desired
Completion Rate 3
+
+ ++ +
Clinic 4PatientBacklog Completing
Stage 4
Maximum
Completion Rate 4
Minimum Delivery
Time 4
-
+
+
Clinic 4
Capacity
Clinic 4 Manager's
Capacity Decisions
Desired
Completion Rate 4
+
++
Clinic 1 Target
Service Delay
Clinic 2 Target
Service Delay
Clinic 3 Target
Service Delay
Clinic 4 Target
Service Delay
--- -
- - --
Figure 24. High-level stock and flow diagram of the generic service supply chain; rectangles represent
accumulations, hourglasses represent rates, and bold arrows represent information exchange.

Rust 97
patient pathway could be changed to allow patients to leave and enter any clinic without first
receiving the services of the previous clinic (as would be more realistic in a complex system,
such as a hospital, where patients can move quickly between clinics and specialty services as
their conditions change). We could allow patients to leave a clinic wait list if the wait time
increases beyond their personal tolerance; we could also allow endogenous demand, connecting
current service quality to future demand. However, none of these possibilities are universal
features of healthcare delivery chains. For example, some patients cannot leave once a service
has started (you can leave the ER waiting room, but you cannot leave the OR waiting room), and
waiting for some services is more tolerable than others (many patients would probably prefer to
wait indefinitely for a colonoscopy, whereas for patients with acute myocardial infarctions
waiting more than 90 minutes for percutaneous coronary intervention can be fatal). Including
service or disease specific feedbacks would lessen the impact of our analysis and policy
conclusions. While all these are excellent areas for future research, just like past service supply
chain modelers, we believe our generic analysis and policy conclusions should still be
applicable, regardless of the type of service provided (Anderson et al, 2005).
Each clinic in our model operates in an identical manner, but is autonomous, as capacity
decisions are based only on the information available at each clinic. Each clinic is linked as the
output of clinic i forms the input signal of clinic i+1, but each clinic requires a separate resource
to serve its patient backlog, which could either be from requiring a different set of skills to
complete the tasks in each clinic, or that an organizational structure prevents sharing resources
between clinics. Each clinic has a finite capacity, which is derived from the number of staff
working in that clinic, their productivity (as measured by tasks/clinician/hour), and their working
hours (hours/week/clinician). The manager of each clinic has sole responsibility for operational
performance and control over service capacity in their clinic. Each clinic manager’s implicit
goal is to keep service performance at a desired level (measured in average days wait time),
while keeping service capacity costs to a minimum. They use the information available to them
on the order backlog of their clinic and the current service capacity. While this structure is far
from optimal, it is a realistic representation of how real managers make decisions in similar
settings (Sterman, 1989). This structure follows the common ‘staff to demand’ heuristic found
currently in most hospitals and healthcare centers (Litvak et al, 2005).
2-6.1 Model equations
A more specific stock and flow model of one representative clinic is presented in Figure 25,
graphically displaying the three control loops fundamental to clinic management: one to prevent
number of customers waiting for service from going negative (the Work Availability loop), one
representing manager's decisions on hiring and firing to balance workforce with demand (the
Capacity Management loop), in which is embedded the manager's decisions comparing current
workforce with desired workforce to achieve desired service capacity (the Meeting Workforce
Goal loop). A full set of model equations and parameters is reported in Appendix D.

Rust 98
Patient
BacklogDemand or patients
from previous clinic
Seeing patients and
demand for next clinic
Clinic
CapacityChanging Clinic
Capacity
+
Capacity
Adjustment
Time (tau)-
TargetServiceDelay
(lambda)
Maximum
Completion Rate
Minimum Delivery
Delay (mu)
-
B
Work Availability
+
+
-
Desired
Completion Rate
Time
per Task
(delta)
Desired Service
Capacity
+ +
-
+
-
+Service
CapacityGap
+
B
CapacityManagement
B
MeetingWF Goal
border
Figure 25. Stock and flow diagram of one clinic in an operational service supply chain structure.
The main capacity adjustment loop is highlighted; parameters adjusted to explore behavior
inherent to the model’s structure are circled.
Mathematically, the structure of this first control loop is as follows, where B(t) is the order
backlog, Ci (t) is the service capacity, and rci (t) is the task completion rate in the clinic on day t.
Note that rai (t) is the new patient demand rate, which is determined exogenously. Equations
have been slightly modified from those used in previous system dynamics service supply chain
models to include a specific measure of clinician productivity.
where Bi (t) = patient backlog at t, measured in units of patient tasks
Rai (t)= arrival rate of patients at t, measured in units of patient tasks/week
Rci (t) = completion rate of patients at t, measured in units of patient tasks/week
Bi0 = initial backlog (patients in-progress) at t = 0, measured in units of patient tasks
i = minimum task delivery time at clinic i (fixed in this model to 0.05 weeks).
wi = standard work week at clinic i (fixed in this model to 40 hours / week).
i = productivity of clinicians at clinic i (measured in clinician*hour / patient task).
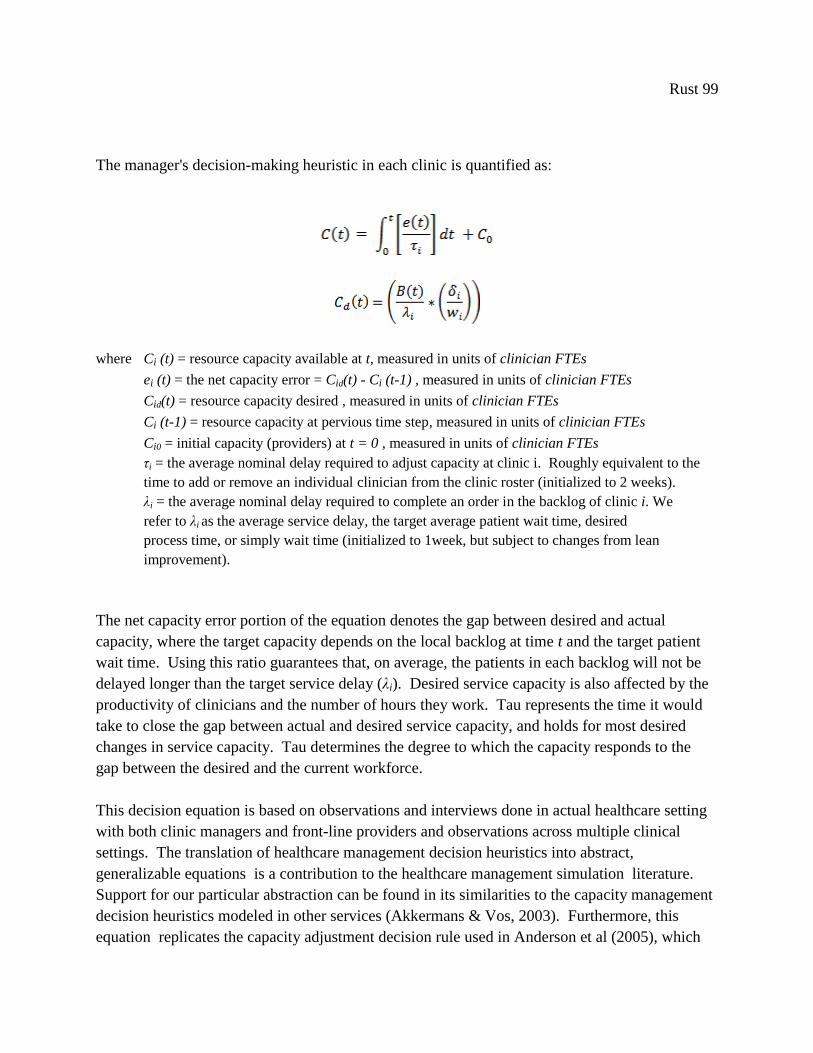
Rust 99
The manager's decision-making heuristic in each clinic is quantified as:
where Ci (t) = resource capacity available at t, measured in units of clinician FTEs
ei (t) = the net capacity error = Cid(t) - Ci (t-1) , measured in units of clinician FTEs
Cid(t) = resource capacity desired , measured in units of clinician FTEs
Ci (t-1) = resource capacity at pervious time step, measured in units of clinician FTEs
Ci0 = initial capacity (providers) at t = 0 , measured in units of clinician FTEs
τi = the average nominal delay required to adjust capacity at clinic i. Roughly equivalent to the
time to add or remove an individual clinician from the clinic roster (initialized to 2 weeks).
λi = the average nominal delay required to complete an order in the backlog of clinic i. We
refer to λi as the average service delay, the target average patient wait time, desired
process time, or simply wait time (initialized to 1week, but subject to changes from lean
improvement).
The net capacity error portion of the equation denotes the gap between desired and actual
capacity, where the target capacity depends on the local backlog at time t and the target patient
wait time. Using this ratio guarantees that, on average, the patients in each backlog will not be
delayed longer than the target service delay (λi). Desired service capacity is also affected by the
productivity of clinicians and the number of hours they work. Tau represents the time it would
take to close the gap between actual and desired service capacity, and holds for most desired
changes in service capacity. Tau determines the degree to which the capacity responds to the
gap between the desired and the current workforce.
This decision equation is based on observations and interviews done in actual healthcare setting
with both clinic managers and front-line providers and observations across multiple clinical
settings. The translation of healthcare management decision heuristics into abstract,
generalizable equations is a contribution to the healthcare management simulation literature.
Support for our particular abstraction can be found in its similarities to the capacity management
decision heuristics modeled in other services (Akkermans & Vos, 2003). Furthermore, this
equation replicates the capacity adjustment decision rule used in Anderson et al (2005), which
Rust 100
they have found in use by capacity managers in a wide range of services. Case studies cited
include an oil field development company, a mortgage service company, and custom
manufacturing (where finished inventories are also impossible).
Historically in healthcare, managers have used a fundamentally different staffing heuristic, not
basing their decisions on current demand for services, but to ensure that enough staff were
always available to meet peak demand. For example, employees were assigned to a clinic based
on the number of beds in that clinic, regardless of whether or not those beds were in use
(Buerhaus, 1995). During periods of below average demand, it was acceptable for staff to be
underutilized. But, a large portion of hospitals’ operating expenses is labor related, and as
competition and public pressure to reduce cost increased, many hospitals began to reduce what
became to be seen as excess staffing. With the advent of managed care, hospitals changed clinic
management to base desired capacity on the average demand (Litvak et al, 2005), bring the
industry in line with almost all other services. While this is not an optimal decision rule for
system performance, or even for local performance, we agree with Drezner (et al, 2000) that
simulations should try to replicate the rules found to be used most often in the service being
examined, regardless of the existence of more effective capacity management algorithms. There
is no evidence of more sophisticated decision heuristic in common use in service capacity
management (Anderson et al, 2005).
The model is initialized in equilibrium, designed and calibrated to fulfill all initial incoming
orders and maintain the desired service delay. The patient backlog at each clinic is set initially to
λi(ri,0). Initial service capacity is set to (ri,0 * i)/wi, ensuring that it starts in equilibrium, where
service capacity matches demand. If there were no change in the demand for services, then no
other rates or levels would change, thus the total service time with remain λ. All clinic
parameters in this abstract model (productivity, target wait time, etc.) are identical, which is not
realistic, but allows for clearer interpretation of model behavior.
2-6.2 Simulating lean improvements
Lean-based redesign efforts are modeled as a sustained increase in the productivity of service
providers in a single clinic. Reducing waste in a clinic could take many forms, but the overall
effect would be a reduction in process time, also referred to as an increase in patient throughput.
Operationally, we assume that lean improvement efforts results in a successful and sustained
reduction in time per task (i). Lean improvement also affects desired service delay (λi) in that
clinic. Service standards as well as service performance improve after successful lean
implementation (Graban, 2008). In equilibrium, a more efficient process would require fewer
staff (as each is now more efficient because non-value added process steps have been removed)
if demand is unchanged. This is common effect of lean implementation (Sterman et al, 1997).
Even if hospitals have included a no lay-offs policy in their lean implementation initiatives, it is
common for workers to still be moved out of their original clinic after productivity increases
Rust 101
(Kenny, 2011). This approximation of the outcome of lean-based redesign efforts is congruent
with the current iteration of lean as applied in healthcare.
We recognize that this simulation model is a highly simplified version of reality. Even though
the purpose of each step in health care delivery is to improve the health of the patient, we feel the
need to clearly acknowledge that feedbacks to patient health are absent from the model. We
assume that the specific service provided by each clinic in the process of care is essential to the
overall service and adds value to the patient. Moreover, most health care services contain more
than four process processes, while some processes can potentially be done in parallel. However,
adding more clinics does not significantly change the analysis or policy conclusions. One of the
operational abstractions necessary for this model to be representative is that each clinic has a
finite resource capacity, but has no other constraints on service production (space, equipment,
etc.). Lean-based initiatives have other impacts on an organization than simply improving
process productivity. Effects on organizational culture, sustainability and standards erosion,
tipping point phenomena, and organizational learning effects are all explored in other works; all
of which could be included as extensions of the current model for future research. Furthermore,
our model structure assumes managers have no knowledge of initial patient demand and no
knowledge of the order backlogs at any other clinic in the service chain, as is common in
healthcare, but far from optimal. These abstractions give the model the simplicity to allow us to
focus on the fundamental dynamics inherent to the healthcare service supply chain. The effect of
relaxing these assumptions will be explored in future research based in specific healthcare sites
or services.
2.7. Simulation Analysis
In this section, we discuss our selection of performance measures and how they compare to
general performance measures previously developed for the evaluation of service chains. Next,
we present simulations that establish demand variation amplification as an inherent system
behavior and a causal connection between demand uncertainty and the trade-off between
flexibility and efficiency. We test for the effects of lean redesign in a healthcare service chain,
finding support for our hypothesis. Finally, we discuss how model structure creates these
behaviors and the implications for patient risk.
2-7.1 Performance measures
Our performance measures must clearly identify both if and how lean-based redesign directly
reduces quality of care through limiting the ability of a healthcare supply chain to meet patients’
needs and provide care in a timely way. Research in manufacturing and recent simulation work
in service supply chains suggests that these adverse effects will be caused by reduced flexibility,
as the system will be less able to respond to unknown, variable demand, and by the unintended
consequence of lean efforts increasing the demand amplification effect, adding to the demand

Rust 102
uncertainty already present in the environment. We select performance measures common to
evaluating service chains, and that will reveal these effects, if they exist.
Our most common measure of service quality is both applicable to services in general and a basic
measure of patient care: total service time. In this study, total service time is how long the
average patient is in the system before discharge, or the time it takes the average patient to
traverse all the steps in the service chain, thus completing the service requested. Average patient
service time in a clinic is defined through Little’s Law, as the quotient of the current backlog of
patients by the rate at which the clinic delivers its service and they are sent to the next clinic.
Service time is a common measure of service performance, especially in services where quality
of service is subjective and difficult to quantify. This provides a measure of whether lean
reduces ability to provide care in a timely way. Converting this absolute measure into a
dimensionless ratio (of desired wait time, λi, to actual wait time (Bi,t/ri,t)), gives us an
instantaneous error rate by which to judge system performance. We also measure the
distribution of total service time over the course of a simulation, to determine if lean-based
redesign causes some patients to wait longer, even if average service time remains unchanged.
Besides timeliness, another measure of quality common to both service delivery and healthcare is
the likelihood of error generation during the care process. Error generation in healthcare is
attributed to the creation of adverse events, medication errors, wrong-site surgeries, and other
patient safety hazards. Past research in healthcare service delivery has linked the ratio of patients
to providers, and the subsequent clinician stress and fatigue, to increased error generation. The
mismatch between resources and peaks in demand is a major source of provider fatigue and
reduced quality of care in most healthcare services (Kane et al, 2007; Robertson & Hassan,
1999). For example, higher patient to provider ratios have been correlated with increased patient
mortality and failure-to-rescue (deaths following complications) rates within 30 days of
admission (Aiken et al, 2002). One large, multi-state study involving 500 US hospitals found an
inverse relationship between the number of registered nurses per patient and urinary tract
infections, pneumonia, thrombosis, and pulmonary compromise (Kovner & Gergen, 1998).
Another study finds that when medical interns are made to work overtime (shifts >24 hours),
they made 35.9% more serious medical errors than when all shifts were <24 hours (Landrigan et
al, 2004). Robert et al (2000) find that higher ICU patient:staff ratios significantly increase the
risk of bloodstream infections. Studies of both neo-natal and adult ICUs indicate that times of
high nursing workload correlate with higher risk of inadequate supervision, medication errors,
increased infection rates, and premature discharge, all leading to significantly higher patient
mortality rates (Carayon & Gurses, 2005; Tarnow-Mordi et al, 2000; Beckmann et al, 1998).
This wide array of data clearly supports the premise that the appropriate staff to patient ratio
must be maintained to provide optimal patient care, and falling below an appropriate, ‘normal’
ratio leads to increased errors and adverse events.

Rust 103
The definition of what is considered a 'normal ratio' must be based on specific healthcare process
and clinic in question. Variation in care practices, patient population characteristics, and process
design all contribute to the development of site-specific patient to provider guidelines. However,
some researchers have attempted to directly estimate the relationship between the
patient:provider ratio and patient mortality. One of the largest and most robust study in this area
of research was taken from a sample of 168 hospitals in Pennsylvania (Aiken et al, 2002).
Adjusting for factors such as hospital size, teaching status and technological capacity, this
research finds that for each additional (non-critical) patient assigned to an RN above the level of
adequate staffing (defined as 4:1 for non-critical care wards), the mortality rate of all patients
being cared for by that nurse increases by 7%. This implies that doubling the number of patients
in a clinic would increase patient mortality by 31%, if nurse staffing remained unchanged. In
starker terms, this doubling of workload (from a ratio of 4:1 to a ratio of 8:1 patients to nurses)
would be expected to lead to 5.0 excess deaths per 1000 patients, and 18.2 excess deaths per
patients with complications (Aiken et al, 2002 – for the calculations necessary to apply this
mortality likelihood to our model, see Appendix B). While this odds ratio may not be
generalizable to other hospital units or entire hospital populations, the authors find no change in
their estimates depending on type of patient, using the outcome measure of inpatient deaths or
deaths within 30 days, sampling either medical or surgical nurses, or the ratios of other skilled
and unskilled practitioners to patients.
We recognize the controversial nature of this precise association between mortality and nurse
workload, and do not wish for discussions of the applicability of this relationship to occlude the
more generalizable conclusions derived from our simulations. Thus, we do not include any
estimates of patient mortality or error generation in our model, even if there is evidence to
support such feedback effects between provider workload on patient safety. Meaningful
estimates of excess patient mortality could be generated for a particular care delivery process, if
the model was parameterized from more specific data on patient backlogs, workload increases,
and the effects of patient to provider ratios on key patient outcomes by type of clinic and
specialty. Any work to develop a more precise estimate would also need take the beneficial
impact of reduced care delivery time into account, as reduced length-of-stay has been correlated
with improved patient outcomes and reduced risk. Including the dynamic feedback effects of
these changes to patient risk would complicate the interpretation of model behavior, and reduce
its significance to only specific patient characteristics and individual care processes. While
challenging, we believe this is necessary future research for both patient safety and healthcare
service delivery researchers.
To keep the analysis as widely applicable as possible, we report only variation in the
patient:provider ratio as a proxy for error creation and patient safety risk. We operationalize our
measure through observing changes in clinic workload. Workload is defined as a dimensionless
ratio of the service capacity necessary to see the current backlog of patients within the target
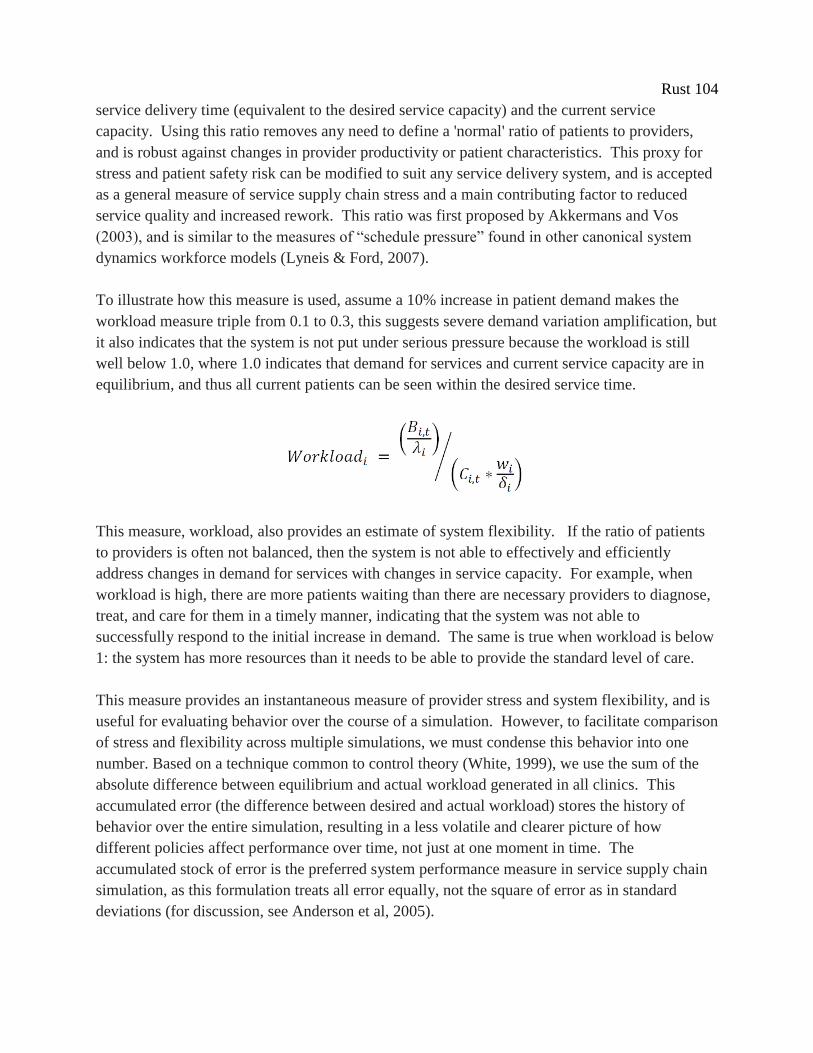
Rust 104
service delivery time (equivalent to the desired service capacity) and the current service
capacity. Using this ratio removes any need to define a 'normal' ratio of patients to providers,
and is robust against changes in provider productivity or patient characteristics. This proxy for
stress and patient safety risk can be modified to suit any service delivery system, and is accepted
as a general measure of service supply chain stress and a main contributing factor to reduced
service quality and increased rework. This ratio was first proposed by Akkermans and Vos
(2003), and is similar to the measures of “schedule pressure” found in other canonical system
dynamics workforce models (Lyneis & Ford, 2007).
To illustrate how this measure is used, assume a 10% increase in patient demand makes the
workload measure triple from 0.1 to 0.3, this suggests severe demand variation amplification, but
it also indicates that the system is not put under serious pressure because the workload is still
well below 1.0, where 1.0 indicates that demand for services and current service capacity are in
equilibrium, and thus all current patients can be seen within the desired service time.
This measure, workload, also provides an estimate of system flexibility. If the ratio of patients
to providers is often not balanced, then the system is not able to effectively and efficiently
address changes in demand for services with changes in service capacity. For example, when
workload is high, there are more patients waiting than there are necessary providers to diagnose,
treat, and care for them in a timely manner, indicating that the system was not able to
successfully respond to the initial increase in demand. The same is true when workload is below
1: the system has more resources than it needs to be able to provide the standard level of care.
This measure provides an instantaneous measure of provider stress and system flexibility, and is
useful for evaluating behavior over the course of a simulation. However, to facilitate comparison
of stress and flexibility across multiple simulations, we must condense this behavior into one
number. Based on a technique common to control theory (White, 1999), we use the sum of the
absolute difference between equilibrium and actual workload generated in all clinics. This
accumulated error (the difference between desired and actual workload) stores the history of
behavior over the entire simulation, resulting in a less volatile and clearer picture of how
different policies affect performance over time, not just at one moment in time. The
accumulated stock of error is the preferred system performance measure in service supply chain
simulation, as this formulation treats all error equally, not the square of error as in standard
deviations (for discussion, see Anderson et al, 2005).

Rust 105
2-7.2 Inherent model behavior
System behavior offers key evidence toward model validation. Comparison of behavior
generated by the structure of the model against well-established behaviors found in empirical
studies adds weight to model design. From the literature, a service supply chain with delays,
bounded rationality, and no demand signaling, which faces unknown, variable demand should
produce its own internal variation, which amplifies the variation in the original demand. This
'bullwhip effect' is theorized to be inherent to all real-world service and production systems, and
is the key performance problem to analyze in both service and manufacturing supply chains
(Anderson & Morrice, 2005; Lee et al, 2009). The bullwhip effect, or its equivalent in non-
inventoried service chains, has been reported in multiple healthcare services. Case studies and
analyses of real-world hospital and clinic admissions and discharge rates have shown increasing
downstream variation amplification (Walley, 2007; Sethuraman & Tirupati, 2005; Jack &
powers, 2004). In each of these studies, this variation amplification effect is related to increased
costs, employee stress, and resource utilization rates. In manufacturing, the bullwhip effect is
similarly credited with creating undue stress on supply chain resources, increased costs, lower
customer satisfaction, lower service quality, and lost sales. Examples of these adverse outcomes
attributed to the bullwhip effect exist in the case studies of many diverse service industries, as
well.
The existence of variation amplification between clinics in our service chain is significant
because stress placed upon a healthcare system by demand variability has been shown to lead to
more medical errors, sicker patients, and is believed to be a leading cause of adverse patient
outcomes (Needleman et al, 2002; Berens, 2000; Pronovost et al, 1999). Increasing demand
variation should exacerbate our hypothesized adverse effects of lean-based redesign, reducing
the ability of the service system to meet patient needs and to provide the requested care in a
timely way. Demand variation amplification is a pervasive problem, and should be generated by
this model.
We also look for the model to generate an appreciable trade-off between supply chain efficiency
and flexibility. This relationship, while not yet reported in the healthcare literature, is found in
both service and manufacturing supply chain case studies, and would align with the current
understanding of generic service supply chain behavior. If this inverse relation is demonstrated,
then model behavior should also indicate that uncertainty in end-customer demand acts an
amplifier on that relationship, with increasing uncertainty leading to increases in efficiency
having larger negative correlation with overall system flexibility. Producing these behaviors
would further align our model with the current understanding of service systems.
To test for these behaviors, we first simulate a base case scenario, which contains no lean-based
redesign or increases in clinic efficiency, productivity, or patient throughput. The system faces a
minimal level of demand uncertainty, but one that will clearly expose inherent model behavior: a

Rust 106
one-time 20% increase in patient demand. Key parameters in the model are initially set to the
relative equivalents of those found in other generic service supply chain models. The total
desired patient service time is one month, spread evenly over each clinic (λi is 1 week); the time
to add or remove a provider from any clinic roster is two weeks (τi = 2 weeks), and the
productivity of each provider is 1 exam per hour (i = 1 hour / exam / clinician). The model
starts in equilibrium, where exogenous demand is a constant rate of 100 patients per week, and
each clinic is staffed with 2.5 FTE, which is the number needed to meet that demand in the target
service time (λ). Thus, desired capacity and actual service capacity are equal, and our
performance measure, workload, is 1.0 in each service clinic. This scenario represents the most
basic service delivery system, where local managers control the workforce at each clinic using
only information on their local clinic backlog and provider productivity.
This model structure clearly generates the demand variation amplification effect. The results for
weekly demand for services and system stress for all clinics in this healthcare delivery chain over
a 60 week period are contained in Figure 26 and Table 5. This finding compliments previous
service supply chain modeling studies, as the effect manifests in increasing upstream variation in
both order backlogs and service capacity. Each clinic transfers variation to subsequent clinics,
magnifying demand as it moves up the service chain, creating system stresses proportionally
much larger than the initial increase in demand. The amplification effects arise from delays in
demand signaling and the limited information and bounded rationality of individual clinic
managers. Clinics in this model are highly compartmentalized; they share no data on
productivity, patient backlog or service quality. In this model, there is no coordination of
functions between clinics, which represents the typical level of coordination of care both
between healthcare organizations and inside hospitals.
Workloads
1.25
1.125
1
0.875
0.75
0 3 6 9 12 15 18 21 24 27 30 33 36 39 42 45 48 51 54 57 60
Time (Week)
Dm
nl
Workload 1 : Base Case
Workload 2 : Base Case
Workload 3 : Base Case
Workload 4 : Base Case Figure 26. Base case analysis of changes in individual clinic workloads resulting from a 20%
increase in demand in week 10.
Demand rate changed from 100 tasks per week to 120 tasks per week. Simulation was conducted in Vensim®
software version 6.0 using Runge-Kutta integration methods, with a time step of 0.03125weeks.

Rust 107
Further tests also reveal that model structure generates the trade-off between efficiency and
flexibility found in the supply chain management literature. Increased efficiency is modeled as a
sustained reduction in providers’ average time per task (i) and the target service delivery time
(λi) in all clinics. These two changes are necessary to typify the operational effects of increasing
efficiency in healthcare, where the two most common goals are improving patient care and
reducing costs (Robinson et al, 2012; Miller, 2005). In most case studies of redesign efforts
hospitals credit lean redesign with improvements in both patient care (as measured by reducing
patient backlogs, inventory, reduced waiting times), as well as reductions in operational costs
(Nelson-Peterson & Leppa, 2007; Jones, 2006). Adjusting both system parameters
simultaneously ensures that the benefits of increased efficiency are spread between these two
goals; both patient service times and total clinic workforce are reduced in the steady state, thus,
patient care is improved and overall costs are reduced. Increasing provider productivity without
decreasing target service time would simply result in cutting costs (as the number of necessary
providers would decline), while decreasing desired service times would improve patient care, but
without decreasing provider time per exam would require more staff and thus incur higher costs.
In these scenarios, the benefits of increasing service chain efficiency are shared between the
hospital and the patient.
Table 5. Comparison of service times and workload errors caused by one-time step increases in
demand. Base Case
Change in
demand Clinic 1 Clinic 2 Clinic 3 Clinic 4 Global Performance
Increase in
Patients
/day
∫|Workload
Error1|
Service
Time
St. Dev
∫| Workload
Error2|
Service
Time
St. Dev
∫| Workload
Error3|
Service
Time
St. Dev
∫| Workload
Error4|
Service
Time
St. Dev
∫
|Workload
Error|
Service
Time
St. Dev
+10% 0.349 0.01838 0.551 0.02219 0.845 0.02919 1.285 0.04009 3.031 0.10985
+20% 0.652 0.03472 1.020 0.04115 1.556 0.05364 2.362 0.07359 5.591 0.20310
+30% 0.921 0.04944 1.426 0.05768 2.165 0.07456 3.285 0.10229 7.798 0.28397
This experiment includes three different scenarios for model parameter governing exogenous demand, which is
varied from the base case of 100 tasks per week to 110, 120, and 130 tasks per week. The table reports accumulated
absolute workload error and standard deviation of average service time (computed by Little’s Law) for each
scenario, and the sum of these performance measures for all clinics. The time horizon for each simulation is 60
weeks. Simulation was conducted in Vensim® software version 6.0 using Runge-Kutta integration methods, with a
time step of 0.03125weeks.
We define time per service (∑δ) in the service chain as the measure of efficiency, and measure
flexibility (the ability of system to respond to changes in demand) through accumulating
workload error over the course of the simulation. With these definitions, a perfectly flexible
service chain would be able to match any change in demand with changes in clinic service
Rust 108
capacity, leading to no fluctuations in workload or total service time. By contrast, a perfectly
inflexible service chain would never respond to changes in demand, leading to no variation in
clinic workforce size, and thus patients themselves would bear all the burden of demand
variation through fluctuations in service time. As currently designed, our generic healthcare
chain lies between these two extreme cases, not completely resilient against demand uncertainty,
but not completely inert either.
Simulations presented in Figure 27 indicate that increasing total supply chain efficiency results
in increased workload error. The same step increase in demand of 20% in week 10 results in
very different workload error rates depending on the level of clinic efficiency in each
simulation. These results can be explained by the changes made to the system structure.
Improving the chain’s efficiency increases the speed of service delivery, which results in
reducing the size of clinic patient backlogs. In service chains, these backlogs act as buffers on
demand variation; therefore, shrinking service times (and subsequently shrinking buffers) allow
more variation amplification through to the service chain (Anderson et al, 2005). If demand
variation is not absorbed by patient backlogs, then it is more directly felt by service capacity, as
there is no finished goods inventory to absorb changes in demand. The clinics in this more
efficient system are more exposed to variations in demand, and the resulting system is harder to
keep in control than when the system provides services more slowly. This results in more
demand variation amplification, and thus more system stress and reduced performance.
To clarify, in all these scenarios the chain itself does not become less flexible absolutely as
efficiency increases, but only relatively less flexible, as the increased efficiency has led to
increases in internal demand variation. With increasing efficiency creating to a more
pronounced ‘bullwhip effect,’ the level of flexibility set by model parameters (τi) is no longer
adequate to maintain initial performance levels. Changes in service supply chain efficiency have
a similar effect: doubling the efficiency results in approximately doubling the workload error
accumulated over each simulation. When faced with increasing demand volatility, even if
caused by internal variation amplification, the delivery system needs more flexibility to maintain
equivalent performance (both as measured by distribution of service times and workload
measures).
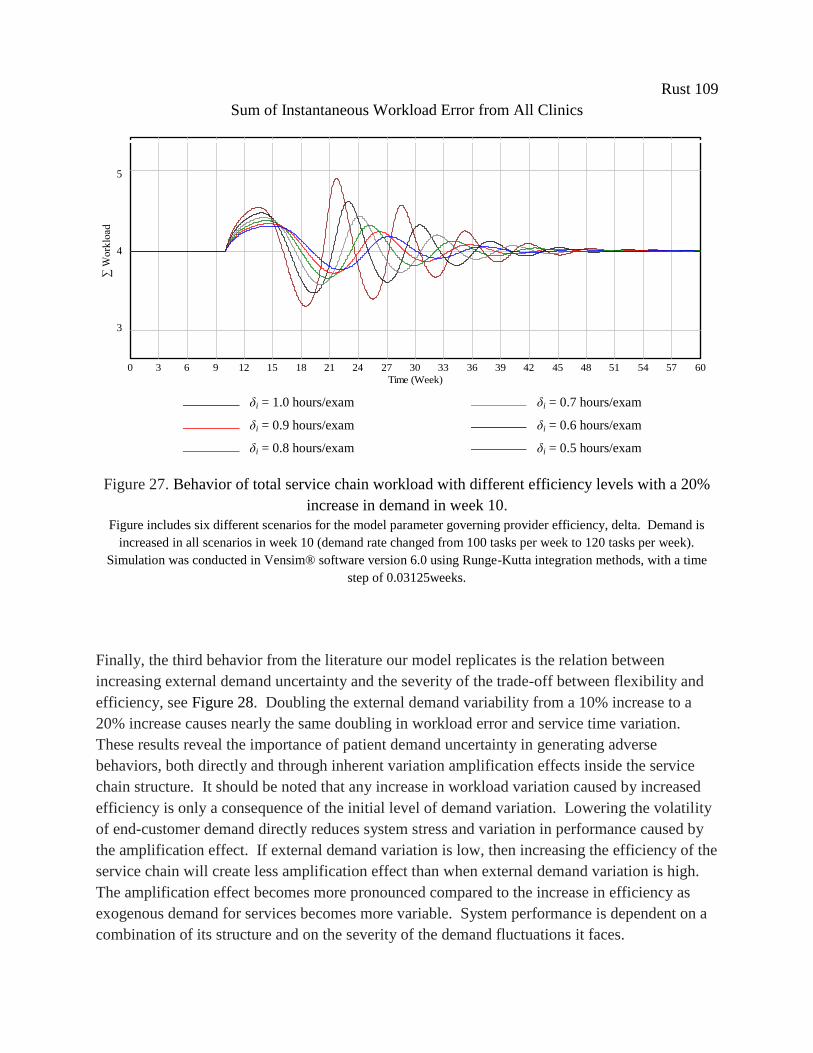
Rust 109
Sum of Instantaneous Workload Error from All Clinics E Workload Error
6
5
4
3
2
0 3 6 9 12 15 18 21 24 27 30 33 36 39 42 45 48 51 54 57 60
Time (Week)
E Workload Error : BaseCase-test_throughput_and_workload
E Workload Error : BaseCase-test_throughput_and_workload-eff90
E Workload Error : BaseCase-test_throughput_and_workload-eff80
E Workload Error : BaseCase-test_throughput_and_workload-eff70
E Workload Error : BaseCase-test_throughput_and_workload-eff60
E Workload Error : BaseCase-test_throughput_and_workload-eff50
E Workload Error
6
5
4
3
2
0 3 6 9 12 15 18 21 24 27 30 33 36 39 42 45 48 51 54 57 60
Time (Week)
E Workload Error : BaseCase-test_throughput_and_workload
E Workload Error : BaseCase-test_throughput_and_workload-eff90
E Workload Error : BaseCase-test_throughput_and_workload-eff80
E Workload Error : BaseCase-test_throughput_and_workload-eff70
E Workload Error : BaseCase-test_throughput_and_workload-eff60
E Workload Error : BaseCase-test_throughput_and_workload-eff50
Figure 27. Behavior of total service chain workload with different efficiency levels with a 20%
increase in demand in week 10.
Figure includes six different scenarios for the model parameter governing provider efficiency, delta. Demand is
increased in all scenarios in week 10 (demand rate changed from 100 tasks per week to 120 tasks per week).
Simulation was conducted in Vensim® software version 6.0 using Runge-Kutta integration methods, with a time
step of 0.03125weeks.
Finally, the third behavior from the literature our model replicates is the relation between
increasing external demand uncertainty and the severity of the trade-off between flexibility and
efficiency, see Figure 28. Doubling the external demand variability from a 10% increase to a
20% increase causes nearly the same doubling in workload error and service time variation.
These results reveal the importance of patient demand uncertainty in generating adverse
behaviors, both directly and through inherent variation amplification effects inside the service
chain structure. It should be noted that any increase in workload variation caused by increased
efficiency is only a consequence of the initial level of demand variation. Lowering the volatility
of end-customer demand directly reduces system stress and variation in performance caused by
the amplification effect. If external demand variation is low, then increasing the efficiency of the
service chain will create less amplification effect than when external demand variation is high.
The amplification effect becomes more pronounced compared to the increase in efficiency as
exogenous demand for services becomes more variable. System performance is dependent on a
combination of its structure and on the severity of the demand fluctuations it faces.
δi = 1.0 hours/exam δi = 0.7 hours/exam
δi = 0.9 hours/exam δi = 0.6 hours/exam
δi = 0.8 hours/exam δi = 0.5 hours/exam
E Acc. Error Workload
20
15
10
5
0
0 3 6 9 12 15 18 21 24 27 30 33 36 39 42 45 48 51 54 57 60
Time (Week)
Dim
en
sio
nless*
Week
"E Acc. Error Workload" : BaseCase-test_throughput_and_workload-eff50
"E Acc. Error Workload" : BaseCase-test_throughput_and_workload-eff60
"E Acc. Error Workload" : BaseCase-test_throughput_and_workload-eff70
"E Acc. Error Workload" : BaseCase-test_throughput_and_workload-eff80
"E Acc. Error Workload" : BaseCase-test_throughput_and_workload-eff90
"E Acc. Error Workload" : BaseCase-test_throughput_and_workload
∑ W
ork
load
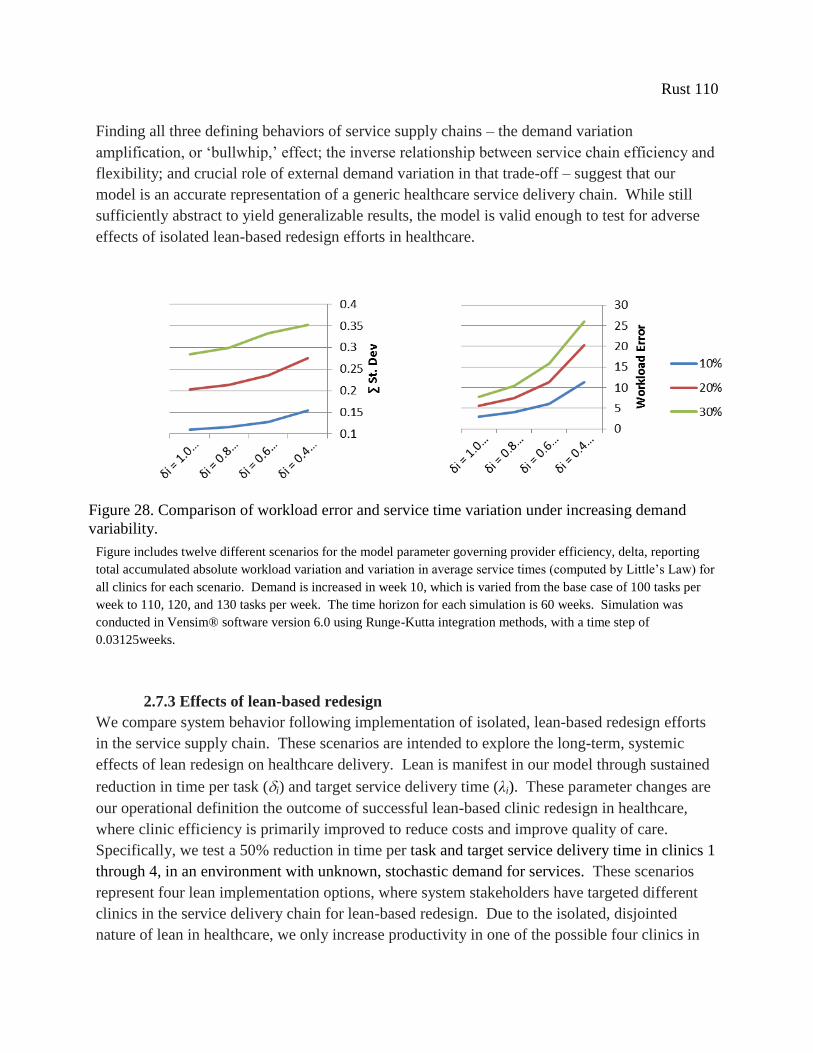
Rust 110
Finding all three defining behaviors of service supply chains – the demand variation
amplification, or ‘bullwhip,’ effect; the inverse relationship between service chain efficiency and
flexibility; and crucial role of external demand variation in that trade-off – suggest that our
model is an accurate representation of a generic healthcare service delivery chain. While still
sufficiently abstract to yield generalizable results, the model is valid enough to test for adverse
effects of isolated lean-based redesign efforts in healthcare.
Figure includes twelve different scenarios for the model parameter governing provider efficiency, delta, reporting
total accumulated absolute workload variation and variation in average service times (computed by Little’s Law) for
all clinics for each scenario. Demand is increased in week 10, which is varied from the base case of 100 tasks per
week to 110, 120, and 130 tasks per week. The time horizon for each simulation is 60 weeks. Simulation was
conducted in Vensim® software version 6.0 using Runge-Kutta integration methods, with a time step of
0.03125weeks.
2.7.3 Effects of lean-based redesign
We compare system behavior following implementation of isolated, lean-based redesign efforts
in the service supply chain. These scenarios are intended to explore the long-term, systemic
effects of lean redesign on healthcare delivery. Lean is manifest in our model through sustained
reduction in time per task (i) and target service delivery time (λi). These parameter changes are
our operational definition the outcome of successful lean-based clinic redesign in healthcare,
where clinic efficiency is primarily improved to reduce costs and improve quality of care.
Specifically, we test a 50% reduction in time per task and target service delivery time in clinics 1
through 4, in an environment with unknown, stochastic demand for services. These scenarios
represent four lean implementation options, where system stakeholders have targeted different
clinics in the service delivery chain for lean-based redesign. Due to the isolated, disjointed
nature of lean in healthcare, we only increase productivity in one of the possible four clinics in
Figure 28. Comparison of workload error and service time variation under increasing demand
variability.
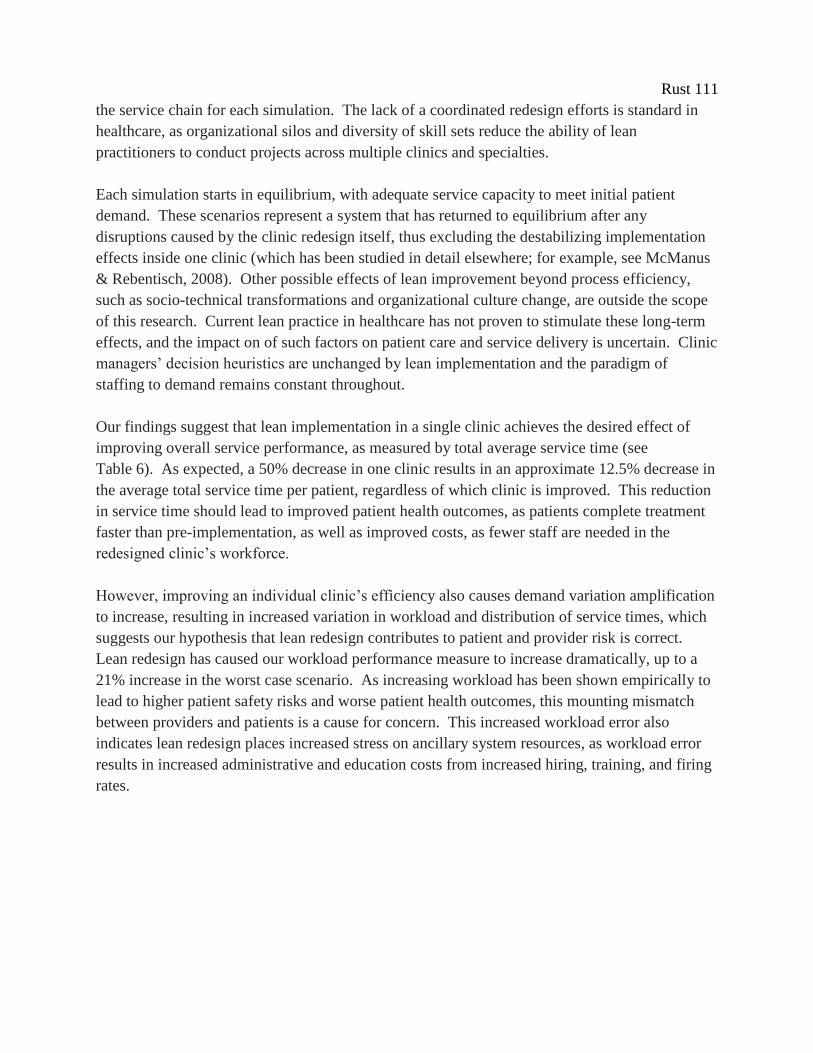
Rust 111
the service chain for each simulation. The lack of a coordinated redesign efforts is standard in
healthcare, as organizational silos and diversity of skill sets reduce the ability of lean
practitioners to conduct projects across multiple clinics and specialties.
Each simulation starts in equilibrium, with adequate service capacity to meet initial patient
demand. These scenarios represent a system that has returned to equilibrium after any
disruptions caused by the clinic redesign itself, thus excluding the destabilizing implementation
effects inside one clinic (which has been studied in detail elsewhere; for example, see McManus
& Rebentisch, 2008). Other possible effects of lean improvement beyond process efficiency,
such as socio-technical transformations and organizational culture change, are outside the scope
of this research. Current lean practice in healthcare has not proven to stimulate these long-term
effects, and the impact on of such factors on patient care and service delivery is uncertain. Clinic
managers’ decision heuristics are unchanged by lean implementation and the paradigm of
staffing to demand remains constant throughout.
Our findings suggest that lean implementation in a single clinic achieves the desired effect of
improving overall service performance, as measured by total average service time (see
Table 6). As expected, a 50% decrease in one clinic results in an approximate 12.5% decrease in
the average total service time per patient, regardless of which clinic is improved. This reduction
in service time should lead to improved patient health outcomes, as patients complete treatment
faster than pre-implementation, as well as improved costs, as fewer staff are needed in the
redesigned clinic’s workforce.
However, improving an individual clinic’s efficiency also causes demand variation amplification
to increase, resulting in increased variation in workload and distribution of service times, which
suggests our hypothesis that lean redesign contributes to patient and provider risk is correct.
Lean redesign has caused our workload performance measure to increase dramatically, up to a
21% increase in the worst case scenario. As increasing workload has been shown empirically to
lead to higher patient safety risks and worse patient health outcomes, this mounting mismatch
between providers and patients is a cause for concern. This increased workload error also
indicates lean redesign places increased stress on ancillary system resources, as workload error
results in increased administrative and education costs from increased hiring, training, and firing
rates.

Rust 112
Table 6. Comparison of service times and provider stress levels of four lean-based redesign
scenarios, when patient demand is stochastic and unknown.
Desired
Performance Actual Performance
Range of
Total Avg.
Service Time
Probability of
Exceeding Base
Case Service
Time
Accumulated
Workload
Clinician Stress
measure
Total Avg.
Process Time
(avg.)
Total Avg. Service
Time
(min., avg., max.)
Max. time –
Min. time P(x > 4 weeks)
∫|Workload
Error|
unit
[weeks] [weeks] [weeks] [%] [Dmnl]
Base Case (w/
random
demand)
4 3.4947, 3.9959,
4.7324
1.2377
(100%) 48.88%
45.139
(100%)
Scenario
Improvement in
Clinic 1 3.5
2.9421, 3.4980,
4.2402
1.2981
(+4.88%) 2.37%
54.659
(+21.09%)
Improvement in
Clinic 2 3.5
2.9386, 3.4980,
4.2386
1.3000
(+5.03%) 2.37%
51.007
(+13.00%)
Improvement in
Clinic 3 3.5
2.9366, 3.4980,
4.2428
1.3062
(+5.53%) 2.37%
48.800
(+8.11%)
Improvement in
Clinic 4 3.5
2.9443, 3.4980,
4.1972
1.2529
(+1.23%) 2.40%
47.023
(+4.17%)
The experiment includes five different scenarios for the model parameter governing provider efficiency, delta, and
desired service time, lambda; reporting average service times (computed by Little’s Law), range of average service
times, probability of exceeding the base case desired time of 4 weeks, and total accumulated absolute workload
variation for all clinics for each scenario. Demand is simulated around a base demand rate of 100 tasks per week
with a pink noise process with a standard deviation of 10%. The time horizon for each simulation is 60 weeks.
Simulation was conducted in Vensim® software version 6.0 using Runge-Kutta integration methods, with a time
step of 0.03125weeks.
Lean-based redesign has also caused service time distribution to increase, by approximately
5.5% in the worst case scenario. While this is evidence of increased variation and system stress
due to lean efforts, this is unlikely to have direct adverse effects on patient care. For even if the
distribution is wider, the overall range has shifted enough that all patients are still being treated
faster than before lean redesign occurred. The likelihood of a patient care episode lasting longer
than 4 weeks is now only 2.37% post-lean implementation, compared to pre-implementation
service levels of 48% of patients exceeding the service standard of 4 weeks. These results
indicate that increasing service time distribution is not cause for concern nor should it affect
patient safety or quality of care.
We found similar behavior in our base case scenarios, where decreasing overall service times
created internal demand variation amplification. The key finding from this experiment is that not
all lean implementation options produce the same level of variation amplification and provider
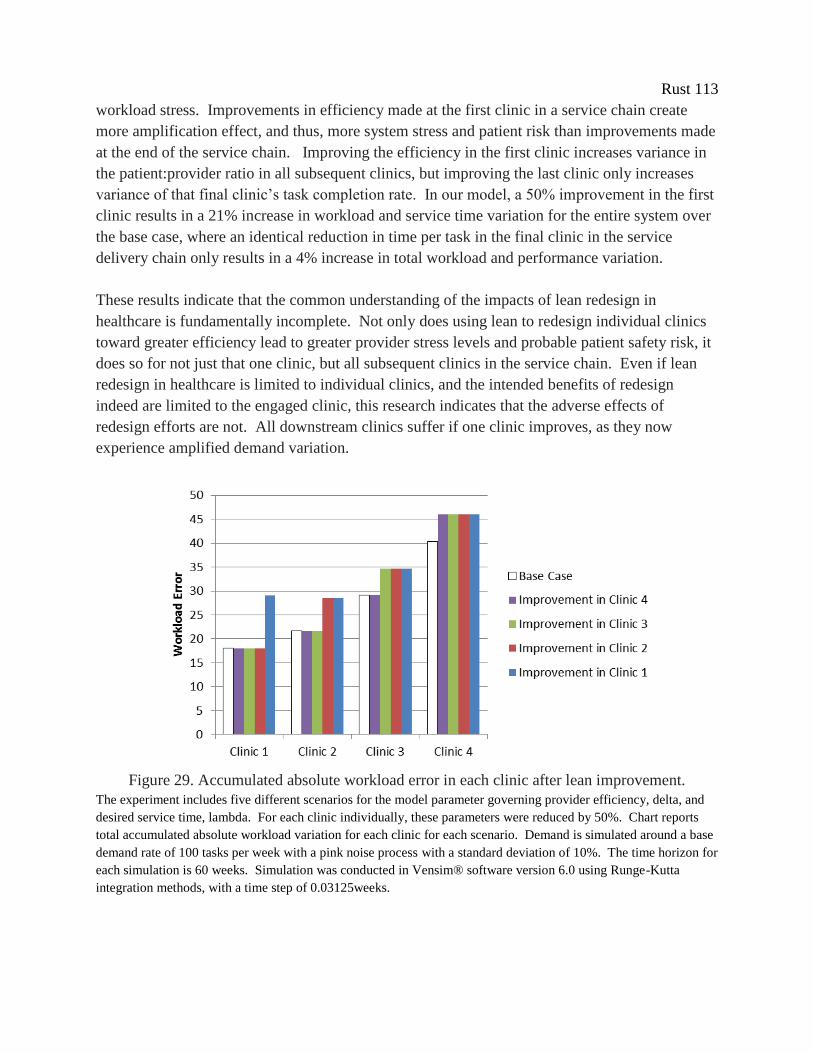
Rust 113
workload stress. Improvements in efficiency made at the first clinic in a service chain create
more amplification effect, and thus, more system stress and patient risk than improvements made
at the end of the service chain. Improving the efficiency in the first clinic increases variance in
the patient:provider ratio in all subsequent clinics, but improving the last clinic only increases
variance of that final clinic’s task completion rate. In our model, a 50% improvement in the first
clinic results in a 21% increase in workload and service time variation for the entire system over
the base case, where an identical reduction in time per task in the final clinic in the service
delivery chain only results in a 4% increase in total workload and performance variation.
These results indicate that the common understanding of the impacts of lean redesign in
healthcare is fundamentally incomplete. Not only does using lean to redesign individual clinics
toward greater efficiency lead to greater provider stress levels and probable patient safety risk, it
does so for not just that one clinic, but all subsequent clinics in the service chain. Even if lean
redesign in healthcare is limited to individual clinics, and the intended benefits of redesign
indeed are limited to the engaged clinic, this research indicates that the adverse effects of
redesign efforts are not. All downstream clinics suffer if one clinic improves, as they now
experience amplified demand variation.
Figure 29. Accumulated absolute workload error in each clinic after lean improvement.
The experiment includes five different scenarios for the model parameter governing provider efficiency, delta, and
desired service time, lambda. For each clinic individually, these parameters were reduced by 50%. Chart reports
total accumulated absolute workload variation for each clinic for each scenario. Demand is simulated around a base
demand rate of 100 tasks per week with a pink noise process with a standard deviation of 10%. The time horizon for
each simulation is 60 weeks. Simulation was conducted in Vensim® software version 6.0 using Runge-Kutta
integration methods, with a time step of 0.03125weeks.
Rust 114
While the reported trend in system performance is generally applicable, the precise increases in
workload variation generated by the model are not. They are not derived from observations of
any specific healthcare service supply chain or case study, and are completely dependent on
model parameters (target service times, exogenous demand variation, etc.). This makes the
precise estimation of the impact of lean-induced demand variation amplification in our model on
patient safety impossible. However, this does not mean that it does not exist. For illustration
purposes only, we use the relationship between the patient:provider ratio and patient mortality
reported by Aiken et al (2002) to calculate these effects for our simulation results. If their
analysis was applicable, we would find that all four lean improvement strategies increase patient
mortality over the base case. Increases in mortality would range from 3.3% in the best case to
the worse case resulting in a 19% increase in patient mortality over the base case scenario (see
Appendix D for calculations). Even if these ratios are off by an order of magnitude, this analysis
suggests lean redesign has a significant adverse impact on preventable patient deaths.
These results suggests that lean could be better suited to healthcare services where quality is not
closely tied to the patient:provider ratio. This could be either in clinics where clinicians and
patients are more immune to schedule pressures, like a screening clinic; or where quality is less
flexible, perhaps in a service chain with many checklists and redundant inspections. These
findings also highlight the importance of pursuing other lean aims besides increasing efficiency.
Taking from the iteration of lean still used in manufacturing, standardizing work processes and
error proofing could be used to counter the effects of demand variation amplification on patient
safety. To counter the bullwhip effect itself, heijunka, or level loading, a primary element of the
Toyota Production System, could be brought to the fore of lean as applied in healthcare.
Currently, analyzing and improving the flow of patients through a healthcare system is more the
realm of queuing theorists and operations researchers than front-line staff engaged in clinic
redesign. Refocusing lean re-design efforts on patient safety and process reliability issues could
further prevent the hypothesized increases in patient safety risks.
2-8. Exploration of Agile-based Counter-Measures
Since reduction in relative supply chain flexibility is the source of our simulations’ patient safety
problems, we believe redesigning the service supply chain base on ‘agile’ principles is a
potential solution. While not completely opposing or mutually exclusive redesign strategies,
focusing on the principles of ‘agility’ will lead to a supply chain toward operating effectively in
an environment of continually and unpredictably changing customer demands, as defined by
Goldman et al. (1995). The more ‘agile’ a service supply chain, the more accurately and quickly
it responds to market changes, and the more it sees demand changes as opportunities rather than
obstacles (Sharifi & Zhang, 2001). Pursuing an ‘agile’ system redesign strategy should allow the
service chain to work toward perfectly accommodating individual customer care needs.
Rust 115
Both redesign paradigms seek to improve value for the patient, but through different approaches,
focusing on different aspects of care delivery. Where lean in healthcare focuses mainly on waste
elimination and increasing efficiency in individual clinics, agile focuses on process integration,
meaning the collaborative design and implementation of co-operative service delivery and
capacity management. This form of co-operation in service supply chains is becoming more
prevalent in some areas of healthcare, as team-based care models for primary care (e.g., the
Patient Centered Medical Home, or PCMH) are becoming standardized. As of 2007, an
estimated 27% of primary care practices follow some elements of the PCMH model, where
disparate elements of the healthcare system (e.g., subspecialty care, hospitals, home health
agencies, nursing homes) and the patient’s community (e.g., family, public and private
community-based services) are coordinated through a patient’s primary care provider (Beal et al,
2007). If not specifically called ‘agile,’ these changes are consistent with the supply chain
literature examples of agile redesign activities.
In healthcare, there is growing recognition that individual clinicians no longer provide care as
stand-alone entities but rather through complex networks of activities and specialties. Healthcare
systems that can better structure, co-ordinate and manage the relationships of their clinicians,
technicians, and specialists in a network produce better patient outcomes. Consistent with the
move toward team-based care, care networks that improve co-ordination among providers show
improved quality, reduced errors, and increased satisfaction (Rosenthal, 2008), with one recent
study of a Seattle health system demonstrating 29% fewer emergency visits, 6% fewer
hospitalizations, and total savings of $10.30 per patient per month over a twenty-one month
period (Reid et al. 2010). Healthcare service delivery researches see the potential benefits of
agile-based redesign, and are calling for more research into how to apply agile principles in
healthcare settings (Vries & Huijsman, 2011).
We believe this approach could limit the patient safety risks caused by lean redesign.
Collaborative planning releases individual clinics from the motivation to promote their own
efficiency without regard to the cost it places on downstream clinics. Coordinating redesign
efforts across the entire service chain allows service chain managers to work toward optimal
performance from the patient’s perspective, as they experience the entire chain, rather
conducting isolated improvements in individual clinics.
We operationalize co-operative planning and implementation of redesign activities across the
four clinics in our care delivery chain, by varying the distribution of individual clinic’s
performance standards and productivity levels while keeping total desired service time for the
entire service delivery chain constant at three weeks, i.e., = 3 weeks. In these scenarios, the
performance standard has been set for the service chain as a whole, allowing clinics to vary their
individual efficiencies, within the constraint that total patient service time remains at 3 weeks.
Rust 116
Since all of these scenarios have the same desired total service time, regardless of the distribution
of those patients in the chain, no one scenario should have patients waiting longer than any other.
All subsequent effects are caused by the distribution of individual clinic efficiencies, not by
changes to the overall performance standard. It should be noted that in these scenarios the
service chain has a shorter service time than in the previous experiment, as the average patient is
completing treatment and leaving the system after 3 weeks, rather than 3.5 weeks. Based on our
analysis of inherent behaviors, this should cause more internal demand variation amplification
than results reported in previous sections. This service chain is ‘leaner’ than the chain in
previous scenarios, but it is a more coordinated chain, as well.
These experiments are designed to reveal the extent workload and distribution of service time
can be affected by coordinated planning and management. Desired clinic performance is
determined exogenously by model parameters defining individual clinic’s target service time and
provider efficiency rates (λi and i, respectively). An individual clinic’s parameters are varied
between 1 and 0.25; while the units of these parameters are different (weeks and exams per
provider per hour, respectively) varying them together is a more accurate representation of how
changes to clinic performance measure would be achieved in an actual healthcare delivery chain.
These are the same parameters modified to simulate lean-based redesign activities. These
scenarios could represent a combination of lean methods with an overarching agile strategy, but
it is not necessarily following a lean-based approach that causes clinic efficiency to increase.
In our simulations, service supply chains that increase the performance of clinics toward the end
of the chain produce substantially less workload variation and provider stress than chains which
set desired performance equal across all clinics (see Figure 30). The ‘balanced performance’
strategy generated an accumulated workload error of 75.915 over the course of the simulation –
the worst of all scenarios, while the ‘end improving’ strategy only generated a workload error of
48.182, which is 36.5% less than the balanced strategy. Furthermore, setting higher performance
standards on the clinics in the end of the chain creates less variation than setting higher
performances standards at the beginning of the chain.
Changing the distribution of service time standards did not affect total average service time, as
remained constant, but did significantly affect the range of service times. Similar to
workload error, the ‘balanced performance’ strategy yielded the worst performance, with the
largest range of total service times. Coordinating improvement efforts so the clinic at the end of
the service chain has the best performance results in the smallest range of total service times,
with a range of almost half as wide as the ‘balanced’ approached. This finding suggests that
system stakeholders can prevent lean redesign causing deleterious fluctuations in system
workload through restricting lean efforts to the end clinics in a service chain.
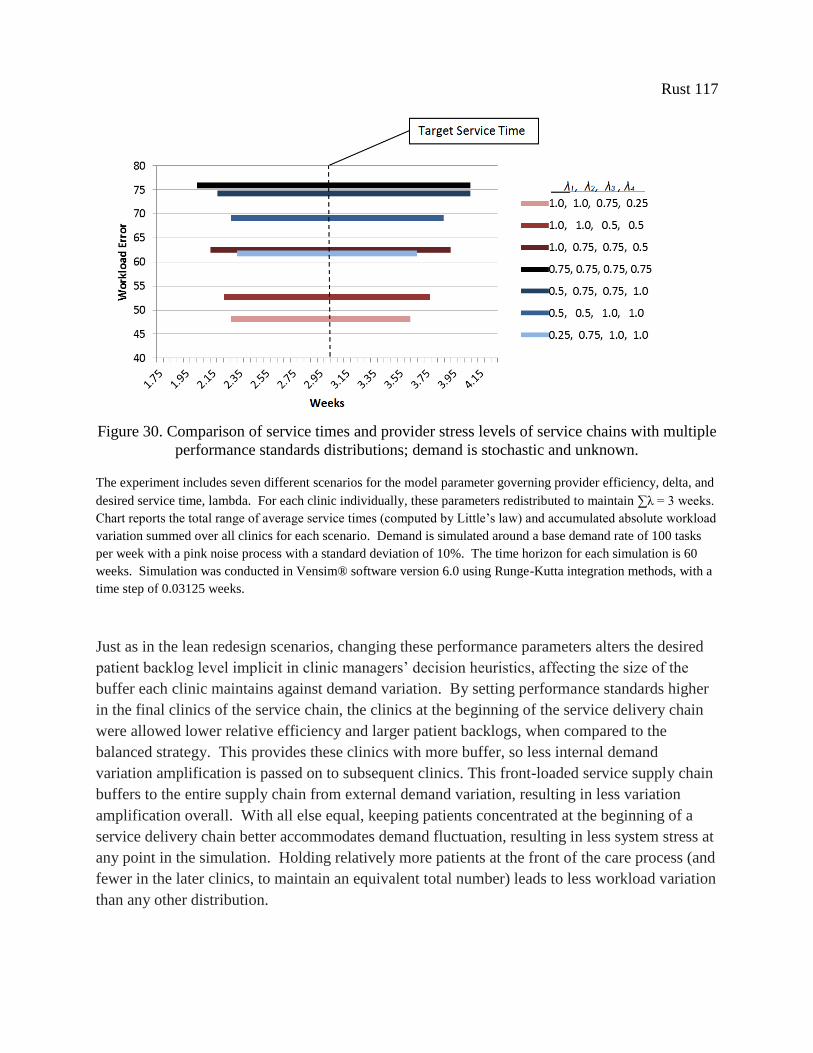
Rust 117
Figure 30. Comparison of service times and provider stress levels of service chains with multiple
performance standards distributions; demand is stochastic and unknown.
The experiment includes seven different scenarios for the model parameter governing provider efficiency, delta, and
desired service time, lambda. For each clinic individually, these parameters redistributed to maintain ∑λ = 3 weeks.
Chart reports the total range of average service times (computed by Little’s law) and accumulated absolute workload
variation summed over all clinics for each scenario. Demand is simulated around a base demand rate of 100 tasks
per week with a pink noise process with a standard deviation of 10%. The time horizon for each simulation is 60
weeks. Simulation was conducted in Vensim® software version 6.0 using Runge-Kutta integration methods, with a
time step of 0.03125 weeks.
Just as in the lean redesign scenarios, changing these performance parameters alters the desired
patient backlog level implicit in clinic managers’ decision heuristics, affecting the size of the
buffer each clinic maintains against demand variation. By setting performance standards higher
in the final clinics of the service chain, the clinics at the beginning of the service delivery chain
were allowed lower relative efficiency and larger patient backlogs, when compared to the
balanced strategy. This provides these clinics with more buffer, so less internal demand
variation amplification is passed on to subsequent clinics. This front-loaded service supply chain
buffers to the entire supply chain from external demand variation, resulting in less variation
amplification overall. With all else equal, keeping patients concentrated at the beginning of a
service delivery chain better accommodates demand fluctuation, resulting in less system stress at
any point in the simulation. Holding relatively more patients at the front of the care process (and
fewer in the later clinics, to maintain an equivalent total number) leads to less workload variation
than any other distribution.
Rust 118
Reversing this distribution of performance standards, so the clinics in the beginning of the chain
hold smaller patient backlogs than clinics at the end of the chain does not yield the worst system
behavior. In this scenario, demand variation is more amplified by these clinics because the first
clinic’s patient backlog is relatively smaller than before, but this effect is countered by later stage
clinics having more of a buffer against that internally created variability. Setting performance
standards equally across all clinics generates the most demand variation amplification. We
believe the clinics in this scenario amplify inherent demand variation at the same frequency,
reinforcing each other’s effects (similar behavior has been shown in cascaded pink noise filters,
see Sterman, 2000).
These results indicate that global coordination of performance standards and planning of
improvement efforts can directly affect the flexibility of the service supply chain. We show that
lean, or other performance improvement strategies, can be applied so as to achieve the goals of
process time reduction without creating adverse effects on workload and patient safety, if
knowledge of system feedback effects is taken into account. While changing individual clinic
performance can be disruptive to the other clinics in the service chain, changing performance can
also be used to reorganize the structure of the service supply chain to mitigate the demand
variation amplification effect. These results clearly support the importance of collaborative
planning and design of service chains in healthcare. To minimize workload stress and the danger
it represents to patient safety, setting performance standards should not be left to individual
clinics, but set in a coordinated manner by system stakeholders for all clinics to optimize the
performance of the chain as a whole.
Comparing this set of simulations to the previous experiment with lean-based redesign of
individual clinics further reveals the power and importance of coordinated improvement
planning and coordination of performance standards. Under the best coordinated planning
scenario, this service chain achieves better performance and less variation in total service time
than any of the isolated redesign scenarios, with an equivalent level workload stress. Thus, with
coordinated planning, it is possible to create performance improvement without generating
increases in internal demand variation amplification. For example, in the ‘end improving’
scenario, average service time is maintained at 3 weeks, a 17 % improvement over the best
isolated lean scenarios, but the workload error is practically equivalent. By purposefully varying
performance standards across clinics in the service chain, instead of allowing individual clinics
to set their own improvement schedules and performance standards, healthcare systems
managers can use the behaviors inherent supply chain structures to dampen internal demand
amplification and the stress it causes.
Our analysis suggests that coordinated planning and implementation of lean methods can lead to
system-wide improvements, if these changes in individual clinic efficiency and performance are
used toward the goal of creating a more ‘agile’ service chain. Using lean to shift the total patient
Rust 119
backlog from an equal distribution to the beginning of the service chain can reduce the demand
amplification effect, and theoretically reduce excess patient mortality caused by variation in the
patient:provider ratio. Depending on the situation, this general finding could lead to counter-
intuitive recommendations for application of lean in specific contexts: it could be possible to find
that, in order to achieve both improved service time and reduced workload variation, the clinic
with the worst performance should not be improved at all. Indeed, it is even foreseeable that
increasing service delays in one clinic would lead to overall increases in quality of care.
Understanding the magnitude of demand variation and the impact of service supply chain design
on variation amplification are crucial to making appropriate decisions for effective coordinated
planning and making healthcare chains safer and more ‘agile.’
These results should not be inferred as the optimal strategy for all healthcare service chains, but
represent a possibility to be considered when undertaking the redesign of service delivery.
While these results, that workload volatility will be reduced if patient backlogs are relatively
larger in the first clinics of a service chain, are generally applicable, any changes to clinic
performance must be evaluated in context. The cost and health consequences of changing
individual clinic efficiency and service delivery times, even if total service time remains
constant, can vary dramatically depending on the healthcare service in question. The decision to
change clinic performance standards should be made with a concrete evidence-base to determine
the effect of service time on patients’ specific conditions, a deep understanding of demand
patterns and resultant system behavior, and cooperation and coordination between all system
stakeholders.
2-9. Conclusion
We have shown that while lean redesign can improve individual clinic productivity, and thus
decrease local cost and service times, this performance improvement can lead to unintended
increases in provider workload and risk to patients. Systems analysis suggests that successful
individual improvement efforts in one clinic can have counter-intuitive, adverse consequences on
clinics throughout the entire healthcare service chain. Increasing clinic efficiency increases the
demand variation amplification effect, which leads to increased workload variation and stress on
system resources.
The dominant lean implementation strategy, of prioritizing projects based on impact and effort of
implementation, the ‘low-hanging fruit strategy,’ ignores the reality that healthcare is a complex,
adaptive system. This naive, narrow focus leads to unintended effects on patient health and
safety. Numerous studies have reported the connection between clinician workload and quality
of care; we are the first to report a connection between lean redesign efforts and systemic clinical
workload variation amplification. This research reveals previously unknown negative aspects to
lean redesign initiatives in healthcare.
Rust 120
Our exploratory simulation study finds that the impact of lean on patient health is determined by
its effect on the distribution of patients along the service chain. While reducing patient backlogs
in general increases the downstream variation amplification effect, using lean to shift the bulk of
patient backlogs to the front of the chain creates more upstream buffer against demand variation,
thus reducing the amplification effect overall. This strategy can be used to reduce the
occurrences of staff shortages and patient risk. If lean projects are conducted strategically,
taking into account the dynamic feedback effects inherent to service delivery chains, then we
believe it is possible for lean improvements to simultaneously achieve increased care efficiency
and patient safety.
These research results lead to important hospital management implications. The first implication
is the crucial importance of the effect of agile-based design on service supply chain performance.
Focusing on flexibility through the coordination of performance standards allows service chains
to achieve higher efficiency, reduced costs, and higher quality. When over half of the patients
admitted to hospitals in the US arrive through the emergency department (Stern et al, 1991),
healthcare services must be designed to respond both quickly and accurately if they are to meet
the unique set of needs presented by individual patients. Healthcare managers and leaders
should explore the beneficial effects of increasing flexibility in actual healthcare service chains.
A second implication is the importance of quality controls in healthcare to prevent workload
variation from affecting patient health. Hospitals in the U.S. have a poor record of measuring
and responding to overwork due to variation in the patient:provider ratio. In a national survey of
hospital staff nurses, more than one-quarter of respondents reported working unpredictable,
‘mandatory overtime’ during the 28-day study period (Rogers et al, 2004). Another similarly
designed self-report survey of critical care nurses reported that over 60% worked ten or more
overtime shifts during that 28-day study period (Scott et al, 2006). Only one state has addressed
this issue, with a mandate to maintain a standard ratio of patients to nurses at all times
(California: Office of the Governor, 2004). Using lean methods to implement standard work,
checklists, error-proofing, and the application of other human factors engineering methods would
limit the effect of abnormal patient:provider ratios on patient health outcomes.
Finally, this research highlights the importance of demand volatility in general on patient
outcomes. Past research has shown patient:provider ratios to be correlated with patient mortality
rates. In practice, the link between quality and performance is not at all obvious or immediately
made by clinic managers. Hospital managers need more information on quality elasticity across
different health care providers and settings to support effective health care staffing decision
making. Excess patient mortality will continue to occur as long as the healthcare system fails to
mitigate the stresses that contribute to operational dysfunction. If setting staffing levels equal to
average demand is an unavoidable paradigm for US hospitals under the current pressures to
Rust 121
reduce healthcare costs, then both lean practitioners and healthcare leaders must focus their
efforts on smoothing variation to reduce needless stress and improve patient safety and quality of
care. The operational definition of lean in healthcare needs to be recast to incorporate those
aspects from the Toyota Production System, such as heijunka (or load leveling) and standardized
work, that have been discounted in its current iteration.
One limitation of this study is the potential bias generated by excluding, 1) the dynamic effects
of increased patient service time on patient health, and 2) the effect of service quality on clinic
rework rates. These elements should be included in future simulation studies, but must be
calibrated to a specific service delivery chain. Past service supply chain research suggests that
these additional feedbacks may magnify the variation amplification effect (Akkermans & Vos,
2003), thus our model potentially under-estimates the bullwhip effect and its subsequent effects
on provider workload. Another limitation is the lack of a direct measure of the impact of the
patient:provider ration on risks to patient health. More precise estimation of the effects of
various clinical staff workloads in diverse clinical settings would increase the significance of our
results. We do not including the more qualitative effects of lean initiatives on employee
satisfaction, engagement, and morale in our model, which could also impact long-term quality of
care.
To operate effectively, our healthcare system must fully realize the benefits of its complexity,
rather than be limited by it. Until we know enough to redesign healthcare service delivery chains
to mitigate demand variation amplification, any innocent attempts to use lean methods to
improve clinic efficiency in healthcare delivery will almost certainly reduce patient safety to
some extent. Coordinating service delivery is complex and non-intuitive; it is of dire importance
that we undertake a serious and sophisticated study of the intersection of operational systems
issues and patient health, and act on what we learn. Essential components of such work would
include:
Aggressive research to identify robust policies from the agile redesign paradigm which
mitigate variation and amplification in the demand for healthcare services;
Pilot programs to test operational changes designed to reduce system stress by improving
flow and efficiency simultaneously, and based on these case studies;
Development of closer collaborations and communication between system scientists, lean
practitioners, and providers, both in clinical care and healthcare administration.
Attempts to improve the healthcare system by separately addressing the highly interdependent
issues of quality, efficiency, and systems management are unlikely to be productive, but
combining them would be a powerful strategy. If undertaken, the result will be an increased
ability to make optimal management decisions for patient care and health outcomes, that is,
decisions that simultaneously decrease overall costs and increase care quality.

Rust 122
Chapter 3. Adapting Agile Strategies to Healthcare Service Delivery
3-1. Abstract
Agility is a fundamental characteristic of successful supply chains faced with volatile and
unpredictable demand, and has been suggested as a promising new paradigm for improving
healthcare delivery. Agility is an organization-wide capability that seeks to improve overall
responsiveness to customer demands, synchronize supply to demand, and cope with uncertainty.
However, even if many conceptual models of agility are available, extant literature fails to
clearly delineate how ‘agile’ can be applied in healthcare services and to what extent healthcare
systems can benefit from these approaches, nor are there comparisons to current healthcare
system redesign paradigms. Given the resource constraints in most hospitals, it is useful, if not
critical, to develop a good understanding of how, and to what effect, the agile paradigm can be
applied in healthcare. We test specific agile operational practices in a simulated healthcare
environment using system dynamics modeling, establishing the comparative effectiveness of
changes to system structures that promote market sensitivity, demand information sharing, and
centralized planning. This study provides healthcare managers and policy makers with concrete
guidance to improve system performance through adopting agile practices, and opens a new area
for service supply chain management research.
3-2. Introduction
Healthcare has long been considered to be among the most complex systems in modern society
(Longest, 1974), and as healthcare continues to increase in scope and complexity, so will the
challenges to manage that system effectively. Present day healthcare delivery is defined by the
idea that networks of clinicians, rather than individual clinicians, provide patient care, and that
the success or failure of healthcare delivery is ultimately determined by the ability of those
clinicians to coordinate their activities. As healthcare increases in complexity, these previously
disparate care processes and clinicians become harder to manage and align, resulting in increased
risk to patients and inefficient use of system resources. At the same time, increasing
competition, expanding public health challenges, and decreasing resources create an increasing
necessity to deliver healthcare services in a more efficient way. Hence, being able to understand
and quickly adapt to the ever-changing needs of patients as they move through networks of
healthcare providers is crucial to the success of our healthcare delivery system. Ensuring that the
proper supply of care can be synchronized to meet the peaks and troughs of demand is clearly of
critical importance to providing cost-effective, high-quality healthcare.
The ‘old’ solutions of reducing costs by cutting back on staff and services are shortsighted at
best. Other solutions taken from the manufacturing sector, such as lean or TQM, have yet to
yield the scale of improvements predicted. Furthermore, healthcare has been slow to adopt the
service supply chain management practices that have benefitted other industries (McKone-Sweet
Rust 123
et al, 2005). Research into supply chain principles applied in healthcare settings is still in its
infancy; therefore, no operations-level guidelines exist for healthcare managers seeking to
improve system-wide service delivery.
To address this gap, this paper explores the use of a relatively new management paradigm in
healthcare. Taken from custom manufacturing and service delivery, ‘agile’ is a set of
organization-wide strategies which optimize service delivery in volatile demand environments
with highly variable customer requirements. First coined by researchers at the Iacocca Institute
at Lehigh University, in 1991, ‘agile’ focuses on increasing system responsiveness to customers
through improved resource coordination and flexibility, by redesigning organizational structures,
information systems, logistics processes, and management decision heuristics.
Agile has recently been suggested as a means to improve healthcare service delivery (Vries &
Huijsman, 2011), but specific practices or policies to increase 'agility' have not been developed
for service chains, including healthcare. Moreover, the comparative effectiveness of individual
agile practices is unknown, as are the trade-offs created by individual agile practices on cost,
service access, and service quality. While theoretical agile concepts seem perfectly suited for
improving the management of complex healthcare organizations faced with inherently variable
demand, practical implementation remains challenging.
We seek to determine how agile principles can be operationalized in healthcare redesign efforts
to address issues of patient access, service quality, and cost control. The research questions to be
answered in this paper are:
What are key agile operational plans or practices (structural changes to process or
information flows or management decision-making) that can be applied or adapted to
improve performance of healthcare service delivery chains?
How do these different agile-derived practices impact cost, quality, and access to services
under unpredictable, variable demand?
To this end, we uncover operational plans from agile and service supply chain literature, then
using system dynamics modeling, examine the effectiveness of these operations-level changes in
simulation in a generic healthcare service chain. We present our findings as guidelines
healthcare managers and policy makers to improve system performance through adopting agile
practices. This study opens a new area for service supply chain management research and
provides recommendations for future empirical field tests.
The paper is organized as follows. Section 4 briefly details the current trends in increasing
healthcare delivery complexity, difficulty with demand and supply synchronization, and resultant
service quality and patient safety impacts. In section 5, an ‘agile’ literature review and summary
of current knowledge gaps are presented. Sections 6 and 7 report the methodological approach
Rust 124
and formal mathematical conceptualization of the healthcare service chain and agile strategies,
respectively. Section 8 is devoted to describing performance measurement and ‘base case’
simulation analysis. In Section 9 the experimental design is presented and results are discussed.
Finally, Section 10 provides the conclusions.
3-3. Problem Description
With the growing complexity of healthcare, providers are increasingly dependent on sharing care
delivery activities with other, specialized healthcare professionals to provide adequate patient
care. Patients are now treated in service chains or service networks that combine interventions
into serial encounters with specialized providers and link theses encounters into clinical
pathways. Moreover, the redesign of hospital services and the implementation of integrated care
programs are frequently cited as being critical strategies to decrease resource utilization and
improve healthcare quality (Aptel and Pourjalali, 2001). Clearly, from both a theoretical and
practical point of view, the health service operations are in the process of changing significantly.
However, the variability and unpredictability inherent to healthcare demand and internal
operations render this network approach to care delivery difficult to manage (Li et al, 2002).
Individual patient cases are variable and work cannot always proceed according to schedule or
plan. New developments in a patient’s condition, unexpected diagnostic findings or surprising
reactions to medication may call for sudden changes in planned processes with ripple effects
throughout the service supply chain. The growing interdependence of healthcare delivery,
coupled with pressure to reduce costs and serve greater numbers of patients, makes these
delivery chains increasingly difficult to manage and coordinate.
There is also evidence of healthcare service chain generate internal increased demand variability.
Similar to the ‘bullwhip effect’ (Forrester, 1958, 1961; Lee et al, 1997) in manufacturing,
research on healthcare service chains has identified structural tendencies toward demand
amplification as a key cause of supply chain stress, and leads to reduced access to services (as
measured by the distribution of service delivery time), and subsequent degradations in service
quality and increasing employee fatigue. Even with significant external variation, internal
variation is clearly introduced by system structure and dynamics. For example, a case study
conducted in a 127 bed hospital in Uttar Pradesh, India revealed dynamic system behavior
equivalent to the bullwhip effect (Sameul et al, 2010). The bullwhip effect was similarly
identified in the a study of a UK hospital: Based on interviews with hospital staff and data from
hospital's EHR system, analysis of emergency patient arrivals and discharges revealed
amplification of demand variability downstream in the service chain (Walley, 2007). In this
case, distortions in demand clearly led to performance degradation, as downstream services
reported reduced resource availability and greater probability of exceeding desired utilization
and occupancy rates. These are similar consequence to the effects seen in manufacturing
Rust 125
systems, where the bullwhip effect has been a suggested cause for increasing stock-outs and
higher costs. A study of a large hospital in Australia also directly identifies the bullwhip effect
in the patient pathway for elective surgeries (Sethuraman & Tirupati, 2005). The increasing
variation in demand for services as elective patients move to downstream clinics creates the need
to make more beds available in post-operative care wards than indicated by the initial demand.
On peak days, when the bullwhip effect causes the number of elective surgeries to be artificially
high, there is a shortage of beds in the patient wards, which restricts the number of surgeries and
reducing the theater utilization and hospital throughput on subsequent days. Demand for nursing
services is directly affected by higher variability, resulting in higher labor costs. Higher demand
variation amplification is also associated with increased dependence on part-time or temp agency
staff. Increasing demand variability inside the patient care pathway generally results in greater
stress on employees, higher operating costs, and lower hospital revenues.
There is mounting evidence that the US healthcare system has difficulty matching supply of
services to patient demand, coordinating transfer of patients between providers in healthcare
service chains, and managing demand variability. Each of these issues adversely affects care
quality and patient health outcomes. Kane et al (2007) find that the mismatch between resources
and peaks in demand is the major source of provider fatigue and reduced quality of care in most
healthcare services. With the management systems currently in place, this variation leads to
mistakes in care delivery and increased patient safety risks. Specifically, the stresses placed
upon a healthcare system by variability have been found to lead to more medication errors,
hospital-acquired infections, sicker patients, and are a leading cause of adverse patient outcomes
(Needleman et al, 2002; Berens, 2000; Pronovost et al, 1999).
Studies of variation in the patient to provider ratio, a key measure of service supply chain
coordination, find that variability is the norm in healthcare services (De Vries et al, 1999).
Higher patient to provider ratios have been correlated with increased patient mortality and
failure-to-rescue (deaths following complications) rates within 30 days of admission (Aiken et al,
2002). Large, multi-state studies frequently report inverse relationships between the number of
nurses per patient and common nosocomial complications, such as urinary tract infections,
pneumonia, thrombosis, and pulmonary compromise (Kovner & Gergen, 1998). Ensuring that
the proper supply of care resources can be synchronized to meet the peaks and troughs of
demand is clearly of critical importance to providing cost-effective, high-quality healthcare.
The common management practice in healthcare is to accommodate fluctuations in demand with
‘mandatory’ overtime. Driven by the need to maintain competitive advantage and minimize
costs, the common practice in healthcare is to set staff levels equal to the average demand for
services as opposed to setting staff to accommodate peak demand (Litvak et al, 2005). Although
such staff management strategies help to reduce labor-related costs, this staffing trend leads to
the undesirable consequence of care units being increasingly understaffed during periods of peak
Rust 126
demand, which limits their ability to match services with patient demand. This results in the use
of excessive overtime as a management solution to demand variability. Excessive overtime is a
pervasive problem in healthcare; for example, in a national survey of hospital staff nurses, more
than one-quarter of respondents reported working unpredictable, ‘mandatory’ overtime during
the 28-day study period (Rogers et al, 2004). A more recent survey of critical care nurses
reported that over 60% worked ten or more overtime shifts during the 28-day study period (Scott
et al, 2006). This capacity management trend leads to higher turnover rates (some estimates of
nurse turnover rates in the US are as high as 20% per year, see Hayes et al, 2012), which leads
hospitals to incur excessive training costs and to lower average staff experience levels.
Excessive ‘mandatory’ overtime is also one of the key drivers of increased provider fatigue and
error rates, further reinforcing the argument that current healthcare management strategies need
improvement, and currently contribute to patient safety risk and deterioration in quality of care.
These reported pressures and adverse feedbacks to care quality all indicate that current service
supply management strategies are failing in healthcare. The healthcare sector is far behind other
industries with respect to successful service supply chain management. As currently managed,
the average healthcare delivery system exposes patients to unnecessary risk and provides sub-
optimal use of system resources and personnel. However, with healthcare expenditures currently
18% of GDP and climbing, hospitals cannot return to past practices of setting staff levels based
on peak demand; nor, with the near-exponential increase in the number of clinical trials and the
medical evidence-base (NIH, 2013), can they effectively simplify care delivery. Healthcare
managers need new service management strategies to be able to respond effectively to changes in
patient demand and to mitigate the adverse effects of demand variability on patient care.
Other sectors are able to harness the insights developed by industrial supply chain management
research, where firms have faced similar challenges of demand variability and the need
for increasing supply chain integration. With minimal abstraction, it is possible to align most
healthcare service performance improvement or care coordination questions with those from
industrial supply chain management, mostly relating to how a high resource utilization can be
matched with a high customer service level. Recent empirical studies show that a significant
portion of the costs associated with service chains in the health care sector could be reduced by
implementing effective supply chain management principles (Burns, 2000; Dacosta-Claro, 2002;
Oliveira & Pinto, 2005). The current discourse in the service supply chain management
literature supports the assumption that existing concepts, models and supply chain management
practices can be extended to service chain management in health services (Vries & Huijsman,
2011). The healthcare managers should be able to benefit from the lessons learned in the
industrial sector.
However, improving healthcare service delivery chains cannot be done by simply transferring
product and manufacturing knowledge and models (Ellram et al, 2004; Sengupta, Heiser &
Rust 127
Cook, 2006). Service chain management in a healthcare setting is characterized by some unique
features, which make it difficult to apply knowledge gleaned from the industrial sector to the
healthcare sector in a direct way. The unpredictable, stochastic demand for services, individual
patient attributes driving the need for customized services, the inability to maintain physical
buffers of finished inventory, the inherent uncertainty in the duration of care processes, and other
distinctive characteristics of health service operations impede a straight forward application of
industrially-oriented supply chain management practices. In practice, Bohmer (2009, p.
16) finds that “many of the approaches and tools drawn from industrial settings fail to adequately
account for the residual uncertainty in medical care or explicitly address the experimental nature
of much care.” Most manufacturing-based supply chain management paradigms, such as 'lean,'
Total Quality Management, or Six Sigma do not function effectively in systems with high levels
of inherent process variability and demand uncertainty (Lee, 2004), but it is precisely these
context-defining characteristics that cause most of the present difficulties in healthcare service
integration and care coordination.
Service chain management in a healthcare context is very much an emerging field, and has not
yet identified how to overcome these contextual difficulties, nor has the field identified a service
chain management paradigm suited to the healthcare context. Subsequent questions of how
service delivery integration and coordination of care systems regarding patient flows and
resource management can be best achieved operationally still are a relatively unexplored area of
service supply chain management, and starting from this question there are only limited
academic studies addressing the challenges unique to the healthcare setting (Vries & Huijsman,
2011). Most service supply chain management research is still theoretical or conceptually-
focused as opposed to operational in nature (Sampson & Froelhe, 2006), currently providing
little to aid managers in the midst of redesigning their systems and integrating care processes.
Healthcare managers face a significant gap in knowledge around the optimal design and
management of complex care delivery systems that ensure effective patient care.
If the current trend to integrate patient care through increasingly complex provider networks
continues, then matching supply and demand throughout the healthcare service chain will
become increasingly difficult. As a result, both patients and providers will suffer. Hospital
managers need insight from service management researchers that directly address the problems
arising from the variability and complexity of demand within a hospital and coordination issues
between healthcare units. They require guidance on decision structures and designs of service
chains that create the flexibility necessary for the dynamic nature of health itself and which
enhance the effectiveness and efficiency of care delivery in the face of complexity. Service
supply chain scholars need to identify and develop a new service management paradigm that
accommodates the uncertainty and variability inherent to healthcare, specifically to conduct
operations-level research to improve the design and management of healthcare service chains.

Rust 128
3-4. Literature Review
There is one supply chain management paradigm that does address the context issues which
separate most healthcare operations from those in industrial or manufacturing settings. 'Agile' is
a manufacturing paradigm, coined by researchers at the Iacocca Institute at Lehigh University in
1991, that describes the strategies they observed as crucial to enterprise success in environments
of rapid and unpredictable change (Iacocca Institute, 1991; DeVor et al., 1997). In essence, an
agile manufacturing system is one that is capable of operating profitably in a competitive
environment of continually and unpredictably changing customer opportunities (Goldman, et al.
1995). Similarly, Gunasekaran (1998) defined 'agility' in manufacturing as the capability to
survive and prosper in a competitive environment of continuous and unpredictable change by
reacting quickly and effectively to changing markets, driven by customer-designed products and
services. An ‘agile’ organization as one that able to compete successfully within a state of
dynamic and continuous change (Sarkis, 2001), through efficiently changing operating states in
response to uncertain and the changing demands placed upon it (Narasimhan et al. 2006).
‘Agile’ is more than a description of an ideal supply chain. Many manufacturing companies
have experienced high costs associated with holding excess inventories as consumer preferences
change, or incurring stock-outs and decreased to market share in times of unanticipated demand,
and have followed agile principles to re-designed their supply chains to better accommodate such
demand volatility, resulting in increased revenues and market share (see Lee, 2004 for
discussion). There are academic journals dedicated to the advancement of theory and practice of
agility in manufacturing systems (e.g., International Journal of Agile Management
Systems). Harvard Business School has published case studies highlighting the principles of
agile manufacturing (1991). Since its inception, the agile paradigm has had a profound impact
on the design and management of manufacturing systems facing the same problems that
healthcare currently faces: the need to integrate and coordinate disparate units in a delivery
chain, all in the face of unpredictable, volatile demand.
In an operational sense, agile is a set of strategies that solves the problem of demand uncertainty
and variability through increasing system flexibility (Lee, 2004). It encompasses re-design of
organizational structures, information systems, logistics processes, and management decision
heuristics, all to achieve timely and effective response to rapidly changing demand environments
(Christopher & Towill, 2002). Agility involves increasing the capability to quickly identify
shifts in market demands or external supply disruptions and execute new, unplanned activities in
response (Brown & Bessant, 2003; Prince & Kay, 2003; Sharifi & Zhang, 2001).
There are four commonly agreed upon distinguishing operational characteristics of agile supply
chains (Harrison et al., 1999; Christopher, 2000), as outlined in Figure 31. They are highly
market sensitive; capacity adjustment decisions are driven by demand information; planning is

Rust 129
centralized, not left up to individual units; and processes and performance management are
integrated across all units in the chain. Each is discussed in detail below.
Figure 31. Characteristics of agile supply chain (modified from Harrison et al., 1999).
First, market sensitivity means that the supply chain is capable of reading and responding to real
demand in real time. This is a direct contrast to most organizations, where long production times
and logistical delays tend to require they be forecast-driven rather than demand-driven. A key
operational requirement of agile supply chains is to be able to quickly change production
resources to respond to real-time demand data. Agile supply chains often make use of
information technology systems to capture and share data on demand quickly throughout the
entire supply chain (Harrison et al., 1999).
Christopher (2000) suggests that, to be truly ‘agile,’ the use of information technology to share
data between partners in the supply chain must be taken farther, in effect, creating a virtual
supply chain, defined as a supply chain that is information based rather than inventory based.
This does not imply simply reducing physical inventory; instead of coordinating flows of
physical goods, agile organizations must acquire the capability to coordinate production capacity
(Lee, 2004). Shifting to information based supply chain coordination means that all elements in
the chain act upon the same data, i.e. real demand, rather than being dependent upon the distorted
information that emerges when orders are transmitted from one step to another in an extended
chain (Argawal et al, 2007). Without being subsumed under the agile paradigm, research into
the phenomenon of demand variation amplification (the ‘bullwhip effect’) has shown that this

Rust 130
operational strategy improves supply chain performance, in terms of reducing risk of stock-outs,
reduced ‘phantom’ demand, and decreased average costs (Croson & Donohue, 2003; Chen et al,
2000).
This shared information between supply chain partners can only be fully leveraged through the
third key characteristic of agile supply chains: centralized planning, meaning the collaborative
design and implementation of cooperative management structures. Operationally, centralized
planning requires disparate units in the production chain to make management decisions and set
performance goals to maximize performance of the total chain, not the performance of each
individual production unit. Each unit must take the adjacent units into consideration when
making production decisions. Central planning creates a shared systems perspective and ensures
the appropriate incentives structure is in place to lead to maximizing overall performance
(Cannella & Ciancimino, 2010; Cachon & Fisher, 2000). Operationalizing this aspect of agility
has been shown to improve visibility of production requirements and reduce the amount of stock
(or production capacity) held in anticipation of predicted and often distorted demand (Hewitt,
1999).
This idea of the supply chain as a confederation of partners linked together through a network of
continuous collaboration leads to the fourth ingredient of agility. More than cooperation on
strategic planning and goal-setting, process integration implies cooperation between production
units on production activities themselves. There is a broad assortment of operational plans
supporting the concept of process integration in the literature. Examples range from the co-
design of new products, so design accommodates both end-user preferences and factory and
production constraints; to the most extreme manifestation of direct sharing of production and
management resources between production units (Lee, 2004).
Some of these individual operational plans have been tested through the simulation of generic
service chains, even if not directly subsumed under the paradigm of ‘agile.’ Most of these
simulation studies inadvertently target market sensitivity. Anderson et al (2005) explore the
effects of increased market sensitivity through changing in service capacity adjustment decision-
making times, finding that decreasing decision delays leads to improvement in overall supply
chain performance. Lee et al (2010) examine the effect of supplementing demand data with
information on the derivative of changes in demand. Their results are mixed, finding that with
optimal control schemes it was possible to halve the costs associated with demand variation
amplification, but that including derivative-based information could also lead to increasing
oscillations in some scenarios.
The other operational strategy tested in simulation is virtual integration, with Anderson and
Morrice (2000) assessing the effect of sharing end-customer demand data in real time in a
simplified service chain. As is commonly reported in manufacturing settings, they found that

Rust 131
incorporating end-customer demand data with local demand data in individual service unit
decision making led to increased performance, both in terms of total reduced costs and improved
service delivery times. Although not directly discussed, their work also reveals the necessity of
centralized planning in service chains. The parameter set that created their lowest-cost, highest-
performance scenario would have been unsustainable without centralized planning, as costs were
not shared equally across service units. If individual units made decisions only to maximize their
own performance, the service chain would never be able to implement this optimal scenario.
Cooperating to redistribute the costs and benefits of service delivery redesign seems crucial to
the ability to achieve optimal performance.
There is also some anecdotal empirical evidence supporting the use of agile strategies in
healthcare service delivery chains. Service chain integration is becoming more prevalent in
healthcare, as team-based care models (e.g., the Patient Centered Medical Home, or PCMH) are
becoming standardized. As of 2007, an estimated 27% of primary care practices follow some
elements of the PCMH model, where disparate elements of the health care system (e.g.,
subspecialty care, hospitals, home health agencies, nursing homes) and the patient’s community
(e.g., family, public and private community-based services) are coordinated through a patient’s
primary care provider (Beal et al, 2007). There are a few reports suggesting that these changes
lead to better care quality, reduced errors, and increased patient satisfaction (Rosenthal, 2008),
with one recent study of a Seattle health system demonstrating 29% fewer emergency visits, 6%
fewer hospitalizations, and total savings of $10.30 per patient per month over a twenty-one
month period (Reid et al. 2010). Health services are also moving toward virtual integration as
well, with the recent mandate to create health information exchange, which will provide the
capability to electronically move clinical information among disparate healthcare information
systems (HITECH, 2009). All this suggest that agile strategies have promise in the healthcare
context and should be further explored.
The question how to best integrate agile strategies into healthcare is an uncovered field in the
area of supply chain management, and has only most recently been suggested. The November
2011 special issue on healthcare of the international journal Supply Chain Management
highlights the need for in-depth research into the strengths and weaknesses of the agile
management paradigm in the context of health services. There are clear gaps in knowledge of
the application of agile strategies, namely: What are the clearest translations of agile strategies
into operational plans applicable and feasible in healthcare service delivery? How do they
compare to each other in effectiveness, as defined as the ability to increase total service chain
flexibility and mitigate the adverse effects of demand volatility? Do agile strategies need to be
implemented as a bundle to be effective, or are they effective at creating service chain flexibility
when implemented separately? Answering these questions to further the adaptation and use of
agile strategies to healthcare could contribute significantly to the broader field of patient logistics
and the improvement of healthcare service management.
Rust 132
3-5. Methodology/Approach
The literature on supply chain analysis is rich with classifications of methods used to investigate
supply chain performance and the effects of demand variation (Riddalls et al, 2000; Kleijnen &
Smits, 2003; Dejonckheere et al, 2004; Disney et al, 2004; Geary et al, 2006; Towill et al, 2007;
Disney & Lambrecht, 2008). Riddalls et al. (2000) submit that the choice of which methodology
is most appropriate is determined by decision-making level under consideration, commonly
divided into 1) the local, tactical level for day-to-day decision making, and 2) the implication of
strategic design on supply chain performance and overall network functioning. Holweg and
Disney (2005) recommend the latter category be analyzed using methods based on the dynamics
of the system in question. They recognized three distinct and methodologically independent
research domains: continuous time differential equation models, discrete time difference
equation models, discrete event simulation systems.
The choice of methodological approach adopted in this paper is based on the need to explore the
dynamic interaction effects of various operational plans, and to develop a general understanding
of their inherent dynamics when applied in a healthcare service chain. We adopt a continuous
time approach, namely system dynamics simulation modeling. The service chain and governing
decision heuristics are modeled through first-order nonlinear differential equations. The formal
mathematical expressions of the system are reported in the next section. We have not used
discrete-event simulation (DES) or stochastic modeling (of variables like ‘patient inflow' or
‘treatment time') because our primary objective is not to quantify numerical results for one
specific healthcare delivery chain, but to understand and illustrate to healthcare managers the
deterministic behaviors of healthcare delivery systems in general. The use of continuous, as
opposed to discrete, flows in the model is a reasonable approximation of the perpetual
adjustments (hiring and firing) necessary in the management of service organizations, and is a
common method for abstracting these systems in both operations management and supply chain
management research (Sethi & Thompson, 2000). For an in-depth discussion of the trade-offs
and appropriate problems for using system dynamics or DES see Tako and Robinson (2009) and
Kleijnen (2005).
System dynamics is an appropriate chose for modeling healthcare systems, as it encourages both
a systemic view of the interactions of patient flows and information, and a strategic perspective
on the management of healthcare delivery systems. System dynamics modeling has been used to
address several healthcare related problems and has resulted in about 1500 publications since
1991 (Brailsford 2008). Dangerfield (1999) reviews system dynamics modeling in healthcare
and concludes that the method can be used effectively in quantitative ways when based on
simulation models. Examples of modeling efforts range from the use system dynamics
simulation to analyze the reasons for the failure of management interventions in cardiac
catheterization services (Taylor & Dangerfield, 2005), to the improvement of acute patient flows
in the UK National Health Service (Lane & Husemann, 2008). With the trend toward care

Rust 133
integration across complex networks of activities and specialties, system dynamics offers a
rigorous approach for understanding the strengths and weaknesses of that new
interconnectedness. A general discussion of the role of system dynamics in analyzing healthcare
systems can be found in Taylor and Lane (1998).
The use of system dynamics to understand the dynamics of healthcare service delivery builds on
a rich history of developing insights into supply chain management. Forrester (1961), the creator
of system dynamics, laid the foundations for the use of the continuous time approach towards the
study of supply chain dynamics. Later, the work on ‘beer game’ simulation (Sterman, 1989)
ushered a new era in supply chain management research into understanding how micro-level
decision structures, bounded rationality, and misperceptions of system feedback cause macro-
level behavior (Cannella & Ciancimino, 2010). Subsequent system dynamics-based research in
service supply chains has led to knowledge of how the defining phenomena of services, for
example, the intangibility of services and the simultaneous interaction of customer and service
provider, affect system behavior.
This paper builds on a thread started by Oliva and Sterman’s (2001) simulation study of a single-
stage service process, as well as Anderson’s (2001a, 2001b) analytical models of similar issues.
It relates to research on managing service chain dynamics (such as the ‘bullwhip’ effect),
information sharing, and coordination of management decision making (e.g., Lee et al, 1997;
Chen, 1998, 1999). Anderson and Morrice (1999, 2000) first consider a multi-stage service
system in their model of the mortgage service industry, and start the exploration of the impact of
resource acquisition delays on demand variation amplification. In their case study of a European
telecom firm, Akkermans and Vos (2003) use a similar model to develop insight into the
interdependence between workload, work quality and variation amplification. However, their
model is highly context specific and the analysis space is limited by the narrow set of policy
options available to the firm’s management. Perhaps the most closely related research exists in
the linear programing work Anderson et al. (2005, 2006), which uses a relaxation of a system
dynamics model to evaluate the structural causes of, and counter-measures to, demand
amplification in a generic service chain. Such uses of system dynamics have been cited as "clear
exceptions" to what is normally described as the "forced and unclear" application of supply chain
management modeling methods to services (Sampson & Froehle, 2006, p.337).
3-6. Model Design
The healthcare service chain we model here is an abstract representation of a broad spectrum of
possible healthcare delivery networks. The purpose of the model is to capture the essential
elements of reality common to most healthcare delivery chains rather than perfectly simulate one
specific service. Our delivery chain consists of three stages, the three most clearly defined stages
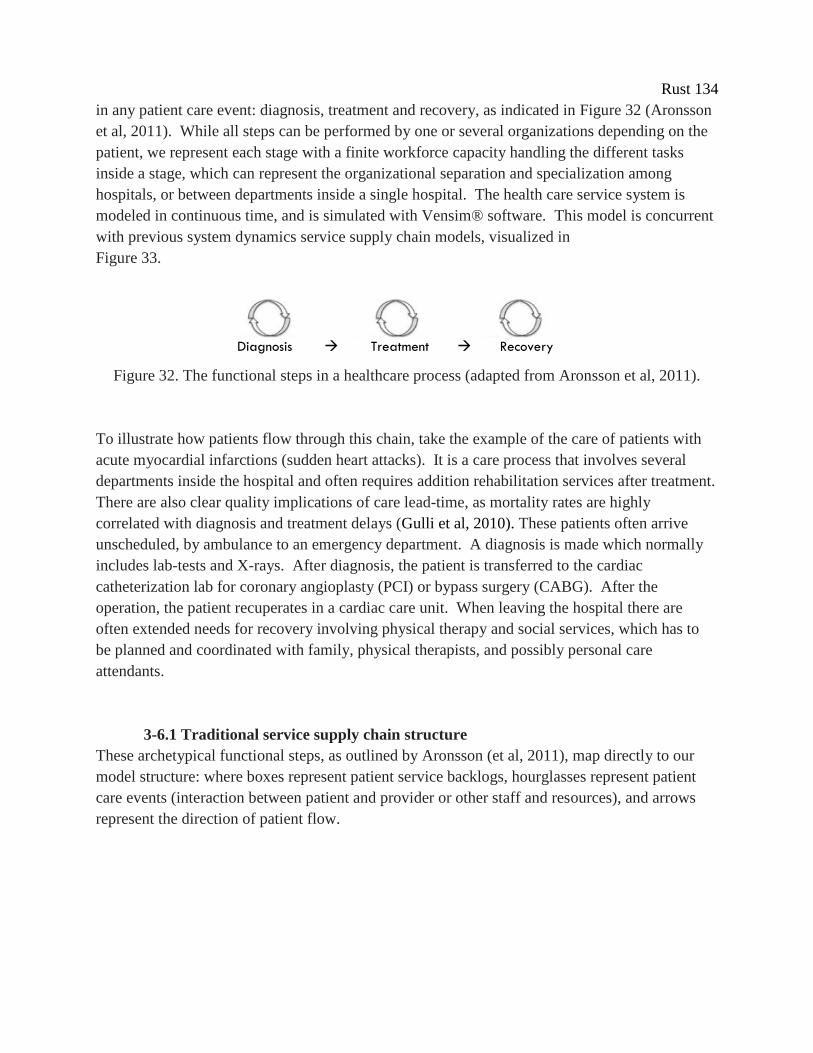
Rust 134
in any patient care event: diagnosis, treatment and recovery, as indicated in Figure 32 (Aronsson
et al, 2011). While all steps can be performed by one or several organizations depending on the
patient, we represent each stage with a finite workforce capacity handling the different tasks
inside a stage, which can represent the organizational separation and specialization among
hospitals, or between departments inside a single hospital. The health care service system is
modeled in continuous time, and is simulated with Vensim® software. This model is concurrent
with previous system dynamics service supply chain models, visualized in
Figure 33.
Figure 32. The functional steps in a healthcare process (adapted from Aronsson et al, 2011).
To illustrate how patients flow through this chain, take the example of the care of patients with
acute myocardial infarctions (sudden heart attacks). It is a care process that involves several
departments inside the hospital and often requires addition rehabilitation services after treatment.
There are also clear quality implications of care lead-time, as mortality rates are highly
correlated with diagnosis and treatment delays (Gulli et al, 2010). These patients often arrive
unscheduled, by ambulance to an emergency department. A diagnosis is made which normally
includes lab-tests and X-rays. After diagnosis, the patient is transferred to the cardiac
catheterization lab for coronary angioplasty (PCI) or bypass surgery (CABG). After the
operation, the patient recuperates in a cardiac care unit. When leaving the hospital there are
often extended needs for recovery involving physical therapy and social services, which has to
be planned and coordinated with family, physical therapists, and possibly personal care
attendants.
3-6.1 Traditional service supply chain structure
These archetypical functional steps, as outlined by Aronsson (et al, 2011), map directly to our
model structure: where boxes represent patient service backlogs, hourglasses represent patient
care events (interaction between patient and provider or other staff and resources), and arrows
represent the direction of patient flow.
Diagnosis Treatment Recovery

Rust 135
Triage Admission Recovery
PatientArrival
PatientDiagnosis
PatientTreatment
PatientDischarge
adsfl;kjadadsfl;kjad 0
Figure 33. A generic multi-stage healthcare service delivery model
While clinics in our service chain are obviously linked, as the output of one clinic forms the
input to the next, each clinic in our model operates autonomously, as management decisions are
based only on the information available inside each clinic. Each clinic has sole responsibility for
operational performance and control of its own resource actions, i.e., acquiring and releasing
workforce. Each clinic requires a separate set of resources to serve its patient backlog; no
resources are shared between clinics. Resource sharing may be possible in some healthcare
service chains, depending on the specifics of a particular care process, but the high level of
specialization and the complexity of healthcare ensure that resource sharing is not the norm. For
simplicity, we assume that there are no dropped or lost patients and all of the patient care events
in a backlog are eventually concluded.
Each of the three clinics is identical, with a finite capacity for patient care, derived from the
number of providers working in that clinic. Each clinic’s implicit goal is to keep service
performance at a desired level (measured in average service time), while keeping service
capacity costs to a minimum. While this structure is far from optimal, it is a realistic
representation of the common ‘staff to demand’ heuristic found currently in most hospitals and
health care centers (Litvak et al, 2005).
A more specific stock and flow model of one representative clinic is presented in Figure 25,
graphically displaying the three control loops fundamental to clinic management: one to prevent
number of customers waiting for service from going negative (the Work Availability loop), one
representing manager's decisions to add or remove providers from the clinic schedule to balance
workforce with demand (the Capacity Management loop), in which is embedded the manager's
decisions comparing current workforce with desired workforce to achieve desired service
capacity (the Meeting Workforce Goal loop). The formal mathematical details are described
below, and the full set of model equations and parameters is included in Appendix E.
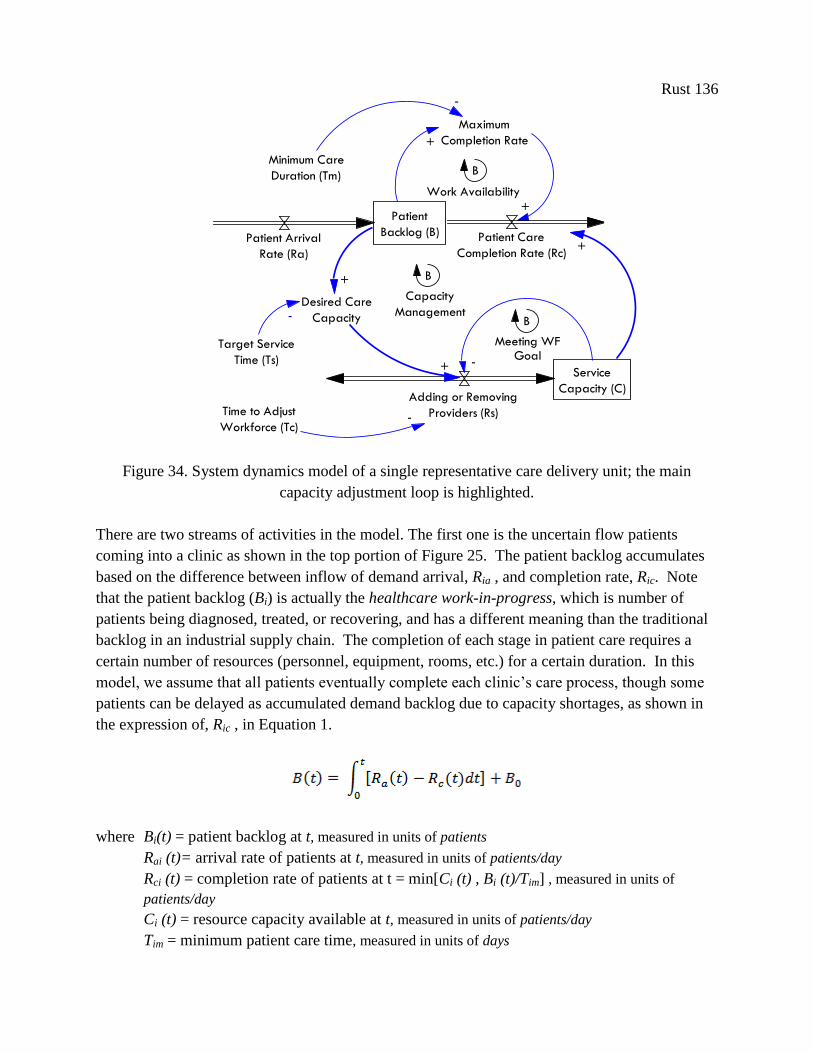
Rust 136
Patient
Backlog (B)Patient Arrival
Rate (Ra)
Patient Care
Completion Rate (Rc)
Adding or Removing
Providers (Rs)
Maximum
Completion Rate
B
+
+
Time to Adjust
Workforce (Tc)-
Minimum Care
Duration (Tm)
-
Target Service
Time (Ts)
Desired Care
Capacity-
+
+ Service
Capacity (C)
-
+
Capacity
Management
Meeting WFGoal
Work Availability
B
B
a;lkjf a;lkjf 0
a;lkjf 1
Figure 34. System dynamics model of a single representative care delivery unit; the main
capacity adjustment loop is highlighted.
There are two streams of activities in the model. The first one is the uncertain flow patients
coming into a clinic as shown in the top portion of Figure 25. The patient backlog accumulates
based on the difference between inflow of demand arrival, Ria , and completion rate, Ric. Note
that the patient backlog (Bi) is actually the healthcare work-in-progress, which is number of
patients being diagnosed, treated, or recovering, and has a different meaning than the traditional
backlog in an industrial supply chain. The completion of each stage in patient care requires a
certain number of resources (personnel, equipment, rooms, etc.) for a certain duration. In this
model, we assume that all patients eventually complete each clinic’s care process, though some
patients can be delayed as accumulated demand backlog due to capacity shortages, as shown in
the expression of, Ric , in Equation 1.
where Bi(t) = patient backlog at t, measured in units of patients
Rai (t)= arrival rate of patients at t, measured in units of patients/day
Rci (t) = completion rate of patients at t = min[Ci (t) , Bi (t)/Tim] , measured in units of
patients/day
Ci (t) = resource capacity available at t, measured in units of patients/day
Tim = minimum patient care time, measured in units of days

Rust 137
Bi0 = initial backlog (patients in-progress) at t = 0, measured in units of patients
Note that patient backlog (Bi (t) and Bi0) is expressed in number of patients. Completion rate and
resource capacity (Ria , Rie and Ci ) are expressed in the number of patients per day, and
completion time (Tim ) is expressed in days. There is a minimum completion time even if
unlimited resources are available. With the minimum care completion time, adding more
resources past a certain level will not reduce the backlog, merely the resource utilization.
The second flow in the model is the flow of workforce as shown in the bottom part of the model
in Figure 34. The resource capacity available, Ci (t), accumulates based on the net capacity
discrepancy, ei (t), which is defined as the resource capacity needed to care for all patients in the
desired time, Cid(t), minus the resource capacity currently available, Cit-1(t), as shown in
Equation 2.
where Ci (t) = resource capacity available at t, measured in units of patients/day
ei (t) = the net capacity error = Cdi (t) - Ci (t-1), measured in units of patients/day
Cid(t) = resource capacity desired = [Bi (t)/ Tis ] , measured in units of patients/day
Ci (t-1) = resource capacity at pervious time step, measured in units of patients/day
Tis = target patient care service time, measured in units of days
Tic = delay for resource capacity change process, measured in units of days
Ci0 = initial capacity (providers) at t = 0, measured in units of patients/day
In the traditional service supply chain, any single clinic only receives information about patient
flow from the adjacent upstream clinic. Each clinic calculates the resource adjustment in any
given period, Cid(t), on the basis of local data and parameters (service capacity level Ci (t), delays
in the resource adjustment process, Tic) and on the desired service capacity. This desired service
capacity is, in turn, modeled as a rate of patients per day, calculated from the current patient
backlog and the desired care delivery time. The overall capacity adjustment decision is
moderated (divided) by the delays inherent to the resource capacity adjustment process, Tic,
which represent delays in decision making and the schedule modification process itself. The
denominator of Tic captures the first-order effect of capacity adjustment, and approximates reality
for all but extreme target capacity changes. Implicit in these equations is the assumption that one
unit of capacity is required to process one unit of patient backlog each day. This assumption can
be relaxed by scaling the capacity appropriately. Note that net resource adjustment rate, is
expressed in the number of patients per day per day, while the units of resource capacities, (Cid,
Ci(t-1), Ci0) are expressed in units of number of patients per day.
Rust 138
This capacity adjustment policy is derived both from the literature and from interviews
conducted with healthcare department chiefs and clinic managers. Anderson (1997) finds an
identical stock correction mechanism in custom machine tool industry, Anderson and Morrice
(2000, 2001) in a mortgage services company, Akkerman and Vos (2003) in a telecom company,
and Anderson et al (2005) in the service supply chains of an oil field development firm. While
not an optimal decision heuristic by any means, it is the rule most often used in practice in
service supply chain management. Note that the rule in Equation 2 is simpler than the standard
stock-adjustment rule found in manufacturing supply chain modeling (Sterman, 2000); we
believe this is justified because there is no significant supply line of capacity on order in this
system.
Health care service delivery chains are complex and require a great deal of coordination. Based
on its use in similarly complex fields, we believe this base structure is both abstract enough to be
generalizable across services, and structurally sound enough to yield insights into the dynamics
of healthcare service delivery management. We use it as a base upon which to test the adoption
of multiple agile-derived operational plans, each explained in detail below.
3-6.2 Agile operational plans
We identify specific operational plans from the literature on service supply chain management
which can be subsumed under the agile paradigm. This assembled set of plans covers all four of
the key characteristic of an agile supply chain: market sensitivity, information driven, centralized
planning, and process integration. Each is described in detail below; including the structural
changes to information flows and management’s decision heuristics, along with its mathematical
formulation.
3-6.2.1 Market Sensitivity
Despite its importance in manufacturing supply chain management research, increasing market
sensitivity is not directly discussed as such in the service supply chain literature. As a
conceptual framework of ‘agility’ has not yet been universally adopted (Li et al, 2008), there are
many meanings of the term market sensitivity depending on context and level of detail under
investigation. It could refer to the ability of a manufacturing chain to elicit and respond to
patient preferences in new product development (product characteristics), or the ability to
perceive, evaluate, and respond to changes in total demand with accurate adjustments to
production and inventory quotas (availability), or to identify the relative value of a product in the
market and adjust price accordingly (price). In general, market sensitivity is the ability to make
swift and appropriate decisions in reaction to changes in demand, in any of its dimensions.
Rust 139
For healthcare delivery, where patients have limited knowledge of the price and relative quality
of any given service or provider, the most significant dimension of demand, from a clinic
manager’s perspective, is total volume. We narrow our focus through defining market sensitivity
as the ability of a service chain to respond quickly to changes in demand for a given service with
accurate changes in service capacity in order to maintain an adequate level of service
availability. Including the price and service characteristics of patient demand are possible
extensions for future work, but are more apposite to the analysis of national healthcare policy
than improving healthcare delivery. With this definition, we find two operational plans in the
literature that address increasing market sensitivity. Both were first developed in manufacturing
and only recently tested (separately) in simulation in service supply chains.
The first focuses on the impact of increasing the speed of capacity adjustment decision making,
modeled as a reduction in the service capacity adjustment time, Tc. Analysis of mortgage service
simulations (Anderson & Morrice, 2000) suggest that decreasing service capacity adjustment
delays is one operational plan available to managers of individual clinics to improve the
responsiveness of their clinic to changes in patient arrival rates. In subsequent research,
however, they find reducing the equivalent of had mixed effectiveness, improving service
delivery (as measured by the variance in average service time), but increasing variance in
subsequent stages’ capacity stocks and backlogs (Anderson et al, 2005). A reduction in Tc could
be achieved through many operations-level changes, from increasing the frequency of
information gathering and analysis on the current patient backlog level, to streamlining the HR
process for hiring and firing, to improving the quality of training to reduce the training time for
new hires, to improving coordination between managers and employees over clinic schedule
changes. All would reduce Tc , and make the clinic more sensitive to changes in demand
volume.
The second focuses on improving the information used to make the capacity adjustment decision.
This operational plan captures emerging trends in demand volume, through including a measure
of the change in the patient backlog along with the actual size of the backlog itself. This
‘derivative control’ is common to physical manufacturing systems (temperature control, velocity
control, etc.), and is part of a standard engineering control algorithm called PID (Proportional,
Integral, Derivative Control), which is mainly used as a means to minimize the error between a
measured value and a target value, given the presence of adjustment delays (Axsater, 1985). Our
current decision equation falls under the domain of proportional control, where the rate of
capacity adjustment is a proportion of the error between the desired and the actual service
capacity. Fundamentally, a PID control algorithm improves basic proportional control in two
ways. Integral control creates a system memory of the accumulated error over any period of
time when error is being corrected, and adds that error to the correction itself, thus preventing
‘steady-state error.’ Derivative control increases the correction in response to rising error, thus
returning the system to its desired state faster that if the system responded proportion to the error
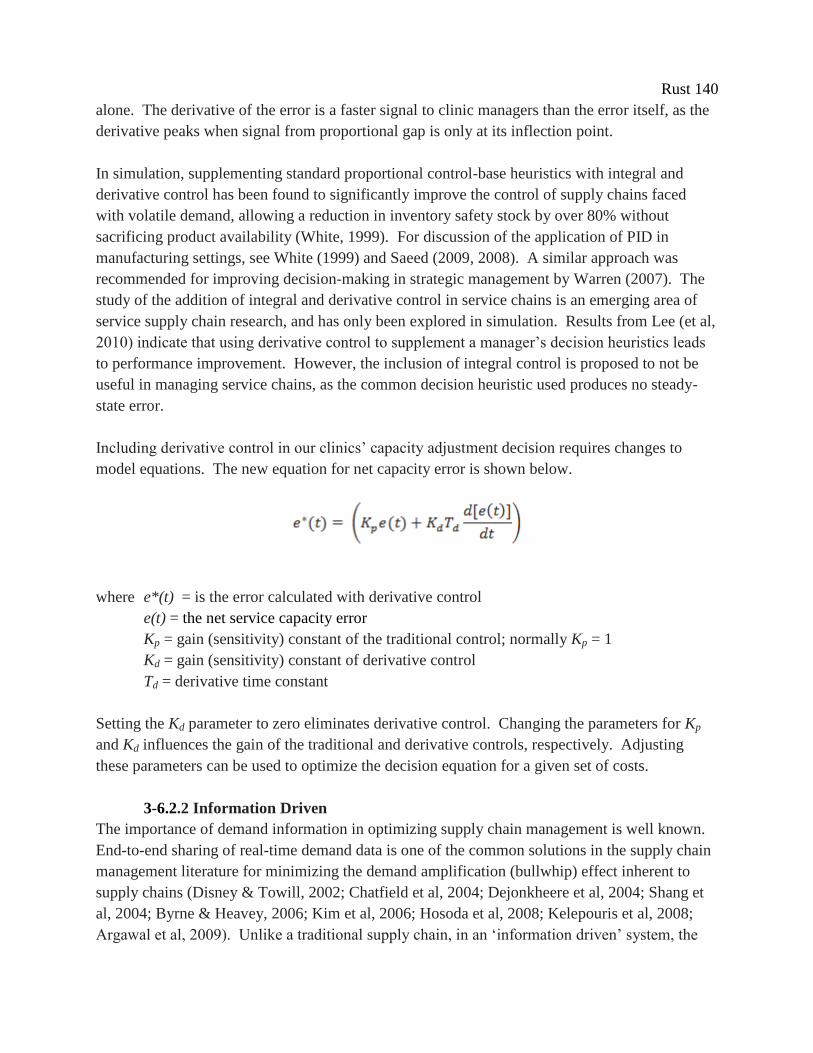
Rust 140
alone. The derivative of the error is a faster signal to clinic managers than the error itself, as the
derivative peaks when signal from proportional gap is only at its inflection point.
In simulation, supplementing standard proportional control-base heuristics with integral and
derivative control has been found to significantly improve the control of supply chains faced
with volatile demand, allowing a reduction in inventory safety stock by over 80% without
sacrificing product availability (White, 1999). For discussion of the application of PID in
manufacturing settings, see White (1999) and Saeed (2009, 2008). A similar approach was
recommended for improving decision-making in strategic management by Warren (2007). The
study of the addition of integral and derivative control in service chains is an emerging area of
service supply chain research, and has only been explored in simulation. Results from Lee (et al,
2010) indicate that using derivative control to supplement a manager’s decision heuristics leads
to performance improvement. However, the inclusion of integral control is proposed to not be
useful in managing service chains, as the common decision heuristic used produces no steady-
state error.
Including derivative control in our clinics’ capacity adjustment decision requires changes to
model equations. The new equation for net capacity error is shown below.
where e*(t) = is the error calculated with derivative control
e(t) = the net service capacity error
Kp = gain (sensitivity) constant of the traditional control; normally Kp = 1
Kd = gain (sensitivity) constant of derivative control
Td = derivative time constant
Setting the Kd parameter to zero eliminates derivative control. Changing the parameters for Kp
and Kd influences the gain of the traditional and derivative controls, respectively. Adjusting
these parameters can be used to optimize the decision equation for a given set of costs.
3-6.2.2 Information Driven
The importance of demand information in optimizing supply chain management is well known.
End-to-end sharing of real-time demand data is one of the common solutions in the supply chain
management literature for minimizing the demand amplification (bullwhip) effect inherent to
supply chains (Disney & Towill, 2002; Chatfield et al, 2004; Dejonkheere et al, 2004; Shang et
al, 2004; Byrne & Heavey, 2006; Kim et al, 2006; Hosoda et al, 2008; Kelepouris et al, 2008;
Argawal et al, 2009). Unlike a traditional supply chain, in an ‘information driven’ system, the
Rust 141
information flow consists of both the transmission of stages’ orders in the up-stream direction
and sharing information on market demand. Each stage remains autonomous and makes
decisions on production and distribution independently, but all stages make those decisions on
the basis of shared, global information. This prevents extreme internal demand variation
amplification, as each stage now has some understanding of real demand, not just local demand
from the downstream stage.
Expanding the data available to supply chain managers at each stage almost always leads to
lower costs and fewer stock-outs. The effects of sharing end-customer demand data in industrial
supply chains has been tested many times in simulation, under many constraining assumptions,
with all findings indicating that sharing end-customer demand data improves performance.
There are fewer results from analysis of real world data, but they also re-enforce this finding.
For example, Hosoda (et al, 2008) find that sharing ‘point-of-sale’ data in real-time between a
supermarket chain and a soft-drink manufacture reduced the holding and backlog costs incurred
by the manufacturer by 8-19%. In a similar study conducted in a Greek retail grocery company,
consisting of 250 retail stores and 7 central warehouses, Kelepouris (et al, 2008) find that
information sharing results in a 21% reduction in order variability and a 20% reduction in
average inventory. These, and other studies, confirm the value of shared information on end-
customer demand for mitigating the bullwhip effect and associated costs in physical supply
chains.
The usefulness of sharing end-customer demand data has not been empirically examined in
service supply chains, but has been explored in simulation. Anderson and Morrice (2000, 2001)
test the effect of sharing information on real demand with each stage in their mortgage services
chain, finding that adding this information to each stage’s decision heuristic does improve
performance. However, the use of end-customer demand data can create a trade-off between the
level of variation in patient backlog and in service capacity. Anderson (et al, 2005) assert that
the stages in a service chain can always decrease their backlog variation by paying more
attention to end-customer demand rather than local backlog, but only up to a certain point,
beyond which capacity variation will start to increase. Thus, information sharing can only lead
to limited improvements before creating a direct trade-off between customer service (variation in
patient wait times) and personnel costs (variation in capacity). The precise tipping points are
determined by the parameters of a process (for discussion, see Anderson et al, 2006). The
common strategy advocated for service supply chain scholars is to use a mix of both, rather than
completely relying on one or the other. Determining the optimal weights for both types of data
in management decision depends on the cost structure in a given service chain.
We change the ‘capacity management’ loop to include data on initial patient demand,
supplementing local patient backlog data. The first term represents the degree to which the
target capacity relies on the end-customer demand rate. The second term denotes how the target
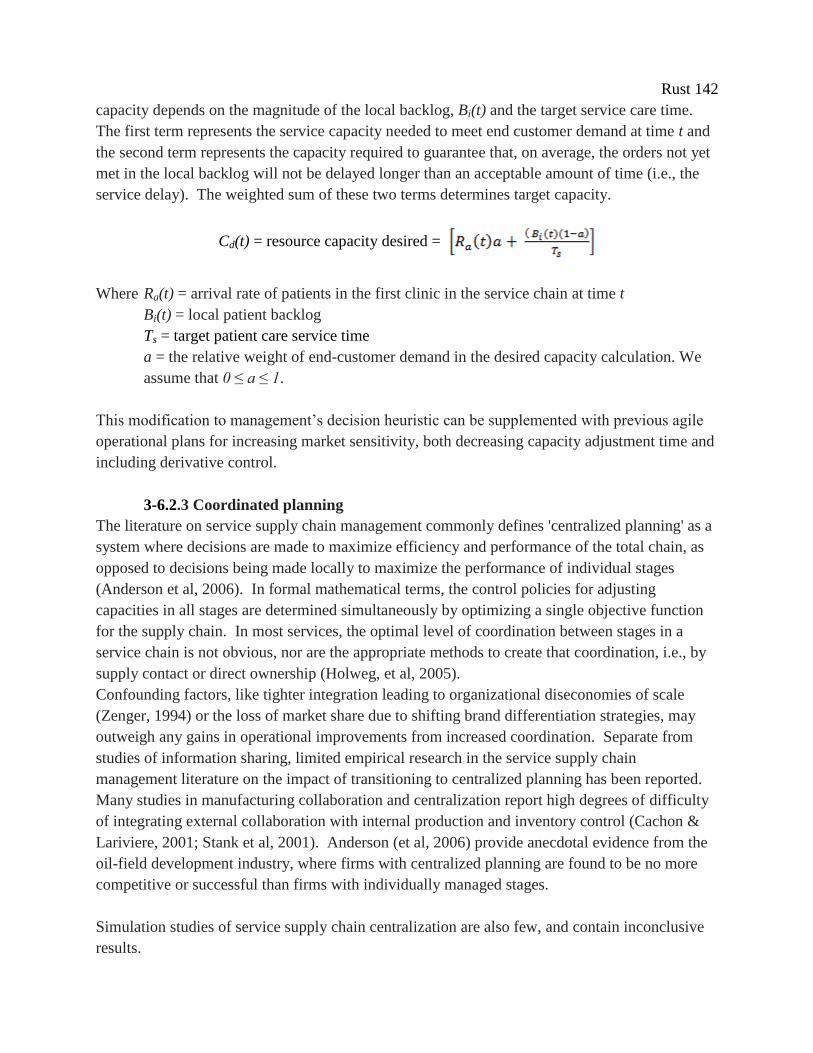
Rust 142
capacity depends on the magnitude of the local backlog, Bi(t) and the target service care time.
The first term represents the service capacity needed to meet end customer demand at time t and
the second term represents the capacity required to guarantee that, on average, the orders not yet
met in the local backlog will not be delayed longer than an acceptable amount of time (i.e., the
service delay). The weighted sum of these two terms determines target capacity.
Cd(t) = resource capacity desired =
Where Ra(t) = arrival rate of patients in the first clinic in the service chain at time t
Bi(t) = local patient backlog
Ts = target patient care service time
a = the relative weight of end-customer demand in the desired capacity calculation. We
assume that 0 ≤ a ≤ 1.
This modification to management’s decision heuristic can be supplemented with previous agile
operational plans for increasing market sensitivity, both decreasing capacity adjustment time and
including derivative control.
3-6.2.3 Coordinated planning
The literature on service supply chain management commonly defines 'centralized planning' as a
system where decisions are made to maximize efficiency and performance of the total chain, as
opposed to decisions being made locally to maximize the performance of individual stages
(Anderson et al, 2006). In formal mathematical terms, the control policies for adjusting
capacities in all stages are determined simultaneously by optimizing a single objective function
for the supply chain. In most services, the optimal level of coordination between stages in a
service chain is not obvious, nor are the appropriate methods to create that coordination, i.e., by
supply contact or direct ownership (Holweg, et al, 2005).
Confounding factors, like tighter integration leading to organizational diseconomies of scale
(Zenger, 1994) or the loss of market share due to shifting brand differentiation strategies, may
outweigh any gains in operational improvements from increased coordination. Separate from
studies of information sharing, limited empirical research in the service supply chain
management literature on the impact of transitioning to centralized planning has been reported.
Many studies in manufacturing collaboration and centralization report high degrees of difficulty
of integrating external collaboration with internal production and inventory control (Cachon &
Lariviere, 2001; Stank et al, 2001). Anderson (et al, 2006) provide anecdotal evidence from the
oil-field development industry, where firms with centralized planning are found to be no more
competitive or successful than firms with individually managed stages.
Simulation studies of service supply chain centralization are also few, and contain inconclusive
results.
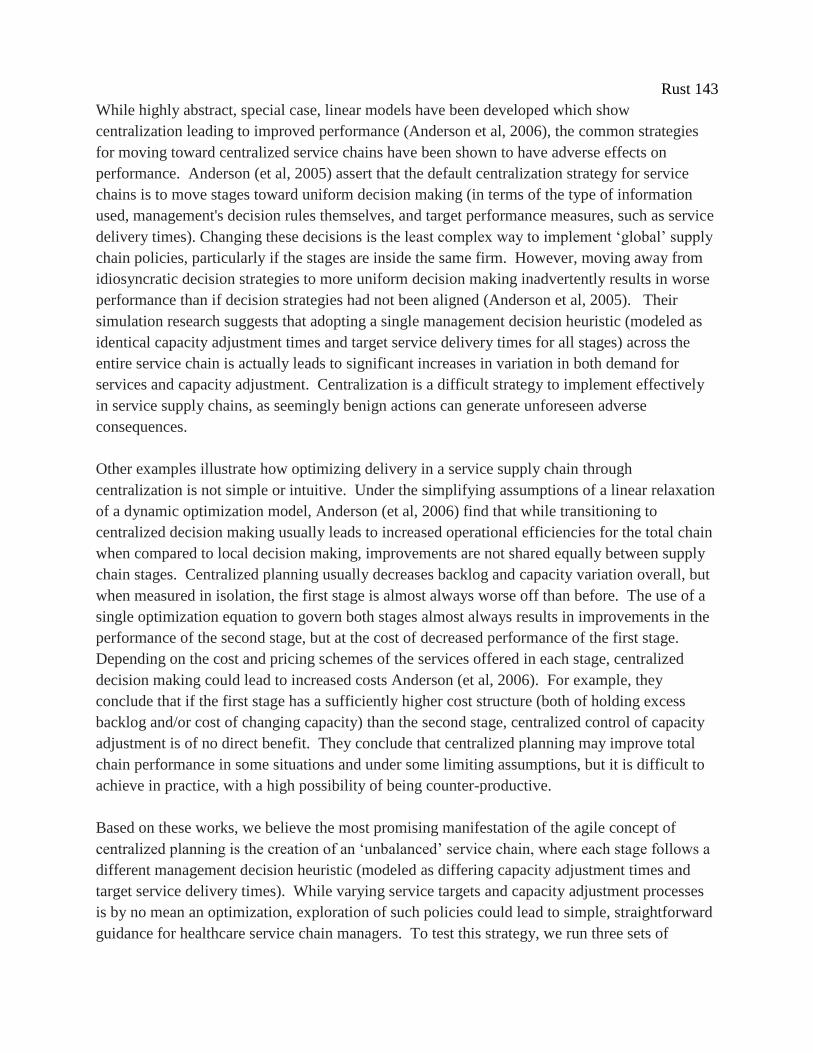
Rust 143
While highly abstract, special case, linear models have been developed which show
centralization leading to improved performance (Anderson et al, 2006), the common strategies
for moving toward centralized service chains have been shown to have adverse effects on
performance. Anderson (et al, 2005) assert that the default centralization strategy for service
chains is to move stages toward uniform decision making (in terms of the type of information
used, management's decision rules themselves, and target performance measures, such as service
delivery times). Changing these decisions is the least complex way to implement ‘global’ supply
chain policies, particularly if the stages are inside the same firm. However, moving away from
idiosyncratic decision strategies to more uniform decision making inadvertently results in worse
performance than if decision strategies had not been aligned (Anderson et al, 2005). Their
simulation research suggests that adopting a single management decision heuristic (modeled as
identical capacity adjustment times and target service delivery times for all stages) across the
entire service chain is actually leads to significant increases in variation in both demand for
services and capacity adjustment. Centralization is a difficult strategy to implement effectively
in service supply chains, as seemingly benign actions can generate unforeseen adverse
consequences.
Other examples illustrate how optimizing delivery in a service supply chain through
centralization is not simple or intuitive. Under the simplifying assumptions of a linear relaxation
of a dynamic optimization model, Anderson (et al, 2006) find that while transitioning to
centralized decision making usually leads to increased operational efficiencies for the total chain
when compared to local decision making, improvements are not shared equally between supply
chain stages. Centralized planning usually decreases backlog and capacity variation overall, but
when measured in isolation, the first stage is almost always worse off than before. The use of a
single optimization equation to govern both stages almost always results in improvements in the
performance of the second stage, but at the cost of decreased performance of the first stage.
Depending on the cost and pricing schemes of the services offered in each stage, centralized
decision making could lead to increased costs Anderson (et al, 2006). For example, they
conclude that if the first stage has a sufficiently higher cost structure (both of holding excess
backlog and/or cost of changing capacity) than the second stage, centralized control of capacity
adjustment is of no direct benefit. They conclude that centralized planning may improve total
chain performance in some situations and under some limiting assumptions, but it is difficult to
achieve in practice, with a high possibility of being counter-productive.
Based on these works, we believe the most promising manifestation of the agile concept of
centralized planning is the creation of an ‘unbalanced’ service chain, where each stage follows a
different management decision heuristic (modeled as differing capacity adjustment times and
target service delivery times). While varying service targets and capacity adjustment processes
is by no mean an optimization, exploration of such policies could lead to simple, straightforward
guidance for healthcare service chain managers. To test this strategy, we run three sets of
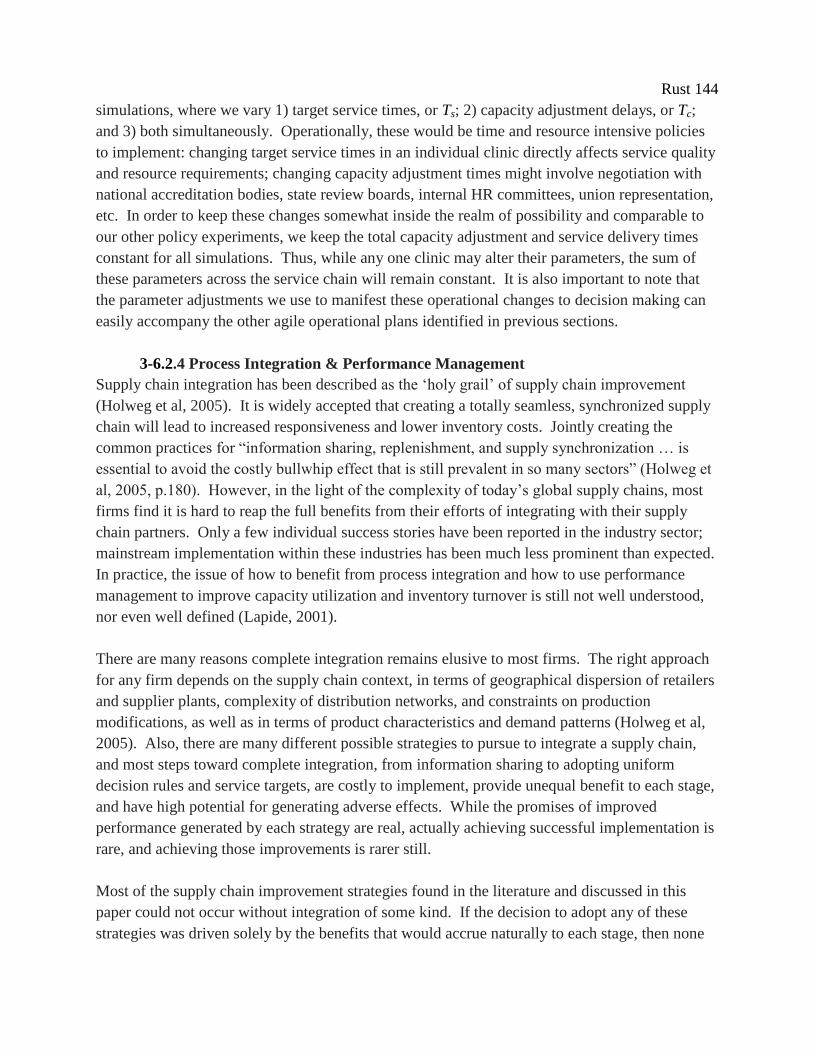
Rust 144
simulations, where we vary 1) target service times, or Ts; 2) capacity adjustment delays, or Tc;
and 3) both simultaneously. Operationally, these would be time and resource intensive policies
to implement: changing target service times in an individual clinic directly affects service quality
and resource requirements; changing capacity adjustment times might involve negotiation with
national accreditation bodies, state review boards, internal HR committees, union representation,
etc. In order to keep these changes somewhat inside the realm of possibility and comparable to
our other policy experiments, we keep the total capacity adjustment and service delivery times
constant for all simulations. Thus, while any one clinic may alter their parameters, the sum of
these parameters across the service chain will remain constant. It is also important to note that
the parameter adjustments we use to manifest these operational changes to decision making can
easily accompany the other agile operational plans identified in previous sections.
3-6.2.4 Process Integration & Performance Management
Supply chain integration has been described as the ‘holy grail’ of supply chain improvement
(Holweg et al, 2005). It is widely accepted that creating a totally seamless, synchronized supply
chain will lead to increased responsiveness and lower inventory costs. Jointly creating the
common practices for “information sharing, replenishment, and supply synchronization … is
essential to avoid the costly bullwhip effect that is still prevalent in so many sectors” (Holweg et
al, 2005, p.180). However, in the light of the complexity of today’s global supply chains, most
firms find it is hard to reap the full benefits from their efforts of integrating with their supply
chain partners. Only a few individual success stories have been reported in the industry sector;
mainstream implementation within these industries has been much less prominent than expected.
In practice, the issue of how to benefit from process integration and how to use performance
management to improve capacity utilization and inventory turnover is still not well understood,
nor even well defined (Lapide, 2001).
There are many reasons complete integration remains elusive to most firms. The right approach
for any firm depends on the supply chain context, in terms of geographical dispersion of retailers
and supplier plants, complexity of distribution networks, and constraints on production
modifications, as well as in terms of product characteristics and demand patterns (Holweg et al,
2005). Also, there are many different possible strategies to pursue to integrate a supply chain,
and most steps toward complete integration, from information sharing to adopting uniform
decision rules and service targets, are costly to implement, provide unequal benefit to each stage,
and have high potential for generating adverse effects. While the promises of improved
performance generated by each strategy are real, actually achieving successful implementation is
rare, and achieving those improvements is rarer still.
Most of the supply chain improvement strategies found in the literature and discussed in this
paper could not occur without integration of some kind. If the decision to adopt any of these
strategies was driven solely by the benefits that would accrue naturally to each stage, then none
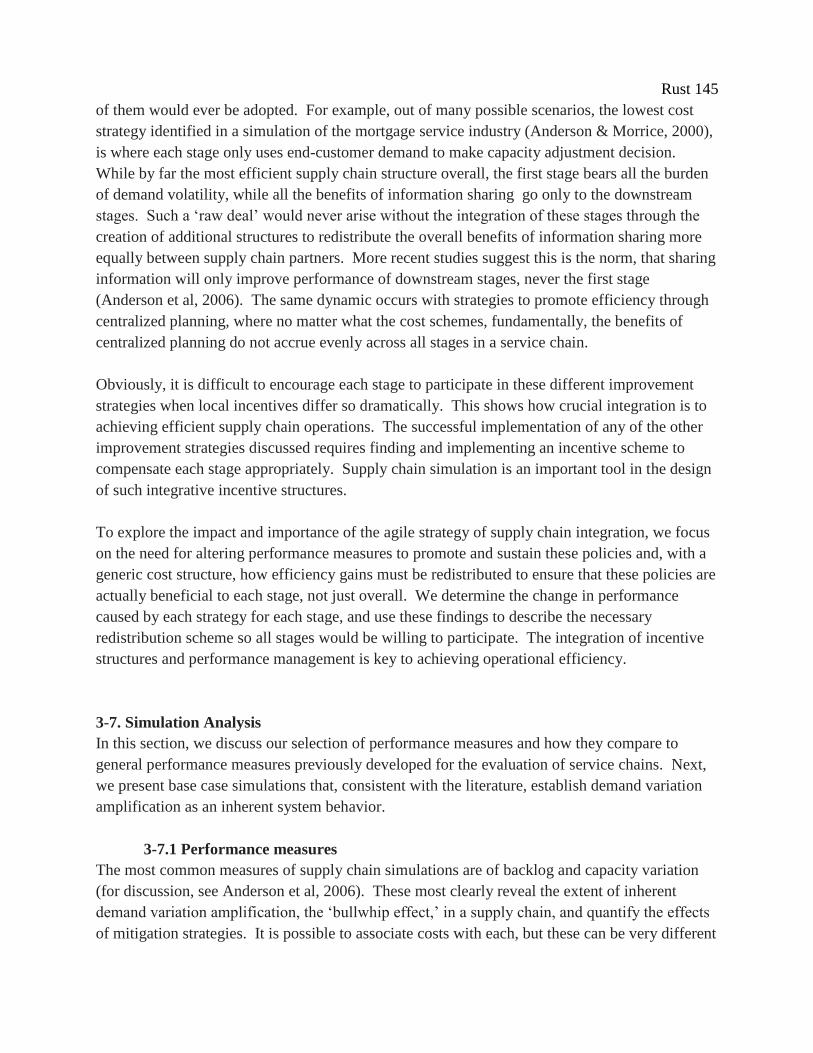
Rust 145
of them would ever be adopted. For example, out of many possible scenarios, the lowest cost
strategy identified in a simulation of the mortgage service industry (Anderson & Morrice, 2000),
is where each stage only uses end-customer demand to make capacity adjustment decision.
While by far the most efficient supply chain structure overall, the first stage bears all the burden
of demand volatility, while all the benefits of information sharing go only to the downstream
stages. Such a ‘raw deal’ would never arise without the integration of these stages through the
creation of additional structures to redistribute the overall benefits of information sharing more
equally between supply chain partners. More recent studies suggest this is the norm, that sharing
information will only improve performance of downstream stages, never the first stage
(Anderson et al, 2006). The same dynamic occurs with strategies to promote efficiency through
centralized planning, where no matter what the cost schemes, fundamentally, the benefits of
centralized planning do not accrue evenly across all stages in a service chain.
Obviously, it is difficult to encourage each stage to participate in these different improvement
strategies when local incentives differ so dramatically. This shows how crucial integration is to
achieving efficient supply chain operations. The successful implementation of any of the other
improvement strategies discussed requires finding and implementing an incentive scheme to
compensate each stage appropriately. Supply chain simulation is an important tool in the design
of such integrative incentive structures.
To explore the impact and importance of the agile strategy of supply chain integration, we focus
on the need for altering performance measures to promote and sustain these policies and, with a
generic cost structure, how efficiency gains must be redistributed to ensure that these policies are
actually beneficial to each stage, not just overall. We determine the change in performance
caused by each strategy for each stage, and use these findings to describe the necessary
redistribution scheme so all stages would be willing to participate. The integration of incentive
structures and performance management is key to achieving operational efficiency.
3-7. Simulation Analysis
In this section, we discuss our selection of performance measures and how they compare to
general performance measures previously developed for the evaluation of service chains. Next,
we present base case simulations that, consistent with the literature, establish demand variation
amplification as an inherent system behavior.
3-7.1 Performance measures
The most common measures of supply chain simulations are of backlog and capacity variation
(for discussion, see Anderson et al, 2006). These most clearly reveal the extent of inherent
demand variation amplification, the ‘bullwhip effect,’ in a supply chain, and quantify the effects
of mitigation strategies. It is possible to associate costs with each, but these can be very different
Rust 146
depending on specifics of supply chain and stage in question. Not all variation creates cost
equally. In a healthcare service chain, costs between service chains and between individual
clinics vary considerably. For example, an increase in the post-surgery patient backlog would
cost a hospital thousands of dollars per day, as patients took up more hospital beds and attendant
care; whereas an increase in the backlog of patients in the ED waiting room would cost almost
nothing. Obviously, the impact to patient is also very different. In the first case, there is
probably a null effect, with increased risk of nosocomial complications countered by increased
attention; while an increased backlog in the second case clearly has a detrimental effect on
patient health. The same is true for service capacity variation: hiring and training a personal care
attendant incurs very different costs than hiring and training a pediatric neurosurgeon. Reducing
service capacity also incurs some costs, quantitatively with possible severance pay and
qualitatively through reduced morale with remaining staff. However, to keep our simulation
results generalizable, we do not associate a cost measure with variation, only reporting averages
and standard deviations of both backlog and service capacity. It should be noted that adding cost
equations to each stage in the model is easily done, if context specific cost data are available.
We also use service time as a measure of performance, which is a common measure of both
general service quality and healthcare quality (Parsuraman et al, 1988). Instantaneous average
service delivery times for each clinic are calculated based on Little’s Law, as the quotient of the
current backlog of patients by the rate at which the clinic completes its service, and summed to
generate the total average service time. We report both the average and standard deviation of
service time for each clinic and the chain as a whole.
Average Patient Service Time =
where B(t) = patient backlog at t
Rc(t) = completion rate of patients at t
The final measure we consider when evaluating the impact of agile strategies on service chains is
the patient to provider ratio. Like service time, this is another measure of care healthcare quality.
Healthcare services research has linked the ratio of patients to providers, and the subsequent
clinician stress and fatigue, to increased error generation, patient safety risk, and reduced overall
care quality (Kane et al, 2007; Robertson & Hassan, 1999). Higher patient to provider ratios
have been correlated with increased patient mortality, failure-to-rescue (deaths following
complications), urinary tract infections, pneumonia, thrombosis, and pulmonary compromise
(Aiken et al, 2002; Kovner & Gergen, 1998). While not a precise measure of service quality, it
is easily comparable across stages and service chains and could be easily modified to provide
more setting specific indications.
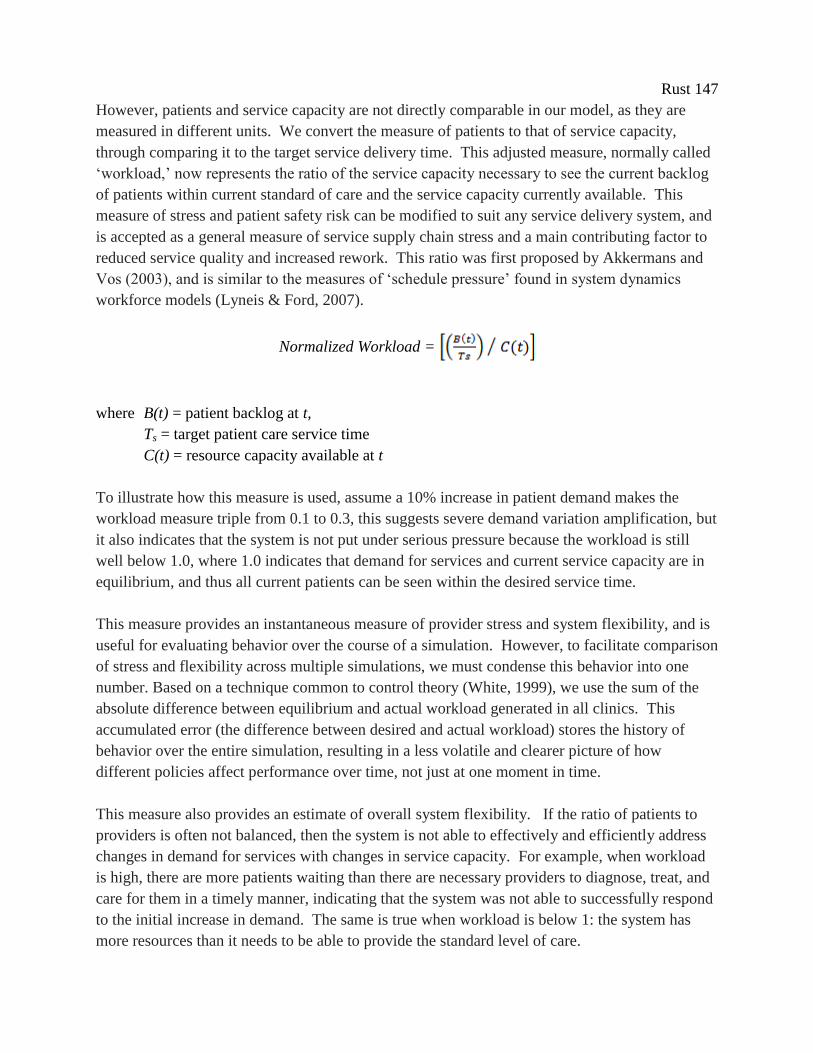
Rust 147
However, patients and service capacity are not directly comparable in our model, as they are
measured in different units. We convert the measure of patients to that of service capacity,
through comparing it to the target service delivery time. This adjusted measure, normally called
‘workload,’ now represents the ratio of the service capacity necessary to see the current backlog
of patients within current standard of care and the service capacity currently available. This
measure of stress and patient safety risk can be modified to suit any service delivery system, and
is accepted as a general measure of service supply chain stress and a main contributing factor to
reduced service quality and increased rework. This ratio was first proposed by Akkermans and
Vos (2003), and is similar to the measures of ‘schedule pressure’ found in system dynamics
workforce models (Lyneis & Ford, 2007).
Normalized Workload =
where B(t) = patient backlog at t,
Ts = target patient care service time
C(t) = resource capacity available at t
To illustrate how this measure is used, assume a 10% increase in patient demand makes the
workload measure triple from 0.1 to 0.3, this suggests severe demand variation amplification, but
it also indicates that the system is not put under serious pressure because the workload is still
well below 1.0, where 1.0 indicates that demand for services and current service capacity are in
equilibrium, and thus all current patients can be seen within the desired service time.
This measure provides an instantaneous measure of provider stress and system flexibility, and is
useful for evaluating behavior over the course of a simulation. However, to facilitate comparison
of stress and flexibility across multiple simulations, we must condense this behavior into one
number. Based on a technique common to control theory (White, 1999), we use the sum of the
absolute difference between equilibrium and actual workload generated in all clinics. This
accumulated error (the difference between desired and actual workload) stores the history of
behavior over the entire simulation, resulting in a less volatile and clearer picture of how
different policies affect performance over time, not just at one moment in time.
This measure also provides an estimate of overall system flexibility. If the ratio of patients to
providers is often not balanced, then the system is not able to effectively and efficiently address
changes in demand for services with changes in service capacity. For example, when workload
is high, there are more patients waiting than there are necessary providers to diagnose, treat, and
care for them in a timely manner, indicating that the system was not able to successfully respond
to the initial increase in demand. The same is true when workload is below 1: the system has
more resources than it needs to be able to provide the standard level of care.
Rust 148
3-7.2 Base Case
We run an initial simulation to reveal dynamic behaviors inherent to the system. Key parameters
in the model are initially set to the relative equivalents of those found in other generic service
supply chain models. The total desired patient service time is 15 days, spread evenly over each
clinic (Ts is 5 days); the time to add or remove a provider from any clinic roster is four times as
long (Tc = 20 days). The model starts in equilibrium, where exogenous demand is a constant rate
of 10 patients per day, and each clinic is staffed with the exact number needed to meet that
demand in the target service time. Thus, initially, there is no variation in backlog or service
capacity, and average service time is equal to desired service time. Desired capacity and actual
service capacity are equal, therefore our performance measure, workload, is 1.0 in each service
clinic. This scenario represents the traditional healthcare service delivery system, where local
managers control the workforce at each clinic using only information on their local clinic
backlog and provider productivity. In this base case scenario, the system is disturbed from that
equilibrium by a minimal level of demand uncertainty, a one-time 10% increase in patient
demand.
The model structure clearly generates the demand variation amplification effect, as expected.
The results outlining the effect of variation in demand for services on each clinic over a one year
period are contained in Figure 35. These oscillations are mirrored in the clinic performance
measures. For example, the 10% increase in demand causes clinic workload to peak at 13.4%,
14.5%, 20.0%, in the first, second, and third clinic, respectively. Patient service time averaged
over the course of the simulation do not vary significantly between clinics (as would be expected
in a return to equilibrium), but the variation is significant, with service times error peaking at
0.67, 0.72, and 1.0 days. This finding compliments previous healthcare service delivery research
(Walley, 2007; Sethuraman & Tirupati, 2005), with has identified increasing downstream
variation common to both service rates and patient backlogs.
The amplification effect arises from delays in demand signaling and the limited information and
bounded rationality of individual clinic managers. As each clinic transfers demand to subsequent
clinics, they unknowingly magnify variation as patients move up the service chain, creating
system stresses proportionally much larger than the initial increase in demand. Clinics in this
model are highly compartmentalized; they share no data on capacity adjustment, patient backlog
or service quality. This lack of coordination and information on the other stages is the chain
represents the typical organization of care both between healthcare organizations and inside
hospitals.
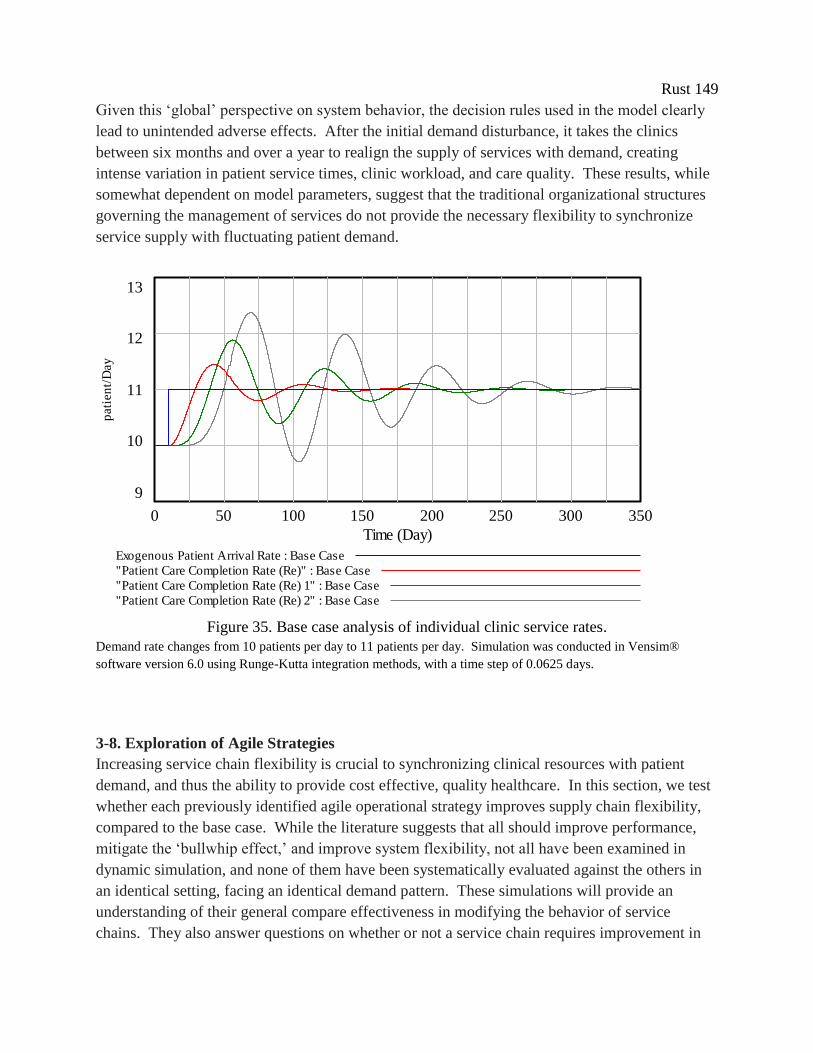
Rust 149
Given this ‘global’ perspective on system behavior, the decision rules used in the model clearly
lead to unintended adverse effects. After the initial demand disturbance, it takes the clinics
between six months and over a year to realign the supply of services with demand, creating
intense variation in patient service times, clinic workload, and care quality. These results, while
somewhat dependent on model parameters, suggest that the traditional organizational structures
governing the management of services do not provide the necessary flexibility to synchronize
service supply with fluctuating patient demand.
rates
13
12
11
10
9
0 50 100 150 200 250 300 350
Time (Day)
pati
en
t/D
ay
Exogenous Patient Arrival Rate : Base Case
"Patient Care Completion Rate (Re)" : Base Case
"Patient Care Completion Rate (Re) 1" : Base Case
"Patient Care Completion Rate (Re) 2" : Base Case
Figure 35. Base case analysis of individual clinic service rates.
Demand rate changes from 10 patients per day to 11 patients per day. Simulation was conducted in Vensim®
software version 6.0 using Runge-Kutta integration methods, with a time step of 0.0625 days.
3-8. Exploration of Agile Strategies
Increasing service chain flexibility is crucial to synchronizing clinical resources with patient
demand, and thus the ability to provide cost effective, quality healthcare. In this section, we test
whether each previously identified agile operational strategy improves supply chain flexibility,
compared to the base case. While the literature suggests that all should improve performance,
mitigate the ‘bullwhip effect,’ and improve system flexibility, not all have been examined in
dynamic simulation, and none of them have been systematically evaluated against the others in
an identical setting, facing an identical demand pattern. These simulations will provide an
understanding of their general compare effectiveness in modifying the behavior of service
chains. They also answer questions on whether or not a service chain requires improvement in
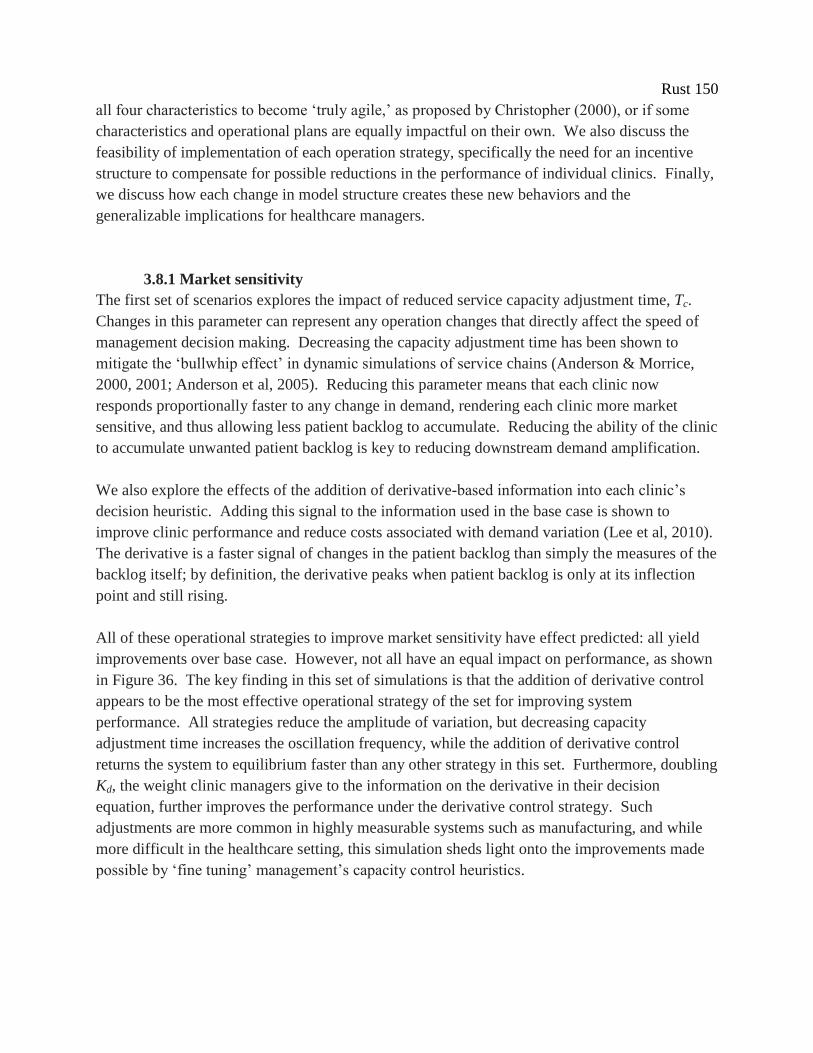
Rust 150
all four characteristics to become ‘truly agile,’ as proposed by Christopher (2000), or if some
characteristics and operational plans are equally impactful on their own. We also discuss the
feasibility of implementation of each operation strategy, specifically the need for an incentive
structure to compensate for possible reductions in the performance of individual clinics. Finally,
we discuss how each change in model structure creates these new behaviors and the
generalizable implications for healthcare managers.
3.8.1 Market sensitivity
The first set of scenarios explores the impact of reduced service capacity adjustment time, Tc.
Changes in this parameter can represent any operation changes that directly affect the speed of
management decision making. Decreasing the capacity adjustment time has been shown to
mitigate the ‘bullwhip effect’ in dynamic simulations of service chains (Anderson & Morrice,
2000, 2001; Anderson et al, 2005). Reducing this parameter means that each clinic now
responds proportionally faster to any change in demand, rendering each clinic more market
sensitive, and thus allowing less patient backlog to accumulate. Reducing the ability of the clinic
to accumulate unwanted patient backlog is key to reducing downstream demand amplification.
We also explore the effects of the addition of derivative-based information into each clinic’s
decision heuristic. Adding this signal to the information used in the base case is shown to
improve clinic performance and reduce costs associated with demand variation (Lee et al, 2010).
The derivative is a faster signal of changes in the patient backlog than simply the measures of the
backlog itself; by definition, the derivative peaks when patient backlog is only at its inflection
point and still rising.
All of these operational strategies to improve market sensitivity have effect predicted: all yield
improvements over base case. However, not all have an equal impact on performance, as shown
in Figure 36. The key finding in this set of simulations is that the addition of derivative control
appears to be the most effective operational strategy of the set for improving system
performance. All strategies reduce the amplitude of variation, but decreasing capacity
adjustment time increases the oscillation frequency, while the addition of derivative control
returns the system to equilibrium faster than any other strategy in this set. Furthermore, doubling
Kd, the weight clinic managers give to the information on the derivative in their decision
equation, further improves the performance under the derivative control strategy. Such
adjustments are more common in highly measurable systems such as manufacturing, and while
more difficult in the healthcare setting, this simulation sheds light onto the improvements made
possible by ‘fine tuning’ management’s capacity control heuristics.
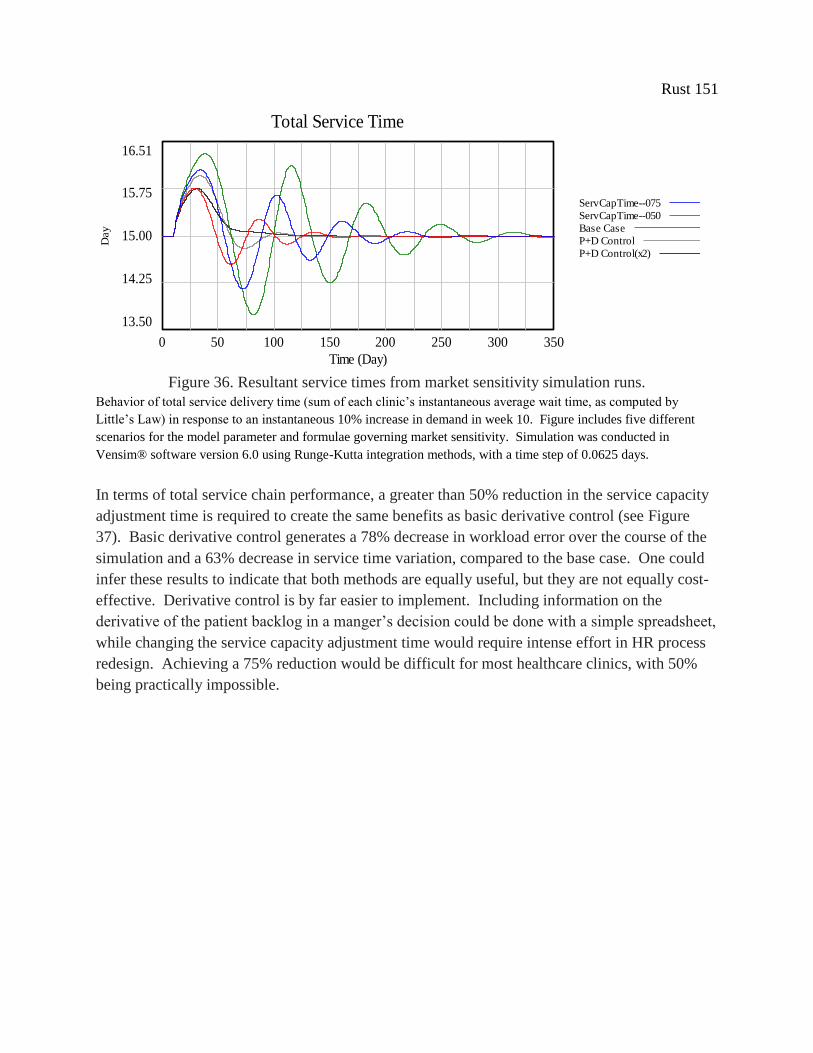
Rust 151
Total Service Time
16.51
15.75
15.00
14.25
13.50
0 50 100 150 200 250 300 350
Time (Day)
Day
Total Service Time : ServCapTime--075
Total Service Time : ServCapTime--050
Total Service Time : Base Case
Total Service Time : P+D Control
Total Service Time : P+D Control(x2)
Figure 36. Resultant service times from market sensitivity simulation runs.
Behavior of total service delivery time (sum of each clinic’s instantaneous average wait time, as computed by
Little’s Law) in response to an instantaneous 10% increase in demand in week 10. Figure includes five different
scenarios for the model parameter and formulae governing market sensitivity. Simulation was conducted in
Vensim® software version 6.0 using Runge-Kutta integration methods, with a time step of 0.0625 days.
In terms of total service chain performance, a greater than 50% reduction in the service capacity
adjustment time is required to create the same benefits as basic derivative control (see Figure
37). Basic derivative control generates a 78% decrease in workload error over the course of the
simulation and a 63% decrease in service time variation, compared to the base case. One could
infer these results to indicate that both methods are equally useful, but they are not equally cost-
effective. Derivative control is by far easier to implement. Including information on the
derivative of the patient backlog in a manger’s decision could be done with a simple spreadsheet,
while changing the service capacity adjustment time would require intense effort in HR process
redesign. Achieving a 75% reduction would be difficult for most healthcare clinics, with 50%
being practically impossible.
Total Service Time
16.51
15.75
15.00
14.25
13.50
0 50 100 150 200 250 300 350
Time (Day)
Day
Total Service Time : ServCapTime--075
Total Service Time : ServCapTime--050
Total Service Time : Base Case
Total Service Time : P+D Control
Total Service Time : P+D Control(x2)
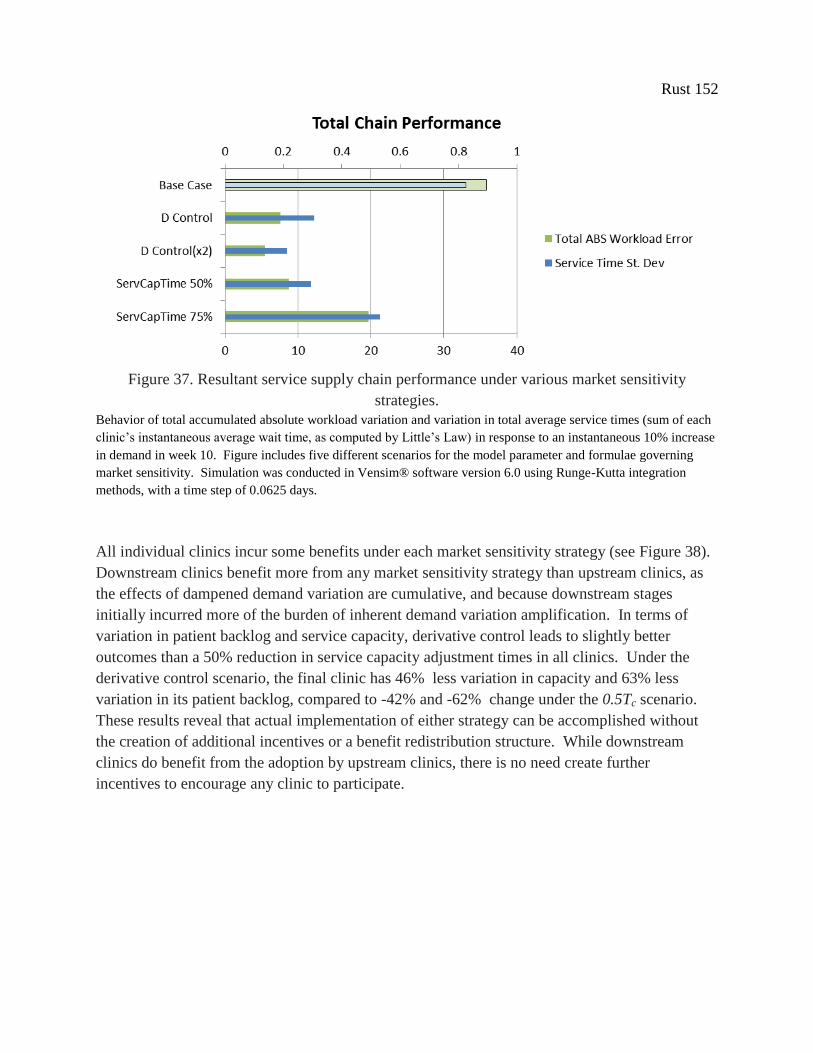
Rust 152
Figure 37. Resultant service supply chain performance under various market sensitivity
strategies.
Behavior of total accumulated absolute workload variation and variation in total average service times (sum of each
clinic’s instantaneous average wait time, as computed by Little’s Law) in response to an instantaneous 10% increase
in demand in week 10. Figure includes five different scenarios for the model parameter and formulae governing
market sensitivity. Simulation was conducted in Vensim® software version 6.0 using Runge-Kutta integration
methods, with a time step of 0.0625 days.
All individual clinics incur some benefits under each market sensitivity strategy (see Figure 38).
Downstream clinics benefit more from any market sensitivity strategy than upstream clinics, as
the effects of dampened demand variation are cumulative, and because downstream stages
initially incurred more of the burden of inherent demand variation amplification. In terms of
variation in patient backlog and service capacity, derivative control leads to slightly better
outcomes than a 50% reduction in service capacity adjustment times in all clinics. Under the
derivative control scenario, the final clinic has 46% less variation in capacity and 63% less
variation in its patient backlog, compared to -42% and -62% change under the 0.5Tc scenario.
These results reveal that actual implementation of either strategy can be accomplished without
the creation of additional incentives or a benefit redistribution structure. While downstream
clinics do benefit from the adoption by upstream clinics, there is no need create further
incentives to encourage any clinic to participate.
Rust 153
Figure 38. Variation in individual clinic backlogs and capacities following market sensitivity
strategies.
Behavior of variation in patient backlogs and service capacities in response to an instantaneous 10% increase in
demand in week 10. Figure includes five different scenarios for the model parameter and formulae governing
market sensitivity. The time horizon for each simulation is 350 days. Simulation was conducted in Vensim®
software version 6.0 using Runge-Kutta integration methods, with a time step of 0.0625 days.
3-8.2 Information Sharing
The second set of scenarios explores the impact of including real-time, end-patient demand data
in the decision equation at each clinic. Including this information means that each clinic now
responds to both changes in their local patient backlog and to the patients that have started the
care process but have not yet arrived at their clinic. Increasing the visibility of real demand
throughout the supply chain has been shown to mitigate the ‘bullwhip effect’ in real-world
manufacturing chains (Holweg et al, 2005). Including initial patient demand in individual
clinic’s capacity adjustment decision making has also improved performance of service chains in
dynamic simulations (Anderson & Morrice, 2000, 2001; Anderson et al, 2005). However,
implementing this strategy in the real world requires a costly change in operations: including the
installation of IT infrastructure to collect and transmit the data in real time, and training
managers on how to incorporate these new data into their decision heuristics. Also, the relative
weight given to each source of information is both difficult to intuit correctly and fundamentally
important to determining overall performance. It should be noted that initial patient demand is a
different type of information than managers used in the base case: it is an instantaneous rate of
patient arrival, as opposed to a stock of patients waiting (or, depending on the formulation, the
stock of patients in process).
We test two different versions of the information sharing strategy, one where information on
initial patient demand completely replaces local backlog in the capacity adjustment decision (a =
1), and another, more reasonable version, where managers use a mix of local backlog and initial

Rust 154
patient demand (a = 0.5). In the runs described, all clinics use the same relative weight
parameter (we did run experiments varying these weights between clinics, but those runs did not
yield significant system improvement or insight into model behavior). For the chain as a whole,
both versions of the information sharing strategy reduce workload and service time variation
under most scenarios, as shown in Figure 39.
The mixed information version leads to significant improvements in mitigating workload
variation, but basing capacity adjustment decisions fully on initial patient demand (i.e., not using
local information at all) appears to yield even more improvement. Under the condition a = 1,
total accumulated workload error is 84% lower than the base case; service times in this version
are also more controlled under most scenarios. These results suggest that using initial patient
demand in place of local demand increases system flexibility, yielding a faster and more accurate
response to demand variation than the traditional decision structure.
We explore the validity of the strategy of only using initial patient demand in all clinics by
testing it in multiple versions of our generic service chains, where all clinics are no longer
identical. The variation in individual clinic parameters provides a more realistic and
representative simulation of the complexity seen in actual healthcare service chains. In these
scenarios, each clinic is portrayed as conducting a different care processes, requiring different
target clinic service times. Also, each clinic manages their service capacity differently, with
each clinic subject to a different capacity adjustment decision time. Target service time is set at
either 2, 5, or 8 days (labeled as L, M, and H for ‘low,’ ‘medium,’ and ‘high’ values); while
capacity adjustment time varies between 7, 20, and 33 days. Despite these changes, each
scenario remains comparable to the other strategy evaluation simulation runs because total
service time and total capacity adjustment delays for the overall chain remain constant (∑Ts = 15
and ∑Tc = 60, for all scenarios).
Even under these more realistic conditions, where all clinics are not identical, making decisions
solely with initial patient demand often yields better outcomes than either the mixed information
strategy or the base case. Only in one simulation run, where the first clinic's parameters produce
low market sensitivity, as the capacity adjustment time is set to 33 days, did this strategy lead to
a worse outcome, specifically a service time variation 73% worse than the base case. In cases
when the first clinic is equally or more responsive to changes in demand than the base case,
overall system performance improved. Results are described in Figure 39.

Rust 155
Figure 39. Resultant service supply chain performance under various information sharing
strategies.
Behavior of total accumulated absolute workload variation and variation in total average service times (sum of each
clinic’s instantaneous average wait time, as computed by Little’s Law) and in response to an instantaneous 10%
increase in demand in week 10. Figure includes seven different scenarios for the model parameter and formulae
governing information sharing under differing assumptions of clinic characteristics (parameters delta and tau varied
between 2, 5, and 8 days and 7, 20, and 33 days respectively). The time horizon for each simulation is 350 days.
Simulation was conducted in Vensim® software version 6.0 using Runge-Kutta integration methods, with a time
step of 0.0625 days.
This variation in service chain performance can be explained by examining the behavior of
individual clinics, as shown in Figure 35. Not all clinics are affected equally by the extreme
reliance on initial patient demand information. A detailed analysis reveals that most of the
predicted benefits of relying on initial patient demand are generated in the model by the
complete elimination of variation in downstream clinics patient backlogs. This is more than the
complete elimination of the amplification of variation, or ‘bullwhip effect,’ it is the complete
elimination of any variation whatsoever. However, these impressive outcomes only occur in the
improbable scenario where all clinics have identical capacity adjustment times. More realistic
scenarios with variable decision making practices between clinics indicate that these results
would not be produced in real-world healthcare service chains, where maintaining identical
management decision making heuristics and HR processes across the entire chain is highly
unlikely.
These uneven outcomes across clinics render implementation of the information sharing strategy
difficult. In almost all scenarios, the first clinic in our service chain incurs more variation in
patient backlog when including initial patient demand in their management decisions than they
would without. This leads to more variation in service times and service quality levels. Even
when demand information is combined with local backlog information, such as the a = 0.5
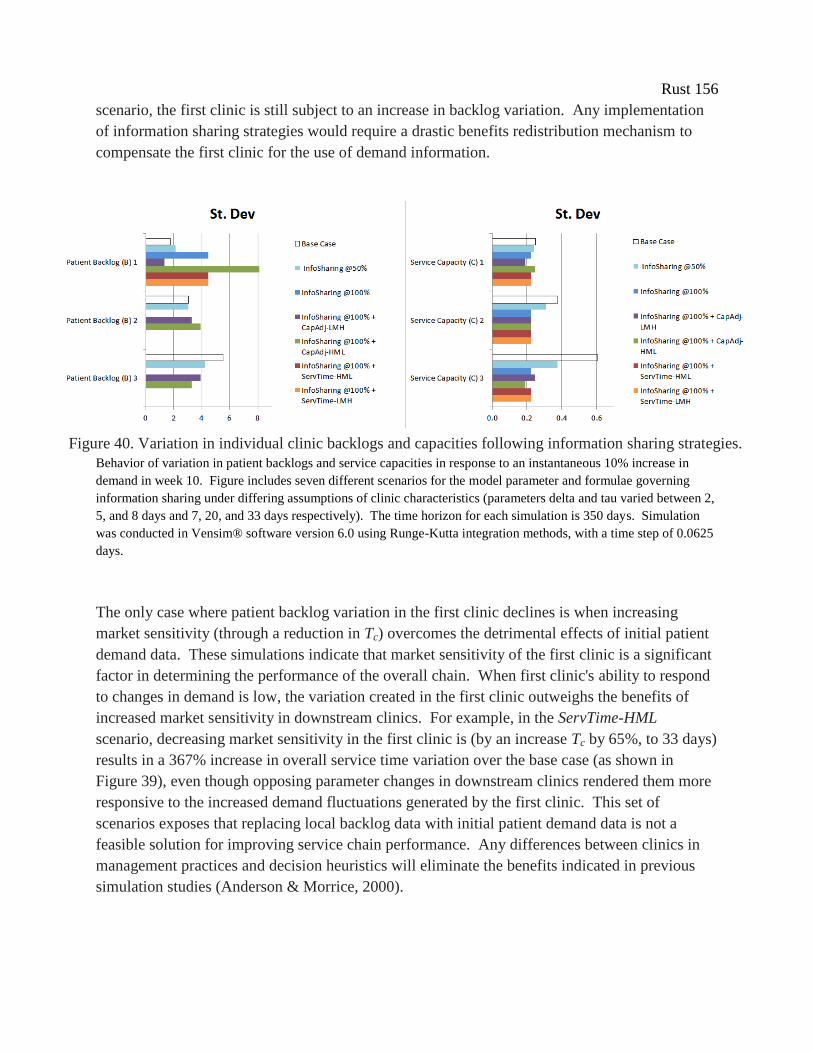
Rust 156
scenario, the first clinic is still subject to an increase in backlog variation. Any implementation
of information sharing strategies would require a drastic benefits redistribution mechanism to
compensate the first clinic for the use of demand information.
Behavior of variation in patient backlogs and service capacities in response to an instantaneous 10% increase in
demand in week 10. Figure includes seven different scenarios for the model parameter and formulae governing
information sharing under differing assumptions of clinic characteristics (parameters delta and tau varied between 2,
5, and 8 days and 7, 20, and 33 days respectively). The time horizon for each simulation is 350 days. Simulation
was conducted in Vensim® software version 6.0 using Runge-Kutta integration methods, with a time step of 0.0625
days.
The only case where patient backlog variation in the first clinic declines is when increasing
market sensitivity (through a reduction in Tc) overcomes the detrimental effects of initial patient
demand data. These simulations indicate that market sensitivity of the first clinic is a significant
factor in determining the performance of the overall chain. When first clinic's ability to respond
to changes in demand is low, the variation created in the first clinic outweighs the benefits of
increased market sensitivity in downstream clinics. For example, in the ServTime-HML
scenario, decreasing market sensitivity in the first clinic is (by an increase Tc by 65%, to 33 days)
results in a 367% increase in overall service time variation over the base case (as shown in
Figure 39), even though opposing parameter changes in downstream clinics rendered them more
responsive to the increased demand fluctuations generated by the first clinic. This set of
scenarios exposes that replacing local backlog data with initial patient demand data is not a
feasible solution for improving service chain performance. Any differences between clinics in
management practices and decision heuristics will eliminate the benefits indicated in previous
simulation studies (Anderson & Morrice, 2000).
Figure 40. Variation in individual clinic backlogs and capacities following information sharing strategies.
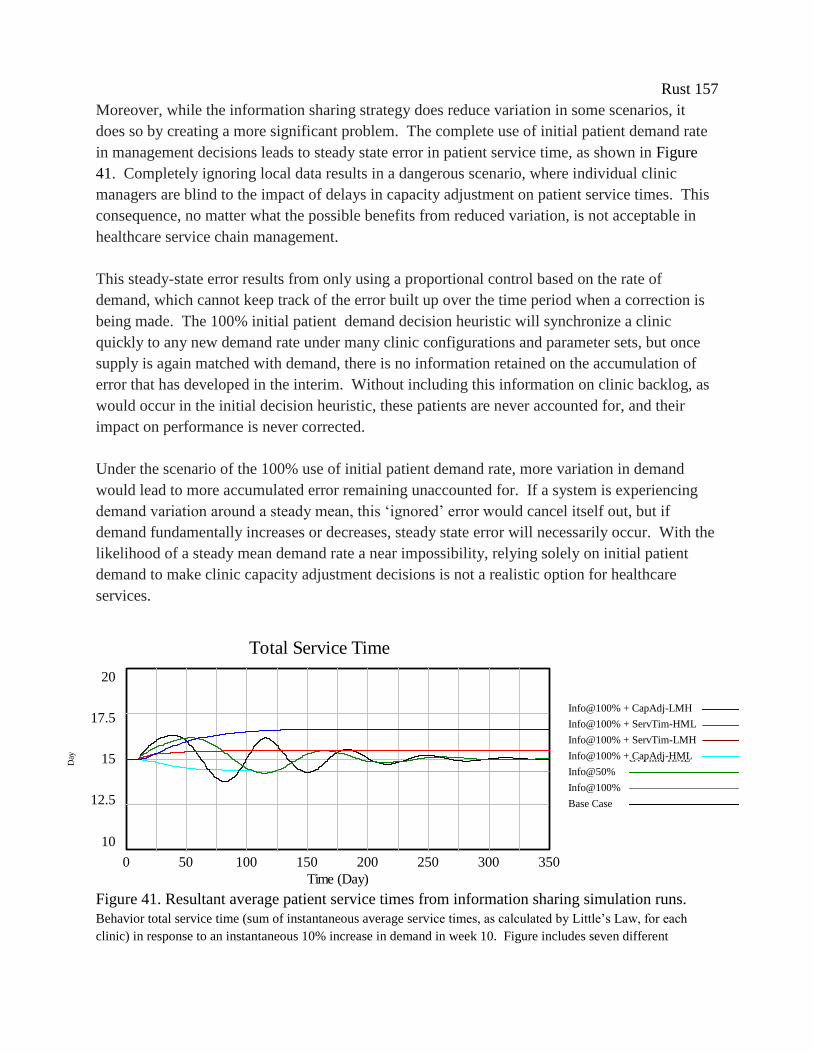
Rust 157
Moreover, while the information sharing strategy does reduce variation in some scenarios, it
does so by creating a more significant problem. The complete use of initial patient demand rate
in management decisions leads to steady state error in patient service time, as shown in Figure
41. Completely ignoring local data results in a dangerous scenario, where individual clinic
managers are blind to the impact of delays in capacity adjustment on patient service times. This
consequence, no matter what the possible benefits from reduced variation, is not acceptable in
healthcare service chain management.
This steady-state error results from only using a proportional control based on the rate of
demand, which cannot keep track of the error built up over the time period when a correction is
being made. The 100% initial patient demand decision heuristic will synchronize a clinic
quickly to any new demand rate under many clinic configurations and parameter sets, but once
supply is again matched with demand, there is no information retained on the accumulation of
error that has developed in the interim. Without including this information on clinic backlog, as
would occur in the initial decision heuristic, these patients are never accounted for, and their
impact on performance is never corrected.
Under the scenario of the 100% use of initial patient demand rate, more variation in demand
would lead to more accumulated error remaining unaccounted for. If a system is experiencing
demand variation around a steady mean, this ‘ignored’ error would cancel itself out, but if
demand fundamentally increases or decreases, steady state error will necessarily occur. With the
likelihood of a steady mean demand rate a near impossibility, relying solely on initial patient
demand to make clinic capacity adjustment decisions is not a realistic option for healthcare
services.
Figure 41. Resultant average patient service times from information sharing simulation runs.
Behavior total service time (sum of instantaneous average service times, as calculated by Little’s Law, for each
clinic) in response to an instantaneous 10% increase in demand in week 10. Figure includes seven different
Total Service Time
20
17.5
15
12.5
10
0 50 100 150 200 250 300 350
Time (Day)
Day
Total Service Time : +POS100&CapAdj-LMH
Total Service Time : +POS100&ServTime-HML
Total Service Time : POS050
Total Service Time : POS100
Total Service Time : Base Case
Total Service Time : +POS100&ServTime-LMH
Total Service Time : +POS100&CapAdj-HML
Info@100% + CapAdj-LMH
Info@100% + ServTim-HML
Info@100% + ServTim-LMH
Info@100% + CapAdj-HML
Info@50%
Info@100%
Base Case
Total Service Time
20
17.5
15
12.5
10
0 50 100 150 200 250 300 350
Time (Day)
Day
Total Service Time : +POS100&CapAdj-LMH
Total Service Time : +POS100&ServTime-HML
Total Service Time : POS050
Total Service Time : POS100
Total Service Time : Base Case
Total Service Time : +POS100&ServTime-LMH
Total Service Time : +POS100&CapAdj-HML

Rust 158
scenarios for the model parameter and formulae governing information sharing under differing assumptions of clinic
characteristics (parameters delta and tau varied between 2, 5, and 8 days and 7, 20, and 33 days respectively). The
time horizon for each simulation is 350 days. Simulation was conducted in Vensim® software version 6.0 using
Runge-Kutta integration methods, with a time step of 0.0625 days
3-8.3 Coordinated planning
The final set of scenarios explores the impact of centralized planning, specifically the use of a
systems perspective to determine clinic decision heuristics and target service times to maximize
supply chain performance. These changes are meant to maximize performance for the total
chain, even if individual clinics generate worse performance. From past simulation research, we
know that service chains should not move toward decision synchronization, as services with
identical stages show worse performance than services with varied stages (Anderson et al, 2005).
We explore the implications of this finding to determine if healthcare services can operationalize
increasing decision and service target variation to improve overall performance.
We manifest this idea through changes to clinic parameters Tc and Ts. To illustrate the possible
feedback effects, consider the example of an increase in Tc, which results in the clinic now
responding proportionally slower to any change in demand, rendering that clinic less market
sensitive, and thus allowing more patient backlog to accumulate. Similarly, reducing Ts results
in a clinics needing to maintain more staff for the same level of demand, which allows patients to
wait less on average to complete services in that clinic. Analogous to the ‘more realistic’
scenarios in the previous section, we maintain a fixed ∑Tc and ∑Ts for the service chain as a
whole, thus there are no improvements in overall standard of care or market sensitivity. These
parameter changes isolate the effects of a redistribution of HR resources (changing Tc allows
clinics to make and execute capacity adjustment decisions faster) and service delivery standards
(changing Ts directly affects a clinic’s average service time).
Decision and service standards de-synchronization has a minimal effect on the behavior of total
service time. There is a minor improvement in workload error, compared to the base case,
confirming results from previous studies (see Figure 42).

Rust 159
Figure 42. Resultant service supply chain performance under various coordination strategies.
Behavior of total accumulated absolute workload variation and variation in total average service times (sum of each
clinic’s instantaneous average wait time, as computed by Little’s Law) in response to an instantaneous 10% increase
in demand in week 10. Figure includes five different scenarios for the model parameter and formulae governing
service chain coordination (parameters delta and tau varied between 2, 5, and 8 days and 7, 20, and 33 days
respectively). Simulation was conducted in Vensim® software version 6.0 using Runge-Kutta integration methods,
with a time step of 0.0625 days.
Simulation results suggest that maintaining relatively longer average service times in the first
clinic in the service chain yields the best performance of these decision and performance
standard de-synchronization scenarios. Changes to the parameter governing target service time
(Ts) alters the desired patient backlog level implicit in clinic managers’ decision heuristics,
affecting the average size of the buffer each clinic maintains against demand variation. By
setting performance standards higher in the final clinics of the service chain, the clinics at the
beginning of the service delivery chain are allowed lower relative efficiency and larger patient
backlogs, when compared to the balanced strategy. This provides the first clinic with more
patient demand buffer, so less internal demand variation amplification is passed on to subsequent
clinics. This ‘front-loaded’ service supply chain buffers the entire service chain from external
demand variation, resulting in less variation amplification overall. All else equal, keeping
patients concentrated at the beginning of a service delivery chain better accommodates demand
fluctuation, resulting in less system stress in any clinic. Holding relatively more patients at the
front of the care process (and fewer in the later clinics, to maintain an equivalent total number)
also leads to less workload variation than any other distribution.
Changes to capacity adjustment time have a similar effect, but less pronounced than the de-
synchronization of service targets. This occurs because the size of Tc is relative small compared
to Ts. If the Tc:Ts, ratio were larger, then unbalancing capacity adjustments would have more
impact on service performance. Re-designing HR processes to affect capacity adjustment rates
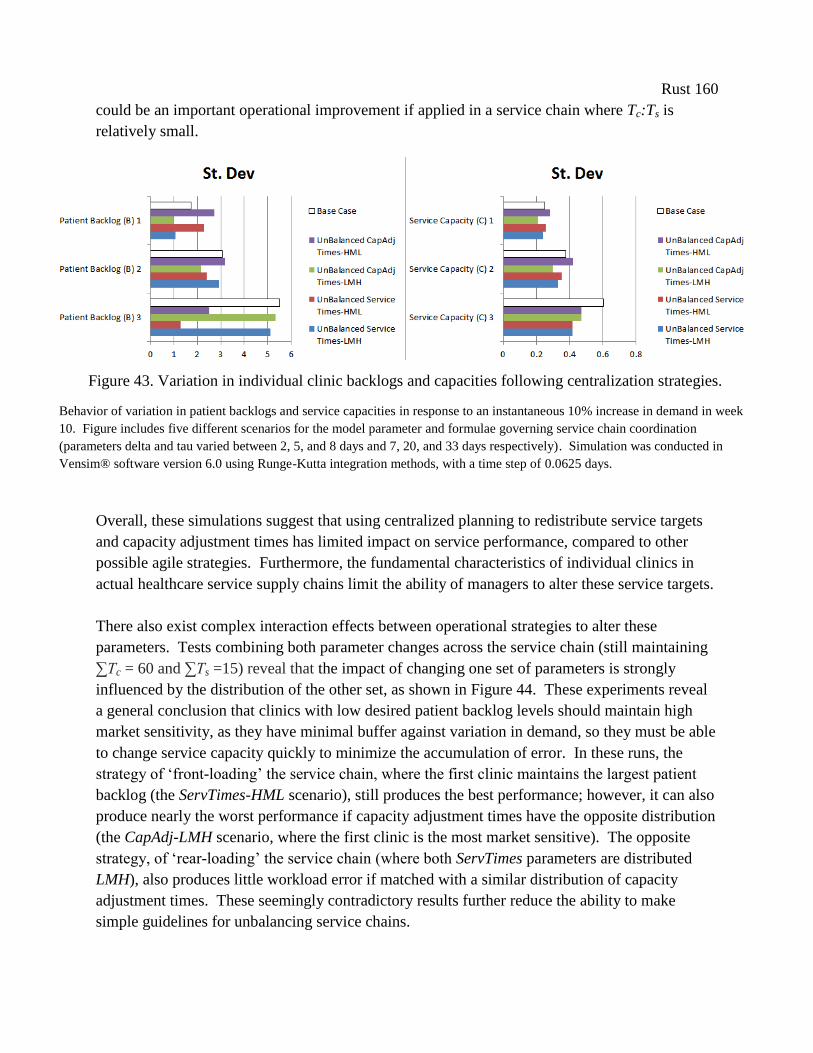
Rust 160
could be an important operational improvement if applied in a service chain where Tc:Ts is
relatively small.
Overall, these simulations suggest that using centralized planning to redistribute service targets
and capacity adjustment times has limited impact on service performance, compared to other
possible agile strategies. Furthermore, the fundamental characteristics of individual clinics in
actual healthcare service supply chains limit the ability of managers to alter these service targets.
There also exist complex interaction effects between operational strategies to alter these
parameters. Tests combining both parameter changes across the service chain (still maintaining
∑Tc = 60 and ∑Ts =15) reveal that the impact of changing one set of parameters is strongly
influenced by the distribution of the other set, as shown in Figure 44. These experiments reveal
a general conclusion that clinics with low desired patient backlog levels should maintain high
market sensitivity, as they have minimal buffer against variation in demand, so they must be able
to change service capacity quickly to minimize the accumulation of error. In these runs, the
strategy of ‘front-loading’ the service chain, where the first clinic maintains the largest patient
backlog (the ServTimes-HML scenario), still produces the best performance; however, it can also
produce nearly the worst performance if capacity adjustment times have the opposite distribution
(the CapAdj-LMH scenario, where the first clinic is the most market sensitive). The opposite
strategy, of ‘rear-loading’ the service chain (where both ServTimes parameters are distributed
LMH), also produces little workload error if matched with a similar distribution of capacity
adjustment times. These seemingly contradictory results further reduce the ability to make
simple guidelines for unbalancing service chains.
Figure 43. Variation in individual clinic backlogs and capacities following centralization strategies.
Behavior of variation in patient backlogs and service capacities in response to an instantaneous 10% increase in demand in week
10. Figure includes five different scenarios for the model parameter and formulae governing service chain coordination
(parameters delta and tau varied between 2, 5, and 8 days and 7, 20, and 33 days respectively). Simulation was conducted in
Vensim® software version 6.0 using Runge-Kutta integration methods, with a time step of 0.0625 days.
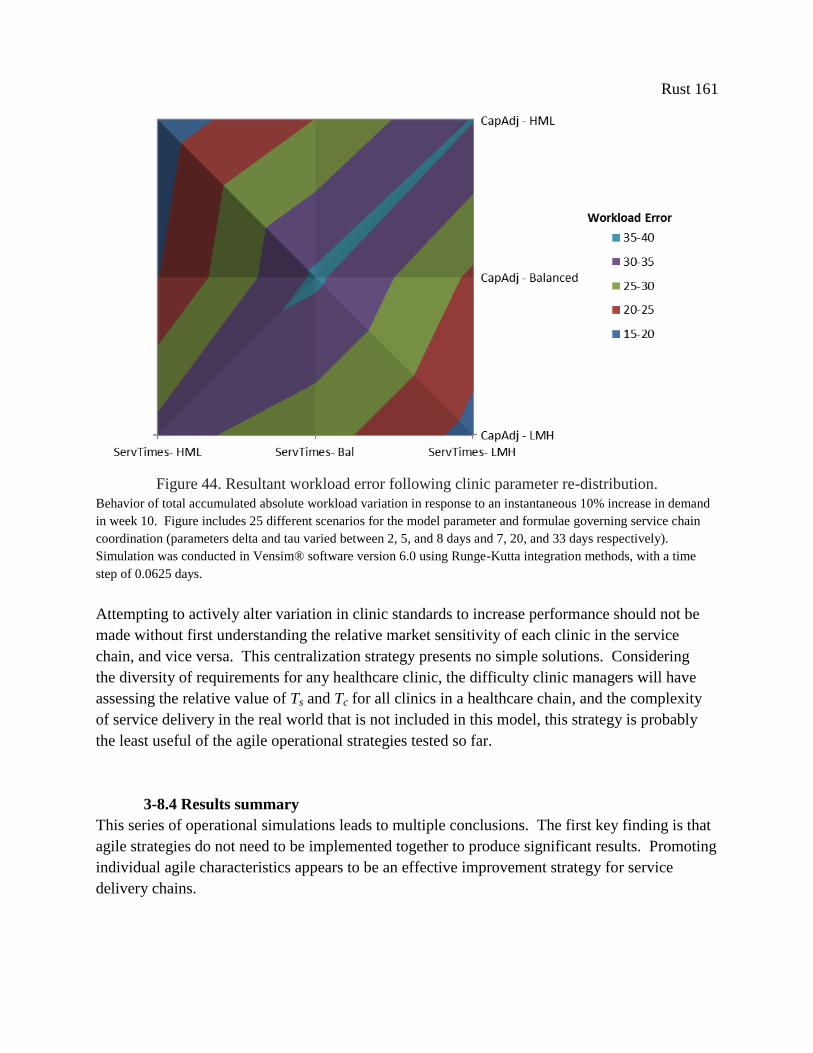
Rust 161
Figure 44. Resultant workload error following clinic parameter re-distribution.
Behavior of total accumulated absolute workload variation in response to an instantaneous 10% increase in demand
in week 10. Figure includes 25 different scenarios for the model parameter and formulae governing service chain
coordination (parameters delta and tau varied between 2, 5, and 8 days and 7, 20, and 33 days respectively).
Simulation was conducted in Vensim® software version 6.0 using Runge-Kutta integration methods, with a time
step of 0.0625 days.
Attempting to actively alter variation in clinic standards to increase performance should not be
made without first understanding the relative market sensitivity of each clinic in the service
chain, and vice versa. This centralization strategy presents no simple solutions. Considering
the diversity of requirements for any healthcare clinic, the difficulty clinic managers will have
assessing the relative value of Ts and Tc for all clinics in a healthcare chain, and the complexity
of service delivery in the real world that is not included in this model, this strategy is probably
the least useful of the agile operational strategies tested so far.
3-8.4 Results summary
This series of operational simulations leads to multiple conclusions. The first key finding is that
agile strategies do not need to be implemented together to produce significant results. Promoting
individual agile characteristics appears to be an effective improvement strategy for service
delivery chains.
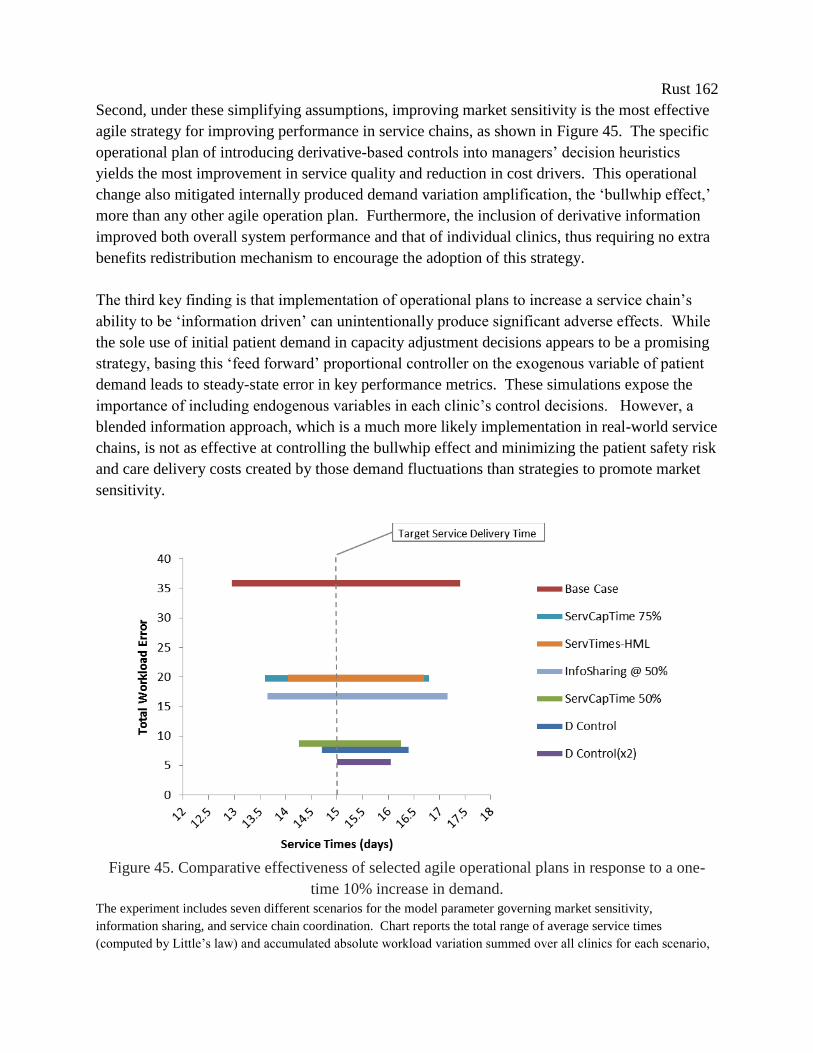
Rust 162
Second, under these simplifying assumptions, improving market sensitivity is the most effective
agile strategy for improving performance in service chains, as shown in Figure 45. The specific
operational plan of introducing derivative-based controls into managers’ decision heuristics
yields the most improvement in service quality and reduction in cost drivers. This operational
change also mitigated internally produced demand variation amplification, the ‘bullwhip effect,’
more than any other agile operation plan. Furthermore, the inclusion of derivative information
improved both overall system performance and that of individual clinics, thus requiring no extra
benefits redistribution mechanism to encourage the adoption of this strategy.
The third key finding is that implementation of operational plans to increase a service chain’s
ability to be ‘information driven’ can unintentionally produce significant adverse effects. While
the sole use of initial patient demand in capacity adjustment decisions appears to be a promising
strategy, basing this ‘feed forward’ proportional controller on the exogenous variable of patient
demand leads to steady-state error in key performance metrics. These simulations expose the
importance of including endogenous variables in each clinic’s control decisions. However, a
blended information approach, which is a much more likely implementation in real-world service
chains, is not as effective at controlling the bullwhip effect and minimizing the patient safety risk
and care delivery costs created by those demand fluctuations than strategies to promote market
sensitivity.
Figure 45. Comparative effectiveness of selected agile operational plans in response to a one-
time 10% increase in demand.
The experiment includes seven different scenarios for the model parameter governing market sensitivity,
information sharing, and service chain coordination. Chart reports the total range of average service times
(computed by Little’s law) and accumulated absolute workload variation summed over all clinics for each scenario,

Rust 163
in response to an instantaneous 10% increase in demand in week 10. The time horizon for each simulation is 350
days. Simulation was conducted in Vensim® software version 6.0 using Runge-Kutta integration methods, with a
time step of 0.0625 days.
3-9. Conclusion
To date there has been limited success in making system-wide service supply chain management
improvements in healthcare (McKone-Sweet et al, 2005; Vries & Huijsman, 2011). We still face
significant challenges designing and implementing cost-effective, and at the same time flexible,
healthcare systems which increase the availability of scarce service resources and improve
patient access to care. Past efforts applying management strategies developed in manufacturing
settings have led to little sustained improvement (Joosten et al, 2009). Defining structural
differences between services and manufacturing necessitate the adoption of new strategies more
suited to the challenges facing healthcare operations and management.
This paper provides a structured assessment of the impact of one possible new strategy, ‘agile,’
on service performance in simulated healthcare delivery chains. In doing so, we bridge the
supply chain and healthcare management literatures and establish ‘agile’ as a new area of study
for service supply chain management research. Our research objectives were to develop a set of
operational plans from the literature on ‘agility’ and service supply chain management and assess
the impact of these agile-derived plans in a generalized healthcare service chain. The knowledge
gained was to provide healthcare managers with useful guidelines for redesigning service
delivery.
To fulfill the research objectives, we describe and test three sets of agile-based operational
strategies, focusing on key characteristics of supply chain agility: increasing market sensitivity,
the use of real-time demand information, and centralized planning. We assess the impact to the
service system based on three criteria: variation in the stocks of patients and service capacity in
each clinic (to expose the ability of each strategy to mitigate the bullwhip effect), average patient
service time, and provider workload. These are measured both at the local (single clinic) and
systemic level (total service chain).
We determine that agile is a valuable strategy for increasing system flexibility and mitigating
internally caused demand variation. Scenarios show improved system performance from both
the patients’ and providers’ perspective, with agile-based operational modifications leading to
reduced variation in service times, improved service quality, and the potential for decreased
costs.
Of the agile characteristics under study, increasing market sensitivity led to the most
improvement, with the specific operational plan of supplementing manager’s traditional decision
making heuristic with derivative control resulting in superior performance. Study results
Rust 164
indicate that demand volatility can be effectively controlled in healthcare by applying derivative
control to the resource adjustment decision. The addition of derivative control reduces the
oscillation of patient backlogs and the discrepancy between demand and service capacity created
by the simplistic feedback control methods commonly used in healthcare. The application of
derivative controls in service chains could refute the conundrum identified by Anderson (et al,
2005), that there is generally a trade-off between policies that improve service quality by
reducing backlog variability and those that reduce personnel costs by reducing capacity
variability. We find that the addition of derivative control can effectively accomplish both.
In practice, derivative controls could be used to dampen oscillations resulting from any capacity
management decision, from resource acquisition, release and write down of capital investments,
to hiring and workforce training. Even the most basic derivative control should lead to a sizable
improvement in synchronization of service resources with demand and, if implemented in all
clinics, significantly mitigate the bullwhip effect. The addition of derivative-based controls is
relatively simple to implementable in real-world service chains. Optimizing these control
equations could further improve cost, utilization and stability of workforce management in
healthcare, if reliable and timely data were available.
Study results also indicate that investing in IT systems to share demand data between clinics
might not as useful in healthcare as predicted from the research done in manufacturing sectors.
Our evidence runs counter to the common supposition on the value of information sharing
strategies in healthcare, as summed up by Baltacioglu (et al, 2007, p121) as "effective
management of healthcare supply chain is only possible via the implementation of effective
information and technology management systems." In our simplified service delivery chain, the
use of initial patient demand rates either has less impact on performance than agile practices
which increase market sensitivity, or leads to significant disruptions in service times and the
alignment of clinic incentives. While possibly beneficial when viewing the chain as a whole,
relying on initial patient demand does not appear to be an appropriate strategy for all clinics.
Generating results that are in direct disagreement with commonly held supply chain management
beliefs could easily be attributed to the abstract nature of our simulation model. Effective
information and technology management systems may address key issues and feedbacks that we
have decided not to include, such as links between service delivery times and patient health, or
between provider workload, service quality, and rework. These information systems may also be
useful in managing details on individual patient demand and provider characteristics not allowed
by the mathematical underpinnings of our model. Other critiques of this research could be
leveled at the applicability of our results to inform decisions in real-world healthcare chains, as
our exogenous demand pattern is undoubtedly not representative of the usually stochastic
demand pattern in healthcare. Each of these shortcomings deserves the attention of further
research.
Rust 165
Our abstract model is a first step toward understanding and informing the application of agile
strategies in healthcare. These results provide only the most general guidance on where agile-
derived efforts to improve service delivery will yield the most return. Healthcare managers are
still ‘on their own’ to adapt these recommendations to their unique care settings and service
delivery chains. Future work should be directed to examining the validity of our findings under
the constraints inherent to different service settings, both in simulation of specific healthcare
service chains and empirically in pilot implementation projects in real-world clinics. Another
thread of future research centers on derivative control. To truly develop useful guidelines for
implementing an agile systems approach in healthcare, the ability of healthcare managers to use
derivative control in individual clinics must be empirically evaluated. Case studies of the
effectiveness of derivative control in ‘noisy’ real-world service chains would undoubtedly shed
light onto important implementation challenges. A second piece of this thread would be
exploring opportunities for ‘tuning’ proportional and derivative-based control decisions, based
on data quality and availability and on the bounded rationality of clinic managers. Increasing
knowledge in these areas together will support the creation of effective, flexible service chain
management that suits the dynamic nature of health itself, and hopefully will lead to enhanced
effectiveness and efficiency of healthcare operations.
Rust 166
4. Conclusion
Healthcare services exist in complex systems, fraught with delays and prone to generating
unintended consequences. The growing complexity and interdependence of healthcare service
delivery, and the inherent variability of patient demand, ensure that matching the supply of
services with its demand is almost impossible to ensure for any significant period of time. This
mismatch between patients and providers has been shown to lead to significant adverse effects.
With the management systems currently in place, this variation leads to mistakes in care delivery
and increased patient safety risks. Kane et al (2007) find that the mismatch between resources
and peaks in demand is the major source of provider fatigue and reduced quality of care in most
healthcare services. Specifically, the stresses placed upon a healthcare system by variability
have been found to lead to more medication errors, hospital-acquired infections, sicker patients,
and are a leading cause of adverse patient outcomes (Needleman et al, 2002; Berens, 2000;
Pronovost et al, 1999). Our ability, or lack thereof, to respond to demand variability may be the
most pressing problem facing healthcare delivery today.
Currently, providers and hospital managers alone do not have the necessary resources or
knowledge to overcome the challenges presented by both exogenous and endogenous demand
variation. Research into the causal relationships between demand variation, capacity
management, system stress, and service quality has been ongoing in many industries for many
years, yet is curiously deficient in healthcare service delivery. Despite increasing efforts to
improve healthcare delivery through practices based on ‘lean’ methods, healthcare remains one
of the least efficient, most dangerous, and highest cost industries in the US. Indeed, one of the
key contributions of our research is the conclusion that implementing lean in the scatter-shot,
“low-hanging-fruit” fashion currently the norm in healthcare could actually be contributing to
demand variation, provider workload, and patient safety risks.
This research recommends a new approach to improving healthcare delivery. Each of the
experiments conducted here supports a core, counter-intuitive concept: When facing volatile
demand for services, modifying management decision-making processes to increase the ability to
synchronize service capacity to demand yields more improvement to patient access and cost than
increasing personnel or resource efficiency. Our main contributions center on revealing the
importance of ‘agile’ strategies for improving healthcare delivery. With the insight generated by
testing in simulation what were previously only theories and correlations, we find that agile-
based practices can improve the access, quality, and cost of healthcare delivery systems. We
attempt to identify and define a set of operational plans for the core set of agile strategies, and
the first to evaluate their comparative effectiveness in simulation.
We propose that supplementing manager’s traditional decision making heuristic with derivative
control at each stage (i.e., clinic or hospital department) in a healthcare delivery chain will result
in superior performance over all other agile-derived operational plans under study, including the
Rust 167
sharing of real-time demand information. At a conceptual level, such a control mechanism has
been suggested by Warren (2007) for improving strategic decisions and Saeed (2009, 2008) for
controlling instability in manufacturing supply chains, but not explored for improving specific
operations like healthcare. Our results indicate that the application of derivative controls in
service chains could refute the conundrum identified by Anderson (et al, 2005), that there is a
necessary trade-off between policies that improve service quality by reducing backlog variability
and those that reduce personnel costs by reducing capacity variability. We find that the addition
of derivative control can effectively accomplish both.
The applied project in the C&P clinic is first application of operational changes derived from an
agile strategy (e.g., increasing market sensitivity) in empirical study in healthcare. While
implemented as only a pilot project limited to one hospital, the estimated impact of the agile-
based operational changes we prescribed is a savings of over 550 years of avoided delay. Taking
these results together, we find that the agile strategy of improving market sensitivity in a
healthcare service chain can produce considerable performance improvement. These simulation
experiments and implementation case study are the first steps to bring ‘agile’ from the realm of
academia to the managers of healthcare service delivery systems.
Our research also contributes to the adaptation of lean methods to the healthcare service system
context. Through the course of this research and through working hands-on with hospital
partners, we have come to see agile not as a substitute for lean, but a complement. Working
together, this combination of methods and philosophies represent a new evolution of lean to
better fit the demanding, highly volatile context of healthcare. Drawing upon Liker’s (2004)
House of Lean diagram, we see creating demand-responsive management structures as a
necessary foundation for lean-based improvement efforts in services with high demand
variability. Unlike the large-scale, low-variability context of mass-manufacturing where lean
first developed, in healthcare, one must first create management systems that respond effectively
to the unavoidable demand variation and uncertainty before any other lean-based improvement
work can be effective. This is a paradigm shift for lean, one that requires recognizing the
inherent limitations of previous methods for controlling variability in the context of healthcare,
and a willingness to focus improvement efforts instead on adapting to that variability.
Most of this research is based on a simulation model of a generic healthcare delivery chain.
This model incorporates the dynamic interplay between external demand variability, clinic
manager’s decision heuristics, and resource allocation structures. The structures and
assumptions made in the model’s design subsume the important concepts that differentiate a
service chain from a manufacturing or product supply chain and are supported by both the
system dynamics and service supply chain literature. This simplified, serial stage model builds
on a research thread started by Anderson and Morrice (1999, 2000), who were the first to use
system dynamics to simulate a multi-stage service system with their model of the mortgage
Rust 168
service industry. Subsequent dynamic serial service models, including publications by
Akkermans and Vos (2003) and Anderson et al. (2005, 2006), are all based on similar underlying
assumptions.
While the dynamic simulation model we create captures the essential elements of reality
common to most healthcare delivery chains, it is an abstract representation with inherent
limitations in both replicating observed behavior and the applicability of our conclusions to any
real-world healthcare service system. The main abstraction that permits clear analysis of the
bullwhip effect and the effect changing management structures has on healthcare service delivery
is also the limitation to the direct applicability of this model to any one healthcare service
delivery chain. Chains of identical clinics, where desired service times, capacity adjustment
practices, and service quality are all equivalent, are simply not a realistic representation of almost
any healthcare delivery system. The stages, clinics, or departments in any healthcare service
chain are more likely to be different in all of these characteristics than they are to be the same.
However, while not universally applicable, there are many healthcare services where the
differences in these parameters and structures are minimal, and thus could benefit from the
knowledge generate by a dynamic analysis of this abstract model. The applicability of our
conclusions depends on how closely a real-world healthcare service chain’s stages are to having
similar properties. For example, consider an elective surgery chain, which starts with a visit to a
primary care provider, then next to a specialist, then to an out-patient surgery clinic. Each of
these stages in our service chain could conceivably have a desired average patient wait time of
two months (i.e., two months to get an appointment with a primary care physician, two months to
get an appointment with a specialist, and two months to schedule an out-patient procedure). In
this example, the capacity management processes and inherent delays would also be similar any
one of these clinics: they must go through the same process of posting a position for,
interviewing, credentialing, and finally hiring a new clinician, which, when summed together,
are probably equivalent no matter the type of clinician, whether general practitioner, specialists,
or specialty surgeon.
Clearly, our conclusions and recommendations should not be applied to a patient care chain with
stages with very dissimilar desired service times; for example, our model is not an accurate
representation of the care process for a patient suffering a heart attack. This patient care chain
starts in the emergency department (where desired service time is measured in minutes), then
moves to the in-patient recovery wards (where the desired service time is measured in days), and
finally to physical therapy (where the desired service time is measured in months). The orders of
magnitude differences in parameters governing each stage in this chain would overwhelm our
current conclusions. Given the impact of the assumption of equal model parameters on overall
model behavior, we propose this as the subject for future research, both in simulation and
especially in quantitative analysis of real-world healthcare service chains.
Rust 169
There are other limitations and potential bias inherent to the structure of our generic model. By
excluding, 1) the dynamic effects of increased patient service time on patient health, 2) the effect
of service quality on clinic rework rates, and 3) variation in both individual patient and provider
characteristics, we limit both the complexity of model behavior and the scope of our subsequent
operations improvement analysis. These elements should be included in future simulation
studies, but, to provide value, they must be calibrated to fit a specific service delivery chain.
Past service supply chain research suggests that these additional feedbacks may magnify the
variation amplification effect (Akkermans & Vos, 2003), thus our model potentially under-
estimates the bullwhip effect and its effects on clinic performance.
Analysis of our model’s assumptions and limitations sheds light on significant research questions
in the management of healthcare systems. A key unknown presented here is the impact of
variability on the quality of care in any given clinic or healthcare service. To find the motivation
to address variability in healthcare, both individual providers and healthcare leaders must first
have a clear understanding of the affect variability in the patient:provider ratio has on patient
health outcomes. Wide-spread understanding of the determinants of quality elasticity, and their
impact on patient health and safety are necessary to effectively guide the work of both lean
practitioners and healthcare managers.
We must also discover and test other operational plans to increase system flexibility.
Undoubtedly, we have only uncovered the tip of the ‘agility iceberg.’ Given the risks identified
and the potential benefits gained from a careful examination of the handful of operational plans
we have presented here, we call on other researchers and healthcare improvement practitioners to
seek out and report new methods for adapting to demand variability. Further refinement of the
broad strategies subsumed under the concept of ‘agility’ to the concrete problems of healthcare
will not only aid us is in stemming the unsustainable increase in healthcare spending, but will
lead to increases in the quality of care for all.
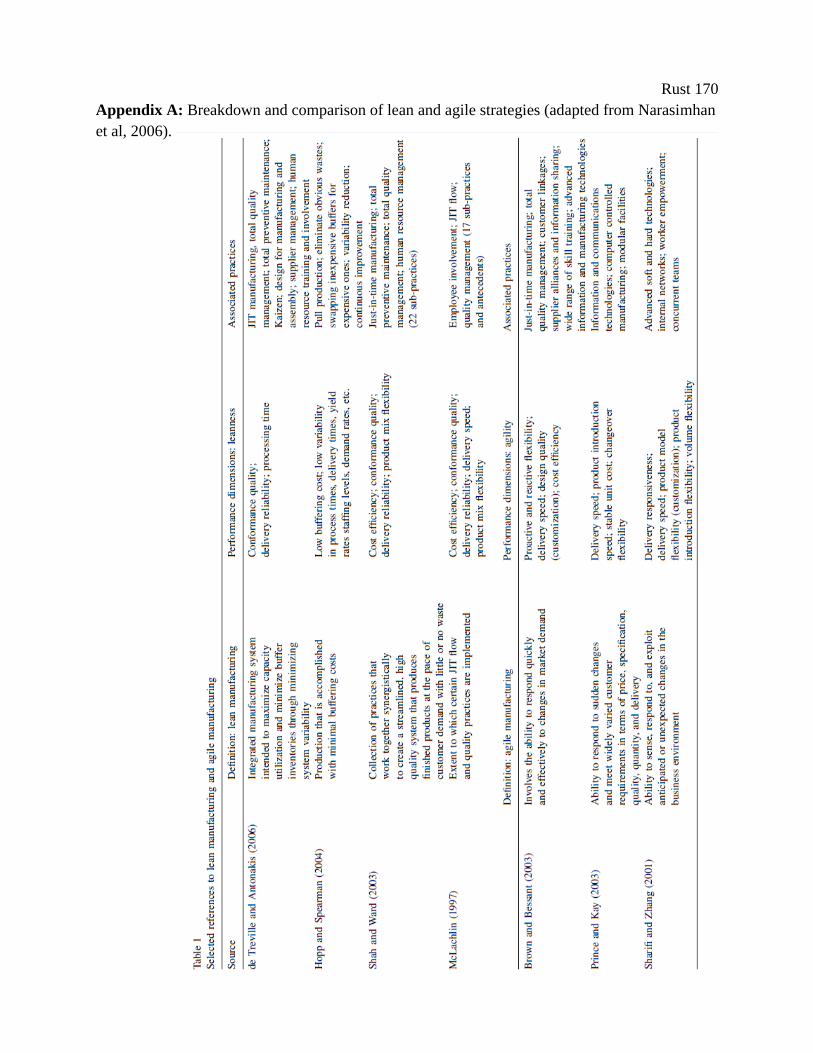
Rust 170
Appendix A: Breakdown and comparison of lean and agile strategies (adapted from Narasimhan
et al, 2006).

Rust 171
Appendix B: Calculations for Estimating the Effect of Patient:Provider Ratio on Patient
Mortality Rate (adapted from Litvak et al, 2005).
First, to adapt an estimate of the effect of increased patient:provider ratio on patient mortality
based on the work by Aiken et al (2002) for our model necessitates the assumption that nurses
are the constraining service capacity (not attending physicians, residents, rooms, or equipment)
in our generic healthcare service chain.
To compute the increase in mortality, first we use the workload measure generate for each clinic
to determine the proportion of patients above the standard patient:nurse ratio for every time step,
or ρ. If this ratio is above 1 (implying more patients than the standard desired ratio of 4:1), then
we multiply the proportion of patients exposed the increased risk defined as ρ*, by the 7%
mortality odds ratio increase reported by Aiken et al (2002). Not all patients are initially affected
by increases in provider workload, only those patients directly receiving care from overworked
nurses. We accumulate the changes in this instantaneous patient mortality risk for the affect
patient population, then compare these results to those from the base case scenario with no lean
improvement and report the proportional difference. No literature was found citing decreases of
patient to nurse ratios below this standard leading to improved patient outcomes, suggesting
diminishing returns in patient health to the number of hours of nurse time per patient.
To calculate ρ*, we assume a standard 4:1 patient to nurse ratio, and define the total number of
patients in a clinic as Ρ, thus the number of nurses in the steady state will be (0.25 Ρ). The
number of patients with increased mortality will be (5 ∙ ρ ∙ Ρ), as the additional ρ ∙ Ρ patients will
be distributed over ρ ∙ Ρ nurses: this assumes even distribution of one additional patient per nurse
(for discussion, see Litvak et al, 2005). Since the total number of patients has increased to Ρ(1 +
ρ), the proportion of patients subjected to the 7% increase in mortality is:
Under this formula, the number of patients in a clinic will have to increase to 25% more than
adequate staffing levels for all patients to be subject to increased risk, and increasing beyond
25% would result in adding new patients with a 14% increase in mortality rate for . We
include this measure not to specify some number of avoidable deaths cause by lean redesign, but
as a representation of the relative effects of provider workload on patient safety.
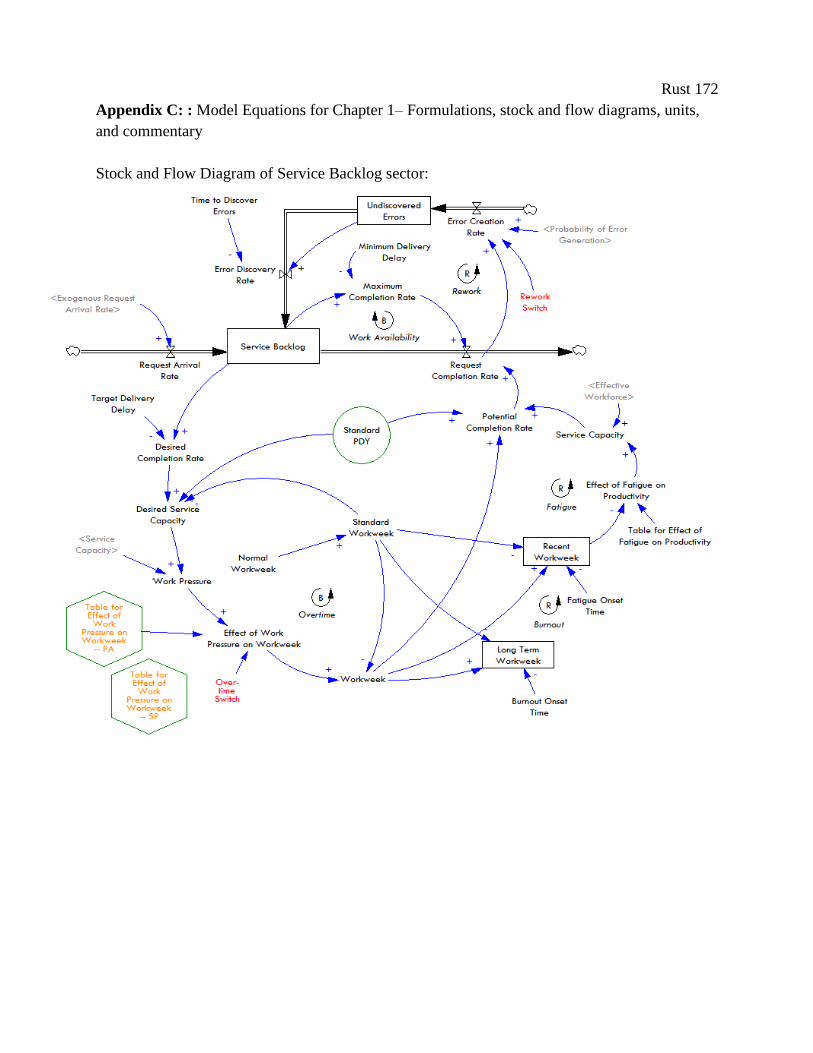
Rust 172
Appendix C: : Model Equations for Chapter 1– Formulations, stock and flow diagrams, units,
and commentary
Stock and Flow Diagram of Service Backlog sector:
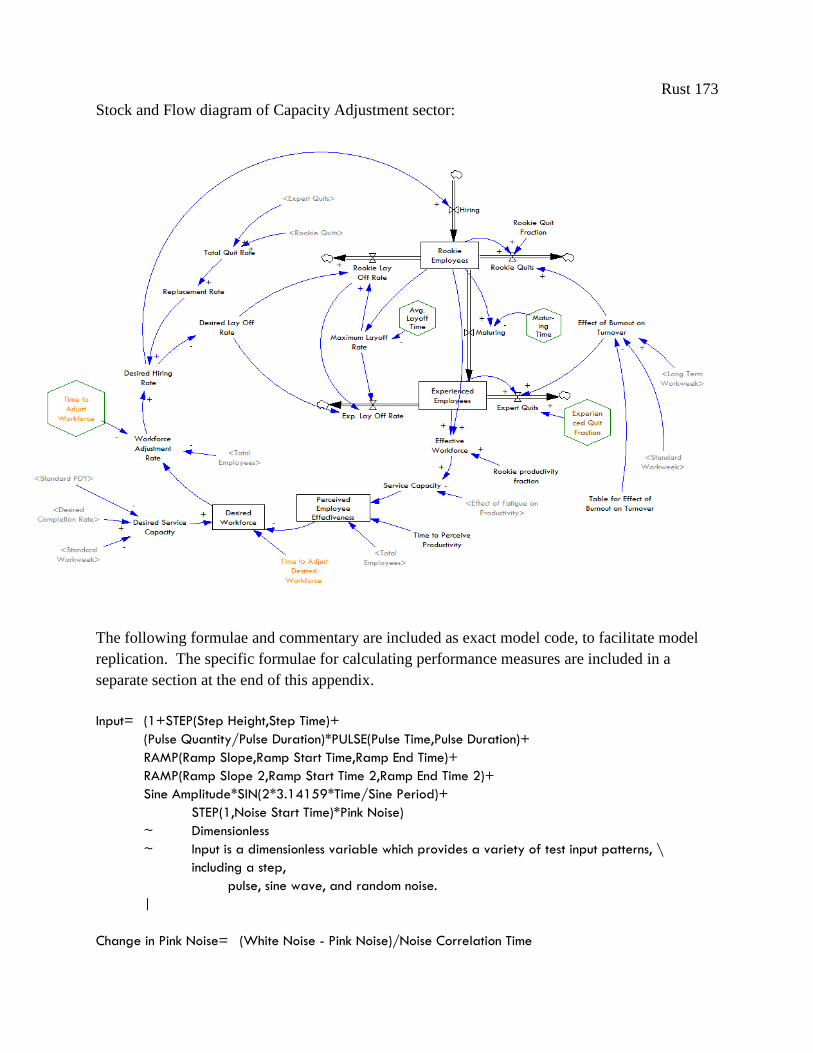
Rust 173
Stock and Flow diagram of Capacity Adjustment sector:
The following formulae and commentary are included as exact model code, to facilitate model
replication. The specific formulae for calculating performance measures are included in a
separate section at the end of this appendix.
Input= (1+STEP(Step Height,Step Time)+
(Pulse Quantity/Pulse Duration)*PULSE(Pulse Time,Pulse Duration)+
RAMP(Ramp Slope,Ramp Start Time,Ramp End Time)+
RAMP(Ramp Slope 2,Ramp Start Time 2,Ramp End Time 2)+
Sine Amplitude*SIN(2*3.14159*Time/Sine Period)+
STEP(1,Noise Start Time)*Pink Noise)
~ Dimensionless
~ Input is a dimensionless variable which provides a variety of test input patterns, \
including a step,
pulse, sine wave, and random noise.
|
Change in Pink Noise= (White Noise - Pink Noise)/Noise Correlation Time

Rust 174
~ 1/Week
~ Change in the pink noise value; Pink noise is a first order exponential smoothing \
delay of the white noise input.
|
Standard PDY= IF THEN ELSE("Lean Switch, 1=PA"=1,0.87, 0.63)
~ requests/Employees/hours
~ Variation in productivity is based on breadth of skill set and \
understanding of the purpose of forensic examination: PAs and MDs can \
conduct more aspects of a patient's request than a specialist, who can \
only examine issues in their area of expertise.PAs can see, on average \
0.87 of a patient's request, while one specialist can complete 63% (based \
on skill set and distribution of exams per patient).
|
Days Wait Time= Delivery Delay*"Days/week"
~ day
~ |
"Lean Switch, 1=PA"= 1
~ DMNL
~ |
"Agile Switch, 1=Cent"= 0
~ DMNL
~ |
Effect of Work Pressure on Workweek= IF THEN ELSE("Agile Switch, 1=Cent"=1,"Table for Effect of Work
Pressure on Workweek -- Centralized"(Work Pressure), "Table for Effect of Work Pressure on Workweek -
- Distributed"(Work Pressure))
~ Dimensionless
~ High schedule pressure leads to overtime; low pressure to a reduction in \
hours worked.
|
Desired Workforce=SMOOTH(Desired Service Capacity / Perceived Employee Effectiveness , Time to
Adjust Desired Workforce)*(1+"Capacity Slack Fraction (can be included as a test)")
~ Employees
~ Desired number of employees based on the throughput requirements, the \
perceived employee effectiveness, and a slack fraction to ensure excess \
capacity to absorb random variations. The desired workforce does not \
change instantaneously as it takes time to authorize the changes in the \
desired workforce.
|
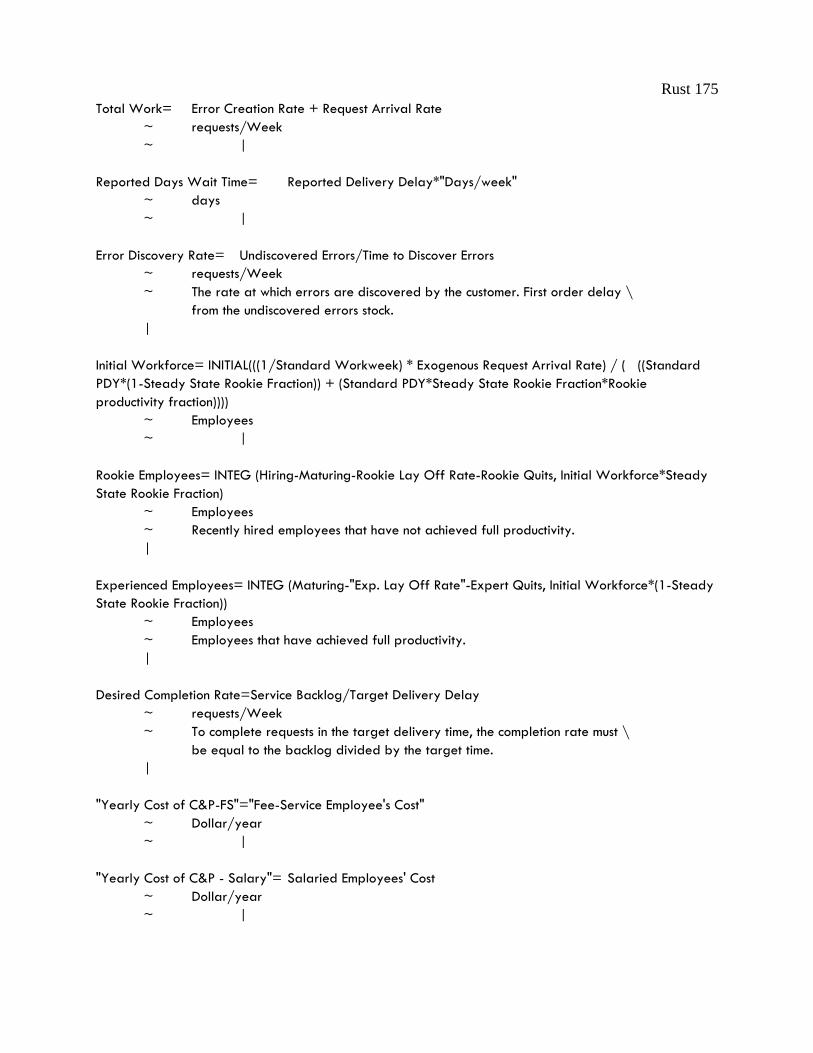
Rust 175
Total Work= Error Creation Rate + Request Arrival Rate
~ requests/Week
~ |
Reported Days Wait Time= Reported Delivery Delay*"Days/week"
~ days
~ |
Error Discovery Rate= Undiscovered Errors/Time to Discover Errors
~ requests/Week
~ The rate at which errors are discovered by the customer. First order delay \
from the undiscovered errors stock.
|
Initial Workforce= INITIAL(((1/Standard Workweek) * Exogenous Request Arrival Rate) / ( ((Standard
PDY*(1-Steady State Rookie Fraction)) + (Standard PDY*Steady State Rookie Fraction*Rookie
productivity fraction))))
~ Employees
~ |
Rookie Employees= INTEG (Hiring-Maturing-Rookie Lay Off Rate-Rookie Quits, Initial Workforce*Steady
State Rookie Fraction)
~ Employees
~ Recently hired employees that have not achieved full productivity.
|
Experienced Employees= INTEG (Maturing-"Exp. Lay Off Rate"-Expert Quits, Initial Workforce*(1-Steady
State Rookie Fraction))
~ Employees
~ Employees that have achieved full productivity.
|
Desired Completion Rate=Service Backlog/Target Delivery Delay
~ requests/Week
~ To complete requests in the target delivery time, the completion rate must \
be equal to the backlog divided by the target time.
|
"Yearly Cost of C&P-FS"="Fee-Service Employee's Cost"
~ Dollar/year
~ |
"Yearly Cost of C&P - Salary"= Salaried Employees' Cost
~ Dollar/year
~ |
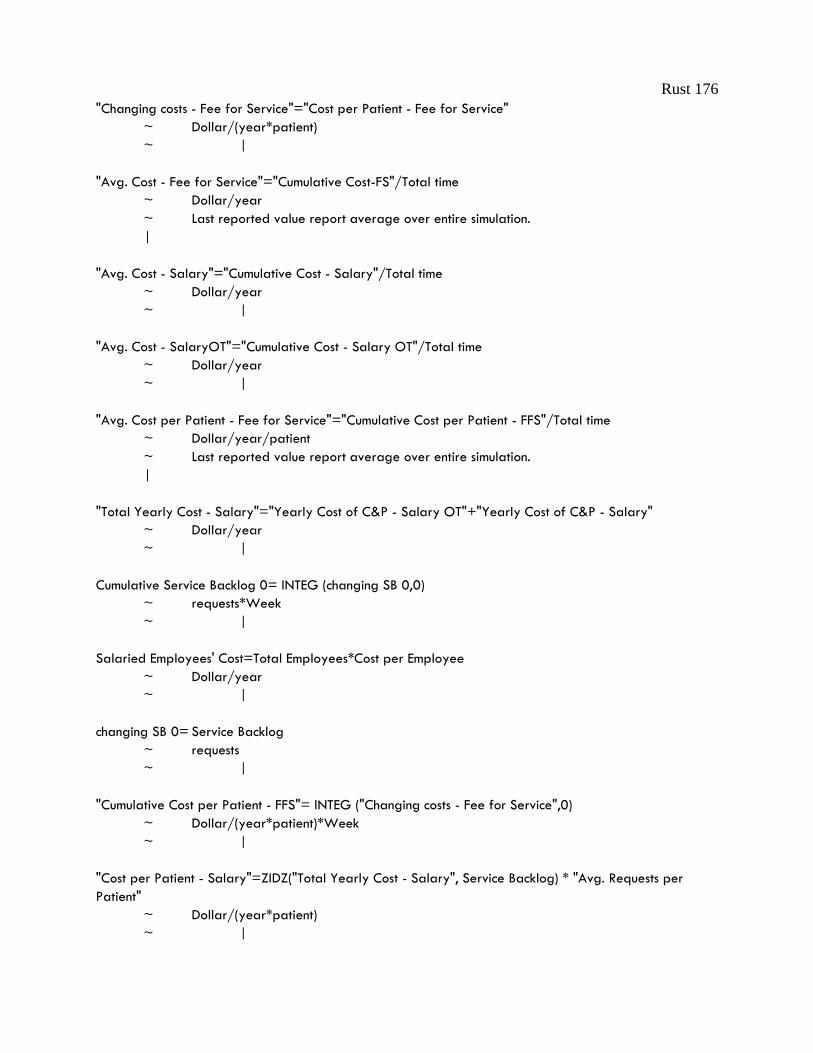
Rust 176
"Changing costs - Fee for Service"="Cost per Patient - Fee for Service"
~ Dollar/(year*patient)
~ |
"Avg. Cost - Fee for Service"="Cumulative Cost-FS"/Total time
~ Dollar/year
~ Last reported value report average over entire simulation.
|
"Avg. Cost - Salary"="Cumulative Cost - Salary"/Total time
~ Dollar/year
~ |
"Avg. Cost - SalaryOT"="Cumulative Cost - Salary OT"/Total time
~ Dollar/year
~ |
"Avg. Cost per Patient - Fee for Service"="Cumulative Cost per Patient - FFS"/Total time
~ Dollar/year/patient
~ Last reported value report average over entire simulation.
|
"Total Yearly Cost - Salary"="Yearly Cost of C&P - Salary OT"+"Yearly Cost of C&P - Salary"
~ Dollar/year
~ |
Cumulative Service Backlog 0= INTEG (changing SB 0,0)
~ requests*Week
~ |
Salaried Employees' Cost=Total Employees*Cost per Employee
~ Dollar/year
~ |
changing SB 0= Service Backlog
~ requests
~ |
"Cumulative Cost per Patient - FFS"= INTEG ("Changing costs - Fee for Service",0)
~ Dollar/(year*patient)*Week
~ |
"Cost per Patient - Salary"=ZIDZ("Total Yearly Cost - Salary", Service Backlog) * "Avg. Requests per
Patient"
~ Dollar/(year*patient)
~ |

Rust 177
"Avg. Total Cost - Salary"="Avg. Cost - Salary" + "Avg. Cost - SalaryOT"
~ Dollar/year
~ Last reported value report average over entire simulation.
|
"Cost per Patient - Fee for Service"=ZIDZ("Yearly Cost of C&P-FS", Service Backlog) * "Avg. Requests per
Patient"
~ Dollar/(year*patient)
~ |
"Cumulative Cost - Salary OT"= INTEG ("Yearly Cost of C&P - Salary OT",0)
~ (Dollar/year)*Week
~ |
OT Cost Ratio= 1.5
~ DMNL
~ Salaried employees make time and a half if they work overtime.
|
"Yearly Cost of C&P - Salary OT"=((IF THEN ELSE(Workweek>Standard Workweek,
(Workweek/Standard Workweek)-1, 0))*Total Employees*Cost per Employee)*(OT Cost Ratio)
~ Dollar/year
~ |
"Fee-Service Employee's Cost"= (Workweek/Standard Workweek)*Total Employees*Cost per Employee
~ Dollar/year
~ |
"Cumulative Cost - Salary"= INTEG ("Yearly Cost of C&P - Salary",0)
~ (Dollar/year)*Week
~ |
Noise Multiplier= 1
~ DMNL [1,5,0.1]
~ Multiply the standard deviation by 2 for demand to match historical data \
without including a separate spike.
|
Noise Standard Deviation=0.075*Noise Multiplier
~ Dimensionless
~ The standard deviation of the pink noise process.
|
Cumulative Delivery Delay 0= INTEG (changing delivery delay,0)
~ Week*Week
Rust 178
~ |
changing delivery delay=Delivery Delay
~ Week
~ I use this to calculate average performance.
|
"Avg. Delivery Delay"= (Cumulative Delivery Delay 0/Total time)*"Days/week 0"
~ day
~ Last reported value report average over entire simulation.
|
"Days/week 0"= 7
~ day/Week
~ |
"Avg. Absolute Delivery Delay Error"=(Cumulative Error in Delivery Delay/Total time)*"Days/week"
~ day
~ Last reported value report average over entire simulation.
|
"Avg. Instantaneous PDY"=Effective Workforce/Total Employees
~ Dimensionless
~ |
Effect of Inexperience on Probability of Error Free=Table for Effect of Inexperience on PEF("Avg.
Instantaneous PDY")
~ Dimensionless
~ The more experience the workforce has, the less likely they will be of \
introducing an error while processing a task. Average Productivity is used \
as a proxy for experience since it captures the amount learning achieved \
by the workforce.
|
"Avg. Reported Delivery Delay"=(Cumulative Delivery Delay/Total time)*"Days/week"
~ day
~ Last reported value report average over entire simulation.
|
Standard Workweek= Normal Workweek
~ hours/Week
~ Hours worked per week under normal conditions, i.e., neutral work pressure.
|
"Days/week"= 7
~ day/Week
Rust 179
~ |
changing insufficiency= Insufficiency Rate
~ Dimensionless
~ |
changing CU= Clinic Utilization Rate
~ Dimensionless
~ |
Cost per Employee=IF THEN ELSE("Lean Switch, 1=PA"=1,75000, 150000)
~ Dollar/year/Employees
~ Sp=150000, PA=75000
|
"Avg. Backlog"=Cumulative Service Backlog/Total time
~ requests
~ Last reported value report average over entire simulation.
|
"Avg. Clinic Utilization Rate"=Cumulative CU Rate/Total time
~ Dimensionless
~ Last reported value report average over entire simulation.
|
"Avg. Cost per Patient - Salary"="Cumulative Cost per Patient - S"/Total time
~ Dollar/year/patient
~ Last reported value report average over entire simulation.
|
"Avg. Insuff- iciency Rate"=Cumulative Insufficiency Rate/Total time
~ Dimensionless
~ Last reported value report average over entire simulation.
|
"Avg. Productivity"="Cumulative Avg. PDY"/Total time
~ requests/Employees/hours
~ Last reported value report average over entire simulation.
|
"Avg. Requests per Patient"= 1.6
~ requests/patient
~ |
"Avg. Service Capacity"=(Cumulative Service Capacity/Total time)
~ Employees
Rust 180
~ Last reported value report average over entire simulation.
|
"Cumulative Cost-FS"= INTEG ("Yearly Cost of C&P-FS",0)
~ (Dollar/year)*Week
~ |
Long Term Workweek= SMOOTHI(Workweek, Burnout Onset Time , Standard Workweek)
~ hours/Week
~ Exponential smoothing of the workweek over the period for the onset of \
burnout. The 'long term' label refers to the fact that the burnout onset \
time is much longer than the fatigue onset time.
|
changing SB= Service Backlog
~ requests
~ |
"Changing costs - Salary"="Cost per Patient - Salary"
~ Dollar/(year*patient)
~ |
"Prod- uctivity"=(Service Capacity/Total Employees)*(Standard PDY)
~ requests/Employees/hours
~ Average productivity for Total personnel.
|
Clinic Utilization Rate=Workweek/Standard Workweek
~ Dimensionless
~ |
Cumulative Service Backlog= INTEG (changing SB,0)
~ requests*Week
~ |
"Cumulative Avg. PDY"= INTEG (changing productivity,0)
~ requests/Employees/hours*Week
~ |
Recent Workweek=SMOOTHI(Workweek, Fatigue Onset Time,Standard Workweek )
~ hours/Week
~ Exponential smoothing of the workweek over the period for the onset of \
fatigue. The 'short term' label refers to the fact that the burnout onset \
time is much longer than the fatigue onset time.
|

Rust 181
"Cumulative Cost per Patient - S"= INTEG ("Changing costs - Salary",0)
~ Dollar/(year*patient)*Week
~ |
Cumulative CU Rate= INTEG (changing CU,0)
~ Dimensionless*Week
~ |
Total time= 150
~ Week
~ |
Cumulative Insufficiency Rate= INTEG (changing insufficiency,0)
~ Dimensionless*Week
~ |
Cumulative Service Capacity= INTEG (changing service capacity,0)
~ Employees*Week
~ |
Effect of Fatigue on Probability of Error Free= Table for Effect of Fatigue on PEF(Recent
Workweek/Standard Workweek)
~ Dimensionless
~ The longer the workweek, the more likely it is employees will introduce an \
error while processing a task.
|
Effect of Burnout on Turnover= Table for Effect of Burnout on Turnover(Long Term Workweek/Standard
Workweek)
~ Dimensionless
~ The higher the workweek, the higher the turnover rate. The accumulation of \
the workweek happens over a period of 52 weeks.
|
changing productivity= "Prod- uctivity"
~ requests/Employees/hours
~ |
Workweek=Effect of Work Pressure on Workweek*Standard Workweek
~ hours/Week
~ The workweek is the standard workweek modified by the effect of schedule \
pressure on workweek.
|
Desired Service Capacity=Desired Completion Rate/(Standard PDY*Standard Workweek)
~ Employees

Rust 182
~ This is the required service capacity based on the desired production rate \
and the standard work intensity and time allocation.
|
Standard Completion Rate=Service Capacity*Standard Workweek*Standard PDY
~ requests/Week
~ The standard completion rate is the rate at which tasks would be completed \
by the current workforce at the standard workday and spending the standard \
time on each task.
|
changing service capacity= Service Capacity
~ Employees
~ |
Target Insufficiency Rate=0.01
~ Dimensionless
~ |
Insufficiency Rate=Error Creation Rate/Request Completion Rate
~ Dimensionless
~ |
Service Capacity=Effective Workforce*Effect of Fatigue on Productivity
~ Employees
~ The workforce effectiveness is affected by the accumulated fatigue \
resulting from extended workweeks.
|
Workforce Adjustment Rate=(Desired Workforce-Total Employees)/ Time to Adjust Workforce
~ Employees/Week
~ Adjustments to the workforce. Smoothed over the time to adjust workforce.
|
Perceived Employee Effectiveness=SMOOTH( Service Capacity/Total Employees, Time to Perceive
Productivity )
~ Dimensionless
~ Management perception of workforce effectiveness. Note that this is an \
aggregate measure that does not distinguish the employees experience, nor \
the effects of fatigue, work intensity, or productivity.
|
changing delay=ABS(Delivery Delay-Target Delivery Delay)
~ Week
~ |
Rust 183
changing reported delay=Reported Delivery Delay
~ Week
~ I use this to calculate average performance.
|
Delivery Delay=Service Backlog/Request Completion Rate
~ Week
~ The average time to complete customer requests is determined by Little's \
Law as the ratio of the backlog to completion rate.
|
Cumulative Delivery Delay= INTEG (changing reported delay,0)
~ Week*Week
~ |
Target Clinic Utilization=1
~ DMNL
~ |
Reported Delivery Delay=DELAY FIXED(Delivery Delay, 8, Delivery Delay)
~ Week
~ There is a 2 month reporting delay as data from each facility is sent to \
the national office, then returned to the sites in an official monthly \
report.
|
Ramp End Time 2=95
~ Week
~ End time for the ramp input.
|
Ramp Slope=-0.001
~ 1/Week
~ Slope of the ramp input, as a fraction of the base value (per week).
|
Ramp Slope 2=0
~ 1/Week
~ Slope of the ramp input, as a fraction of the base value (per week).
|
Ramp Start Time=0
~ Week
~ Start time for the ramp input.
|
Rust 184
Ramp Start Time 2=87.5
~ Week
~ Start time for the ramp input.
|
Hiring=MAX(Desired Hiring Rate, 0)
~ Employees/Week
~ Vacancies filled by hiring.
|
Ramp End Time=500
~ Week
~ End time for the ramp input.
|
Perceived Error Discovery Rate=SMOOTH(Error Discovery Rate, Time To Perceive Arrival Rate)
~ requests/Week
~ The instantaneous error discovery rate, averaged over the period of 1 \
week. VAMC Boston managers receive weekly reports on rework.
|
Perceived Completion Rate=SMOOTH(Request Completion Rate , Time To Perceive Arrival Rate)
~ requests/Week
~ The instantaneous request completion rate, averaged over the period of 1 \
week. VAMC Boston managers receive weekly reports on work completed.
|
Perceived Request Arrival Rate=SMOOTHI(Request Arrival Rate, Time To Perceive Arrival Rate, Request
Arrival Rate)
~ requests/Week
~ The instantaneous demand averaged over the period of 1 week. VAMC Boston \
managers receive weekly reports on demand.
|
Time To Perceive Arrival Rate= 0.1
~ Week
~ VAMC Boston runs reports weekly on most C&P data.
|
Duration Over Which To Calculate Trend=2
~ Week
~ Duration Over Which To Calculate Trend
|
"Exp. Lay Off Rate"=IF THEN ELSE( Rookie Lay Off Rate < Desired Lay Off Rate, MIN(Desired Lay Off
Rate, \
Rust 185
Maximum Layoff Rate), 0 )
~ Employees/Week
~ |
"endogeneous P-control"=Desired Completion Rate
~ requests/Week
~ Proportional reaction to endogenous variable (service backlog).
|
Accumulating Error=
(Desired Completion Rate-Request Completion Rate)/Error Correction Time
~ requests/(Week*Week)
~ Changes in gap between desired and actual completion rates.
|
Change in Error=((Desired Completion Rate-Request Completion Rate)-Exp Avg of Error) / Error Correction
Time
~ requests/(Week*Week)
~ |
Cumulative Error= INTEG (Accumulating Error,0)
~ requests/Week
~ Accumulation of uncorrected error. Allows for error correction even when \
proportional control has waned due to reduction in the instantaneous error.
|
Error Correction Time= 8
~ Week
~ Time to correct error between desired and actual completion rates.
|
Exp Avg of Error= INTEG (Change in Error,0)
~ requests/Week
~ Historical average of change in gap between desired and actual completion \
rates.
|
"exogeneous P-Control"=Request Arrival Rate
~ requests/Week
~ Proportional reaction to exogenous variable (demand).
|
weight of demand=1
~ DMNL [0,1,0.1]
~ Determines how much the system responds to exogenous or endogenous \
variables.

Rust 186
|
Normal Workweek=40
~ hours/Week
~ |
Probability of Error Generation=1-(Effect of Fatigue on Probability of Error Free*Effect of Inexperience
on Probability of Error Free\
)
~ Dimensionless
~ Formulated as one minus the combined probability of being error free from \
fatigue and inexperience.
|
"Table for Effect of Work Pressure on Workweek -- Distributed"( [(-0.25,0)-(2.25,2)],(-
0.25,0.8),(0,0.8),(0.15,0.82),(0.25,0.85),(0.4,0.9),(0.5,0.9),(0.75,0.98),(1,1),(1.25,1.02),(1.5,1.035),(1.75,
1.045),(2,1.05),(2.25,1.05))
~ Dimensionless
~ High schedule pressure leads to longer hours.
|
"Table for Effect of Work Pressure on Workweek -- Centralized"( [(-0.25,0)-(2.25,2)],(-
0.25,0.5),(0,0.5),(0.25,0.55),(0.5,0.69),(0.75,0.85),(1,1),(1.25,1.15),(1.5,1.3),(1.75,1.4),(2,1.45),(2.25,1.4
5))
~ Dimensionless
~ High schedule pressure leads to longer hours.
|
"Avg. Layoff Time"=IF THEN ELSE("Agile Switch, 1=Cent"=1,8, 2)
~ Week
~ The average time required to lay off a worker. Laying off clinicians \
working directly under C&P is a full HR process (8 weeks). Borrowed staff \
only take 2 weeks to remove: all they have to do is re-structure their \
clinic profiles in the EMR.
|
Maximum Layoff Rate= Rookie Employees/"Avg. Layoff Time"
~ Employees/Week
~ The maximum layoff rate is determined by the number of workers and the \
layoff time.
|
Desired Lay Off Rate=
Willingness to Lay Off * MAX(0, -Desired Hiring Rate)
~ Employees/Week
~ The firm desires to lay people off whenever the desired hiring rate is \
Rust 187
negative, modified by their willingness to lay off. Willingness to Lay \
Off = 0 implies a no layoff policy.
|
Rookie Lay Off Rate= MIN(Desired Lay Off Rate, Maximum Layoff Rate)
~ Employees/Week
~ The layoff rate is the lesser of the desired or maximum rate.
|
Willingness to Lay Off= 1
~ Dimensionless
~ The willingness to layoff employees. Zero = no layoff policy; 1 implies \
the firm is just as willing to layoff employees when there are too many as \
to hire when there are too few.
|
Cumulative Error in Delivery Delay= INTEG (changing delay,0)
~ Week*Week
~ |
Expert Quits=Experienced Employees*Experienced Quit Fraction*Effect of Burnout on Turnover
~ Employees/Week
~ Experienced employees turnover.
|
Steady State Rookie Fraction="Matur-ing Time"*(Experienced Quit Fraction)/(1+"Matur-ing
Time"*Experienced Quit Fraction\
)
~ Dimensionless
~ Rookie fraction in equilibrium, or steady state growth. Used to initialize \
the model.
|
"Capacity Slack Fraction (can be included as a test)"=0
~ Dimensionless
~ Test constant to introduce permanent slack in the authorization of the \
workforce. Set to 0 to start the system in equilibrium
|
Effective Workforce=Experienced Employees+(Rookie Employees*Rookie productivity fraction)
~ Employees
~ Expected output from the labor pool accounting for the effect of labor mix \
on average productivity. Measured in FTE (Fully Trained Equivalents).
|
Desired Hiring Rate=Replacement Rate+Workforce Adjustment Rate
Rust 188
~ Employees/Week
~ The desired hiring rate replaces employees that left the hospital and \
adjust for changes in the desired workforce.
|
Replacement Rate=Total Quit Rate
~ Employees/Week
~ Employee replacement rate is equal to the total employee turnover rate.
|
"Matur-ing Time"=IF THEN ELSE("Agile Switch, 1=Cent"=1,16, 52)
~ Week
~ Average time required to achieve the productivity of a Fully Trained \
employee. Clinicians working directly for C&P mature faster (in only 16 \
weeks) because they gain experience faster than borrowed staff (who only \
work on average 20% of their time on C&P, and thus take 52 weeks to reach \
full productivity).
|
Time to Adjust Workforce=IF THEN ELSE("Agile Switch, 1=Cent"=1,52, 16)
~ Week
~ Time to adjust the workforce. Set to 4 months for borrowing staff: \
includes negotiation with other service line, internal negotiation within \
that service, restructuring clinic profiles, and informing C&P clerks. Set \
to 1 year for hiring, as it includes creating and filling a vacancy in HR \
and credentialling processes.
|
Rookie productivity fraction=0.5
~ Dimensionless [0,1]
~ Initial rookie productivity measured as a fraction of the productivity of \
a Fully Trained Employee.
|
Rookie Quits=Rookie Employees*Rookie Quit Fraction*Effect of Burnout on Turnover
~ Employees/Week
~ Rookie employees turnover.
|
Total Employees=Rookie Employees+Experienced Employees
~ Employees
~ Total employees.
|
Experienced Quit Fraction=IF THEN ELSE("Agile Switch, 1=Cent"=1, 0.005, 0.02)
~ Dimensionless/Week [0,2]

Rust 189
~ Fraction of Experienced employees that leaves C&P every week. Centralized \
staff are less likely to quit, as they work for C&P full time; whereas \
currrenlty most specialists view C&P as secondary to their normal work.
|
Time to Adjust Desired Workforce=2
~ Week
~ Time to adjust the desired workforce. Set to 2 weeks based on VAMC Boston \
data.
|
Time to Perceive Productivity=13
~ Week
~ Time to measure, report, and assess employee productivity. Set to 13 \
weeks, i.e., a quarterly update.
|
Total Quit Rate=Rookie Quits+Expert Quits
~ Employees/Week
~ Total turnover rate.
|
Maturing=Rookie Employees/"Matur-ing Time"
~ Employees/Week
~ Rate of employees gaining full productivity.
|
Rookie Quit Fraction=0
~ Dimensionless/Week
~ Fraction of rookie employees that leaves the firm every week.
|
Table for Effect of Burnout on Turnover([(0,0)-(3,5)],(0,1),(1,1),(1.3,1.8),(1.7,4.5),(2,5),(3,5))
~ Dimensionless
~ The higher the burnout (higher average work week over a period of 52 \
weeks) the higher the turnover rate.
|
Initial Arrival Rate= INITIAL(655)
~ requests/Week
~ The initial rate at which work arrives is set to the initial value of the \
standard completion rate. Note that the equation type is INITIAL, which \
ensures that the initial arrival rate remains constant even if the \
standard completion rate varies. By setting the initial arrival rate to \
the standard completion rate we ensure that tasks arrive at exactly the \
rate the organization can handle given the initial staff and standard \

Rust 190
values for the workday and time per task.
|
Table for Effect of Fatigue on
PEF([(0,0)(3,1)],(0,1),(1,1),(1.2,0.98),(1.4,0.96),(1.6,0.93),(1.8,0.9),(2,0.86),(2.2,0.82),(2.4,0.75),(2.6,0.65),
(2.8,0.43),(3,0))
~ Dimensionless
~ Non-linear relationship. Effect of Fatigue on PEF = f(Recent \
Workweek/Standard Workweek).
|
Error Creation Rate=IF THEN ELSE(Rework Switch=1, Request Completion Rate*Probability of Error
Generation, 0)
~ requests/Week
~ |
Table for Effect of Inexperience on PEF([(0,0)-
(1,1)],(0,0),(0.1,0.25),(0.2,0.45),(0.3,0.6),(0.4,0.631579),(0.617737,0.635965),(0.672783,0.824561),(0.
745,1),(1,1))
~ Dimensionless
~ Non-linear relationship. Effect of Inexperience on PEF = f(Average \
Productivity)
|
Time to Discover Errors= 4
~ Week [1,24,1]
~ On average, the VBA reads the reports 1 month after sumbission.
|
Exogenous Request Arrival Rate=MAX (Initial Arrival Rate*Input, 0)
~ requests/Week
~ The exogenous request arrival rate can be configured to include a range of \
test inputs. It is set to the product of the initial arrival rate and the \
test input. The test input allows users to specify a range of input \
patterns, including a step, pulse, ramp, cycle, and pink noise, or \
combinations of these.
|
Burnout Onset Time=52
~ Week
~ Time for the extended workweek to have an effect on turnover.
|
Pulse Quantity= 0
~ Dimensionless*Week
~ The quantity to be injected to customer orders, as a fraction of the base value of \
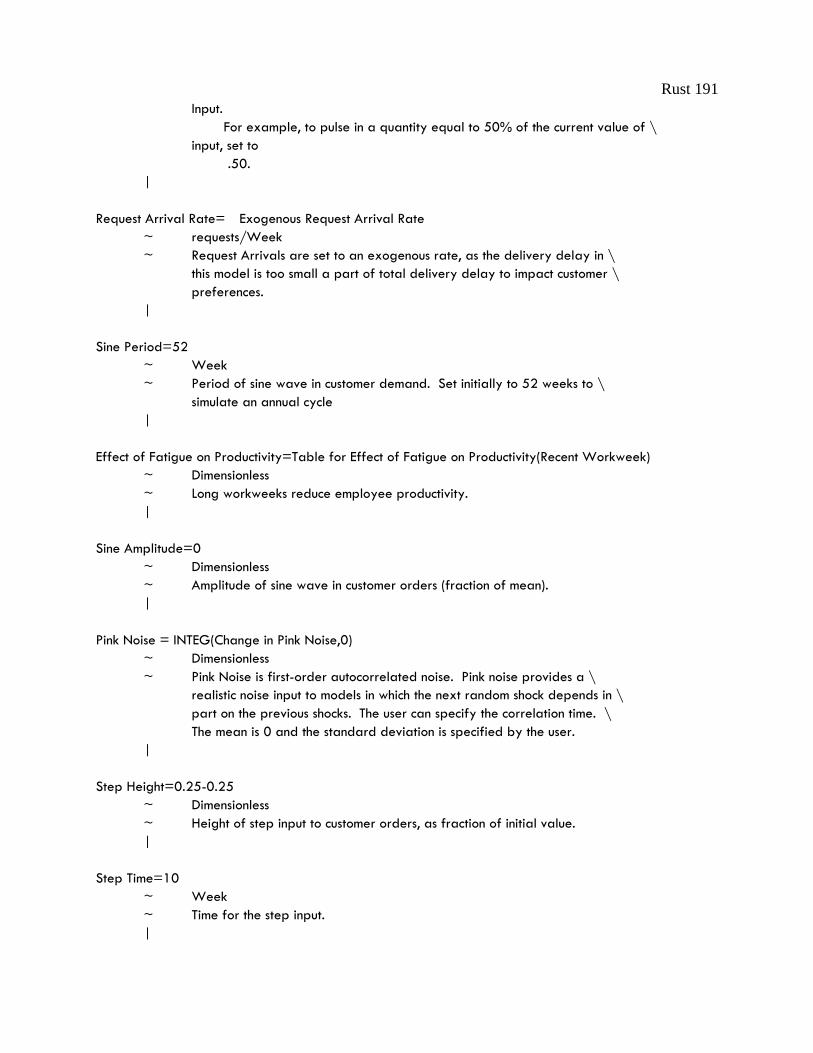
Rust 191
Input.
For example, to pulse in a quantity equal to 50% of the current value of \
input, set to
.50.
|
Request Arrival Rate= Exogenous Request Arrival Rate
~ requests/Week
~ Request Arrivals are set to an exogenous rate, as the delivery delay in \
this model is too small a part of total delivery delay to impact customer \
preferences.
|
Sine Period=52
~ Week
~ Period of sine wave in customer demand. Set initially to 52 weeks to \
simulate an annual cycle
|
Effect of Fatigue on Productivity=Table for Effect of Fatigue on Productivity(Recent Workweek)
~ Dimensionless
~ Long workweeks reduce employee productivity.
|
Sine Amplitude=0
~ Dimensionless
~ Amplitude of sine wave in customer orders (fraction of mean).
|
Pink Noise = INTEG(Change in Pink Noise,0)
~ Dimensionless
~ Pink Noise is first-order autocorrelated noise. Pink noise provides a \
realistic noise input to models in which the next random shock depends in \
part on the previous shocks. The user can specify the correlation time. \
The mean is 0 and the standard deviation is specified by the user.
|
Step Height=0.25-0.25
~ Dimensionless
~ Height of step input to customer orders, as fraction of initial value.
|
Step Time=10
~ Week
~ Time for the step input.
|

Rust 192
Fatigue Onset Time=3
~ Week
~ Time for the extended workweeks to have an impact on employee productivity.
|
Pulse Time=1e+012
~ Week
~ Time at which the pulse in Input occurs.
|
White Noise = Noise Standard Deviation*((24*Noise Correlation Time/TIME STEP)^0.5*(RANDOM 0 1\
() - 0.5))
~ Dimensionless
~ White noise input to the pink noise process.
|
Noise Start Time=1e+014
~ Week
~ Start time for the random input.
|
Undiscovered Errors= INTEG (Error Creation Rate-Error Discovery Rate, Error Creation Rate*Time to
Discover Errors)
~ requests
~ Stock of undiscovered errors.
|
Noise Correlation Time= 10
~ Week [2,100,2]
~ The correlation time constant for Pink Noise.
|
Noise Seed= 0
~ Dimensionless [0,100,1]
~ Random number generator seed. Vary to generate a different sequence of \
random numbers.
|
Work Pressure= Desired Service Capacity/Service Capacity
~ Dimensionless
~ |
Table for Effect of Fatigue on Productivity([(0,0)-
(160,1.3)],(0,1.1),(20,1.07),(40,1),(60,0.8),(80,0.4),(100,0.1),(120,0.03),(140,0.01),(160,0))
~ Dimensionless
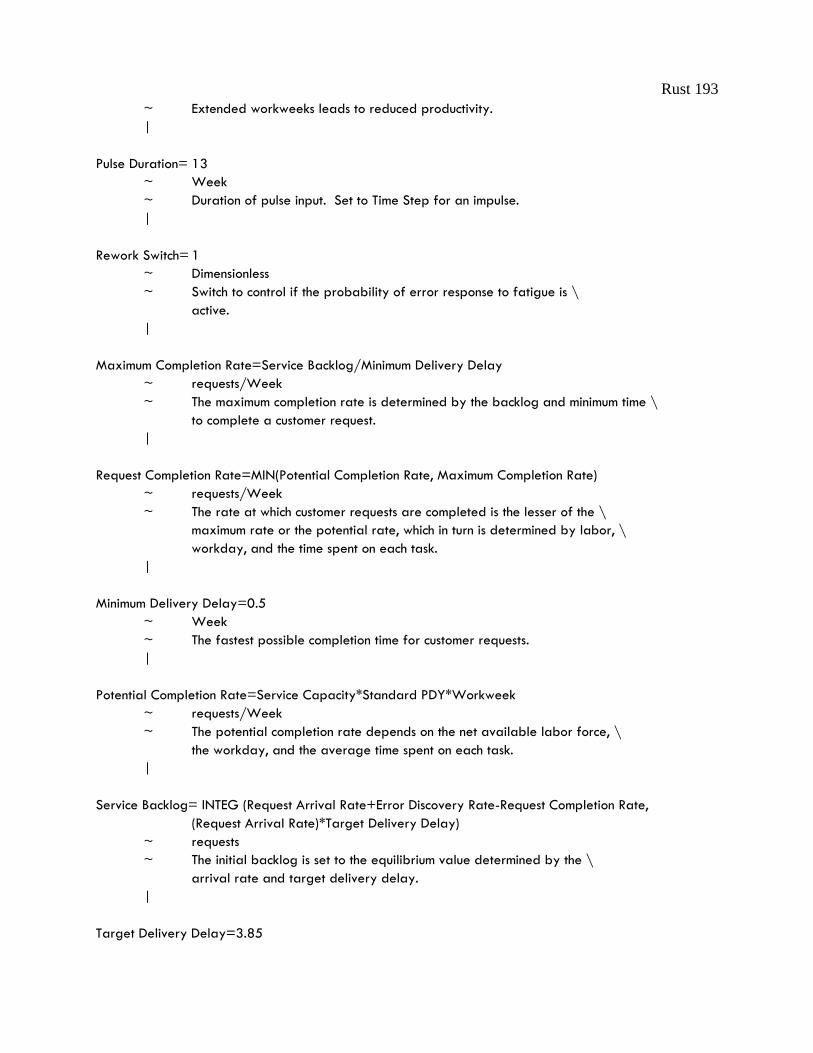
Rust 193
~ Extended workweeks leads to reduced productivity.
|
Pulse Duration= 13
~ Week
~ Duration of pulse input. Set to Time Step for an impulse.
|
Rework Switch= 1
~ Dimensionless
~ Switch to control if the probability of error response to fatigue is \
active.
|
Maximum Completion Rate=Service Backlog/Minimum Delivery Delay
~ requests/Week
~ The maximum completion rate is determined by the backlog and minimum time \
to complete a customer request.
|
Request Completion Rate=MIN(Potential Completion Rate, Maximum Completion Rate)
~ requests/Week
~ The rate at which customer requests are completed is the lesser of the \
maximum rate or the potential rate, which in turn is determined by labor, \
workday, and the time spent on each task.
|
Minimum Delivery Delay=0.5
~ Week
~ The fastest possible completion time for customer requests.
|
Potential Completion Rate=Service Capacity*Standard PDY*Workweek
~ requests/Week
~ The potential completion rate depends on the net available labor force, \
the workday, and the average time spent on each task.
|
Service Backlog= INTEG (Request Arrival Rate+Error Discovery Rate-Request Completion Rate,
(Request Arrival Rate)*Target Delivery Delay)
~ requests
~ The initial backlog is set to the equilibrium value determined by the \
arrival rate and target delivery delay.
|
Target Delivery Delay=3.85
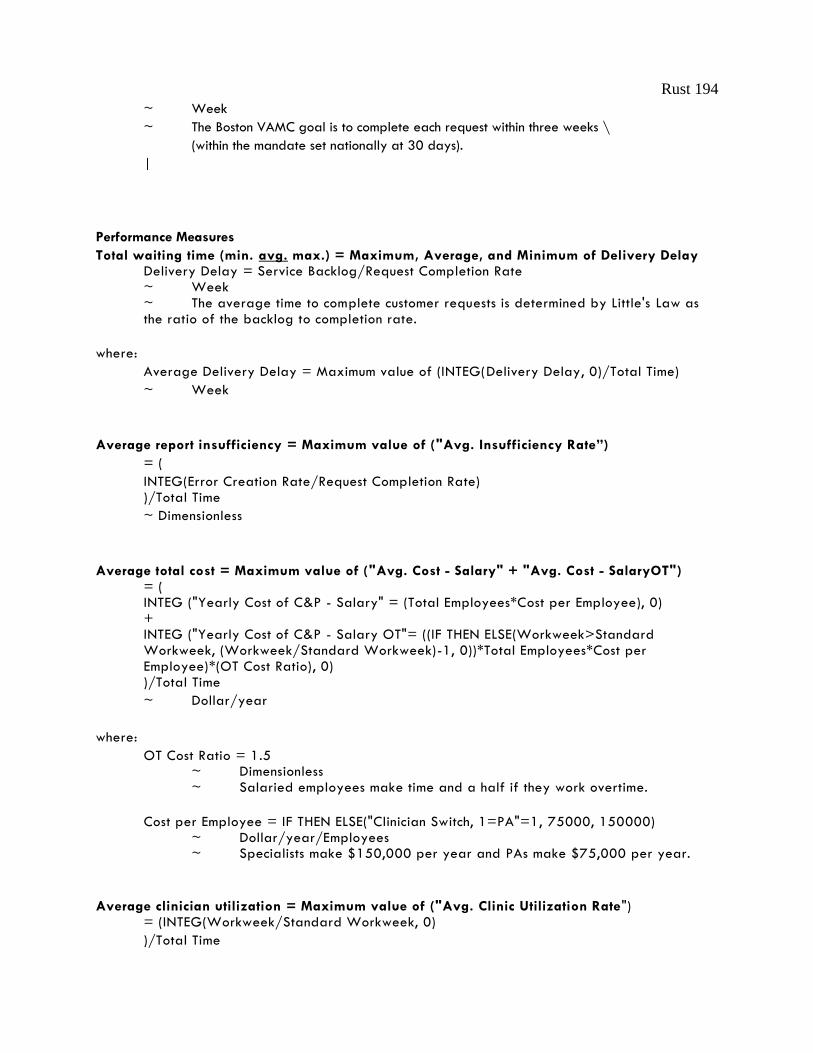
Rust 194
~ Week
~ The Boston VAMC goal is to complete each request within three weeks \
(within the mandate set nationally at 30 days).
|
Performance Measures
Total waiting time (min. avg. max.) = Maximum, Average, and Minimum of Delivery Delay Delivery Delay = Service Backlog/Request Completion Rate
~ Week ~ The average time to complete customer requests is determined by Little's Law as
the ratio of the backlog to completion rate.
where:
Average Delivery Delay = Maximum value of (INTEG(Delivery Delay, 0)/Total Time)
~ Week
Average report insufficiency = Maximum value of ("Avg. Insufficiency Rate”)
= (
INTEG(Error Creation Rate/Request Completion Rate) )/Total Time
~ Dimensionless
Average total cost = Maximum value of ("Avg. Cost - Salary" + "Avg. Cost - SalaryOT") = ( INTEG ("Yearly Cost of C&P - Salary" = (Total Employees*Cost per Employee), 0) + INTEG ("Yearly Cost of C&P - Salary OT"= ((IF THEN ELSE(Workweek>Standard Workweek, (Workweek/Standard Workweek)-1, 0))*Total Employees*Cost per Employee)*(OT Cost Ratio), 0) )/Total Time
~ Dollar/year
where:
OT Cost Ratio = 1.5 ~ Dimensionless ~ Salaried employees make time and a half if they work overtime.
Cost per Employee = IF THEN ELSE("Clinician Switch, 1=PA"=1, 75000, 150000) ~ Dollar/year/Employees ~ Specialists make $150,000 per year and PAs make $75,000 per year.
Average clinician utilization = Maximum value of ("Avg. Clinic Utilization Rate")
= (INTEG(Workweek/Standard Workweek, 0)
)/Total Time

Rust 195
~ Dimensionless
Average clinician productivity = Maximum value of ("Avg. Productivity Rate") = (INTEG ((Service Capacity/Total Employees)*(Standard PDY), 0) )/Total Time ~ requests/Employees/hours ~ Average productivity for Total personnel.
Average cost per patient = Maximum value of ("Avg. Cost per Patient - Salary") = INTEG(ZIDZ(("Yearly Cost of C&P - Salary OT"+"Yearly Cost of C&P - Salary"), Service Backlog) * "Avg. Requests per Patient", 0) / Total Time) ~ Dollar/(year*patient)
where:
"Avg. Requests per Patient" = 1.6 ~ requests/patient
Avg. absolute waiting time error = Maximum value of ("Avg. Absolute Delivery Delay Error")
= (INTEG((ABS(Delivery Delay-Target Delivery Delay) )*"Days/week" , 0)
/Total time)
~ day
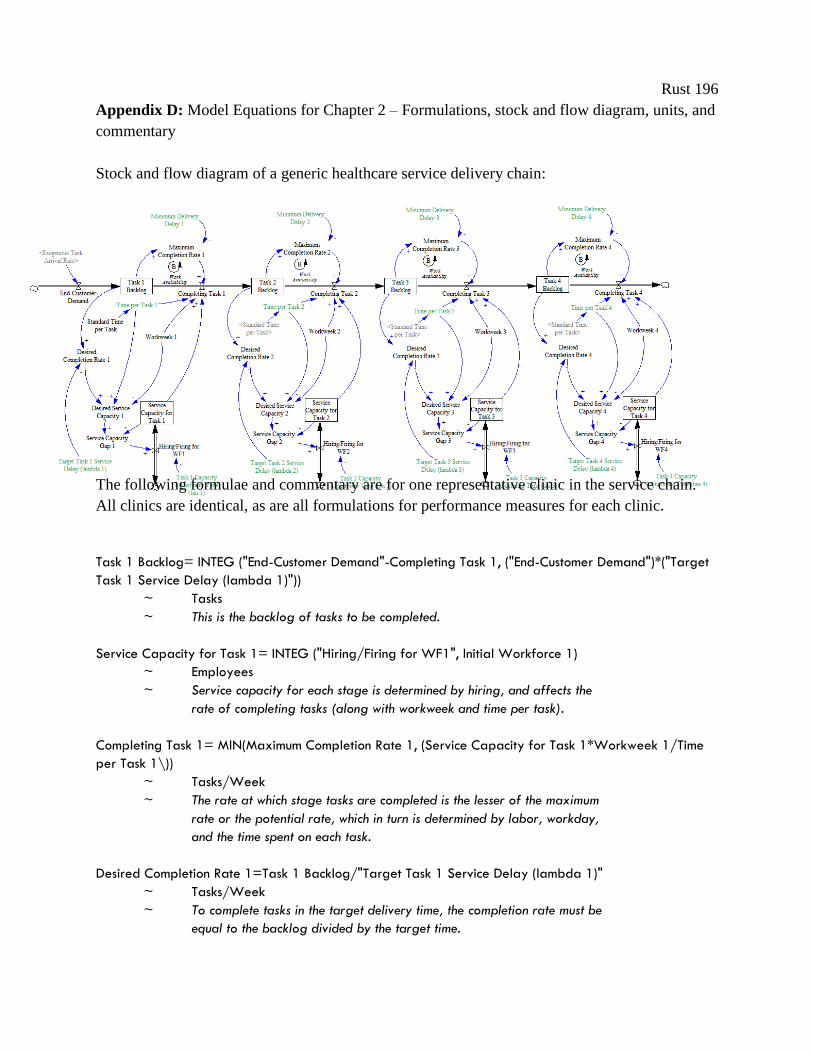
Rust 196
Appendix D: Model Equations for Chapter 2 – Formulations, stock and flow diagram, units, and
commentary
Stock and flow diagram of a generic healthcare service delivery chain:
The following formulae and commentary are for one representative clinic in the service chain.
All clinics are identical, as are all formulations for performance measures for each clinic.
Task 1 Backlog= INTEG ("End-Customer Demand"-Completing Task 1, ("End-Customer Demand")*("Target
Task 1 Service Delay (lambda 1)"))
~ Tasks
~ This is the backlog of tasks to be completed.
Service Capacity for Task 1= INTEG ("Hiring/Firing for WF1", Initial Workforce 1)
~ Employees
~ Service capacity for each stage is determined by hiring, and affects the
rate of completing tasks (along with workweek and time per task).
Completing Task 1= MIN(Maximum Completion Rate 1, (Service Capacity for Task 1*Workweek 1/Time
per Task 1\))
~ Tasks/Week
~ The rate at which stage tasks are completed is the lesser of the maximum
rate or the potential rate, which in turn is determined by labor, workday,
and the time spent on each task.
Desired Completion Rate 1=Task 1 Backlog/"Target Task 1 Service Delay (lambda 1)"
~ Tasks/Week
~ To complete tasks in the target delivery time, the completion rate must be
equal to the backlog divided by the target time.

Rust 197
Desired Service Capacity 1=Desired Completion Rate 1*Time per Task 1/Workweek 1
~ Employees
~ This is the required service capacity based on the desired production rate
and the standard work intensity and time allocation.
Maximum Completion Rate 1=Task 1 Backlog/Minimum Delivery Delay 1
~ Tasks/Week
~ The maximum completion rate is determined by the backlog and minimum time
to complete a customer request.
"Hiring/Firing for WF1"=Service Capacity Gap 1/"Task 1 Capacity Adjustment Time (tau 1)"
~ Employees/Week
~ The hiring or firing rate depends on the gap between the desired and actual
service capacity and the speed at which managers can adjust capacity.
Service Capacity Gap 1= Desired Service Capacity 1-Service Capacity for Task 1
~ Employees
~ This represents manager's actions comparing desired service capacity to
actual service capacity. Note that there are no perception delays, just
action delays.
Time per Task 1=Standard Time per Task*Improvement 1
~ Employees*Hours/Tasks
~ The time spent on each task (in person-hours/task) is the time workers
allocate to each task. Changing this efficiency parameter is the main effect
of lean improvement activities, included here at “improvement 1”
Initial Workforce 1= (Exogenous Task Arrival Rate * Time per Task 1) / Workweek 1
~ Employees
~ This starts the model in equilibrium, with the appropriate size workforce for
the exogenously determined demand rate.
Exogenous Task Arrival Rate=Initial Arrival Rate*Input
~ Tasks/Week
~ The exogenous task arrival rate can be configured to include a range of
test inputs. It is set to the product of the initial arrival rate and the
test input. The test input allows users to specify a range of input
patterns, including a step, pulse, ramp, cycle, and pink noise, or
combinations of these. For simplicity, we only include formulations for
pink noise, as the other demand patterns are straightforward.
Input= 1+STEP(Step Height,Step Time)+
(Pulse Quantity/Pulse Duration)*PULSE(Pulse Time,Pulse Duration)+
RAMP(Ramp Slope,Ramp Start Time,Ramp End Time)+
RAMP(Ramp Slope 2,Ramp Start Time 2,Ramp End Time 2)+
Sine Amplitude*SIN(2*3.14159*Time/Sine Period)+

Rust 198
STEP(1,Noise Start Time)*Pink Noise
~ Dimensionless
~ Input is a dimensionless variable which provides a variety of test input patterns,
including a step, pulse, sine wave, and random noise.
Change in Pink Noise = (White Noise - Pink Noise)/Noise Correlation Time
~ 1/Week
~ Change in the pink noise value; Pink noise is a first order exponential
smoothing delay of the white noise input.
"End-Customer Demand"=Exogenous Task Arrival Rate
~ Tasks/Week
~ End-Customer Demand is set to an exogenous rate.
Pink Noise = INTEG(Change in Pink Noise,0)
~ Dimensionless
~ Pink Noise is first-order auto-correlated noise. Pink noise provides a realistic
noise input to models in which the next random shock depends in part on the
previous shocks. The user can specify the correlation time. The mean is 0 and
the standard deviation is specified by the user.
White Noise = Noise Standard Deviation*((24*Noise Correlation Time/TIME STEP)^0.5*(RANDOM 0 1\
() - 0.5 ))
~ Dimensionless
~ White noise input to the pink noise process.
Parameters
Standard Task Service Delay= 1
~ Week
~ This represents the target service delay for each stage in the service
chain for the average patient.
Standard Time per Task=1
~ Employees*Hours/Tasks
~ How many hour it takes one employee to do one task.
"Task 1 Capacity Adjustment Time (tau 1)"=2
~ Week
~ This represents the time it takes managers to actually manifest the changes in staff they
decide are necessary. A two week capacity adjustment time is the relative equivalent of
a two week delay between deciding to hire a new staff member, and that new employee
actually coming on board.
Initial Arrival Rate=100
~ Tasks/Week

Rust 199
~ This represents the initial exogenous demand rate.
Workweek 1=40
~ Hours/Week
~ Hours worked per week under normal conditions, i.e., neutral work pressure.
Noise Correlation Time= 4
~ Week
~ The correlation time constant for Pink Noise.
Noise Standard Deviation=0.1"
~ Dimensionless
~ The standard deviation of the pink noise process.
Noise Seed= 70
~ Dimensionless
~ Random number generator seed. Vary to generate a different sequence of
random numbers.
Minimum Delivery Delay 1=
0.05
~ Week
~ The fastest possible completion time for customer requests.
Performance Measures
Desired Backlog 1= ("End-Customer Demand")*("Target Task 1 Service Delay (lambda 1)")
~ Tasks
~ The appropriate number of patients (represented by tasks) to keep in a clinic’s
queue to maintain the desired performance time.
"Inst. Average Process Time 1"= Task 1 Backlog/Completing Task 1
~ Week
~ By Little’s Law, this is the average time each patient waits in the queue
before their clinical tasks are complete.
Workload 1= Desired Service Capacity 1/Service Capacity for Task 1
~ Dmnl
~ This is the ratio of patients (converted to the units of “providers” by
the desired performance standard (measured in weeks) to the actual
number of providers available.
"Acc. Workload 1 Error"= INTEG (ABS(Workload 1), 0)
~ Dmnl*Week
~ This is the sum of all error over the course of the simulation. This allows for
one number to represent the dynamic behavior over an entire simulation, to

Rust 200
facilitate easy compare to other simulations.
"Target Task 1 Service Delay (lambda 1)"= Standard Task Service Delay*Improvement 1
~ Week
~ The organization's goal is to for the average customer to complete the process
within 4 weeks (one week per stage of service delivery).
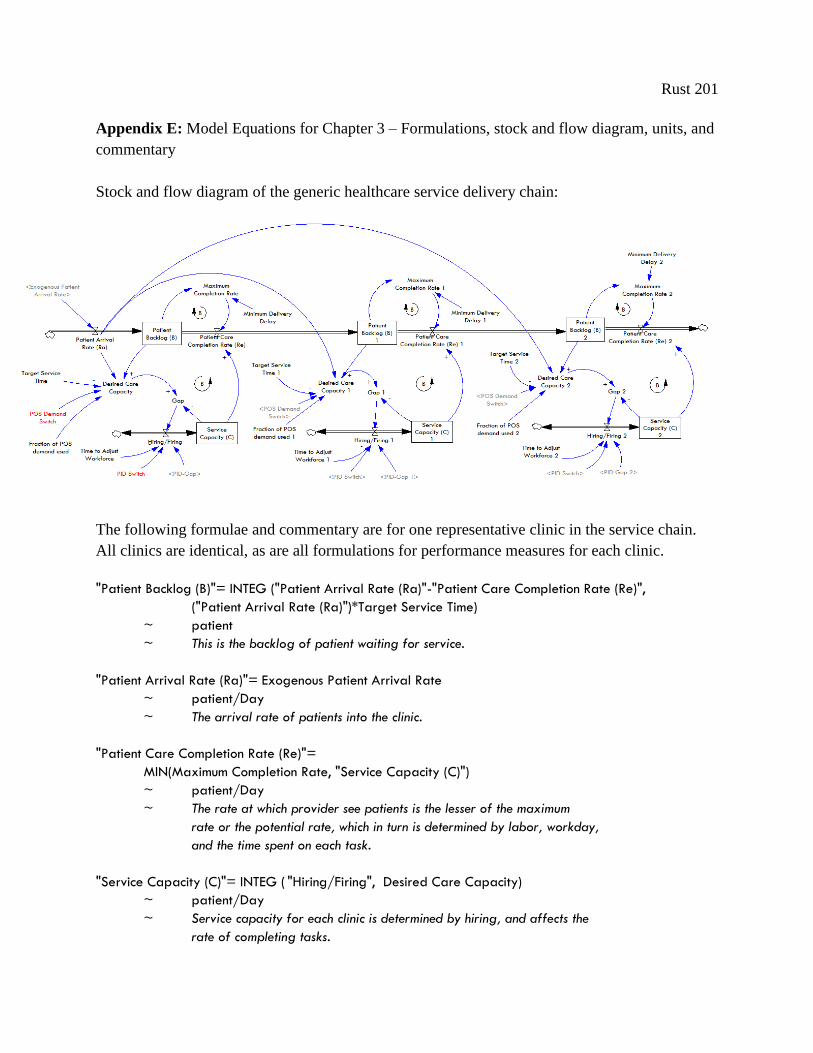
Rust 201
Appendix E: Model Equations for Chapter 3 – Formulations, stock and flow diagram, units, and
commentary
Stock and flow diagram of the generic healthcare service delivery chain:
The following formulae and commentary are for one representative clinic in the service chain.
All clinics are identical, as are all formulations for performance measures for each clinic.
"Patient Backlog (B)"= INTEG ("Patient Arrival Rate (Ra)"-"Patient Care Completion Rate (Re)",
("Patient Arrival Rate (Ra)")*Target Service Time)
~ patient
~ This is the backlog of patient waiting for service.
"Patient Arrival Rate (Ra)"= Exogenous Patient Arrival Rate
~ patient/Day
~ The arrival rate of patients into the clinic.
"Patient Care Completion Rate (Re)"=
MIN(Maximum Completion Rate, "Service Capacity (C)")
~ patient/Day
~ The rate at which provider see patients is the lesser of the maximum
rate or the potential rate, which in turn is determined by labor, workday,
and the time spent on each task.
"Service Capacity (C)"= INTEG ( "Hiring/Firing", Desired Care Capacity)
~ patient/Day
~ Service capacity for each clinic is determined by hiring, and affects the
rate of completing tasks.
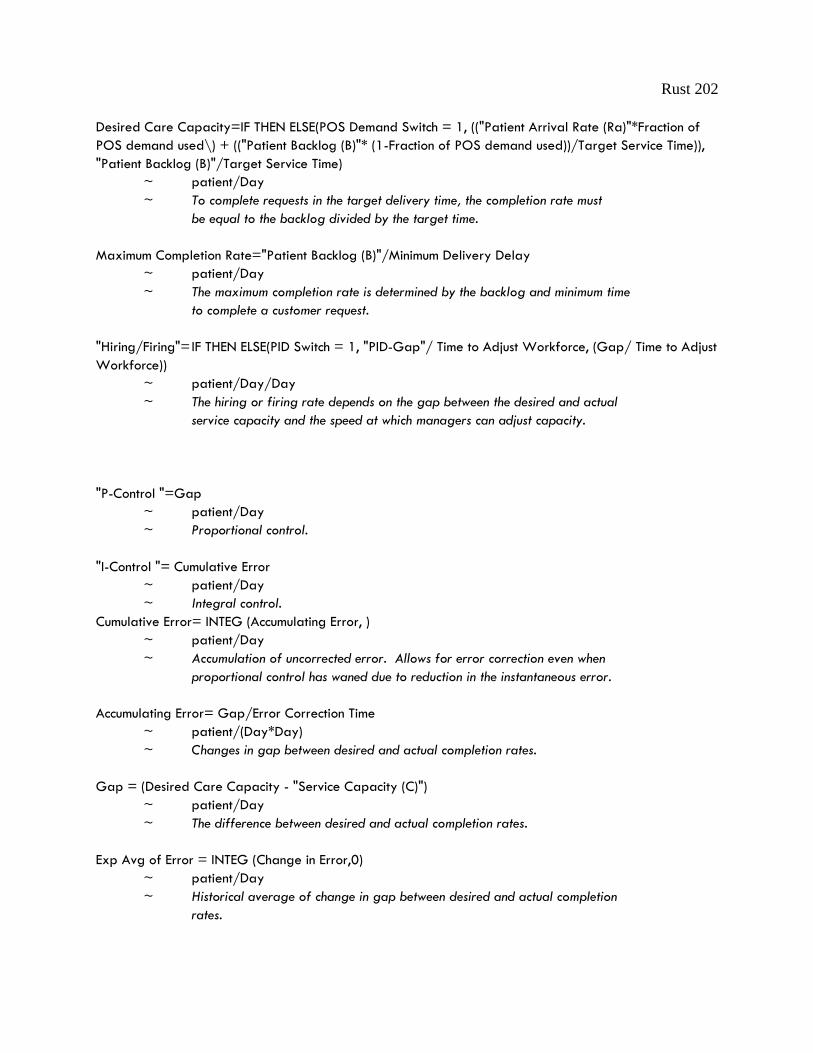
Rust 202
Desired Care Capacity=IF THEN ELSE(POS Demand Switch = 1, (("Patient Arrival Rate (Ra)"*Fraction of
POS demand used\) + (("Patient Backlog (B)"* (1-Fraction of POS demand used))/Target Service Time)),
"Patient Backlog (B)"/Target Service Time)
~ patient/Day
~ To complete requests in the target delivery time, the completion rate must
be equal to the backlog divided by the target time.
Maximum Completion Rate="Patient Backlog (B)"/Minimum Delivery Delay
~ patient/Day
~ The maximum completion rate is determined by the backlog and minimum time
to complete a customer request.
"Hiring/Firing"= IF THEN ELSE(PID Switch = 1, "PID-Gap"/ Time to Adjust Workforce, (Gap/ Time to Adjust
Workforce))
~ patient/Day/Day
~ The hiring or firing rate depends on the gap between the desired and actual
service capacity and the speed at which managers can adjust capacity.
"P-Control "=Gap
~ patient/Day
~ Proportional control.
"I-Control "= Cumulative Error
~ patient/Day
~ Integral control.
Cumulative Error= INTEG (Accumulating Error, )
~ patient/Day
~ Accumulation of uncorrected error. Allows for error correction even when
proportional control has waned due to reduction in the instantaneous error.
Accumulating Error= Gap/Error Correction Time
~ patient/(Day*Day)
~ Changes in gap between desired and actual completion rates.
Gap = (Desired Care Capacity - "Service Capacity (C)")
~ patient/Day
~ The difference between desired and actual completion rates.
Exp Avg of Error = INTEG (Change in Error,0)
~ patient/Day
~ Historical average of change in gap between desired and actual completion
rates.

Rust 203
Change in Error=(Gap - Exp Avg of Error) / Error Correction Time
~ patient/(Day*Day)
~
"D-Control"= Trend in Error Correction
~ patient/Day
~ Derivative control.
Trend in Error Correction=(Gap - Exp Avg of Error)
~ patient/Day
~ The trend of the error correction rate.
"PID-Gap"= (P Wt*"P-Control") + (I Wt*"I-Control") + (D Wt*"D-Control")
~ patient/Day
~ Total, weighted desired capacity derived using PID control.
Exogenous Patient Arrival Rate= Initial Arrival Rate*Input
~ patient/Day
~ The exogenous task arrival rate can be configured to include a range of
test inputs. It is set to the product of the initial arrival rate and the
test input. The test input allows users to specify a range of input
patterns, including a step, pulse, ramp, cycle, and pink noise, or
combinations of these. For simplicity, we only include formulations for
pink noise, as the other demand patterns are straightforward.
Initial Arrival Rate= INITIAL(10)
~ patient/Day
~ The base rate of demand.
Input= 1+STEP(Step Height,Step Time)+
(Pulse Quantity/Pulse Duration)*PULSE(Pulse Time,Pulse Duration)+
RAMP(Ramp Slope,Ramp Start Time,Ramp End Time)+
RAMP(Ramp Slope 2,Ramp Start Time 2,Ramp End Time 2)+
Sine Amplitude*SIN(2*3.14159*Time/Sine Period)+
STEP(1,Noise Start Time)*Pink Noise
~ Dimensionless
~ Input is a dimensionless variable which provides a variety of test input patterns,
including a step, pulse, sine wave, and random noise.
Pink Noise = INTEG(Change in Pink Noise,0)
~ Dimensionless
~ Pink Noise is first-order auto-correlated noise. Pink noise provides a realistic
noise input to models in which the next random shock depends in part on the
previous shocks. The user can specify the correlation time. The mean is 0
and the standard deviation is specified by the user.

Rust 204
Change in Pink Noise = (White Noise - Pink Noise)/Noise Correlation Time
~ 1/Day
~ Change in the pink noise value; Pink noise is a first order exponential smoothing
delay of the white noise input.
White Noise= Noise Standard Deviation*((Noise Correlation Time/TIME STEP)^0.5*(RANDOM 0 1() - 0.5))
~ Dimensionless
~ White noise input to the pink noise process.
Parameters
Time to Adjust Workforce= 20
~ Day
~ This represents the time it takes managers to actually manifest the changes in staff they
decide are necessary. A 20 day adjustment time is the relative equivalent of a three week
delay between deciding to hire a new staff member, and that new employee actually coming
on board.
Fraction of POS demand used 1= 0.0
~ Dimensionless [0,1,0.1]
~ Determines the relative importance of local backlog and initial-customer
demand in managing a clinic’s service capacity.
PID Switch=0
~ Dimensionless
~ Setting this to “1” changes clinic managers decision heuristics to include derivative control.
P Wt= 1
~ Dimensionless
~ Determines the relative weight of proportional control, compared to other control feedbacks.
I Wt= 0
~ Dimensionless
~ Determines the relative weight of integral control, compared to other control feedbacks.
D Wt= 1
~ Dimensionless
~ Determines the relative weight of derivative control, compared to other control feedbacks.
Target Service Time=5
~ Day [0,10,0.5]
~ The clinic’s goal is to for the average customer to complete the process
within five days.
Minimum Delivery Delay=0.5
~ Day
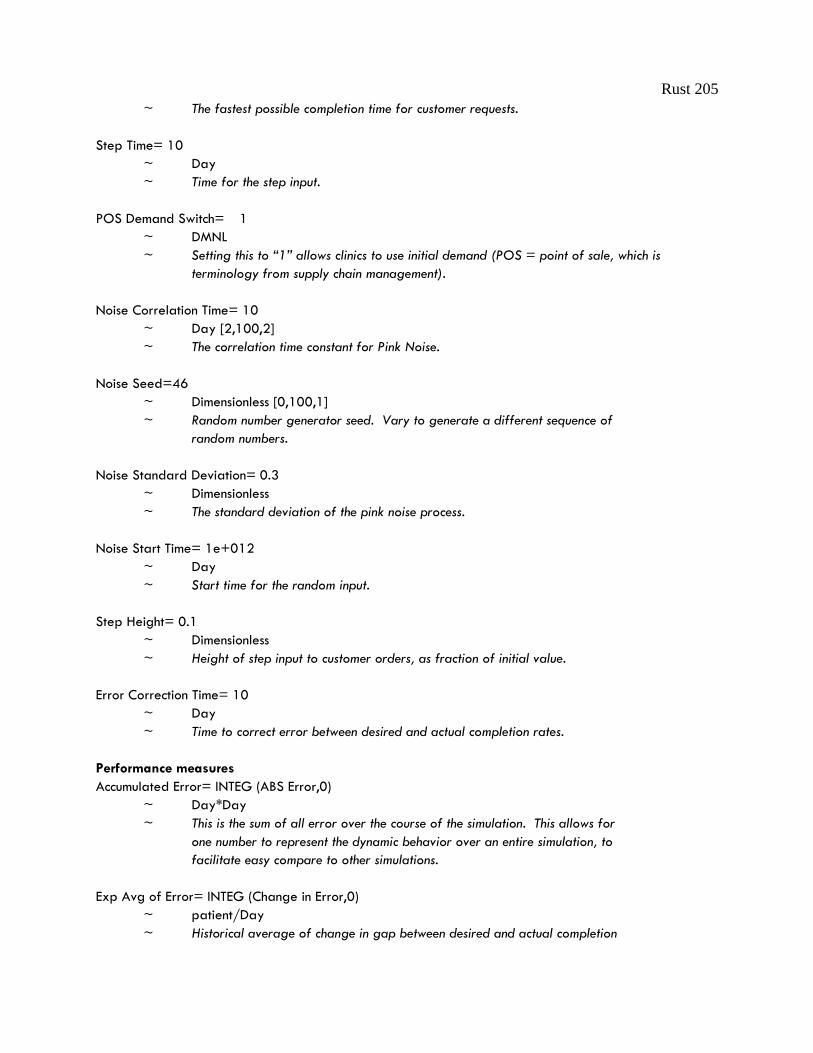
Rust 205
~ The fastest possible completion time for customer requests.
Step Time= 10
~ Day
~ Time for the step input.
POS Demand Switch= 1
~ DMNL
~ Setting this to “1” allows clinics to use initial demand (POS = point of sale, which is
terminology from supply chain management).
Noise Correlation Time= 10
~ Day [2,100,2]
~ The correlation time constant for Pink Noise.
Noise Seed=46
~ Dimensionless [0,100,1]
~ Random number generator seed. Vary to generate a different sequence of
random numbers.
Noise Standard Deviation= 0.3
~ Dimensionless
~ The standard deviation of the pink noise process.
Noise Start Time= 1e+012
~ Day
~ Start time for the random input.
Step Height= 0.1
~ Dimensionless
~ Height of step input to customer orders, as fraction of initial value.
Error Correction Time= 10
~ Day
~ Time to correct error between desired and actual completion rates.
Performance measures
Accumulated Error= INTEG (ABS Error,0)
~ Day*Day
~ This is the sum of all error over the course of the simulation. This allows for
one number to represent the dynamic behavior over an entire simulation, to
facilitate easy compare to other simulations.
Exp Avg of Error= INTEG (Change in Error,0)
~ patient/Day
~ Historical average of change in gap between desired and actual completion
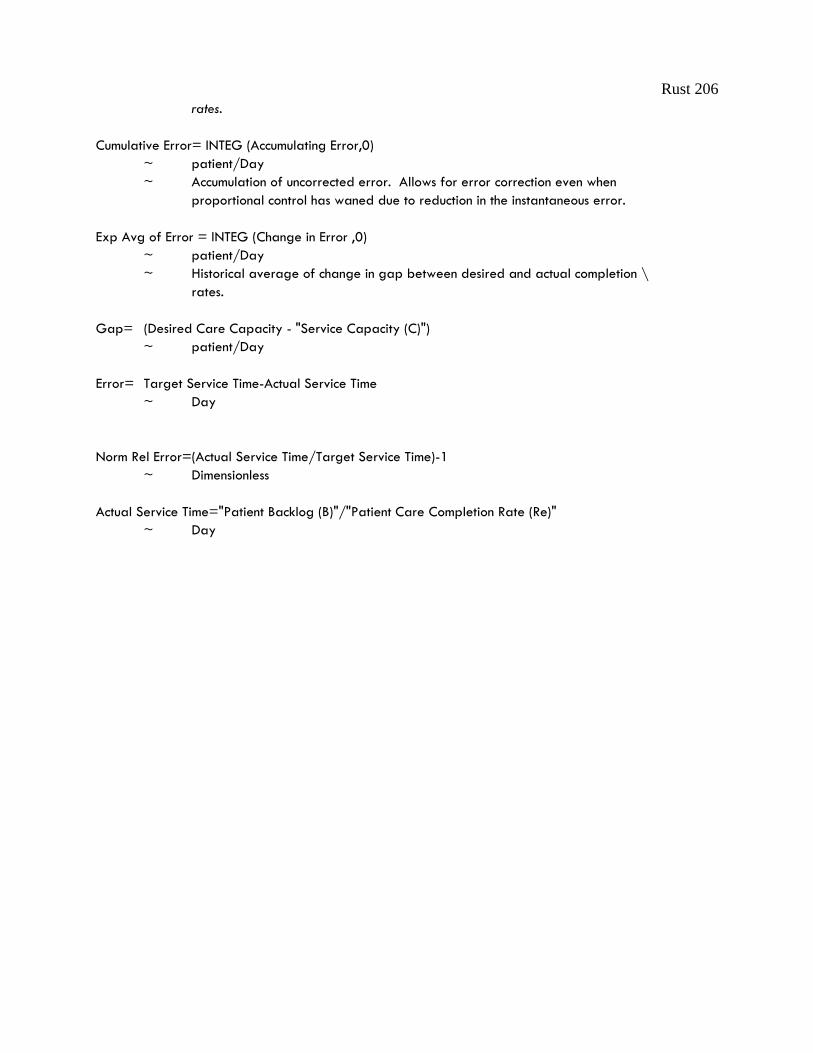
Rust 206
rates.
Cumulative Error= INTEG (Accumulating Error,0)
~ patient/Day
~ Accumulation of uncorrected error. Allows for error correction even when
proportional control has waned due to reduction in the instantaneous error.
Exp Avg of Error = INTEG (Change in Error ,0)
~ patient/Day
~ Historical average of change in gap between desired and actual completion \
rates.
Gap= (Desired Care Capacity - "Service Capacity (C)")
~ patient/Day
Error= Target Service Time-Actual Service Time
~ Day
Norm Rel Error=(Actual Service Time/Target Service Time)-1
~ Dimensionless
Actual Service Time="Patient Backlog (B)"/"Patient Care Completion Rate (Re)"
~ Day
Rust 207
References:
Ackermans, H., & Vos, B. (2003). Amplification in service supply chains: An exploratory
study fromthe telecom industry. Production and Operations Management, 12(2), 204–223.
Adler P, Goldoftas B, Levine D (1999), "Flexibility Versus Efficiency? A case Study of Model
Changeovers in the Toyota Production System," Organizational Science, 10:1 43-68.
Aiken LH, Clarke SP, Sloane DM, et al: Hospital nurse staffing and mortality nurse burnout,
and job dissatisfaction. JAMA 2002; 88:1987–1993
Allen T, Nightengale D, et al (20014) "Engineering Systems: An Enterprise Perspective."
Engineering Systems Monograph. Cambridge, MIT Press.
An Examination of Poorly Performing U.S. Department of Veterans Affairs Regional Offices,
112th Cong. No.112-16 (2011) (testimony of Jon Runyan).
Anderson E, Morrice D and Lundeen G (2005). "The physics of capacity and backlog
management in service and custom manufacturing supply chains" System Dynamics Review,
Vol.21 No.3, 217-247.
Anderson, E. G. (2001). The nonstationary staff-planning problem with business cycle and
learning effects. Management Science, 47(6), 817-832.
Anderson, E.G. and Morrice, D. (2000), “A simulation game for service-oriented supply chain
management: does information sharing help managers with service capacity decisions?”,
Production and Operations Management, Vol. 9 No. 1, pp. 44-55.
Argawal, A., Shankar, R., Tiwari, M., (2007), "Modeling agility of supply chain", Industrial
Marketing Management, Vol. 36, pp. 443–457.
Aronsson H., Abrahamsson M., Spens, K., (2011),"Developing lean and agile health care
supply chains", Supply Chain Management: An International Journal, Vol. 16 Iss: 3 pp. 176 -
183.
Baltacioglu, T., Ada, E., Kaplan, M.D., Yurt, O., & Kaplan, Y.C. (2007). A new framework for
service supply chains. The Service Industries Journal, 27(2), 105–124.
Bar-Yam Y (2005). Making Things Work: Solving Complex Problems in a Complex World.
Cambridge, MA: Necsi Knowledge Press.
Beal A, Doty M, Hernandez S, Shea K, Davis K (2007). "Closing the divide: how medical
homes promote equity in health care. Results from The Commonwealth Fund 2006 Health
Care Quality Survey". New York: The Commonwealth Fund.
Beckmann U, Baldwin I, Durie M, et al: Problems associated with nursing staff shortage: An
analysis of the first 3600 incident reports submitted to the Australian Incident Monitoring
Study (AIMS-ICU). Anaesth Intensive Care 1998; 26:396–400

Rust 208
Berens M.J.: Nursing mistakes kill, injure thousands. Cost cutting exacts toll on patients,
hospital staffs. Chicago Tribune, Sep. 10, 2000, p. 20
Bertrand, J (2003), "Supply chain design: flexibility considerations, Chapter 4 of supply chain
management design, coordination and operation", in de Kok, A.G. and Graves, S.C. (Eds),
Design and Analysis of Supply Chains (Handbooks in Operations Research and Management
Science 11), North Holland, Amsterdam, pp. 133-98.
Bhasin S (2008), "Lean and performance measurement," Journal of Manufacturing Technology
Management, 12(1/2): 56.
Bhasin S and BurcherP, (2006), "Lean viewed as a philosophy." Journal of Manufacturing
Technology Management 17(1/2):56.
Boelke C, Boushon B, Isensee S (2000). Achieving open access: the road to improved service
& satisfaction. Med Group Manage J. Sep-Oct; 47: 58-62, 64-6, 68.
Bower P and Gilbody S (2005). Stepped care in psychological therapies: access, effectiveness
and efficiency. British J of Psychiatry 186: 11–17.
Brailsford SC (2008). System Dynamics: what’s in it for health care simulation modelers? In:
Mason SJ, Hill R, Monch L and Rose O (eds). Proceedings of the 2008 Winter Simulation
Conference, Miami, FL, pp 1478–1483.
Brailsford, S. C., Desai, S. M., & Viana, J. (2010, December). Towards the holy grail:
Combining system dynamics and discrete-event simulation in healthcare. In Simulation
Conference (WSC), Proceedings of the 2010 Winter (pp. 2293-2303). IEEE.
Brandao de Souza L, (2009),"Trends and approaches in lean healthcare", Leadership in Health
Services, Vol. 22 Iss: 2 pp. 121 - 139
Brown, S., Bessant, J., (2003). The manufacturing strategy-capabilities links in mass
customization and agile manufacturing—an exploratory study. International Journal of
Operations and Production Management 23 (7), 707–730.
Bruce, M., Daly, L., Towers, N. (2004),"Lean or agile: A solution for supply chain
management in the textiles and clothing industry?", International Journal of Operations &
Production Management, Vol. 24 Iss: 2 pp. 151 - 170
Buerhaus P.: Economics and reform: Forces affecting nurse staffing. Nursing Policy Forum
1(2):8–14, 1995.
Burgess N & Radnor Z, (2010). Lean implementation in healthcare: complexities and tensions.
California Health and Safety Code, Section 1276.4, 1999. Available at:
http://www.leginfo.ca.gov/pub/99-00/bill/asm/ab_0351-
0400/ab_394_bill_19991010_chaptered.html.
Rust 209
Carayon P, Gürses AP: A human factors engineering conceptual framework of nursing
workload and patient safety in intensive care units. Intensive Crit Care Nurs 2005; 21: 284–
301
Carlsson, B. (1989), "Flexibility and the theory of the firm", International Journal of Industrial
Organisation, Vol. 7 No. 2, pp. 179-203.
Childerhouse, P. and Towill, D. (2000), “Engineering supply chains to match customer
requirements”, Logistics Information Management, Vol. 13 No. 6, pp. 337-45.
Christopher, M. (2000), “The agile supply chain”, Industrial Marketing Management, Vol. 29
No. 29, pp. 37-44.
Christopher, M., & Peck, H. (2004). Building the resilient supply chain. International Journal
of Logistics Management, 15(2), 1-14.
Christopher, M., & Towill, D. R. (2002). Developing market specific supply chain strategies.
International Journal of Logistics Management, The, 13(1), 1-14.
Christopher, M., Towill, D., (2001), "An integrated model for the design of agile supply
chains", International Journal of Physical Distribution & Logistics Management 31 (4), 235–
246.
Dangerfield BC (1999). System dynamics applications to European health care issues. J Opl
Res Soc 50: 345–353.
De Toni, A.F. and Tonchia, S. (2005), "Definitions and linkages between operational and
strategic flexibilities", Omega, Vol. 33, pp. 525-40.
DeVor, R., Graves, R. and Mills, J. (1997), “Agile manufacturing research: accomplishments
and opportunities”, IIE Transactions, Vol. 29 No. 10, pp. 813-23.
Disney, S.M. and Towill, D.R. (2003), “On the bullwhip and inventory variance produced by
an ordering policy”, Omega, Vol. 31 No. 3, pp. 157-67.
Drezner Z, Ryan JK, Simchi-Levi D. 2000. Quantifying the bullwhip effect: the impact of
forecasting, leadtime, and information. Management Science 46(3): 436–443.
D'Souza, D.E. (2002), "Toward an understanding of how organizations create manufacturing
flexibility", Journal of Managerial Issues, Vol. 14 No. 4, pp. 470-85.
Easton, G. and Rothschild, R. (1987), "The influence of product and production flexibility on
marketing strategy", in Pettigrew, A. (Ed.), The Management of Strategic Change, Basil
Blackwell Limited, Oxford.
Ellram L, Tate W and Billington C. (2004) Understanding and managing the services supply
chain, Journal of Supply Chain Management: A Global Review of Purchasing and Supply,
40(4), pp.17–32.

Rust 210
Finn BJ (2010). Department of Veterans Affairs Audit of VA's Efforts to Provide Timely
Compensation and Pension Medical Examinations. Available at
http://www4.va.gov/oig/52/reports/2010/VAOIG-09-02135-107.pdf; accessed January 18,
2012.
Forrester JW (1961). Industrial Dynamics. MIT Press: Cambridge, MA.
Forrester JW (1994). System dynamics, systems thinking, and soft OR. System Dynamic
Review 10(2–3): 245–256.
Forrester JW (1958). Industrial dynamics: a major breakthrough for decision makers. Harvard
Business Review 36(4): 37–66.
Forsbery H, Aronsson H, Keller C, Lindblad S (2011). Managing Health Care Decisions and
Improvement through Simulation Modeling. Q Manage Health Care 20(1):15–29.
Gerwin, D. (1987), "An agenda for research on the flexibility of manufacturing processes",
International Journal of Operations & Production Management, Vol. 7 No. 1, pp. 38-49.
Giannakis M (2011): Conceptualizing and managing service supply chains, The Service
Industries Journal, 31:11, 1809-1823
Goldman, Steven L.; Nagel, Roger N.; Preiss, Kenneth, (1995), Agile Competitors and Virtual
Organizations, Van Nostrand Reinhold, New York, New York.
Goldsby, T., Garcie-Dastugue, S., (2003), "The Manufacturing Flow Management Process",
The International Journal of Logistics management, Vol. 14, No. 2, pp.33-52.
Goldsby, T., Martichenko, R., (2005), Lean SixSigma Logistics: Stragetic Development to
Operatoinal Success, Boca Raton, FL: J. Ross Publishing.
Graban, M. (2008). Lean hospitals: Improving quality, patient safety, and employee
satisfaction. Productivity Press.
Gunasekaran, A. (1998), “Agile manufacturing: enablers and an implementation framework”,
International Journal of Production Research, Vol. 36 No. 5, pp. 1223-47.
Harrison, A., Christopher, M. and Van Hoek, R. (1999), “Creating the agile supply chain”,
School of Management Working Paper, Cranfield University, Cranfield.
Health Information Technology for Economic and Clinical Health (HITECH) Act, Title XIII of
Division A and Title IV of Division B of the American Recovery and Reinvestment Act of
2009 (ARRA), Pub. L. No. 111-5, 123 Stat. 226 (Feb. 17, 2009).
Hermann RC, Leff HS, Palmer RH, Yang D, Teller T, Provost S, Jakubiak C and Chan J
(2000). Quality measures for mental health care: results from a national inventory. Med Care
Res Rev 57: 136-154.
Rust 211
Hewitt, F. (1999), “Supply or demand? Chains or pipelines? Co-ordination or control?”,
Proceedings from International Symposium in the Information Age, Florence, pp. 785-90.
Hines, P., Found, P., Harrison, R., 2008. Staying Lean: Thriving, Not Just Surviving. Lean
Enterprise Research Centre, Cardiff University, Cardiff.
Hines, P., Holweg, M., Rich, N., 2004. Learning to evolve. A review of contemporary lean
thinking. International Journal of Operations and Production Management 24 (10), 994–1011.
Holweg, M. (2007). The genealogy of lean production. Journal of Operations Management,
25(2), 420-437.
Homer, J.B. and Hirsch, G.B. (2006), “System dynamics modeling for public health:
background and opportunities”, American Journal of Public Health, Vol. 96 No. 3, pp. 452-8.
Iacocca Institute (1991), 21st Century Manufacturing Enterprise Strategy. An Industry-Led
View, Vol. 1/2, Iacocca Institute, Bethlehem, PA.
Jack, E. P., & Powers, T. L. (2004). Volume flexible strategies in health services: a research
framework. Production and Operations Management, 13(3), 230-244.
Jones, D. (2006), “Leaning healthcare”, Management Services, Summer, pp. 16-17.
Joosten T, Bongers I, and Janssen R. (2009). Application of lean thinking to health care: issues
and observations. International Journal for Quality in Health Care 21 (5): 341-347.
Kane, R. L., Shamliyan, T. A., Mueller, C., Duval, S., & Wilt, T. J. (2007). The association of
registered nurse staffing levels and patient outcomes: systematic review and meta-analysis.
Medical care, 45(12), 1195-1204.
Kenny, C. (2011). Transforming Health Care: Virginia Mason Medical Center's Pursuit of the
Perfect Patient Experience. Taylor & Francis Group.
Kertzman E, Janssen R and Ruster M (2003). E-business in health care: Does it contribute to
strengthen consumer interest? Health Policy 64: 63–73.
Kidd, P.T. (1994), Agile Manufacturing – Forging New Frontiers, Addison-Wesley,
Wokingham.
Kleijnen JPC (2005). Supply chain simulation tools and techniques: A survey. Int J Simul &
Process Model 1(1&2): 82–89.
Kovner CT, Gergen PJ: Nurse staffing levels and adverse events following surgery in U.S.
hospitals. Image 1998; 30:315–321
Krafcik, J.F., (1988). Triumph of the Lean Production System. Sloan Management Review,
Fall.

Rust 212
Krajewski, L., Wei, J.C. and Tang, L-L. (2005), "Responding to schedule changes in build-to-
order supply chains", Journal of Operations Management, Vol. 23, pp. 452-69
LAI (1996). Lean Entermprise Model. Cambridge, MA, MIT Press.
Landrigan CP, Rothschild JM, Cronin JW, et al: Effect of reducing interns’ work hours on
serious medical errors in intensive care units. N Engl J Med 2004; 351:1838–1848
Lane DC (1997). From discussion to dialogue: A case study using an interactive system
dynamics modelling approach (De la discussion an dialogue: une etude de cas d'utilisation
interactive de la dynamique des systems). Revue des Sys de Decis 6: 251-281.
Lane DC (1999). System Dynamics Modelling of Patient Flows Through Acute Hospitals.
Report for the NHS Executive: London.
Lane DC and Husemann E (2008). System dynamics mapping of acute patient flows. J Opl Res
Soc 59: 213–224.
Lane, D.C., Monefeldt, C. and Husemann, E. (2003), “Client involvement in simulation model
building: hints and insights from a case study in a London hospital", Healthcare Management,
Vol. 6, pp.105-16.
Lane, D.C., Monefeldt, C. and Rosenhead, J.V. (2000), “Looking in the wrong place for
healthcare improvements: a system dynamics study on an A & E department”, Journal of
Operational Research Society, Vol. 51, pp. 518-31.
Lau, R (1996), "Strategic flexibility: a new reality for world-class manufacturing", SAM
Advanced Management Journal, Spring, pp. 11-15.
Laursen ML, Gertsen F, Johansen J. Applying Lean Thinking in Hospitals; Exploring
Implementation Difficulties. Aalborg: Aalborg University, Center for Industrial Production,
2003
Lee HL, Padmanabhan V, Wang S. (1997). The bullwhip effect in supply chains. Sloan
Management Review 38: 93–102.
Lee, H. (2004), "The Triple-A Supply Chain," Harvard Business Review, Oct.
Lee, Y. M., An, L., & Connors, D. (2009). Application of Feedback Control Method to
Workforce Management in a Service Supply Chain. Service Science, 1(2), 77-92.
Lewis, M. (2000), “Lean production and sustainable competitive advantage”, International
Journal of Operations and Productions Management, Vol. 20 No. 8, pp. 959-78.
Liker J (2004), The Toyota Way: 14 management principles from the world's greatest
manufacturer. New York, NY, McGraw-Hill Professional.

Rust 213
Liker J and Morgan M, (2006). The Toyota Wan in Services: the case of lean product
development. Academy of Management Perspectives 20(2): 5-20.
Litvak E, Buerhaus P, Davidoff F, et al. (2005). "Managing Unnecessary Variability in Patietn
Demand to Reduce Nursing Stress and improve Patient Safety," Journal on Quality and
Patient Safety, 31:6 330-338.
Luk BV, Shiner B, Watts B, Zubkoff L, Schlosser J (2010). Strategies to Improve
Compensation and Pension Timeliness: Lessons Learned from High-performing Facilities. Mil
Med 175(12):978-982.
Lyneis, J. M. (1980). Corporate planning and policy design: A system dynamics approach.
MIT Press.
Lyneis, J. M., & Ford, D. N. (2007). System dynamics applied to project management: a
survey, assessment, and directions for future research. System Dynamics Review, 23(2‐3), 157-
189.
Mason-Jones, R., Naylor, B., Towill, D.R., (2000). Engineering the leagile supply chain.
International Journal of Agile Management Systems 2 (1), 54.
McManus, H., & Rebentisch, E. (2008, October). Experiences in simulation-based education in
engineering processes. In Frontiers in Education Conference, 2008. FIE 2008. 38th Annual
(pp. S1C-21). IEEE.
Miller, D. (2005), “Going lean in health care”, Institute for Healthcare Improvement,
Cambridge, MA, pp. 1-2
Mitton C and Donaldson C (2004). Health care priority setting: Principles, practice, and
challenges. Cost Eff Resour Allocation 2(3).
Muir Gray J. How to get Better Value Healthcare. Oxford: Offox Press, 2007.
Murman A, Allen T, et al, (2002). Lean Enterprise Value: insights from MIT's Lean
Aerospace Initiative. New York, NY, Palgrave Macmillan.
Murray M and Berwick D (2003). Advanced access: reducing waiting and delays in primary
care. JAMA. Feb 26;289: 1035-40.
Nancy, C., (1999), "Lose the waste: Get lean!" Quality 38(3):34.
Narasimhan, R., Swink, M. and Kim, S. (2006), “Disentangling leanness and agility: an
empirical investigation”, Journal of Operations Management, Vol. 24 No. 5, pp. 440-57.
Naylor, J., Naim, M. and Berry, D. (1999), “Leagility: integrating the lean and agile
manufacturing paradigms in the total supply chain”, International Journal of Production

Rust 214
Economics, Vol. 62 No. 1/2, pp. 107-18.
Needleman J, Buerhaus P, Mattke S, et al: Nurse-staffing levels and the quality of care in
hospitals. N Engl J Med 2002; 346: 1715–1722
Nelson-Peterson, D. and Leppa, C. (2007), “Creating an environment for caring using lean
principles of the Virginia Mason Production System”, Journal of Nursing Administration, Vol.
37 No. 6, pp. 287-94.
New York Times. “A Victory for Veterans.” May 6, 2011.
NHSI, 2007. Going Lean in the NHS.
<http://www.institute.nhs.uk/option,com_joomcart/Itemid,26/
main_page,document_product_info/products_id,231.html>. (Accessed January 2011).
Noon, C. E., Hankins, C. T., & Cote, M. J. (2003). Understanding the impact of variation in the
delivery of healthcare services. Journal of healthcare management/American College of
Healthcare Executives, 48(2), 82.
Parchman M, Scoglio C, Schumm P (2011), "Understanding the implementation of evidence
based care: A structural network approach" Implementation Science 6:14.
Prince, J., Kay, J., (2003). Combining lean and agile characteristics: creation of virtual groups
by enhanced production flow analysis. International Journal of Production Economics 85, 305–
318.
Pronovost PJ, Jenckes MW, Dorman T, et al: Organizational characteristics of intensive care
units related to outcomes of abdominal aortic surgery. JAMA 1999; 281:1310–1317
Radnor Z, Holweg M, Waring J, (2012). Lean in healthcare: The unfilled promise? Social
Science and Medicine. 74(3):364-71.
Radnor, Z.J., Boaden, R., 2008. Lean in public services – Panacea or paradox? Public Money
and Management 28 (1), 3–7.
Reid R, Coleman K, Johnson E et al. (May 2010). "The group health medical home at year
two: cost savings, higher patient satisfaction, and less burnout for providers". Health Affairs 29
(5): 835–43.
Robert J, Fridkin SK, Blumberg HM, et al. The influence of the composition of the nursing
staff on primary bloodstream infection rates in a surgical intensive care unit. Infect Control
Hosp Epidemiol. 2000;21:12–17.
Robertson RH, Hassan M. Staffing intensity, skill mix and mortality outcomes: the case of
chronic obstructive lung disease. Health Serv Manage Res. 1999;12:258 –268.
Rust 215
Robinson S, Radnor Z, et al, (2012). SimLean: utilizing simulation in the implementation of
lean in healthcare. European Journal of Operational Research 219: 188-197.
Robinson, S., Radnor, Z. J., Burgess, N., & Worthington, C. (2012). SimLean: Utilizing
simulation in the implementation of lean in healthcare. European Journal of Operational
Research.
Rogers A, Hwant, W, Scott L, Aiken L, Dinges D (2004), "The Working Hours of Hospital
Staff Nurses and Patient Safety," Health Affairs, 23:4, 202-212.
Rosenthal, T., (2008), “The Medical Home: Growing Evidence to Support a New Approach to
Primary Care”, Journal of the American Board of Family Medicine, Vol. 21, No. 5, pp. 427-
440 .
Saeed, K. (2009), “Can trend forecasting improve stability in supply chains? A response to
Forrester's challenge in Appendix L of Industrial Dynamics.” System Dynamics Review. 25(1):
63-78
Saeed, K. (2008), “Trend Forecasting for Stability in Supply Chains.” Journal of Business
Research. 61(11): 1113-1124
Sampson S & Froehle C. (2006). Foundations and implications of a proposed unified services
theory. Production and Operations Management, 15(2), 329–343.
Sampson, S.E. (2000) Customer–supplier duality and bidirectional supply chains in service
organizations, International Journal of Service Industry Management, 11, pp.348–64.
Samuel, C., Gonapa, K., Chaudhary, P. K., & Mishra, A. (2010). Supply chain dynamics in
healthcare services. International journal of health care quality assurance, 23(7), 631-642.
Sanchez, A and Perez, M (2005), "Supply chain flexibility and firm performance: a conceptual
model and empirical study in the automotive industry", International Journal of Operations &
Production Management, Vol. 25 No. 7, pp. 681-700
Sarkis, J. (2001), “Benchmarking for agility”, Benchmarking: An International Journal, Vol. 8
No. 2, pp. 88-107.
Schonberger, R. (2007), “Japanese production management: an evolution – with mixed
success”, Journal of Operations Management, Vol. 25 No. 2, pp. 403-19.
Scott LD, Rogers AE, Hwang WT, et al: Effects of critical care nurses’ work hours on
vigilance and patients’ safety. Am J Crit Care 2006; 15:30–37
Sethi SP, Thompson GL. 2000. Optimal Control Theory: Applications to Management Science
and Economics. Kluwer: Boston, MA.
Sethuraman, K., & Tirupati, D. (2005). Evidence of bullwhip effect in healthcare sector:
causes, consequences and cures. International Journal of Services and Operations

Rust 216
Management, 1(4), 372-394.
Shah, R., Goldstein, S., Unger, B., Henry, T. (2008), “Explaining anomalous high performance
in a health care supply chain”, Decision Sciences, Vol. 29 No. 4, pp. 759-89.
Sharifi, H., Zhang, Z., (2001), "Agile manufacturing in practice: application of a
methodology", International Journal of Operations and Production Management, Vol. 21 No.
5/6, pp 772–794.
Sheffi Y and Rice J, (2005), "A supply chain view of the resilient enterprise", Sloan
Management Review, Vol. 47 No. 1, pp. 41-8.
Silvester, K., Lendon, R., Bevan, H., Steyn, R. and Walley, P. (2004), “Reducing waiting times
in the NHS: is lack of capacity the problem?”, Clinician in Management, Vol. 12 No. 3, pp. 1-
5.
Slack, N. (1983), "Flexibility as a manufacturing objective", International Journal of
Operations & Production Management, Vol. 3 No. 3, pp. 4-13.
Smits M (2010). Impact of policy and process design on the performance of intake and
tratment processes in mental health care: a system dynamics case study. J Opl Res Soc 61:
1437-1445.
Spear S, (2005), “Fixing healthcare from the inside, today”, Harvard Business Review, Vol. 83,
No. 9, pp. 78-91.
Spear S, (2009). Chasing the rabbit. McGraw-Hill.
Sterman JD (2000). Business Dynamics: Systems Thinking and Modeling for a
ComplexWorld. MIT Sloan School of Management: Irwin/McGraw-Hill.
Sterman JD. 1989. Modeling management behavior: misperceptions of feedback in a dynamic
decision making experiment. Management Science 35: 321–339.
Sterman, J. D., Repenning, N. P., & Kofman, F. (1997). Unanticipated side effects of
successful quality programs: Exploring a paradox of organizational improvement. Management
Science, 43(4), 503-521.
Stern, R. S., Weissman, J. S., & Epstein, A. M. (1991). The emergency department as a
pathway to admission for poor and high-cost patients. JAMA, 266(16), 2238-2243.
Stern, R., Weissman, J., Epstein, A. (1991), "The emergency department as a pathway to
admission for poor and high-cost patients", Journal of the American Medical Association, Vol.
19, pp. 2238-43.

Rust 217
Stevenson M, Spring M, (2007) "Flexibility from a supply chain perspective: definition and
review", International Journal of Operations & Production Management, Vol. 27 Iss: 7,
pp.685 - 713
Suarez, F.F., Cusumano, M.A. and Fine, C.H. (1996), "An empirical study of flexibility in
printed circuit board assembly", Operations Research, Vol. 44 No. 1, pp. 223-40
Suzaki, K., (1987), New manufacturing challenge: Techniques for continuous improvement,
Simon and Schuster, New York, New York.
Tako AA and Robinson S (2009). Comparing discrete-event simulation and system dynamics:
Users’ perceptions. J Opl Res Soc 60: 296–312.
Tarnow-Mordi WO, Hau C, Warden A, et al: Hospital mortality in relation to staff workload: 4
year study in an adult intensive care unit. Lancet 2000; 356:185–189
Taylor K and Dangerfield B (2005). Modeling the feedback effects of reconfiguring health
services. J Opl Res Soc 56: 659–675
Taylor K and Lane D (1998). Simulation applied to health services: opportunities for applying
the system dynamics approach. Journal of Health Services Research and Policy 3: 226-232.
Tsourveloudis, N.C. and Valavanis, K.P. (2002), “On the measurement of enterprise agility”,
Journal of Intelligent and Robotic Systems, Vol. 33 No. 3, pp. 329-42.
Upton, D.M. (1995), "What really makes factories flexible?", Harvard Business Review, July-
August, pp. 74-84.
Vennix JAM (1996). Group decision making. Wiley: London.
Ventana Systems, Inc. 2012. Vensim Version 6.0. 60 JacobGates Road, Harvard, MA 01451.
Vries, J., Huijsman, R. (2011), "Supply chain management in health services: an overview",
Supply Chain Management: An International Journal, Vol. 16 Iss: 3 pp. 159 - 165
Walley P, Silvester K, Steyn R (2006). Managing variation in demand: Lessons from the UK
National Health Service. Journal of Healthcare Management. Sept; 51: 309-322.
Walley, P. (2007). Managing variation through system redesign. International Journal of
Healthcare Technology and Management, 8(6), 589-602.
Warren, K., (2007). “Strategic Management Dynamics”, John Wiley and Sons.
Wheelwright S, (1995) "Texas Instruments: Time Products Division." Harvard Business
School Case 677-043, July (Revised from original September 1976 version.)

Rust 218
White, A., Daniel, E.M. and Mohdzain, M. (2005), "The role of emergent information
technologies and systems in enabling supply chain agility", International Journal of
Information Management, Vol. 25, pp. 396-410.
White, A.S., 1999, Management of Inventory Using Control Theory. International Journal of
Technology Management, 17: 847-860.
Wolstenholme EF (2003). Towards the definition and use of a core set of archetypal structures
in system dynamics. Sys Dyn Rev 19(1):7-26.
Wolstenholme EF, Repper D, Todd D, Monk D and McKelvie D (2006). Implementation of a
stepped care approach to depression services in North West England. White paper, Symmetric
SD Ltd, www.symmetricsd.co.uk.
Womack, J., Jones, D., (1996), Lean Thinking. Simon & Schuster, New York, NY.
Young T and McClean S, (2008). A critical look at Lean Thinking in healthcare. Quality and
Safety in Health Care 17(5):382-386.
Young T, Brailsford S, Connell C, Davies R, Harper P and Klein JH (2004). Using industrial
processes to improve patient care. Brit Med J 328: 162–164.
Young, T. (2005), “An agenda for healthcare and information simulation”, Health Care
Management Science, Vol. 8 No. 3, pp. 189-96.
Young, T., Brailsford, S., Connell, C., Davies, R., Harper, P. and Klein, J.H. (2004), “Using
industrial processes to improve patient care”, British Medical Journal, Vol. 328 No. 7432, pp.
162-4.